Article

Four Decades of Land-Cover Change on the Kenai Peninsula, Alaska: Detecting Disturbance-Influenced Vegetation Shifts Using Landsat Legacy Data

by
Carson A. Baughman
1,*,
Rachel A. Loehman
1,
Dawn R. Magness
2,
Lisa B. Saperstein
3 and
Rosemary L. Sherriff
4
1
U.S. Geological Survey—Alaska Science Center, 4210 University Dr., Anchorage, AK 99508, USA
2
Kenai National Wildlife Refuge, U.S. Fish and Wildlife Service, 1 Ski Hill Rd., Soldotna, AK 99669, USA
3
U.S. Fish and Wildlife Service Alaska Region, 1011 East Tudor Rd., Anchorage, AK 99503, USA
4
Department of Geography, Environment & Spatial Analysis, Humboldt State University, 1 Harpst St., Arcata, CA 95521, USA
*
Author to whom correspondence should be addressed.
Land 2020, 9(10), 382; https://doi.org/10.3390/land9100382
Submission received: 19 August 2020 / Revised: 1 October 2020 / Accepted: 1 October 2020 / Published: 9 October 2020

Abstract

:
Across Alaska’s Kenai Peninsula, disturbance events have removed large areas of forest over the last half century. Simultaneously, succession and landscape evolution have facilitated forest regrowth and expansion. Detecting forest loss within known pulse disturbance events is often straightforward given that reduction in tree cover is a readily detectable and measurable land-cover change. Land-cover change is more difficult to quantify when disturbance events are unknown, remote, or environmental response is slow in relation to human observation. While disturbance events and related land-cover change are relatively instant, assessing patterns of post-disturbance succession requires long term monitoring. Here, we describe a method for classifying land cover and quantifying land-cover change over time, using Landsat legacy imagery for three historical eras on the western Kenai Peninsula: 1973–2002, 2002–2017, and 1973–2017. Scenes from numerous Landsat sensors, including summer and winter seasons, were acquired between 1973 and 2017 and used to classify vegetation cover using a random forest classifier. Land-cover type was summarized by era and combined to produce a dataset capturing spatially explicit land-cover change at a moderate 30-m resolution. Our results document large-scale forest loss across the study area that can be attributed to known disturbance events including beetle kill and wildfire. Despite numerous and extensive disturbances resulting in forest loss, we estimate that the study area has experienced net forest gain over the duration of our study period due to reforestation within large fire events that predate this study. Transition between forest and graminoid non-forest land cover including wetlands and herbaceous uplands is the most common land-cover change—representing recruitment of a graminoid dominated understory following forest loss and the return of forest canopy given sufficient time post-disturbance.

1. Introduction

The boreal forest is a global resource in terms of biodiversity, silviculture production [1], and global carbon stocks [2]. Boreal forests, which encompass about 30% of Earth’s forested area [3], are a massive carbon reservoir, composing one third or between 367.3 and 1715.8 Pg of Earth’s terrestrial carbon [4]; these immense forests contain more freshwater than any other biome and help regulate global climate via exchange of energy and water [5,6]. However, boreal forests are increasingly altered by human activities such as timber harvest, mining, and urbanization, and the impacts of global climate change [6]. Although the boreal forest has served as a carbon sink during the Holocene, climate warming, increased disturbance rates, and altered biophysical processes are weakening or reversing this sink status [4,7,8]. Additional observed changes over the last two decades include greening and browning trends [9], tree line expansion into tundra environments [10], tree mortality from insect outbreaks and drought [11,12], more frequent and extreme wildfires [13,14], and the recruitment of novel post-disturbance lifeforms and species [15]. These processes, many of which are projected to increase with ongoing and increasing climate changes and can be linked via interactions and feedbacks [16,17,18], may impact broad patterns of land cover and, consequently, the provisioning of ecosystem services critical for natural and human communities [19].
The boreal forests of Alaska’s Kenai Peninsula have experienced significant land-cover change over the past half century [20,21,22]. Three broad types of change have been observed in relation to forest extent: deforestation (loss of established forest), afforestation (conversion of historically non-forested areas to forest), and reforestation (re-establishment of historical forests). Deforestation mechanisms include spruce bark beetle (Dendroctonus rufipennis Kirby) outbreaks [23] that have resulted in areas with increased perennial grass (Calamagrostis canadensis) cover, decreased establishment and survival of tree seedlings, and potentially permanent deforestation [21]. Climate warming and drying are the likely causes of afforestation in some areas of the peninsula, including conversion of wetlands into shrub and forest communities [20,22], shrub expansion into previously non-forested areas [21], and an elevational increase in tree line and shrub line [21]. Barring uncharacteristic perturbations such as anthropogenic climate change, uncharacteristic wildfires [24,25], permafrost thaw [26], and industrial activities [27], Alaska’s boreal forests are largely resilient and, following disturbance events, often return to a composition similar to that of the pre-disturbance stand (Van Cleve and Viereck, 1981, as cited in [28]).
Changes in land-cover type and extent are of interest across the Kenai Peninsula given the region’s geography. The Kenai Peninsula is a significant asset to national and, arguably, global natural resource conservation. Large portions of the Kenai Peninsula are managed by the U.S. Forest Service with a mission to “sustain the health, diversity, and productivity of the Nation’s forests to meet the needs of present and future generations.” The entirety of the Kenai National Wildlife Refuge, with a mission to “conserve fish and wildlife populations and habitats in their natural diversity” falls within the Kenai Peninsula. Approximately 8% of the population of Alaska resides on the Kenai Peninsula and over half of the state’s population lives within a day’s drive [29]. The region also represents one of Alaska’s largest sectors for nature-based tourism, contributing approximately 175 million USD in 2016 [30]. Consequently, disturbance events and changes in land cover are more perceptible to, and more often directly affect, a disproportionately large human population compared to other events within Alaska and the broader boreal forest domain.
A “wall-to-wall” land-cover change analysis has previously been difficult to execute because of a legacy of different methodologies employed to classify land-cover types. Here, we describe a method for quantifying the extent and magnitude of prominent land-cover changes across the Kenai Peninsula based on classification of landcover from Landsat legacy imagery for three historical eras. This approach has become more practical by pairing fundamental land-cover mapping techniques [31] with greater desktop computing power and the growing availability and organization of remote sensing products. Our primary focus is on delineation of forest vs. non-forest cover types, as this represents the most significant and perceivable land-cover change. Second, we classified and summarized the extent of change within needleleaf, broadleaf, and mixed species forest types and non-forest cover types including shrubs, graminoids (the combined area of herbaceous and wetland), alpine, barren, and water. This approach aims to extend the geospatial record of land-cover change and to better quantify how disturbance events and natural succession have shaped the distribution of vegetation types across the peninsula. This information can then serve as an important assessment tool for local, state, and federal land managers tasked with monitoring and managing the area’s natural resources [32].

2. Materials and Methods
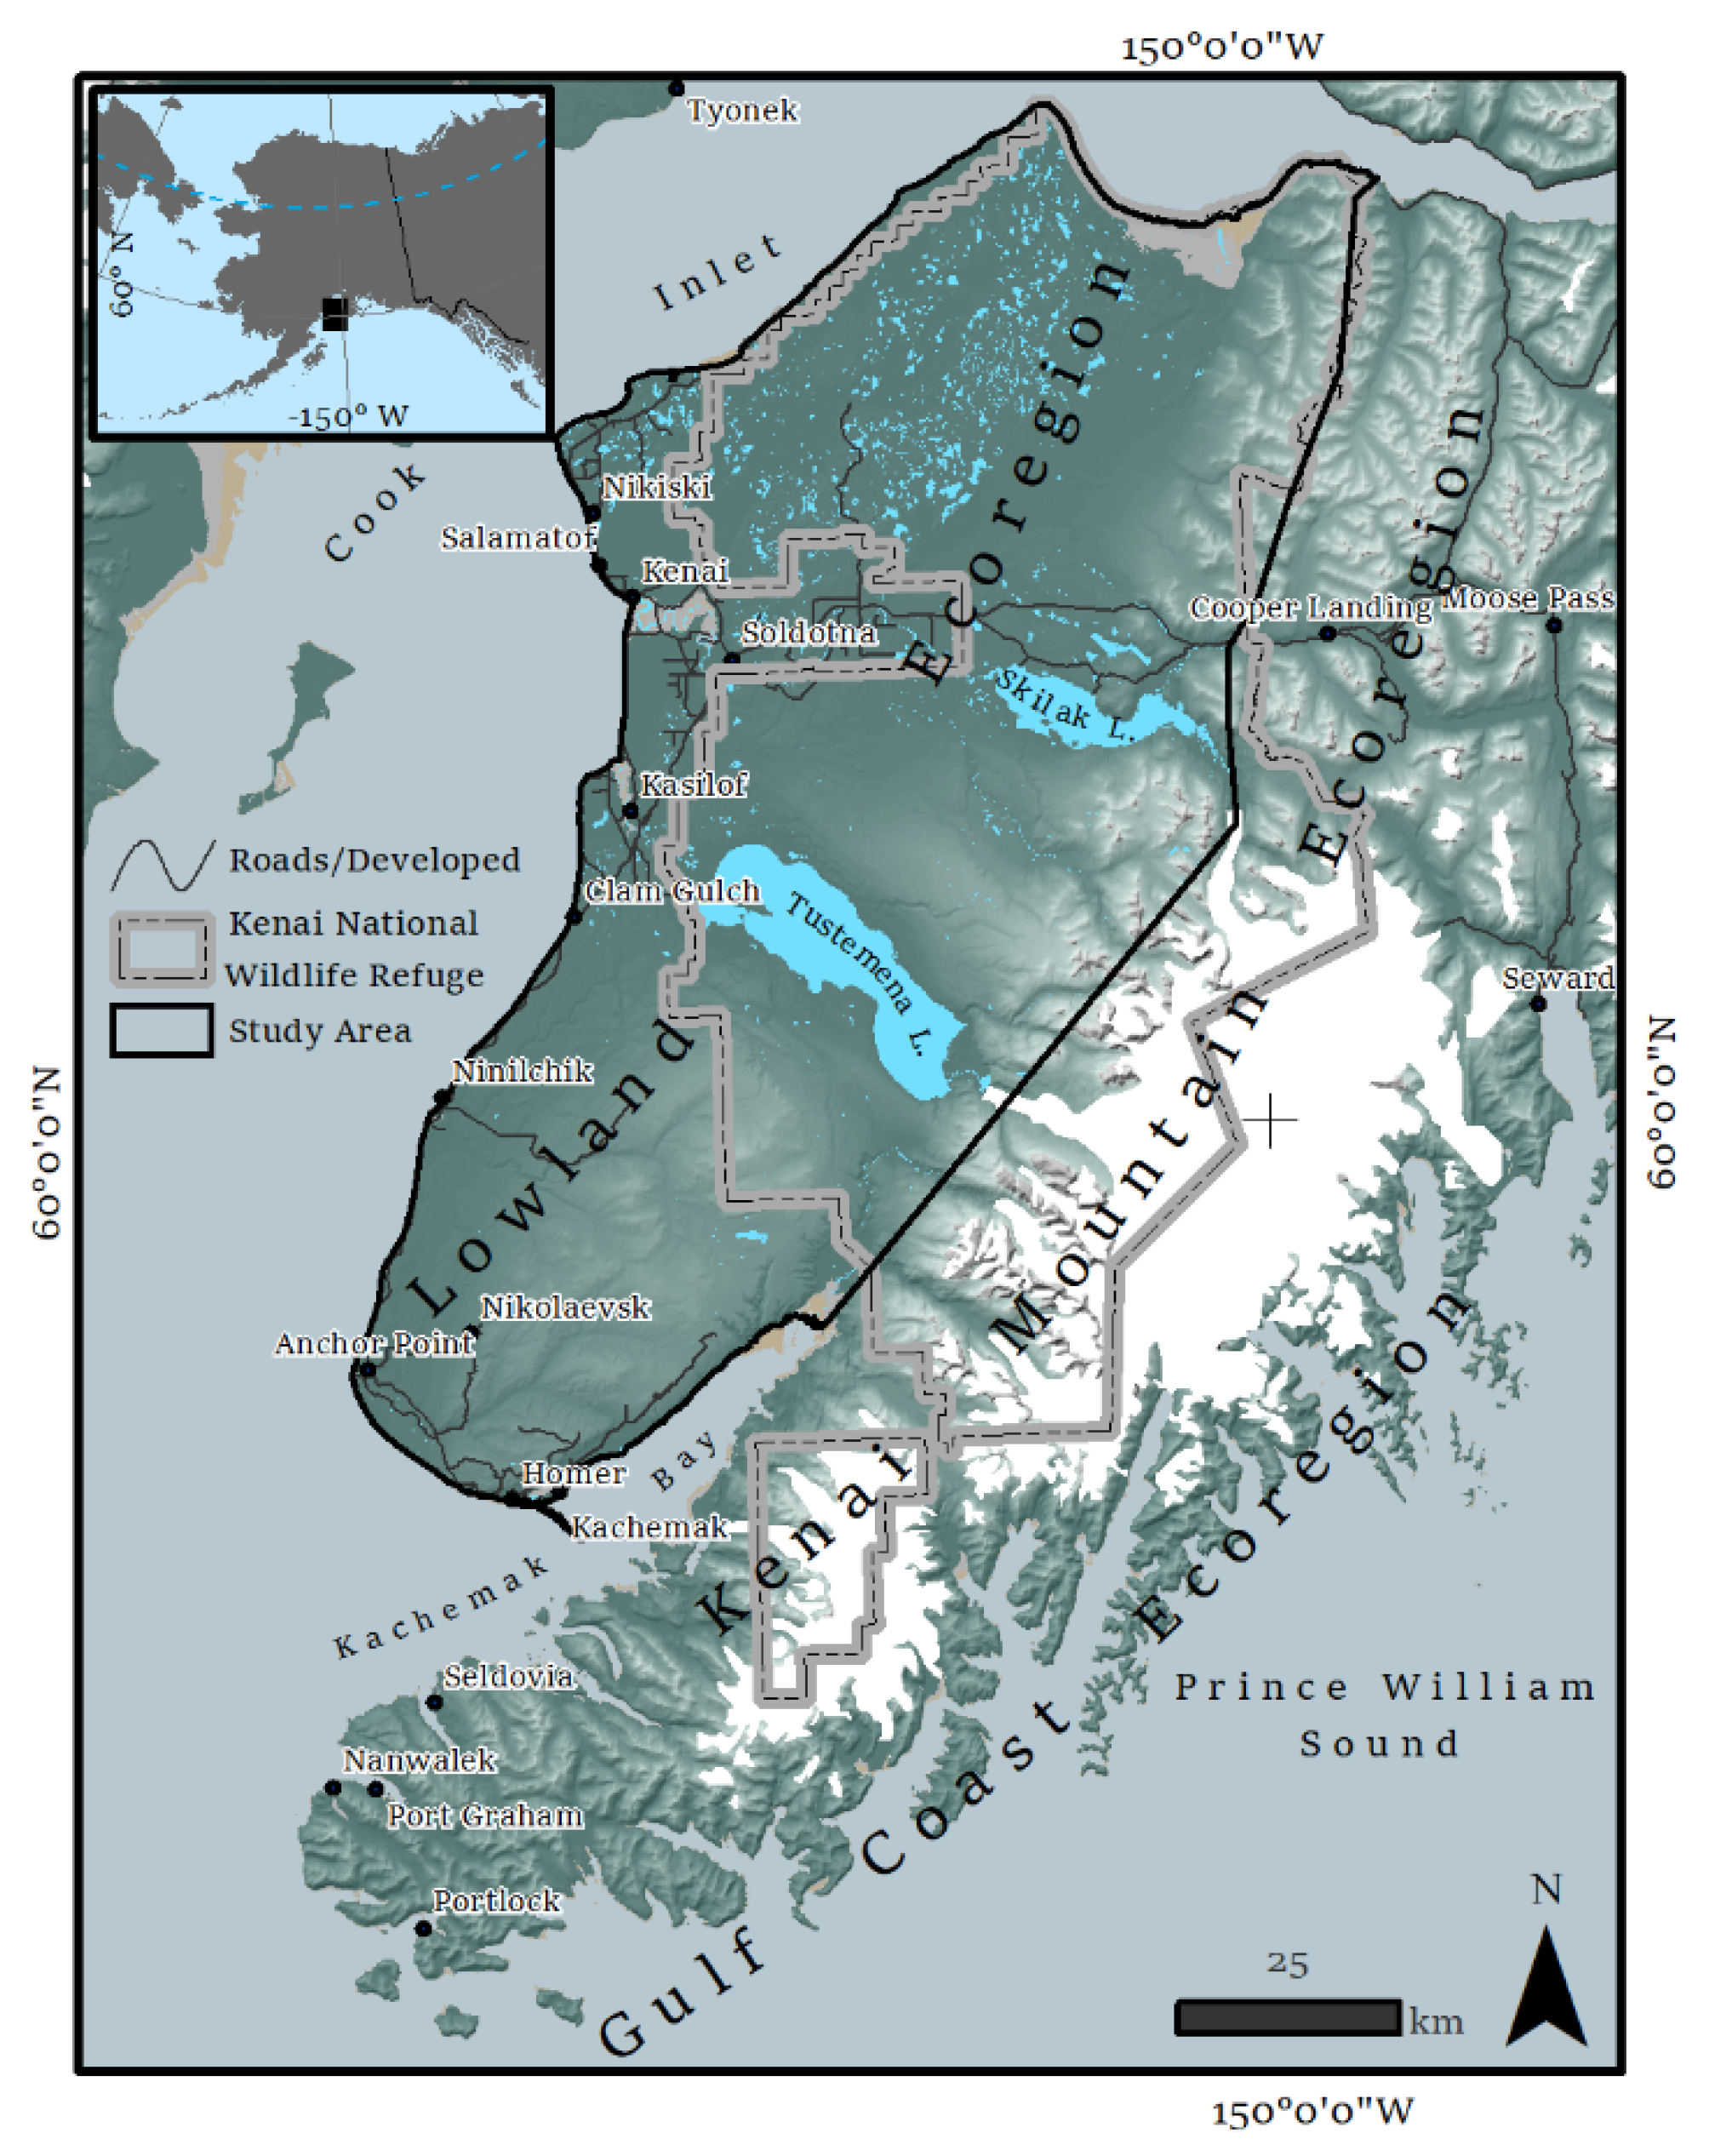
2.1. Study Area

The Kenai Peninsula is located in southcentral Alaska and extends southwest into the northern Gulf of Alaska (Figure 1). Colloquially termed “Alaska in miniature,” the Kenai Peninsula is a unique microcosm where many of the key land-cover components of arctic, subarctic, boreal, and coastal ecosystems can be found within proximity to each other in addition to a relatively dense human population [20]. The peninsula includes three ecoregions: the Gulf Coast along the east and southeastern margins, the Kenai Mountains, and lowlands west of the Kenai Mountains and east of Cook Inlet [21,33]. Our area of interest consists solely of the lowland portion of the peninsula, which can be further divided into the northern and southern lowlands [21]. The dominant vegetation types across the lowlands before recent and cover change consisted of black spruce (Picea mariana (Mill.) B.S.P), muskegs, birch forest (paper birch [Betula neoalaskana (Sarg.)], Kenai birch [Betula kenaica] (W.H. Evans)), white spruce (Picea glauca (Moench) Voss), and quaking aspen (Populus tremuloides (Michx)) forests with the addition of mature and extensive white and Lutz (Picea xlutzii (Little)) spruce and mixed species forests in the southern lowlands [21].
Although humans have inhabited the region for millennia, until recently the human impacts to land cover have been dwarfed by natural disturbances. The Dena’ina and Alutiiq people settled the Kenai Peninsula around 1000 A.D. and engaged in vibrant subsistence economies [34]. Settlers from Russia and the United States arrived in the late 17th and 18th centuries to support the fur trade, salmon canneries, and fox farming. The human population increased after gold was discovered in 1895; in the 1940s, when homesteading opened; and again in the 1950s, when oil and gas were discovered [35]. These activities began and continue to result in larger human-induced land-cover change including forest removal for infrastructure and agricultural resources and incidental human-caused wildfires. The Chugach National Forest was established in 1907 and the Kenai Moose Range (now a National Wildlife Refuge) was established in 1941. Highway construction to link the western peninsula to Anchorage began in 1946. Wildfires and spruce bark beetle outbreaks are significant disturbance agents within forests of the Kenai Peninsula [23,24,36]. Reconstruction of historical mean fire intervals (MFI) for the Kenai Peninsula indicate relatively short MFI of approximately 80 years in black spruce forests of the northern half of the peninsula [37] and much longer, 400–600-year MFI in white and Lutz spruce forests [24]. Major wildfires that have occurred on the peninsula within the period of detailed fire history records include the 1947 Kenai fire (128,727 ha), 1969 Swanson River fire (34,522 ha), 2015 Funny River fire (79,565 ha), and the 2019 Swan Lake fire (67,656 ha) as reported in the Alaska Large Fire Database (https://www.frames.gov/catalog/10465) [38]. Spruce bark beetles have also been an historically significant disturbance agent within white, Lutz, and Sitka spruce (Picea sitchensis (Bong.) Carrière) forests, with large outbreaks resulting in significant tree mortality approximately every 50 years [24]. Notably, spruce beetle outbreaks that began in the 1980s and continue today have affected the majority of Lutz spruce forests in the southern portion of the Kenai Peninsula [23,39]. Other natural disturbance agents (wind, fire, insect, fungus, and geomorphic processes) have affected all forest patches since post-glacial forest establishment [29].

2.2. Approach

We classified the entire Kenai Peninsula Lowland study area using temporally constrained satellite imagery, a random forest classifier, and training data derived from manual interpretation of high-resolution aerial imagery. Available data limited our approach to producing land-cover classification for three eras: circa 1973, circa 2002, and circa 2017. In each of these eras, two conditions were met. First, high-resolution aerial imagery was available for ground-truthing and model development within parts of the study area. Second, satellite imagery of sufficient quality for both summer (June, July, August) and winter (February, March, April) seasons was available for landscape classification. After historical land-cover classifications were developed for each era, land-cover change for three periods of assessment were tabulated. These periods include the early 1973–2002 period, the later 2002–2017 period, and the net change experienced over the entire 1973–2017 period.

2.3. Vegetation Classification

Vegetation type was both interpreted and modeled as one of nine general classes: needleleaf forest, broadleaf forest, mixed forest, alpine, barren, shrub, herbaceous, wetland, or water. These lifeform classifications are ecologically significant to the landscape and are also common to other land-cover classifications such as the National Land Cover Database (NLCD) [40]. We did not classify urban or developed land-cover types and instead used the extent of developed land covers from the 2011 NLCD (https://www.mrlc.gov/data/nlcd-2011-land-cover-alaska-0) to mask built environments from each era so that only consistently naturally vegetated areas were considered.

2.4. Image Acquisition

We used Landsat imagery acquired between 1973 and 2017 to classify vegetation into nine general classes based on vegetation height, density, and photosynthetic activity. We inspected the entire Landsat Collection-1 Level-1 archive housed within the U.S. Geological Survey (USGS) Center for Earth Resources Observation and Science (EROS) EarthExplorer web application for our study area and seasons of interest. From all Landsat platforms, we ultimately used scenes from Landsat 1 Multispectral Scanner (MSS), Landsat 7 Enhanced Thematic Mapper Plus (ETM+), and Landsat 8 Operational Land Imager (OLI) defining three eras: circa 1973, circa 2002, and circa 2017. These eras were solely the result of cloud-free scene availability during both summer and winter seasons. These three eras are the only eras where such conditions were met within our study area. Landsat Collection 1 data products are deemed suitable for time-series pixel level analysis and are organized into two tiers. Tier 1 contains the highest quality scenes considered suitable for time-series analysis, while Tier 2 consists of scenes potentially suitable for time-series analysis even though they do not meet Tier 1 criteria (https://lta.cr.usgs.gov/). Our analysis used both Tier 1 and Tier 2 scenes (Table 1). To facilitate the primary delineation between forest and non-forest areas, we used the blue band (Landsat 8 B2, Landsat 7 B1) from late winter scenes as a measure of vegetation density and general structure. We chose the blue band based on the snow’s highest reflectance in the blue portion of the electromagnetic spectrum.
For Landsat 1, which was not designed to acquire data in the blue band, we used the infrared band (Landsat 1 B7), which is only slightly less sensitive to reflectance of light from snow. Detection of forested area is based on the difference in albedo between forest canopy and open ground, where dense forest canopies mask the reflective ground snow, and non-forested areas are moderately to highly reflective in relation to decreased height and density of vegetation overtopping snow. Using this method, we found that land-cover types that are often misclassified, such as graminoid wetlands and low stature black spruce, were much more readily discernible when the winter scene was considered. Two overlapping winter scenes were used for each season for both the 2017 and 2002 eras. The 1973 era was prone to winter cloud cover, so five scenes from 1974–1975 were mosaicked together (Table 1). We used level 1 digital number (DN) values for all winter scenes except for those used in the c1973 era. For this era, each scene was manually clipped to remove cloud and shadow contamination; the DN values were standardized by using dark object subtraction based on ice-free offshore water and then rescaled so that large snow-covered lowland lakes common to overlapping scenes had a DN value of 140. These scenes were then ordered and mosaicked in ArcMap [41] using the FIRST operator, a method that determines the pixel value from the first raster dataset encountered in a mosaic list.
We used the Level 2 Enhanced Vegetation Index (EVI) spectral index derived from clear-sky summer scenes for the 2017 and 2002 eras available from USGS EROS Science Processing Architecture (ESPA, Equation (1)). This index is a ratio of red (R) and near infrared (NIR) signatures that incorporates the blue (B) band to reduce atmospheric noise, and results in a single-band product that scales the “greenness” of vegetation and permits classification of lifeforms based on the amount of photosynthetically active vegetation:
E V I = 2.5 × N I R R N I R + 6 × R 7.5 × B + 1
As an example, EVI can be used to differentiate broadleaf (highly photosynthetically active) and evergreen (less photosynthetically active) vegetation [42,43]. As ESPA does not provide Level 2 spectral indices for Landsat 1 or Landsat 2 from the 1973 era, we used the Transformed Vegetation Index (TVI) based on the red and infrared bands (Equation (2)). This index also functions as a measure of greenness by detecting differences in photosynthetic activity [44]. Scenes were selected to capture peak greenness (July–August) and minimal cloud contamination. Two overlapping scenes were also used for each summer season for each era.
T V I = N I R R N I R + R + 0.5

2.5. Model Development

The study area was divided into 30 × 30-m cells (0.09 ha) based on the Landsat 7 and Landsat 8 pixel resolution. Each cell was assigned a feature list containing pixel values from the winter and summer Landsat mosaics and values for slope, aspect, and elevation, which were derived from the Alaska 2-Arc-second digital elevation model (DEM) with a 60-m resolution [45]. A random forest classifier was developed for each era based on 3600 training points (400 points for each land-cover type). Training points were randomly distributed within training areas, and training areas were opportunistically distributed to capture the regional and geomorphic extent of each land-cover type to the extent possible given availability of aerial imagery. Training areas for the 2017 era were guided by plot data used in the development of the 2017 Kenai Vegetation Mapping Project [46]. Training areas were drawn around homogenous stands of vegetation identified by these points; these totaled 15,929 hectares and were distributed across the entire study area. Land cover was verified using high-resolution imagery acquired in 2016 by the Kenai Peninsula Borough (http://maps.kpb.us/gis/rest/services/2016_Imagery/MapServer).
For the 2002 era, we used previous interpretations of aerial imagery completed circa 1999 when the majority of the Kenai Peninsula’s land cover was manually classified. The shapefiles delineating land-cover type were acquired from the Kenai Peninsula Borough’s interactive Land Cover Viewer (http://maps.kpb.us/gis/rest/services/Vegetation/MapServer). This approach gave our 2002 era training area a net area of 844,920 hectares. For the 1973 era, training areas totaled 34,275 hectares and were restricted to the northern half of the study area due to coverage of high-resolution air photos acquired in 1975 and provided upon request by the Kenai National Wildlife Refuge. No reference data were available, and training areas were placed where homogenous vegetation patches could be confidently identified and manually delineated. Each training point was assigned feature list values and a land-cover type based on the corresponding cell values from the winter and summer Landsat mosaics, values for slope, aspect, and elevation derived from the same 60-m DEM, and manual interpretation of high-resolution aerial imagery. These training data were read into the randomForest package in R [47] and used to create a predictive model (classifier). The random forest classifier was then run for every cell within the entire study area. The classifier looked at the feature list for every pixel within the study area to determine the most probable land-cover type (Table 2). An independent model was developed and executed for each era [48]. Each model used 500 trees and tested two variables at each node. All other parameters remained in the default settings offered in the R package [47].
In addition to classifying vegetation type, we derived the classification probability for each pixel that represents the proportion of decision trees that “voted” for the majority classification [48]. In our classifications, 11.2% probability represented the minimum proportion of votes (56 out of 500) needed to achieve a majority vote. To produce a conservative estimate of land-cover transition rates, we summarized our estimates of land-cover area and transition rates for pixels with a probability greater than 50%. We bound these estimates with error bars representing probabilities >25% (upper) and probabilities >75% (lower).

2.6. Land-Cover Assessment and Change Detection

Our region of analysis encompasses a total area of 9300 km2. We excluded urban and developed areas mapped in the 2011 NLCD, which removed approximately 160 km2 from within the study area for a final area of 9142 km2. The proportion of this final area that is classified depends on the probability level used in our summary statistics. All 9142 km2 are classified with a minimum probability of 11.2%. When we only consider model predictions where the probability of the majority predicted land cover was greater than 25% (over twice the minimum required for a majority vote), 2–3% of our final study area becomes indeterminable. In other words, 0.4–0.5% (37 km2–46 km2) of our study area becomes indeterminable depending on the era. If we restrict our analysis to pixels where the probability of the majority predicted land cover is greater than 75%, our confidence in model predictions is maximized but 64–81% (5864 km2–7403 km2) of our study area becomes indeterminable depending on the era. When using the intermediate threshold of a >50% probability, 27–38% (2505 km2–3503 km2) of our study area becomes indeterminable. This 50% probability threshold provides a conservative estimate and allows us to more confidently approximate the spatial extent of various land-cover types and provide margins of error associated with vegetation transition types and transition localities (Figure 2).
To produce a spatially explicit land-change product, a feature list was produced for each grid cell within the study area that contained the predicted land-cover type for each era. Using the ArcGIS environment, this feature list could be queried to group specific sequences of land-cover classes into interpreted ecological processes (e.g., deforestation). For example, if a pixel was classified as needleleaf, mixed, or broadleaf forest in one era and then transitioned to a non-forested class in a subsequent era, it was termed “deforestation”. Grid cells that were not forested in an era and transitioned to a forest class in a later era were considered “reforestation.” We considered pixels that remained in wetland classification for the 1973 and 2002 era but transitioned to a woody classification (forest or shrub) in 2017 to represent afforestation of wetlands. We considered pixels that remained in shrub classification for the 1973 and 2002 era but transitioned to forest in 2017 to represent afforestation of shrub lands and a possible elevational increase in tree line. The total areas of each transition type were summarized within the ArcGIS environment by counting the number of grid cells that shared specific transition types. Lastly, raster datasets were produced to graphically display the spatial extent of forest loss and gain among the eras.

3. Results

3.1. Classification Accuracy

When using random forest classification routines, a subset (approximately 36%) of the training data is automatically reserved and employed in model testing. The test statistic is reported as the out of bag estimate of error rate. The error rate for 1973 was 14.5%. Out of bag estimates of error rate for 2002 and 2017 were 30.67% and 10.06%, respectively. General classification accuracy was good across all three eras with classification accuracies of >80% for forest (needleleaf, broadleaf, or mixed) vs. non-forest (Table 3). User accuracy for classifying forest was highest for 2017 at 97.7% and lowest for 2002 at 85.4%. The 1973 era attained user accuracy of 94.5 %. General classification accuracy appeared to be influenced by training area as the larger the training area, the lower the user’s and producer’s accuracy.
Classification accuracy was >50% for all vegetation types across all eras (Table 4). The 2002 era had the lowest user’s accuracy (UA) compared to the 2017 and 1973 eras. This is likely because the 2002 era has a broader training area with more scattered training locations and greater variation in the attributes associated with the training data points. The 2017 era had the highest UA across all vegetation types, with all values above 80%. This may represent greater classification potential from the increased radiometric resolution of the OLI sensor found in Landsat 8 as compared with ETM+ sensor used in Landsat 7 and MSS sensor used in Landsat 1 and 2.

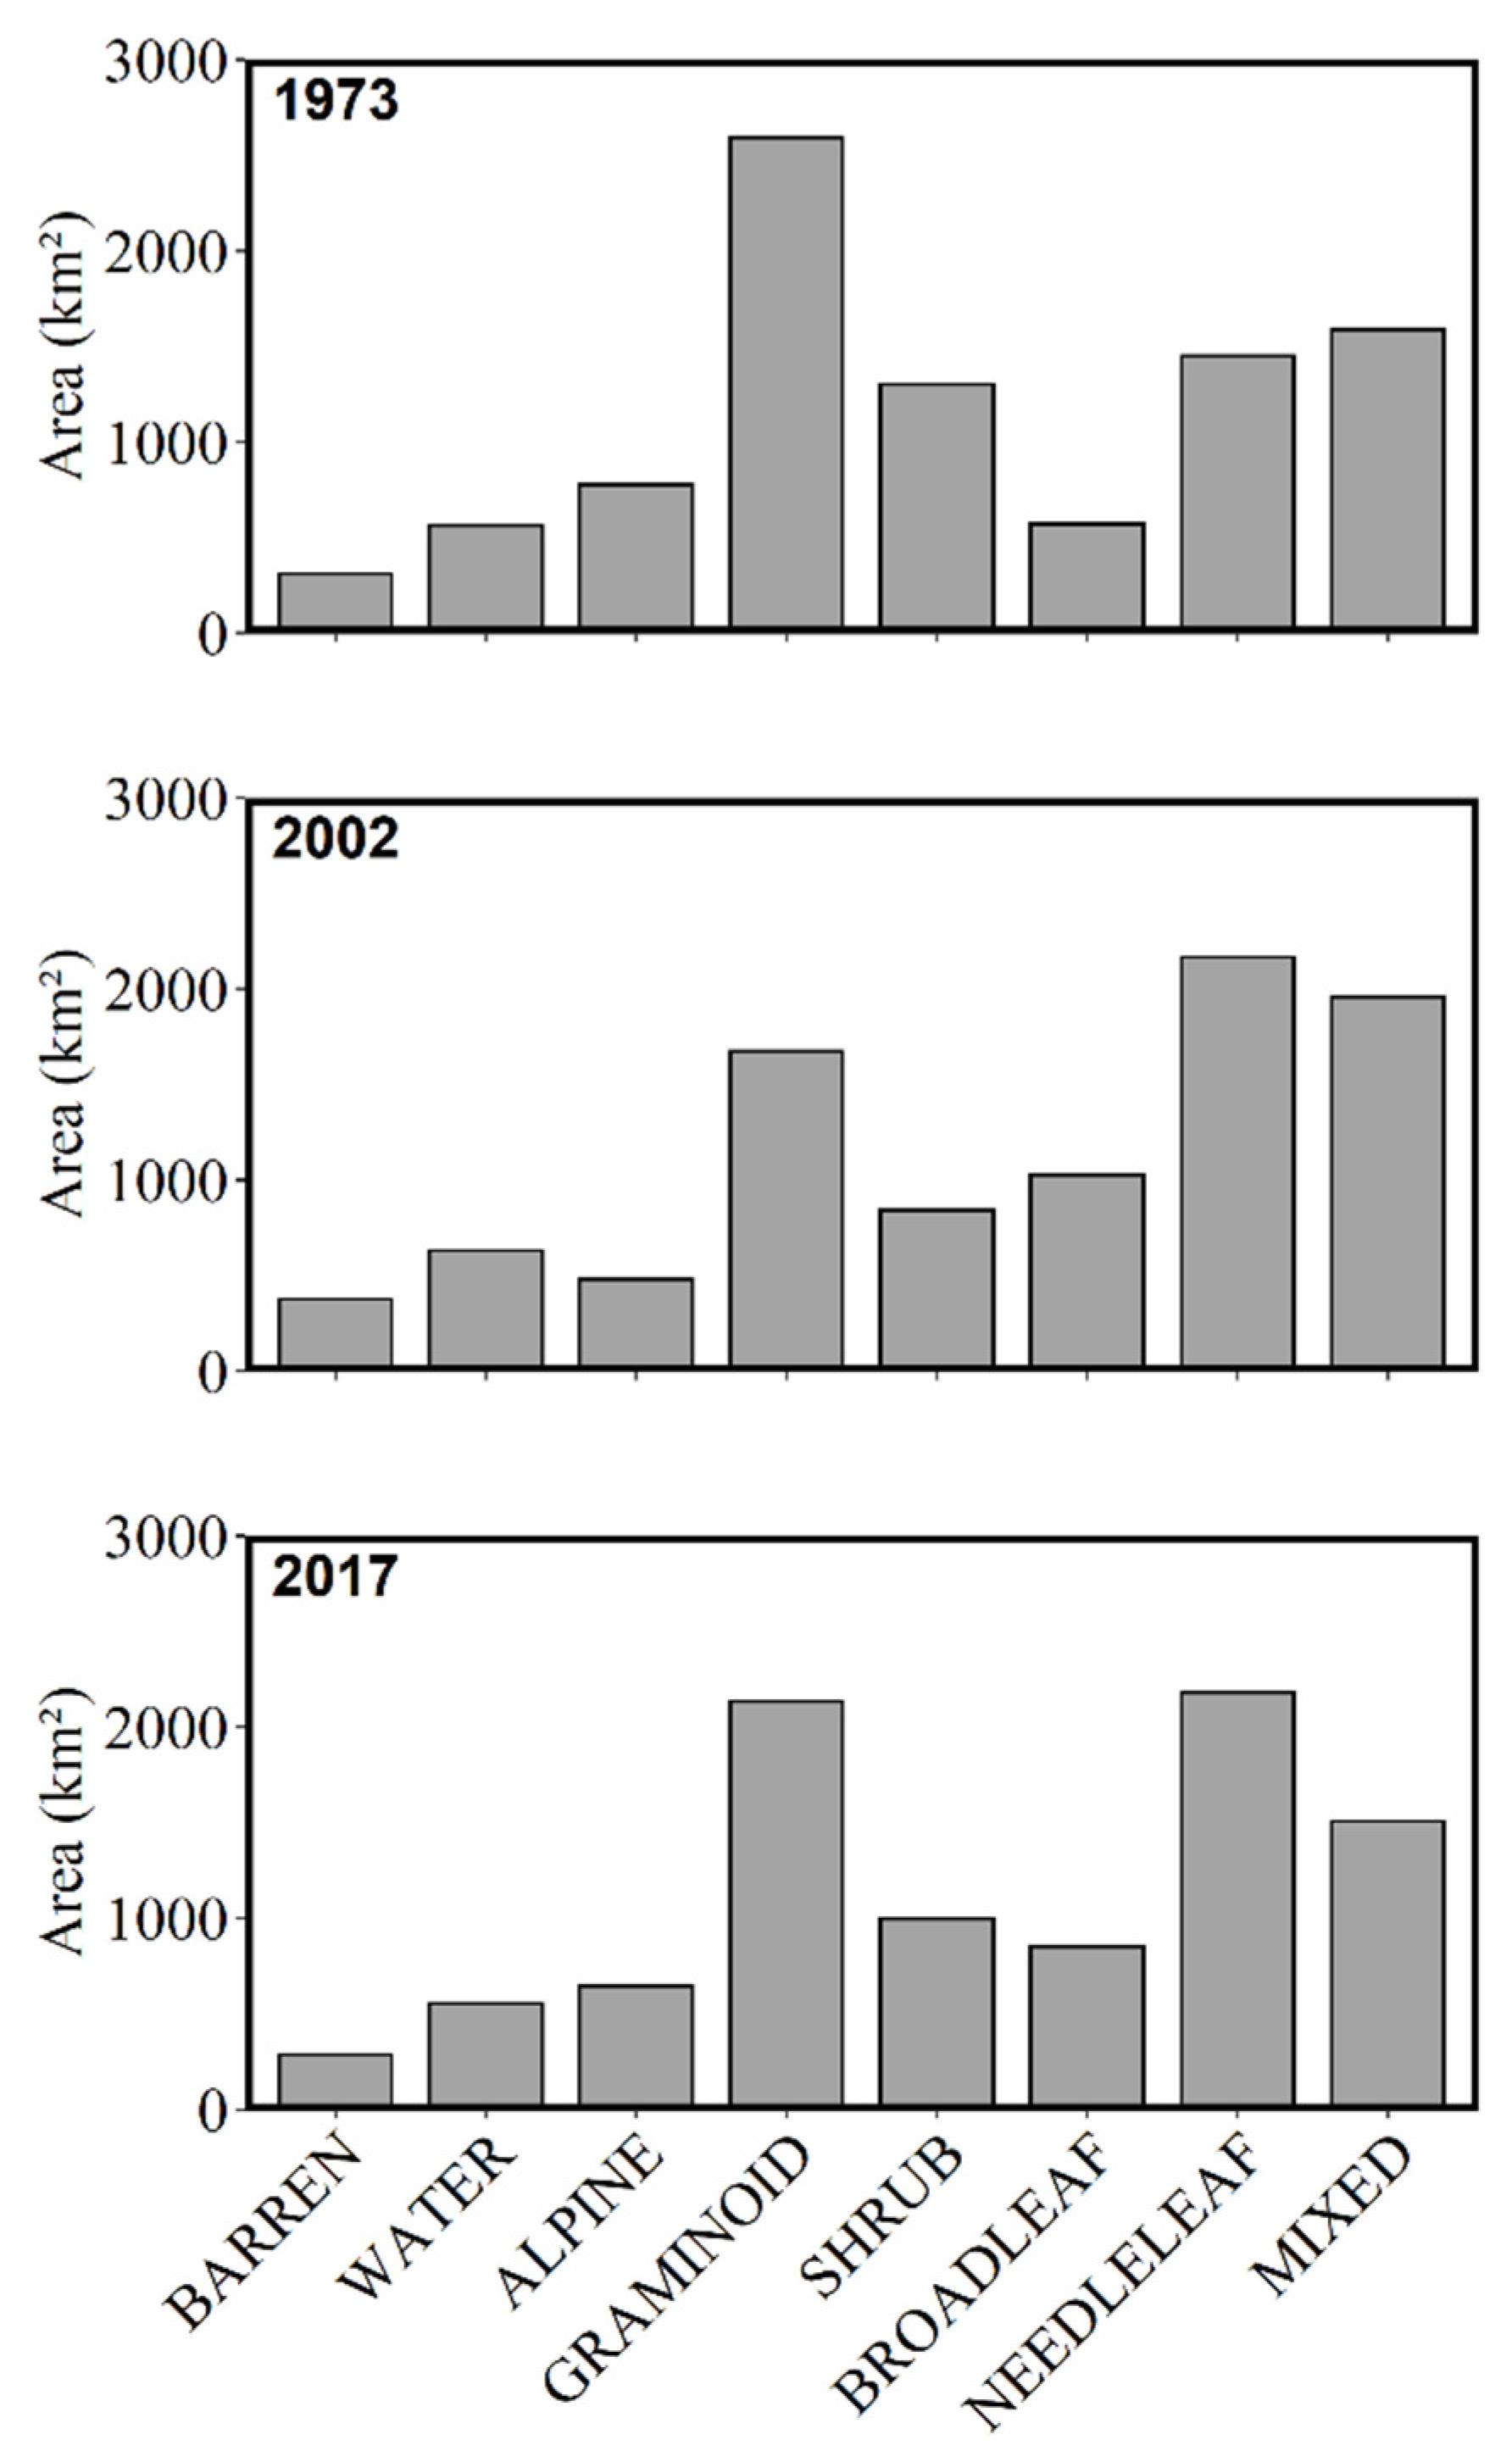
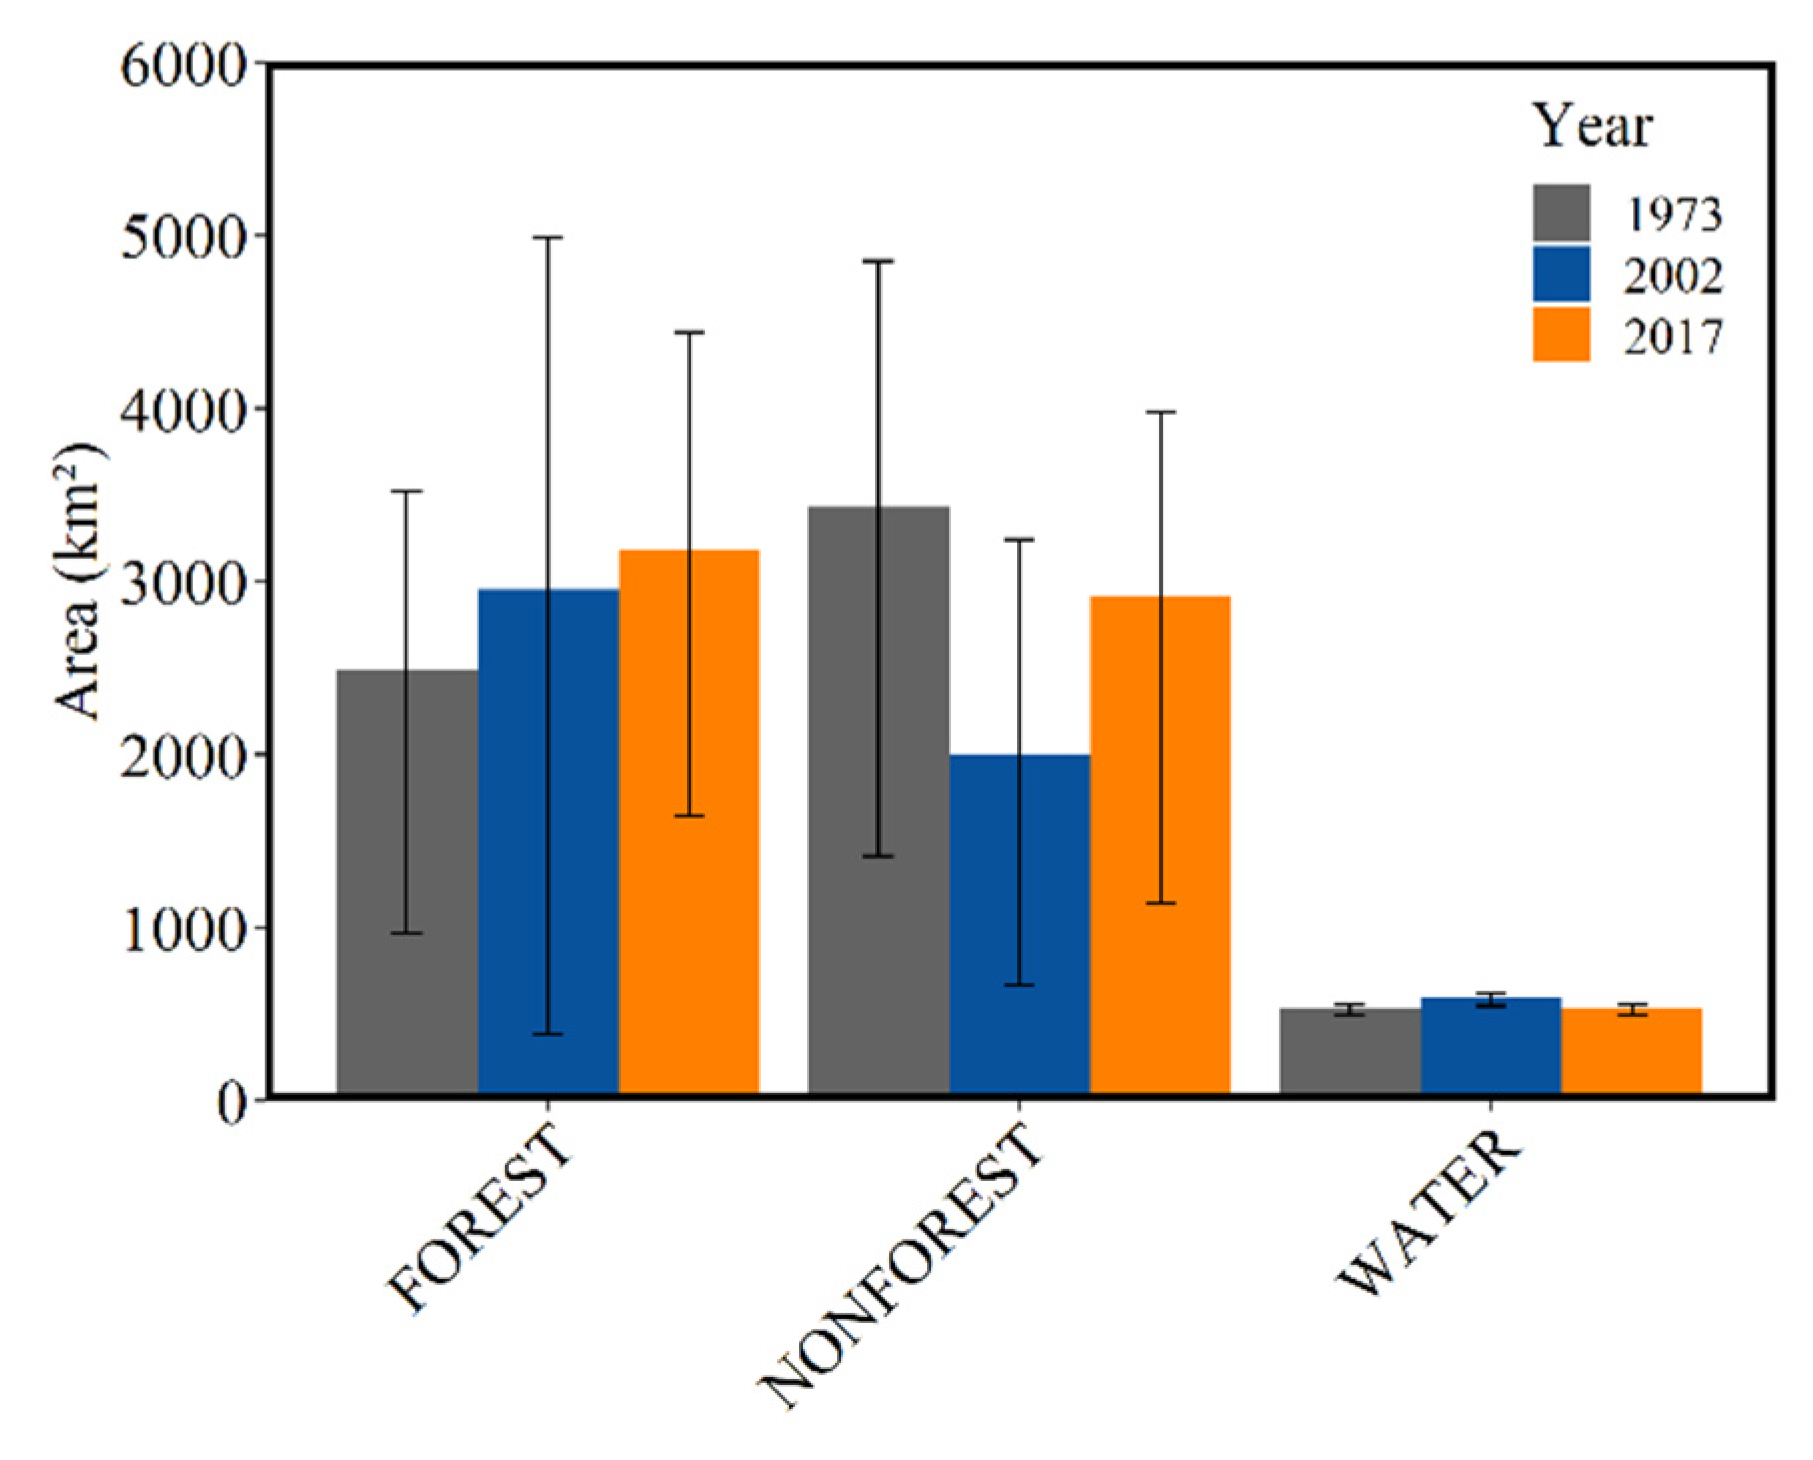
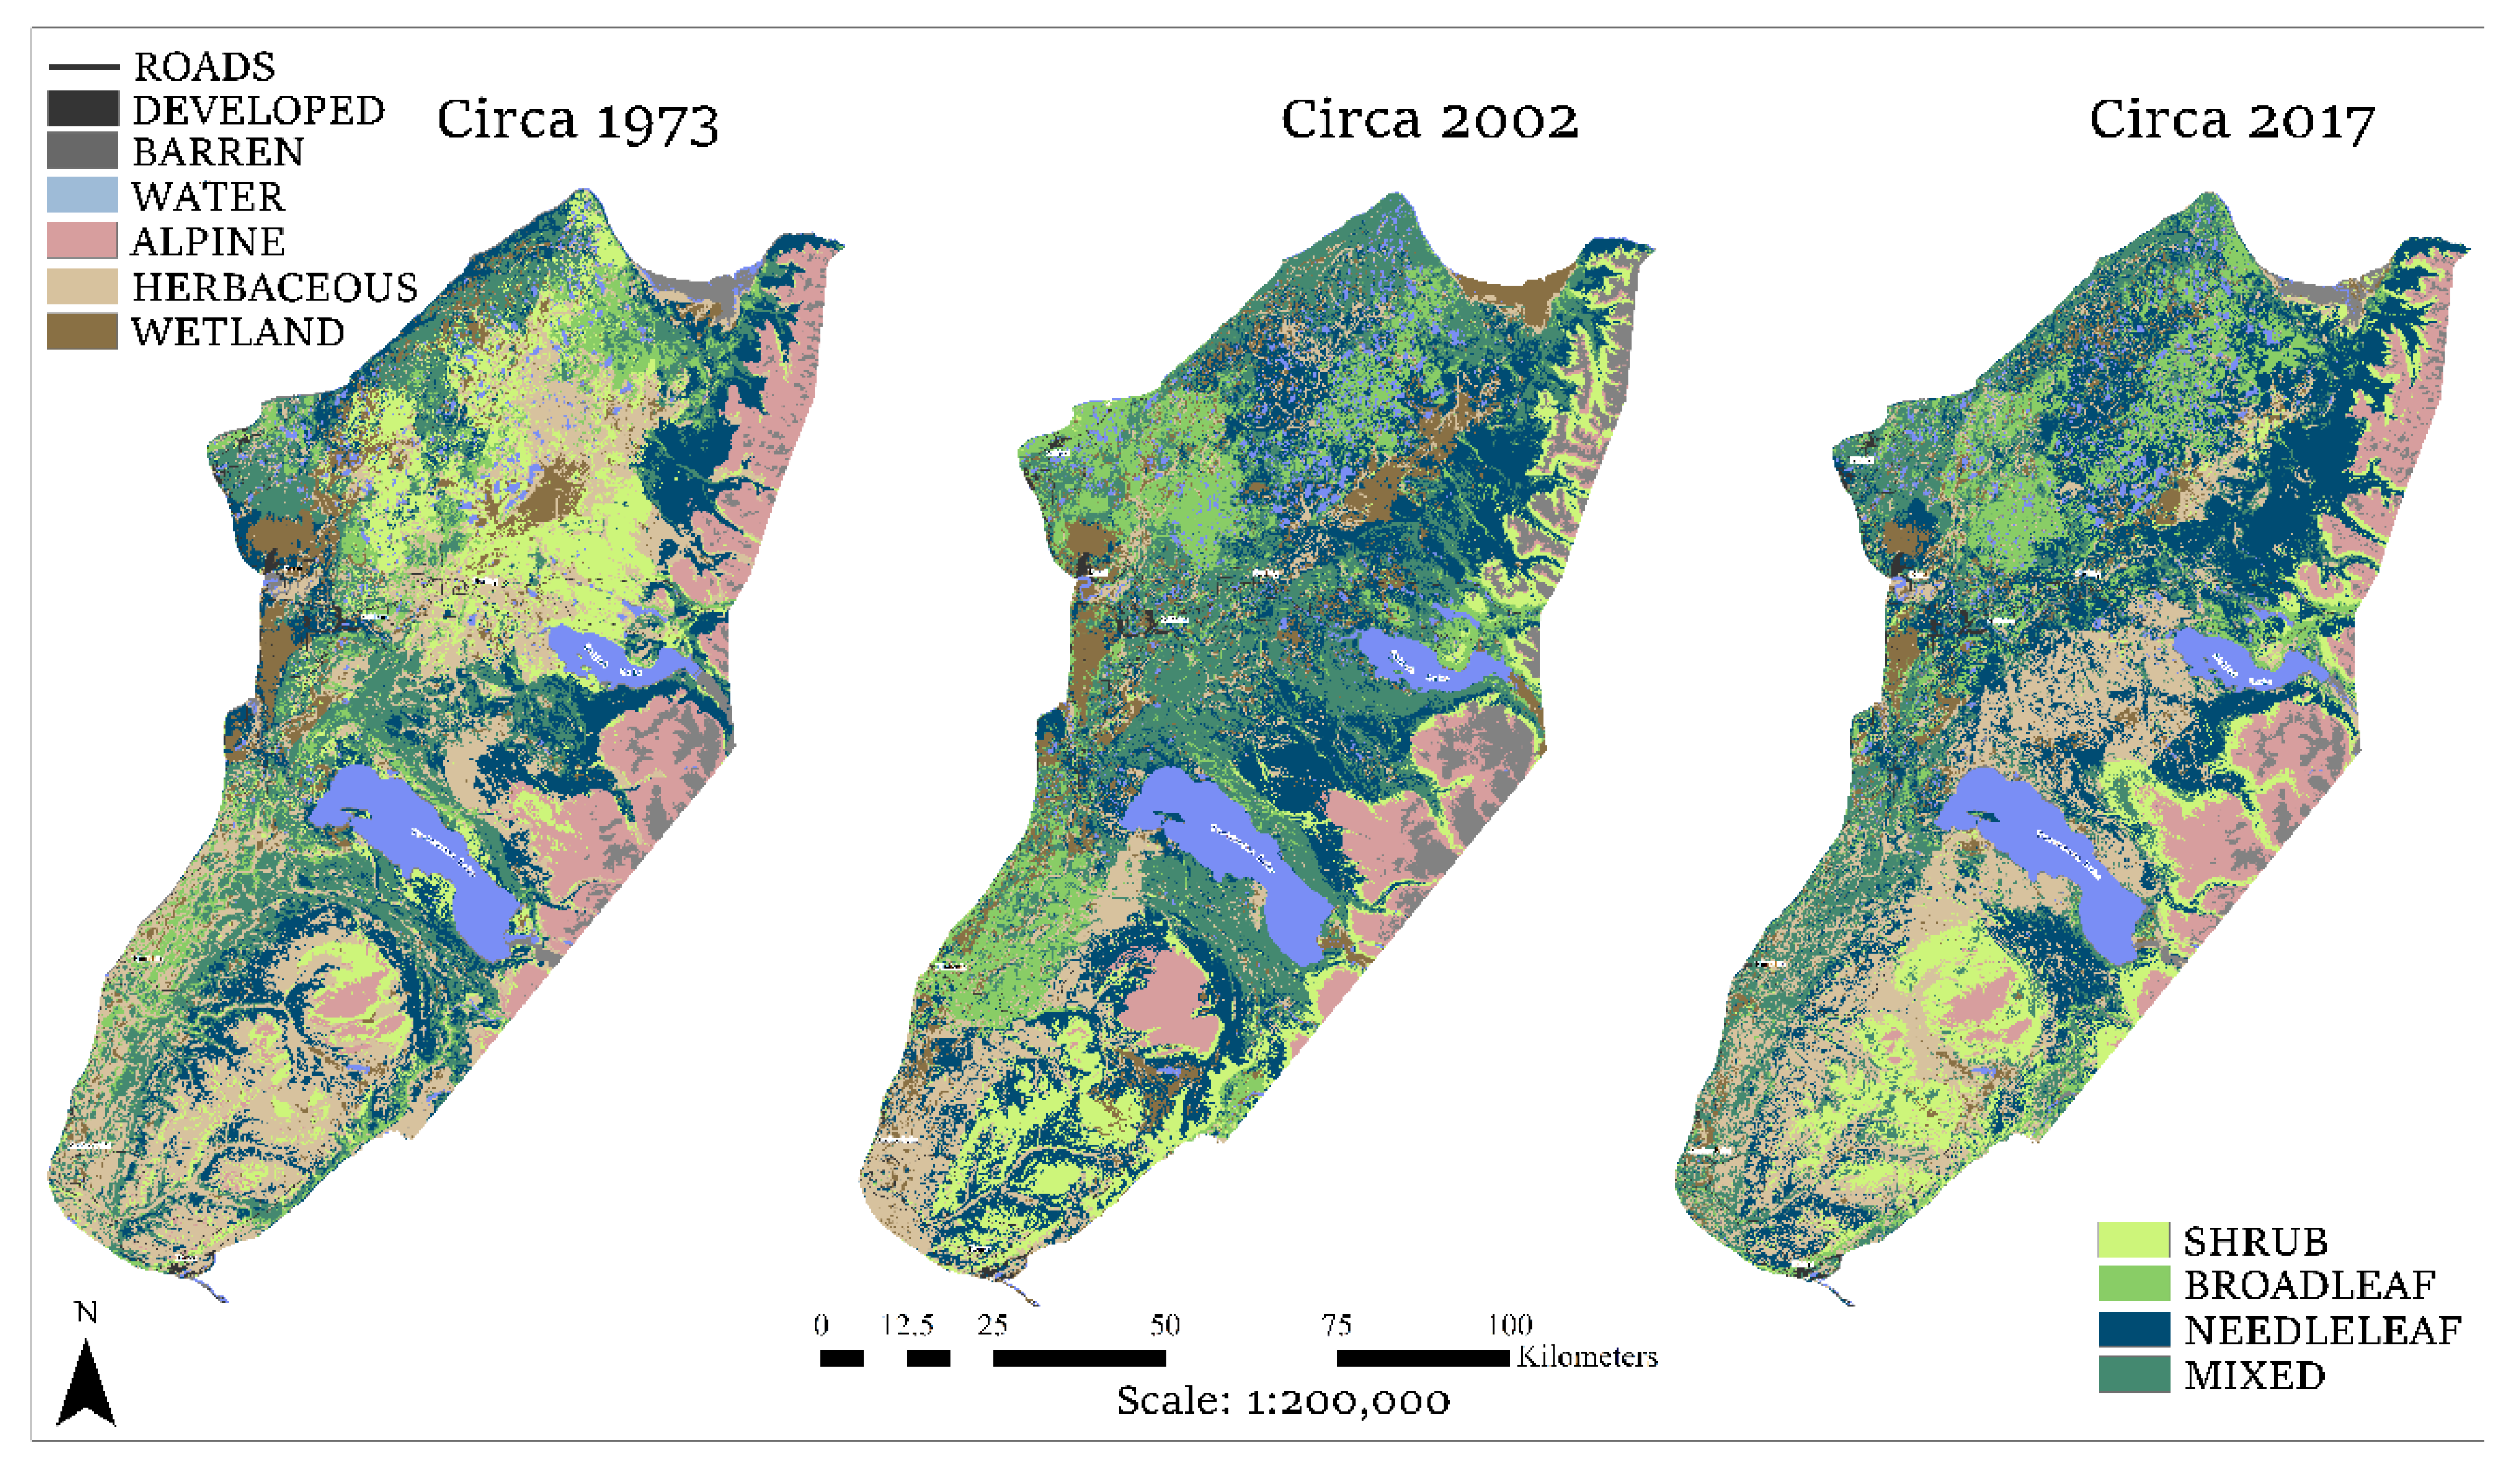
3.2. Land Cover by Era

For the 1973 era, 71% (6457 km2) of the study area was classified. Forest covered approximately 39% of the study area (2494 km2) (Figure 3), while non-forest land-cover types excluding water covered 61% of the study area and totaled 3429 km2 (Table 5, Figure 3). Of the forest cover, roughly equal parts were needleleaf (16% or 1024 km2) and mixed species (16% or 1064 km2) forest (Figure 2). Broadleaf forest made up roughly 6% of the total forest area (407 km2) (Figure 2). Approximately 43% and 20% of the total non-forested area was made up of graminoid and shrub cover types, respectively, with alpine and barren ground land cover comprising the remaining 17% and 6%, respectively (Figure 2). Area covered by water totaled 532 km2 and accounted for approximately 8% of the total classified area (Figure 3).
In 2002, only 62% (5638 km2) of the study area was classified. Total forest area covered 52% (2955 km2) of the classified area and non-forest land cover totaled 48% (2683 km2) (Table 5, Figure 3). Forest cover was divided among classes with needleleaf, mixed, and broadleaf composing 22.2% (1250 km2), 20.4% (1148 km2), and 9.9% (558 km2) of the area, respectively (Figure 2). Within the non-forest classes, 6.3% (356 km2) of the classified area was herbaceous. Shrub, alpine, and barren land cover made up the remaining 9.9% (558 km2), 7.2% (404 km2), and 5.9% (330 km2) of the area, respectively (Figure 2). Water totaled 595 km2 and accounted for 10.5% of the study area.
In 2017, 73% (6637 km2) of the study area was classified, leaving 27% (2505 km2) as unclassified. Classified area was roughly equally divided between forest cover (48%) and non-forest cover (52%) or 3183 km2 and 3453 km2, respectively (Table 5, Figure 3). Of area classified as forested, approximately 25% (1642 km2) was needleleaf, 13.7% (907 km2) was mixed species, and 9.6% (634 km2) was broadleaf (Figure 2). Non-forested area totaled 3453 km2 (Figure 3). Graminoid non-forest (the combined area of both herbaceous and wetland-cover types) made up the majority (22% or 1441 km2) of the total non-forested area. The shrub class made up 10% (658 km2), and the alpine class made up 9% (598 km2) (Figure 2). In 2017, water was classified for 495 km2 or approximately 15% of the total classified area (Figure 3).

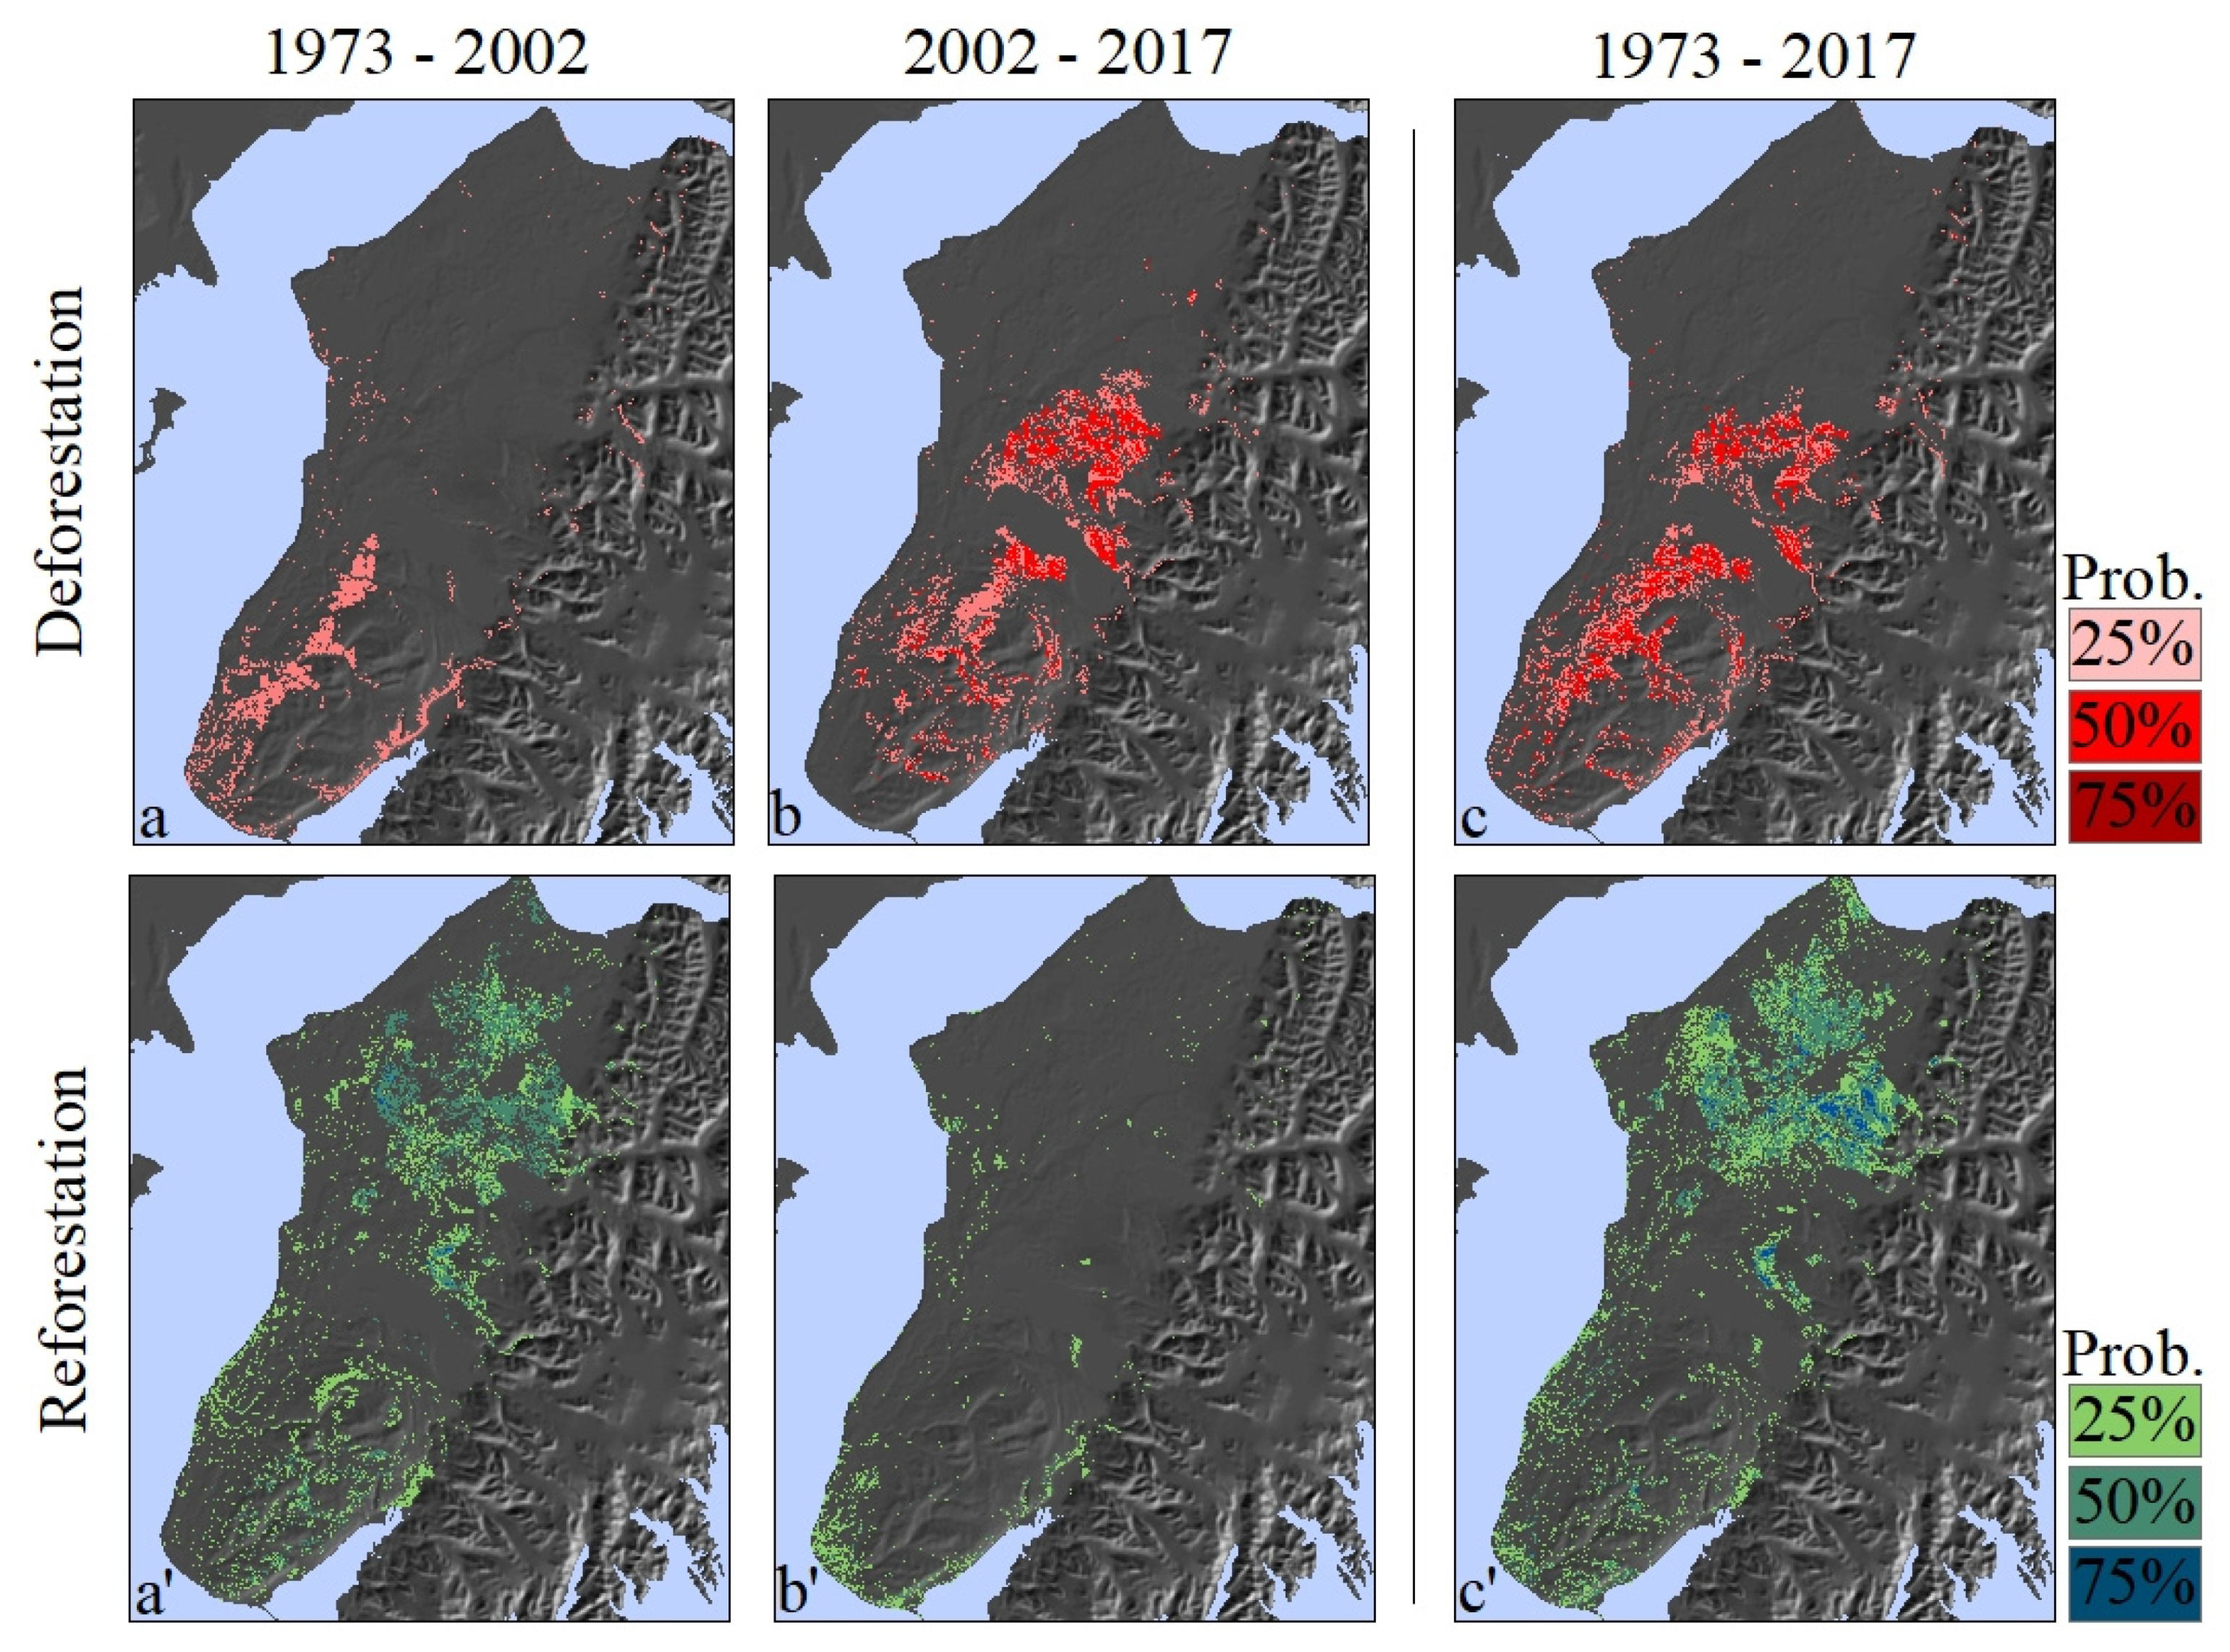
3.3. Change Detection: Deforestation

3.3.1. 1973–2002

Approximately 6% (158 km2) of the pixels classed as forest in 1973 were no longer forest classes by 2002 (Figure 4). Approximately 47% (75 km2) of the deforestation area was previously needleleaf forest, 43% (68 km2) was previously mixed forest, and 10% (15 km2) was broadleaf forest in 1973. The majority of these deforested pixels (81% or 128 km2), transitioned to graminoid land cover (Table 6). Conversion of forest to shrub was the next most common (17% or 28 km2), followed by forest transition to water (2% or 2 km2), alpine (0.3% or <1 km2), or barren ground (0.08% or <1 km2).

3.3.2. 2002–2017

Approximately 13% (374 km2) of the pixels classed as forest in 2002 were no longer forest classes by 2017. Deforestation comprised 50% (187 km2) needleleaf forest, 43% (161 km2) mixed forest, and 7% (26 km2) broadleaf forest. The majority of deforested pixels transitioned to graminoid non-forest (85% or 319 km2; Table 6). Forest transition to shrub was the next most common (15% or 55 km2), followed by transition to barren ground (0.07% or <1 km2), water (0.02% or <1 km2), or alpine (0.01% or <1 km2).

3.3.3. 1973–2017

Between 1973 and 2017 (the net change within our study area), approximately 18% (457 km2) of the pixels classed as forest in 1973 were no longer forest classes by 2017. Previously forested area included 54% (247 km2) needleleaf forest, 40% (184 km2) mixed forest, and 6% (26 km2) broadleaf forest. The majority of deforested pixels (87% or 396 km2) transitioned to graminoid non-forest (Table 6). Transition of forest to shrub was the next most common (13% or 58 km2) followed by barren ground (0.3% or 1 km2), alpine (0.2% or 1 km2), or water (0.2% or 1 km2).

3.4. Change Detection: Reforestation

3.4.1. 1973–2002

Between 1973 and 2002, 18% or 695 km2 of non-forest pixels transitioned to forest. The majority (54% or 373 km2) of these transitions were in pixels classified as graminoid (Table 6). Transition to forest from shrub (46% or 321 km2) was the second most common transition. The majority (50% or 351 km2) of the forest gained during this period was needleleaf forest. Mixed species forest was the next most common (29% or 200 km2) followed by broadleaf forests (21% or 145 km2).

3.4.2. 2002–2017

Between 2002 and 2017, 2% of the area classed as non-forest (54 km2) transitioned to forest. Again, the majority of these transitions were in pixels classified as shrub (50% or 27 km2) or graminoid (49% or 26 km2; Table 6). The majority of the forest gained during this period (41%) was mixed species forest totaling 22 km2. Broadleaf forest was the next most common (34% or 20 km2), followed by needleleaf forests (22% or 12 km2).

3.4.3. 1973–2017

Between 1973 and 2017 (the net change within our study area), 23% of the area (886 km2) classed as non-forest in 1973 had transitioned to forest by 2017. The majority of the net forest gain between 1973 and 2017 was needleleaf (52%) totaling 459 km2. Mixed species forest was the next most common (25% or 225 km2), followed by broadleaf forests (23%, 202 km2). Reforestation occurred in nearly equal proportions of area classified as shrub (47% or 416 km2) and graminoid (52% or 463 km2) land cover (Table 6). A portion (~0.3%) of this forest gain came from pixels previously classified as alpine.
Afforestation, the intrusion of shrubs and trees into historically non-forested areas, accounts for a small proportion of the observed forest gains in this time frame. Conversion of persistent wetland into forest made up 0.2% or 0.6 km2 (Table 6). Of this area, 76% converted to needleleaf, 8% converted to mixed forest, and 17% converted to broadleaf forest. Wetland transition into shrubs occurred over an additional 2.6 km2. Transition from shrub to forest accounted for 0.3% or 0.9 km2 of forest gain (Table 6). The majority of shrub to forest transition was to needleleaf forest (47%) followed by transition to broadleaf forest (29%) and mixed species forest (24%).

4. Discussion

4.1. Four Decades of Land-Cover change on the Kenai Peninsula

Our analysis indicates that substantial land-cover change has occurred across the Kenai Peninsula over the last 44 years with the exception of water extent, which remained stable between 1973 and 2017 with a slight peak in 2002 (Figure 3). Although deforestation events related to spruce bark beetle outbreaks, wildfires, and timber harvest have occurred on the Kenai Peninsula over the past four decades [24,36,49], our classifications suggest that the peninsula has actually become more forested over the period of analysis, because significant and prolonged forest loss in the southern half of the peninsula (Figure 5) has been offset by forest regrowth in the northern half. Forest regrowth is characterized as increased cover of needleleaf and broadleaf forest between 1973 and 2017. These transitions were primarily within the large fire perimeters of the Kenai fire of 1947 and the Swanson River fire of 1969.
Additional reforestation occurred as the infilling and maturation of forest cover around and within existing forest patches. Prominent reforestation occurred within the 1994 Windy Creek fire, located in the central portion of the study area. We also noted what appeared to be reforested logging patches in the southern portion of the study area. Some reforestation occurred within areas previously classified as alpine. It is possible that these pixels represent an encroachment of trees into higher elevations; however, we suspect these are erroneous classifications due to the improved ability of Landsat 8 over earlier platforms to detect small and scattered trees characteristic of elevational tree lines. Transition areas from wetland to forest and/or shrub are scattered throughout the study area and predominantly clustered within the large wetland complexes north and south of the communities of Kenai and Soldotna. Additional transitions are located within the wetland complex north of Skilak Lake. The transition of forest to shrub occurred along mountain slopes where forest stands blend into shrub thickets. This pattern aligns with the elevational increase in tree line that has been documented elsewhere on the peninsula [50].
Interestingly, mixed-forest cover decreased between 1973 and 2017. We hypothesize that this was due to transitions from mixed forest to needleleaf forest via maturation of coniferous tree canopies in mixed-forest patches, which sways classification towards a needleleaf designation. Mixed forest to broadleaf transitions are coincident with large forest patches in the northern half of the peninsula and may represent disagreement in classification between the eras. The increased spatial and spectral resolution in Landsat 7 and Landsat 8 offer greater ability to differentiate broadleaf forests from the more common mixed-forest types.
Known disturbances from insect outbreaks, wildfire, and timber harvests align well with our detection of land-cover change, giving us confidence that the methods employed in our study capture true change. Land-cover changes are primarily attributed to pulse disturbances that are readily detected by both Landsat sensors and human observers. Between 1973 and 2002, forest loss was concentrated within the southern half of the peninsula (Figure 4), primarily associated with known spruce bark beetle mortality, resultant salvage logging operations, and the 1996 Crooked Creek wildfire [38]. Between 2002 and 2017, deforestation occurred primarily within the central and northern portions of the peninsula chiefly within the perimeter of wildfires and additional spruce bark beetle infestations. Specific locations of forest loss align with the 2005 Fox Creek fire, 2007 Caribou Creek fire, 2009 Shanta Creek fire, and 2014 Funny River fire [38]. Smaller additional areas of forest loss are distributed across the southern half of the peninsula and likely represent human- and insect-caused forest loss. Some deforestation within the northern half of the study area can be attributed to prescribed fire and forest mastication efforts completed within the Kenai National Wildlife Refuge. These disturbance events were often perceived as negative impacts on the biophysical and socioeconomic systems by people living in the area [51]. The loss of forest and conversion of forest to graminoid-dominated cover has received considerable attention from both the scientific community and general public [36]. Less perceptible to human observation, but well-captured in our long-term analysis, are the slow shifts in vegetation primarily due to forest succession. This land-cover change has not received the same attention as that of forest loss, likely due to the slower process of natural succession and the fact that the majority of forest succession is occurring away from populated areas. The increase in forest area is largely a reflection of transitions from shrubs to forest during the 1974–2002 period. Within this time frame, reforestation occurred primarily as recovery from the 1947 Kenai fire.
The greater extent of reforestation in the north as compared with the southern portion of the peninsula may be partially explained by disturbance history and species responses. Wildfires have historically been more frequent and extensive in the northern portion of the peninsula [24,38], whereas bark beetle-caused forest mortality has been more extensive in the southern portion (Figure 6). Both disturbance agents (fires and beetle outbreaks) have occurred throughout the study area, suggesting that the region is broadly vulnerable to disturbance; however, wetter and cooler conditions in the south relative to the north [33] may explain the reduced frequency and extent of fires, while drier and warmer conditions in the northern peninsula have facilitated wildfire spread. Low-elevation forests, in which the principal needleleaf species are white and/or Lutz spruce, are the most vulnerable to beetle attack [52] and were historically most common in (or in the case of Lutz spruce, restricted to) the southern portion of the Kenai Peninsula. Black spruce forests, most extensive in the northern portion of the peninsula, were found to be least vulnerable to beetle damage [52] but are especially flammable and therefore regularly disturbed by wildfire [37,53]. For many of the woody species found on the Kenai Peninsula, exposure of mineral soil improved rates of seedling establishment and survival [54,55,56], which is more likely to occur with forest fires that create tree throws (subsurface depressions left by tree roots) and combust the surficial organic horizon [57,58,59]. In contrast, bark beetle-caused tree mortality can lead to a release of Calamagrostis grass, which is negatively correlated with seedling establishment [60]. This may be slowing reforestation dynamics in the southern portion of the peninsula [21] and highlights unique species, disturbance, and biogeographic patterns of vulnerability and resilience.
The vast majority of the reforestation we report in this study is natural succession of forest patches where forest cover is the historical land-cover type (Figure 7A,A’) and instances of non-forest status only occur following pulse disturbances such as wildfire (Figure 7B,B’). A subset of this reforestation, however, represents true afforestation—the establishment of forest communities in locations that are historically devoid of forest. This is the case for locations that are traditionally wetland or upland non-forest that have clearly transitioned to a forested status (Figure 7C,C’). We found it necessary to restrict our analysis to our first two eras to identify pixels that were persistently non-forested and that transitioned to forest between 2002 and 2017. We further emphasize that site specific investigations are required to document true encroachment of forest cover into areas that have no known disturbance or appear to have been historically persistent non-forested areas (Figure 7C,C’).
Large and significant shifts in vegetation continue to occur across the study area. During the summer of 2019, numerous wildfires resulted in further natural forest loss. The largest of these fires, the +67,000-hectare Swan Lake fire, largely burned at stand-replacing severity in black spruce forests that had reforested since the 1947 Kenai fire but also burned climax stage spruce and birch forests and subalpine hemlock forests with no known fire history. Additionally, the fire burned above the tree line along the northern Kenai Mountains.
The coming decades are likely to bring further shifts in land cover associated with changing climate and amplification of natural disturbances. Alaskan ecosystems are highly vulnerable to climate change [61], because northern latitudes are warming at twice the rate of the global average [62]. Warming temperatures that increase spruce susceptibility to beetle attack, shorten beetle life cycle, and increase the number of individuals that mature in a given year can synchronize beetle attacks at landscape or regional scales [23,39,63], putting remaining or regenerating spruce forests at risk of sustained insect outbreaks. Above-average temperatures and prolonged drought are contributing factors to increased incidence of wildfires in the boreal forest [64], a pattern that may be amplified at local scales where widespread flushes of Calamagrostis grass and increased overall surface fuel loads following spruce beetle outbreaks have increased fuel flammability [65]. Recent disturbances and future projections mean that existing estimates of forest and non-forest cover, both in our study and others, are no longer representative of rapidly changing, on-the-ground conditions. This necessitates the continued systematic mapping of prominent vegetation for the purposes of inventory and monitoring, land and resource management, and an understanding of the resilience of boreal forest ecosystems to global change.

4.2. Assumptions and Limitations

Two primary components of our methods influence the accuracy of our model outputs. First, we assume that a change in the spectral parameters of pixels from one era to the next represents true change in vegetation type. High magnitude shifts in spectral conditions are most likely to represent changes in land cover, but subtle variation in spectral reflectance can occur for a location despite no actual land-cover change. This variation originates from the natural seasonal variation in vegetation (e.g., the extent of leaf out, foliar senescence, vegetation health, and physically wet vegetation), the physical variability of atmospheric conditions, and the configuration of the observing remote sensing platform. We have attempted to minimize the effects by limiting our data to cloud-free scenes and scenes that capture peak greenness (mid-summer) and maximal snow extent and depth (late winter/early-spring). For example, our methods depend on the use of winter clear-sky scenes to deduce forest from non-forest and infer forest canopy structure. Under ideal conditions, this offers great power in defining land-cover types given the significant differences in reflected spectra. In dense evergreen forests, snow-covered, closed-canopy trees could be interpreted due to increased reflectivity [66]. While we strived to use the best available scenes from the Landsat campaign, it is possible that snow-covered trees introduced error and inflated our reforestation or deforestation estimates. We attempt to reduce the detection of false transitions by restricting our summary to cells that had high probabilities (over 50%) of being correctly classified in each era, maximizing our confidence in the assigned land-cover type and identified land-cover transitions. However, the exclusion of less probable pixels may mask useful but more subtle patterns.
Second, the location and extent of training areas influences model performance when classifying land-cover types. This was detected around the maximal and minimal elevational limits of the alpine land-cover training areas. As a result, restricted distribution of training areas could artificially restrict the distribution of predicted land-cover types. The historical nature of our analysis also prohibited site visits to verify field conditions as the vegetation has likely changed over time. We attempted to minimize this effect by opportunistically establishing training areas throughout the study area to the best of our ability to confidently interpret land-cover types using high-resolution imagery. Furthermore, we rely on pre-existing datasets for ground-truthed reference data in the 2002 and 2017 eras. Any error associated with these data at the time of collection has been passed along into our classification accuracy. While overall agreement between the respective eras of classifications, known disturbance events, and land-cover patterns was good, an obvious inconsistency can be found with the distribution of alpine regions in the 2002 era. While the alpine and subalpine shrub in the Caribou Hills and north-western Kenai Mountains are generally consistent between 1973 and 2017, there are spatial differences in the 2002 era. This is due to alpine areas having been classified most broadly as “alpine” and more specifically as “alpine-shrub” in the Kenai Peninsula Land Cover dataset. When deriving our reference data for this era, we incorporated these areas as alpine assuming the broadest classification would be the most accurate. However, upon comparison, classifying these reference areas as shrub may have improved the era-to-era agreement of vegetation at these specific locations.

Author Contributions

Conceptualization, C.A.B., R.A.L., D.R.M., and R.L.S.; methodology, C.A.B., R.A.L., D.R.M., L.B.S., and R.L.S.; visualization, C.A.B. and R.A.L.; writing—original draft, C.A.B. and R.A.L.; writing—review and editing, C.A.B., R.A.L., D.R.M., L.B.S., and R.L.S. All authors have read and agreed to the published version of the manuscript.

Funding

Funding for this research was provided by the U.S. Geological Survey Land Change Science and Land Remote Sensing programs and the Joint Fire Science Program under Project JFSP 16-3-01-14. Any use of trade, product, or firm names is for descriptive purposes only and does not imply endorsement by the U.S. Government.

Acknowledgments

The authors acknowledge two anonymous reviewers for providing their critical review of this manuscript.

Conflicts of Interest

The authors declare no conflict of interest.

Supporting Data

Data produced and analyzed as part of this study are available here: Baughman, C.A., Loehman, R.A., Saperstein, L., 2020, Land cover estimates for the Kenai Peninsula lowlands; 1973, 2002, and 2017: U.S. Geological Survey data release, https://doi.org/10.5066/P92BGHW1.

References

  1. Spence, J.R. The new boreal forestry: Adjusting timber management to accommodate biodiversity. Trends Ecol. Evol. 2001, 14, 591–593. [Google Scholar] [CrossRef]
  2. Walker, X.J.; Baltzer, J.L.; Cumming, S.G.; Day, N.J.; Ebert, C.; Goetz, S.; Johnstone, J.F.; Potter, S.; Rogers, B.M.; Schuur, E.A.G.; et al. Increasing wildfires threaten historic carbon sink of boreal forest soils. Nature 2019, 572, 520–523. [Google Scholar] [CrossRef] [PubMed]
  3. Brandt, J.P.; Flannigan, M.D.; Maynard, D.G.; Thompson, I.D.; Volney, W.I.A. An introduction to Canada’s boreal zone: Ecosystem processes, health, sustainability, and environmental issues. Environ. Rev. 2013, 21, 207–226. [Google Scholar] [CrossRef]
  4. Bradshaw, C.J.A.; Warkentin, I.G. Global estimates of boreal forest carbon stocks and flux. Glob. Planet. Chang. 2015, 128, 24–30. [Google Scholar] [CrossRef]
  5. Gerardo, M.; Katila, P.; Galloway, G.; Alfaro, R.I.; Markku, K.; Lobovikov, M.; Varjo, J. Forests and Society—Responding to Global Drivers of Change; IUFRO World Series; IUFRO: Vienna, Austria, 2010; Volume 25, ISBN 978-3-901347-93-1. [Google Scholar]
  6. Gauthier, S.; Bernier, P.; Kuuluvainen, T.; Shividenko, A.Z.; Schepaschenko, D.G. Boreal forest health and global change. Science 2015, 349, 819–822. [Google Scholar] [CrossRef]
  7. Yarie, J.; Billings, S. Carbon balance of the taiga forest within Alaska: Present and future. Can. J. Res. 2002, 32, 757–767. [Google Scholar] [CrossRef] [Green Version]
  8. Hayes, D.J.; McGuire, A.D.; Kicklighter, D.W.; Gurney, K.R.; Burnside, T.J.; Melillo, J.M. Is the northern high-latitude land-based CO2 sink weakening? Glob. Biogeochem. Cycles 2011, 25, 3. [Google Scholar] [CrossRef] [Green Version]
  9. Sulla-Menashe, D.; Woodcock, C.E.; Friedl, M.A. Canadian boreal forest greening and browning trends: An analysis of biogeographic patterns and the relative roles of disturbance versus climate drivers. Environ. Res. Lett. 2018, 13, 014007. [Google Scholar] [CrossRef]
  10. Lloyd, A.H.; Fastie, C.L. Recent changes in treeline forest distribution and structure in interior Alaska. Écoscience 2003, 10, 176–185. [Google Scholar] [CrossRef]
  11. Petersen, B.; Stuart, D. Explanations of a changing landscape: A critical examination of the British Columbia bark beetle epidemic. Environ. Plan. Econ. Space 2013, 46, 598–613. [Google Scholar] [CrossRef]
  12. Peng, C.; Ma, Z.; Lei, X.; Zhu, Q.; Chen, H.; Wang, W.; Liu, S.; Li, W.; Fang, X.; Zhou, X. A drought-induced pervasive increase in tree mortality across Canada’s boreal forests. Nat. Clim. Chang. 2011, 1, 467–471. [Google Scholar] [CrossRef]
  13. Soja, A.J.; Tchebakova, N.M.; French, N.H.F.; Flannigan, M.D.; Shugart, H.H.; Stocks, B.J.; Sukhinin, A.I.; Parfenova, E.I.; Chapin, F.S., III; Stackhouse, P.W., Jr. Climate-induced boreal forest change: Predictions versus current observations. Glob. Planet. Chang. 2007, 56, 274–296. [Google Scholar] [CrossRef] [Green Version]
  14. Kelly, R.; Chipman, M.L.; Higuera, P.E.; Stefanova, I.; Brubaker, L.B.; Hu, F.S. Recent burning of boreal forests exceeds fire regime limits of the past 10,000 years. Proc. Natl. Acad. Sci. USA 2013, 110, 13055–13060. [Google Scholar] [CrossRef] [PubMed] [Green Version]
  15. McDowell, N.G.; Allen, C.D. Darcy’s law predicts widespread forest mortality under climate warming. Nat. Clim. Chang. 2015, 5, 669–672. [Google Scholar] [CrossRef]
  16. Schaphoff, S.; Reyer, C.P.O.; Schepaschenko, D.; Gerten, D.; Shvidenko, A. Tamm review: Observed and projected climate change impacts on Russia’s forests and its carbon balance. Ecol. Manag. 2016, 361, 432–444. [Google Scholar] [CrossRef] [Green Version]
  17. Young, A.M.; Higuera, P.E.; Duffy, P.A.; Hu, F.S. Climatic thresholds shape northern high-latitude fire regimes and imply vulnerability to future climate change. Ecography 2017, 40, 606–617. [Google Scholar] [CrossRef]
  18. Safranyik, L.; Carroll, A.L.; Regniere, J.; Langor, D.W.; Riel, W.G.; Shore, T.L.; Peter, B.; Cooke, B.J.; Nealis, V.G.; Taylor, S.W. Potential for range expansion of mountain pine beetle into the boreal forest of north America. Can. Entomol. 2010, 142, 415–442. [Google Scholar] [CrossRef]
  19. Anielski, M.; Wilson, S. Counting Canada’s Natural Capital: Assessing the Real Value of Canada’s Boreal Ecosystems; The Pembina Institute and the Canadian Boreal Initiative: Ottawa, ON, Canada, 2009. [Google Scholar]
  20. Berg, E.E.; Hillman, K.M.; Dial, R.; DeRuwe, A. Recent woody invasion of wetlands on the Kenai Peninsula Lowlands, south-central Alaska: A major regime shift after 18 000 years of wet Sphagnum–sedge peat recruitment. Can. J. Res. 2009, 39, 2033–2046. [Google Scholar] [CrossRef]
  21. Boucher, T.V.; Mead, B.R. Vegetation change and forest regeneration on the Kenai Peninsula, Alaska following a spruce beetle outbreak, 1987–2000. Ecol. Manag. 2006, 227, 233–246. [Google Scholar] [CrossRef]
  22. Klein, E.; Berg, E.E.; Dial, R. Wetland drying and succession across the Kenai Peninsula Lowlands, south-central Alaska. Can. J. Res. 2005, 35, 1931–1941. [Google Scholar] [CrossRef]
  23. Berg, E.E.; David Henry, J.; Fastie, C.L.; De Volder, A.D.; Matsuoka, S.M. Spruce beetle outbreaks on the Kenai Peninsula, Alaska, and Kluane National Park and reserve, Yukon territory: Relationship to summer temperatures and regional differences in disturbance regimes. Ecol. Manag. 2006, 227, 219–232. [Google Scholar] [CrossRef]
  24. Berg, E.E.; Anderson, R.S. Fire history of white and Lutz spruce forests on the Kenai Peninsula, Alaska, over the last two millennia as determined from soil charcoal. Ecol. Manag. 2006, 227, 275–283. [Google Scholar] [CrossRef]
  25. Jain, T.; Barrett, T.M. The western Kenai Peninsula: An opportunity to study fire and its effects on soils and trees. In Forests of Southeast and South-Central Alaska, 2004–2008: Five-Year Forest Inventory and Analysis Report; U.S. Department of Agriculture, Forest Service, Pacific Northwest Research Station: Portland, OR, USA, 2011; pp. 70–74. [Google Scholar]
  26. Jones, B.M.; Baughman, C.A.; Romanovsky, V.E.; Parsekian, A.D.; Jones, M.C.; Grosse, G.; Berg, E.E. The presence and degradation of residual permafrost plateaus on the western Kenai Peninsula Lowlands, southcentral Alaska. Cryosphere 2016, 10, 2673–2692. [Google Scholar] [CrossRef] [Green Version]
  27. Lowell, E.C.; Willits, S.A. Lumber recovery from beetle-killed spruce trees, Kenai Peninsula, Alaska. West. J. Appl. 1998, 13, 54–59. [Google Scholar] [CrossRef] [Green Version]
  28. Johnstone, J.F.; Chapin, F.S., III; Hollingsworth, T.N.; Mack, M.C.; Romanovsky, V.E.; Turetsky, M.R. Fire, climate change, and forest resilience in interior Alaska. Can. J. Res. 2010, 40, 1302–1312. [Google Scholar] [CrossRef]
  29. USDA. Chugach National Forest Land Management Plan. R10-MB. 828c; United States Department of Agriculture, Forest Service, Chugach National Forest: Anchorage, AL, USA, 2019.
  30. Oliver, S.G. Kenai Peninsula Tourism Industry Expected To Grow In 2017. Available online: https://www.kbbi.org (accessed on 6 June 2018).
  31. King, R.B. Land cover mapping principles: A return to interpretation fundamentals. Int. J. Remote Sens. 2010, 3525–3545. [Google Scholar] [CrossRef]
  32. Wallace, C.S.A.; Webb, R.H.; Thomas, K.A. Estimation of perennial vegetation cover distribution in the mojave desert using MODIS-EVI data. Giscience Remote Sens. 2008, 45, 167–187. [Google Scholar] [CrossRef]
  33. Jones, M.C.; Peteet, D.M.; Kurdyla, D.; Guilderson, T. Climate and vegetation history from a 14,000-year peatland record, Kenai Peninsula, Alaska. Quat. Res. 2009, 72, 207–217. [Google Scholar] [CrossRef]
  34. Allen, L.H. One Hundred Centuries of Native Life on the Kenai Peninsula; Kenai Peninsula Historical Association: Soldotna, AK, USA, 2002. [Google Scholar]
  35. Bangs, E.; Spraker, T.; Bailey, T.; Berns, V. Effects of Increased Human Populations on Wildlife Resources of the Kenai Peninsula, Alaska; US Fish & Wildlife Publications: Lincoln, NE, USA, 1982.
  36. Goodman, L.F.; Hungate, B.A. Managing forests infested by spruce beetles in south-central Alaska: Effects on nitrogen availability, understory biomass, and spruce regeneration. Ecol. Manag. 2006, 227, 267–274. [Google Scholar] [CrossRef]
  37. Anderson, R.S.; Hallett, D.J.; Berg, E.; Jass, R.B.; Toney, J.L.; de Fontaine, C.S.; DeVolder, A. Holocene development of Boreal forests and fire regimes on the Kenai Lowlands of Alaska. Holocene 2006, 16, 791–803. [Google Scholar] [CrossRef]
  38. Hrobak, J.; Schmunk, G. The Alaska Large Fire Database [Data set]. 2019. Available online: https://www.frames.gov/catalog/10465 (accessed on 6 June 2018).
  39. Werner, R.A.; Holsten, E.H.; Matsuoka, S.M.; Burnside, R.E. Spruce beetles and forest ecosystems in south-central Alaska: A review of 30 years of research. Ecol. Manag. 2006, 227, 195–206. [Google Scholar] [CrossRef]
  40. Yang, L.; Jin, S.; Danielson, P.; Homer, C.; Gass, L.; Bender, S.M.; Case, A.; Costello, C.; Dewitz, J.; Fry, J.; et al. A new generation of the United States National land cover database: Requirements, research priorities, design, and implementation strategies. ISPRS J. Photogramm. Remote Sens. 2018, 146, 108–123. [Google Scholar] [CrossRef]
  41. ArcMap; Environmental Systems Research Institute (ESRI): Redlands, CA, USA, 2019.
  42. Huete, A.; Didan, K.; Miura, T.; Rodriguez, E.P.; Gao, X.; Ferreira, L.G. Overview of the radiometric and biophysical performance of the MODIS vegetation indices. Remote Sens. Environ. 2002, 83, 195–213. [Google Scholar] [CrossRef]
  43. Wulder, M.A.; Franklin, S.E. Remote Sensing of Forest Environments: Concepts and Case Studies; Kluwer Academic Publishers: Boston, MA, USA, 2003. [Google Scholar]
  44. Tucker, C.J. Red and photographic infrared linear combinations for monitoring vegetation. Remote Sens. Environ. 1979, 8, 127–150. [Google Scholar] [CrossRef] [Green Version]
  45. Alaska 2 Arc-second Digital Elevation Models (DEMs)—USGS National Map 3DEP Downloadable Data Collection [Data Set]. 2017. Available online: https://catalog.data.gov/dataset/national-elevation-dataset-ned-alaska-2-arc-second-downloadable-data-collection-national-geosp (accessed on 6 June 2018).
  46. Kenai Peninsula Vegetation Map. Available online: https://usfs.maps.arcgis.com/apps/MapSeries/index.html?appid=4e21c25d5eac421babaef3222004cccf (accessed on 6 June 2018).
  47. Breiman, L. Random Forests. Mach. Leaning 2001, 45, 5–32. [Google Scholar] [CrossRef] [Green Version]
  48. Baughman, C.A.; Loehman, R.A.; Saperstein, L. Land cover estimates for the Kenai Peninsula lowlands; 1973, 2002, and 2017. US Geol. Surv. Data Release 2020. [Google Scholar] [CrossRef]
  49. Jones, B.M. Land-cover change on the southern Kenai Peninsula lowlands, Alaska using USGS land cover trends methodology. J. Geogr. Reg. Plan. 2008, 1, 68–71. [Google Scholar]
  50. Dial, R.; Berg, E.; Timm, K.; McMahon, A.; Geck, J. Changes in the alpine forest-tundra ecotone commensurate with recent warming in southcentral Alaska: Evidence from orthophotos and field plots. J. Geophys. Res. 2007, 112, G4. [Google Scholar] [CrossRef]
  51. Flint, C.G. Community perspectives on spruce beetle impacts on the Kenai Peninsula, Alaska. Ecol. Manag. 2006, 227, 207–218. [Google Scholar] [CrossRef]
  52. Reynolds, K.M.; Hard, J.S. Risk and hazard of spruce beetle attack in unmanaged stands on the Kenai Peninsula, Alaska, under epidemic conditions. Ecol. Manag. 1991, 43, 137–151. [Google Scholar] [CrossRef]
  53. De Volder, A. Fire and Climate History of Lowland Black Spruce Forests, Kenai National Wildlife Refuge, Alaska. Master’s Thesis, Northern Arizona University, Flagstaff, AZ, USA, 1999. [Google Scholar]
  54. DeLong, H.B.; Lieffers, V.J.; Blenis, P.V. Microsite effects on first-year establishment and overwinter survival of white spruce in aspen-dominated boreal mixedwoods. Can. J. Res. 1997, 27, 1452–1457. [Google Scholar] [CrossRef]
  55. Zasada, J.C.; Norum, R.A.; Veldhuizen, R.M.; Teutsch, C. Artifical regeneration of trees and tall shrubs in experimentally burned upland black spruce/feather moss stands in Alaska. Can. J. Res. 1983, 13, 903–913. [Google Scholar] [CrossRef]
  56. von Ow, F.; Joyce, P.; Keane, M. Factors affecting the establishment of natural regeneration of Sitka spruce (Picea sitchensis (Bong.) Carr.) in Ireland. Ir. For. 1996, 53, 2–18. [Google Scholar]
  57. Viereck, L.A. Wildfire in the taiga of Alaska. J. Quat. Res. 1973, 3, 465–495. [Google Scholar] [CrossRef]
  58. Carter, T.C.; Chapin, F.S., III. Differential effects of competition or microenvironment on boreal tree seedling establishment after fire. Ecology 2000, 84, 1086–1099. [Google Scholar] [CrossRef]
  59. Fastie, C.L.; Lloyd, A.H.; Doak, P. Fire history and post-fire forest development in an upland watershed of interior Alaska. J. Geophys. Res. 2002, 108, 8150. [Google Scholar] [CrossRef] [Green Version]
  60. Boggs, K.; Sturdy, M.; Rinella, D.J.; Rinella, M.J. White spruce regeneration following a major spruce beetle outbreak in forests on the Kenai Peninsula, Alaska. Ecol. Manag. 2008, 255, 3571–3579. [Google Scholar] [CrossRef]
  61. Kasischke, E.S.; Verbyla, D.L.; Rupp, T.S.; McGuire, A.D.; Murphy, K.A.; Jandt, R.; Barnes, J.L.; Hoy, E.E.; Duffy, P.A.; Calef, M.; et al. Alaska’s changing fire regime—Implications for the vulnerability of its boreal forests. Can. J. Res. 2010, 40, 1313–1324. [Google Scholar] [CrossRef]
  62. Serreze, M.C.; Barry, R.G. Processes and impacts of Arctic amplification: A research synthesis. Glob. Planet. Chang. 2011, 77, 85–96. [Google Scholar] [CrossRef]
  63. Sherriff, R.L.; Berg, E.E.; Miller, A.E. Climate variability and spruce beetle (Dendroctonus rufipennis) outbreaks in south-central and southwest Alaska. Ecology 2011, 92, 1459–1470. [Google Scholar] [CrossRef]
  64. Fauria, M.M.; Johnson, E.A. Climate and wildfires in the North American boreal forest. Philos. Trans. R. Soc. B 2008, 363, 2317–2329. [Google Scholar] [CrossRef]
  65. Hess, K.A.; Cullen, C.; Cobian-Iniguez, J.; Ramthun, J.S.; Lenske, V.; Magness, D.R.; Bolten, J.D.; Foster, A.C.; Spruce, J. Satellite-based assessment of grassland conversion and related fire disturbance in the Kenai Peninsula, Alaska. Remote Sens. 2019, 11, 283. [Google Scholar] [CrossRef] [PubMed] [Green Version]
  66. Kuusinen, N.; Kolari, P.; Levula, J.; Porcar-Castell, A.; Stenberg, P.; Berninger, F. Seasonal variation in boreal pine forest albedo and effects of canopy snow on forest reflectance. Agric. Meteorol. 2012, 164, 53–60. [Google Scholar] [CrossRef]
Figure 1. Location of Kenai Peninsula and study area (black) and extent of the Kenai National Wildlife Refuge (grey).
Land 09 00382 g001
Figure 2. Estimated area of land-cover type by era.
Land 09 00382 g002
Figure 3. Conservative estimate (>50% probability) of extent of forest and non-forest. Upper error bars capture area with >25% probability. Lower bars capture area with >75% probability.
Land 09 00382 g003
Figure 4. Patterns of deforestation and reforestation across the Kenai Peninsula Lowlands between 1973 and 2017. Color shades represent the proportion of decision tree votes (out of 500) in agreement with the depicted transition.
Land 09 00382 g004
Figure 5. Spatial distribution of primary land-cover types on the Kenai Peninsula over time.
Land 09 00382 g005
Figure 6. Spatial distribution of wildfire occurrence and spruce bark beetle-caused tree mortality for two time frames determined by available data: (A) 1940–2002 and (B) 2003–2019.
Land 09 00382 g006
Figure 7. Examples of land-cover transitions between 1973 (A,B,C) and 2017 (A’,B’,C’). Areas common to each scene and representing detected change are shaded in white. Forests lost to a pre-1973 fire (A) regenerate to closed canopy forest by 2017 (A’). Mature forest stands in 1973 (B) are lost to fire in 1996 and have not regrown by 2017 (B’). Wetland meadow (C) is infilled by woody vegetation possibly due to drying or warming (C’).
Land 09 00382 g007
Table 1. Landsat scenes used in this study.
Scene IdentifierLandsatSensorTierDateBand/IndexSeason
LM10740171973229AAA051MSST28/17/1973TVISummer
LM10740181973229AAA051MSST28/17/1973TVISummer
LM10750171974063FAK041MSST23/4/1974B7Winter
LM10750181974063FAK041MSST23/4/1974B7Winter
LM10760171975041AAA021MSST22/10/1975B7Winter
LM10760181975041AAA021MSST22/10/1975B7Winter
LM10740181975093FAK081MSST24/3/1975B7Winter
LE70690172002211EDC007ETM+T17/30/2002EVI *Summer
LE70690182002211EDC007ETM+T17/30/2002EVI *Summer
LE70690172002051EDC007ETM+T12/20/2002B1Winter
LE70690182002051EDC007ETM+T12/20/2002B1Winter
LC80690172017084LGN008OLIT18/29/2016EVI *Summer
LC80690182017084LGN008OLIT18/29/2016EVI *Summer
LC80690172017084LGN008OLIT13/25/2017B2Winter
LC80690182017084LGN008OLIT13/25/2017B2Winter
* Scene Identifier submitted to https://espa.cr.usgs.gov/ for derivation of Enhanced Vegetation Index (EVI). MSS: Multispectral Scanner System, ETM+: Enhanced Thematic Mapper Plus, OLI: Operational Land Imager. B1: Band 1, B2: Band 2, B7: Band 7, EVI: Enhanced Vegetation Index, TVI: Transformed Vegetation Index.
Table 2. Decision structure for interpreting vegetation types from Landsat scenes.
Spectral CharacteristicsInterpretationClass ID
Intermediate EVI/TVI values in summer, low reflectance in blue or IR bands during winterClosed canopy forest with significant conifer component concealing snow in winterNeedleleaf
High EVI/TVI values in summer, low reflectance in blue or IR bands during winterClosed canopy forest with significant hardwood component partially concealing snow in winterBroadleaf
Intermediate EVI/TVI values in summer, low reflectance in blue or IR bands during winterClosed canopy forest with mixed species partially concealing snow in winterMixed
Intermediate EVI/TVI values in summer, intermediate reflectance in blue or IR bands during winterSparser leafy vegetation standing above snow in winterShrub
Intermediate EVI/TVI values in summer, high reflectance in blue or IR bands during winterShort mixed vegetation becoming completely snow-covered in winterHerbaceous
Intermediate EVI/TVI values in summer, high reflectance in blue or IR bands during winterShort hydrophytic vegetation becoming completely snow-covered in winterWetland
Intermediate EVI/TVI values in summer, high reflectance in blue or IR bands during winterShort and/or sparse vegetation becoming completely snow-covered in winterAlpine
Low EVI/TVI values in summer, maximum reflectance in blue or IR bands during winterNon- to minimally vegetated surfaces becoming completely snow-covered in winterBarren
Negative EVI/TVI values in summer, maximum reflectance in blue or IR bands during winterStanding water with no visible vegetation becoming completely snow-covered in winterWater
Table 3. Confusion matrices summarizing out of bag error estimation rates for forest and non-forest land-cover types.
1973Referenced ForestReferenced Non-forestTotalUACommission
Classified Forest113565120094.6%5.4%
Classified Non-forest682332240097.2%2.8%
Total120323973600
PA94.3%97.3%
Omission5.7%2.7%
2002Referenced ForestReferenced Non-forestTotalUACommission
Classified Forest1028172120085.7%14.3%
Classified Non-forest1632237240093.2%6.8%
Total119124093600
PA86.3%92.9%
Omission13.7%7.1%
2017Referenced ForestReferenced Non-forestTotalUACommission
Classified Forest117129120097.6%2.4%
Classified Non-forest262374240098.9%1.1%
Total119724033600
PA97.8%98.8%
Omission2.2%1.2%
Table 4. Confusion matrices summarizing out of bag error estimation rates for each land-cover type. Bold lines denote forest and non-forest land-cover types.
1973 Reference Conditions
OOB Est. of Error:14.5%
ClassificationsNeedleMixedBroadShrubHerbWet.AlpineBarrenWaterTotalUACommission
Needleleaf324511203100040081.0%19.0%
Mixed4431422135200040078.5%21.5%
Broadleaf233344318000040086.0%14.0%
Shrub1392327263200040081.8%18.3%
Herbaceous5620323082630040077.0%23.0%
Wetland550122135330140088.3%11.8%
Alpine100145033743040084.3%15.8%
Barren00000021378140094.5%5.5%
Water1011110239340098.3%1.8%
Total3954183904223873863844233953600
PA34.5%15.1%42.9%18.5%14.4%30.4%83.6%15.5%8.9%
Omission18.0%24.9%11.8%22.5%20.4%8.5%12.2%10.6%0.5%
2002 Reference Conditions
OOB Est. of Error:30.67%
ClassificationsNeedleMixedBroadShrubHerbWet.AlpineBarrenWaterTotalUACommission
Needleleaf211782326421431240052.8%47.3%
Mixed812236889600540055.8%44.3%
Broadleaf28662501233600540062.5%37.5%
Shrub1773124937122819040062.3%37.8%
Herbaceous36919332208120040055.0%45.0%
Wetland18413657284301540071.0%29.0%
Alpine000231031264040078.0%22.0%
Barren00090017374040093.5%6.5%
Water52200180037340093.5%6.8%
Total3963894063663994213654584003600
PA53.3%57.3%61.6%68.0%55.1%67.5%85.5%81.7%93.3%
Omission46.7%42.7%38.4%32.0%44.9%32.5%14.5%18.3%6.8%
2017 Reference Conditions
OOB Est. of Error:10.06%
ClassificationsNeedleMixedBroadShrubHerbWet.AlpineBarrenWaterTotalUACommission
Needleleaf35431724020040088.2%11.5%
Mixed223293856000040082.3%17.8%
Broadleaf123134773000040086.8%13.3%
Shrub637345205131040086.3%13.8%
Herbaceous51073384252040084.5%15.5%
Wetland12121837600040094.0%6.0%
Alpine00070036726040091.8%8.3%
Barren00004112383040095.8%4.3%
Water0000000139940099.8%0.3%
Total4003974003753934243994133993600
PA34.5%15.1%42.9%18.5%14.4%30.4%83.6%15.5%8.9%
Omission11.5%17.1%13.3%8.0%14.0%11.3%8.0%7.3%0.0%
UA = user’s accuracy, PA = producer’s accuracy, OOB: Out of Bag.
Table 5. Estimated area for each land-cover type based on model classification with 50% or greater probability.
197320022017
% of Classified Areakm2% of Classified Areakm2% of Classified Areakm2
Alpine10.2%6607.2%4049.0%598
Barren3.9%2515.9%3303.4%224
Broadleaf6.3%4079.9%5589.6%634
Herbaceous20.8%13406.3%35617.9%1185
Mixed16.5%106420.4%114813.7%907
Needleleaf15.9%102422.2%125024.7%1642
Wetland5.7%3677.8%4403.9%256
Shrub12.6%8129.9%5589.9%657
Water8.2%53210.5%5958.0%533
Total100%6457100%5638100%6637
Table 6. Area and percent of prominent land-cover change patterns estimated for each period.
Deforestation
1973–20022002–20171973–2017
Forest
to
Graminoid
Forest
to
Shrub
Forest
to
Water
Forest
to
Graminoid
Forest
to
Shrub
Forest
to
Barren
Forest
to
Graminoid
Forest
to
Shrub
Forest
to
Barren
182 km2
81% a
28 km2
17% a
2 km2
2% a
319 km2
85% a
55 km2
15% a
<1 km2
0.07% a
396 km2
87% a
58 km2
13% a
1 km2
0.3% a
Reforestation
1973–20022002–20171973–2017
Graminoid
to
Forest
Shrub
to
Forest
Water
to
Forest
Shrub
to
Forest
Graminoid
to
Forest
Alpine
to
Forest
Graminoid
to
Forest
Shrub
to
Forest
Alpine
to
Forest
373 km2
54% b
321 km2
46% b
0.8 km2
0.1% b
27 km2
50% b
26 km2
49% b
2.4 km2
0.5% b
463 km2
52% b
416 km2
47% b
2.6 km2
0.29% b
Afforestation
1973–20022002–20171973–2017
------------------Wetland
to
Forest
Wetland
to
Shrub
Shrub
to
Forest
------------------0.6 km2
0.2% b
2.6 km2
1.5% c
0.9 km2
0.3% b
a Percent of total deforestation area for this period; b Percent of total reforested area for this period; c Percent of 1973–2002 wetland area.

