Article

Sugarcane Land Quality Evaluation and Limiting Factors Diagnosis in Typical Acidified Regions of Southern China Based on Minimum Data Set


1
Key Laboratory of Arable Land Conservation (North China), Ministry of Agriculture and Rural Affairs, College of Land Science and Technology, China Agricultural University, Beijing 100193, China
2
Soil and Fertilizer Station of Guangxi Zhuang Autonomous Region, Nanning 530007, China
*
Author to whom correspondence should be addressed.
Land 2026, 15(9), 1743; https://doi.org/10.3390/land15091743 (registering DOI)
Submission received: 23 August 2026 / Revised: 13 September 2026 / Accepted: 15 September 2026 / Published: 18 September 2026

Abstract

Effective evaluation of cultivated land quality (CLQ) and limiting factors diagnosis is essential for sustainable land use and soil improvement. Studies on CLQ evaluation and limiting factors diagnosis have mainly focused on staple crops. However, related studies for sugarcane land at local scales remain relatively scarce. This study selected Xingbin District in Guangxi Zhuang Autonomous Region, a typical sugarcane-producing area, as a case study. A minimum data set (MDS) was constructed using principal component analysis to evaluate CLQ and an integrated approach combining membership functions, and bivariate Moran’s I was applied to identify limiting factors. Eight indicators, including soil pH, soil organic matter (SOM), available phosphorus, cultivated layer thickness (CLTH), cultivated layer texture, depth of obstacle horizon (DOH), topographic position, and biodiversity, were selected from the total data set (TDS) to construct the MDS. The CLQ derived from the MDS was strongly correlated with that from the TDS, indicating that the MDS can substitute for the TDS. CLQ in Xingbin District was classified into three grades, with moderate-quality land accounting for 84.7% of the whole study area. Soil pH, SOM, CLTH, and DOH were the main limiting factors for low-quality land, whereas pH and SOM dominated in moderate- and high-quality land. Bivariate Moran’s I revealed significant positive spatial autocorrelation between CLQ and CLTH, pH, and SOM. High–high clusters were mainly in the northeast, while low–low clusters were concentrated in the southwest. These findings provide scientific guidance for targeted soil management and sustainable sugarcane production.

1. Introduction

Sugarcane plays a pivotal role in China’s sugar supply balance, sugar market stability, and addressing sugar security issues, making it an important cash crop [1,2]. Cultivated soil provides the fundamental basis for sugarcane growth; its quality directly affects both yield and product quality [3,4,5]. Cultivated land quality (CLQ), determined by soil fertility, soil health, and field infrastructure, underpins sustainable agricultural production and the safety of agricultural products [6]. Accordingly, CLQ assessment is essential for monitoring soil degradation and supporting sustainable land use [3].
Existing studies have mainly focused on CLQ evaluation for staple crops, such as wheat [7], rice [6], maize [8], and soybean [9], while research on CLQ evaluation for sugarcane fields remain relatively scarce. Moreover, no consensus has been reached regarding standardized indicator systems and methodologies for sugarcane CLQ assessment. Previous studies have applied various approaches, including artificial neural networks (ANN) [10], grey relational analysis (GRA) [11], and the integrated quality index (IQI) method [12] to assess CLQ. Although ANN can enhance automation and reduce subjectivity, difficulties in obtaining representative training samples may introduce systematic bias in CLQ assessment [10]. GRA requires relatively small sample sizes and is easy to implement; however, it may lead to information loss when handling discretely distributed variables, thereby reducing evaluation accuracy [11]. In contrast, the IQI approach is widely used in CLQ evaluation due to its computational simplicity, adaptable application, and strong versatility [13].
Indicator selection is fundamental to CLQ evaluation. Common indicators include soil physical properties (e.g., bulk density, BD), chemical properties (e.g., soil pH, nutrient availability) [14], and biological indicators (e.g., biodiversity, BIO; microbial biomass carbon and nitrogen) [15]. However, incorporating all indicators into CLQ assessment can result in complex calculations, high data acquisition costs, and redundancy among variables [16]. To address these issues, principal component analysis (PCA) has been widely used to establish a minimum data set (MDS) for CLQ evaluation. This approach simplifies the indicator system while enabling objective weighting [17,18]. Overall, the combined PCA–IQI framework effectively integrates indicator values, weights, and interactions, allowing for reliable evaluation of sugarcane CLQ.
Identifying key limiting factors is essential for improving CLQ and guiding targeted soil management. Previous studies for identifying limiting factors of CLQ have predominantly relied on statistical and machine learning methods such as random forest (RF) models [7,19], membership function [20], and obstacle degree model [21,22]. While these approaches are effective for quantifying the global importance of influencing factors, they generally overlook spatial autocorrelation and the coupling relationships between limiting factors and CLQ. However, cultivated land systems are inherently spatially structured and the effects of limiting factors are often spatially heterogeneous rather than uniformly distributed [6,23]. Ignoring these spatial relationships may, therefore, lead to biased or incomplete interpretations of the mechanisms driving CLQ variation. Moreover, existing studies mainly focused on staple crops, such as rice wheat, and maize [23], with major limiting factors, including soil pH, soil organic matter (SOM), available nitrogen, available phosphorus (AP), available potassium (AK), total nitrogen (TN) [8], clay content, cultivated layer thickness (CLTH), guaranteed rate of irrigation water (GRIW) [6], and water-holding capacity [24,25]. For sugarcane, evidence is largely derived from field experiments, highlighting constraints such as soil acidification and nutrient deficiencies [26,27]. However, regional-scale analyses of limiting factors for sugarcane CLQ remain scarce.
Sugarcane cultivation is mainly concentrated in southern China, where favorable hydrothermal conditions prevail [2]. However, long-term acid deposition, intensive cultivation, and excessive nitrogen application have led to widespread soil acidification [28,29]. Sugarcane grows optimally under slightly acidic to neutral pH conditions [30]; thus, pronounced soil heterogeneity across the region limits productivity. In addition, soil compaction, shallow CLTH, and imbalanced nutrient ratios further constrain sustainable high yields [26]. Xingbin District accounts for approximately 10–12% of the total sugarcane planting area and sugar production in Guangxi Zhuang Autonomous Region, ranking first among county-level units [31]. These combined constraints reduce economic returns and threaten the sustainability of sugarcane production systems [27].
To address those limitations, this study proposes an integrated analytical framework combining membership functions, RF, and bivariate Moran’s I. This framework not only assesses limiting factors based on their indicator conditions and relative importance but also captures their spatial associations with CLQ. By jointly considering factors that show suboptimal conditions, relatively high importance, and significant spatial associations, it provides a more robust basis for diagnosing spatially explicit constraints on CLQ. Therefore, this study selected Xingbin District, a representative sugarcane-producing region, as the study area. The objectives were to: (1) establish a MDS for sugarcane CLQ assessment using PCA and evaluate the feasibility of substituting the MDS for the total data set (TDS); (2) identify the main limiting factors affecting sugarcane CLQ; and (3) analyze the spatial distribution of CLQ and the main limiting factors. This study will provide scientific guidance for soil improvement and sustainable management in the sugarcane-producing region.

2. Materials and Methods

2.1. Study Area

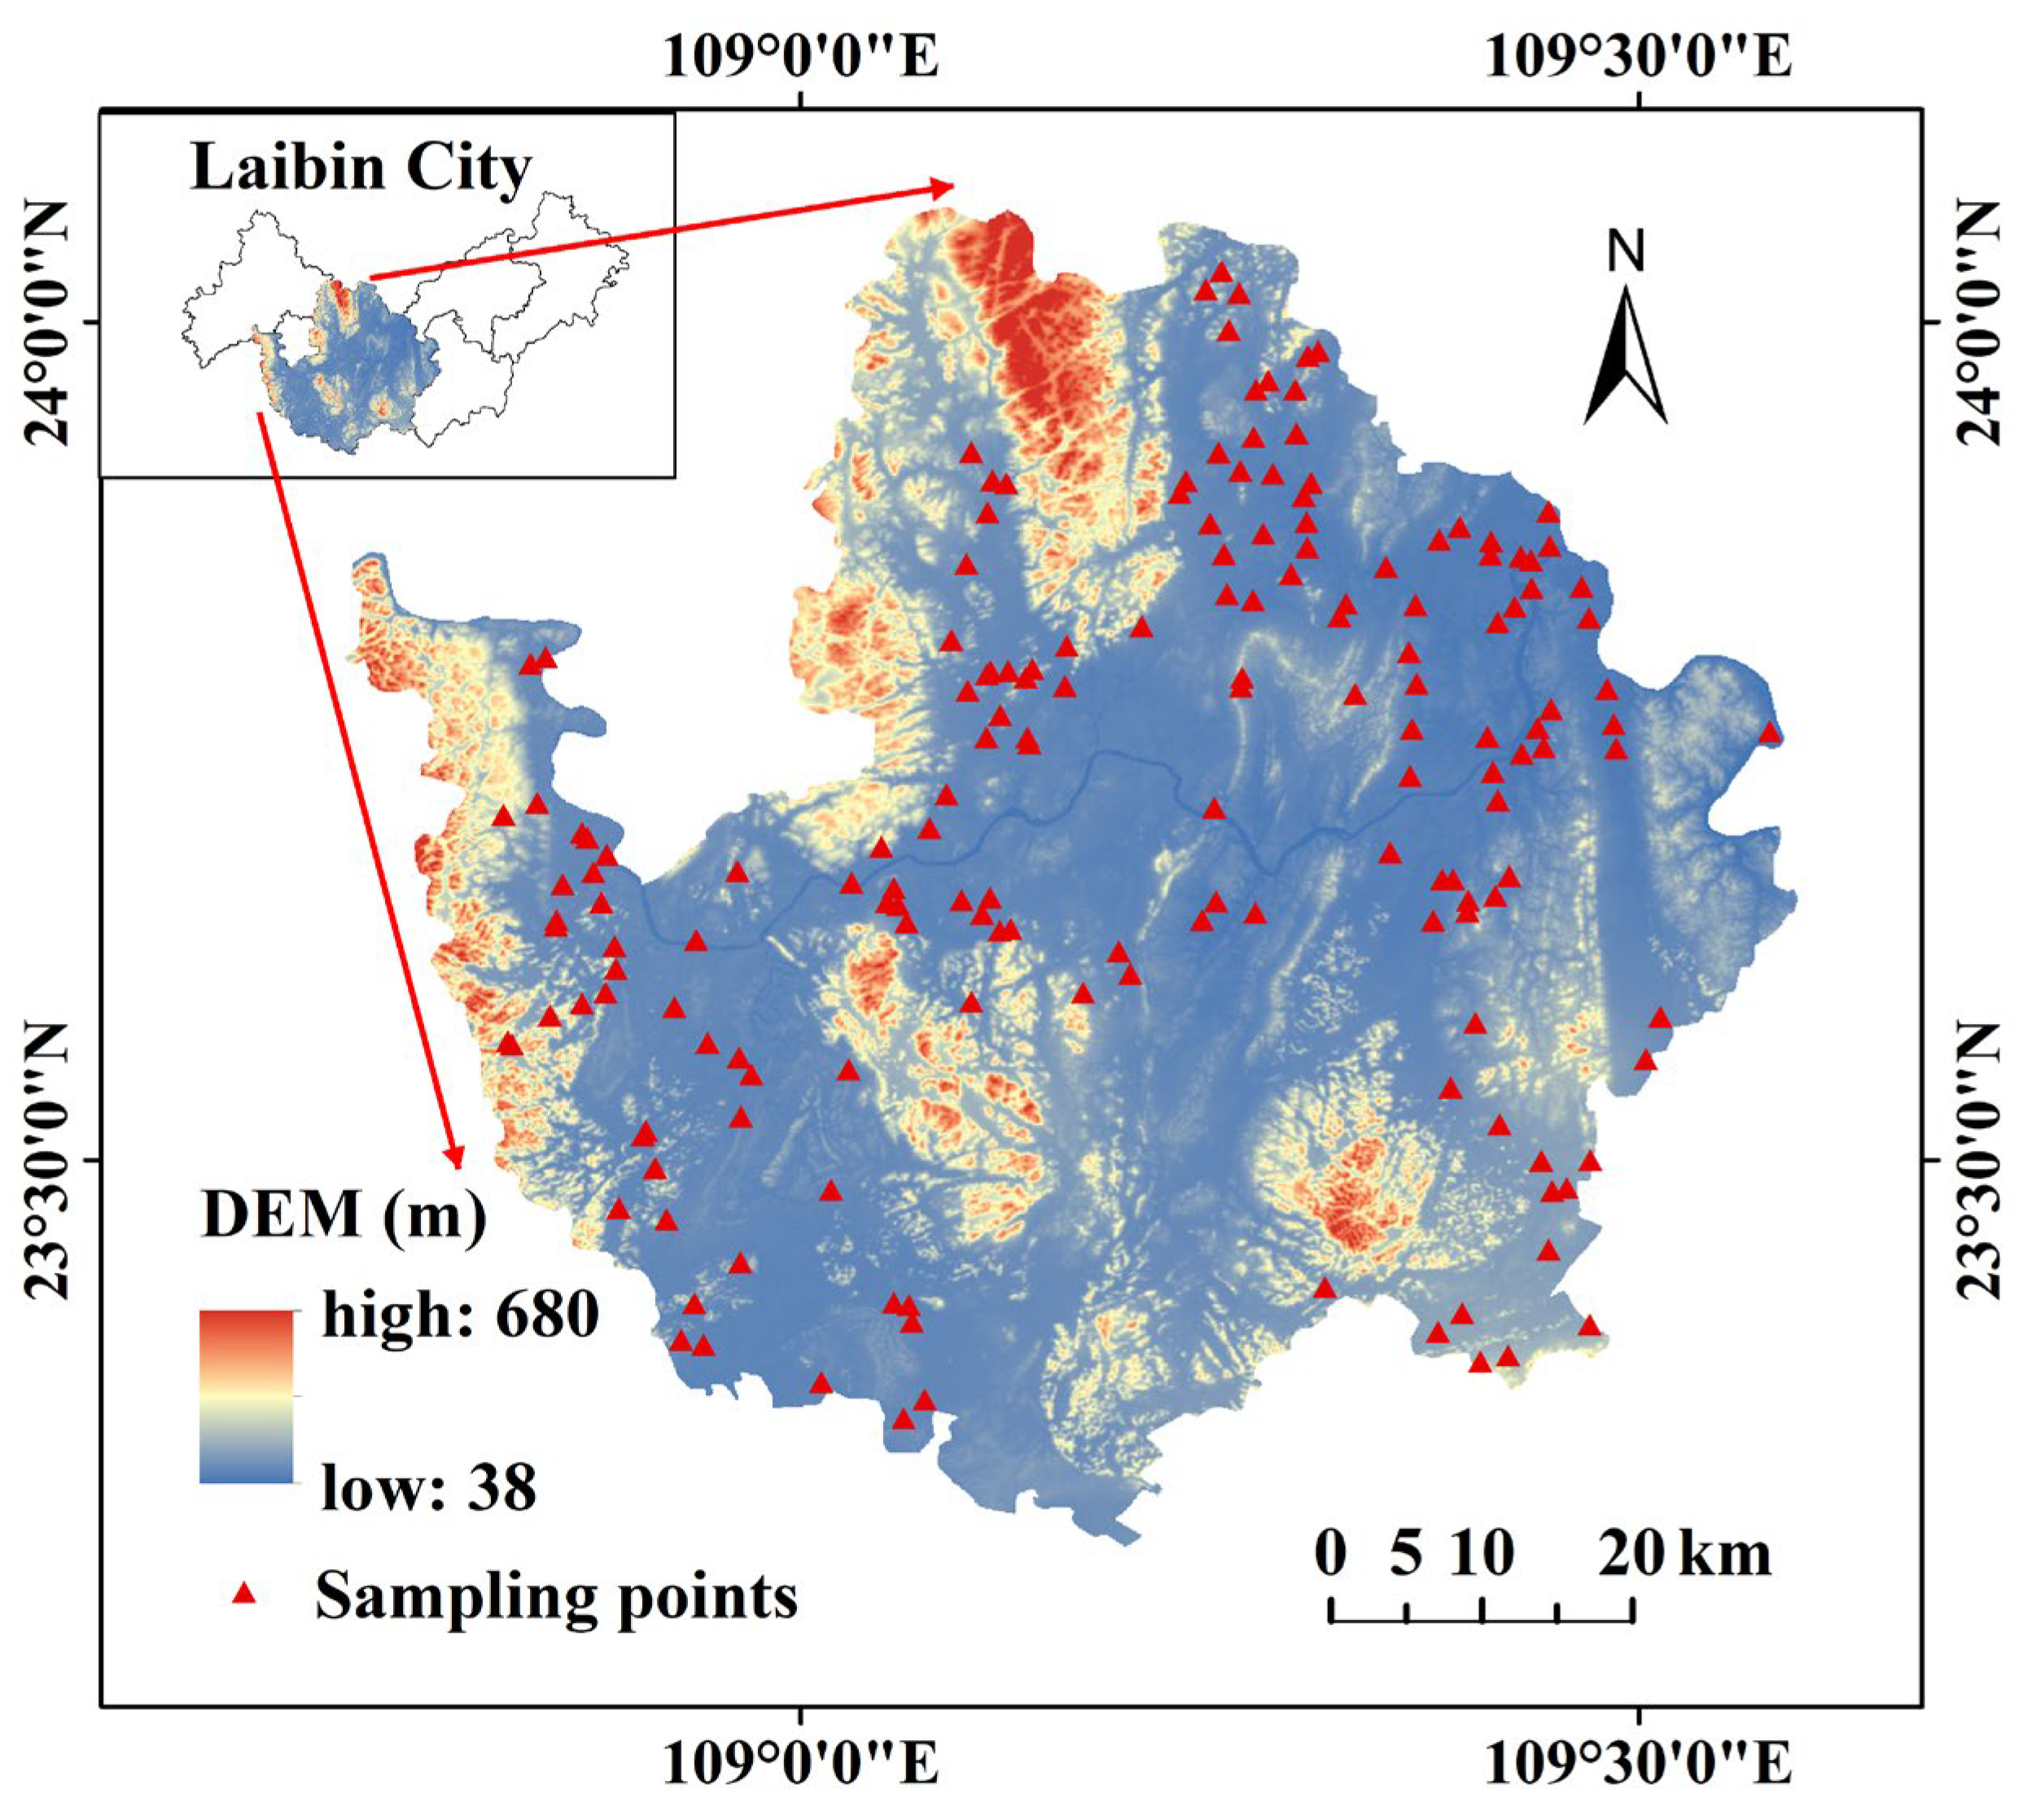
Xingbin District (108°44′–109°36′ E, 23°16′–24°04′ N), located in Laibin City, Guangxi Zhuang Autonomous Region, lies in the lower reaches of the Hongshui River, with elevations ranging from 38 to 680 m (Figure 1). The district covers a total area of 4364 km2, of which 1514 km2 is cultivated land. Xingbin District has a subtropical monsoon climate, with a mean annual temperature of 20.9 °C, annual precipitation of 1328 mm, and annual sunshine duration of 1567 h. The climate is characterized by synchronized heat and rainfall, distinct wet and dry seasons, and a long frost-free period. The terrain is predominantly hilly and mountainous. Red soils dominate the region and approximately 89% of the area is affected by soil acidification. The cultivated layer is mainly loamy in texture. This region is representative of typical sugarcane-growing areas in southern China.

2.2. Soil Data Collection and Analysis

Considering the distribution and extent of contiguous sugarcane fields, soil types, and field management practices, a total of 168 sampling points are established in Xingbin District (Laibin City, Guangxi) based on previous field surveys (Figure 1). The primary data set was obtained from the Soil and Fertilizer Workstation of Guangxi Zhuang Autonomous Region, and covered six aspects: site conditions, soil profile attributes, soil physical properties, soil nutrients, farmland management, and ecological security: (i) Site conditions are represented by topographic position (TPO); (ii) Profile attributes include effective soil thickness (EST), cultivated layer thickness (CLTH), cultivated layer texture (CLT), texture configuration (TC), depth of obstacle horizon (DOH) and obstacle factors (OF); (iii) Soil physicochemical properties comprise bulk density (BD) and pH; (iv) Soil nutrients are SOM, TN, AP, and AK; (v) Farmland management is characterized by the guaranteed rate of irrigation water (GRIW) and drainage conditions (DC); and (vi) Ecological security consists of forest network density (FND) and biodiversity (BIO).
Soil sampling was conducted in cultivated lands and a total of 336 (168 × 2) disturbed and undisturbed soil samples (0–20 cm depth) were collected in 2020. Each disturbed soil sample was obtained by compositing at least five subsamples collected randomly at each sampling point after removing plant roots. All soil samples were air-dried, passed through a 2 mm sieve, and, finally, analyzed in the laboratory. Undisturbed soil samples were used for bulk density. Effective soil thickness, CLTH, CLT, and DOH were measured using a steel tap. Bulk density was measured using the cutting ring method. Soil pH was determined by a pH meter (PHS-3D, San–Xin Instruments, Shanghai, China) with a soil-to-water suspension ratio of 1:2.5 (m/v). SOM and TN were analyzed using the potassium dichromate and Kjeldahl digestion method, respectively. Available phosphorus was measured using molybdenum–antimony anti-colorimetry (UV1800PC, JingHua Instruments, Shanghai, China). Available potassium was detected by ammonium acetate extraction and subsequent flame photometer analysis (FP640, INESA Analytical Instrument, Shanghai, China). Topographic position, TC, OF, GRIW, DC, FND, and BIO were determined by trained professionals. BIO was assessed following the National Standard (GB/T 33469-2016) through field investigation combined with expert judgment. Based on the observed biodiversity conditions at each sampling site, BIO was classified into three categories: rich, moderate, and poor [32].
Based on the above measurements, obstacle factors were identified in accordance with the Chinese National Standard [32], which defines soil conditions that restrict plant growth, including desertification, salinization, erosion, gleization, and the presence of restrictive soil layers [33]. The restrictive soil layers identified in the sugarcane fields of Xingbin District are classified into six types: albic horizon, sandy interlayer, clay pan, calcic horizon, gleyic horizon, and gravel layer. Among these, gravel layers account for 20.83% of the observations, while calcic horizons account for 5.65%. Notably, 67.86% of the sampling points exhibit no restrictive layers.

2.3. Methodology

2.3.1. Indicator Selection

According to the Chinese National Standard [32], 17 soil properties (TPO, EST, CLT, CLTH, TC, DOH, OF, BD, pH, SOM, TN, AP, AK, GRIW, DC, FND, and BIO) sensitive to changes in CLQ were selected to form the evaluation indicator system, which is called the total data set (TDS).

2.3.2. Establishment of the Minimum Data Set

Categorical variables in the TDS were first converted into numerical scores before being included alongside the continuous variables in the PCA for MDS selection (Table S1). The procedure is as follows. First, principal components (PCs) with eigenvalues ≥ 1 are selected. The loadings of each indicator on the selected PCs are calculated, and each indicator is assigned to the PC on which it has highest absolute loading. Second, for each PC, indicators with loadings ≥ 90% of the highest absolute loading within that PC are retained as candidate indicators. Third, a comprehensive loading (Norm) value is calculated for each candidate indicator to represent its capacity to explain integrated information. Pairwise correlations among these retained indicators are then examined. If the absolute correlation coefficient between two indicators is greater than 0.3, only the indicator with the higher Norm value is included in the MDS, otherwise, both indicators are retained for the MDS [12].
The Norm value is calculated as follows:
N i k = i = 1 k u i k 2 λ k
where Nik is the Norm value of the i-th indicator across the first k PCs with eigenvalues ≥ 1, uik is the loading of the i-th indicator on the k-th PC, and λk is the eigenvalue of the k-th PC.

2.3.3. Indicator Scoring

Qualitative indicators were assigned values ranging from 0 to 1 according to the Chinese National Standard [32] (Table S1). For quantitative indicators, membership functions were used for normalization to values between 0 and 1. S-shaped functions, including increasing and decreasing types, are commonly applied. However, decreasing functions were not used in this study because none of the selected indicators showed negative effects on CLQ. The type of membership function (increasing or parabolic) was determined based on the relationship between each indicator and CLQ (i.e., positive or optimum range effects). Threshold values were defined according to the China National Soil Survey in the 1980s [34]. The selected function types and corresponding threshold values are presented in Table S2. The MDS was subsequently used for CLQ evaluation to improve efficiency while maintaining representativeness.
The S-shaped membership function is defined as:
f x = 0.1 x x 1 0.9 x x 1 / x 2 x 1 + 0.1 x 1 < x < x 2   1 x x 2
where x1 and x2 are the threshold values corresponding to the lowest and highest grades of the indicator in the soil grading system, respectively.
The parabolic membership function is defined as:
f x =   1.0 0.9 x x 3 / x 4 x 3 x 3 < x < x 4 1.0 x 2 x x 3 0.9 x x 1 / x 2 x 1 + 0.1 x 1 < x < x 2 0.1 x x 1   or   x x 4
where x1 and x4 are the lower and upper bounds corresponding to the lowest grade of the indicator, respectively, and x2 and x3 define the range corresponding to the highest grade.

2.3.4. Weight Assignment and Cultivated Land Quality Index

Indicator weights in both the TDS and MDS were derived from PCA based on communality values. Specifically, the weight of each indicator was calculated as the ratio of its communality to the sum of communalities of all indicators. This data-driven weighting scheme was used to reduce subjectivity in weight assignment and ensure a consistent and reproducible weighting procedure. It should be noted that the resulting weights represent the relative statistical contribution of the indicators to the CLQ index rather than their intrinsic agronomic importance to sugarcane production. Agronomic knowledge was incorporated in the selection, parameterization, and interpretation of the indicators based on relevant standards and previous studies.
The cultivated land quality index (CQI) was calculated as:
CQI = i = 1 n q i × w i
where qi is the score of the i-th indicator, wi is the corresponding weight, and n is the number of evaluation indicators.

2.3.5. Identification of Limiting Factors

An RF model was used to quantify the relative importance of MDS variables in explaining variation in sugarcane CLQ. Because these variables were also used to construct the composite CLQ index, RF importance was interpreted as the relative contribution of individual CLQ components rather than as independent evidence of external drivers or causal effects. To standardize indicators with different units and scales, membership functions were applied to normalize all variables and to provide a basis for identifying major limiting factors across different CLQ grades [20]. The normalized MDS scores were then visualized using a radar chart, where higher values indicate more favorable soil conditions. Following Si et al. [35], indicators with scores below 0.6 were considered to reflect suboptimal soil conditions that may constrain crop performance. Accordingly, this threshold was adopted as a diagnostic criterion for identifying potential limiting factors in CLQ evaluation. A sensitivity analysis was conducted by applying alternative membership-score thresholds of 0.5, 0.6, and 0.7 to assess the robustness of limiting-factor identification (Table S3). We found that the threshold of 0.6, selected in this study, can be used to identify the limiting factors in the study area.

2.3.6. Spatial Autocorrelation Analysis

To further investigate the spatial associations between the limiting factors and CLQ, this study applies the bivariate Moran’s I to examine the spatial correlation between one variable and the spatial lag of another. This method helps to identify clusters with similar spatial distribution patterns and to determine whether high or low values of a limiting factor are spatially associated with high or low CLQ values in neighboring spatial units. The global and local Moran’s I expressions were used to measure the spatial correlation, respectively.
First, the study area was divided into 5 km × 5 km spatial units, resulting in 227 grid cells within the study area. a Rook contiguity-based spatial-weight matrix was constructed in those spatial units for the Moran’s I analysis, in which spatial units sharing a common edge were defined as spatial neighbors. The spatial-weight matrix contained 227 spatial units, with the number of neighbors ranging from 1 to 16, with an average of 6.21 and a median of 5. Because a Rook contiguity-based weight matrix was used, no distance threshold was involved. Second, the original data of the limiting factors and CQI were interpolated separately according to the same grid. Finally, the bivariate spatial autocorrelation analysis was conducted in each spatial unit. Statistical significance was assessed using 999 random permutations. The pseudo-p-values obtained from the bivariate Moran’s I tests were further adjusted using the Benjamini–Hochberg false discovery rate (FDR) procedure to account for multiple comparisons. All spatial associations remained statistically significant after FDR correction (adjusted p = 0.001).
The global Moran’s I formula is as follows:
I x y = i j w i j z x i z y j i j w i j
I i x y = z x i × j w i j z y j
where Ixy represents the global bivariate Moran’s I statistic with a value range of [−1, 1]. If it is greater than 0, limiting factors and CQI show a positive spatial correlation, which indicates a high degree of aggregation. The larger the absolute value is, the more significant the spatial correlation. If the index is close to 0, it indicates a random distribution of limiting factors and CQI. The significance test of spatial autocorrelation is based on the study by Li et al. [36], where |Z| > 1.96, and p < 0.05 indicate significant correlation; i and j denote the number of the i-th and j-th grids; x and y represent limiting factors and CQI, respectively; wij is the spatial weight matrix; and zxi and zyi are the variances of the study variables x and y, respectively.
Iixy refers to the local bivariate Moran’s I for grid i. A positive value indicates a positive spatial association, meaning that high or low values of the limiting factor tend to be spatially associated with high or low CLQ values in neighboring grid i, respectively. Conversely, a negative value indicates a negative spatial association, meaning that high values of the limiting factor tend to be spatially associated with low CLQ values in neighboring grid i, and vice versa. Statistical significance was determined based on the corresponding permutation test rather than the magnitude of Moran’s I alone. After FDR correction, the statistically significant local spatial associations were identified using an adjusted p-value threshold of 0.05. The local Moran’s I is divided into four types: “High–High”, “High–Low”, “Low–High”, and “Low–Low”.
DOH was not treated as a true continuous variable because its values integrate two distinct dimensions—presence/absence (nominal) and depth (continuous)—and its relationship with CQI exhibits nonlinear threshold effects. Therefore, it is not suitable for bivariate spatial correlation analysis. Similarly, TPO, as a categorical variable, cannot be directly used in bivariate spatial correlation analysis. Instead, statistical analyses of CQI across DOH and TPO categories were conducted to indirectly evaluate and support their limiting effects on CLQ.

2.4. Data Analysis

Statistical analysis and PCA were conducted using SPSS 27.0. Pearson correlation analysis (two-tailed) was applied to examine relationships among the indicators. Variable importance was measured as the percentage increase in mean squared error (%IncMSE). The significance of variable importance was evaluated using permutation-based tests implemented in the rfPermute package in R 4.5.3, with p-values used to determine statistical significance. GeoDa 1.22.0 software was used to construct the distance spatial weight matrix to test the spatial autocorrelation of the limiting factors and the CQI in sugarcane land. Spatial distribution maps and interpolation analysis were performed using ArcGIS 10.8. Other figures were produced using Origin 2021.

3. Results

3.1. Statistical Features of Soil Properties

The BD of cultivated soil ranged from 1.04 to 1.44 g cm−3, with a mean value of 1.22 g cm−3 (Table 1). The soil pH had an average value of 5.24, indicating acidic conditions in the study area. The cultivated soils exhibited moderate levels of SOM, TN and AP, with mean values of 20.77 g kg−1, 1.03 g kg−1, and 51.8 mg kg−1, respectively. Effective soil thickness, CLTH, and DOH were relatively low, with mean values of 12.5 cm, 4.34 cm, and 17.6 cm, respectively. Except for BD, AP showed the highest coefficient of variation (CV > 100%), while the other indicators exhibited moderate variability (CV 10–100%).

3.2. Sugarcane Land Quality Evaluation in Xingbin District

3.2.1. Minimum Data Set

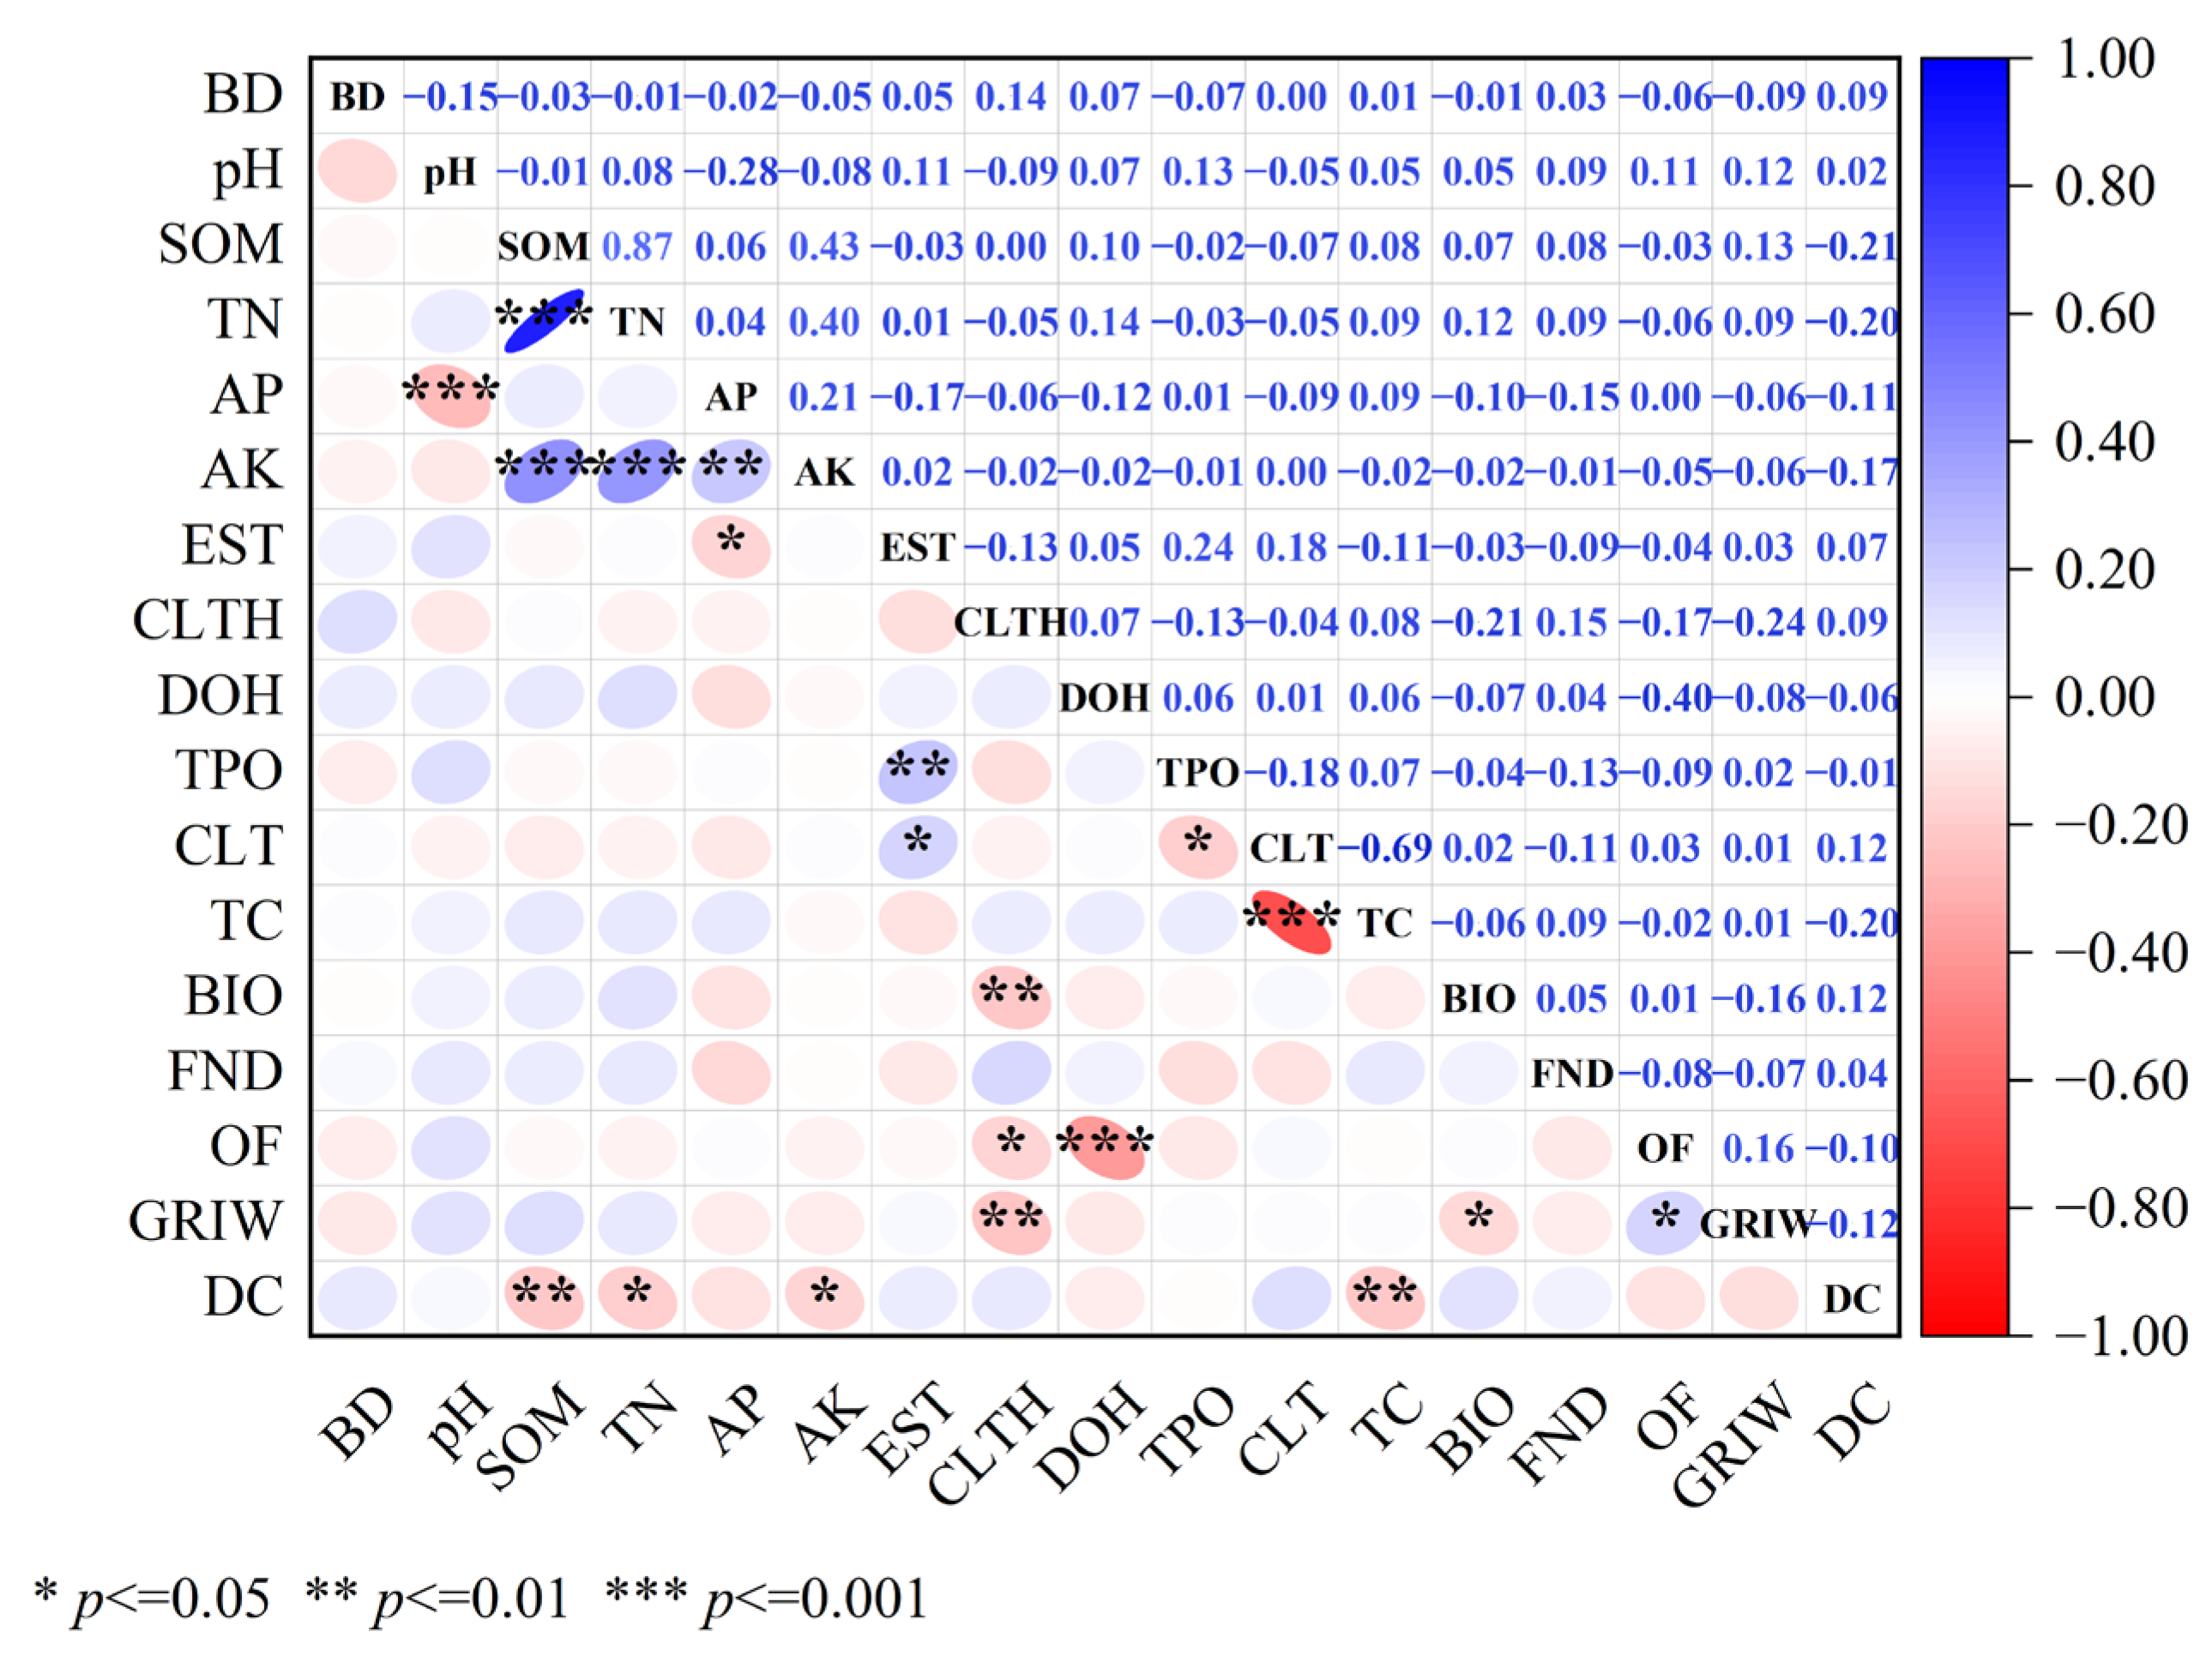
The Kaiser–Meyer–Olkin (KMO) value for PCA was 0.533 (p < 0.05), indicating relatively modest sampling adequacy, while Bartlett’s test of sphericity was significant (p < 0.001), indicating that the correlation matrix was not an identity matrix and supporting the suitability of the data set for PCA. Principal component analysis of the TDS identified seven principal components (PCs) with eigenvalues > 1, collectively explaining 68.22% of the total variance (Table 2). Correlation analysis of soil indicators in Xingbin District is shown in Figure 2. According to the selection criteria described in Section 2.3.2, representative indicators were selected from each PC. Specifically, the absolute correlation coefficient between SOM and TN or AK was greater than 0.3; therefore, SOM was chosen from PC1. Depth of obstacle horizon in PC2 was identified as one of the indicators for the MDS. Cultivated layer texture was chosen as a representative for the PC3. In PC4, soil pH entered in the MDS, while AP, recognized as a crucial indicator of soil quality, was also selected. In PC5, TPO was selected to the MDS. In PC6, CLTH was included in the MDS and BIO was selected from PC7. Therefore, the MDS consists of eight indicators, including pH, SOM, AP, CLTH, DOH, TPO, CLT, and BIO.
Weights for both TDS and MDS indicators were determined using PCA, based on the communalities of each variable (Table 3). The weights of TDS indicators ranged from 0.034 to 0.083, with obstacle factors showing the highest weight and BD the lowest. For the MDS, weights ranged from 0.095 to 0.153; SOM had the highest weight, whereas CLT had the lowest.

3.2.2. Validation of the Feasibility of Substituting the TDS with the MDS

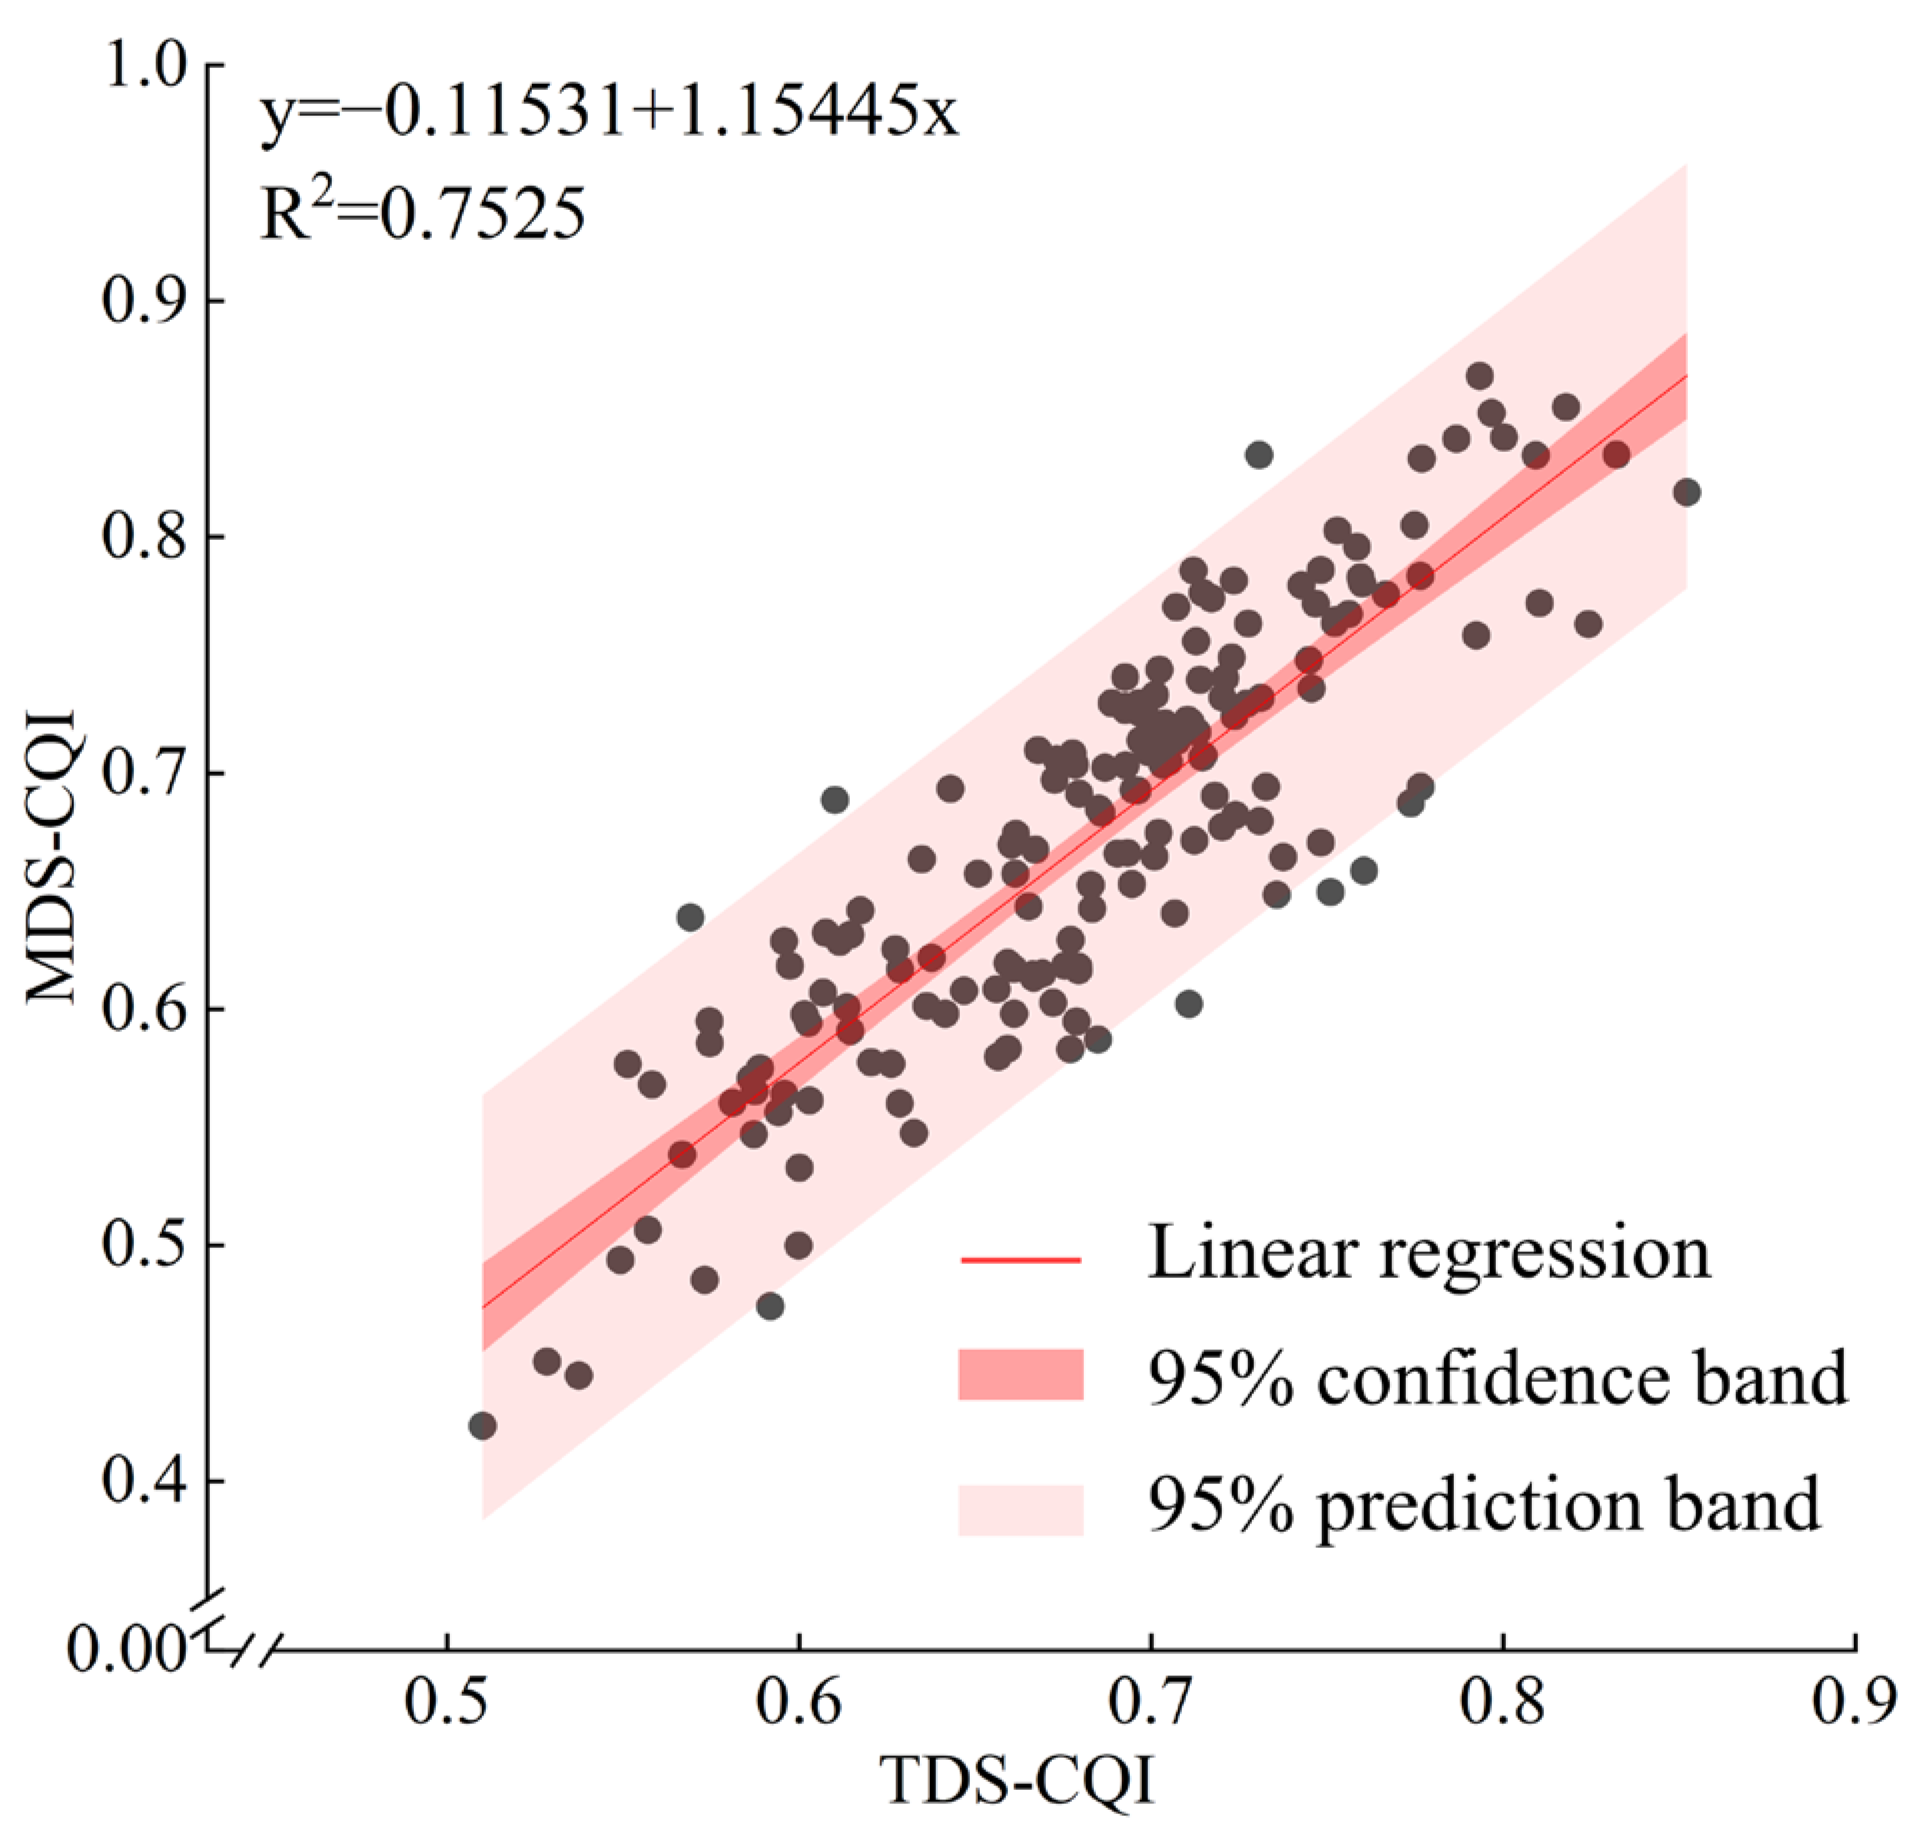
The standardized indicator scores and their corresponding weights were substituted into Equation (4) to calculate the CQI for each sampling site. The CQI values for the 168 sugarcane fields ranged from 0.42 to 0.87 based on the MDS (Table 4). Compared with the CQI derived from the TDS, the MDS produced similar mean values and standard deviations, although a higher CV was observed for the MDS-based CQI. A comparison of CQI values derived from the TDS and MDS showed good internal agreement (r = 0.863, p < 0.01, R2 = 0.753, RMSE = 0.044, and MAE = 0.037) (Figure 3). These results suggest that the CLQ assessment based on the MDS adequately reflects the quality of sugarcane-cultivated land, supporting the use of the MDS as a substitute for the TDS in CLQ evaluation in Xingbin District.

3.3. Diagnosis of Limiting Factors

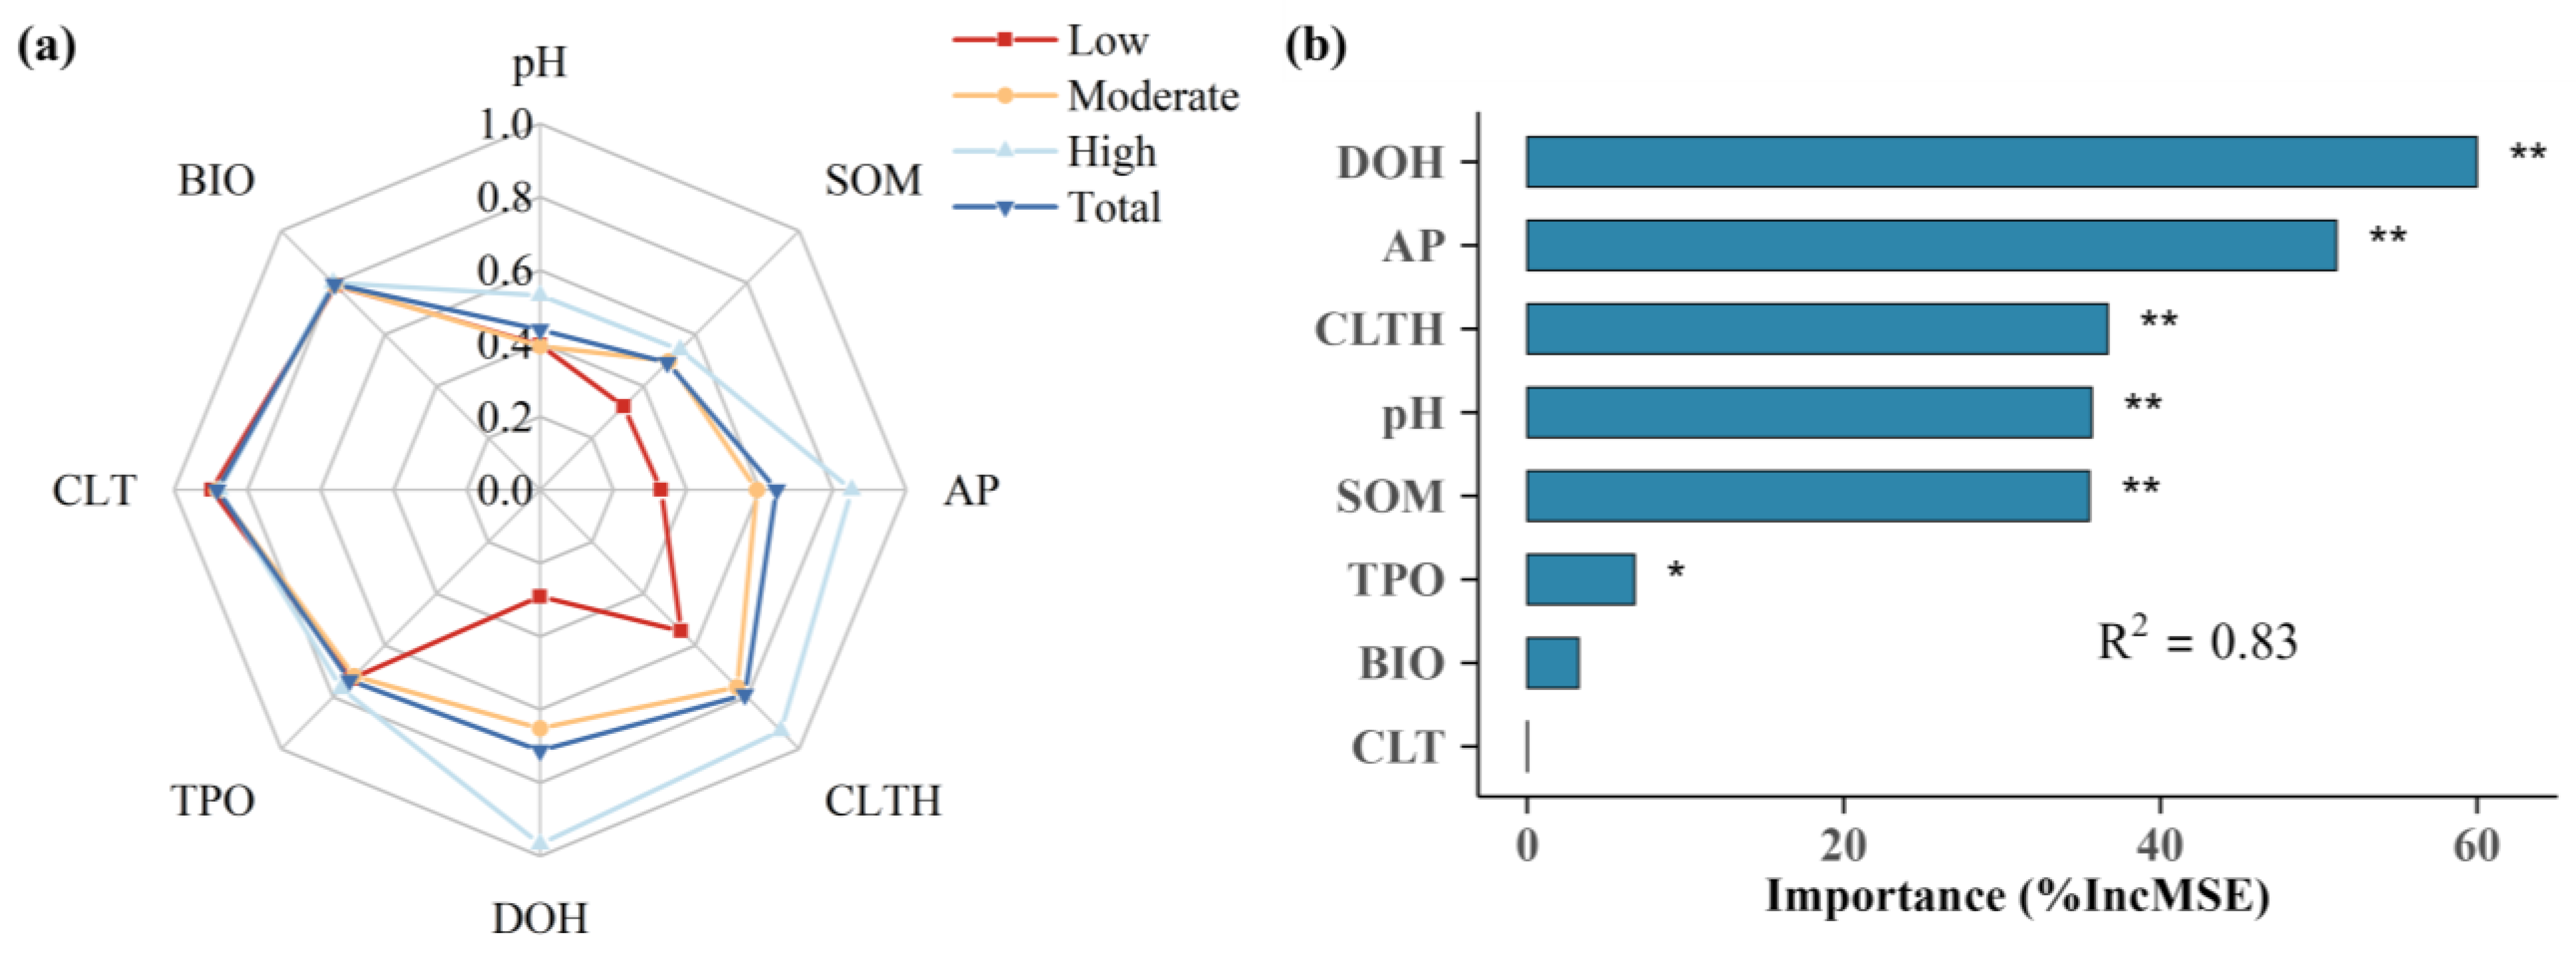
The radar chart illustrates the distribution patterns of MDS across different CLQ levels (Figure 4a). Based on the overall CLQ assessment, the primary limiting factors for sugarcane land were identified as pH (0.44) and SOM (0.49) for Xingbin District. To guide targeted management, limiting factors were further evaluated for different land quality classes. The equal-interval classification method was applied to categorize CLQ into three grades: high [0.72–0.87], moderate [0.57–0.72), and low [0.42–0.57), with the high grade indicating better soil quality. In low-quality land, the main constraints, in descending order of severity, were DOH (0.29), SOM (0.32), AP (0.33), pH (0.40), and CLTH (0.55). In moderate-quality land, the dominant limiting factors were pH (0.39), SOM (0.50), and AP (0.59). In high-quality land, pH (0.53) and SOM (0.54) remained the primary constraints. The sensitivity analysis showed that the identified limiting factors varied to some extent with the membership-score threshold, whereas the major constraints identified in low-quality land remained relatively stable (Table S3).
A RF model was used to quantify the relative importance of MDS variables for CLQ in sugarcane lands. The RF results were used to provide additional evidence supporting the identification of limiting factors based on the radar charts. The results indicate that six key factors contribute significantly to the model, as supported by permutation-based importance tests (Figure 4b). Among these, DOH showed the highest importance (%IncMSE = 60.0%), followed by AP (51.12%). CLTH, pH, and SOM exhibited moderate contributions, with %IncMSE values of 36.68%, 35.66%, and 35.51%, respectively, whereas TPO had the lowest importance (6.79%).
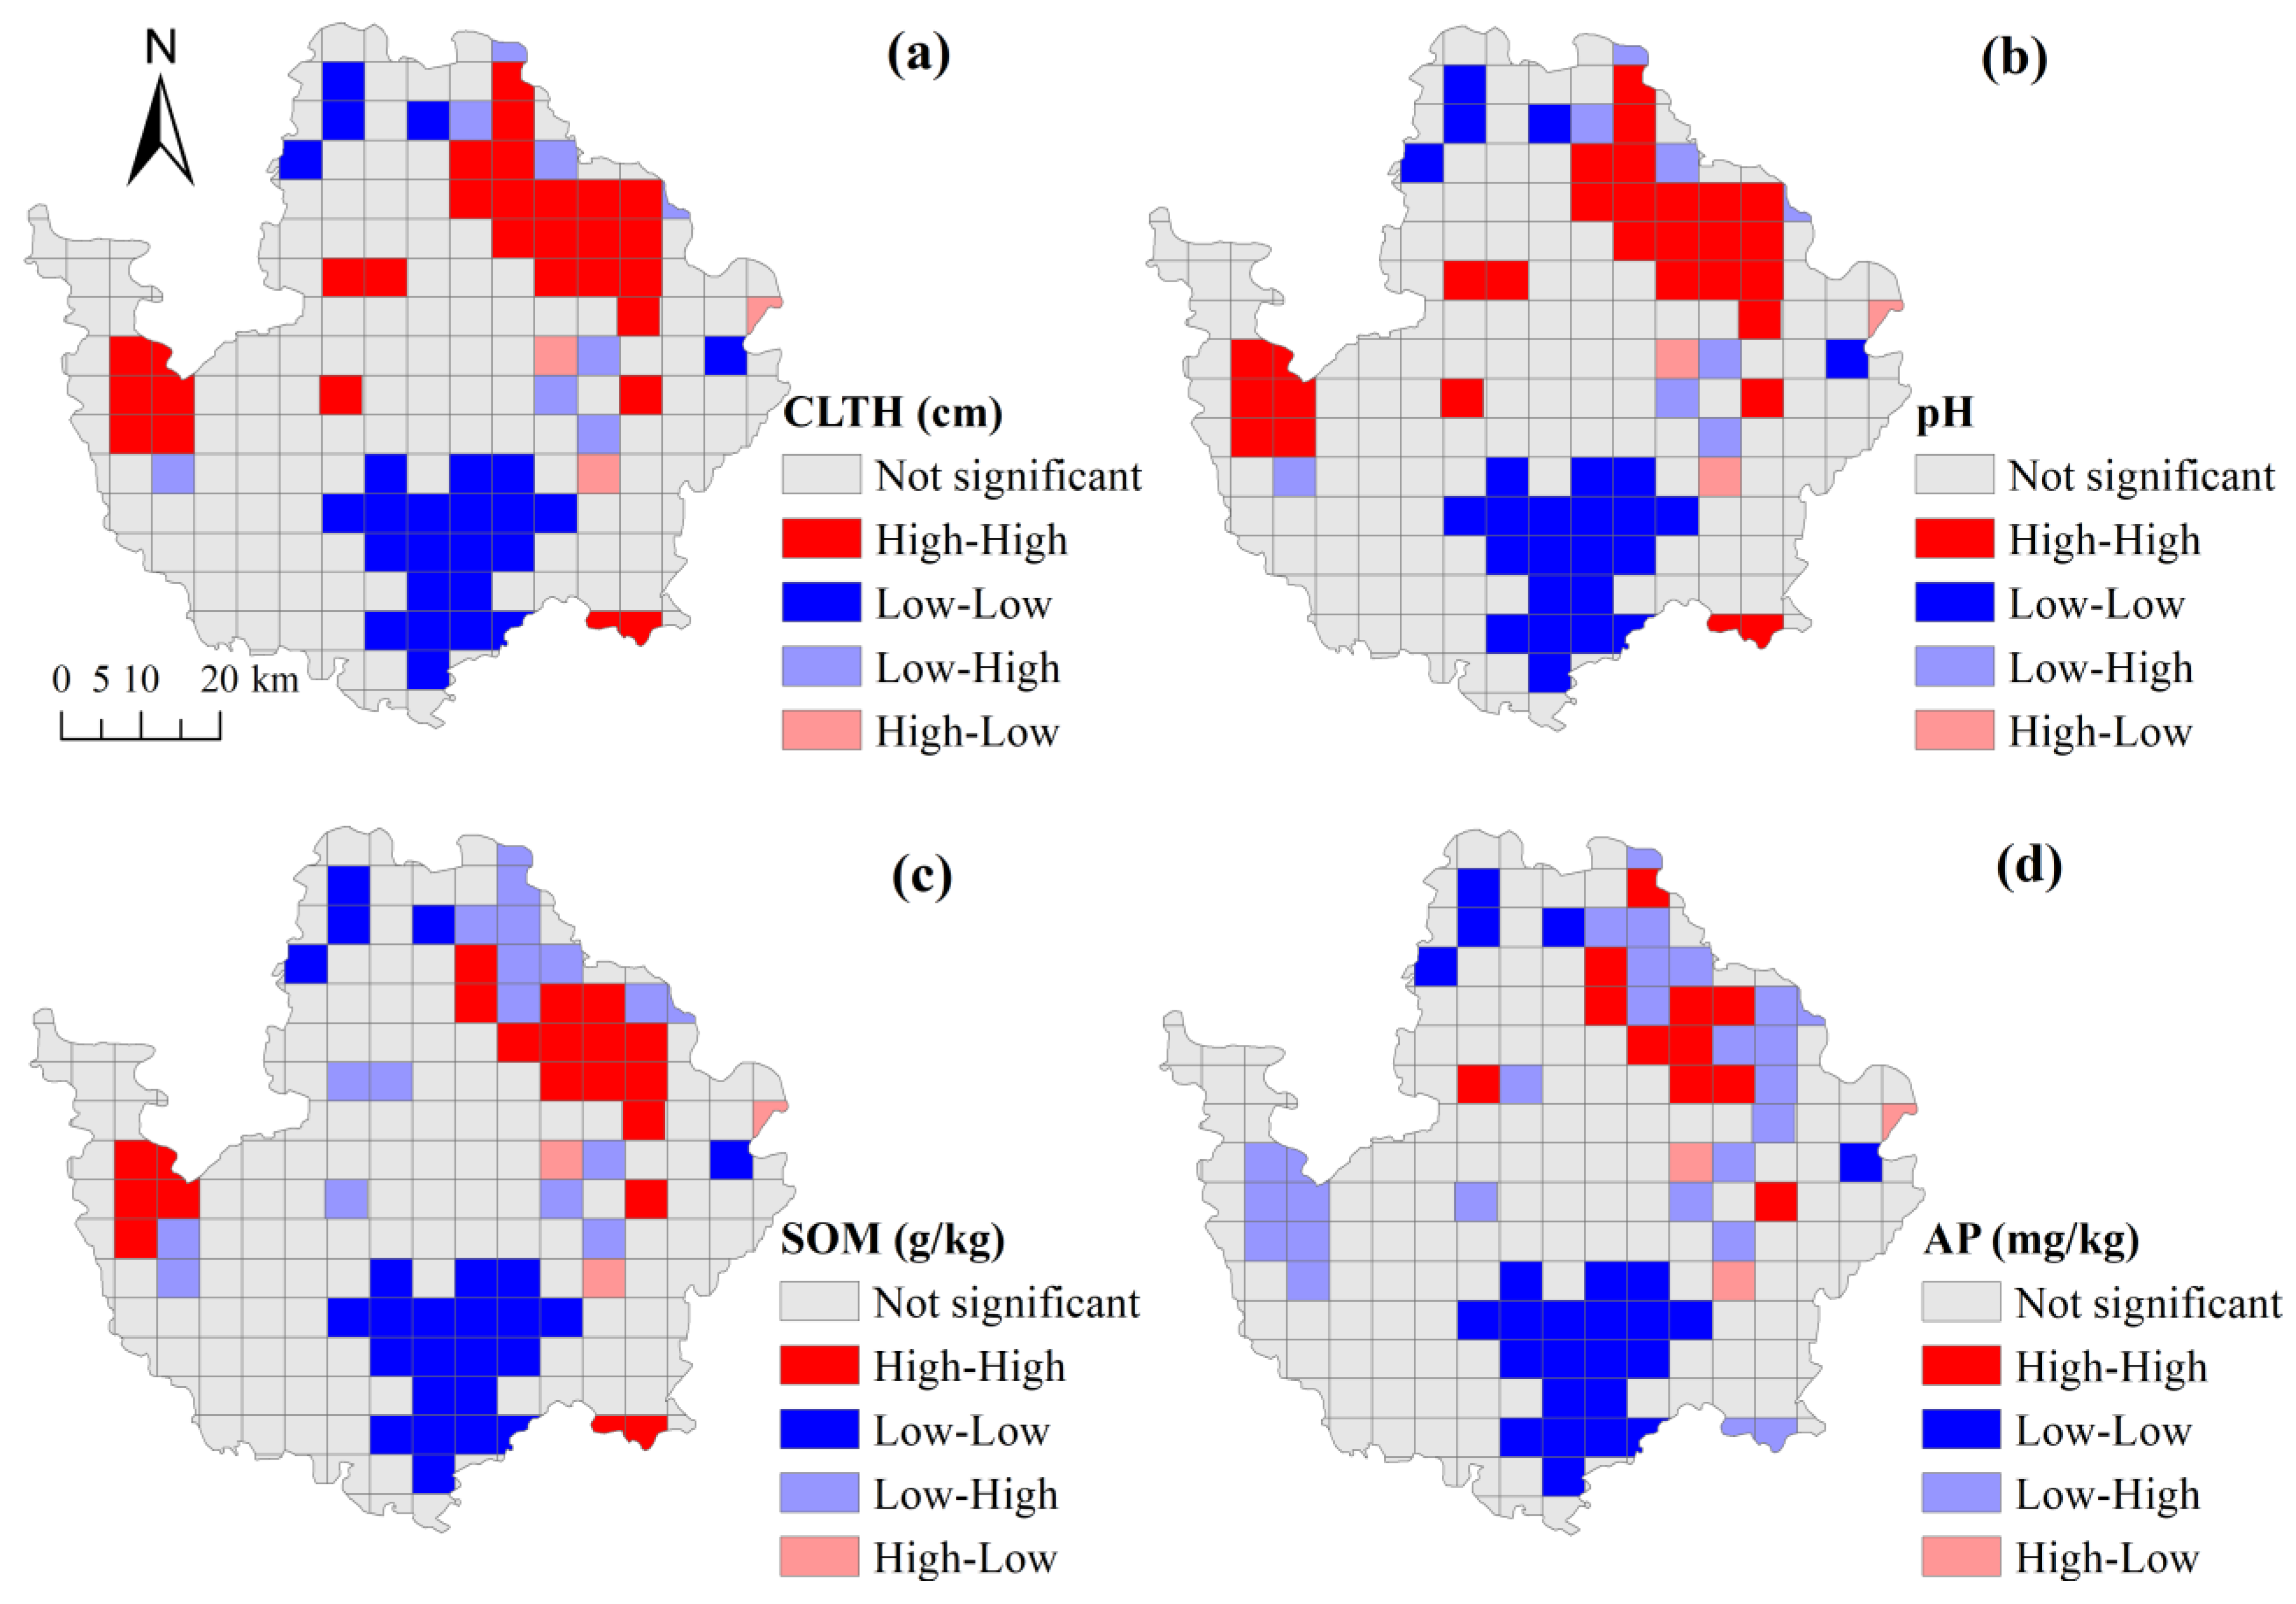
The bivariate global Moran’s I values for CLTH, pH, SOM and AP were all greater than zero (p < 0.001, I > 0, |Z| > 1.96), indicating significant positive spatial autocorrelation with CLQ (Table S4; Figure S1). This result suggests that the spatial distribution of these limiting factors was not random, thereby supporting the applicability of bivariate spatial autocorrelation analysis in this study. Among the variables, CLTH, pH, and SOM exhibited relatively stronger spatial autocorrelation, with Moran’s I values of 0.365, 0.369, and 0.310, respectively, whereas AP showed a comparatively weaker spatial autocorrelation (0.134). To further explore local spatial relationships and clustering characteristics between limiting factors and CLQ, bivariate local indicators of spatial autocorrelation maps were generated (Figure 5). The results revealed significant spatial clustering patterns and pronounced spatial heterogeneity. Overall, high–high clusters of limiting factors and CLQ were primarily distributed in the northeastern part of the study area, whereas low–low clusters were mainly observed in the southwestern region.
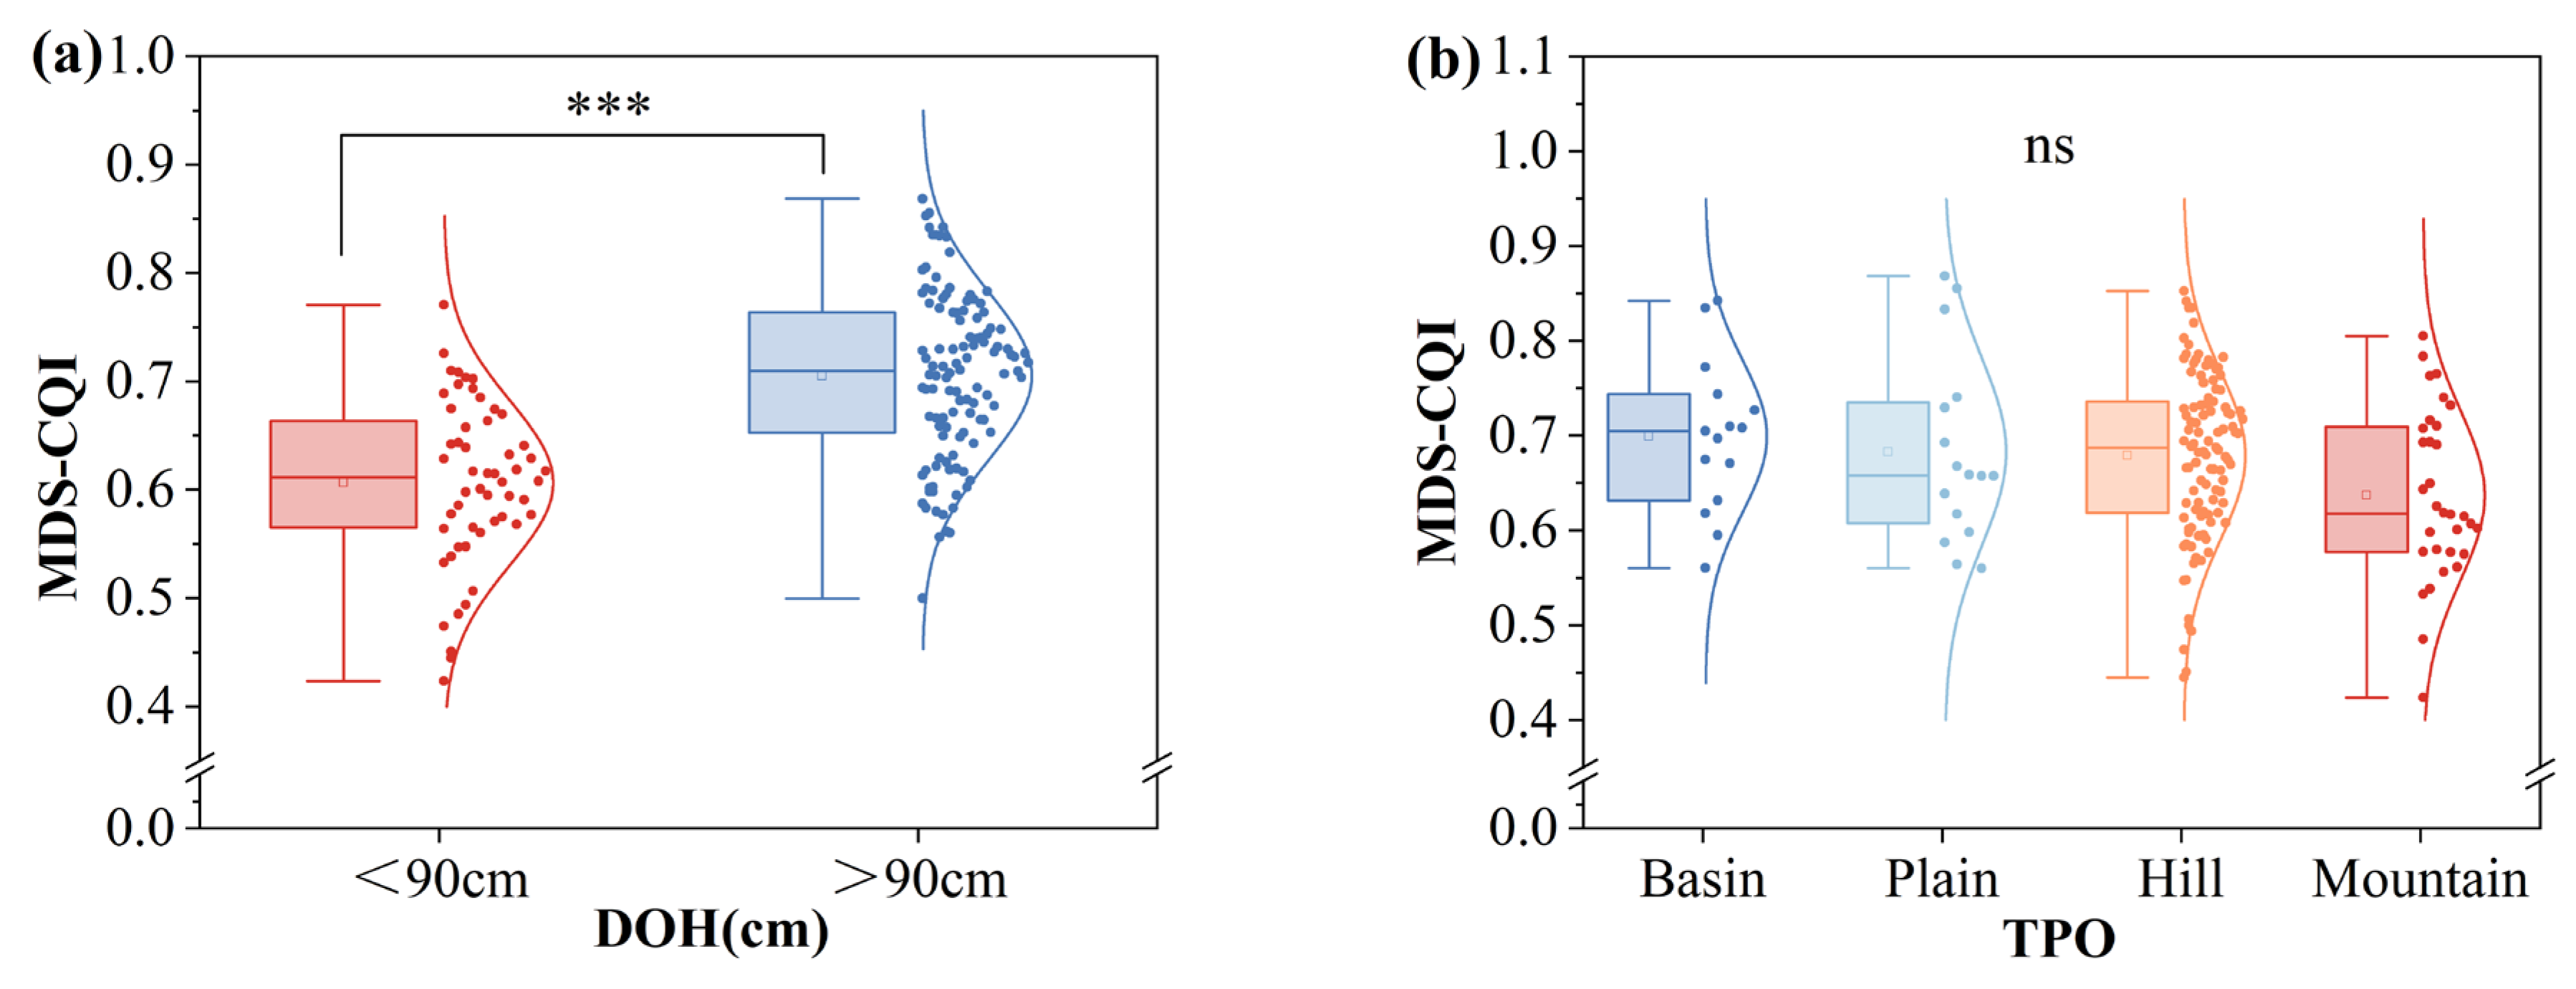
According to the Chinese National Standard [32], soils with a DOH greater than 90 cm have negligible adverse effects on crop growth. Therefore, in this study, DOH was classified into two groups: >90 cm and <90 cm. As shown in Figure 6a, the CQI for DOH values exceeding 90 cm is significantly higher than that for DOH values below 90 cm, with an increase of 14.75%. In contrast, no significant differences in mean CQI were observed among the different TPO categories (Figure 6b). In summary, based on the combined results of RF, radar chart, spatial autocorrelation, and comparative analyses, DOH, CLTH, pH, and SOM were identified as the primary limiting factors, whereas AP was considered a secondary limiting factor.

3.4. Spatial Distribution Characteristics of CQI and Limiting Factors

To complement the bivariate Moran’s I results, spatial interpolation was conducted to examine the continuous spatial patterns of CLQ and its limiting factors. In this study, kriging interpolation was performed across the administrative extent of Xingbin District based on the available sampling data. The interpolated surfaces revealed pronounced spatial heterogeneity across the study area. The spatial dependence of CQI derived from the MDS was further examined using semivariogram analysis. The best-fitting semivariogram model for CQI was the spherical model, with a nugget of 0.0045, a sill of 0.0091, and a range of 34.08 km. Model performance was indicated by a coefficient of determination (R2) of 0.914 and a residual approaching zero. In addition, five-fold cross-validation was conducted to evaluate the predictive performance of the kriging models. The cross-validation results yielded an RMSE of 0.0816, a standardized RMSE of 1.0272, and a mean standard error of 0.0797. The nugget-to-sill ratio of CQI was 50% (within the range of 25–75%), indicating moderate spatial association [6].
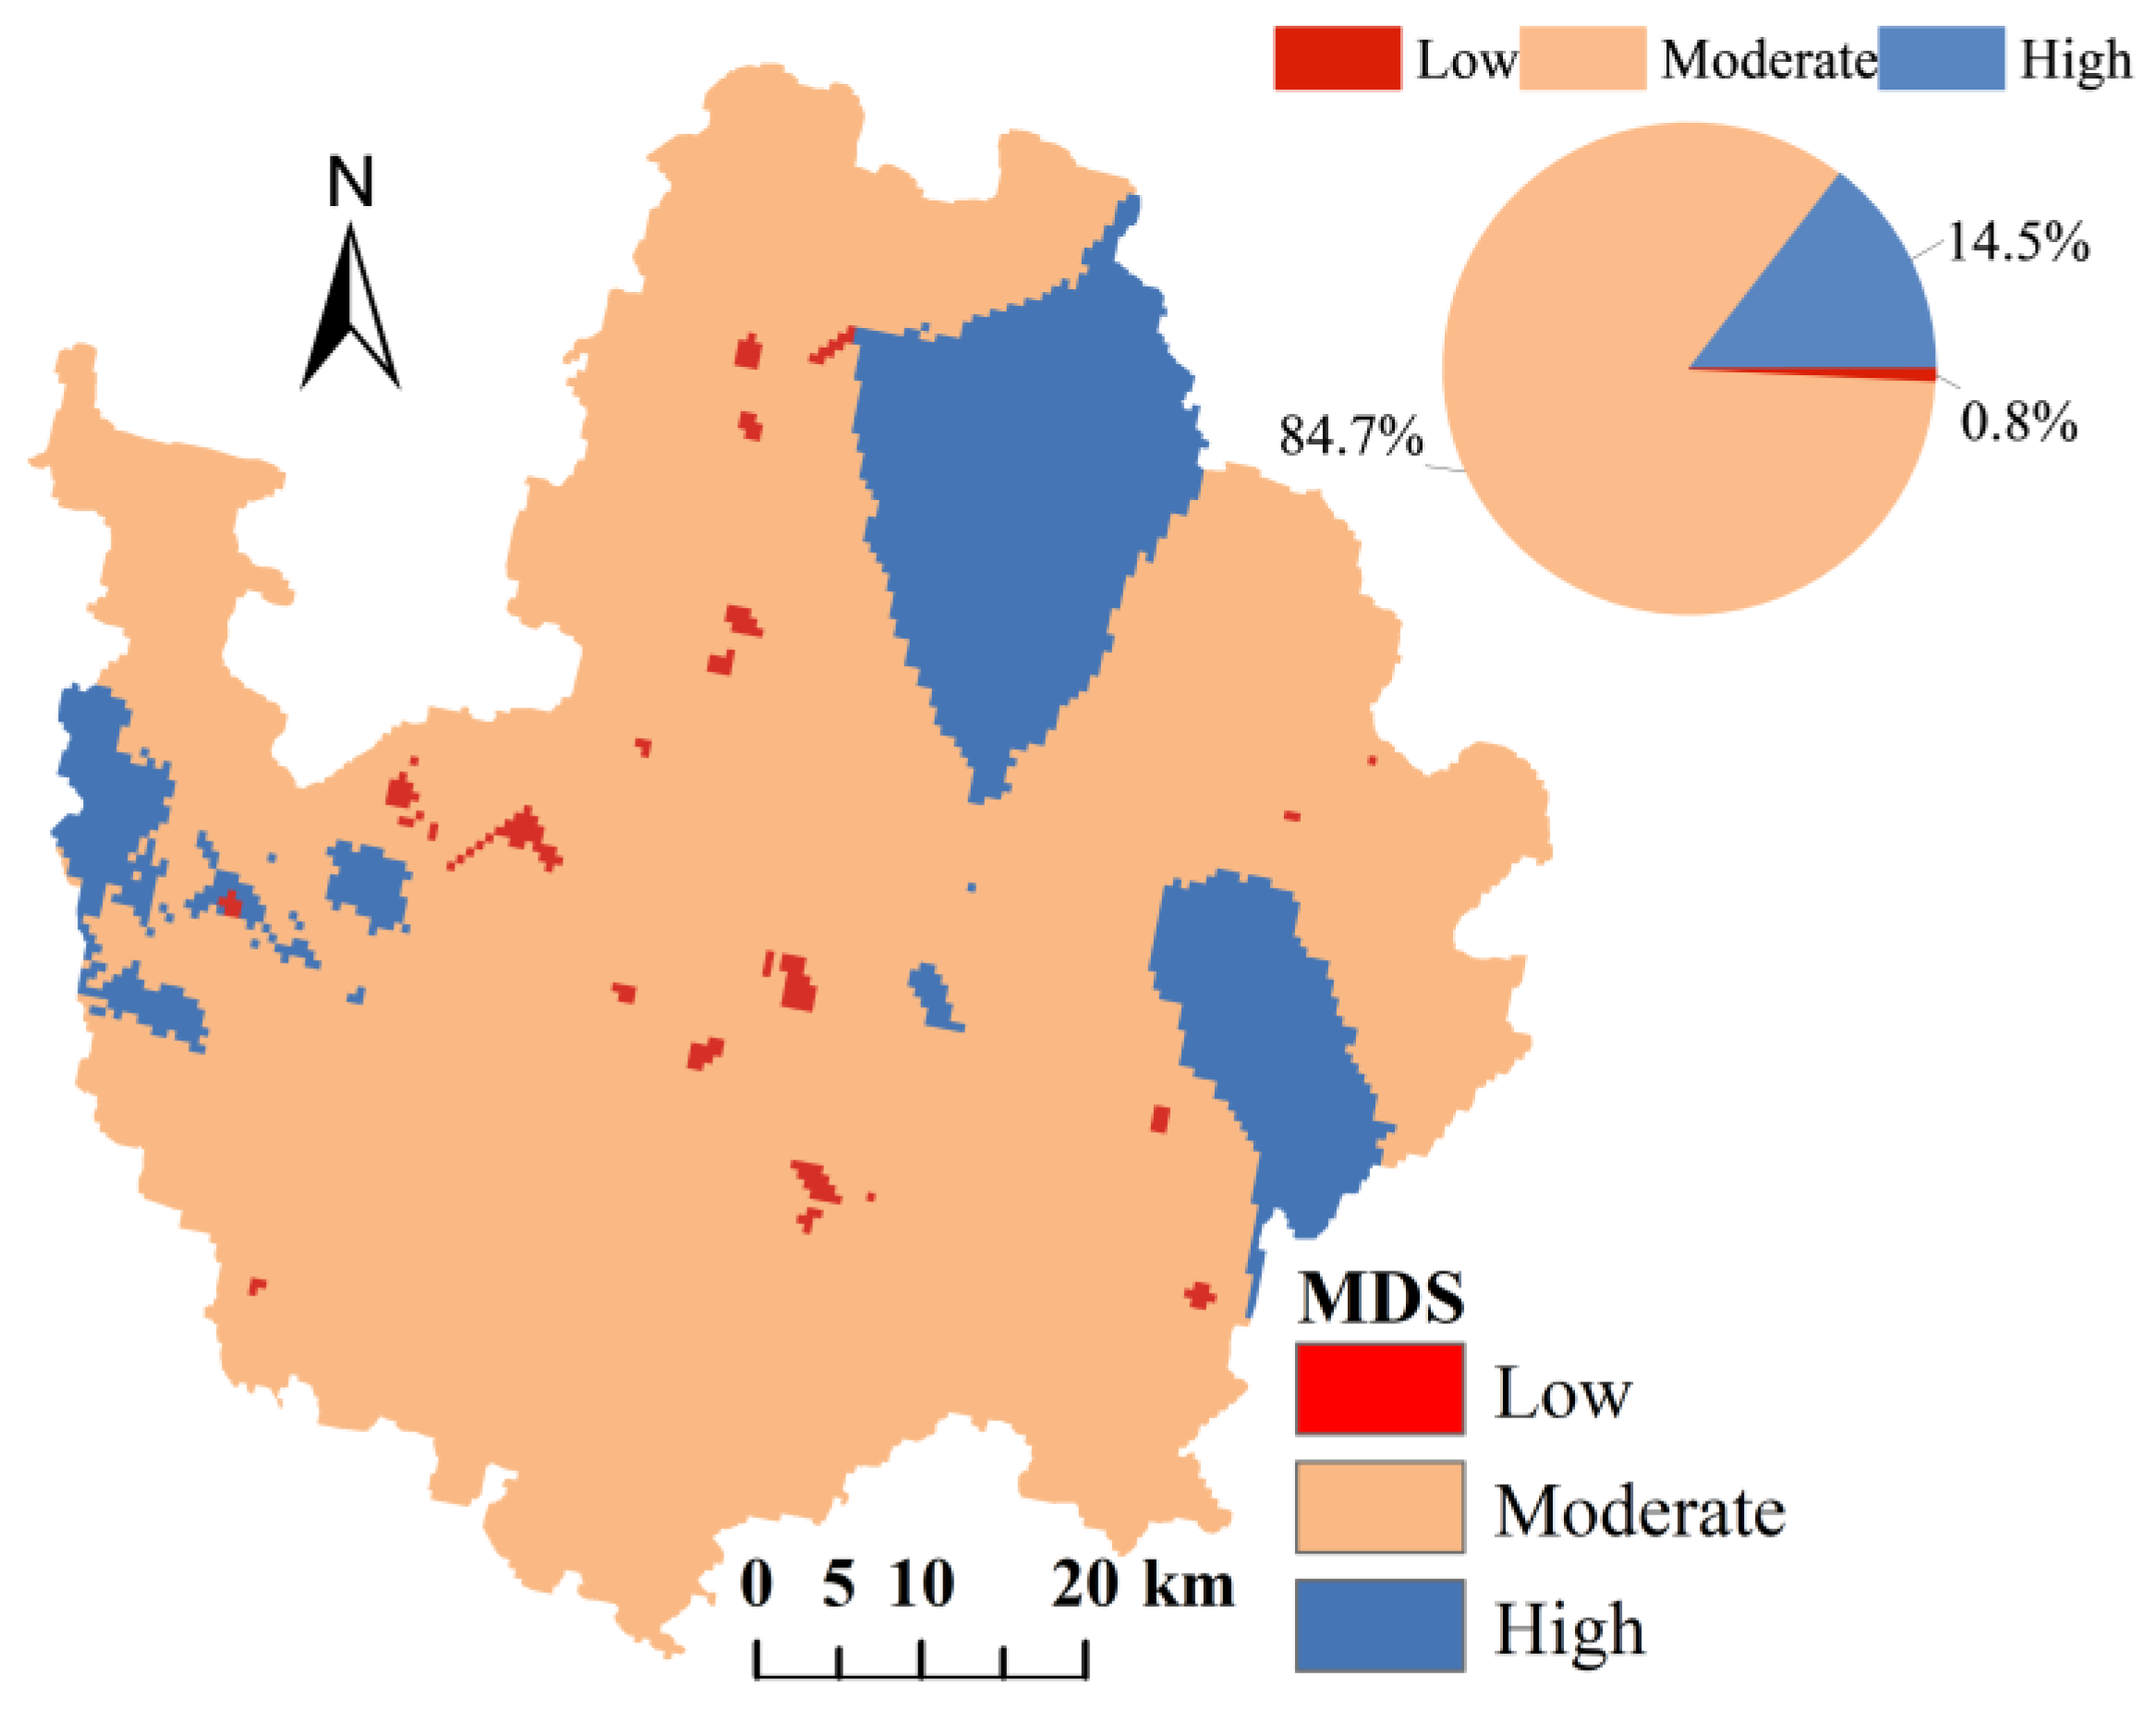
A spatial distribution map of CQI was generated using ordinary kriging. As shown in Figure 7, CQI were generally lower in the central and southwestern parts of the study area and higher in the northeastern region. High- and low-quality cultivated lands exhibited a patchy spatial distribution. Overall, high, moderate, and low grades accounted for 14.5%, 84.7%, and 0.8% of the whole study area, respectively. As a cash crop, sugarcane generally receives intensive fertilization and field management, which may contribute to relatively favorable baseline soil conditions and, consequently, a small proportion of low-quality land.
For the CLQ classification, the original analysis used equal-interval classification to divide CLQ into three quality classes. To examine the sensitivity of the classification scheme, we additionally applied the natural-breaks (Jenks) method and compared the resulting class distributions and limiting-factor identification with those obtained using equal intervals. The natural-breaks classification resulted in low-, moderate-, and high-quality land accounting for 2.50%, 74.43%, and 23.07% of the whole study area, respectively, compared with 0.80%, 84.70%, and 14.50% under the equal-interval classification. Although the proportions of the three quality classes changed, the identification of the major limiting factors based on membership scores showed no substantial change (Table S3). Thus, the classification scheme affected the estimated area proportions of the quality classes but had a limited influence on the identification of the major limiting factors.
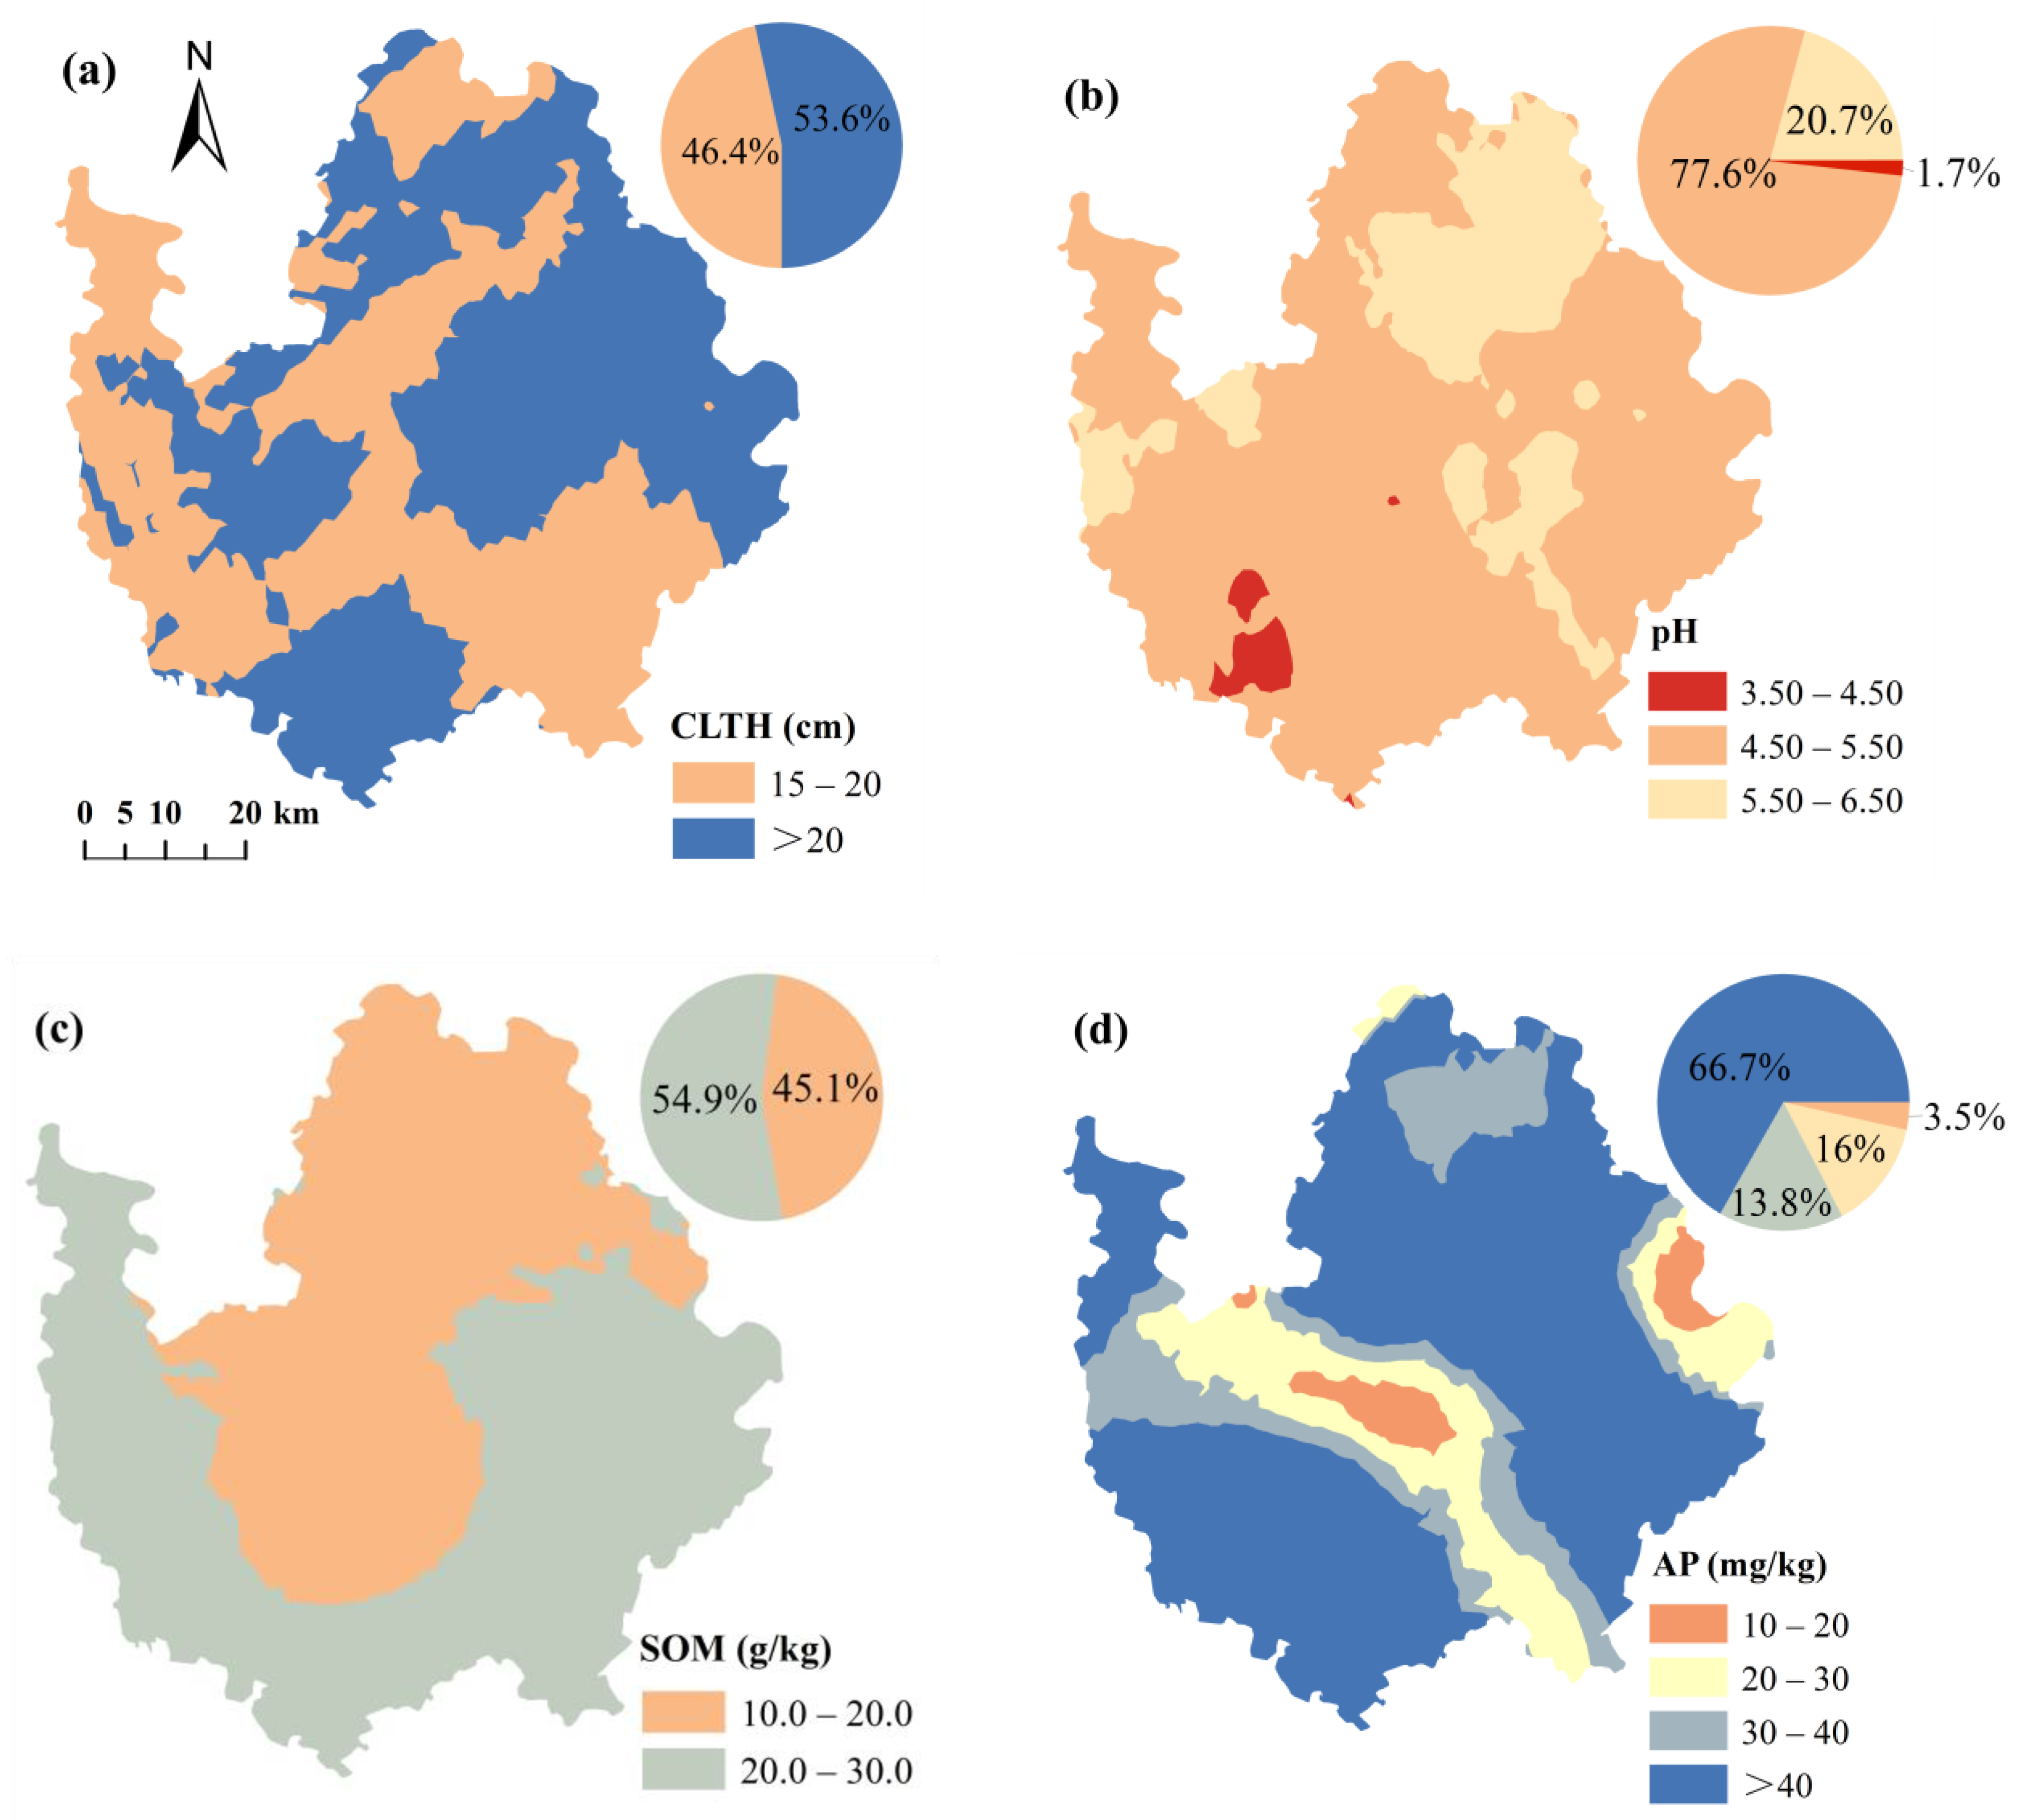
Spatial interpolation of major limiting factors revealed distinct spatial clustering patterns. Areas with stronger limiting constraints generally coincided with regions of lower CLQ. High- and low-value zones were spatially clustered in different regions, showing a general gradient from the northeast to the southwest. Based on the China National Soil Survey conducted in the 1980s, limiting factors were classified into different categories. CLTH (15–20 cm) accounted for approximately half of the whole study area (Figure 8a). Soil pH was classified into five categories and decreased from northeast to southwest, with acidic area (4.5–5.5) accounting for 77.6%. Slightly acidic soils (5.5–6.5) were mainly in the northeast, whereas strongly acidic soils (3.5–4.5) occurred sporadically in the southwest (Figure 8b). SOM showed pronounced spatial heterogeneity, with lower values in the north and higher values in the south. The 20.0–30.0 g kg−1 class dominated the whole study area (54.9%), followed by the 10.0–20.0 g kg−1 class (Figure 8c). AP was generally high across the whole study area. Areas with AP < 30 mg kg−1 accounted for less than 20%, indicating limited phosphorus deficiency and localized fertilizer demand (Figure 8d).

4. Discussion

4.1. Applicability and Limitations of the MDS

In this study, PCA was used to select eight indicators to construct the MDS, including pH, SOM, AP, CLTH, DOH, TPO, CLT, and BIO. These indicators have been widely reported in previous studies on CLQ assessment [7,12]. The MDS developed in this study effectively captured key soil properties relevant to CLQ, as evidenced by the strong agreement between CQI values derived from the MDS and the TDS. This finding is consistent with previous studies demonstrating that MDS approaches can reduce redundancy while maintaining robust explanatory power [8]. However, the relatively strong agreement between MDS- and TDS-based CQI values observed in this study, may be attributed to stronger collinearity among soil variables, which enhances the efficiency of PCA-based selection [22].
Previous studies have shown that commonly selected MDS indicators in southern China include pH, available Ca, SOM, AP, clay content, TN, AK, dissolved organic carbon, available Fe, and enzyme activity [16,20,22,37,38]. In this study, the selection of pH, SOM, and AP aligns with a large body of studies in the literature identifying these variables as core indicators of soil fertility [21,39]. However, unlike studies that emphasize TN and AK as primary contributors to soil quality [40], these variables were excluded in this study due to redundancy. This suggests that SOM may function as an integrative indicator of nutrient status in the study area, a role also highlighted by Qian et al. [8] and Liu et al. [41], who emphasized the central importance of SOM in nutrient cycling and soil structure.
In this study, CLTH, DOH, and CLT were selected for establishing the MDS to capture soil structural constraints associated with sugarcane cultivation. Continuous cropping and intensive tillage using heavy machinery tend to compact the soil, resulting in a progressively shallower plough layer and an upward shift of the compacted layer, which is consistent with the findings of Cherubin et al. [4]. The inclusion of these structural indicators reflects an effort to incorporate physical constraints, which are often underrepresented in soil quality studies that focus primarily on chemical properties [40,42]. However, compared with studies that directly measure soil compaction or hydraulic conductivity [12,16], the indicators used here provide only indirect proxies and may, therefore, limit the ability to fully capture soil physical degradation processes. Nevertheless, these indicators still provide useful, albeit indirect, insights into the structural constraints affecting soil quality at the regional scale.
The use of a qualitative BIO indicator highlights a broader limitation in soil quality assessment. While biological indicators are increasingly recognized as essential [39,43], their integration into large-scale assessments remains challenging due to methodological constraints. Similar compromises have been reported in other regional studies [20], indicating a need for improved biological monitoring frameworks.
The weighting scheme derived from PCA assigned greater importance to SOM, whereas TPO is prioritized in the Chinese National Standard [32]. This emphasis on SOM is consistent with studies highlighting its multifunctional role in soil systems [41]. However, PCA-based weighting reflects the statistical structure of the data set and may, therefore, assign greater importance to variables with higher variance rather than functional relevance [44]. Therefore, although this approach enhances objectivity, the resulting weights should be interpreted alongside expert knowledge. Nevertheless, in this study, the resulting weighting pattern remains reasonable from a functional perspective.
Overall, while the MDS provides a simplified and effective framework, its structure is influenced by data set characteristics and methodological choices. Therefore, caution is required when comparing results across studies using different indicator selection and weighting approaches [44,45].

4.2. Diagnosis Method of Limiting Factors for Sugarcane Land Quality

Clarifying the main limiting factors is essential for improving CLQ [21]. Numerous methods have been developed to identify limiting factors for CLQ improvement. For example, Xiao et al. [22] applied an integrated approach combining RF, path analysis, and multiple linear regression to identify key factors influencing soil quality changes in ancient terrace systems. Membership function methods have also been used to identify limiting factors, such as for pine in the Loess Hilly Region [20] and for upland red soils under long-term pig manure application [35]. Similarly, Huang et al. [23] developed an integrated framework combining entropy-weighted TOPSIS, obstacle degree models, and sequential Gaussian simulation to identify major limiting indicators in North China. In addition. Liu et al. [12,21] widely applied the obstacle degree model to identify key constraint indicators in dryland farming regions of the Huang–Huai–Hai Plain and across different microtopographic conditions in hilly and gully areas. Despite these advances, several limitations remain. Most of these approaches focus on identifying dominant factors but provide limited insight into the bivariate spatial autocorrelation between limiting factors and CLQ, and they do not explicitly characterize their spatial patterns. Moreover, some methods require relatively large sample sizes and involve computationally intensive procedures, which limit their applicability.
The bivariate spatial autocorrelation method has been widely used in human geography, land resource management, urban planning, and ecosystem assessment to quantify spatial autocorrelation between paired variables [46,47]. Some studies have examined relationships, such as those between urban industrial land use efficiency and green space suitability, rural transformation and multifunctionality, and carbon emissions and ecological risk, revealing pronounced spatial heterogeneity across scales [46,47,48]. However, few studies have used the bivariate spatial autocorrelation method to explore the relationship between the limiting factors and CLQ. In this study, we used membership functions to identify indicators with suboptimal conditions, RF to rank the relative importance of MDS indicators in explaining variation in composite CLQ, and bivariate Moran’s I to characterize their spatial associations. This integrated approach provides complementary information on the limitation status, relative importance, and spatial patterns of CLQ components, thereby improving the spatial interpretation of cultivated land constraints.

4.3. Limiting Factors for Sugarcane Land Quality

Soil pH, SOM, CLTH, and DOH were determined to be the dominant limiting factors in the study area. Studies on staple crops (e.g., rice, maize, wheat) have shown that key constraints on CLQ commonly include BD, CLTH, pH, SOM, AP, microbial biomass carbon, GRIW, and water retention [6,23,24,45,49]. The limiting factors identified in this study for sugarcane-dominated systems are generally consistent with those reported for staple crop systems, suggesting a comparable soil constraint framework across different cropping types. CLTH, pH, and SOM exhibited relatively continuous spatial patterns and showed strong spatial autocorrelation with CLQ in this study, whereas AP displayed a distinct pattern and weak spatial autocorrelation with CLQ; thus, its limiting role was considered secondary. This is likely due to localized factors such as parent material, soil type, microtopography, and human management practices [22]. This divergence highlights the limitation of relying on a single indicator to interpret CLQ patterns. Topography contributes to spatial variability by regulating processes such as erosion, water redistribution, and soil depth [50]. Li et al. [19] further showed that topography, and, in particular, altitude, significantly influences the spatial variability of CLQ in China. In contrast, the spatial differentiation of CQI in this study showed no significant differences among TPO categories. This discrepancy is likely attributable to the relatively narrow altitude range of the study area (38–680 m). Compared with the much broader elevation gradient reported by Li et al. [19] (from −24 to 5028 m), the limited variation in altitude here may weaken the influence of topography on CQI.
Soil pH plays a fundamental role in regulating nutrient availability and toxicity. Under acidic conditions, aluminum toxicity and phosphorus fixation can significantly constrain crop growth [28,51]. In this study, the spatial pattern of CLQ closely corresponded to that of soil pH, reinforcing its dominant role. This relationship is further supported by well-established mechanistic links between soil pH and nutrient dynamics, particularly the influence on phosphorus availability, aluminum toxicity, and nitrogen transformation [9,14,16,51]. Natural factors, such as precipitation, parent material, and leaching, may contribute to soil acidification [28]. In addition, both anthropogenic and biological processes may intensify soil acidification, including long-term nitrogen fertilization and root-induced proton release in sugarcane systems [27,52].
SOM is another key determinant of CLQ, reflecting its central role in soil fertility, structure, and biological activity [41]. The relatively low SOM levels observed in the study area, compared with intensively managed systems with organic amendments [53], suggest potential depletion under current management practices. This may lead to reduced nutrient supply capacity, weakened soil structure, and diminished microbial activity, ultimately limiting crop productivity [39].
In addition to these dominant factors, soil physical constraints also play an important role. CLTH showed strong spatial autocorrelation with CLQ, and significant differences in CLQ were observed between DOH categories; both results further support their role as a structural limiting factor. This may be attributed to the effects of CLTH on root penetration, soil water storage, and aeration conditions, which in turn affect sugarcane land quality [54]. Similarly, DOH reflects the effective rooting depth and soil volume available for water and nutrient storage [55].
In this study, limiting factors were identified within the CLQ evaluation framework and represent constraints on CLQ rather than direct yield-limiting factors. However, field-level sugarcane yield data were not collected in the present study, which limits our ability to directly verify the relationships between cultivated land quality, the identified limiting factors, and actual sugarcane productivity. Future research should incorporate field-level sugarcane yield data to further validate whether the identified CLQ constraints are associated with actual sugarcane productivity.
From a management perspective, spatially targeted strategies should be adopted to address these limiting factors. In the northeastern region, where higher soil quality is observed, priority should be given to enhancing organic matter inputs or crop residues to further improve soil fertility and sustain productivity [5,41]. In contrast, the southwestern region, characterized by stronger soil acidification and lower soil quality, should focus on acidification amelioration measures combined with deep plowing and subsoiling to improve soil chemical conditions and the rooting environment [55]. Specifically, to mitigate soil acidification, the application of lime, alkaline fertilizers, or soil conditioners is recommended [53]. However, the long-term effectiveness and optimal implementation of these practices require further field-based validation.

4.4. Limitations

Because spatial data delineating the actual sugarcane cultivated land in the study area were not available, the resulting spatial prediction surfaces may include areas outside the actual cultivated land, which limits the interpretation of the area proportions of the CLQ categories. Nevertheless, because the sampling sites were mainly distributed across the major sugarcane-growing areas, the interpolation results can still provide, to some extent, a representative indication of the spatial distribution pattern of sugarcane-cultivated land quality. However, the reported area proportions should be interpreted with caution and should not be regarded as exact proportions of the actual sugarcane-cultivated land area.
As we know, CQI can change with spatial–temporal dynamics. In this study, we did not consider the effects of climatic conditions and agricultural management practices on CQI. Therefore, another limitation concerns the temporal representativeness of the assessment. Because all soil samples were only collected in 2020, the assessed CLQ represents the spatial status of CLQ during the sampling period rather than its long-term temporal dynamics. Soil properties may vary between years in response to climatic conditions and agricultural management practices such as precipitation, temperature, fertilization, and irrigation. Therefore, the spatial patterns and limiting factors identified in this study should be interpreted primarily in the context of the 2020 sampling conditions. Repeated soil sampling over multiple years would be required to further assess the temporal stability of CLQ and the persistence of the identified limiting factors.

5. Conclusions

This study constructed an MDS for evaluating sugarcane CLQ in Xingbin District, comprising eight key indicators: pH, SOM, AP, CLTH, DOH, TPO, CLT, and BIO. Validation results indicated that the MDS can effectively substitute the TDS for CLQ assessment. Overall, CLQ in the whole study area was predominantly at a moderate level, with a spatial pattern characterized by higher values in the northeast and lower values in the southwest. High- and low-quality cultivated lands were distributed in distinct patchy clusters across the region. An integrated analysis of membership function, RF importance, and bivariate Moran’s I identified CLTH, pH, SOM, and DOH as the main constraints in low-quality land, whereas pH and SOM were the main constraints in moderate- and high-quality land. These findings provide a scientific basis for evaluating CLQ in acid-affected regions of southern China and offer a reference for soil improvement strategies.

Supplementary Materials

The following supporting information can be downloaded at https://www.mdpi.com/article/10.3390/land15091743/s1, Figure S1: Spatial autocorrelation analysis of primary limiting factors (a, CLTH, b, pH, c, SOM, d, AP); Table S1: Assignment of categorical variables and its membership function; Table S2: The membership function and threshold parameters for quantitative indicators; Table S3: Sensitivity analysis of limiting-factor identification under different membership-score thresholds; Table S4: Moran’s I Statistical Results.

Author Contributions

Conceptualization, H.H.; methodology, H.H.; investigation, Y.W., Y.C. and J.X.; data curation, H.H.; writing—original draft preparation, H.H.; writing—review and editing, K.H., Y.W., C.C. and Y.C.; supervision, K.H.; funding acquisition, K.H. All authors have read and agreed to the published version of the manuscript.

Funding

This work was supported by Guangxi Key R&D Program (Agriculture and Rural Areas) Project: Year-round Whole-stage Acid Amelioration Model Integration and Demonstration for Guangxi Red Soil (Latosolic Red Soil) (Project No. GXKJNAB2506910010) and the 2115 Talent Development Program of China Agricultural University (No. 1191–00109011).

Data Availability Statement

Data will be made available on request.

Conflicts of Interest

The authors declare no conflicts of interest.

References

  1. Zhan, L.; Xv, Z.; Huang, Z. Analysis of the Regional Comparative Advantages of China’s Sugarcane Industry. Chin. J. Trop. Agric. 2025, 45, 132–139. [Google Scholar] [CrossRef]
  2. Zhou, Z.; Liu, X.; Liu, R.; Liu, J.; Liu, W.; Yang, Q.; Luo, X.; Wang, R.; Xing, L.; Zhao, H.; et al. Sugarcane Distribution Simulation and Climate Change Impact Analysis in China. Agriculture 2025, 15, 491. [Google Scholar] [CrossRef] [Scilit]
  3. De Freitas, L.; Filho, M.V.M.; Casagrande, J.C.; De Oliveira, I.A.; Da Silva, L.G. Soil Quality Indicator of Oxisols Grown with Sugarcane and Native Forest in Northeastern São Paulo State, Brazil. Environ. Earth Sci. 2018, 77, 642. [Google Scholar] [CrossRef] [Scilit]
  4. Cherubin, M.R.; Karlen, D.L.; Franco, A.L.C.; Tormena, C.A.; Cerri, C.E.P.; Davies, C.A.; Cerri, C.C. Soil Physical Quality Response to Sugarcane Expansion in Brazil. Geoderma 2016, 267, 156–168. [Google Scholar] [CrossRef] [Scilit]
  5. Cairo, P.C.; Armas, J.M.d.; Artiles, P.T.; Martin, B.D.; Carrazana, R.J.; Lopez, O.R. Effects of Zeolite and Organic Fertilizers on Soil Quality and Yield of Sugarcane. Aust. J. Crop Sci. 2017, 11, 733–738. [Google Scholar] [CrossRef] [Scilit]
  6. Li, Y.H.; Wang, H.Y.; Zhang, J.D.; Wang, X.Y.; Zhang, R.; Ying, H.; Cui, Z.L. Spatial Distribution of Cultivated Land Quality and Potential for Capacity Improvement of Paddy Fields in South China. Chin. J. Eco-Agric. 2023, 31, 1613–1625. [Google Scholar] [CrossRef]
  7. Li, X.Y.; Wang, D.; Ren, Y.; Wang, Z.; Zhou, Y. Soil Quality Assessment of Croplands in the Black Soil Zone of Jilin Province, China: Establishing a Minimum Data Set Model. Ecol. Indic. 2019, 107, 105251. [Google Scholar] [CrossRef] [Scilit]
  8. Qian, F.; Jiao, S.; Yu, Y.; Wang, X.; Shao, T. Cultivated Land Quality Assessment and Obstacle Factors Diagnosis in Changtu County, Northeast China. Land Degrad. Dev. 2024, 35, 5065–5077. [Google Scholar] [CrossRef] [Scilit]
  9. Bonetti, J.D.A.; Nunes, M.R.; Fink, J.R.; Tretto, T.; Tormena, C.A. Agricultural Practices to Improve Near-Surface Soil Health and Crop Yield in Subtropical Soils. Soil Tillage Res. 2023, 234, 105835. [Google Scholar] [CrossRef] [Scilit]
  10. Pacci, S.; Dengiz, O.; Alaboz, P.; Saygın, F. Artificial Neural Networks in Soil Quality Prediction: Significance for Sustainable Tea Cultivation. Sci. Total Environ. 2024, 947, 174447. [Google Scholar] [CrossRef] [Scilit] [PubMed]
  11. Wang, Q.; Yan, Q.; Xv, H.; Wang, X.; Zhang, J.; Li, Z.; Chen, Z. A Modified Analytic Hierarchy Process Method Based on Grey Relation Analysis and Its Application in Evaluating Sustainability of Agricultural Land Use in Zaoyang City, Hubei Province. Prog. Geogr. 2016, 35, 1249–1257. [Google Scholar] [CrossRef] [Scilit]
  12. Liu, X.J.; Qiao, G.Y.; Guo, F.H.; Liu, D.; Li, Y.; Gou, Y.X.; Yv, R.Y.; Zhou, W.T.; Huang, Y.F. Evaluation and Obstacle Analysis of Cultivated Horizon Soil Quality Based on MDS in the Dry Farming Areas of Huang-Huai-Hai Region. Trans. Chin. Soc. Agric. Eng. 2023, 39, 104–113. [Google Scholar] [CrossRef]
  13. Li, P.; Shi, K.; Wang, Y.; Kong, D.; Liu, T.; Jiao, J.; Liu, M.; Li, H.; Hu, F. Soil Quality Assessment of Wheat-Maize Cropping System with Different Productivities in China: Establishing a Minimum Data Set. Soil Tillage Res. 2019, 190, 31–40. [Google Scholar] [CrossRef] [Scilit]
  14. Liu, X.; Rezaei Rashti, M.; Dougall, A.; Esfandbod, M.; Van Zwieten, L.; Chen, C. Subsoil Application of Compost Improved Sugarcane Yield through Enhanced Supply and Cycling of Soil Labile Organic Carbon and Nitrogen in an Acidic Soil at Tropical Australia. Soil Tillage Res. 2018, 180, 73–81. [Google Scholar] [CrossRef] [Scilit]
  15. Schloter, M.; Dilly, O.; Munch, J.C. Indicators for Evaluating Soil Quality. Agric. Ecosyst. Environ. 2003, 98, 255–262. [Google Scholar] [CrossRef] [Scilit]
  16. Jin, H.F.; Zhong, Y.J.; Shi, D.M.; Li, J.K.; Lou, Y.B.; Li, J.F. Quantifying the Impact of Tillage Measures on the Cultivated-Layer Soil Quality in the Red Soil Hilly Region: Establishing the Thresholds of the Minimum Data Set. Ecol. Indic. 2021, 130, 108013. [Google Scholar] [CrossRef] [Scilit]
  17. Larson, W.E.; Pierce, F.J. The Dynamics of Soil Quality as a Measure of Sustainable Management. In SSSA Special Publications; Doran, J.W., Coleman, D.C., Bezdicek, D.F., Stewart, B.A., Eds.; Wiley: Hoboken, NJ, USA, 1994; Volume 35, pp. 37–51. ISBN 978-0-89118-807-0. [Google Scholar]
  18. Qian, F.; Yu, Y.; Dong, X.; Gu, H. Soil Quality Evaluation Based on a Minimum Data Set (MDS)—A Case Study of Tieling County, Northeast China. Land 2023, 12, 1263. [Google Scholar] [CrossRef] [Scilit]
  19. Li, T.; Li, L.; Chen, X.; Zhang, S.; Wang, H.; Pu, Y.; Xu, X.; Wang, G.; Jia, Y.; Li, H.; et al. Soil Quality Assessment of Cropland in China and Its Relationships with Climate and Topography. Land Degrad. Dev. 2023, 34, 637–652. [Google Scholar] [CrossRef] [Scilit]
  20. Li, J.; Qiang, F.; Ai, N.; Liu, C.; Liu, G.; Zou, M.; Ren, Q.; Liu, M. Soil Quality Evaluation and Analysis of Driving Factors of Pinus Tabuliformis in Loess Hilly Areas. Forests 2024, 15, 1603. [Google Scholar] [CrossRef] [Scilit]
  21. Liu, L.; Qin, F.; Sheng, Y.; Li, L.; Dong, X.; Zhang, S.; Shen, C. Soil Quality Evaluation and Limiting Factor Analysis in Different Microtopographies of Hilly and Gully Region Based on Minimum Data Set. CATENA 2025, 254, 108973. [Google Scholar] [CrossRef] [Scilit]
  22. Xiao, P.; Hao, Y.; Liu, Y.; Deng, C.; Li, W.; Zhang, G.; Li, T.; Ma, Y.; Lei, M.; Long, Y.; et al. Mechanisms of Land Use Change Effects on Soil Quality in Ancient Terraces Based on the Minimum Data Set Approach. CATENA 2025, 254, 108990. [Google Scholar] [CrossRef] [Scilit]
  23. Huang, X.; Zhang, S.; Zhu, Q.; Zhang, H. Spatial Variation of Soil Quality Limiting Indicators in the North China. J. Environ. Manag. 2025, 380, 124936. [Google Scholar] [CrossRef] [Scilit] [PubMed]
  24. Haefele, S.M.; Nelson, A.; Hijmans, R.J. Soil Quality and Constraints in Global Rice Production. Geoderma 2014, 235–236, 250–259. [Google Scholar] [CrossRef] [Scilit]
  25. Dewi, W.S.; Romadhon, M.R.; Amalina, D.D.; Aziz, A. Paddy Soil Quality Assessment to Sustaining Food Security. IOP Conf. Ser. Earth Environ. Sci. 2022, 1107, 012051. [Google Scholar] [CrossRef] [Scilit]
  26. Pang, Z.; Mo, L.; Liu, Q.; Huang, Q.; Xiao, Y.; Yuan, Z. Soil Acidification Reduces Flavonoids and Key Metabolites in Sugarcane Roots and Rhizosphere Leading to Yield Decline. Rhizosphere 2025, 33, 101028. [Google Scholar] [CrossRef] [Scilit]
  27. Zhong, N.; Cai, Q.; Huang, J. Synergistic Regulation Mechanism of Nitrogen and Potassium Coupling on Sugarcane Yield and Soil Quality in Karst Areas. Front. Plant Sci. 2025, 16, 1614682. [Google Scholar] [CrossRef] [Scilit] [PubMed]
  28. Dong, Y.; Yang, J.-L.; Zhao, X.-R.; Yang, S.-H.; Mulder, J.; Dörsch, P.; Peng, X.-H.; Zhang, G.-L. Soil Acidification and Loss of Base Cations in a Subtropical Agricultural Watershed. Sci. Total Environ. 2022, 827, 154338. [Google Scholar] [CrossRef] [Scilit] [PubMed]
  29. Pang, Z.; Huang, J.; Fallah, N.; Lin, W.; Yuan, Z.; Hu, C. Combining N Fertilization with Biochar Affects Root-Shoot Growth, Rhizosphere Soil Properties and Bacterial Communities under Sugarcane Monocropping. Ind. Crops Prod. 2022, 182, 114899. [Google Scholar] [CrossRef] [Scilit]
  30. Sun, X.; Guo, S.; Li, Y.; Wang, X. Investigation and Analysis of Physical and Chemical Properties of Sugarcane Field Soil in Xingbin District of Laibin City. J. Anhui Agric. Sci. 2022, 50, 78–81, 85. [Google Scholar] [CrossRef]
  31. Luo, G.; Chen, S.; Zeng, X. Current Status and Improvement Utilisation of Cultivated Land Fertility in Sugarcane Planting Areas of Xingbin District, Laibin City. South China Agric. 2023, 17, 206–209+214. [Google Scholar] [CrossRef]
  32. GB/T 33469-2016; Cultivated Land Quality Grade. Standards Press of China: Beijing, China, 2016.
  33. Wang, R.M. Construction and Application of Comprehensive Evaluation Model of Cultivated Land Quality on a County Scale: Take Conghua District of Guangzhou City as an Example. Ph.D. Thesis, South China Agricultural University, Guangzhou, China, 2021. [Google Scholar]
  34. NSCO (National Soil Census Office). Techniques of Soil Census in China; Agricultural Press: Beijing, China, 1992. [Google Scholar]
  35. Si, S.C.; Tu, C.; Wu, Y.C.; Li, Y.; Lin, Y.M. Soil Fertility Health and Peanut Yield in Upland Red Soils under Long-Term Continuous Application of Pig Manure. J. Ecol. Rural Environ. 2023, 39, 480–487. [Google Scholar] [CrossRef]
  36. Li, C.; Xu, M.; Wang, X.; Tan, Q. Spatial Analysis of Dual-Scale Water Stresses Based on Water Footprint Accounting in the Haihe River Basin, China. Ecol. Indic. 2018, 92, 254–267. [Google Scholar] [CrossRef] [Scilit]
  37. Mi, W.; Sun, T.; Ma, Y.; Chen, C.; Ma, Q.; Wu, L.; Wu, Q.; Xu, Q. Higher Yield Sustainability and Soil Quality by Manure Amendment than Straw Returning under a Single-Rice Cropping System. Field Crops Res. 2023, 292, 108805. [Google Scholar] [CrossRef] [Scilit]
  38. Teng, L.; Jiang, G.; Ding, Z.; Wang, Y.; Liang, T.; Zhang, J.; Dai, H.; Cao, F. Evaluation of Tobacco-Planting Soil Quality Using Multiple Distinct Scoring Methods and Soil Quality Indices. J. Clean. Prod. 2024, 441, 140883. [Google Scholar] [CrossRef] [Scilit]
  39. Bünemann, E.K.; Bongiorno, G.; Bai, Z.; Creamer, R.E.; De Deyn, G.; De Goede, R.; Fleskens, L.; Geissen, V.; Kuyper, T.W.; Mäder, P.; et al. Soil Quality—A Critical Review. Soil Biol. Biochem. 2018, 120, 105–125. [Google Scholar] [CrossRef] [Scilit]
  40. Wu, C.; Liu, G.; Huang, C.; Liu, Q. Soil Quality Assessment in Yellow River Delta: Establishing a Minimum Data Set and Fuzzy Logic Model. Geoderma 2019, 334, 82–89. [Google Scholar] [CrossRef] [Scilit]
  41. Liu, H.; Du, X.; Li, Y.; Han, X.; Li, B.; Zhang, X.; Li, Q.; Liang, W. Organic Substitutions Improve Soil Quality and Maize Yield through Increasing Soil Microbial Diversity. J. Clean. Prod. 2022, 347, 131323. [Google Scholar] [CrossRef] [Scilit]
  42. Barbosa De Souza, A.C.; Paiva Leão, T.; De Figueiredo, C.C.; Carolino De Sá, M.A. Soil Physical Quality Using DRES and VESS Visual Assessment Approaches and Physical Properties. Soil Tillage Res. 2025, 251, 106558. [Google Scholar] [CrossRef] [Scilit]
  43. Tóth, Z.; Vasileiadis, V.P.; Dombos, M. An Arthropod-Based Assessment of Biological Soil Quality in Winter Wheat Fields across Hungary. Agric. Ecosyst. Environ. 2025, 378, 109325. [Google Scholar] [CrossRef] [Scilit]
  44. Martín-Sanz, J.P.; De Santiago-Martín, A.; Valverde-Asenjo, I.; Quintana-Nieto, J.R.; González-Huecas, C.; López-Lafuente, A.L. Comparison of Soil Quality Indexes Calculated by Network and Principal Component Analysis for Carbonated Soils under Different Uses. Ecol. Indic. 2022, 143, 109374. [Google Scholar] [CrossRef] [Scilit]
  45. Serda Kaya, N.; Dengiz, O. Assessment of the Neutrosophic Fuzzy-AHP and Predictive Power of Some Machine Learning Approaches for Maize Silage Soil Quality. Comput. Electron. Agric. 2024, 226, 109446. [Google Scholar] [CrossRef] [Scilit]
  46. Yan, G.; Wang, S. Coexistence and Transformation from Urban Industrial Land to Green Space in Decentralization of Megacities: A Case Study of Daxing District, Beijing, China. Ecol. Indic. 2023, 156, 111120. [Google Scholar] [CrossRef] [Scilit]
  47. Zhou, H.; Zhao, X.C. Spatial Relationships between Land Use Carbon Emissions and Ecological Risk in Changsha-Zhuzhou-Xiangtan Urban Agglomeration Based on Grid Scale. Acta Ecol. Sin. 2025, 45, 10898–10909. [Google Scholar] [CrossRef]
  48. Nie, Z.; Chen, C.; Wang, K.; Wang, Z. Nonlinear Transition under Geographic Embeddedness: Uncovering the Changing Spatial Pattern and Its Underpinning Dynamics of Rural Transformation at the Village Scale in China’s Developed Region. Habitat Int. 2026, 168, 103704. [Google Scholar] [CrossRef] [Scilit]
  49. Jia, R.; Zhou, J.; Chu, J.; Shahbaz, M.; Yang, Y.; Jones, D.L.; Zang, H.; Razavi, B.S.; Zeng, Z. Insights into the Associations between Soil Quality and Ecosystem Multifunctionality Driven by Fertilization Management: A Case Study from the North China Plain. J. Clean. Prod. 2022, 362, 132265. [Google Scholar] [CrossRef] [Scilit]
  50. Liang, Y.; Li, X.; He, B.Y.; Song, X.Q. Evaluating Cultivated Land Quality in Loess Hill and Gully Region and Characterisation of Topographic Gradient Using the Minimum Data Set. J. Northwest Univ. (Nat. Sci. Ed.) 2025, 55, 850–866. [Google Scholar] [CrossRef]
  51. Zhao, X.Q.; Pan, X.Z.; Ma, H.Y.; Dong, X.Y.; Che, J.; Wang, C.; Shi, Y.; Liu, K.L.; Sheng, R.F. Scientific Issues and Strategies of Acid Soil Use in China. Acta Pedol. Sin. 2023, 60, 1248–1263. [Google Scholar] [CrossRef]
  52. Lin, X.; Yang, D.; Zhu, Y.; Qin, Y.; Liang, T.; Yang, S.; Tan, H. Changes in Root Metabolites and Soil Microbial Community Structures in Rhizospheres of Sugarcanes under Different Propagation Methods. Microb. Biotechnol. 2024, 17, e14372. [Google Scholar] [CrossRef] [Scilit] [PubMed]
  53. Wu, Y.; Hao, H.; Ren, J.; Qin, Y.; Lu, S.; Tan, H.; Liang, X.; Hu, K. Optimizing Soil Conditioner Selection Based on Acidification Severity for Fertility and Yield Enhancement in Southern China’s Acid Soils: A Meta-Analysis. J. Environ. Manag. 2026, 403, 129200. [Google Scholar] [CrossRef] [Scilit] [PubMed]
  54. Battie Laclau, P.; Laclau, J.-P. Growth of the Whole Root System for a Plant Crop of Sugarcane under Rainfed and Irrigated Environments in Brazil. Field Crops Res. 2009, 114, 351–360. [Google Scholar] [CrossRef] [Scilit]
  55. Zhou, J.R.; Zhao, H.F.; Song, W.; Hou, X.Y. Spatial Variation and Impact Factors in Cultivated Land Productivity at Village Level. Chin. J. Agric. Resour. Reg. Plan. 2019, 40, 126–134. Available online: https://d.wanfangdata.com.cn/periodical/zgnyzyyqh201907019 (accessed on 14 September 2026).
Figure 1. The distribution of sampling points for sugarcane field in Xingbin District. DEM, digital elevation model.
Land 15 01743 g001
Figure 2. Correlation analysis of soil indicators in Xingbin District sugarcane fields. BD, bulk density; SOM, soil organic matter; TN, total nitrogen; AP, available phosphorus; AK, available potassium; EST, effective soil thickness; CLTH, cultivated layer thickness; DOH, depth of obstacle horizon; TPO, topographic position; CLT, cultivated layer texture; TC, texture configuration; BIO, biodiversity; FND, forest network density; OF, obstacle factors; GRIW, guaranteed rate of irrigation water; DC, drainage conditions.
Land 15 01743 g002
Figure 3. Linear regression relationship between CQI based on MDS and TDS. TDS, total data set; MDS, minimum data set; CQI, cultivated quality index.
Land 15 01743 g003
Figure 4. Radar chart of the minimum data set indicators across different cultivated land quality grades (a) * p < 0.05, ** p < 0.01; and the contribution of different indicators to cultivated land quality in the minimum data set (b). SOM, soil organic matter; AP, available phosphorus; CLTH, cultivated layer thickness; DOH, depth of obstacle horizon; TPO, topographic position; CLT, cultivated layer texture; BIO, biodiversity.
Land 15 01743 g004
Figure 5. The local bivariate spatial aggregation of primary limiting factors with CQI (Moran’s I): (a) CLTH; (b) pH; (c) SOM; and (d) AP in sugarcane cultivated land of Xingbin District. “Not significant” indicates that none of the four types of autocorrelations are apparent. SOM, soil organic matter; AP, available phosphorus; CLTH, cultivated layer thickness; DOH, depth of obstacle horizon.
Land 15 01743 g005
Figure 6. Comparable analysis of cultivated land quality index between different depth of obstacle (a); and topographies (b) in Xingbin District. In the boxplot, the transparent box denotes the mean, the central line represents the median, and the whiskers extend to 1.5× of the interquartile range (IQR). “ns” indicates “not significant” between different topographies, *** p < 0.001. DOH, depth of obstacle horizon; TPO, topographic position; MDS, minimum data set; CQI, cultivated quality index.
Land 15 01743 g006
Figure 7. Spatial distribution and area proportions of sugarcane-cultivated land quality grades within the whole study area. MDS, minimum data set.
Land 15 01743 g007
Figure 8. Spatial distribution and area proportion of the primary limiting factors: (a) CLTH; (b) pH; (c) SOM; and (d) AP in cultivated land of Xingbin District. SOM, soil organic matter; AP, available phosphorus; CLTH, cultivated layer thickness; DOH, depth of obstacle horizon.
Land 15 01743 g008
Table 1. Statistical features of cultivated land quality evaluating indicators for sugarcane in Xingbin District.
IndicatorsMinimumMaximumMeanStandard DeviationCV (%)
BD (g cm−3)1.041.441.220.086.46
pH3.608.225.241.0620.2
SOM (g kg−1)2.5143.5020.778.6741.7
TN (g kg−1)0.202.321.030.3938.2
AP (mg kg−1)4.00226.4051.0457.5113
AK (mg kg−1)16.0267.093.751.855.3
EST (cm)51.0100.091.612.513.7
CLTH (cm)13.032.020.64.3421.1
DOH (cm)17.0100.048.017.636.7
Note: BD, bulk density; SOM, soil organic matter; TN, total nitrogen; AP, available phosphorus; AK, available potassium; EST, effective soil thickness; CLTH, cultivated layer thickness; DOH, depth of obstacle horizon; CV, coefficient of variation.
Table 2. Rotated factor loadings and composite normalized loadings of evaluation indicators.
IndicatorGroupPrincipal Component (PC) Norm
PC 1PC 2PC 3PC 4PC 5PC 6PC 7
BD60.006−0.019−0.028−0.0260.1360.6060.0420.737
pH40.026−0.0370.1260.6910.168−0.2010.0180.932
SOM10.919−0.0410.0140.058−0.059−0.046−0.0441.386
TN10.912−0.0770.0180.127−0.029−0.0620.0311.385
AP40.1140.0850.169−0.7480.035−0.055−0.0400.983
AK10.6690.047−0.030−0.2790.0750.0750.0151.073
EST50.0340.008−0.3170.2730.6890.139−0.0311.001
CLTH6−0.016−0.0750.0560.020−0.3080.697−0.2450.952
DOH20.039−0.978−0.0070.0830.0110.017−0.0131.380
TPO5−0.014−0.0560.282−0.0620.777−0.063−0.0441.012
CLT30.024−0.066−0.881−0.013−0.0190.040−0.0721.174
TC30.031−0.0520.8110.002−0.0140.057−0.1331.088
BIO70.1050.067−0.0200.102−0.074−0.2110.8391.000
FND40.108−0.0030.1960.465−0.4370.2600.0720.895
OF2−0.0350.9740.001−0.040−0.032−0.0930.0361.377
GRIW70.0870.149−0.0490.2450.052−0.502−0.5350.932
DC7−0.2810.094−0.2070.1920.0390.2910.3970.803
Eigenvalue2.2531.9761.7481.5461.4331.3941.247
Percentage of
Variance
13.25011.62110.2829.0968.4318.2017.337
Cumulative
Percentage
13.25024.87135.15344.24952.68060.88168.218
Note: BD, bulk density; SOM, soil organic matter; TN, total nitrogen; AP, available phosphorus; AK, available potassium; EST, effective soil thickness; CLTH, cultivated layer thickness; DOH, depth of obstacle horizon; TPO, topographic position; CLT, cultivated layer texture; TC, texture configuration; BIO, biodiversity; FND, forest network density; OF, obstacle factors; GRIW, guaranteed rate of irrigation water; DC, drainage conditions. Indicators assigned to this PC were shown in bold.
Table 3. Weights for cultivated quality comprehensive evaluation indicators.
IndicatorTDSMDS
Common Factor VarianceWeightCommon Factor VarianceWeight
BD0.3890.034
pH0.5650.0490.6300.126
SOM0.8570.0740.7690.153
TN0.8590.074
AP0.6140.0530.6980.139
AK0.5400.047
EST0.6710.058
CLTH0.6500.0560.5690.114
DOH0.9650.0830.5970.119
TPO0.6950.0600.6080.121
CLT0.7890.0680.4760.095
TC0.6820.059
BIO0.7810.0670.6630.132
FND0.5300.046
OF0.9630.083
GRIW0.6320.055
DC0.4120.036
Note: BD, bulk density; SOM, soil organic matter; TN, total nitrogen; AP, available phosphorus; AK, available potassium; EST, effective soil thickness; CLTH, cultivated layer thickness; DOH, depth of obstacle horizon; TPO, topographic position; CLT, cultivated layer texture; TC, texture configuration; BIO, biodiversity; FND, forest network density; OF, obstacle factors; GRIW, guaranteed rate of irrigation water; DC, drainage conditions.
Table 4. Statistical characteristics of sugarcane-cultivated land quality evaluation based on TDS and MDS.
IndicatorMinimumMaximumMeanStandard DeviationCV (%)
TDS0.510.850.680.079.81
MDS0.420.870.670.0913.27
Note: TDS, total data set; MDS, minimum data set; CV, coefficient of variation.
Disclaimer/Publisher’s Note: The statements, opinions and data contained in all publications are solely those of the individual author(s) and contributor(s) and not of MDPI and/or the editor(s). MDPI and/or the editor(s) disclaim responsibility for any injury to people or property resulting from any ideas, methods, instructions or products referred to in the content.