Article

Generative Regeneration of Historic Urban Fabric: A Framework Based on Deep Learning and Multi-Objective Optimization

1
School of Art and Archaeology, Hangzhou City University, Hangzhou 310015, China
2
Zhejiang Engineering Research Center of Building’s Digital Carbon Neutral Technology, Hangzhou 310015, China
3
Zhejiang Provincial Collaborative Innovation Center for Immovable Cultural Heritage Protection Technology, Hangzhou 310015, China
4
Department of KANSEI Design Engineering, Faculty of Engineering, Yamaguchi University, Yamaguchi 753-8511, Japan
5
College of Civil Engineering and Architecture, Zhejiang University, Hangzhou 310058, China
*
Author to whom correspondence should be addressed.
Land 2026, 15(6), 976; https://doi.org/10.3390/land15060976
Submission received: 12 April 2026 / Revised: 27 May 2026 / Accepted: 30 May 2026 / Published: 3 June 2026

Abstract

Amid China’s rapid urbanization, many historic districts face complex challenges, including fragmented traditional fabrics, disordered spatial morphology, and discontinuous street networks. To tackle these issues, this study proposes a multimodal deep learning framework that combines Generative Adversarial Networks (GANs) and Diffusion Models, establishing an integrated generation-optimization workflow for the renewal of historic districts. The methodology begins by using Pix2PixHD to generate high-precision fabric layouts, followed by fine-tuning a Diffusion Model through Low-Rank Adaptation (LoRA) to achieve diversified morphological expansion. The candidate proposals are quantitatively evaluated using a ten-indicator evaluation matrix that covers both architectural fabric and street network dimensions. Afterwards, these proposals undergo iterative optimization with a multi-objective framework to enhance both urban fabric morphology and network performance. The framework was validated through an empirical study of the Yuehe Historic District in Jiaxing. The results indicate that the generated schemes closely align with the original urban fabric. Compared with the existing expanded area (EA), the weighted comprehensive fitness score of the optimized scheme group improved from 0.66 to 0.89 ± 0.02 (a 34.8% increase), with the standard deviation decreasing from 0.07 to 0.02, indicating significantly enhanced stability. Deep learning balances morphological authenticity, generative diversity, and performance in historic district preservation and renewal.

1. Introduction

China is home to a rich collection of historic districts, but preserving and renewing these areas presents significant challenges [1]. Rapid urbanization places tremendous pressure on heritage sites, intensifying the conflict between conservation and redevelopment. This issue is especially pronounced in southern China, where dense water networks, narrow alleyways, and compact mixed-use blocks form a unique urban fabric. These features contribute to distinct regional identities, making the protection of these areas an urgent priority.
Conventional large-scale renewal strategies often require extensive land consolidation. However, this approach fragments traditional small-scale morphologies and leads to a decline in spatial identity and vitality. For instance, inappropriate renewal interventions in Nanjing’s historic quarters have caused significant morphological degradation [2,3]. Consequently, it is essential to establish an organic renewal mechanism to preserve the continuity of the historic urban fabric while accommodating modern development.
To establish a clear framework for this approach, the core concepts must be explicitly defined within the context of contemporary urban planning. Historic District Renewal refers to a dynamic process that balances heritage conservation with functional modernization to ensure long-term viability. This process revolves around the preservation of the Historic Urban Fabric, which is defined as the physical texture of a city composed of plot patterns, building footprints, street networks, and open spaces that embody its historical evolution [2]. In modern practice, the synthesis of this fabric can be accelerated through Deep Learning, a subset of machine learning that utilizes multi-layered neural networks to recognize complex spatial patterns. When integrated into Generative Design frameworks, these algorithms automatically produce diverse design options based on defined parametric constraints [4,5,6]. To ensure these designs meet real-world planning standards, the outcomes are processed through Multi-Objective Optimization, a computational method that systematically identifies optimal solutions by balancing multiple conflicting performance goals [7].
Although advanced computational tools are increasingly applied to urban design, current generative frameworks face significant limitations when applied to sensitive heritage environments. These limitations can be grouped into three core issues:
  • Issue 1: An epistemological gap between computational metrics and heritage values. In current generative design workflows, “authenticity” is often oversimplified as mere physical similarity or geometric replication of building footprints. However, heritage conservation doctrines—such as the Nara Document on Authenticity [8] and the Historic Urban Landscape (HUL) approach [9]—state that authenticity is a broader, multidimensional concept. It encompasses materiality, utilization, memory, historic context, and intangible human associations. Equating simple geometric resemblance with authentic heritage continuity is a conceptually overstretched claim that risks stripping a district of its deeper historical value.
  • Issue 2: Methodological deficiencies in traditional planning tools. Conventional renewal strategies still rely heavily on manual surveying and subjective experiential judgments, as seen in projects like Dujiangyan West Street [10]. These methods lack standardized quantitative tools, which prevents the precise restoration and performance-based evaluation of intricate spatial structures.
  • Issue 3: Technical barriers in computational design generation. The application of deep generative models to complex urban forms faces severe algorithmic constraints. Generative Adversarial Networks (GANs) frequently suffer from data scarcity, mode collapse, and unstable training processes [4]. Meanwhile, advanced Denoising Diffusion Probabilistic Models lack explicit topological reasoning, which often results in semantic hallucinations, discontinuous street networks, and a lack of precise metric control [6,11,12].
The evolution of neural networks in architectural design generation has progressed from early probabilistic models to advanced deep generative frameworks, most notably Generative Adversarial Networks (GANs). In 2011, researchers at Stanford University pioneered the application of probabilistic methods, specifically Markov Chain Monte Carlo techniques, to architectural layout generation. This work established a foundational framework for data-driven design [13]. The introduction of GANs by Goodfellow et al. in 2014 marked a paradigm shift, offering a new approach to image-driven design synthesis [4,14]. Specialized models like Pix2PixHD have since been used to generate architectural layouts, master plans, and campus designs [5,14,15,16,17,18]. However, using GANs to regenerate historic urban fabric remains difficult due to insufficient training samples and limited morphological variety in the outputs [18,19,20,21,22].
To address these limitations, diffusion models have emerged as a powerful alternative, outperforming GANs in sample fidelity and diversity. Recent architectural studies have combined Latent Diffusion Models (such as Stable Diffusion) with adapter-based techniques like ControlNet and Low-Rank Adaptation (LoRA) to achieve precise stylistic control over facades and floor plans [6,23]. Furthermore, hybrid workflows that integrate diffusion models with optimization algorithms have been developed to predict performance metrics such as daylighting [7]. Yet, because diffusion models operate primarily as visual synthesizers, they struggle to natively incorporate domain-specific engineering knowledge or maintain strict spatial topology [23,24,25]. This limitation often produces broken street networks and geometric errors in historical contexts. To resolve these conflicts, this study proposes a multimodal deep generative framework that combines the structural stability of GANs with the creative diversity of Diffusion Models. This hybrid architecture utilizes Pix2PixHD to establish high-precision fabric boundaries and fine-tunes a Diffusion Model via LoRA to expand morphological diversity. By embedding a ten-indicator evaluation matrix into a Multi-Objective Optimization workflow, the framework achieves both high-fidelity reconstruction and controllable synthesis. Ultimately, this research establishes a novel methodological paradigm for the digital preservation and adaptive regeneration of cultural heritage, effectively balancing generative creativity with engineering precision.

2. Materials and Methods

To tackle the critical challenge of balancing morphological fidelity and generative diversity in the regeneration of historic urban fabric, this study proposes a novel technical framework that combines deep learning with Multi-Objective Optimization. This framework aims to create precise fabric layouts using GANs while utilizing Diffusion Models to broaden the design space. Subsequently, Multi-Objective Optimization algorithms are applied to systematically enhance the generated solutions, improving the overall spatial quality of both the urban fabric and the street network.
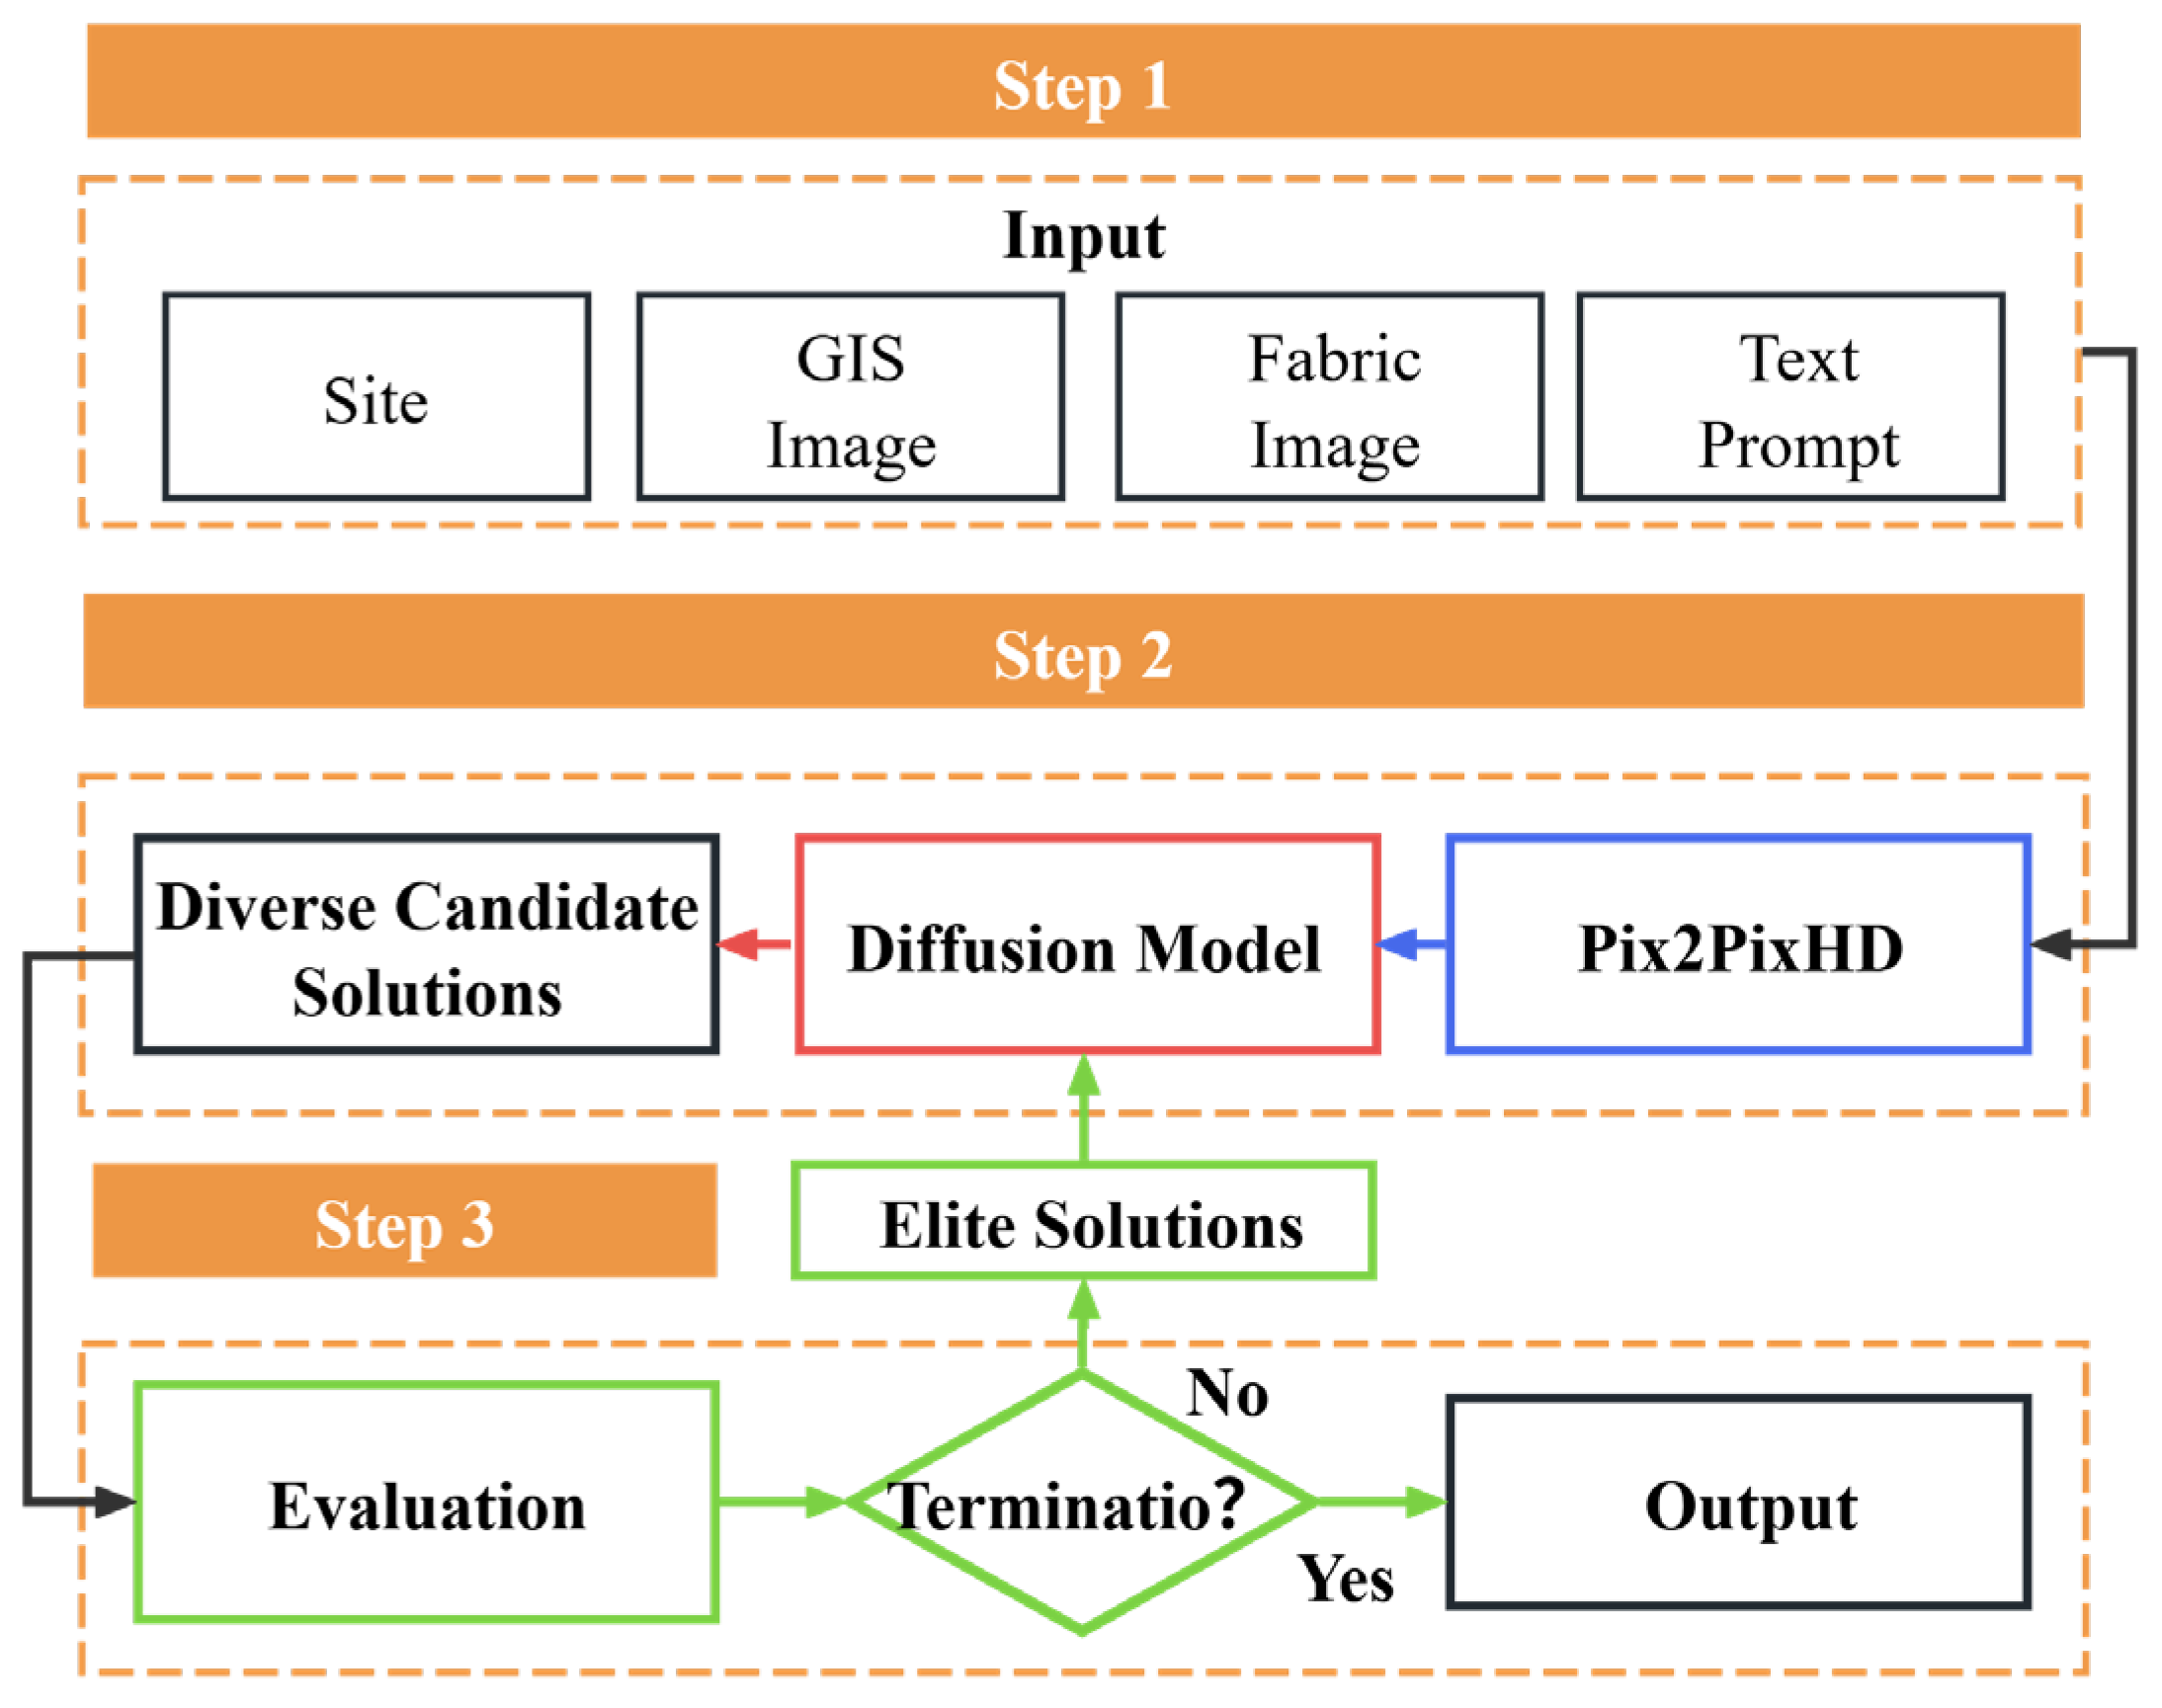
The implementation workflow consists of three core stages (see Figure 1 for the overall framework):
  • Initial Layout Synthesis (GAN-based): A constructed multimodal dataset is utilized, employing the Pix2PixHD model to generate high-fidelity initial urban fabric layouts. These layouts adhere strictly to land-use constraints and historical spatial patterns;
  • Design Space Expansion (Diffusion-based): To overcome the diversity limitations of GANs, we implement a Stable Diffusion model fine-tuned via LoRA. This stage uses semantic guidance to diversify the initial results, generating a wide variety of candidate solutions (morphological variants);
  • Performance-Driven Optimization and Decision-Making: We establish a quantitative evaluation system that includes metrics for fabric morphology and street network efficiency (with detailed definitions in Section 2.1). Using this framework, a custom Python (version 3.10, Python Software Foundation, Wilmington, DE, USA) algorithm integrates with Multi-Objective Optimization strategies for fitness evaluation and iterative refinement. This process filters and selects Pareto-optimal solutions that exhibit superior overall performance, establishing a closed-loop optimization cycle of generation-evaluation-feedback.
This framework systematically integrates the generative capabilities of deep learning with the scientific rigor of Multi-Objective Optimization, providing comprehensive technical support for the renewal of historic districts—from the synthesis of multiple schemes to the selection of optimal solutions. The following sections detail the implementation methodologies for both the generation and optimization modules.

2.1. Deep Learning-Driven Synthesis of Historic District Layouts

2.1.1. Multimodal Dataset Construction and Pre-Processing

To address the complex challenges involved in synthesizing the morphology of historic districts—especially those characterized by the distinctive river–street typologies of the Jiangnan region—this study developed a structured, multimodal dataset for training and validating generative design models. Data acquisition combined Geographic Information System (GIS) data, field survey drawings, archival materials from design institutes, and professional architectural databases to ensure that the samples were highly representative, standardized, and practically feasible.
  • A total of 60 representative historic district cases were curated through a stratified sampling strategy based on four rigorous criteria:
  • Morphological Integration: building layouts must exhibit a strong spatial interdependence with river corridors;
  • Legibility of Fabric: the spatial fabric characteristics must be clearly discernible;
  • Heritage Value: the districts must possess significant historical and cultural importance; and Data Completeness: high-quality visual and archival documentation must be available.
Balanced geographic representation was achieved by drawing cases from ten distinct cities in the Jiangnan region, including Hangzhou, Jiaxing, Suzhou, and Shaoxing, with each city contributing between four and eight cases to prevent single-city dominance. The dataset focuses on historic districts shaped or renewed from the early years of the People’s Republic of China to the present. However, the surviving architectural fabric within these districts spans a much longer period. Many building remains date back to the Ming and Qing dynasties and have persisted through various phases of urban change into the present day. The dataset encompasses both well-preserved cores and moderately transformed buffer zones to reflect real-world conservation and urban change conditions.
The final dataset consists of 60 cases. This number reflects a practical reality. Well-preserved historic districts of the specific river–street typology are scarce. The collected cases represent nearly all available samples that meet the rigorous selection criteria. A larger dataset of the same typology is not easily obtainable. However, because the typology is highly coherent, the morphological variation across cases is limited. The 60 samples are therefore sufficient to capture the essential spatial patterns of this fabric. To further address the sample size, data augmentation and transfer learning strategies were applied, as described below.
A 5-fold cross-validation strategy was adopted to evaluate the generalizability of the deep learning model and to reduce the risk of overfitting caused by the limited sample size. The complete dataset contained 60 historic district cases. From these, 10 cases were randomly selected as a fixed test set. The remaining 50 cases were used for the 5-fold cross-validation. They were randomly partitioned into five disjoint subsets of equal size. In each fold, one subset served as the validation set, and the other four subsets were used for training. The complete Pix2PixHD-LoRA pipeline was trained and evaluated in every fold. The results are summarized in Section 3.1 and confirm the stability of the proposed framework.
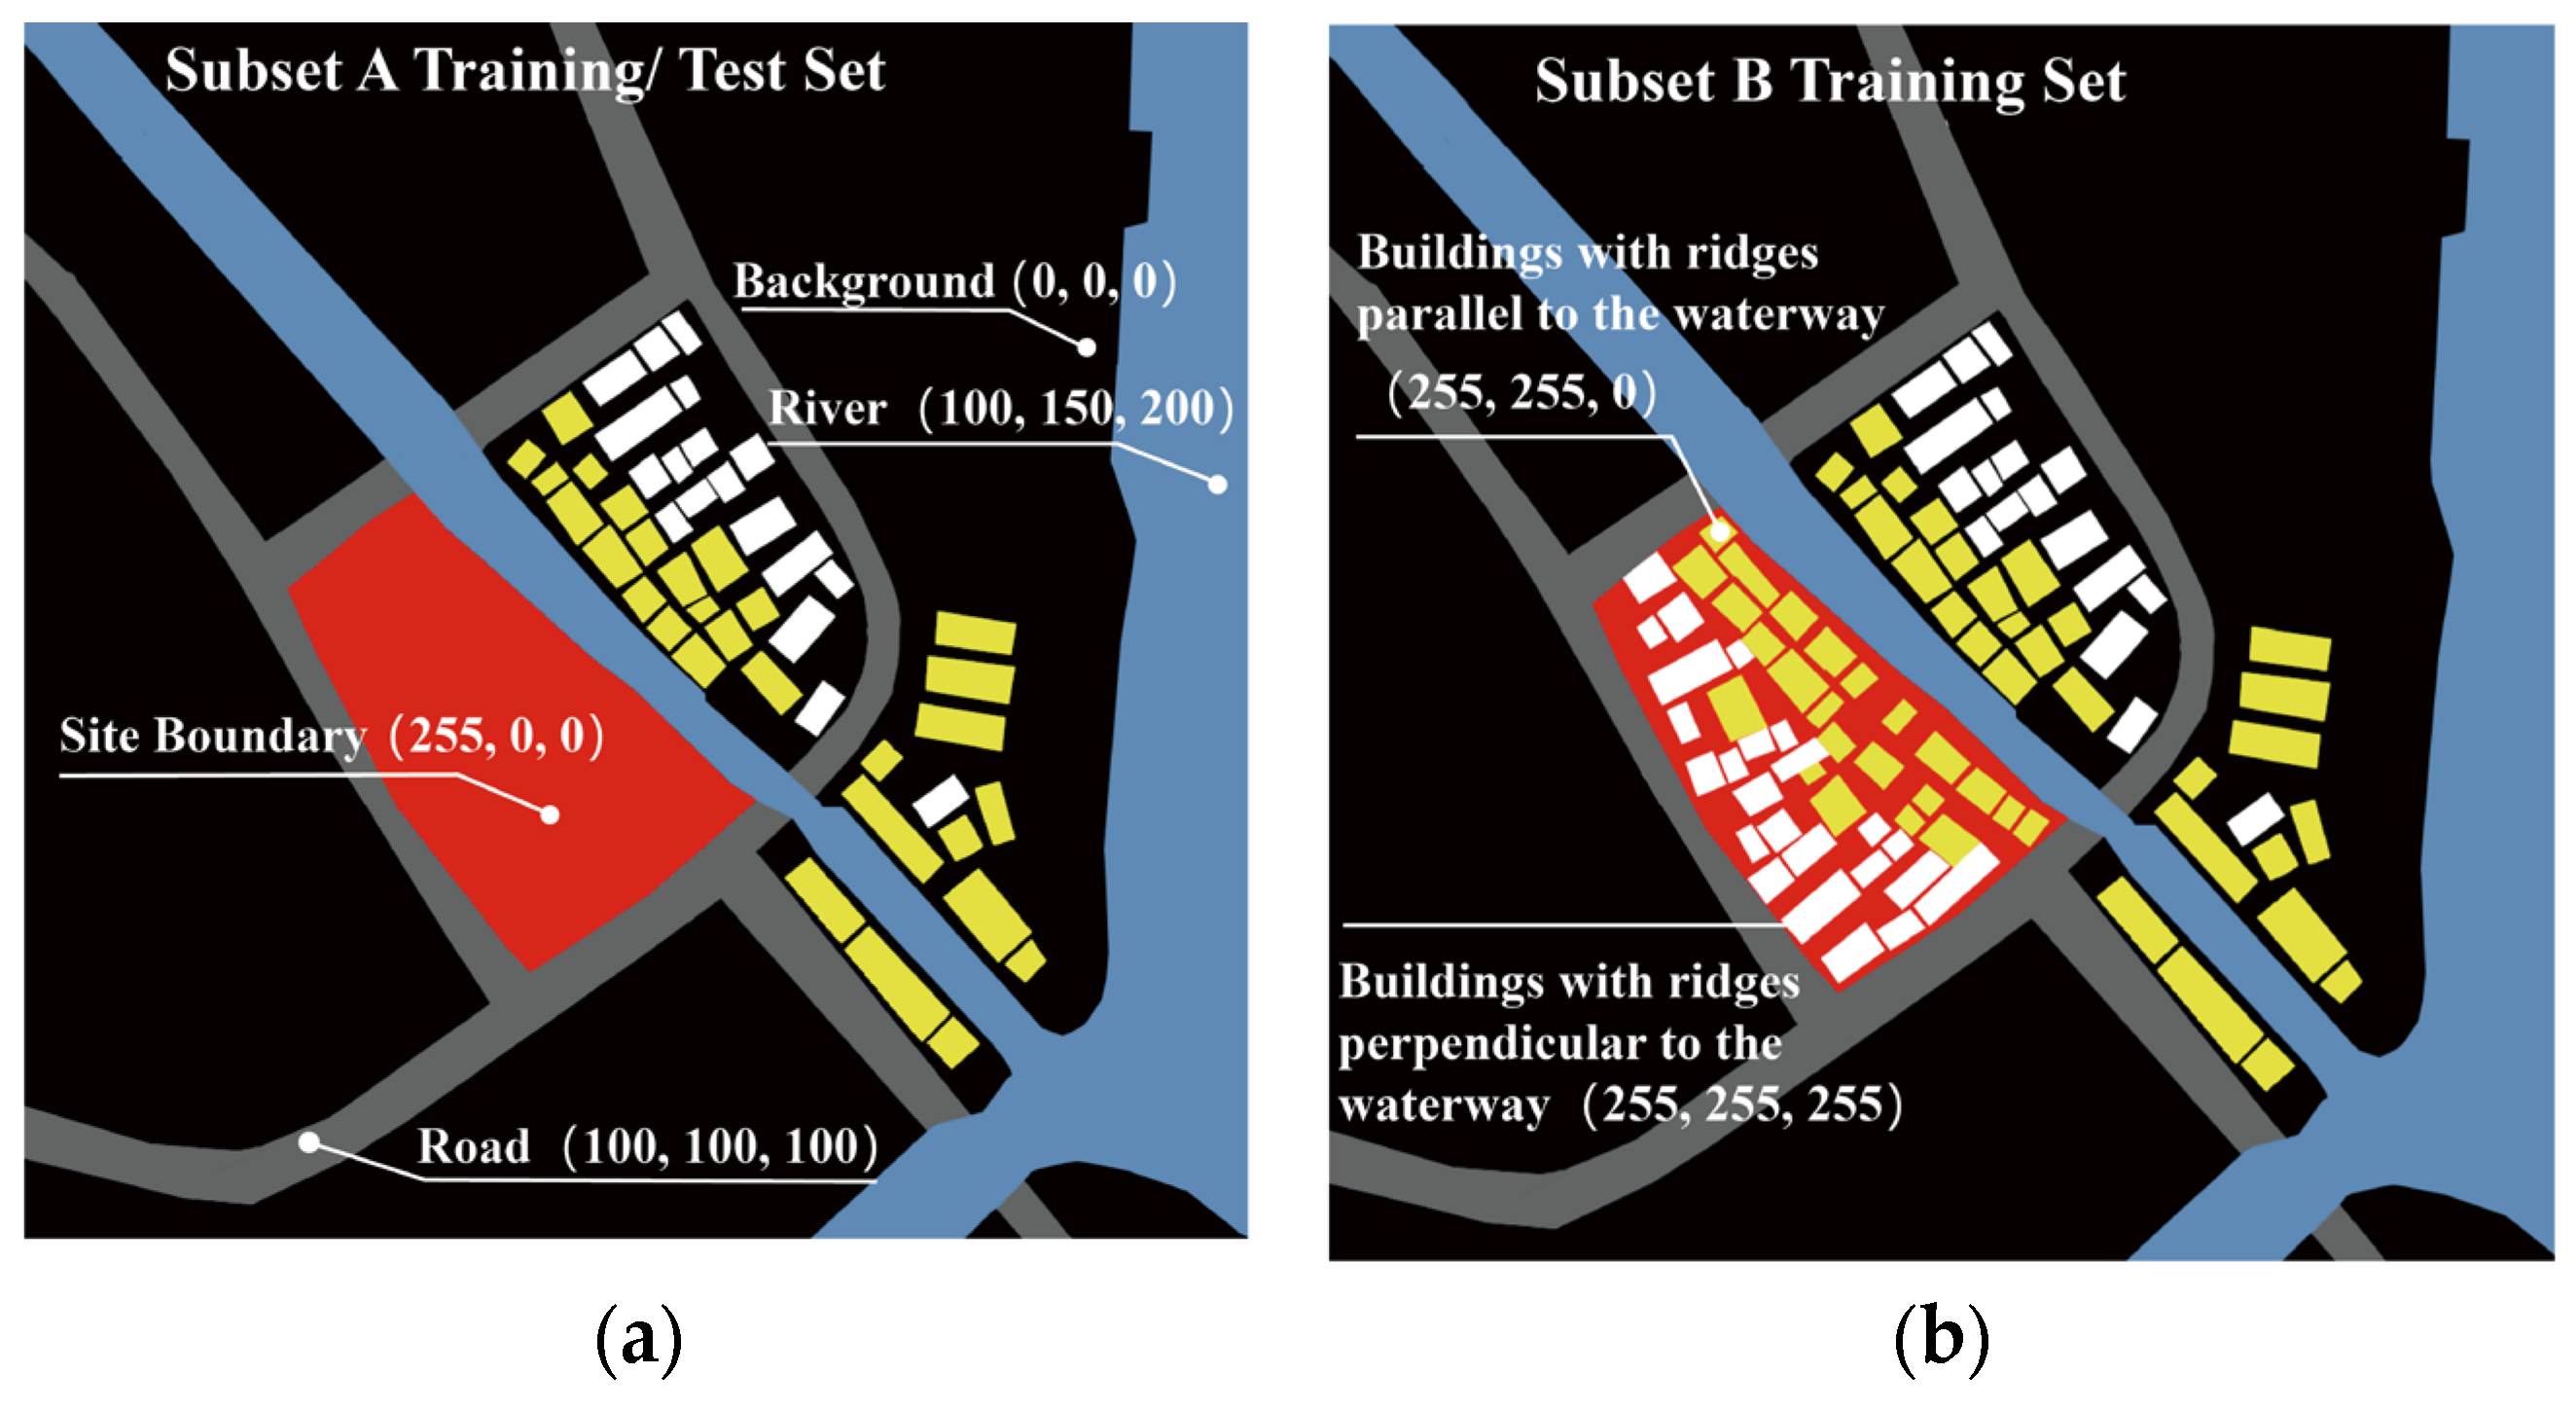
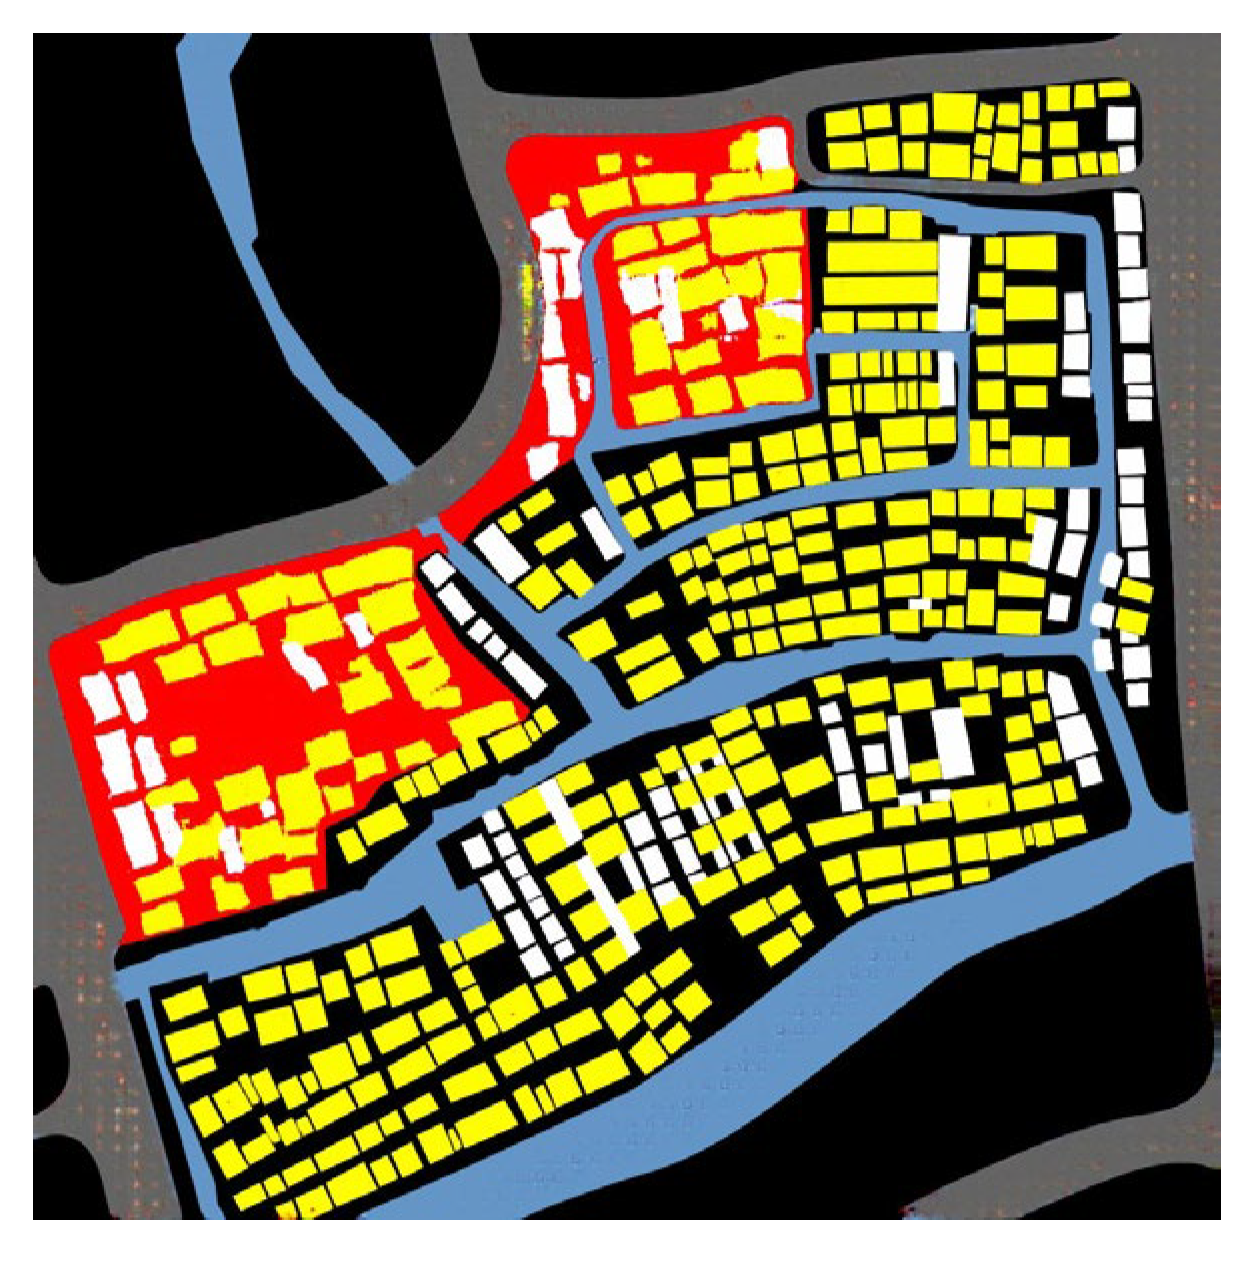
In compliance with the input specifications of the deep learning architecture, all image samples underwent standardized pre-processing (detailed in Appendix A). Images were resampled to a uniform resolution of 1024 × 1024 pixels at a cartographic scale of 1:2000, which standardizes the covered ground area to approximately 442 m × 442 m. Following standard semantic segmentation protocols, distinct spatial elements were encoded using specific Red-Green-Blue (RGB) values (Figure 2): background (0, 0, 0), land-use boundaries (255, 0, 0), waterways (100, 150, 200), street networks (100, 100, 100), buildings with ridge orientations parallel to the watercourse (255, 255, 0), and buildings with ridge orientations perpendicular to the watercourse (255, 255, 255). For each case, a paired dataset was generated for the Pix2PixHD algorithm, consisting of the Source Domain (Domain A, site constraints with existing buildings removed) and the Target Domain (Domain B, ground-truth historic urban fabric).
To enhance model generalization and reduce overfitting due to data scarcity, two data augmentation strategies were implemented: Geometric Symmetry Augmentation and Noise Injection. Horizontal flipping [26] reinforces the model’s ability to learn directional invariance in morphology, particularly relevant for the mirrored layouts commonly found in riverside architecture, while vertical flipping [27] helps better extract local fabric features by introducing top-down symmetry. Additionally, zero-mean Gaussian noise [28] was introduced to simulate potential image degradation or sensor artifacts encountered in real-world applications, compelling the model to learn more robust feature representations.
The curated dataset was split into a training set (50 cases) and a testing set (10 cases). The testing set was strictly isolated from the training process and deliberately designed to contain unseen, challenging morphologies—such as irregular water edges, highly fragmented parcels, and dead-end alley configurations—to rigorously evaluate the model’s generalization capability within the regional typology. While the raw sample size appears modest, several design choices ensure its adequacy for the generative task: first, each case contains dense spatial information with hundreds of building footprints and street segments, providing a rich supervision signal; second, the geometric symmetry augmentation expands the training set fourfold to 200 equivalent samples; third, the LoRA fine-tuning strategy leverages the strong visual priors of a large-scale pre-trained Stable Diffusion model, substantially reducing the demand for massive domain-specific data. Moreover, confining the dataset to a single coherent typology—the Jiangnan river–street fabric—limits stylistic variance and allows the model to efficiently learn deep morphological patterns, aligned with sample sizes adopted in comparable architectural generation workflows [15,17,18]. Consequently, this structured database establishes a solid foundation for efficient neural network training and reliable evaluation.

2.1.2. High-Resolution Synthesis of Historic Urban Fabric via Pix2PixHD

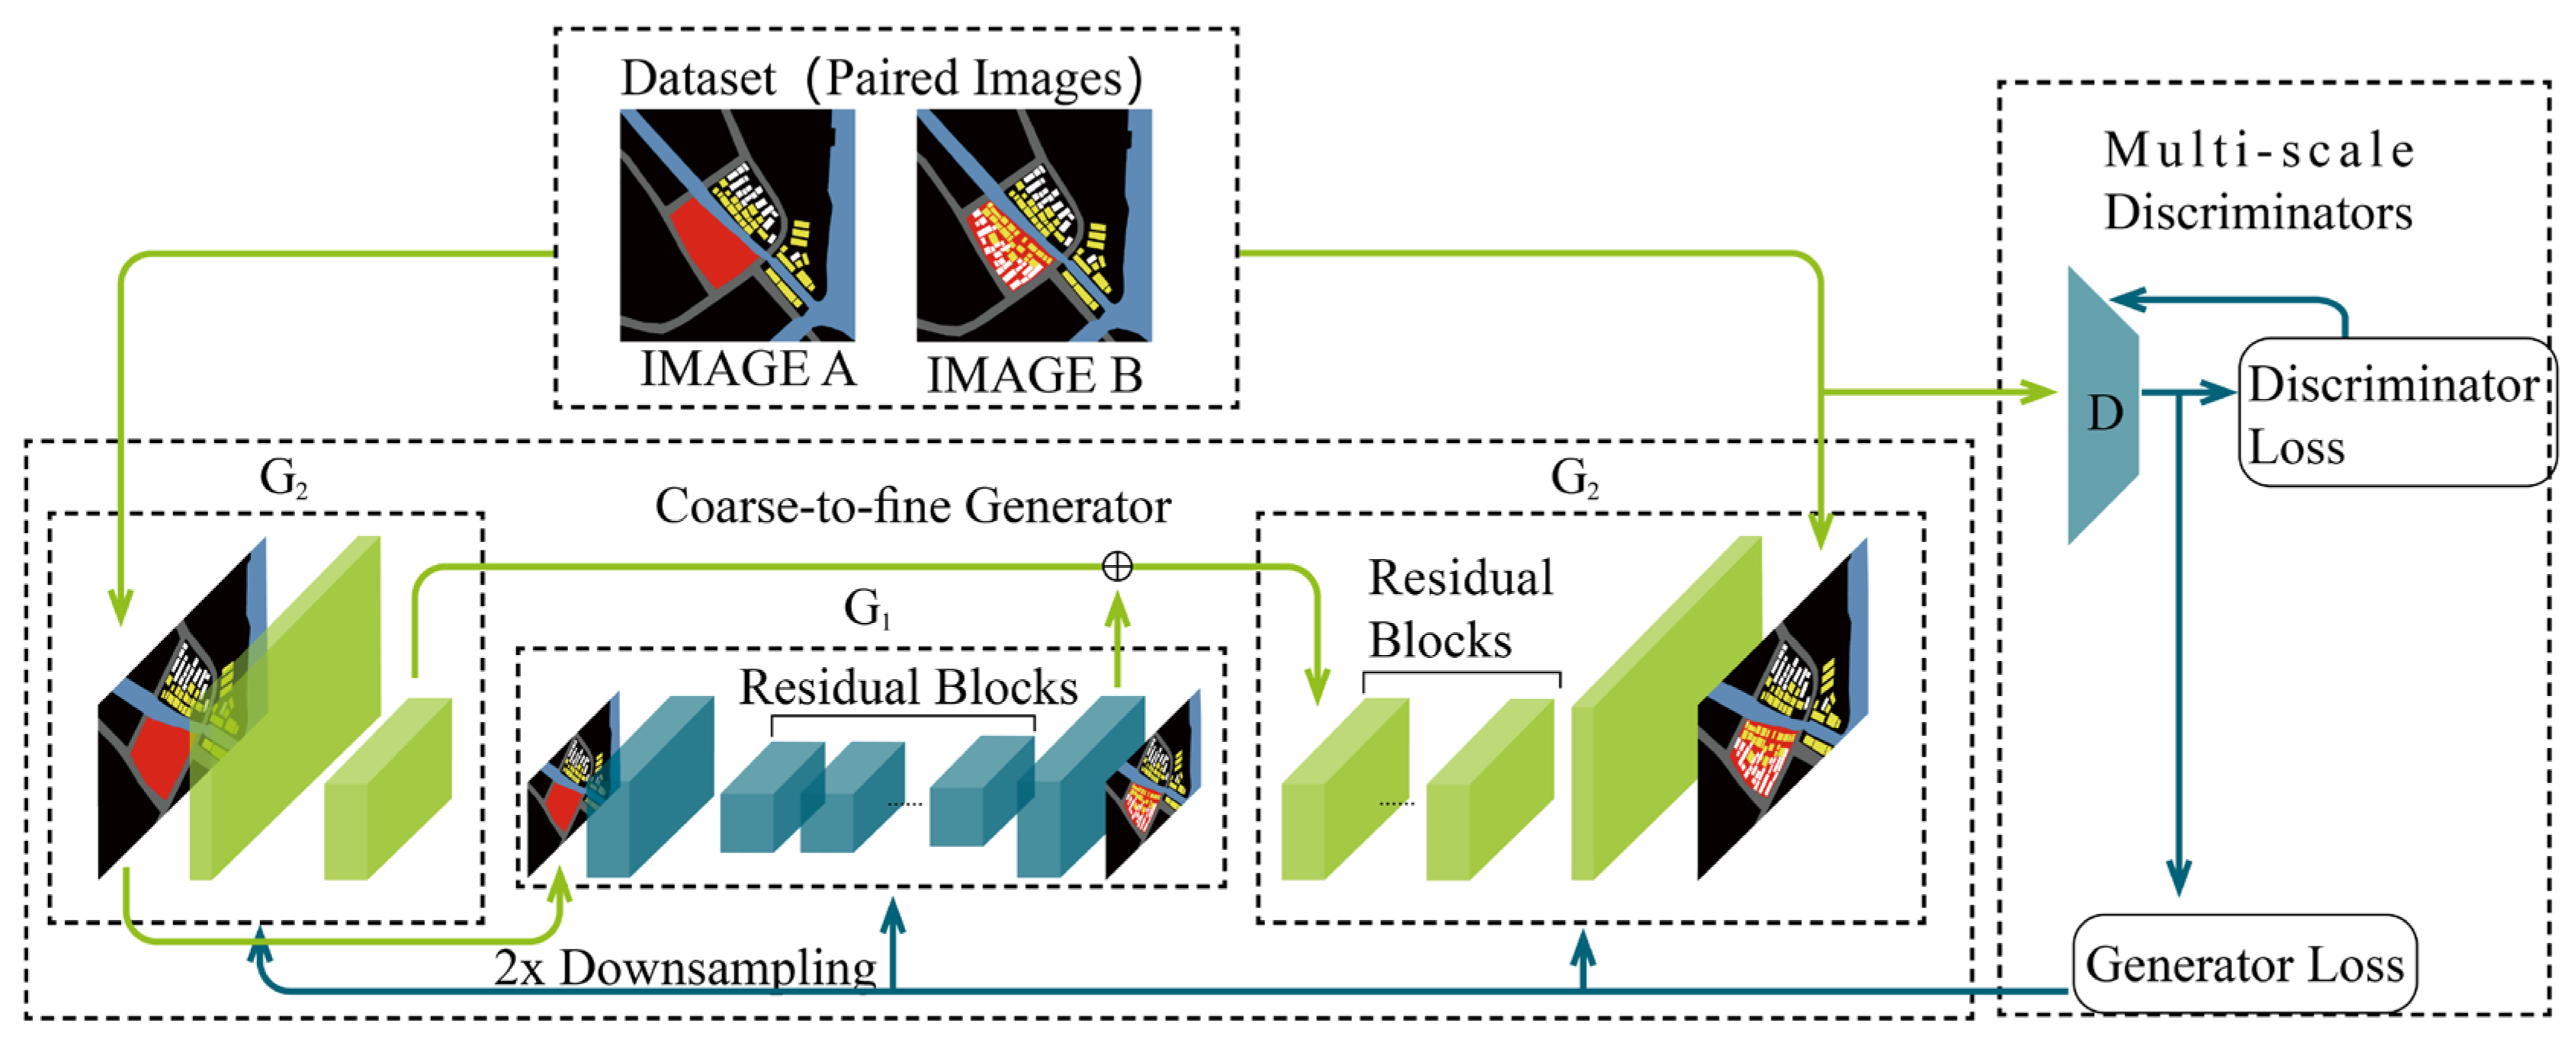
To achieve high-fidelity synthesis of historic district layouts, this study employs the Pix2PixHD model [5] as the primary generative architecture. As illustrated in Figure 3, this model utilizes an advanced Conditional Generative Adversarial Network framework optimized for high-resolution synthesis. Its primary innovation lies in the integration of a coarse-to-fine generator coupled with a multi-scale discriminator, effectively addressing challenges in detail preservation and training stability.
The generator (G) adopts a two-stage cascaded architecture G = G 1 , G 2 . The Global Generator G 1 first constructs macro-structural features at a resolution of 512 × 512. Subsequently, the Local Enhancer Network ( G 2 ) performs 4× upsampling and local refinement on the output of G 1 . By integrating global contextual information, G 2 synthesizes the final high-resolution result (e.g., 1024 × 1024), ensuring both high-frequency detail fidelity and structural consistency. Complementarily, the discriminator ( D = D 1 , D 2 , D 3 ) evaluates the input at three distinct scales to assess image authenticity across different perceptual fields.
The training process is optimized via a composite objective function:
L t o t a l   G , D k = min G max D 1 , D 2 , D 3 k L G A N G , D k + λ F M k L F M G , D k + λ V G G L V G G ( y , G )
where L G A N is the adversarial loss, which drives the synthesis to approximate the real data distribution; L F M denotes the feature matching loss, which stabilizes training by minimizing feature discrepancies within the discriminator’s intermediate layers; L V G G signifies the perceptual loss, which utilizes a pre-trained Visual Geometry Group network to constrain the semantic content in the feature space; L F M and L V G G are weighting coefficients empirically set to 10 to balance each loss term’s contribution; and y represents the ground-truth image used for training.
Ultimately, the Pix2PixHD model synthesizes high-fidelity pre-synthesized layouts for historic districts. These layouts serve as the foundational structural guidance to drive the subsequent phase of Diffusion Model-based design space expansion.

2.1.3. Diversified Layout Synthesis via Diffusion Models and LoRA

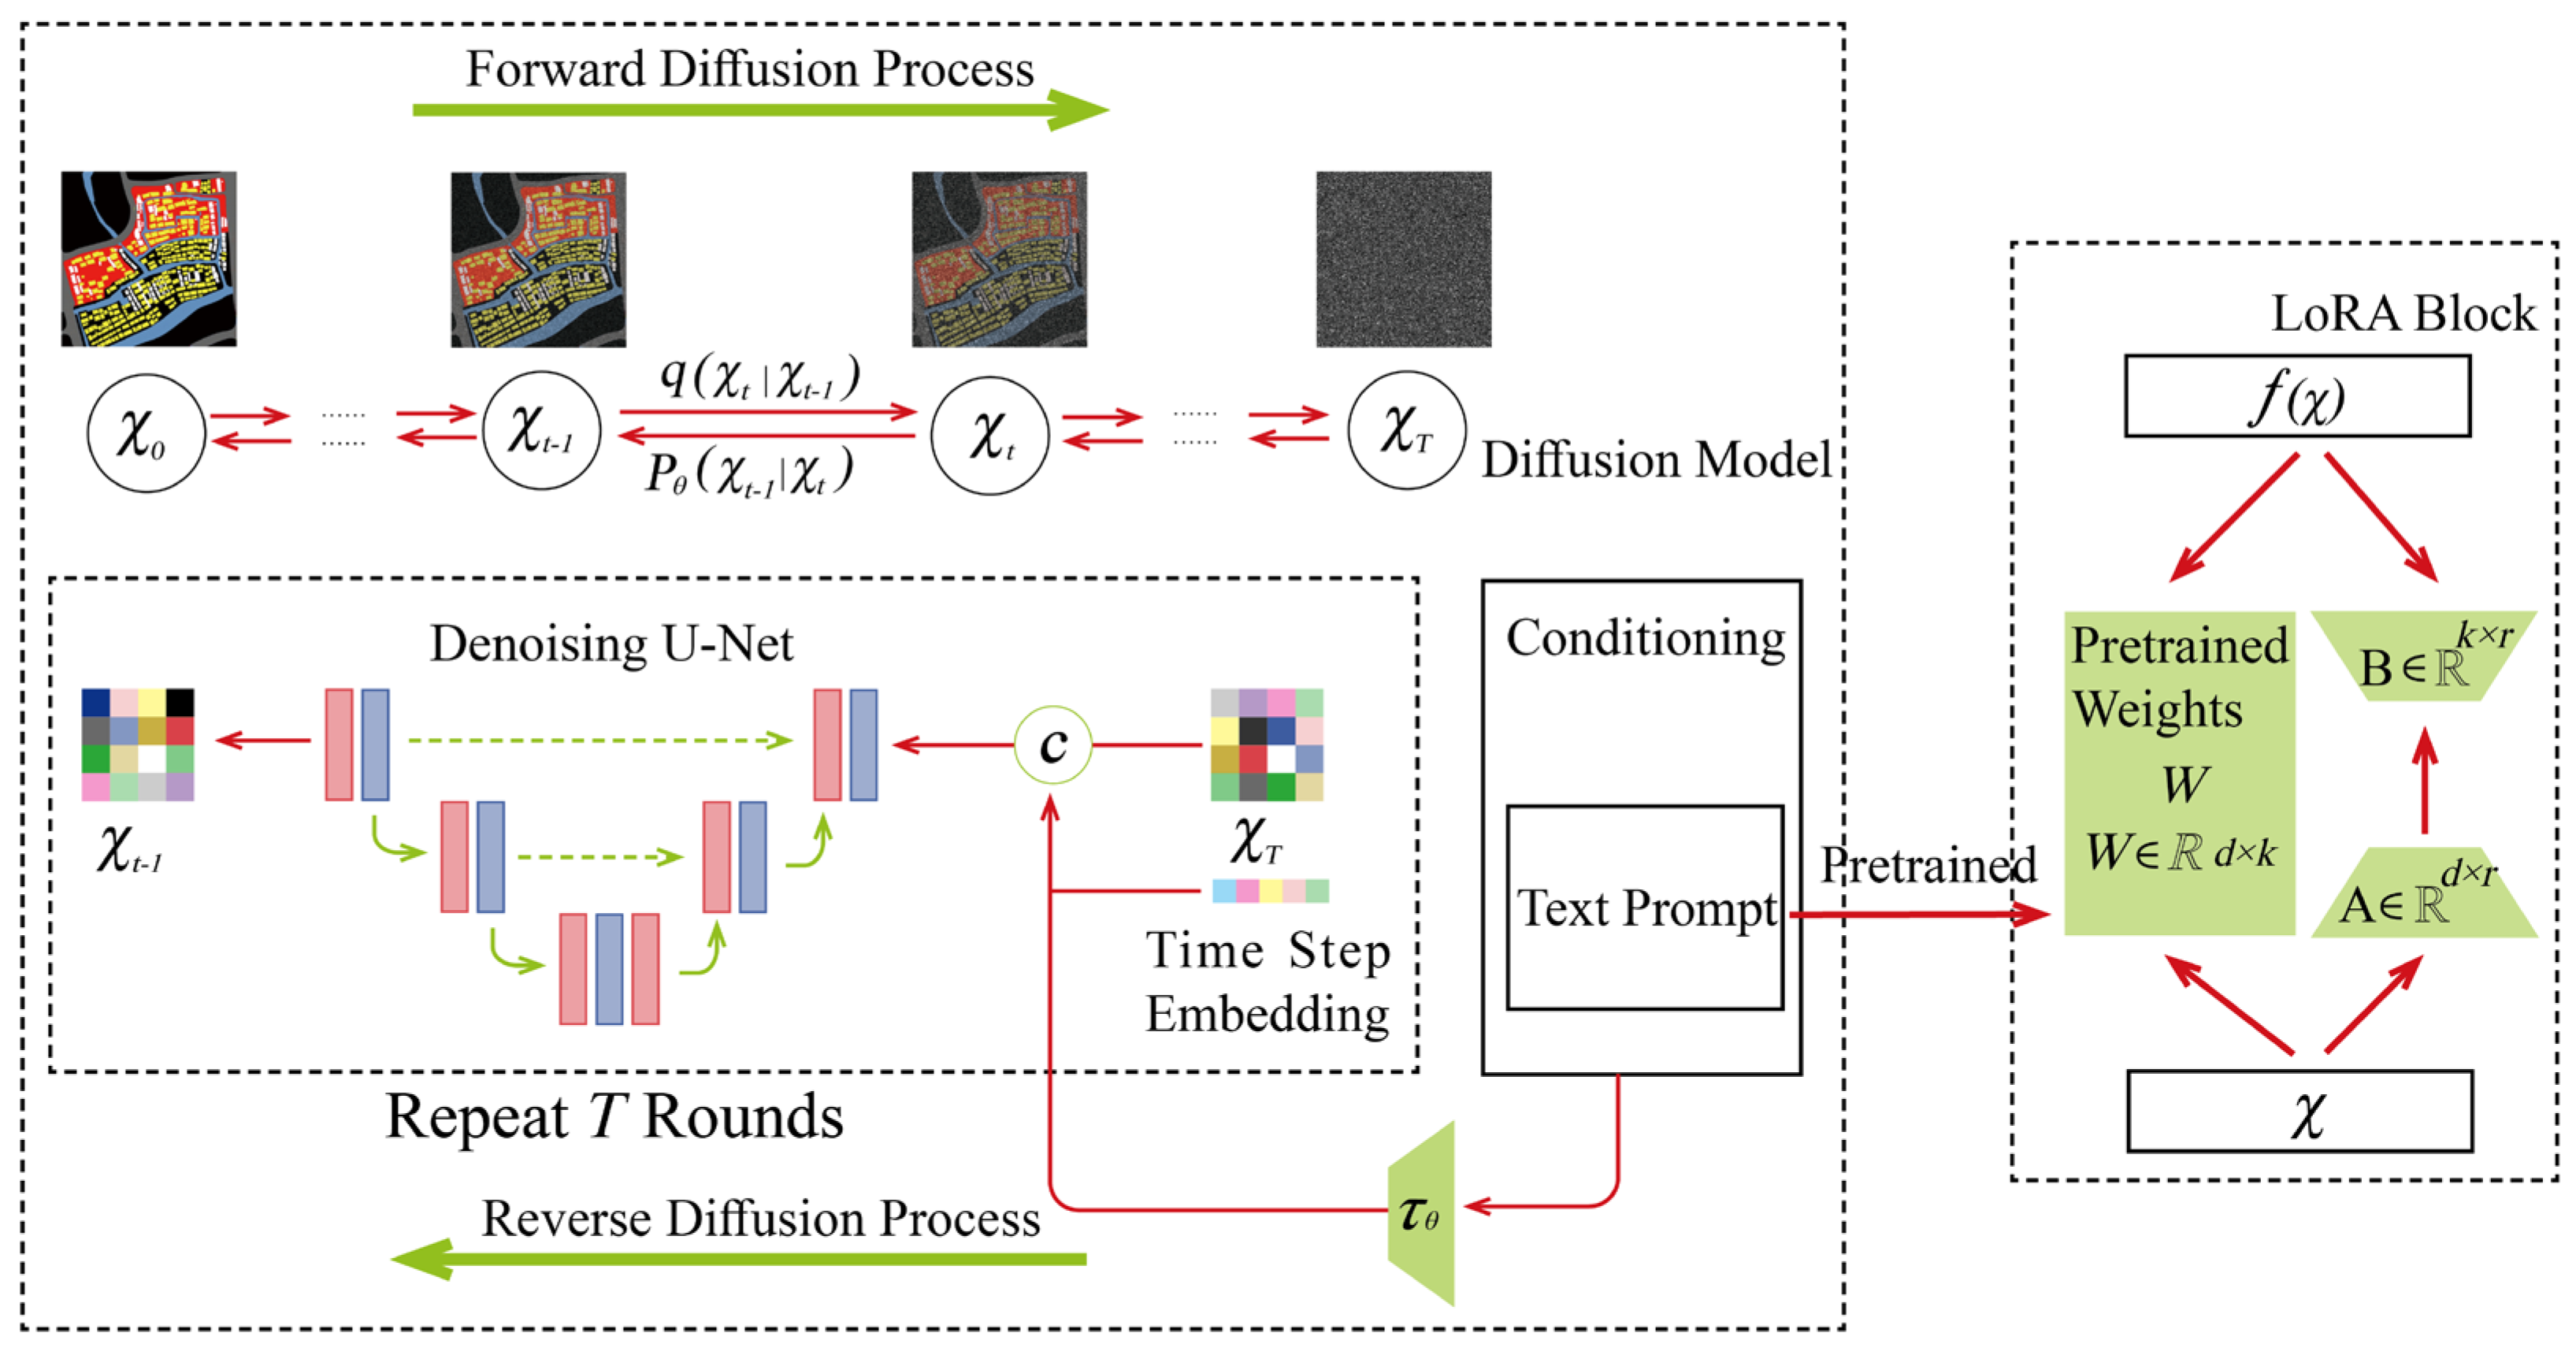
To achieve a diversified synthesis of historic district layouts (Figure 4), this study employs a Diffusion Model integrated with LoRA for efficient domain adaptation. By embedding lightweight, trainable rank-decomposition matrices into the pre-trained backbone, this approach enables rapid adaptation for generating historic urban fabrics with limited computational resources [21].
The generative mechanism is based on reversing a forward noise injection process. The forward process gradually corrupts the raw data x 0 with Gaussian noise x T N 0 , I using a fixed variance schedule β 1 , …, β t , adhering to the Markov chain property:
q x t x t 1 = N x t ; 1 β t x t 1 , β t I
Conversely, the reverse process trains a neural network ϵ θ , typically a U-Net, to iteratively reconstruct a coherent image from this noise:
p θ x t 1 x t = N x t 1 ; μ θ x t , t , Σ θ x t , t
To adapt the pre-trained model (Stable Diffusion v1.5) efficiently, this study utilizes LoRA fine-tuning. This technique approximates the weight updates Δ W using low-rank decomposition:
W = W 0 + Δ W = W 0 + B A
The training objective is to minimize the mean squared error between the predicted and the actual noise:
L L D M = E x , ε ~ N ( 0 , 1 ) , t ε ε θ x t , t , c 2 2
where x t denotes the latent representation of the fabric layout at timestep t ; ε and ε θ represent the actual added noise and the noise predicted by the U-Net, respectively; c signifies the conditional input, which, in this study, is the pre-synthesized layout from the Pix2PixHD stage; W 0 d × k is the pre-trained weight matrix, whereas B d × r and A r × k are the low-rank matrices with rank r min ( d , k ) ; and L L D M is the loss function used to optimize the LoRA parameters while preserving generative priors.
This integrated framework leverages the robustness of diffusion models for synthesizing complex topological structures while balancing computational efficiency and morphological fidelity.

2.1.4. Training and Implementation Details

The Pix2PixHD model was trained using the official PyTorch (version 2.0.1, Meta Platforms, Inc., Menlo Park, CA, USA) implementation. Training was conducted for 200 epochs with a batch size of 1, due to the high resolution of the input images. The Adam optimizer was adopted with a learning rate of 0.0002, β 1 = 0.5, and β 2 = 0.999. The loss weighting coefficients L F M and L V G G (corresponding to λ 1 and λ 2 in Equation (1)) were both set to 10. The generator followed a coarse-to-fine architecture, while the discriminator operated at three scales. A single NVIDIA GeForce RTX 4090 GPU (NVIDIA Corporation, Santa Clara, CA, USA) with 24 GB memory was used.
For the diffusion-based expansion, the pre-trained Stable Diffusion v1.5 (Stability AI, London, UK) checkpoint was fine-tuned using the Diffusers library (version 0.25.0, Hugging Face, Inc., New York, NY, USA). LoRA was applied to the attention layers of the U-Net, with rank r = 16 and alpha = 16. The model was trained for 20,000 steps, with a batch size of 4 and a learning rate of 1 × 10⁻⁴. All input images were resized to 1024 × 1024 pixels. The conditioning text prompt was: “historic water town fabric, traditional Jiangnan architecture, dense alleyways, riverside buildings”. The classifier-free guidance scale was set to 7.5. During inference, 50 denoising steps were performed using the DDIM scheduler. All LoRA experiments ran on a single NVIDIA GeForce RTX 4090 GPU with 24 GB memory.
A fixed random seed of 42 was used across all experiments to ensure reproducibility. Generated images were post-processed by thresholding the semantic colour channels to extract binary masks for buildings, streets, and water. These masks were then vectorised into GIS-ready polygon and polyline layers using standard computer vision and geospatial libraries.
The code developed for this study (Python 3.10, PyTorch 2.0.1, Diffusers 0.25.0) will be publicly released on GitHub upon acceptance. The training dataset cannot be shared due to privacy and archival restrictions. A detailed description of data sources and pre-processing is provided in Appendix A.

2.2. Evaluation Metrics and Multi-Objective Optimization Framework

Deep learning models can effectively create multiple design scenarios for historic districts, offering a variety of options for organic renewal. However, the inherent stochasticity of the generation process leads to significant variations in output quality. On one hand, the model can generate high-fidelity designs that align exceptionally well with site-specific constraints. On the other hand, it often produces a substantial number of suboptimal solutions that may suffer from poor spatial organization, a lack of coherence in the urban fabric, and issues with street network integrity. Relying exclusively on manual expert judgment to screen and assess large-scale generative datasets is not only computationally inefficient but also lacks objective, standardized evaluation criteria.
To address these challenges, this study establishes a comprehensive evaluation system that quantitatively decodes the morphological rules and spatial logic of historic districts. Grounded in empirical research on the Yuehe Historic District in Jiaxing, Zhejiang, this system facilitates automated fitness evaluation and controlled, iterative optimization of the generated outcomes. Ultimately, it constitutes a deep learning framework characterized by both precision and adaptability, providing robust technical support for the preservation and adaptive regeneration of historic district.

2.2.1. Evaluation Indicators

This study utilizes established frameworks in urban morphology and heritage conservation to identify two fundamental physical dimensions that shape the historical context and functionality of historic districts: architectural fabric and street networks [25,29]. While each of these dimensions has been extensively examined in isolation in the existing literature, their integration into a cohesive, synergistic evaluation framework tailored for deep learning-driven optimization has not been adequately addressed.
To address this gap, this study establishes a comprehensive assessment system focused on these two primary dimensions: architectural fabric and street network configuration. This system is explicitly grounded in the unique spatial characteristics and stringent conservation requirements of traditional Jiangnan water towns (traditional waterfront towns south of the Yangtze River). Furthermore, the framework is broken down into 10 specific, quantifiable performance indicators (as detailed in Table 1). This metric system aims to translate abstract, qualitative conservation needs into computable objectives compatible with Multi-Objective Optimization algorithms. Consequently, it directs the generative process towards an optimal balance between preserving the continuity of historical context and ensuring spatial rationality.
  • Architectural Fabric Dimension
This dimension encompasses five key indicators designed to assess the morphological integrity of the built form:
  • Fabric Coverage Rate [30]
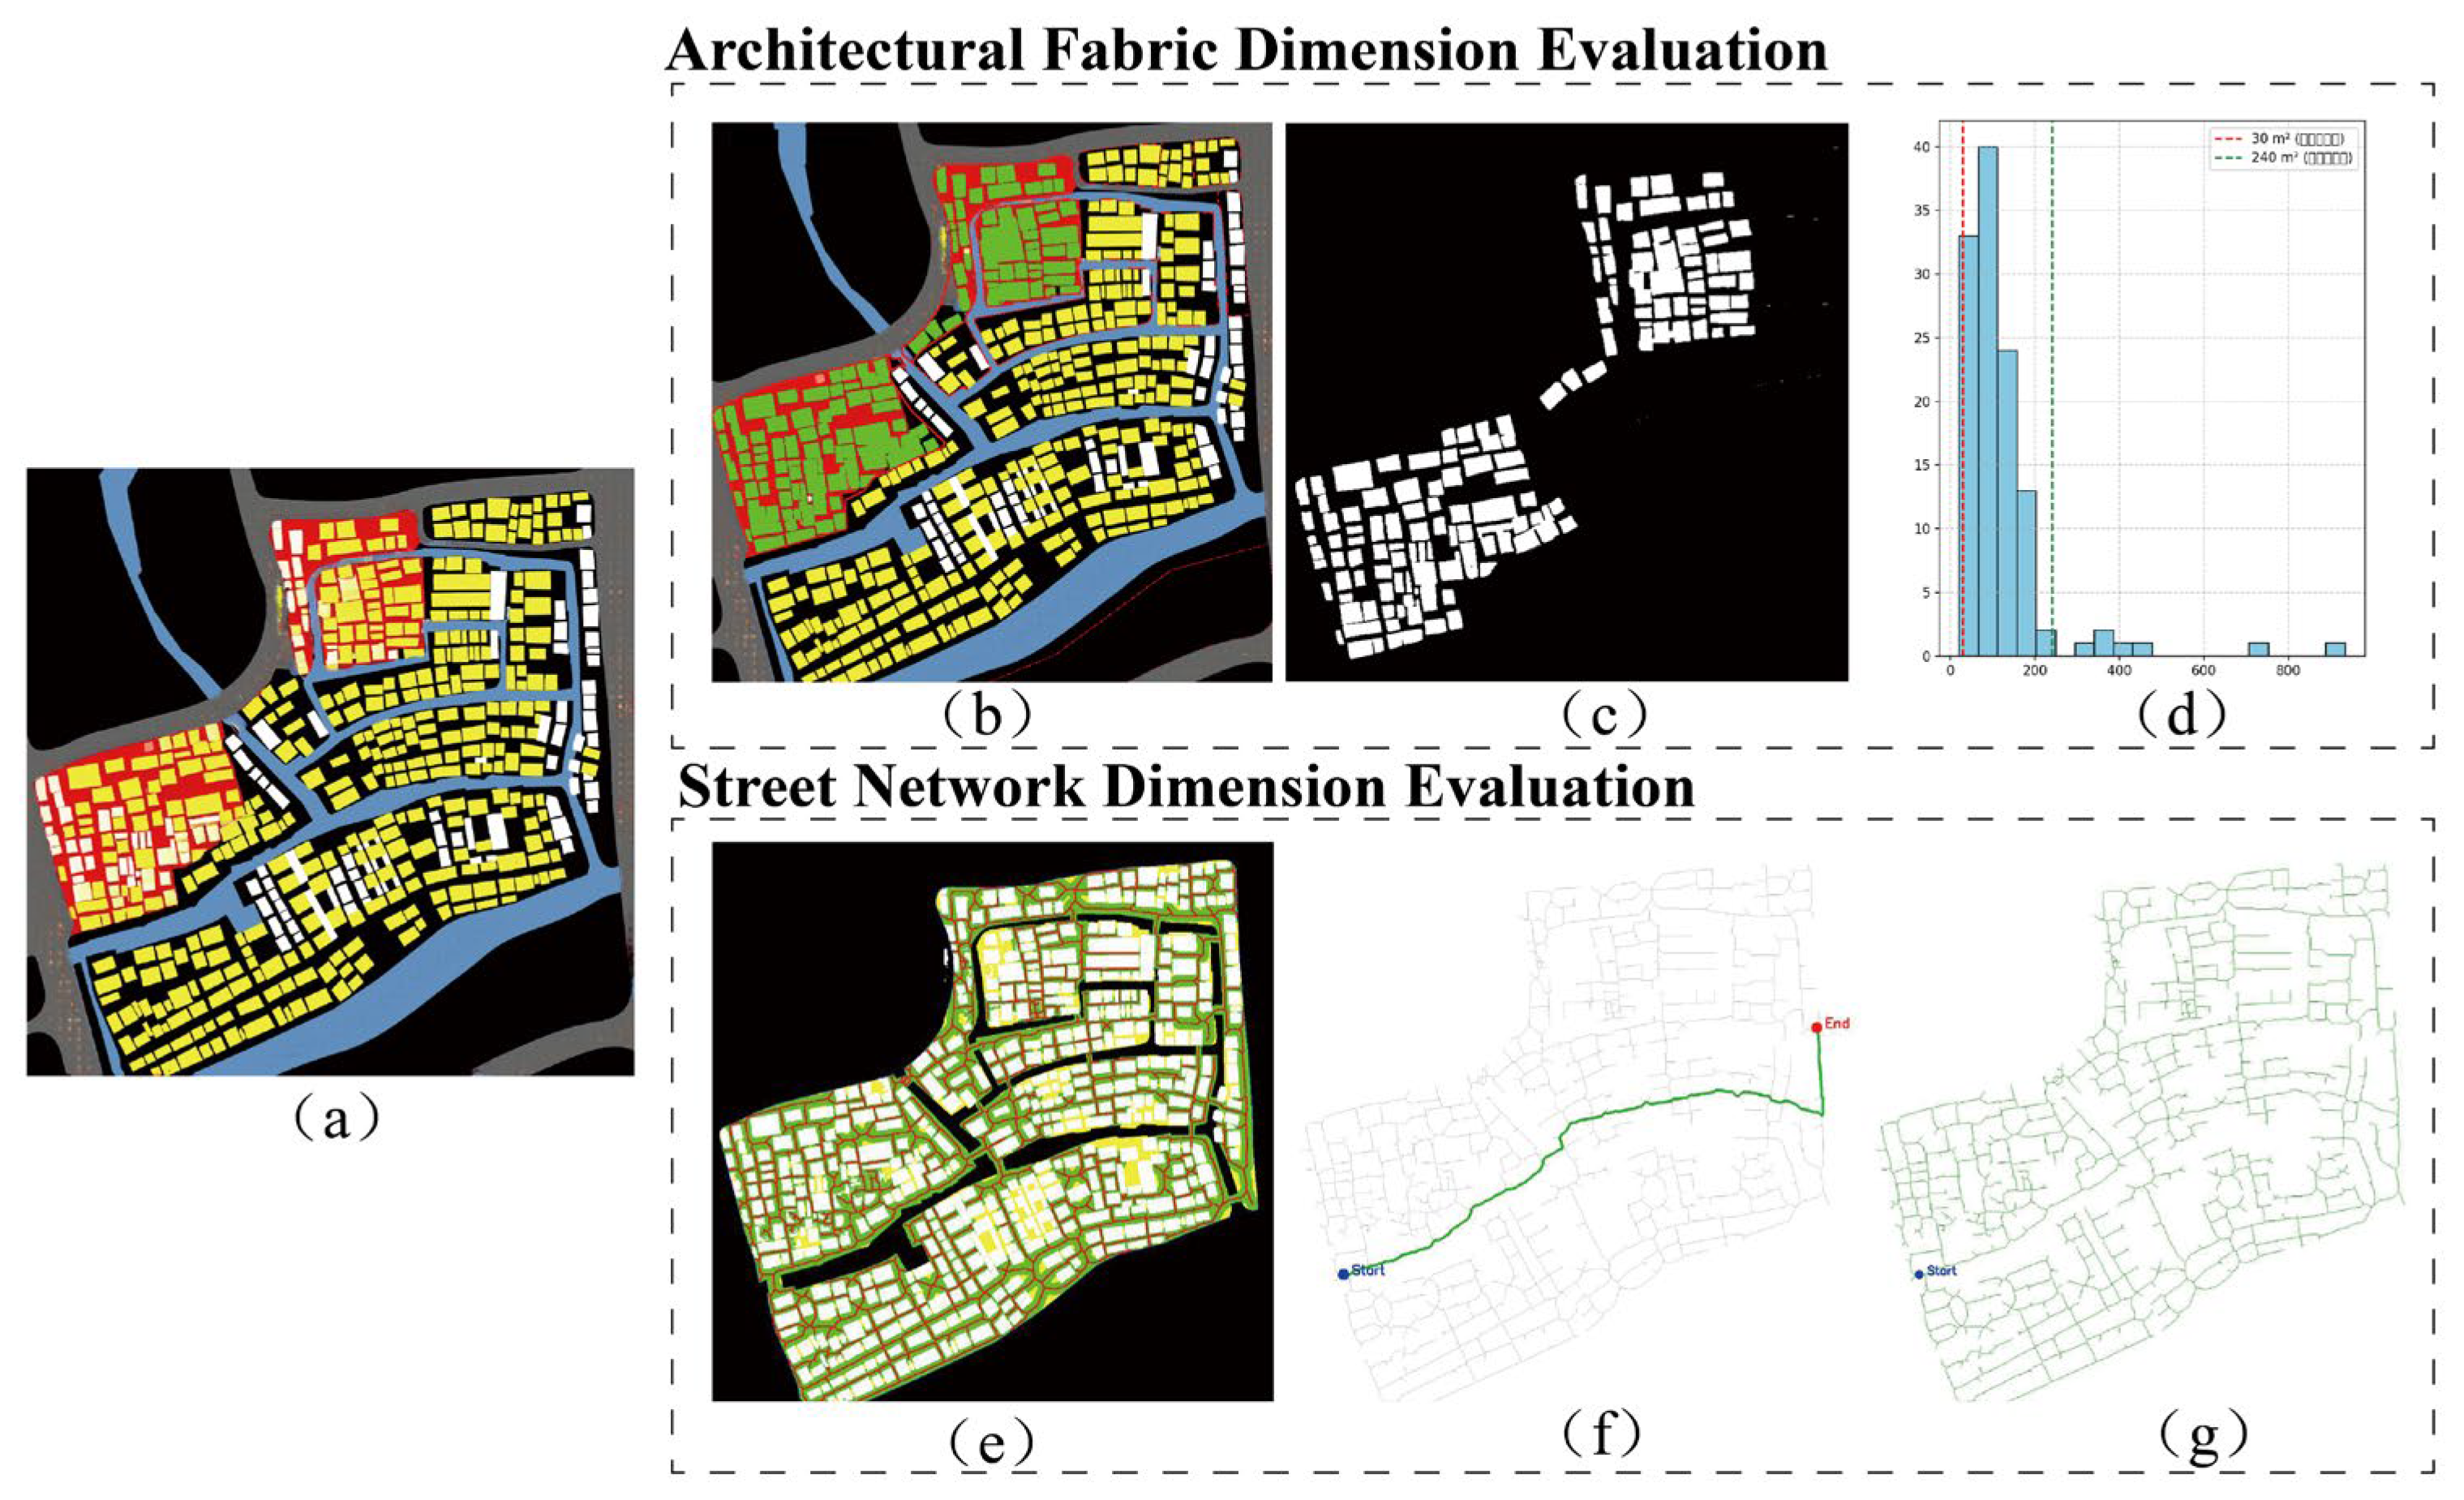
To evaluate the spatial compactness and land-use intensity of the historic district, this indicator is defined as the ratio (percentage) of the total building footprint area to the total site area. Its theoretical basis stems from the classical measurement of the Building Coverage Ratio in urban morphology, serving as a critical metric for assessing the preservation integrity of traditional building clusters and the potential intrusiveness of modern developments. In the scoring criteria, a score of 100% is awarded for values ≥ 50%. For every 5% decrease, 0.1 points are deducted. This threshold is empirically derived from systematic surveys of historic districts in the Jiangnan region and aligns with the characteristic building density of 45–55% found in traditional settlements.
A F C R = S b i S total   × 100 %
where A F C R is the Fabric Coverage Rate; S b i represents the footprint area of the i -th building unit; and S total represents the total area of the site (red line boundary).
Number of Small Fabric Units [30]
To measure the level of spatial fragmentation within the historic district, this indicator counts the total number of independent building units with a footprint of less than 30 m2. It helps to identify the distribution of fine-grained architectural elements. In historic districts, this metric reveals the remnants of traditional alleyways, ancillary structures, and courtyard layouts, enabling us to assess whether the original capillary-like spatial fabric remains intact. In the scoring system, full points are awarded for 0 units, which indicates a consolidated fabric. For each additional 5 units, 0.1 points are deducted. This penalty mechanism is designed to prevent excessive spatial fragmentation from weakening the coherence of the historic fabric.
A N S U = i = 1 n f S b i , f S b i = 1 , S b i < 30   m 2 0 , S b i 30 m 2
where A N S U is the total count of independent building units smaller than 30 m2, and S b i is the footprint area of an individual building unit i .
2.
Number of Large Fabric Units [30]
To identify large-scale volumes inconsistent with an area’s historic character, this indicator counts the total number of independent building units exceeding 240 m2. In historic district studies, this measure primarily serves to detect the introduction of incompatible, large-scale modern constructions. It provides a crucial foundation for assessing scalar conflicts with the historical environment. The scoring system begins at 0 points, with 0.1 points deducted for every additional 5 units. Its purpose is to strictly limit building volumes that do not align with the historical context.
A N L U = i = 1 n f S b i , f S b i = 1 , S b i > 240 m 2 0 , S b i 240 m 2
where A N L U is the total count of independent building units exceeding 240 m2, and S b i is the footprint area of an individual building unit i .
3.
Average Fabric Size [30,31]
To evaluate the overall scalar coordination of the built form within the historic district, this metric calculates the arithmetic mean of all building unit footprints (m2). This average reflects the area’s foundational spatial granularity. It allows comparison of scale characteristics across different historical periods and helps determine whether any modifications or additions have distorted the original morphological dimensions. In the scoring system, the maximum value is set at 120 m2, which earns full marks. For each deviation of 10 m2 from this optimal value, there is a deduction of 0.1 points. This benchmark is based on the typical scale of traditional vernacular dwellings in the Jiangnan region.
A A F S = 1 n i = 1 n S b i
where A A F S is the arithmetic mean of all building unit footprints (Mean Grain Size); n is the total number of building units within the district; and S b i is the area of building unit i .
4.
Standard Deviation of Fabric Size [30,31]
To measure the homogeneity of the historic urban fabric and its spatial rhythm, this metric measures the dispersion of building unit areas (m2). The methodology is based on statistical methods for spatial form analysis, enabling the identification of regional morphological variations. In the scoring system, the target value for full marks is set at 120 m2. For every deviation of 10 m2 from this target, there is a deduction of 0.1 points. This approach aims to maintain the district’s spatial rhythm, ensuring that architectural groups exhibit variation within a unified scale.
A S D F = 1 n i = 1 n S b i A m 2
where A S D F is the standard deviation of building footprint areas, representing morphological homogeneity, and A m is the average fabric size calculated in the previous indicator A A F S .
  • Street Network Dimension
This dimension encompasses five key indicators designed to assess the connectivity and accessibility of the spatial structure:
  • Street Network Density [29,30]
To quantify the coverage and connectivity potential of the historic district’s transportation network, this indicator calculates the total street length per unit area (m/ha). This method is based on traditional urban morphology research, which suggests that a high network density corresponds to the dense street network characteristic of historical settlements. In the scoring system, a maximum score is assigned for densities of 1000 m/ha or more. For every 100 m/ha decrease, 0.05 points are subtracted, reflecting the high-density spatial characteristics typical of Jiangnan water towns.
A S N D = L s j S h a
where A S N D is the street network density (m/ha); L s j denotes the length of the j -th street segment; and S h a denotes the total area of the study region in hectares.
2.
Minimum Cost Path [30,32]
To objectively evaluate the accessibility efficiency of the historic district, this metric uses graph-theoretic principles to analyze the shortest path length (m) between the two farthest nodes in the network. It effectively identifies connectivity barriers caused by dead-end streets and tortuous alleyways. In the scoring system, full points are awarded for distances equal to or less than the straight-line (Euclidean) distance between the primary entrances. For every additional 10 m beyond this distance, 0.1 points are deducted. This approach balances accessibility efficiency with the preservation of traditional spatial complexity.
A M C P = min j P u v l j
where A M C P is the shortest path length between the two most distant nodes u and v in the network, and l j represents the length of the individual segments j that constitute path P u v .
3.
Spatio-Temporal Accessibility [30,32,33]
To evaluate the walkability and human-scale design of the historic district, this metric uses time geography as its theoretical foundation. It measures the percentage of street areas that are accessible within a defined walking timeframe (e.g., 2 h). This method effectively evaluates how conveniently residents and visitors can reach service facilities and cultural attractions. In the scoring system, the percentage value is normalized to a score ranging from 0 to 1, highlighting the pedestrian-oriented spatial character of historic districts.
A S T A = N reachable   N total   × 100 %
where A S T A is the percentage of the street area or nodes accessible within the defined walking timeframe (e.g., 2 h); N reachable is the number of nodes reachable within the time threshold; and N total is the total set of nodes within the network.
4.
Average Street Width [30,31]
To identify instances of inappropriate widening of historic streets and alleys for modern traffic demands, this indicator calculates the arithmetic mean (m) of all street widths. This calculation reflects the overall spatial scale of the streetscape and is vital for preserving the original spatial proportions, specifically the Distance/Height ratio, in historic districts. The scoring standard sets 6 m as the optimal width for full points. Widths of 10 m receive 0 points, with a linear decrease in points for widths between 6 m and 10 m. This range aligns perfectly with the typical scale of traditional streets and alleys.
A A S W = 1 m k = 1 m w k
where A A S W is the arithmetic mean of all street widths; w k represents the width of the k -th street segment; and m is the total number of street segments.
5.
Standard Deviation of Street Width [30,31]
To capture the spatial heterogeneity of the streetscape within the historic district, this metric assesses the statistical dispersion of street widths (m). A lower standard deviation generally indicates well-planned, well-preserved traditional grids. The scoring system assigns 2 m for full points and 6 m for zero points, with a linear scale in between. This approach aims to balance street uniformity with organic diversity.
A S D W = 1 m k = 1 m w k A w 2
where A S D W is the standard deviation of street widths, reflecting spatial heterogeneity; and A w is the average street width calculated in the previous indicator A A S W .
A pool of candidate indicators was first identified from the literature on urban morphology and heritage conservation. Each indicator was assessed for importance, sensitivity, and measurability. A structured expert consultation questionnaire was then developed.
A panel of 20 experts was invited. The selection followed three criteria:
  • A minimum of three years of professional experience in historic district conservation, urban design, or related fields;
  • An intermediate or senior professional title;
  • Direct involvement in at least one historic district project or published research in a relevant area.
The panel included architects, urban morphologists, municipal planning officials, and heritage managers, ensuring representation from both academic and practice-oriented perspectives.
Two rounds of consultation were conducted. In the first round, each expert received a questionnaire containing all candidate indicators with their definitions, measurement formulas, and scoring criteria. Experts rated each indicator on a 1–5 scale (1 = not important, 5 = extremely important) and provided written justifications for their ratings. The completed questionnaires were collected, and the mean scores, coefficients of variation, and all written comments were compiled.
In the second round, the aggregated results were returned to the panel. Each expert received a summary that included the group mean score for each indicator and the anonymized written justifications from the first round. Experts were asked to review the feedback and revise their initial ratings where appropriate. In this round, experts also completed pairwise comparisons between indicators to support the subsequent weight derivation.
Both rounds achieved a 95% response rate (19 valid questionnaires each), indicating high expert positivity. Expert concentration was assessed by the mean score and the proportion of full marks for each indicator, which showed clear differentiation among the indicators.
The Kendall’s W coefficient of concordance was 0.84 (p < 0.001), showing strong consensus among the experts. Internal consistency reliability was high, with Cronbach’s alpha exceeding 0.90 for both the architectural fabric and street network dimensions. The item-level content validity index (I-CVI) ranged from 0.85 to 1.00, and the overall scale-level CVI was 0.94, confirming the relevance of all ten indicators. Indicators with a mean importance score below 4.0 or a coefficient of variation above 0.25 were considered for removal or revision. Ratings of 4 or 5 were considered relevant for the calculation of I-CVI.
Several written justifications provided insight into the experts’ reasoning. One architect noted that “the Standard Deviation of Fabric Size is particularly useful for distinguishing between organically evolved historic fabric and uniform modern redevelopment.” A heritage manager commented that “Spatio-Temporal Accessibility reflects the pedestrian-oriented character of historic districts and should carry substantial weight.” A municipal planning official remarked that “the penalty mechanism for Large Fabric Units is well-designed, as oversized modern buildings are among the most disruptive elements in historic contexts.” These comments supported the final indicator selection and confirmed that the evaluation framework captured the key concerns of historic district renewal.
Final weights were derived using the Analytic Hierarchy Process (AHP), based on the pairwise comparisons collected in the second round. Two comparison matrices were constructed: one for the five indicators within the architectural fabric dimension and one for the five indicators within the street network dimension. A separate comparison between the two dimensions determined their relative importance. Experts used Saaty’s 1–9 scale for all pairwise comparisons. The individual judgments were aggregated using the geometric mean method. The consistency ratio was checked for each matrix and found to be below 0.10, indicating acceptable consistency. The resulting weight set is shown in Table 1.

2.2.2. Multi-Objective Optimization Framework

To thoroughly evaluate the performance of the generated historic urban fabric, this study establishes a systematic Multi-Objective Optimization framework. The main goal of the framework is to achieve synergistic optimization by balancing architectural morphology and street network efficiency through iterative evolutionary screening.
  • Fitness Function Formulation
The design selection problem is formulated as a multi-objective optimization. Because the expert panel produced a clear, consensual set of trade-off preferences, the problem is scalarized into a single fitness function using the weighted-sum method:
F ( X ) = i = 1 n w i f ¯ i ( X )
where X represents a candidate design solution generated by the Pix2PixHD-LoRA hybrid model; n denotes the total number of morphological indicators, which is set at 10; and f ¯ i ( X ) [ 0 , 1 ] refers to the normalized score of the i -th indicator, ensuring that each metric’s maximum contribution is limited to 1; w i is the weight from Table 1 (sum of w i = 1).
  • Evolutionary Operations and Convergence
The optimization process begins with an initial population of 100 candidate solutions. Each iterative generation carries out the following core operations:
  • Elitism and Selection: The algorithm ranks the population in detail. An elite retention strategy selects and advances the top-performing solutions directly to the next generation, preserving optimal genetic traits.
  • Stochastic Variation: Using the elite phenotypes, new candidate solutions are synthesized via genetic operators such as crossover and mutation. This introduces morphological innovation and maintains diversity within the population.
  • Convergence Criteria: To ensure computational efficiency, the algorithm monitors the relative fitness gain over a sliding window of three consecutive generations. The process concludes when the improvement rate falls below a predetermined threshold, τ = 0.01 (1%), indicating that the system has reached stochastic stabilization.

2.3. Case Study

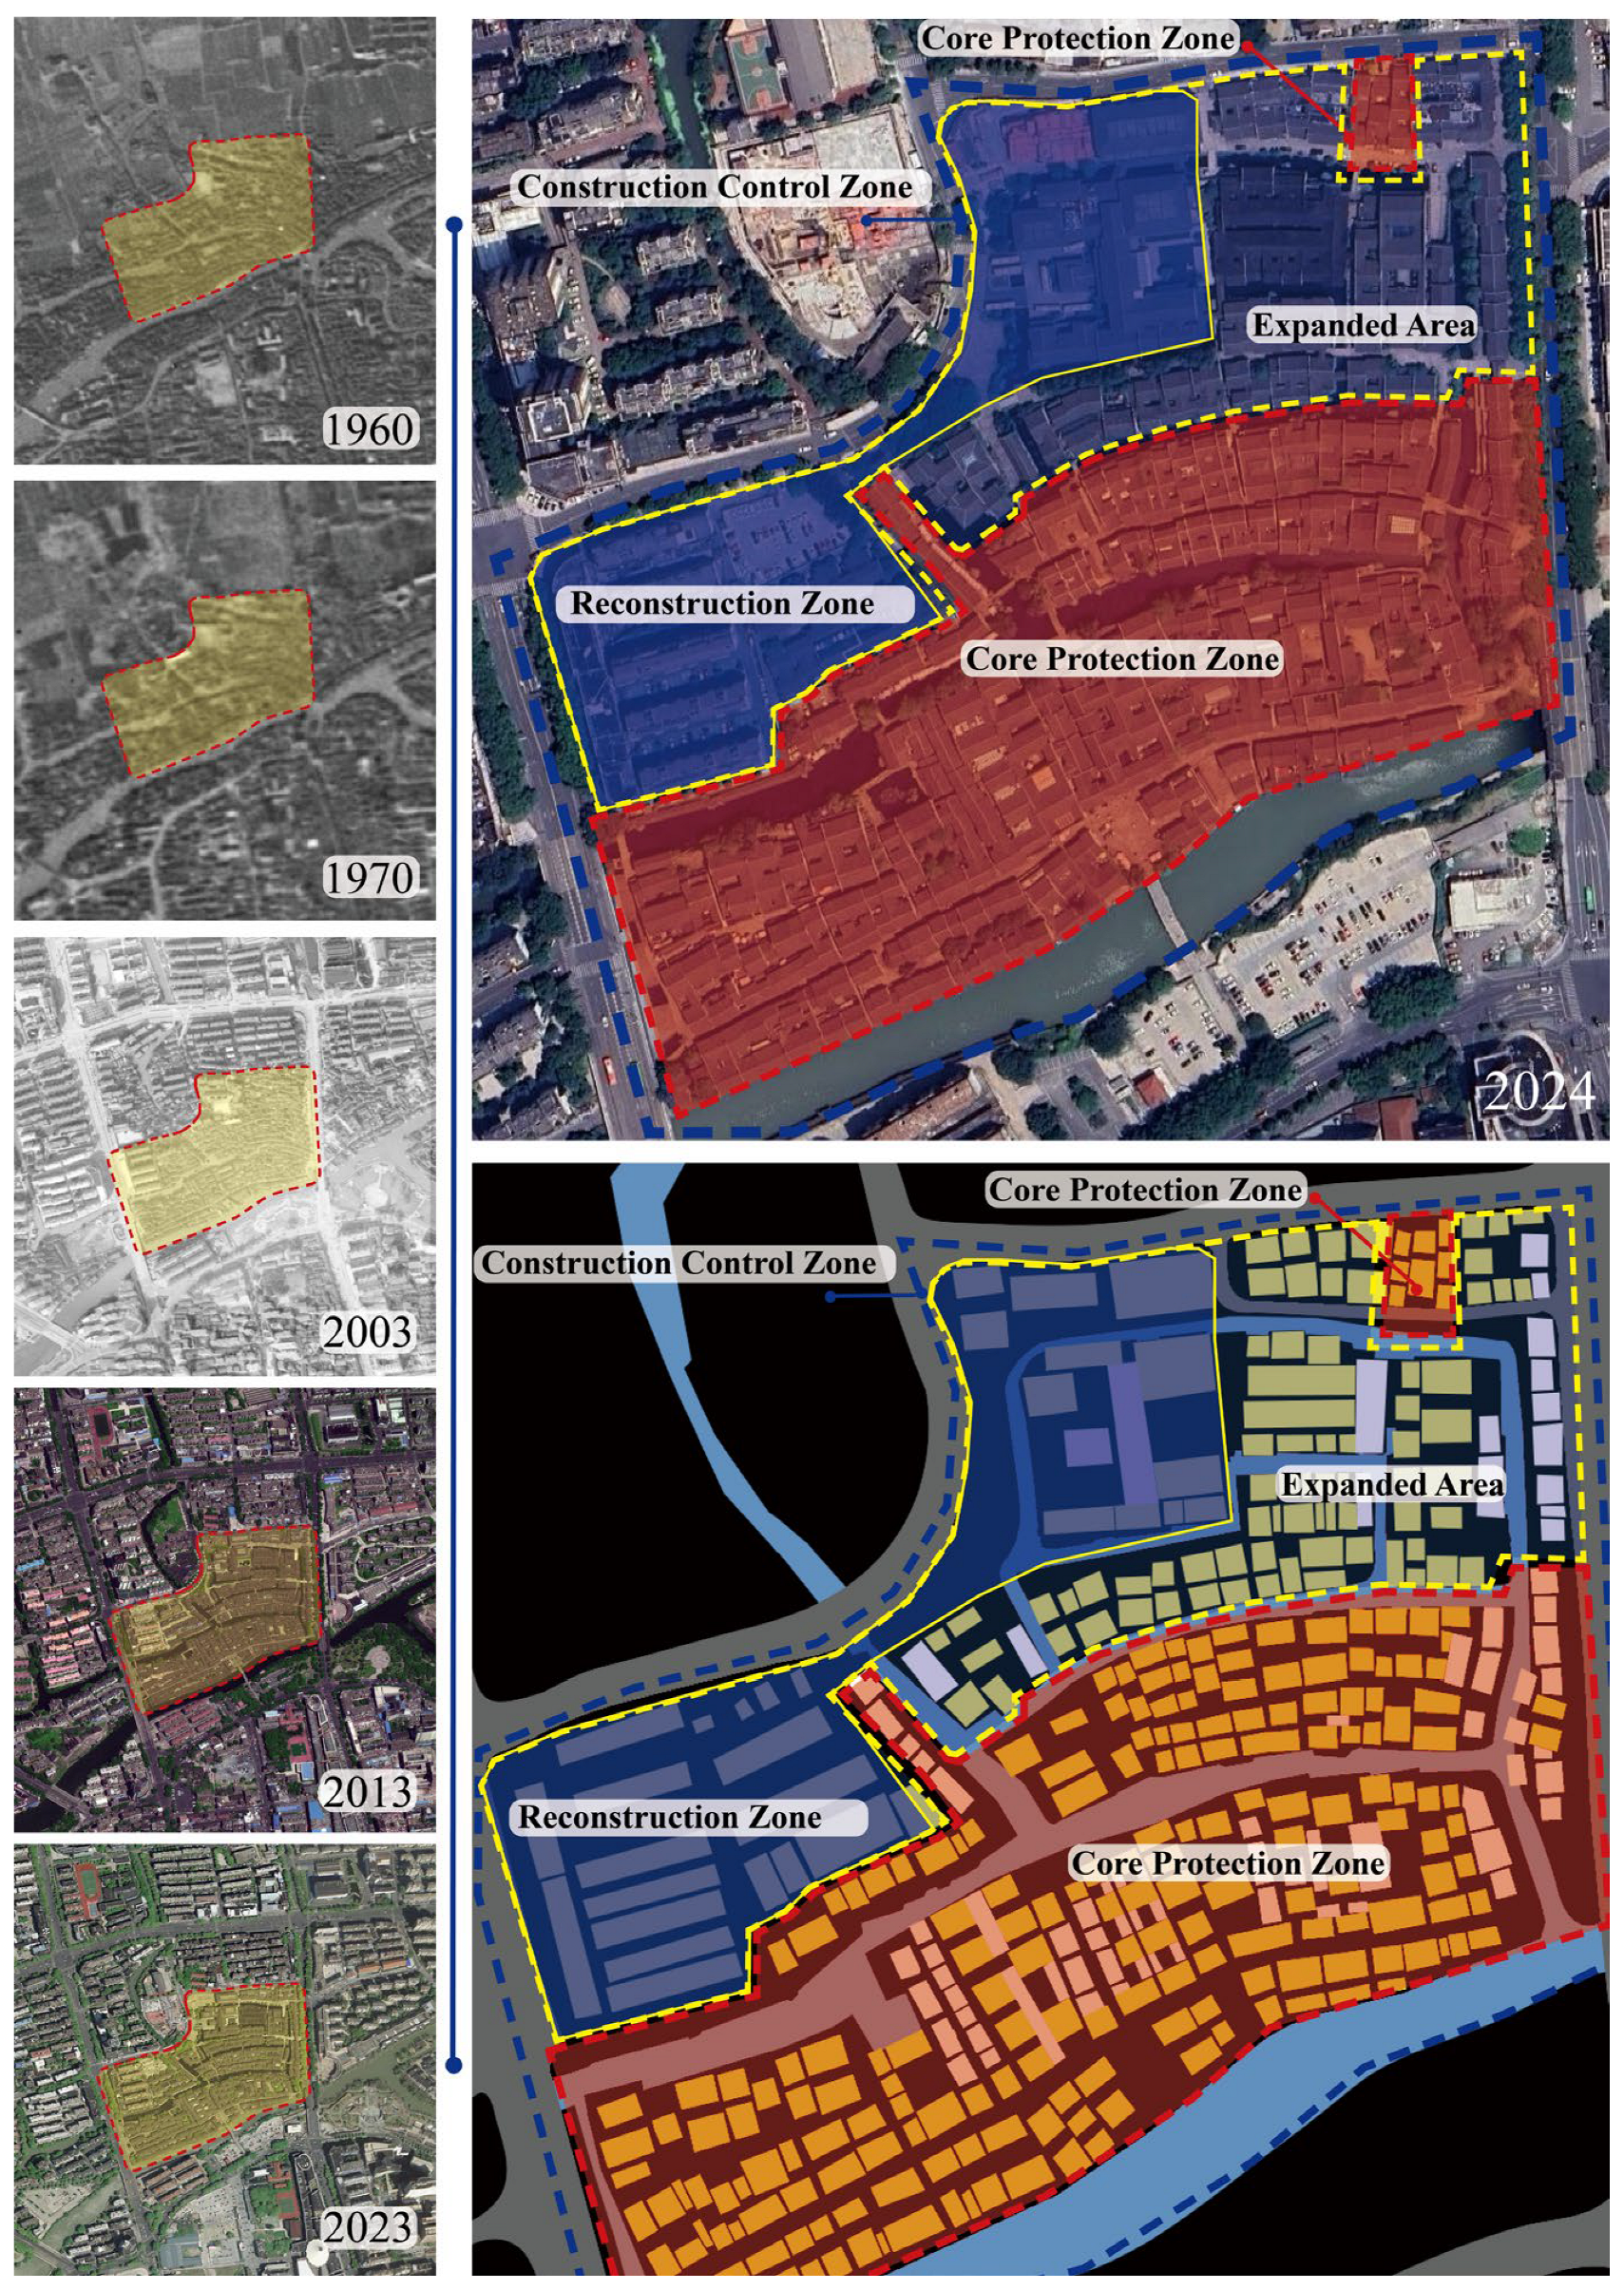
This study utilizes the principle of theoretical sampling, focusing on the Yuehe Historic District in Jiaxing, Zhejiang, China, as its empirical case. The selection of this case is based on its dual representativeness. First, it serves as a typical example of a traditional Historic District in the Jiangnan water towns, featuring an intact spatial layout, well-preserved architecture, and a unique fabric of streets formed by water and markets shaped by rivers. This makes it an ideal spatial paradigm for research. Second, the district currently faces significant fabric decay, including fabric fragmentation, scale imbalance, and landscape disconnection. This scenario is a critical illustrative case that highlights the universal contradictions involved in preserving and developing historic districts amid rapid urbanization. By conducting an in-depth examination of this case, we aim to effectively validate the proposed methodology and uncover the intrinsic patterns that govern the evolution and preservation of the historic district’s fabric. This will provide a solid empirical foundation for developing related theoretical frameworks.
The specific spatial scope of the empirical study is outlined in Figure 5. Within Jiaxing City’s regulatory planning framework, this area is designated as a Construction Control Area rather than a highly restrictive Core Protection Area. This classification strategically positions the site as a critical transitional area for our research. Situated at the intersection of heritage conservation and urban development, the area confronts the common and urgent practical challenges in harmonizing architectural character and integrating the urban fabric. Consequently, selecting this district for empirical analysis robustly validates the applicability and operational efficacy of the proposed methodology in addressing complex real-world contradictions.

3. Results

3.1. Comparative Evaluation of the Original Area, Expanded Area, and Optimal Generative Scheme

This study adopted an experimental approach to progressive fabric generation, focusing on the Construction Control Area of the Yuehe Historic District in Jiaxing. The workflow began with the Pix2PixHD network, which produced a high-precision initial morphological layout. A LoRA-tuned diffusion model was then applied to expand the solution space, generating 100 morphologically diverse candidates. Finally, a Multi-Objective Optimization algorithm iteratively enhanced each scheme. The optimization aimed to improve spatial performance while preserving the continuity of the historical urban context.
Before the comparative evaluation, a 5-fold cross-validation was performed on the 50 training cases to assess the stability of the generation and evaluation pipeline. In each fold, the Pix2PixHD-LoRA model was trained on four subsets and used to generate 100 candidate schemes for the held-out validation subset. All schemes were evaluated using the weighted comprehensive score. Across the five folds, the comprehensive scores ranged from 0.83 to 0.85, with a mean of 0.84 and a standard deviation below 0.02. These small variations indicate that model performance does not depend strongly on a specific data split, which confirms the stability of the evaluation framework.
Based on this stable model, the optimal candidate scheme (GAopt), which achieved a comprehensive score of 9.16, was selected from the optimization results (Figure 6). A tripartite quantitative comparison was then conducted among GAopt, the Original Area, and the existing Expanded Area (Table 2).
In the context of architectural fabric logic, the quantitative results precisely identify the degradation of historical morphological integrity caused by the existing Expanded Area while also showcasing the significant advantages of deep learning-driven reconstruction. Morphological measurements indicate that, while the Expanded Area attempts to replicate traditional scales, with a score of 0.98 for the Number of Small Fabric Units, its score for Standard Deviation of Fabric Size drops to 0. This indicates that the redevelopment in the Expanded Area adopted a highly repetitive, uniform modular building system, leading to a loss of the organic character associated with natural historical growth. In contrast, the optimal scheme, GAopt, achieved a score of 0.99 in Standard Deviation of Fabric Size. This not only corrects the rigidity present in the Expanded Area but also exceeds the original average level of the Original Area (0.74). This shows that the coupled Pix2PixHD-LoRA model effectively extracted and reinforced scale fluctuation patterns within the spatial genotype, facilitating a transition from mechanical repetition to organic complexity. Furthermore, the Average Fabric Size score for GAopt (0.99) significantly surpasses that of the Expanded Area (0.43), indicating that the deep learning model integrates necessary spatial hierarchies while preserving small-scale urban fabric.
The evaluation of street network performance indicators further validates the effectiveness of the generated schemes in enhancing spatial accessibility and fostering a human-centric environment. Spatial analysis shows that the Expanded Area scores poorly on Average Street Width (0.64) and Standard Deviation of Street Width (0.38). This reflects that the existing developments, which prioritize modern motorized traffic, have adopted simplified and homogenized street-widening methods. As a result, this approach undermines the quality of the narrow street and dense network found in historical alleys, which serve as vital spaces for social interaction. In contrast, the optimal candidate scheme, GAopt, shows a clear return to traditional pedestrian-centric logic in the street network. It achieves perfect scores for Spatio-temporal Accessibility and Average Street Width, both reaching the theoretical peak of 1.00, while Street Network Density (0.95) surpasses that of the Original Area (0.91). The data demonstrate that the optimization algorithm effectively filters out the rigid vehicular logic observed in the Expanded Area. Consequently, the new street network is characterized by high permeability and a natural rhythmic variation in street widths, reflected in a Street Width Standard Deviation of 0.74.
The comprehensive performance evaluation reveals that the Expanded Area has a total score of only 0.66, indicating a significant misalignment between fabric diversity and street network performance. In contrast, the GAopt scheme achieved a total score of 0.94, marking a 42.4% improvement over the Expanded Area and exceeding the average quality of the Original Area (0.89). This result underscores a key academic finding: deep learning should not be viewed merely as a passive imitation of historical forms but rather as a performance-enhanced translation. By capturing the spatial genotype of the Original Area through deep learning and applying extreme-value screening via Multi-Objective Optimization, it is possible to develop optimal schemes that both respect historical context and outperform existing or even original conditions in spatial performance, including fabric and street network hierarchy. This approach provides a quantifiable, empirical means to address the contradictions between the urban context and functional degradation in the Construction Control Area of historic urban areas.

3.2. Comparative Performance Analysis of Generative Paradigms

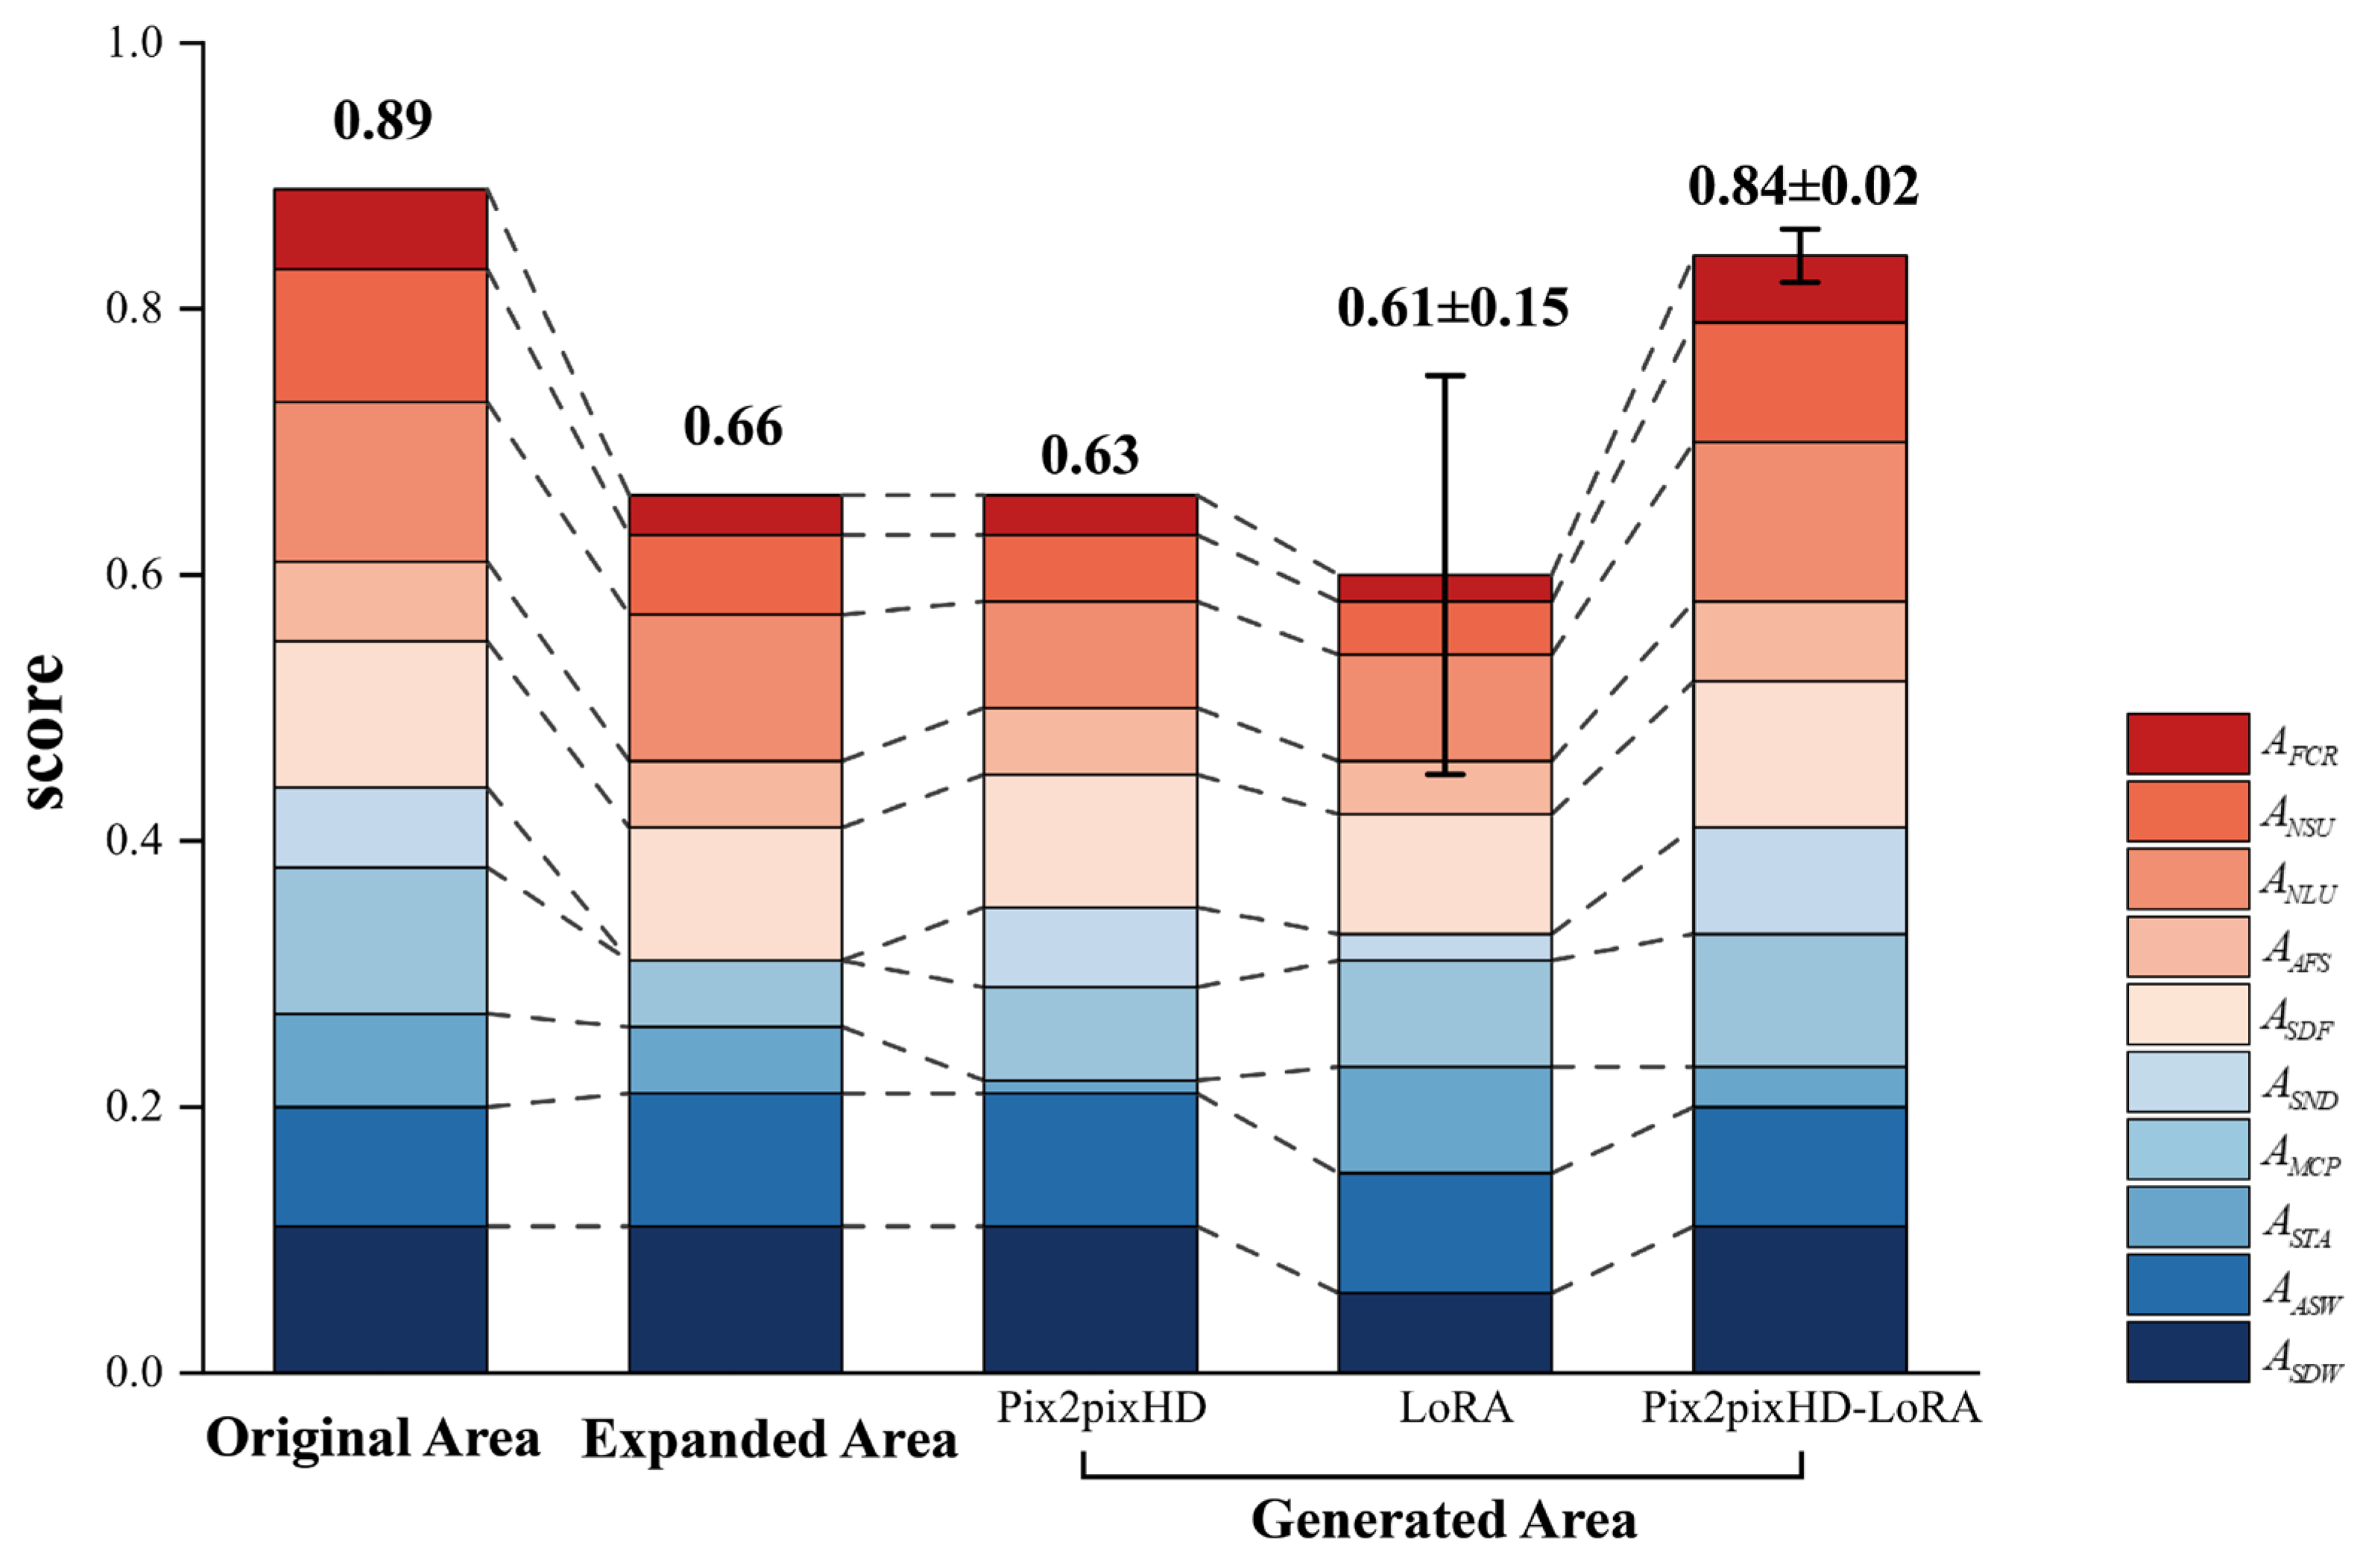
This section compares three generative architectures: the standalone Pix2PixHD (deterministic), the standalone LoRA (stochastic), and the proposed Pix2PixHD–LoRA hybrid. Figure 7 presents a stacked bar chart comparing the evaluation metrics across the Original Area, Expanded Area, and Generated Area.
The robustness of the stochastic methods was assessed through multiple independent runs. Table 3 summarizes the weighted comprehensive scores. For the hybrid model, the mean score across 100 generated samples is 0.84. The intra-run standard deviation is ±0.07, and the scores range from 0.45 to 0.90. The cross-run standard deviation is ±0.02, indicating stable model performance across different training runs.
Detailed per-indicator scores, benchmarked against the Original Area and the Expanded Area, are reported in Table 4. This analysis examines the trade-offs between morphological fidelity, functional plausibility, and generative diversity (see Appendix A).
The standalone Pix2PixHD model operates as a deterministic generator, producing a single output, highlighting its fundamental limitations. While it partially reduces the morphological homogeneity of the Expanded Area—restoring the fabric size standard deviation from 0.00 to 0.71 and maintaining high fabric coverage (0.88)—it struggles to replicate the complex scalar hierarchy of the historic tissue. Specifically, the generation of large fabric units is abnormally low (0.10), and the average fabric size (0.55) remains suboptimal, indicating an inherent deficiency in capturing low-frequency structural patterns. Critically, its performance in street network synthesis falls short of the Original Area in both spatio-temporal accessibility (0.66) and street-width control (0.48). This suggests that the model has difficulty coordinating complex functional dependencies. Furthermore, the monotony of its outputs—providing no alternative design scenarios—severely limits its practical use in design decision support.
On the other hand, the standalone LoRA model exhibits robust generative diversity, producing a wide variety of morphologically distinct phenotypes. However, quantitative metrics reveal critical instability (Total Score: 0.61 ± 0.15). The model not only significantly underperforms the Original Area but also, in key metrics such as fabric coverage (0.46 ± 0.15), falls short of the Expanded Area. The substantial standard deviations observed across street network indicators (consistently exceeding ±0.24) imply that outputs fluctuate dramatically between complete structural failure and accidental viability. While LoRA effectively serves as a creative engine for stylistic exploration, its inherent geometric inaccuracies—resulting in blurred building boundaries and topological discontinuities in the street network—render it unreliable for autonomous planning tasks.
The proposed Pix2PixHD-LoRA hybrid framework successfully addresses the existing dichotomy in image generation, achieving a unified equilibrium of fidelity, diversity, and stability.
  • Morphological Fidelity: Pix2PixHD-LoRA significantly outperforms Pix2PixHD across all key metrics, closely matching the benchmarks of the Original Area. Notably, the average fabric size score of 0.85 represents a 54.5% improvement over Pix2PixHD. Furthermore, the standard deviation of fabric size (0.95 ± 0.05) exceeds that of the Original Area (0.74), showcasing a superior ability to generate heterogeneous yet harmonious fabric patterns.
  • Functional Integrity: In terms of street network functionality, Pix2PixHD-LoRA marks a significant advancement. Both spatio-temporal accessibility (0.96) and network density (0.94) approach the optimal values found in the Original Area. The average street width score of 0.88 reflects an impressive 83.3% improvement over Pix2PixHD, indicating precise control over spatial scale.
  • Stability and Practicality: Most importantly, Pix2PixHD-LoRA achieves a high overall score of 0.84 with an exceptionally low standard deviation of ±0.02 across 100 generated iterations.
This outcome holds substantial methodological significance: it shows that the hybrid framework does not sacrifice quantity for quality. Instead, the high-precision structural prior provided by Pix2PixHD effectively constrains the LoRA model’s latent space, guiding sampling towards high-quality regions of the solution space. Consequently, designers receive not a chaotic assortment of random images but a carefully curated set of valid design alternatives that uphold high morphological consistency and functional rigor.
Comparative analysis indicates that both Pix2PixHD and LoRA exhibit significant limitations when used alone. Pix2PixHD struggles with mode collapse, leading to a lack of diversity in its outputs. On the other hand, LoRA faces issues with geometric hallucination and instability. The proposed hybrid model, with its cascaded architecture, achieves a synergistic effect beyond a simple combination of the two systems. It provides a superior balance across three critical areas: morphological accuracy, functional rationality, and generative diversity. This innovative framework creates a new digital generation paradigm that harmonizes algorithmic creativity with engineering precision, effectively addressing the dual challenges of preserving traditional urban fabric and adapting to modern functional requirements in historic district regeneration.

3.3. Analysis of Multi-Objective Optimization Results

To rigorously validate the comprehensive efficacy of the multi-objective iterative optimization framework in enhancing generative schemes for historic districts, this study conducted multiple rounds of evolutionary searches using an equal-weighted evaluation system. The goal was to synergistically optimize both the architectural fabric and street network performance, utilizing an initial population of candidate solutions generated by the Pix2PixHD-LoRA hybrid model.
After three generations of iteration, the optimization process met the convergence criteria, with the final intergenerational improvement rate of 0.7%, which is below the threshold of τ = 0.01. This demonstrates systematic improvements across all dimensional metrics (Detailed in Table 5 and Appendix B).
In the architectural fabric dimension, the fabric coverage score increased from 0.94 ± 0.05 to 0.99 ± 0.02, while the average fabric size score rose from 0.81 ± 0.16 to 0.86 ± 0.11. Notably, the mean metric score for the Standard Deviation of Fabric Size remained within the stable range of 0.65–0.69, indicating a more rational fabric composition and enhanced morphological order. The score for the number of large fabric units also improved from 0.79 ± 0.06 to 0.82 ± 0.06, suggesting further enhancement in functional integrity.
In terms of the street network, the density score improved from 0.91 ± 0.05 to 0.95 ± 0.01, and spatio-temporal accessibility increased from 0.90 ± 0.14 to 0.98 ± 0.03. The average street width score reached its maximum value of 1.00, up from 0.91 ± 0.15, while the standard deviation of the street width score also improved to 0.75 ± 0.02. These results demonstrate an overall optimization of the street network’s structure with respect to connectivity efficiency and scalar coordination.
Through this optimization process, the comprehensive fitness score of the solution population increased from 0.84 ± 0.07 to 0.89 ± 0.02. This significant increase, along with a notable reduction in standard deviation, indicates that the optimization framework not only enhances overall spatial performance but also improves the stability and reliability of the generative outputs.
Conclusion: The integrated generative-optimization framework developed in this study effectively guides the initial solution set toward a Pareto-optimal frontier, balancing spatial performance and historical authenticity through a multi-objective iterative mechanism. This approach provides a technically feasible and controllable digital paradigm for the organic renewal of historic districts. The results demonstrate that the proposed methodology significantly enhances the comprehensive performance of generated solutions across multiple dimensions—including morphological rationality, street network efficiency, and output stability—while strictly preserving morphological fidelity.

4. Discussion

Comparison with previous studies. Earlier work often relied on a single generative model. For example, some studies used Pix2Pix or Pix2PixHD to produce urban layouts. These models achieved reasonable structural accuracy, but their outputs showed limited diversity [15,17,18]. Other researchers applied standalone diffusion models for floor plans or façades. These models created varied styles but often lost precise geometric control [6,23]. Our hybrid approach combines the two. It keeps the structural stability of GANs and adds diverse variations in diffusion models. The performance-driven optimization further selects the best-fitting schemes. The results show that our generated schemes outperform the expanded area in several metrics, such as standard deviation of fabric size and street network density. The key new finding is that a high-fidelity structural prior from Pix2PixHD can guide the diffusion model’s latent space. This guidance produces stable, high-quality candidates, not random images. This moves beyond passive imitation and achieves a measurable improvement in urban fabric quality.
The generative design methodology proposed in this study has shown promising capabilities for synthesizing historic urban fabric and street network morphology. However, several limitations remain, highlighting important areas for future research.
Limitations of model comparison. Our experiments compared only three architectures: Pix2PixHD, LoRA, and the proposed hybrid model. Many other advanced generative models exist, such as ControlNet-guided diffusion models, transformer-based layout generators, and graph neural networks for spatial synthesis. These models were not tested. Therefore, the current study cannot show how our framework performs relative to the latest alternatives. This limitation should be addressed in future work by including a broader benchmark.
Technological Workflow and Computational Efficiency: Currently, the framework operates across heterogeneous software ecosystems, integrating Pix2PixHD training, LoRA fine-tuning, and optimization algorithms across different platforms. This fragmentation results in operational complexity and hinders seamless automation. Future work should focus on developing a unified computational framework (Integrated Platform) that streamlines module coordination through interoperable protocols. From a computational perspective, training high-fidelity GANs (e.g., Pix2PixHD) is intensive. Although LoRA reduces the adaptation overhead, overall latency still poses a challenge for real-time interaction. Future research will investigate techniques for model lightweighting—such as knowledge distillation or network pruning—to create more efficient generative architectures suitable for rapid iterative design.
Data Generalizability and Multidimensional Evaluation: While the current dataset systematically captures the river–street typologies of the Jiangnan region, its geographical scope is limited. This constrains the model’s generalization to other regional architectural styles (e.g., Northern courtyard dwellings or mountainous settlements). Future efforts should expand the dataset to include cross-regional and multicultural samples to enhance the model’s domain adaptation capabilities. Regarding the evaluation system, current metrics focus primarily on morphological aspects. Key performance indicators, such as disaster resilience (specifically emergency evacuation efficiency in narrow alleys), economic feasibility, and microclimatic comfort (e.g., wind and thermal performance), have not yet been fully integrated. Existing research provides a foundation for quantifying such environmental and behavioral dimensions, from pedestrian wind environments and layout patterns [34,35,36] to public willingness for sustainable transitions [37] to indoor environmental quality, occupant satisfaction [38,39], HVAC-related energy consumption [38,40], and health outcomes such as sick building syndrome in various building types [39,41]. Developing a holistic evaluation framework that encompasses social, economic, and environmental dimensions is essential. Furthermore, the optimization phase currently uses a conservative elite retention rate (1%). Future iterations should consider increasing this parameter (e.g., to 20%) to better balance global exploration (diversity) and local exploitation (stability), thereby enhancing the robustness of optimization convergence.
By addressing these limitations through systematic improvements, generative design methodologies can advance toward greater integration, universality, efficiency, and comprehensiveness in the field of urban heritage conservation.

5. Conclusions

This study proposes an innovative computational framework that synergizes deep learning with Multi-Objective Optimization to address the complex digital design challenges posed by the preservation and regeneration of historic urban fabric. By systematically integrating the high-fidelity generative capabilities of Pix2PixHD, the diverse expressive potential of Diffusion Models, and the goal-oriented decision-making of optimization algorithms, this framework effectively bridges the longstanding methodological disconnect between morphological accuracy, generative diversity, and functional rationality.
The key findings and contributions are summarized as follows:
  • Establishment of a Closed-Loop Generative-Optimization Framework
This study addresses the critical dilemma in current digital design methodologies: the trade-offs between morphological fidelity and functional performance. It establishes a comprehensive, reproducible technical pathway that systematically integrates multimodal dataset construction, dual-stage model synergism, quantitative evaluation, and iterative optimization. This framework not only ensures high fidelity between the synthesized outcomes and the authentic historical fabric but also provides robust methodological support for human–machine collaborative decision-making.
  • Superiority of the Hybrid Generative Architecture
The proposed Pix2PixHD-LoRA hybrid model shows significant advantages over standalone paradigms. Compared to the deterministic Pix2PixHD model, the hybrid approach maintains high historical fidelity and geometric precision while substantially enhancing generative diversity, effectively addressing the mode collapse issue commonly found in GANs. Compared with standalone Diffusion/LoRA approaches, the hybrid method effectively constrains topological inconsistencies and geometric distortions by incorporating structural priors from Pix2PixHD, achieving an organic integration of algorithmic creativity and engineering controllability.
  • Efficacy of Performance-Driven Optimization
The Multi-Objective Optimization process substantially improved the overall spatial performance of the generated solutions. By coupling a quantitative evaluation system based on ten morphological indicators with an evolutionary strategy, the framework achieved synergistic improvements across conflicting objectives, such as fabric compactness and street network efficiency. The top-ranked individual design (GAopt) achieved a weighted comprehensive score of 0.94, a 42.4% improvement over the Expanded Area (0.66). The optimized population reached a mean weighted score of 0.89 ± 0.02, representing a 34.8% gain over the Expanded Area and a 6.0% increase over the initial generated baseline (0.84 ± 0.07). Furthermore, the optimization process significantly enhanced output stability, reducing the standard deviation from 0.07 to 0.02, indicating high reliability.
Limitations. First, the model comparison was limited to three architectures. Future benchmarks should include more advanced generative models. Second, the dataset represents a single regional typology, the Jiangnan river–street fabric. Broader cultural and geographic coverage is needed. Third, the evaluation metrics focus on physical form. Social, economic, and environmental dimensions, such as disaster resilience and microclimatic comfort, are not yet integrated. Fourth, the computational workflow is not yet unified, which limits interactive speed.
Future research. Future work should test a wider set of generative models, expand the dataset to multiple regions, and develop an integrated evaluation framework that includes disaster, comfort, and cost indicators. Model lightweighting techniques and a unified software platform will be explored to enable real-time, interactive design.
Implications. This framework can be adapted to other historic environments that face similar fabric-based challenges. The method provides a quantifiable, repeatable way to balance preservation and renewal. Planners can use the generated and optimized alternatives as design references. This makes the decision process more transparent and evidence-based. The approach can also be extended to other urban design tasks where morphological authenticity and performance must be balanced.
In summary, the generative design framework developed in this study achieves an effective equilibrium among morphological fidelity, design diversity, and performance optimization. It provides both theoretical insights and a practical digital paradigm for the scientific preservation and adaptive regeneration of historic districts amid rapid urbanization.

Author Contributions

Conceptualization, X.Y. and J.W.; methodology, X.Y. and Y.Z.; software, S.N. and R.Q.; validation, Y.Z. and J.B.; formal analysis, Y.Z. and T.L.; investigation, S.N. and R.Q.; resources, H.L., R.Q. and H.Z.; data curation, S.N. and T.L.; writing—original draft preparation, X.Y. and S.N.; writing—review and editing, J.W., H.L., and H.Z.; visualization, S.N. and J.B.; supervision, J.W.; project administration, J.W.; funding acquisition, X.Y. All authors have read and agreed to the published version of the manuscript.

Funding

This research was funded by the National Natural Science Foundation of China (grant numbers 52508143 and 52478034), the Joint Fund of Natural Science Foundation of Zhejiang Province (grant number LLSSZ26F020002, LHZY24A010003 and LHZQN25D010005).

Data Availability Statement

The data presented in this study are not publicly available due to privacy and ethical restrictions.

Acknowledgments

I acknowledge the use of Gemini in assisting with the preparation and/editing of the language and grammar in this paper.

Conflicts of Interest

The authors declare that they have no known competing financial interests or personal relationships that could have appeared to influence the work reported in this paper.

Abbreviations

The following abbreviations are used in this manuscript:
GANsGenerative Adversarial Networks
LoRALow-Rank Adaptation
EAExpanded Area
GISGeographic Information System
GAoptOptimal Generative Scheme

Appendix A

Appendix A.1

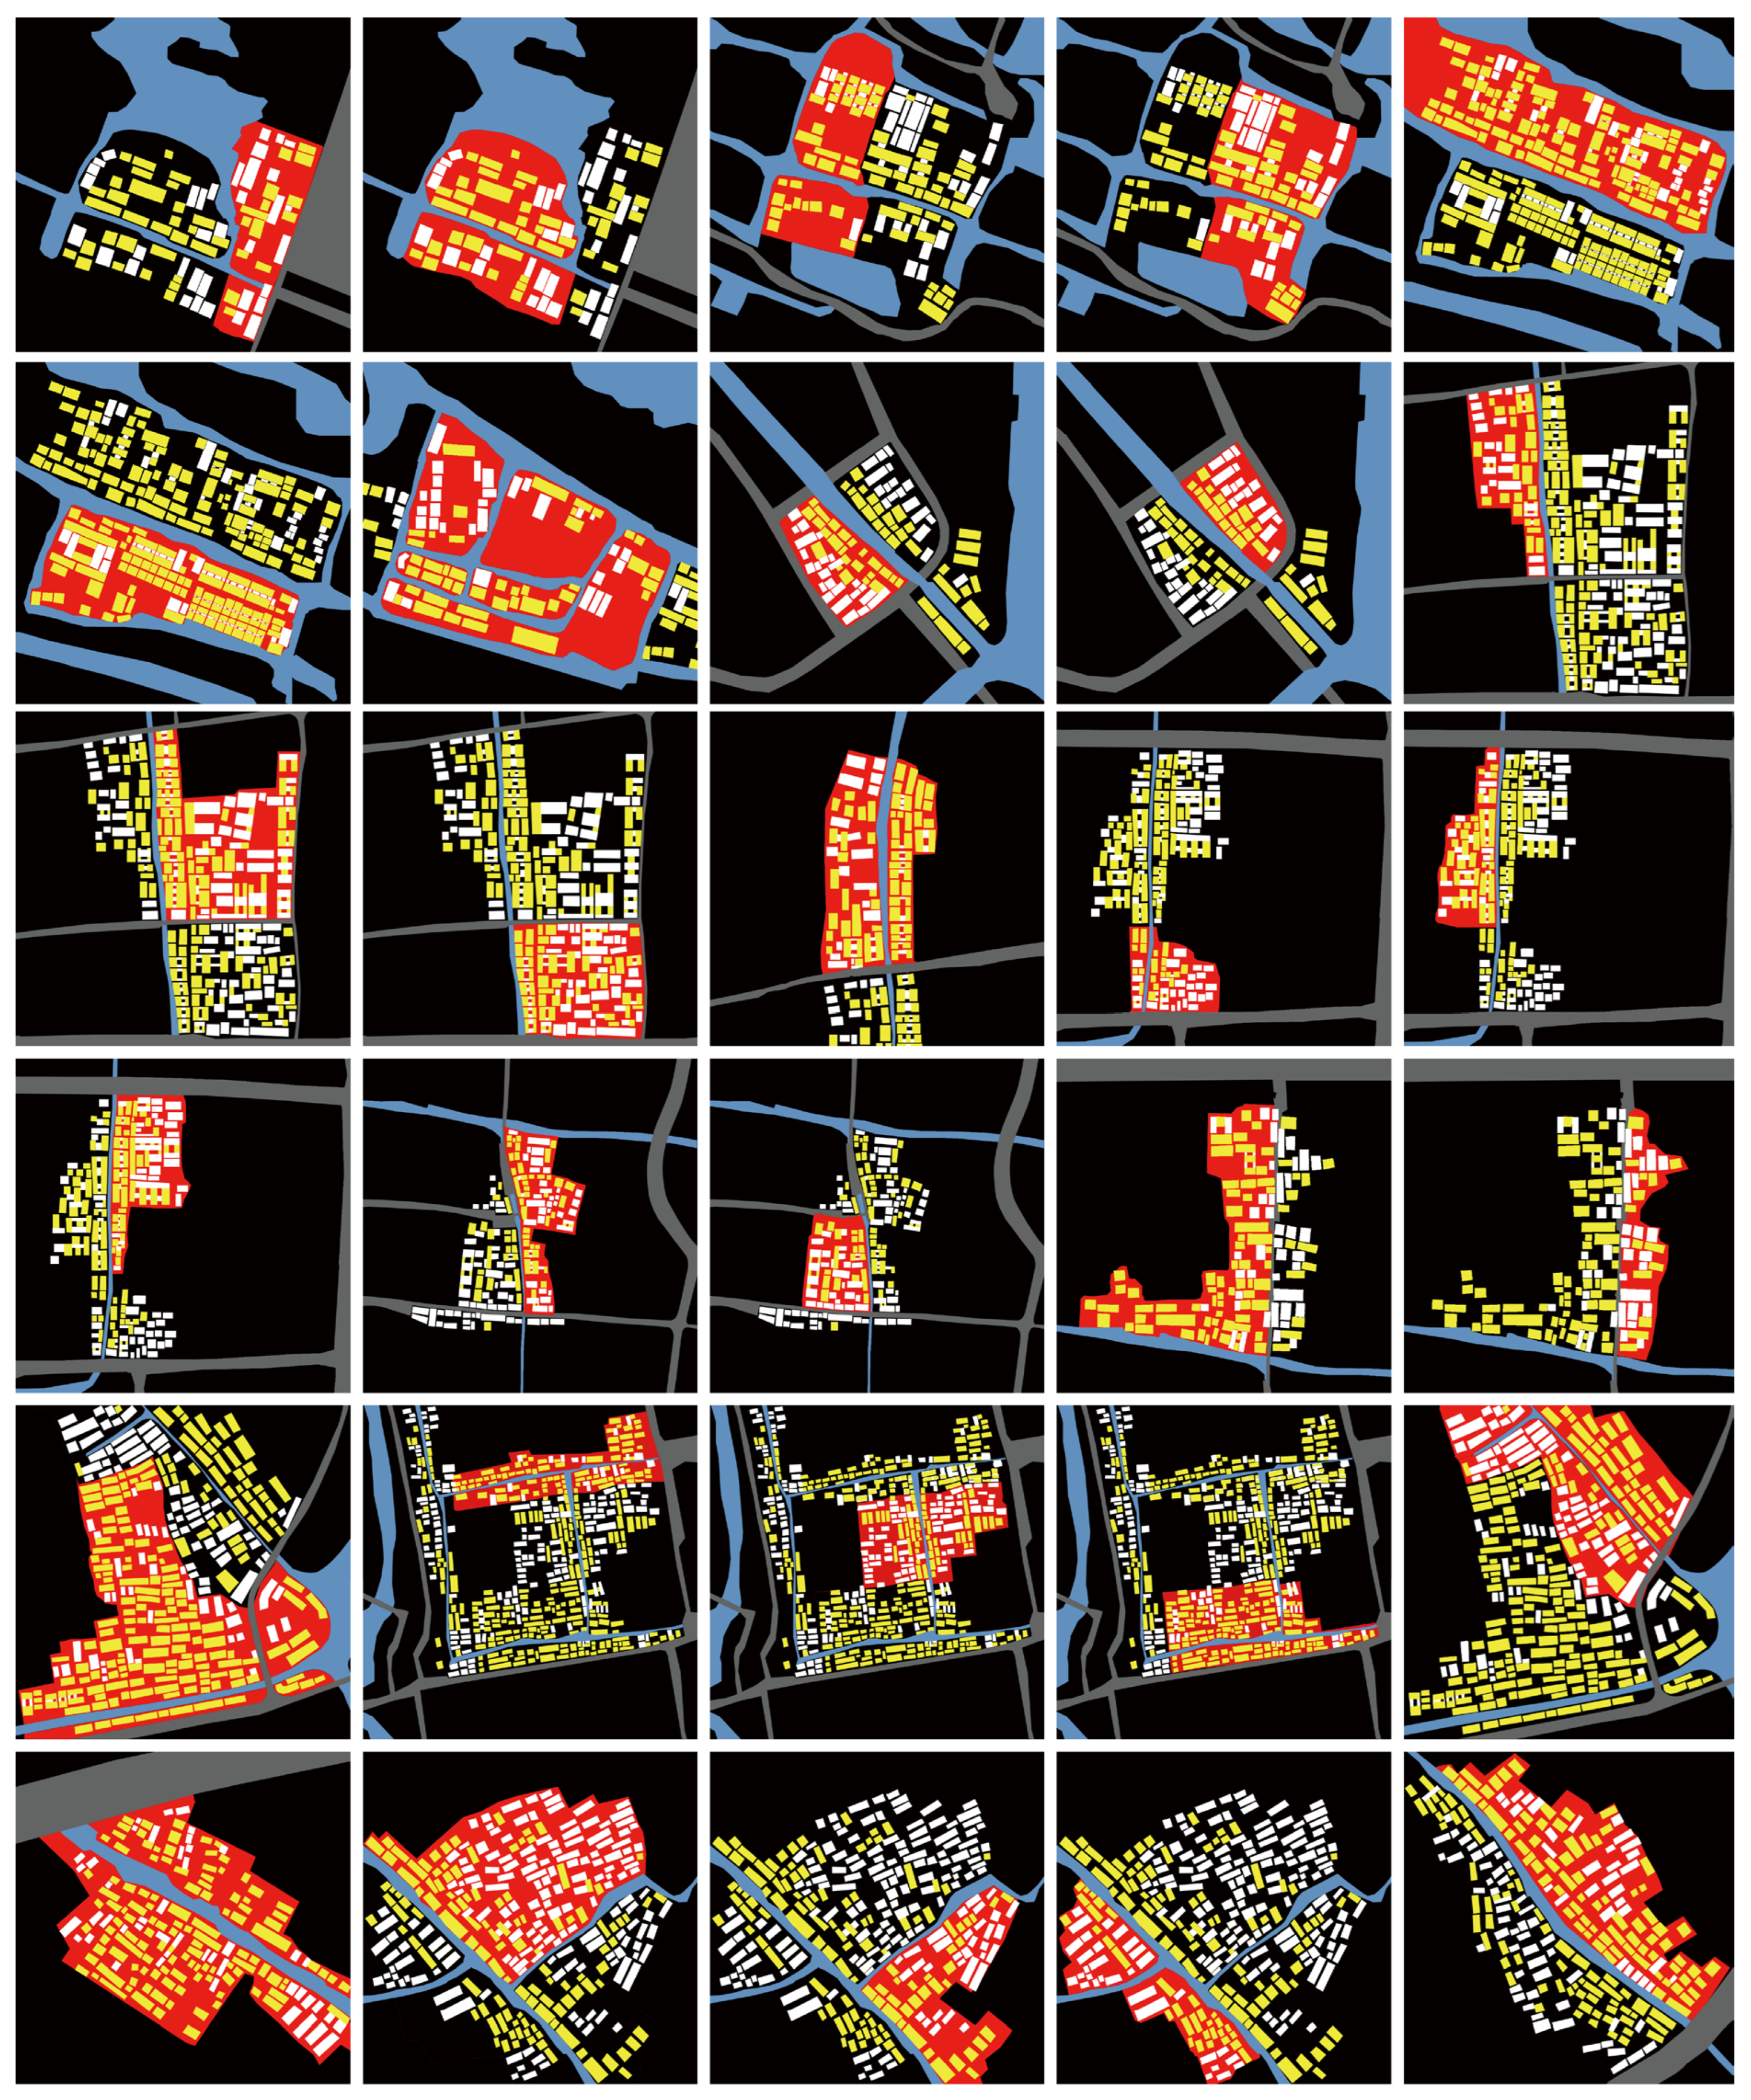
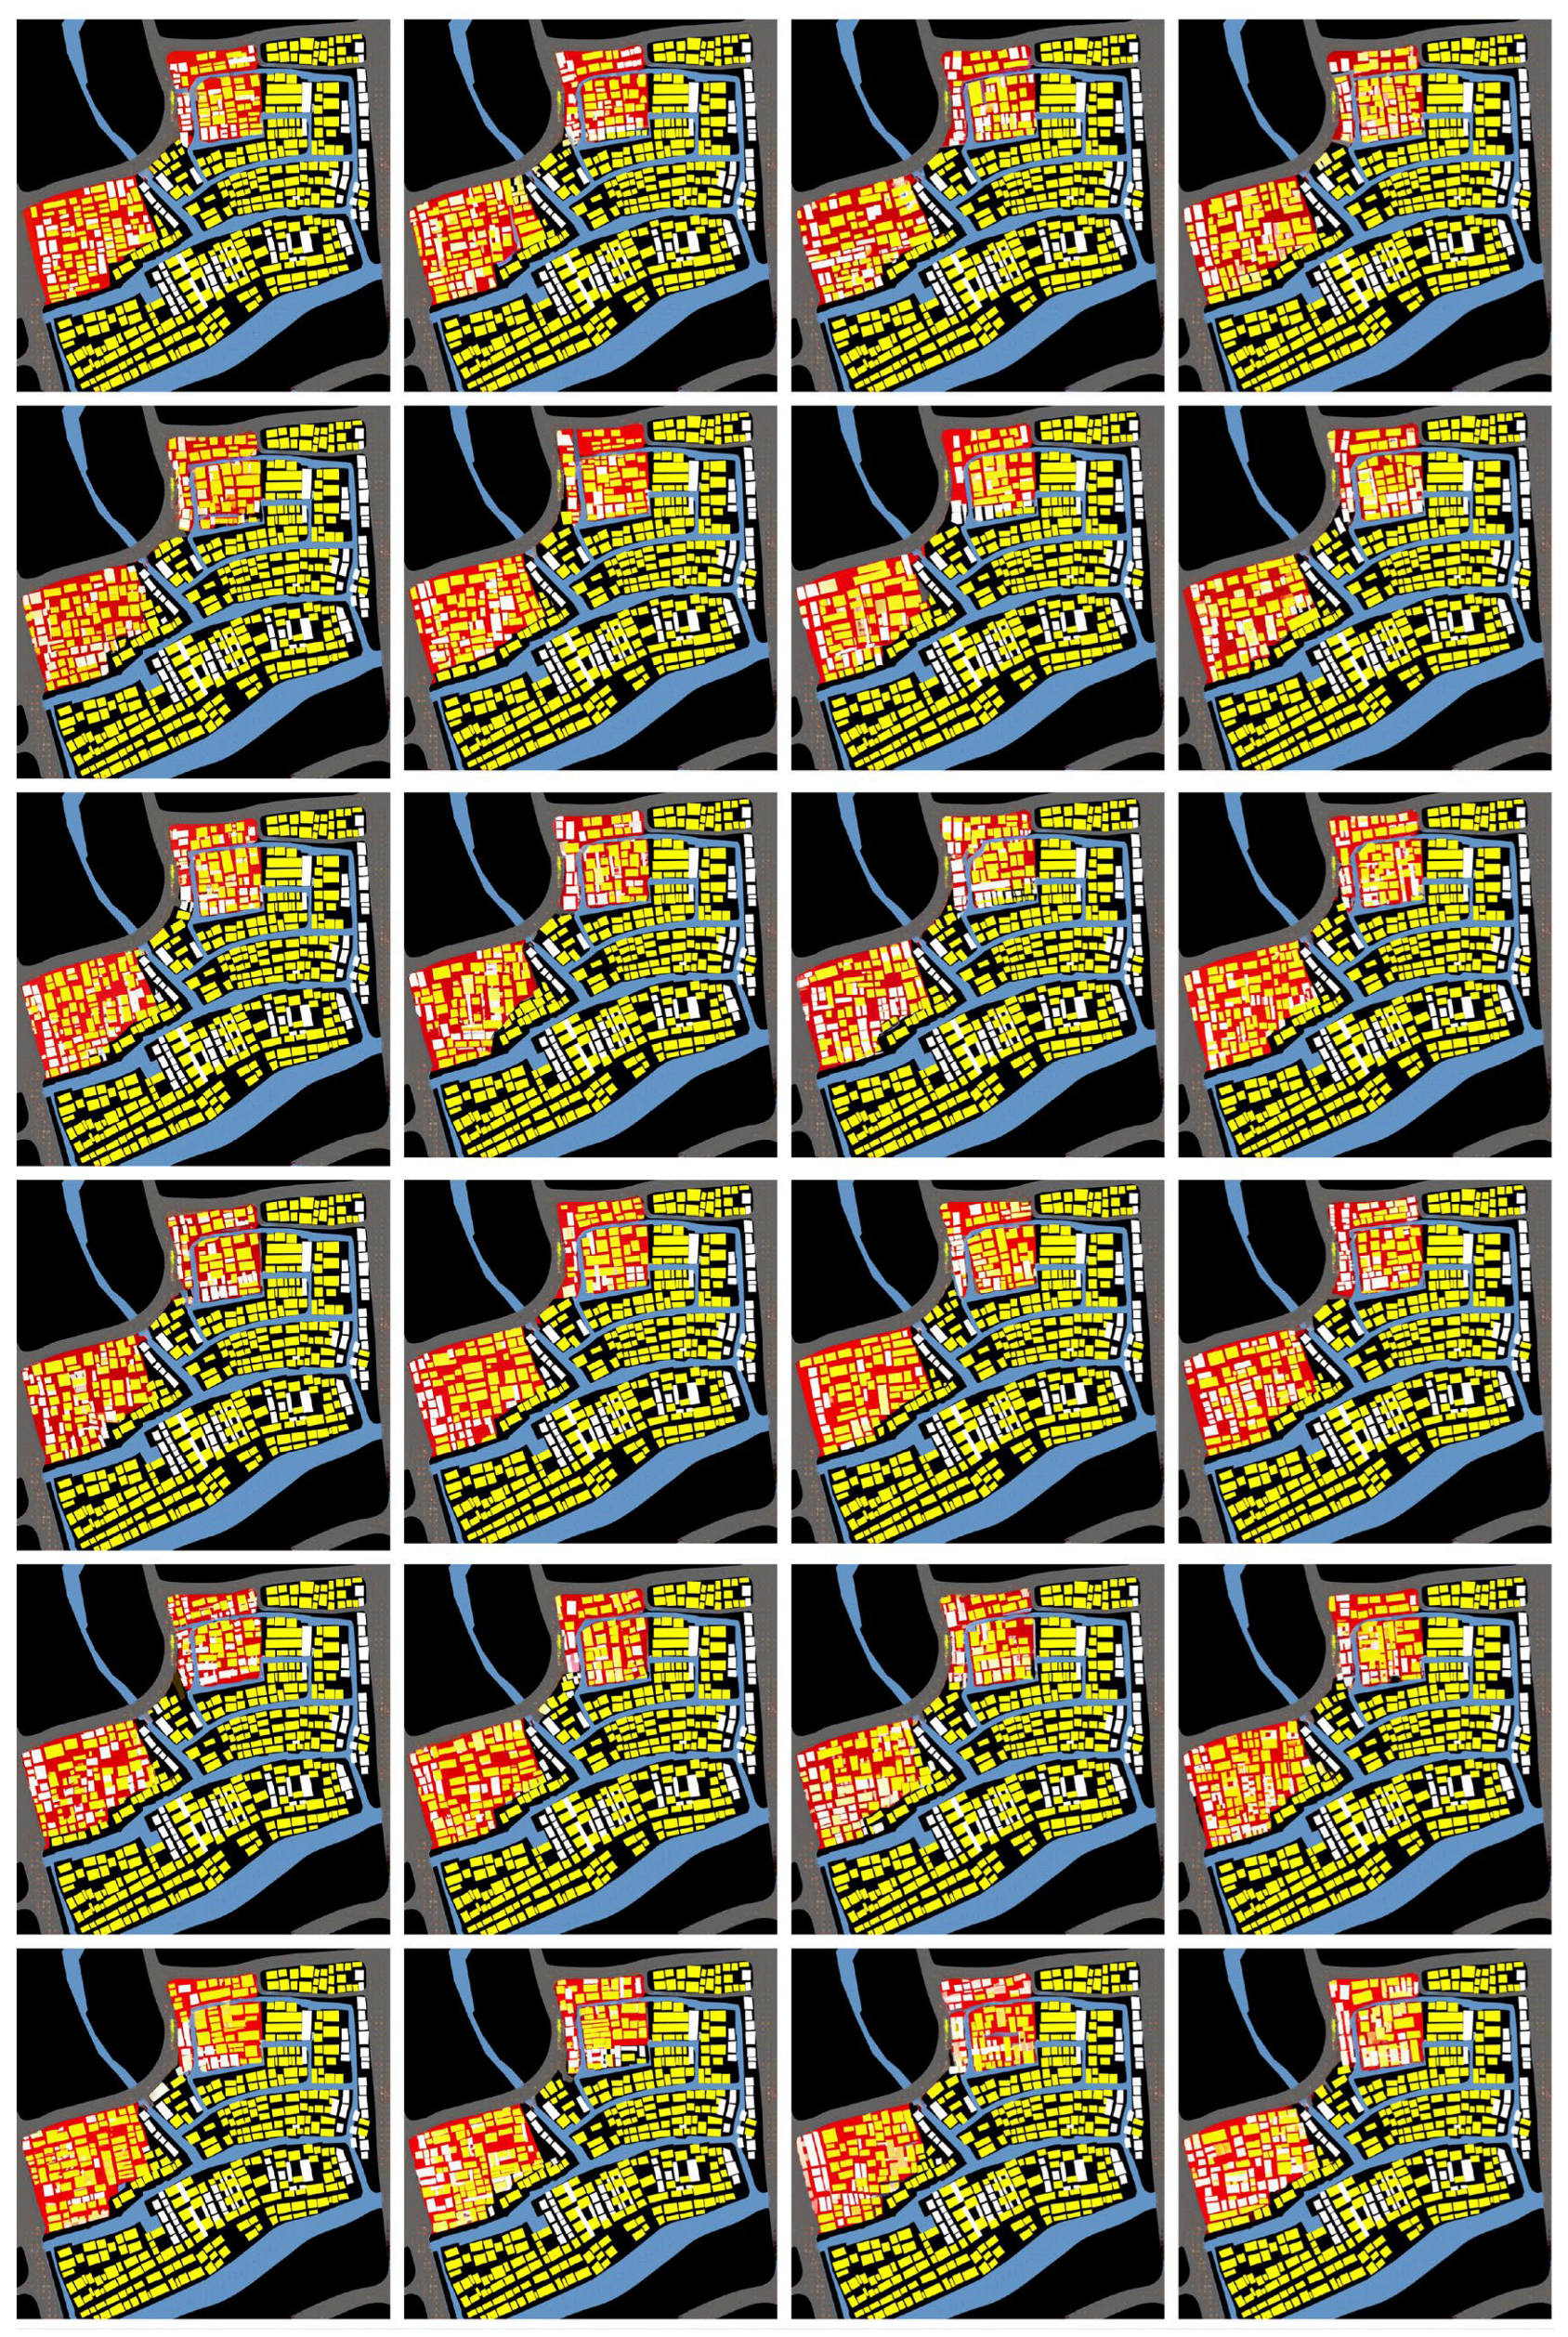
This appendix presents the processed training images (Domain B) utilized for model training.
Figure A1. A subset of Dataset Preparation. Overview of the generation process and color-coding scheme for the paired dataset. The multi-channel site constraints are color-coded based on specific RGB values: black (0, 0, 0) for background, red (255, 0, 0) for land-use boundaries, blue (100, 150, 200) for waterways, grey (100, 100, 100) for street networks, yellow (255, 255, 0) for buildings with ridge orientations parallel to the watercourse, and white (255, 255, 255) for buildings with ridge orientations perpendicular to the watercourse.
Land 15 00976 g0a1

Appendix A.2

This appendix provides a visual comparison of generation outputs across different model architectures.
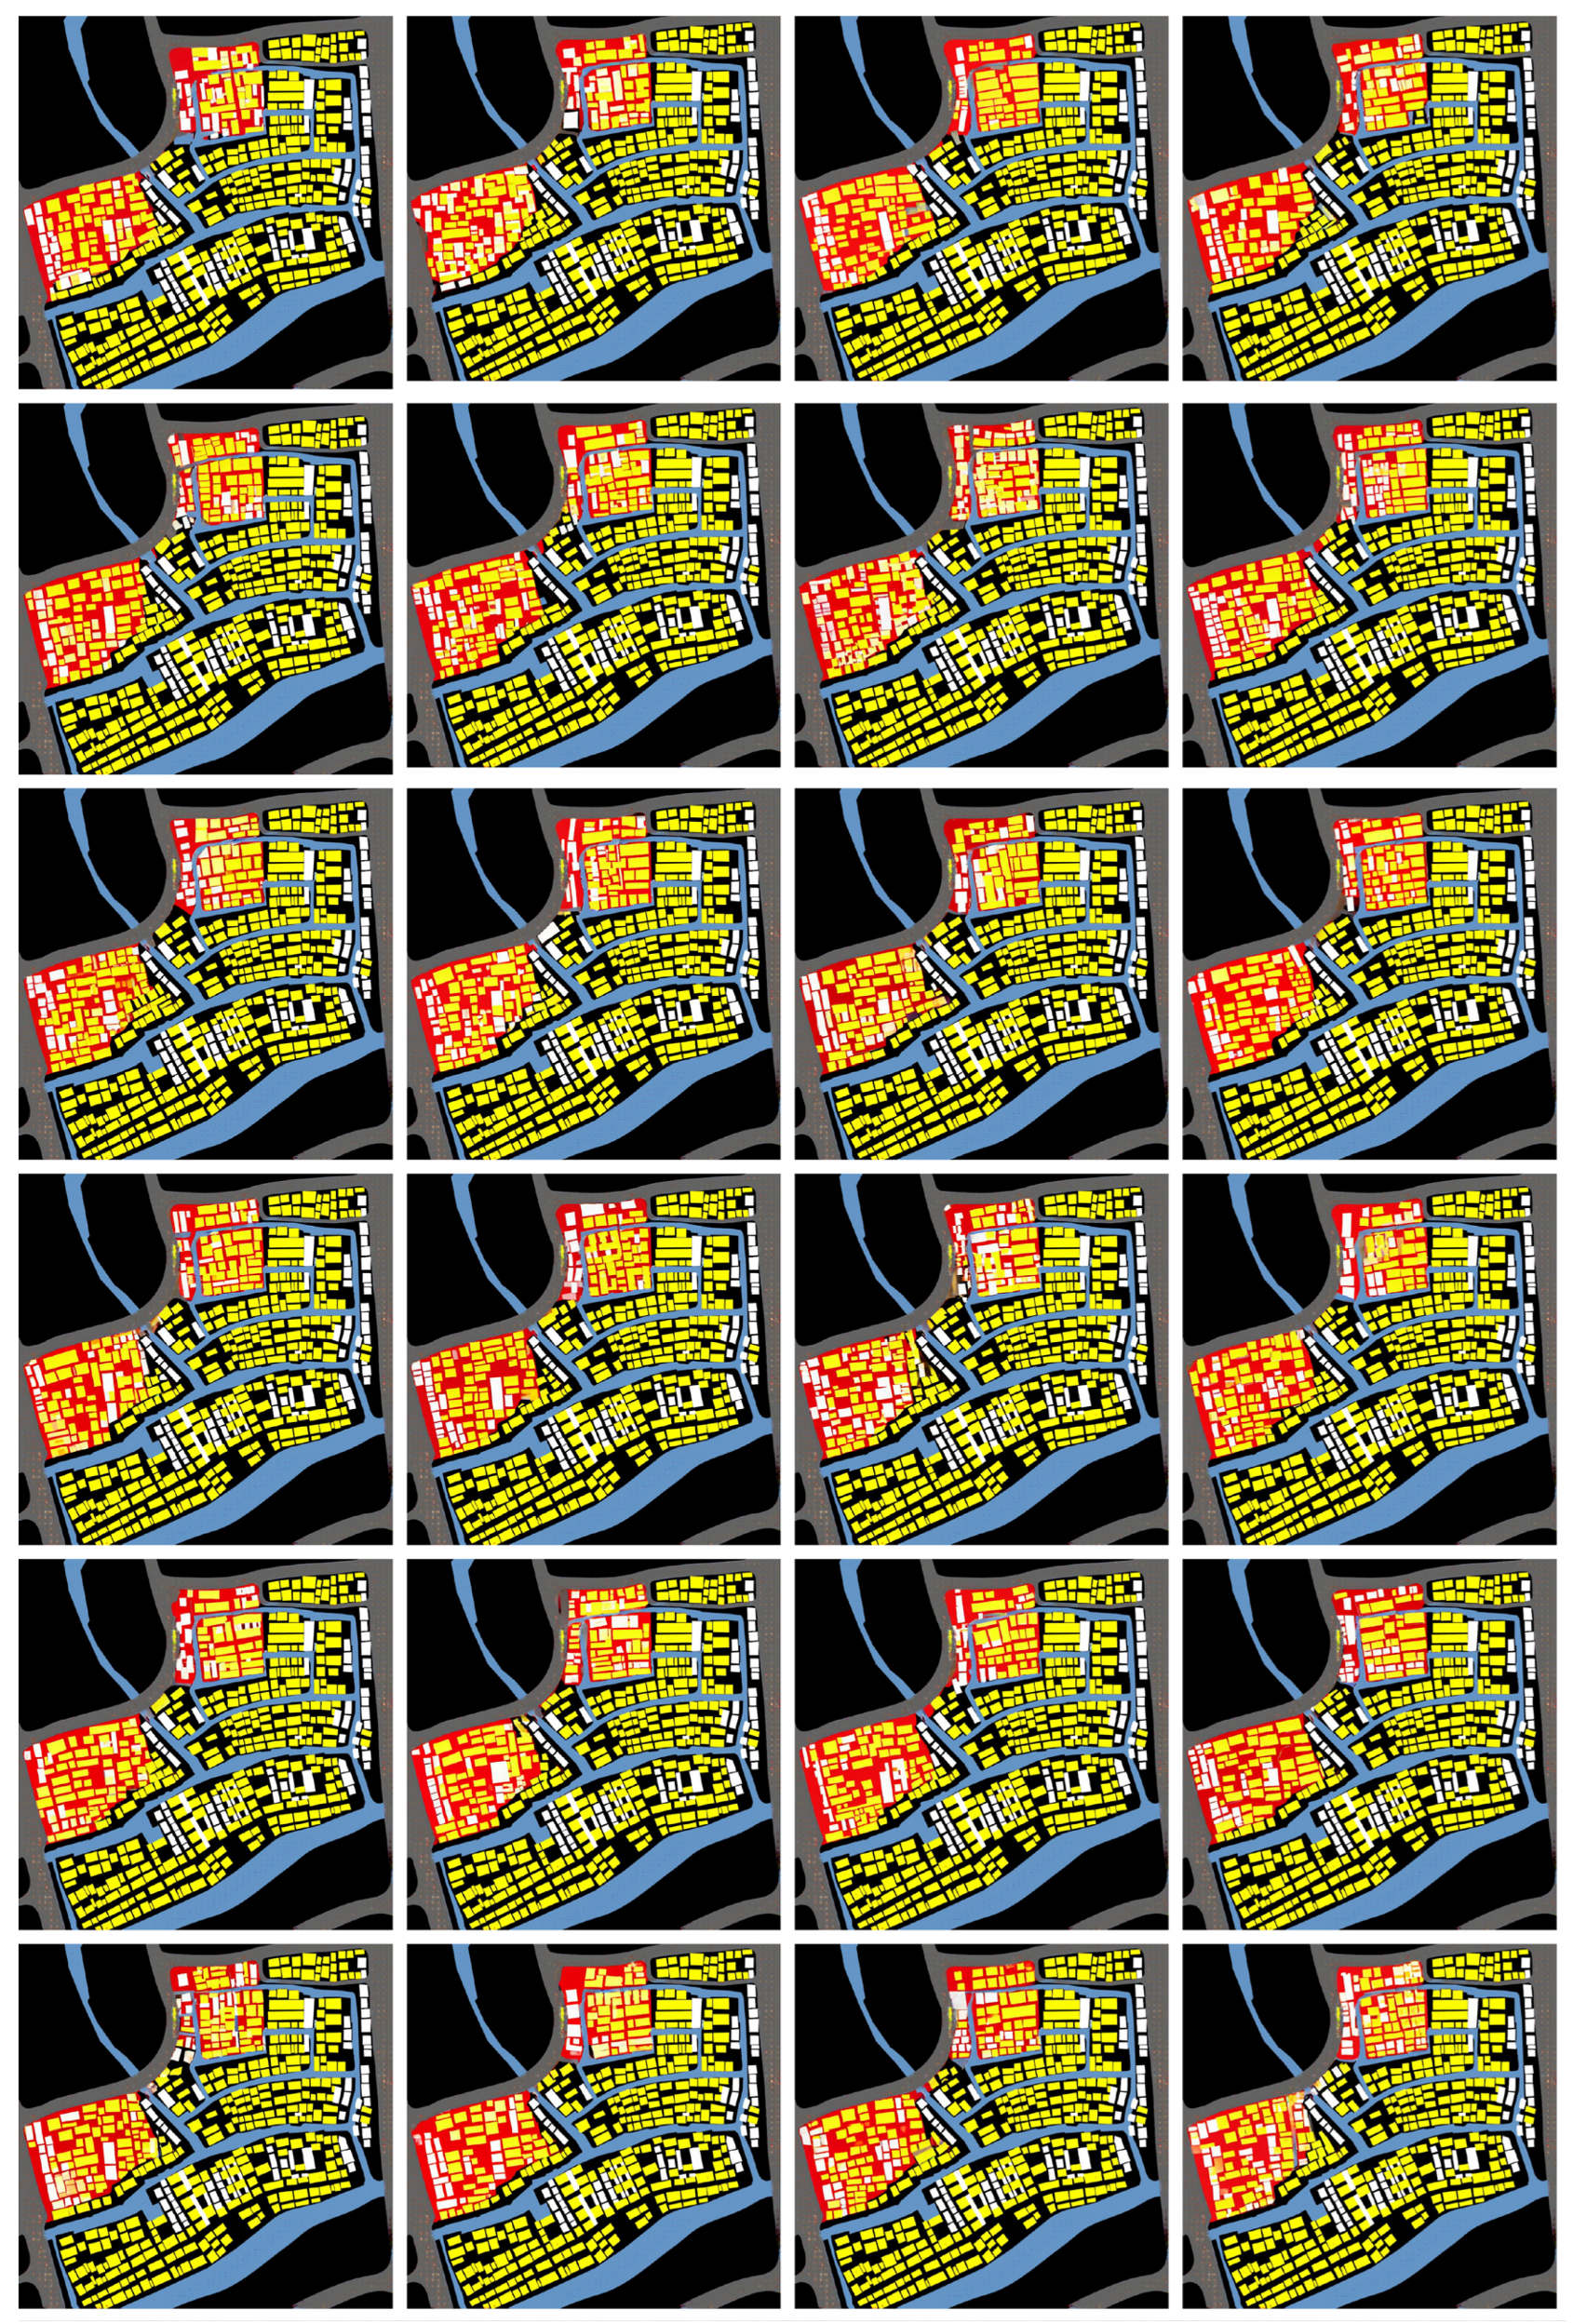
Figure A2. A subset of generation Result of Pix2PixHD. Overview of the generation process and color-coding scheme for the paired dataset. The mul-ti-channel site constraints are color-coded based on specific RGB values: black (0, 0, 0) for back-ground, red (255, 0, 0) for land-use boundaries, blue (100, 150, 200) for waterways, grey (100, 100, 100) for street networks, yellow (255, 255, 0) for buildings with ridge orientations parallel to the watercourse, and white (255, 255, 255) for buildings with ridge orientations perpendicular to the watercourse.
Land 15 00976 g0a2
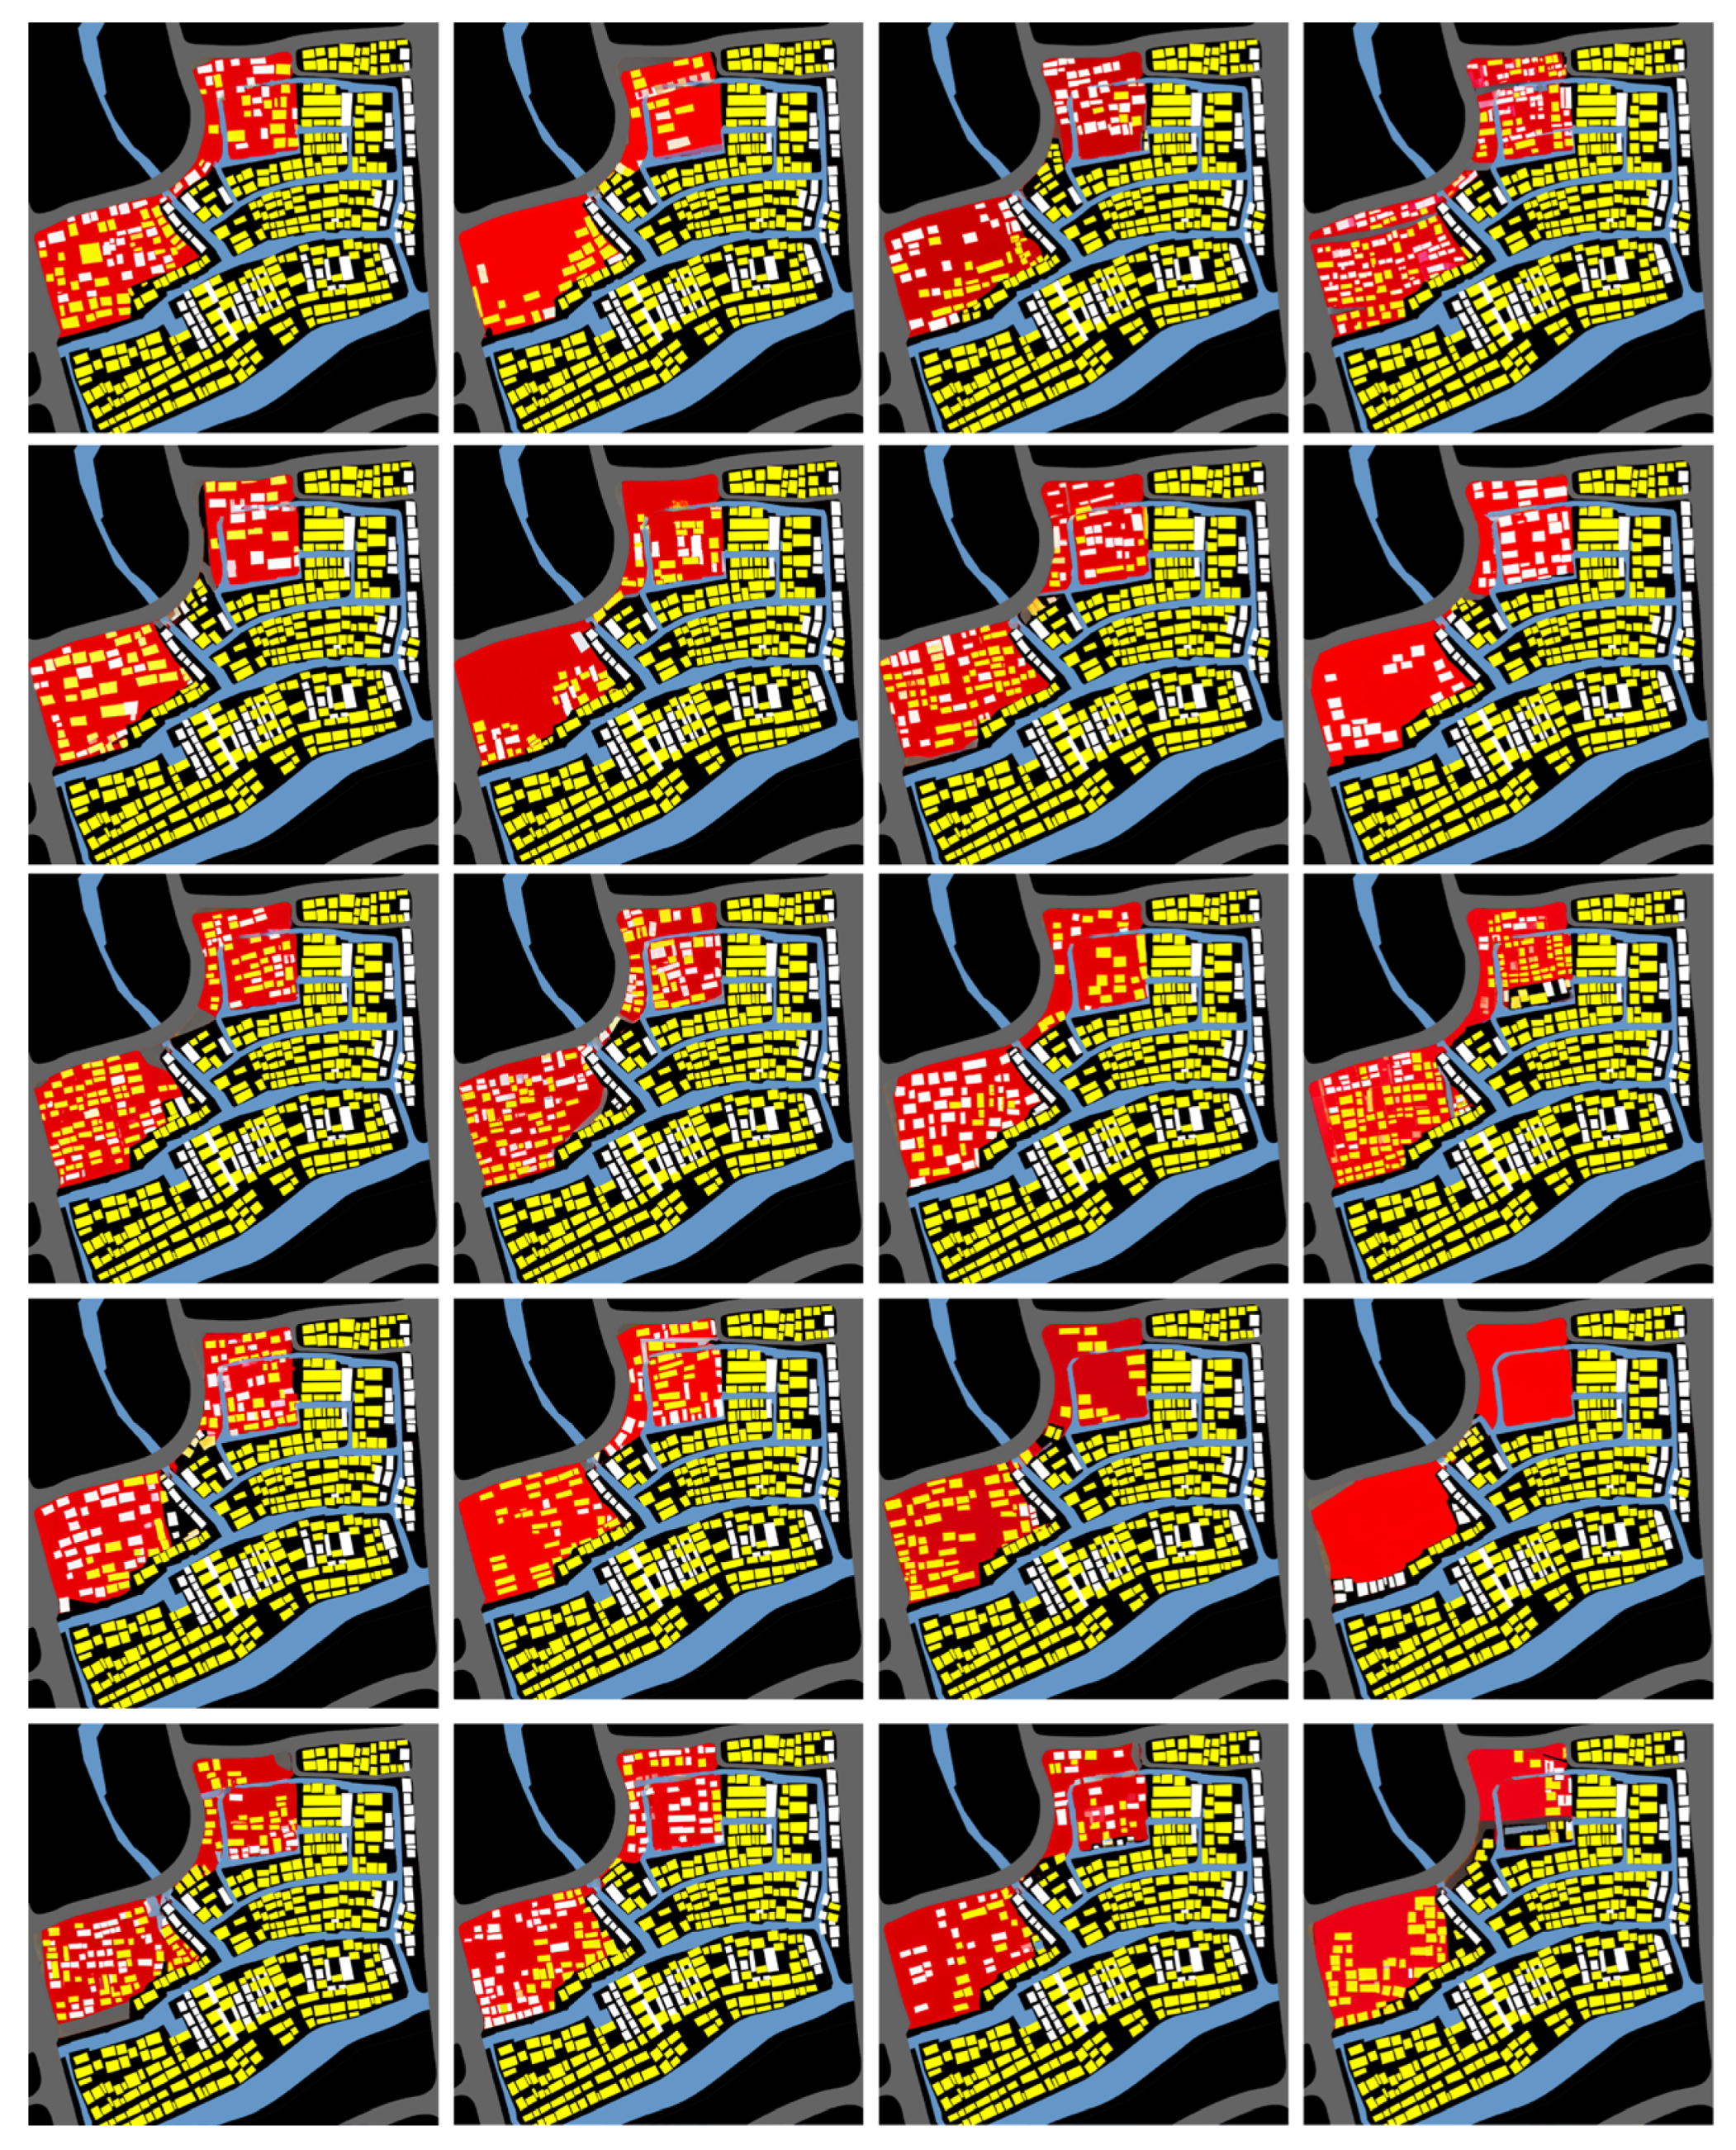
Figure A3. A subset of generation Results of LoRA. Overview of the generation process and color-coding scheme for the paired dataset. The multi-channel site constraints are color-coded based on specific RGB values: black (0, 0, 0) for background, red (255, 0, 0) for land-use boundaries, blue (100, 150, 200) for waterways, grey (100, 100, 100) for street networks, yellow (255, 255, 0) for buildings with ridge orientations parallel to the watercourse, and white (255, 255, 255) for buildings with ridge orientations perpendicular to the watercourse.
Land 15 00976 g0a3
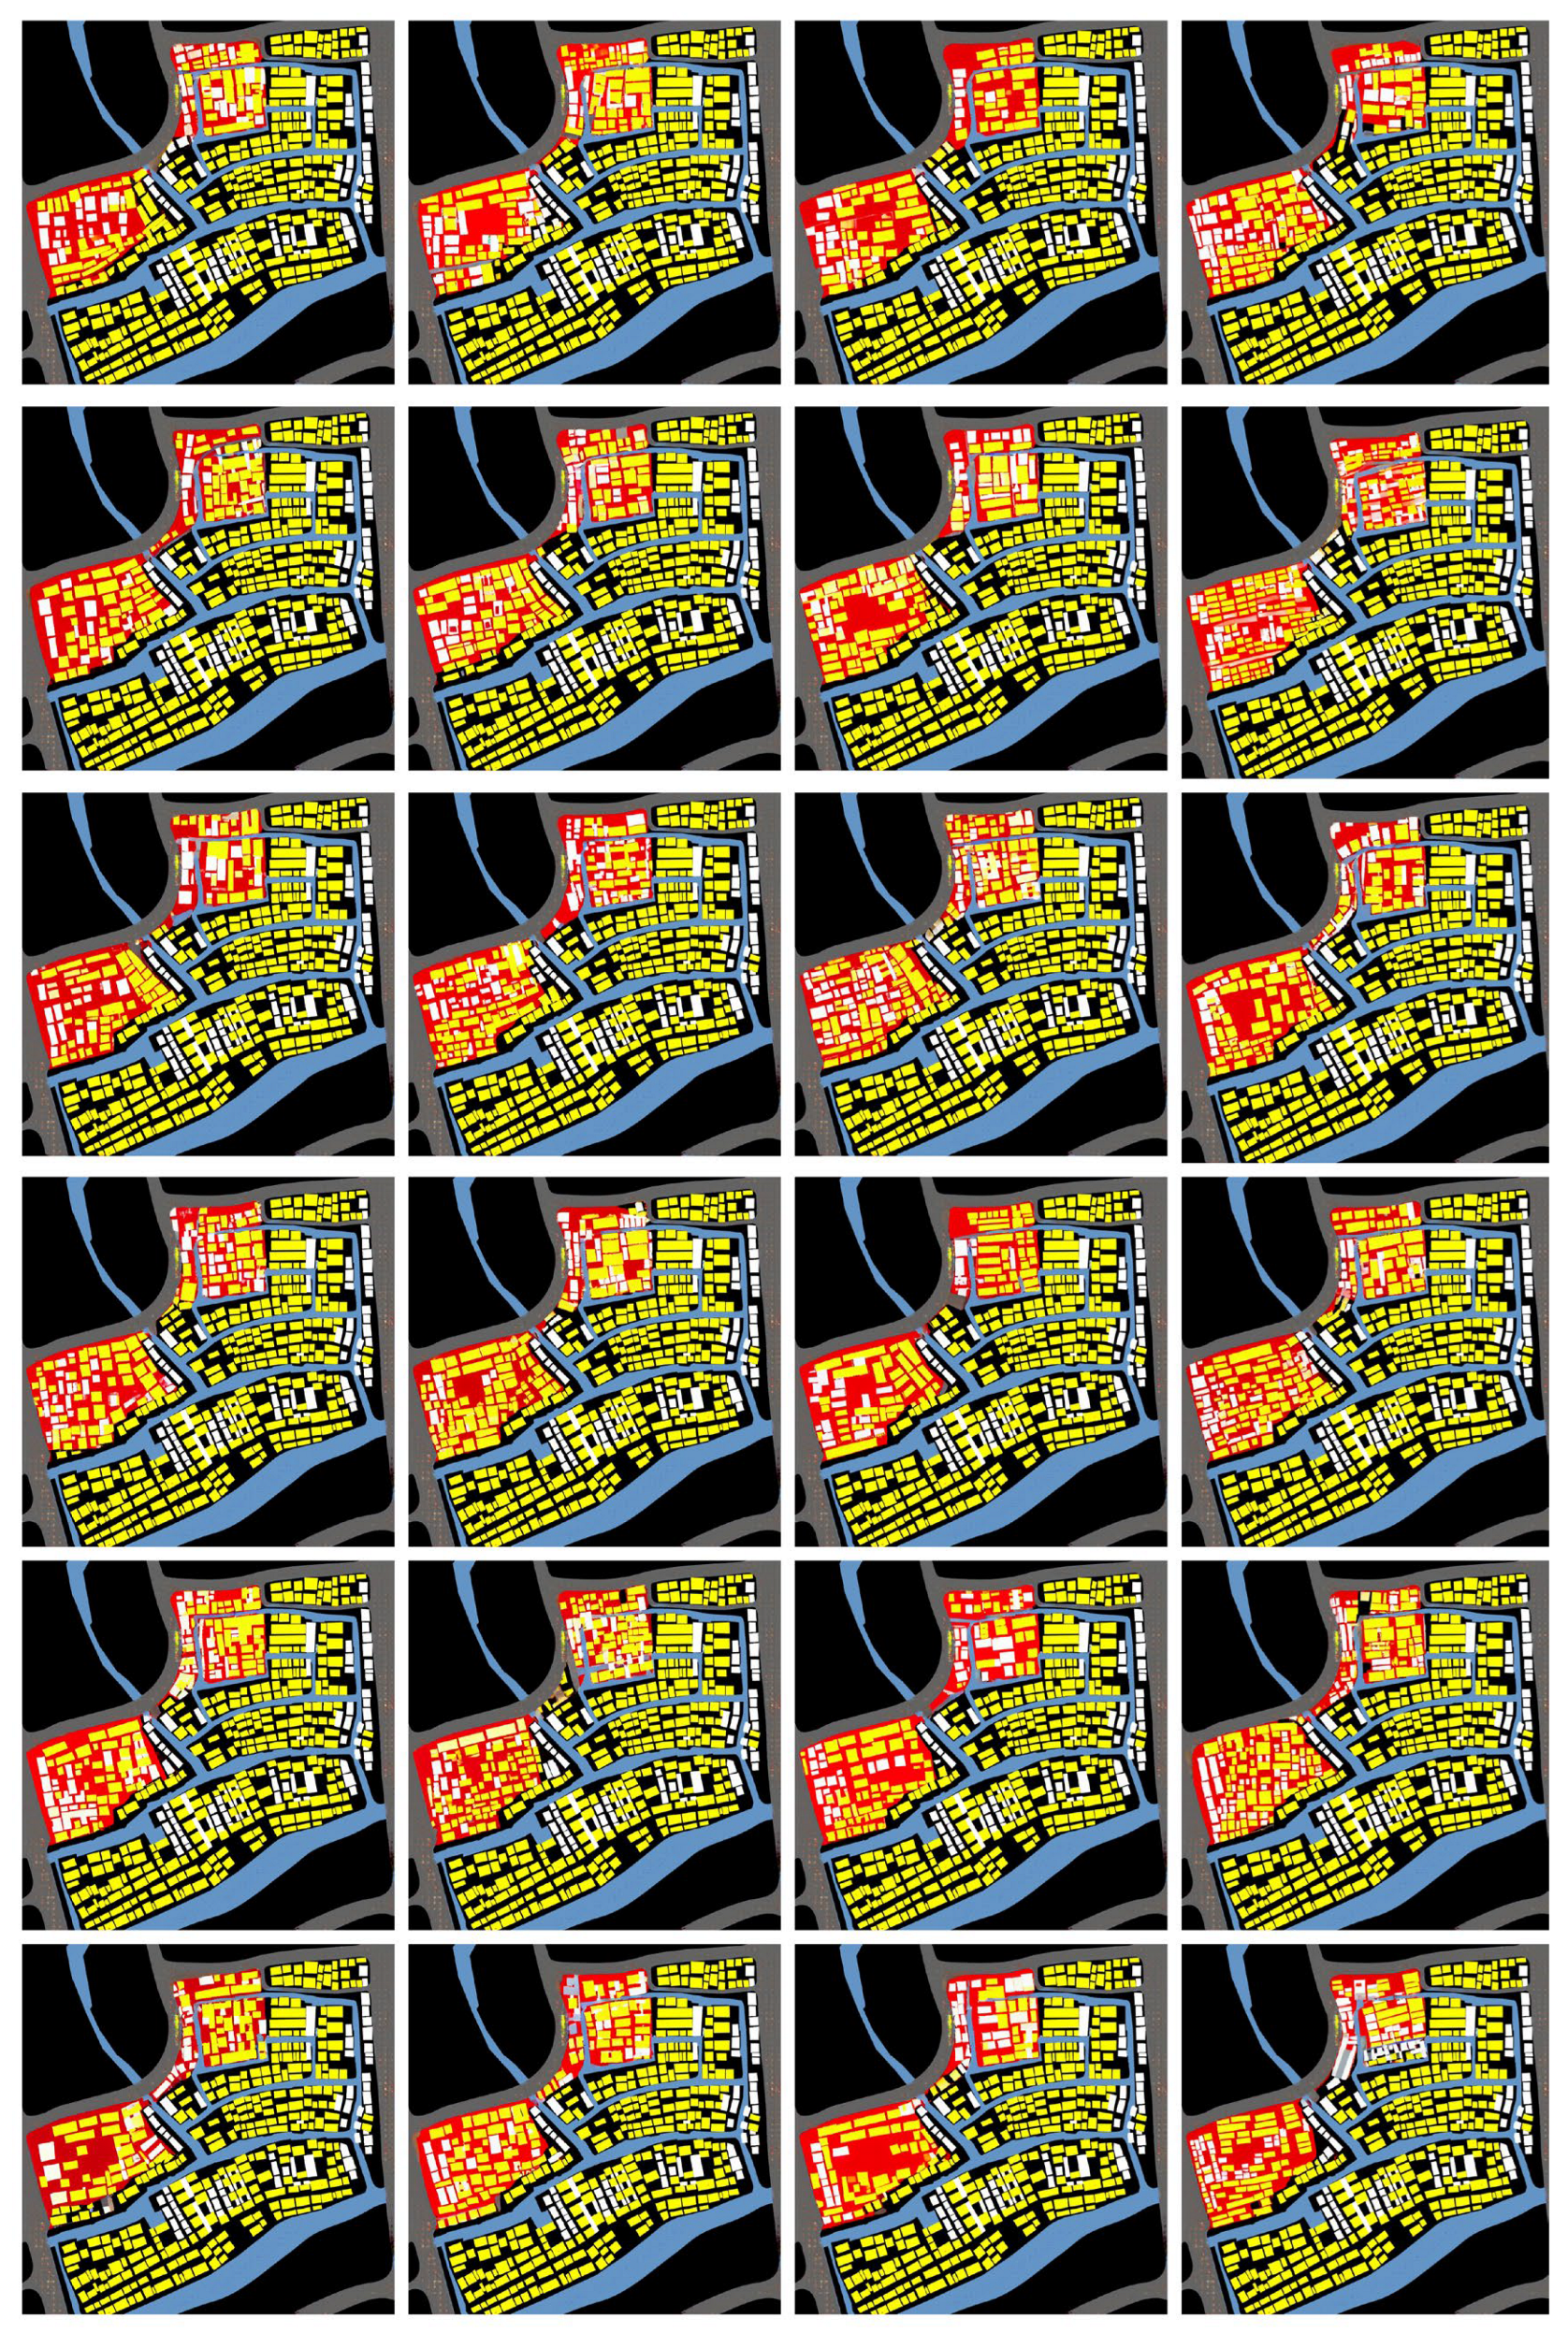
Figure A4. A subset of generation Results of Pix2PixHD-LoRA-1. Overview of the generation process and color-coding scheme for the paired dataset. The multi-channel site constraints are color-coded based on specific RGB values: black (0, 0, 0) for background, red (255, 0, 0) for land-use boundaries, blue (100, 150, 200) for waterways, grey (100, 100, 100) for street networks, yellow (255, 255, 0) for buildings with ridge orientations parallel to the watercourse, and white (255, 255, 255) for buildings with ridge orientations perpendicular to the watercourse.
Land 15 00976 g0a4
Table A1. Generation Results of Deep Learning Model.
Case A F C R A N S U A N L U A A F S A S D F A S N D A M C P A S T A A A S W A S D W Score
A10.880.960.10.550.710.830.660.660.480.336.17
B10.580.900.960.940.540.930.721.000.730.447.73
B20.571.000.940.920.420.910.701.000.700.497.65
B30.630.920.980.720.380.940.721.000.820.547.64
B40.550.960.960.790.280.940.711.000.780.547.49
B50.610.900.980.730.270.920.711.000.760.487.36
B60.650.820.940.550.320.920.720.980.820.517.23
B70.550.861.000.520.200.930.711.000.780.527.08
B80.640.721.000.440.100.930.721.000.870.556.95
B90.560.841.000.430.090.930.711.000.800.496.86
B100.570.500.980.360.330.950.721.000.860.536.80
B110.621.000.980.630.230.850.720.880.580.306.79
B120.570.521.000.320.070.970.711.000.900.646.71
B130.590.521.000.310.060.970.711.000.910.636.69
B140.580.881.000.530.160.870.720.950.570.406.66
B150.540.900.980.650.260.850.720.940.480.266.59
B160.440.920.960.690.390.850.720.950.400.266.58
B170.550.781.000.450.110.890.710.980.640.386.50
B180.520.860.980.660.530.840.710.840.410.086.42
B190.550.740.980.420.170.860.720.930.590.396.35
B200.360.941.000.510.120.840.700.760.300.105.63
B210.330.960.980.940.340.630.610.280.000.005.06
B220.260.960.900.710.710.640.460.280.000.004.92
B230.380.860.980.730.280.580.620.280.000.004.71
B240.330.921.000.500.110.650.670.330.000.004.51
B250.360.920.940.830.550.620.070.220.000.004.51
B260.120.941.000.590.230.570.740.250.000.004.45
B270.061.001.000.750.090.570.620.290.000.004.39
B280.280.921.000.660.170.620.190.250.000.004.10
B290.060.981.000.490.090.580.520.270.000.003.99
B300.451.001.000.960.310.780.000.440.010.003.72
B310.470.960.960.860.320.710.000.290.000.003.57
B320.410.980.960.790.420.750.000.410.000.003.56
B330.400.981.000.840.240.720.000.280.000.003.46
B340.490.921.000.810.230.770.000.440.100.003.44
B350.460.900.980.710.290.750.000.280.000.003.33
B360.490.900.980.620.310.760.000.320.090.003.30
B370.520.881.000.600.260.780.000.270.160.003.25
B380.410.921.000.620.240.600.000.230.000.003.19
B390.400.900.980.600.210.780.000.460.040.003.08
B400.360.861.000.480.160.750.000.290.000.002.85
C10.980.840.820.970.970.940.700.991.000.738.94
C21.000.960.820.840.970.940.700.981.000.748.94
C31.000.800.800.970.980.950.700.931.000.788.90
C41.000.820.760.950.970.940.700.971.000.708.82
C50.990.980.760.860.950.940.700.971.000.678.82
C60.920.800.860.880.990.940.701.001.000.738.82
C70.890.920.780.990.930.940.700.980.990.708.81
C80.940.820.740.960.960.940.701.001.000.738.78
C90.930.860.820.890.920.950.700.981.000.738.78
C100.960.740.840.910.960.950.700.881.000.778.71
C110.920.840.740.910.920.950.701.001.000.738.70
C120.940.840.860.950.960.930.700.900.980.668.70
C131.000.960.780.930.680.940.700.971.000.738.68
C140.910.860.900.880.740.950.701.001.000.738.67
C150.870.880.841.000.810.940.700.970.970.698.67
C161.000.900.820.960.620.930.700.991.000.748.65
C170.950.840.860.900.810.930.700.941.000.728.65
C181.000.960.660.710.940.940.701.001.000.748.65
C190.970.880.820.980.650.940.700.991.000.718.65
C200.980.940.720.890.740.930.700.991.000.768.63
C210.980.940.820.850.690.940.701.001.000.708.63
C221.000.820.840.790.840.950.700.891.000.798.63
C230.980.840.880.960.640.940.700.931.000.748.61
C240.930.980.840.970.510.950.701.001.000.718.60
C250.980.960.800.920.610.940.700.961.000.728.60
C261.000.800.840.960.580.950.700.981.000.788.58
C270.990.920.780.920.620.930.700.991.000.718.57
C280.940.840.880.980.520.950.701.001.000.768.57
C290.980.860.820.880.920.910.700.900.960.638.55
C300.860.940.820.860.860.940.701.000.940.638.55
C310.960.920.840.890.600.950.700.961.000.748.55
C320.840.860.840.990.750.950.700.960.970.698.55
C330.830.920.840.890.870.940.690.970.950.648.54
C340.930.880.800.880.670.940.701.001.000.738.53
C350.960.680.840.810.980.950.700.841.000.768.53
C360.930.920.840.890.630.940.700.961.000.718.52
C370.980.880.680.690.980.930.710.941.000.728.49
C380.900.980.820.710.840.940.700.970.940.698.49
C390.960.880.820.840.720.930.701.000.990.668.49
C400.930.760.840.910.840.920.700.970.970.668.48
C410.890.980.840.890.770.920.700.980.900.618.48
C420.960.740.760.930.890.930.700.940.980.658.48
C430.910.840.780.970.740.930.680.950.980.688.47
C440.920.800.800.900.730.950.700.961.000.708.47
C450.980.640.820.940.760.940.700.941.000.748.46
C460.920.760.840.710.890.950.700.961.000.738.46
C471.000.860.660.860.820.920.700.931.000.698.44
C480.940.940.881.000.380.930.700.950.990.738.44
C490.980.900.640.820.740.940.700.941.000.738.39
C500.860.860.860.970.590.940.700.980.960.658.38
C511.000.860.860.770.550.940.700.961.000.738.38
C521.000.900.760.690.760.920.700.881.000.758.36
C531.001.000.760.500.680.940.701.001.000.758.33
C541.000.740.820.750.660.940.700.931.000.768.31
C550.930.900.780.760.860.910.700.940.920.608.30
C561.000.660.880.800.670.930.700.951.000.718.30
C570.970.700.920.780.510.950.700.981.000.748.26
C580.950.740.840.900.930.860.710.780.880.668.25
C590.930.760.780.790.650.940.700.971.000.748.25
C600.890.920.840.990.730.870.700.940.780.588.24
C610.930.860.760.860.930.870.700.870.830.618.22
C620.900.960.820.830.630.910.700.980.910.588.21
C630.940.700.840.680.650.960.700.981.000.758.20
C640.930.900.780.970.850.850.700.880.770.578.20
C650.960.640.720.810.780.930.700.970.990.698.18
C660.950.760.740.930.960.870.700.800.840.628.17
C670.890.860.720.830.620.930.701.000.930.628.11
C680.960.900.660.670.710.930.700.920.970.688.10
C690.920.960.760.670.550.930.700.970.970.648.07
C700.930.860.920.990.000.950.710.971.000.738.05
C710.900.720.940.700.460.950.700.911.000.717.99
C721.000.900.740.630.370.930.700.951.000.747.96
C730.950.880.780.890.910.830.700.800.720.477.92
C740.940.980.740.650.320.930.700.980.980.687.90
C750.880.880.780.900.990.830.700.700.720.497.89
C761.000.860.720.740.720.850.700.830.840.607.86
C770.890.840.720.660.650.910.700.980.910.587.85
C780.870.900.880.830.530.860.700.900.760.577.81
C790.920.960.820.850.510.850.700.880.760.567.80
C801.000.840.780.720.240.930.700.891.000.717.80
C810.970.840.720.760.590.850.700.920.820.587.76
C820.880.940.720.800.880.840.700.740.720.497.70
C830.960.660.780.810.110.940.700.981.000.747.67
C840.940.960.720.560.160.920.700.980.970.717.62
C851.000.980.780.490.000.930.700.951.000.687.50
C861.000.680.760.810.040.930.700.831.000.747.50
C870.860.820.780.910.910.830.700.620.680.357.47
C881.000.920.680.600.710.820.700.700.740.517.38
C890.890.880.780.810.710.820.700.700.650.387.31
C900.900.880.800.950.920.800.410.590.580.417.23
C910.990.920.820.260.000.920.700.920.970.707.19
C920.950.820.760.920.800.790.410.690.550.307.01
C930.920.900.740.590.450.820.700.810.670.417.01
C940.900.960.740.630.840.800.410.690.560.446.97
C950.890.980.780.660.730.790.410.770.550.336.90
C960.910.860.740.500.000.830.700.740.710.526.50
C970.940.920.680.230.000.840.700.860.750.566.49
C980.780.920.860.880.670.780.000.350.410.214.12
C990.821.000.740.580.880.760.000.240.350.144.02
C1000.850.980.800.170.000.760.000.280.370.152.80
Note: The results are categorized into three groups: Group A (pix2pixHD generation), Group B (LoRA generation), and Group C (pix2pixHD-LoRA model generation). AFCR: Fabric Coverage Rate; ANSU: No. of Small Fabric Units; ANLU: No. of Large Fabric Units; AAFS: Average Fabric Size; ASDF: Standard Deviation of Fabric Size; ASND: Street Network Density; AMCP: Minimum Cost Path; ASTA: Spatio-Temporal Accessibility; AASW: Average Street Width; ASDW: Standard Deviation of Street Width.

Appendix B

This appendix documents the complete quantitative evaluation scores and the identified Multi-objective Optimization results.
Figure A5. A subset of generation Results of Pix2PixHD-LoRA-2. Overview of the generation process and color-coding scheme for the paired dataset. The multi-channel site constraints are color-coded based on specific RGB values: black (0, 0, 0) for back-ground, red (255, 0, 0) for land-use boundaries, blue (100, 150, 200) for waterways, grey (100, 100, 100) for street networks, yellow (255, 255, 0) for buildings with ridge orientations parallel to the watercourse, and white (255, 255, 255) for buildings with ridge orientations perpendicular to the watercourse.
Land 15 00976 g0a5
Figure A6. A subset of generation Results of Pix2PixHD-LoRA-3. Overview of the generation process and color-coding scheme for the paired dataset. The multi-channel site constraints are color-coded based on specific RGB values: black (0, 0, 0) for background, red (255, 0, 0) for land-use boundaries, blue (100, 150, 200) for waterways, grey (100, 100, 100) for street networks, yellow (255, 255, 0) for buildings with ridge orientations parallel to the watercourse, and white (255, 255, 255) for buildings with ridge orientations perpendicular to the watercourse.
Land 15 00976 g0a6
Table A2. Generation Results of Multi-objective Optimization.
Case A F C R A N S U A N L U A A F S A S D F A S N D A M C P A S T A A A S W A S D W Score
C1011.000.860.840.980.930.950.701.001.000.769.01
C1021.000.960.860.930.870.940.700.991.000.759.00
C1031.000.900.840.990.910.950.700.981.000.748.98
C1041.000.900.820.960.980.950.690.921.000.758.97
C1051.000.900.880.920.940.940.700.981.000.718.97
C1061.000.940.780.940.930.950.700.981.000.758.96
C1071.000.800.820.990.960.940.690.981.000.768.95
C1081.000.980.760.910.910.950.700.981.000.748.94
C1091.000.920.820.990.830.940.700.951.000.758.89
C1101.000.920.760.950.900.950.690.981.000.748.89
C1110.960.900.860.970.840.970.700.971.000.728.88
C1121.000.920.820.990.810.940.700.951.000.748.86
C1131.000.960.720.870.920.950.700.981.000.778.86
C1141.000.900.800.970.820.940.700.991.000.748.85
C1151.000.900.860.900.870.930.700.951.000.748.85
C1161.000.880.820.900.910.940.700.961.000.758.85
C1170.970.940.760.900.910.950.701.001.000.728.85
C1181.000.960.840.810.960.930.700.941.000.708.84
C1191.000.940.760.820.950.940.700.971.000.768.84
C1201.000.940.760.950.930.930.700.911.000.718.84
C1211.000.900.780.950.950.940.700.911.000.728.84
C1220.970.920.821.000.830.920.690.970.990.708.83
C1231.000.880.760.930.880.940.701.001.000.748.83
C1241.000.960.740.980.720.960.701.001.000.758.81
C1251.000.980.800.900.760.940.700.971.000.758.80
C1261.000.880.680.911.000.940.700.961.000.748.80
C1271.000.860.800.980.800.950.690.951.000.778.79
C1281.000.900.860.900.790.940.700.941.000.758.78
C1291.000.960.860.910.870.930.700.950.990.618.78
C1301.001.000.780.740.920.930.700.991.000.708.77
C1311.001.000.780.930.740.940.700.931.000.738.76
C1321.000.940.780.760.960.930.700.941.000.768.76
C1331.000.940.840.900.690.940.700.981.000.748.73
C1341.000.840.800.970.850.940.700.921.000.718.73
C1351.000.920.760.760.940.940.690.971.000.758.73
C1361.000.920.880.980.600.950.700.931.000.758.70
C1371.000.900.820.930.730.950.700.931.000.758.70
C1380.980.880.840.990.640.950.691.001.000.738.69
C1391.000.780.760.940.870.940.700.951.000.758.68
C1401.000.900.740.900.790.940.691.001.000.718.68
C1411.000.900.740.940.740.940.690.971.000.768.67
C1421.000.900.840.960.560.950.701.001.000.758.67
C1431.000.920.800.950.660.950.690.961.000.748.67
C1441.000.960.660.750.930.930.700.961.000.778.67
C1450.970.820.780.970.800.940.700.991.000.708.67
C1461.000.960.781.000.560.950.700.961.000.788.67
C1471.000.940.760.820.800.930.700.961.000.748.65
C1481.000.920.760.910.730.930.700.941.000.768.64
C1491.000.880.900.830.680.950.700.961.000.748.64
C1501.000.840.780.950.800.940.700.921.000.718.63
C1510.980.940.800.900.630.950.701.001.000.748.63
C1521.000.880.800.940.620.940.700.991.000.768.63
C1530.960.900.740.970.680.950.701.001.000.738.62
C1541.000.880.760.990.650.940.700.951.000.748.62
C1551.000.980.700.880.740.940.700.931.000.758.62
C1561.000.900.900.940.500.960.700.961.000.758.61
C1571.000.920.800.900.770.920.700.921.000.698.61
C1581.000.860.880.870.610.940.700.981.000.768.60
C1591.000.860.900.880.640.950.700.961.000.738.60
C1601.000.900.740.710.890.940.700.971.000.758.60
C1611.000.980.840.920.550.940.700.951.000.728.60
C1621.000.920.740.910.660.940.700.981.000.758.59
C1630.960.960.840.970.590.940.700.971.000.658.58
C1641.000.900.820.860.600.950.701.001.000.758.57
C1650.961.000.920.950.430.940.700.971.000.698.56
C1661.000.880.680.820.830.930.700.981.000.748.56
C1670.950.840.840.930.610.950.701.001.000.748.55
C1680.940.840.900.790.730.940.691.001.000.718.55
C1691.000.820.880.880.620.940.700.931.000.758.53
C1701.000.960.660.710.860.930.700.971.000.728.51
C1711.000.960.700.640.880.950.700.961.000.728.51
C1721.000.980.840.890.450.960.700.891.000.778.49
C1731.000.880.840.820.620.950.700.921.000.758.48
C1740.950.840.840.840.720.950.700.961.000.698.47
C1751.000.900.700.840.720.940.700.951.000.728.46
C1761.000.680.740.890.750.960.690.991.000.758.46
C1771.000.840.720.880.610.940.700.981.000.778.44
C1780.970.840.820.850.530.960.691.001.000.758.42
C1791.000.820.820.870.520.940.690.981.000.768.41
C1800.930.880.880.920.460.950.700.981.000.708.41
C1811.000.960.640.640.770.940.700.991.000.758.40
C1821.000.940.740.710.750.930.700.901.000.748.40
C1831.000.820.820.830.570.940.700.921.000.758.36
C1841.000.800.840.910.520.930.700.861.000.778.33
C1850.930.860.860.970.400.940.701.000.990.688.31
C1860.950.840.880.810.490.950.701.001.000.698.30
C1871.000.980.760.510.610.940.701.001.000.768.26
C1880.960.800.880.780.410.970.701.001.000.748.24
C1890.970.800.860.790.480.960.690.931.000.758.23
C1901.000.660.860.730.650.950.700.901.000.768.22
C1911.000.860.840.740.460.950.700.891.000.758.20
C1921.000.740.820.760.510.950.700.981.000.748.20
C1930.980.820.880.710.410.960.700.981.000.758.19
C1941.000.820.800.830.320.940.700.991.000.768.16
C1951.000.860.800.870.000.930.690.961.000.757.87
C1961.000.980.720.700.080.940.700.941.000.757.80
C1970.990.940.800.690.000.940.690.961.000.737.73
C1981.000.800.740.650.080.960.700.981.000.777.69
C1991.000.940.780.460.000.930.700.951.000.747.49
C2001.000.960.740.310.000.930.700.941.000.727.30
C2011.000.920.860.990.990.950.701.001.000.748.94
C2021.000.980.880.930.950.950.701.001.000.758.94
C2031.000.960.840.970.880.970.700.971.000.798.90
C2041.000.980.860.960.790.960.701.001.000.768.82
C2050.980.900.820.960.940.950.700.981.000.778.82
C2061.000.960.820.990.850.950.700.981.000.748.82
C2071.000.860.780.951.000.940.710.981.000.768.81
C2081.000.900.820.980.800.950.701.001.000.788.78
C2091.000.960.860.870.940.930.700.951.000.758.78
C2100.990.780.820.940.990.950.700.991.000.788.71
C2111.000.900.840.970.830.950.700.981.000.768.70
C2121.000.860.760.970.930.950.700.991.000.778.70
C2131.000.960.780.940.840.940.700.991.000.778.68
C2141.000.980.800.890.920.950.710.931.000.768.67
C2151.000.960.760.900.930.950.700.961.000.768.67
C2161.000.960.780.810.980.940.701.001.000.758.65
C2170.980.860.780.930.990.950.701.001.000.708.65
C2181.000.900.780.810.960.960.700.991.000.798.65
C2191.001.000.821.000.690.940.711.001.000.748.65
C2201.000.880.740.940.960.940.700.971.000.758.63
C2211.000.980.780.910.820.940.701.001.000.758.63
C2221.000.920.740.980.860.950.700.961.000.758.63
C2231.000.940.820.940.740.950.700.981.000.788.61
C2241.000.940.881.000.670.940.710.991.000.738.60
C2251.000.900.700.960.870.950.710.991.000.768.60
C2261.000.860.800.980.840.940.701.001.000.728.58
C2270.980.860.860.900.900.940.701.001.000.688.57
C2281.000.800.740.960.930.940.690.981.000.758.57
C2291.000.940.800.810.850.940.700.981.000.758.55
C2301.000.920.680.940.830.940.701.001.000.768.55
C2311.000.820.840.960.710.960.700.991.000.798.55
C2321.000.780.820.960.790.950.700.991.000.768.55
C2331.000.860.860.960.750.940.700.901.000.778.54
C2341.000.920.840.950.670.950.710.981.000.758.53
C2351.000.860.880.900.710.940.700.981.000.768.53
C2361.000.900.761.000.680.950.701.001.000.758.52
C2370.950.900.880.880.710.960.711.001.000.768.49
C2380.990.880.880.830.780.960.710.951.000.778.49
C2390.950.960.901.000.570.950.701.001.000.708.49
C2401.000.940.760.980.660.950.711.001.000.748.48
C2411.000.720.820.860.920.950.710.981.000.778.48
C2421.000.880.780.970.640.960.701.001.000.788.48
C2431.000.800.721.000.840.930.700.971.000.748.47
C2441.000.780.820.850.850.950.711.001.000.758.47
C2451.000.860.780.960.660.950.711.001.000.788.46
C2460.920.880.880.980.620.960.711.001.000.758.46
C2470.990.900.860.990.590.960.700.961.000.748.44
C2481.000.920.780.920.650.940.711.001.000.778.44
C2491.000.840.780.950.720.950.700.991.000.758.39
C2501.000.820.840.890.680.960.711.001.000.758.38
C2511.000.940.840.960.530.940.700.981.000.758.38
C2521.000.860.820.900.630.950.711.001.000.768.36
C2531.000.920.900.940.450.950.700.961.000.788.33
C2541.000.740.840.850.740.960.691.001.000.768.31
C2550.990.900.840.930.550.950.700.981.000.758.30
C2560.990.740.860.750.850.960.700.971.000.778.30
C2571.000.840.840.880.660.940.700.961.000.758.26
C2581.000.740.740.870.810.950.700.991.000.768.25
C2591.000.980.860.870.410.960.701.001.000.768.25
C2600.980.920.900.960.410.950.701.001.000.698.24
C2611.000.880.820.780.650.950.700.971.000.768.22
C2621.000.840.880.800.570.960.710.961.000.788.21
C2631.000.960.780.870.450.960.701.001.000.778.20
C2641.000.900.800.850.540.950.711.001.000.778.20
C2651.001.000.720.610.750.940.700.991.000.778.18
C2661.000.820.880.780.560.950.700.991.000.788.17
C2670.920.880.800.890.600.960.701.001.000.708.11
C2680.980.940.880.900.510.940.700.851.000.748.10
C2691.000.640.800.890.720.950.701.001.000.768.07
C2700.980.780.880.740.650.960.711.001.000.758.05
C2711.000.740.780.880.660.950.700.971.000.747.99
C2721.000.980.860.720.490.950.700.961.000.767.96
C2730.990.780.880.850.500.970.701.001.000.767.92
C2740.940.820.900.740.600.950.711.001.000.777.90
C2750.980.920.840.830.470.960.700.961.000.757.89
C2761.000.780.760.890.630.950.700.891.000.767.86
C2770.940.800.840.770.620.950.701.001.000.747.85
C2781.000.820.760.920.510.930.700.971.000.717.81
C2790.980.900.860.780.360.960.701.001.000.767.80
C2800.930.880.920.840.390.950.710.961.000.737.80
C2810.930.940.900.650.460.960.701.001.000.757.76
C2820.920.860.900.780.570.950.700.951.000.667.70
C2830.960.760.880.740.480.970.701.001.000.777.67
C2841.000.900.760.760.430.940.700.991.000.777.62
C2851.000.760.780.830.440.950.710.971.000.787.50
C2861.000.880.920.770.310.960.700.951.000.737.50
C2870.990.720.900.670.470.980.711.001.000.767.47
C2881.001.000.720.510.610.930.700.991.000.737.38
C2890.990.780.900.730.410.950.700.961.000.747.31
C2901.000.920.800.740.270.940.700.981.000.787.23
C2910.980.680.860.730.520.950.700.941.000.747.19
C2921.000.920.780.710.340.930.700.981.000.747.01
C2930.950.720.940.740.440.940.700.921.000.717.01
C2941.000.920.760.710.270.940.690.961.000.776.97
C2951.000.840.680.750.360.930.700.921.000.756.90
C2961.000.900.740.720.170.940.700.951.000.756.50
C2971.000.960.780.750.000.930.710.961.000.766.49
C2981.000.940.680.590.170.930.700.951.000.764.12
C2991.000.980.760.640.040.920.700.921.000.734.02
C3001.000.840.720.760.000.930.710.941.000.762.80
Note: C1–100 denote the first-generation data of multi-objective optimization; C101–200 represent the second-generation data; and C201–300 represent the third-generation data of multi-objective optimization. AFCR: Fabric Coverage Rate; ANSU: No. of Small Fabric Units; ANLU: No. of Large Fabric Units; AAFS: Average Fabric Size; ASDF: Standard Deviation of Fabric Size; ASND: Street Network Density; AMCP: Minimum Cost Path; ASTA: Spatio-Temporal Accessibility; AASW: Average Street Width; ASDW: Standard Deviation of Street Width.

References

  1. Yuan, X. Protection and Development of Historical and Cultural Blocks. Sustain. Dev. 2024, 14, 185–192. [Google Scholar] [CrossRef]
  2. Liu, P.; Neppl, M. A Research on the Conservation of Plot Pattern of Chinese Historic Cities: Connotations, Transformations and Strategies. Urban Plan. Forum 2020, 5, 92–99. [Google Scholar] [CrossRef]
  3. Zhang, C.; Guo, W.; Xie, J.; Wang, W. Reconstruction of City Historical Block Spatial Texture Based on Parametric Technology: A Case Study on Nanjing Lotus Pond. Art Des. 2019, 3, 80–83. (In Chinese) [Google Scholar] [CrossRef]
  4. Goodfellow, I.J.; Pouget-Abadie, J.; Mirza, M.; Xu, B.; Warde-Farley, D.; Ozair, S.; Courville, A.; Bengio, Y. Generative Adversarial Nets. Adv. Neural Inf. Process. Syst. 2014, 27, 2672–2680. Available online: https://proceedings.neurips.cc/paper_files/paper/2014/file/f033ed80deb0234979a61f95710dbe25-Paper.pdf (accessed on 1 April 2026).
  5. Wang, T.-C.; Liu, M.-Y.; Zhu, J.-Y.; Tao, A.; Kautz, J.; Catanzaro, B. High-Resolution Image Synthesis and Semantic Manipulation with Conditional GANs. In Proceedings of the IEEE Conference on Computer Vision and Pattern Recognition, Salt Lake City, UT, USA, 18–23 June 2018. [Google Scholar] [CrossRef] [Scilit]
  6. Shim, J.; Moon, J.; Kim, H.; Hwang, E. FloorDiffusion: Diffusion Model-Based Conditional Floorplan Image Generation Method Using Parameter-Efficient Fine-Tuning and Image Inpainting. J. Build. Eng. 2024, 95, 110320. [Google Scholar] [CrossRef] [Scilit]
  7. Hu, X.; Zheng, H.; Lai, D. Prediction and Optimization of Daylight Performance of AI-Generated Residential Floor Plans. Build. Environ. 2025, 279, 113054. [Google Scholar] [CrossRef] [Scilit]
  8. ICOMOS. The Nara Document on Authenticity. Available online: https://www.icomos.org/charters/nara-e.pdf (accessed on 29 May 2026).
  9. UNESCO. Recommendation on the Historic Urban Landscape. Available online: https://whc.unesco.org/en/hul/ (accessed on 29 May 2026).
  10. Kou, H.; Zhou, J.; Chen, J.; Zhang, S. Conservation for Sustainable Development: The Sustainability Evaluation of the Xijie Historic District, Dujiangyan City, China. Sustainability 2018, 10, 4645. [Google Scholar] [CrossRef] [Scilit]
  11. Liu, X.; Wu, L.; Ye, M.; Liu, Q. Let Us Build Bridges: Understanding and Extending Diffusion Generative Models. arXiv 2022. [Google Scholar] [CrossRef] [Scilit]
  12. Balloni, E.; Paolanti, M.; Uggeri, J.; Zingaretti, P.; Pierdicca, R. Enhancing Cultural Heritage with Generative AI: A Comparative Framework for the Evaluation of 3D Model Accuracy and Visual Fidelity. Digit. Herit. 2025, 1–10. [Google Scholar] [CrossRef]
  13. Merrell, P.; Schkufza, E.; Koltun, V. Computer-Generated Residential Building Layouts. ACM Trans. Graph. 2010, 29, 181. [Google Scholar] [CrossRef] [Scilit]
  14. Isola, P.; Zhu, J.-Y.; Zhou, T.; Efros, A.A. Image-to-Image Translation with Conditional Adversarial Networks. In Proceedings of the IEEE Conference on Computer Vision and Pattern Recognition, Honolulu, HI, USA, 21–26 July 2017. [Google Scholar] [CrossRef] [Scilit]
  15. Yang, Y.; Wu, Y.; Liu, Y.; Zhang, Y.; Xu, Z. Automatic Layout of Building Functions Based on Generative Adversarial Network. In Proceedings of the China Civil Engineering Society, Beijing, China, 20–22 September 2020. (In Chinese) [Google Scholar] [CrossRef]
  16. Wang, S.; Zeng, W.; Chen, X.; Ye, Y.; Qiao, Y.; Fu, C.-W. Actfloor-GAN: Activity-Guided Adversarial Networks for Human-Centric Floorplan Design. IEEE Trans. Vis. Comput. Graph. 2021, 29, 1610–1624. [Google Scholar] [CrossRef] [Scilit]
  17. Deng, Q.; Lin, W.; Liu, Y.; Liang, L. Exploration of Generative Design of Campus General Layout Based on Generative Adversarial Network: Taking Primary School Campuses as Example. World Archit. 2021, 9, 115–119. (In Chinese) [Google Scholar] [CrossRef]
  18. Liu, Y.; Stouffs, R.; Yang, Y. Urban Design Process with Conditional Generative Adversarial Networks. Archit. J. 2018, 9, 108–113. (In Chinese). Available online: https://scholarbank.nus.edu.sg/handle/10635/195769 (accessed on 29 May 2026).
  19. Tian, R. Suggestive Site Planning with Conditional GAN and Urban GIS Data. In Proceedings of the 2020 DigitalFUTURES; Springer: Singapore, 2020; pp. 103–113. [Google Scholar] [CrossRef] [Scilit]
  20. Liu, Y.; Hu, K.; Deng, Q. Artificial Intelligence-Assisted Case-Based Design: A Case Study on Urban Texture Darning Surrounding the Ancient City of Nantou in Shenzhen. South Archit. 2023, 10, 20–27. (In Chinese) [Google Scholar] [CrossRef]
  21. Carbone, D.; Hua, M.; Coste, S.; Vanden-Eijnden, E. Efficient Training of Energy-Based Models Using Jarzynski Equality. J. Stat. Mech. 2024, 2024, 104019. [Google Scholar] [CrossRef] [Scilit]
  22. Ho, J.; Jain, A.; Abbeel, P. Denoising Diffusion Probabilistic Models. arXiv 2020. [Google Scholar] [CrossRef] [Scilit]
  23. Zhang, J.; Huang, Y.; Li, Z.; Li, Y.; Yu, Z.; Li, M. Development of a Method for Commercial Style Transfer of Historical Architectural Facades Based on Stable Diffusion Models. J. Imaging 2024, 10, 165. [Google Scholar] [CrossRef] [Scilit]
  24. Sharma, H.; Kumar, R.; Gupta, M.; Chilluri, V.S.B. Boosting GAN Performance Through Dataset Augmentation with Denoising Diffusion Models. In Proceedings of the 2025 3rd International Conference on Disruptive Technologies (ICDT), Greater Noida, India, 7–8 March 2025. [Google Scholar] [CrossRef] [Scilit]
  25. Lin, B.; Jabi, W.; Corcoran, P.; Lannon, S. The Application of Deep Generative Models in Urban Form Generation Based on Topology: A Review. Archit. Sci. Rev. 2023, 67, 189–204. [Google Scholar] [CrossRef] [Scilit]
  26. Shorten, C.; Khoshgoftaar, T.M. A Survey on Image Data Augmentation for Deep Learning. J. Big Data 2019, 6, 60. [Google Scholar] [CrossRef] [Scilit]
  27. Perez, L.; Wang, J. The Effectiveness of Data Augmentation in Image Classification Using Deep Learning. arXiv 2017. [Google Scholar] [CrossRef] [Scilit]
  28. Krizhevsky, A.; Sutskever, I.; Hinton, G.E. ImageNet Classification with Deep Convolutional Neural Networks. Commun. ACM 2017, 60, 84–90. [Google Scholar] [CrossRef] [Scilit]
  29. Usui, H. Optimisation of Building and Road Network Densities in Terms of Variation in Plot Sizes and Shapes. Environ. Plan. B 2020, 48, 1263–1278. [Google Scholar] [CrossRef] [Scilit]
  30. Zhao, J.; Hao, X.; Yang, Y. Research on Urban Sustainability Indicators Based on Urban Grain: A Case Study in Jinan, China. Sustainability 2023, 15, 13320. [Google Scholar] [CrossRef] [Scilit]
  31. Usui, H.; Asami, Y. Size Distribution of Building Lots and Density of Buildings and Street Networks: Theoretical Derivation Based on Gibrat’s Law and Empirical Study of Downtown Districts in Tokyo. Int. Reg. Sci. Rev. 2019, 43, 229–253. [Google Scholar] [CrossRef] [Scilit]
  32. Rebecchi, A.; Buffoli, M.; Dettori, M.; Appolloni, L.; Azara, A.; Castiglia, P.; D’Alessandro, D.; Capolongo, S. Walkable Environments and Healthy Urban Moves: Urban Context Features Assessment Framework Experienced in Milan. Sustainability 2019, 11, 2778. [Google Scholar] [CrossRef] [Scilit]
  33. Iamtrakul, P.; Chayphong, S.; Gao, W. Assessing Spatial Disparities and Urban Facility Accessibility in Promoting Health and Well-Being. Transp. Res. Interdiscip. Perspect. 2024, 25, 101126. [Google Scholar] [CrossRef] [Scilit]
  34. Ying, X.; Gao, J.; Liu, Z.; Qin, X.; Chen, J.; Shen, L.; Han, X. Investigation of Pedestrian-Level Wind Environment with Skyline Quantitative Factors. Buildings 2022, 12, 792. [Google Scholar] [CrossRef] [Scilit]
  35. Ying, X.; Wang, Y.; Li, W.; Liu, Z.; Ding, G. Group Layout Pattern and Outdoor Wind Environment of Enclosed Office Buildings in Hangzhou. Energies 2020, 13, 406. [Google Scholar] [CrossRef] [Scilit]
  36. Ying, X.-Y.; Ding, G.; Hu, X.-J.; Zhang, Y.-Q. Developing Planning Indicators for Outdoor Wind Environments of High-Rise Residential Buildings. J. Zhejiang Univ.-Sci. A 2016, 17, 378–388. [Google Scholar] [CrossRef] [Scilit]
  37. Tan, Y.; Ying, X.; Gao, W.; Wang, S.; Liu, Z. Applying an Extended Theory of Planned Behavior to Predict Willingness to Pay for Green and Low-Carbon Energy Transition. J. Clean. Prod. 2023, 387, 135893. [Google Scholar] [CrossRef] [Scilit]
  38. Wu, J.; Chen, S.; Ying, X.; Shu, J. Influencing Factors on Air Conditioning Energy Consumption of Naturally Ventilated Research Buildings Based on Actual HVAC Behaviours. Buildings 2023, 13, 2710. [Google Scholar] [CrossRef] [Scilit]
  39. Wu, J.; Qiu, R.; Ying, X.; Chen, S.; Zhao, X. Optimising Behavioural Control Based on Actual HVAC Use in Naturally Ventilated Buildings. Energies 2025, 18, 6130. [Google Scholar] [CrossRef] [Scilit]
  40. Weng, J.; Zhang, Y.; Chen, Z.; Ying, X.; Zhu, W.; Sun, Y. Field Measurements and Analysis of Indoor Environment, Occupant Satisfaction, and Sick Building Syndrome in University Buildings in Hot Summer and Cold Winter Regions in China. Int. J. Environ. Res. Public Health 2023, 20, 554. [Google Scholar] [CrossRef] [Scilit] [PubMed]
  41. Weng, J.; Huang, F.; Lin, J.; Wang, Q.; Ying, X.; Sun, Y.; Tan, Y. Sick Building Syndrome: Prevalence and Risk Factors Among Medical Staff in Chinese Hospitals. Buildings 2025, 15, 1397. [Google Scholar] [CrossRef] [Scilit]
Figure 1. The proposed computational workflow integrating GANs, Diffusion Models, and Multi-Objective Optimization.
Land 15 00976 g001
Figure 2. Schematic diagram of the pre-processed semantic samples: (a) Subset A Training|Test Set; (b) Subset B Training Set.
Land 15 00976 g002
Figure 3. The network architecture of the Pix2PixHD framework.
Land 15 00976 g003
Figure 4. Architecture of the Diffusion Model integrated with LoRA.
Land 15 00976 g004
Figure 5. The designated renovation area within the Yuehe Historic District, Jiaxing.
Land 15 00976 g005
Figure 6. Quantitative evaluation of the architectural fabric and street network for the optimal generation scheme: (a) Original Site Conditions (red area: renovative area); (b) Fabric Coverage Rate; (c) Average Fabric Size and Standard Deviation; (d) Number of Small (Large) Fabric Units; (e) Average Street Width and Size Standard Deviation; (f) Minimum Cost Path; (g) Street Network Density and Spatio-Temporal Accessibility.
Land 15 00976 g006
Figure 7. Stacked bar chart comparing evaluation metrics across the Original Area, Expanded Area, and Generated Area.
Land 15 00976 g007
Table 1. The quantitative evaluation indicator system for historic district regeneration.
DimensionEvaluation IndicatorScoring Criteria & Ideal ThresholdsWeight (%)
Architectural
Fabric
A F C R Fabric Coverage RateOpt. *: ≥50%.
Pen.: −0.1 per 5% decrease.
11.8
A N S U No. of Small Fabric UnitsOpt.: 0 units.
Pen.: −0.1 per 5 additional units.
9.5
A N L U No. of Large Fabric UnitsOpt.: 0 units.
Pen.: −0.1 per 5 additional units.
7.4
A A F S Average Fabric SizeOpt.: 120 m2.
Pen.: −0.1 per 10 m2 deviation.
12.1
A S D F Standard Deviation of Fabric SizeOpt.: 120 m2.
Pen.: −0.1 per 10 m2 deviation.
7.9
Street
Network
A S N D Street Network DensityOpt.: ≥1000 m/ha.
Pen.: −0.05 per 100 m/ha decrease.
11.1
A M C P Minimum Cost PathOpt.: Euclidean distance.
Pen.: −0.1 per 10 m excess.
8.3
A S T A Spatio-Temporal AccessibilityRange: 0–1.12.6
A A S W Average Street WidthOpt.: 6 m.
Limit: Linear scale to 6–10 m.
10.6
A S D W Standard Deviation of Street WidthOpt.: 2 m.
Limit: Linear scale to 2–6 m.
8.7
* Opt. (Optimal Value) represents the benchmark for a full score; Pen. (Penalty) denotes the point deduction per unit of deviation. This weighting scheme is grounded in Jiangnan morphological theory and confirmed by expert consensus.
Table 2. Comparison of Quantitative Evaluation Scores among the Original Area, Expanded Area, and GAopt.
DimensionEvaluation IndicatorOriginal AreaExpanded AreaGAopt
Raw *Wtd. *RawWtd.RawWtd.
Architectural
Fabric
Fabric Coverage Rate0.930.110.910.111.000.12
No. of Small Fabric Units0.920.090.980.090.920.09
No. of Large Fabric Units0.880.070.580.040.860.06
Average Fabric Size0.890.110.430.050.990.12
Standard Deviation of Fabric Size0.740.0600.000.990.08
Street
Network
Street Network Density0.910.100.870.100.950.11
Minimum Cost Path0.720.060.620.050.700.06
Spatio-Temporal Accessibility10.130.950.121.000.13
Average Street Width0.980.100.640.071.000.11
Standard Deviation of Street Width0.720.060.380.030.740.06
Total Score\8.690.896.360.669.160.94
* Raw = normalized indicator score (0–1). Wtd. = Raw × Weigh (rounded to two decimal places). The weighted total is the sum of Wtd. scores. Weights follow the updated Table 1. GAopt improves over the Expanded Area by 42.4% in weighted total.
Table 3. Stability of the weighted comprehensive score for each generative method based on independent runs.
StatisticPix2PixHD
(n = 1)
LoRA
(n = 40)
Pix2PixHD–LoRA
(n = 100)
Mean score0.630.610.84
Intra-run standard deviation±0.15±0.07
Intra-run range (min–max) *0.39–0.790.45–0.90
Cross-run standard deviation±0.02
* Pix2PixHD is deterministic and yields a single output. LoRA and Pix2PixHD–LoRA statistics are computed over 40 and 100 independent samples, respectively. Intra-run standard deviation and range reflect the diversity of generated candidates within a single generation run. Cross-run standard deviation (±0.02 for the hybrid model) reflects the stability of the mean score across multiple complete training runs, as estimated by 5-fold cross-validation (Section 3.1).
Table 4. Comparison of Evaluation Indicator Scores for the Pix2PixHD, LoRA, and Pix2PixHD-LoRA.
DimensionEvaluation IndicatorPix2PixHDLoRAPix2PixHD-LoRA
Raw *Wtd. *RawWtd.RawWtd.
Architectural
Fabric
Fabric Coverage Rate0.880.100.46 ± 0.150.05 ± 0.020.91 ± 0.020.11 ± 0.00
No. of Small Fabric Units0.960.090.88 ± 0.120.08 ± 0.010.90 ± 0.060.09 ± 0.01
No. of Large Fabric Units0.100.010.98 ± 0.020.07 ± 0.000.33 ± 0.060.02 ± 0.00
Average Fabric Size0.550.070.64 ± 0.170.08 ± 0.020.85 ± 0.110.10 ± 0.01
Standard Deviation of Fabric Size0.710.060.26 ± 0.150.02 ± 0.010.95 ± 0.050.08 ± 0.00
Street
Network
Street Network Density0.830.090.79 ± 0.130.09 ± 0.010.94 ± 0.010.10 ± 0.00
Minimum Cost Path0.660.050.47 ± 0.320.04 ± 0.030.73 ± 0.010.06 ± 0.00
Spatio-Temporal Accessibility0.660.080.63 ± 0.340.08 ± 0.040.96 ± 0.070.12 ± 0.01
Average Street Width0.480.050.35 ± 0.360.04 ± 0.040.88 ± 0.050.09 ± 0.01
Standard Deviation of Street Width0.330.030.21 ± 0.240.02 ± 0.020.60 ± 0.080.05 ± 0.01
Total Score\6.170.635.38 ± 1.640.61 ± 0.158.06 ± 0.190.84 ± 0.02
* Raw = normalized indicator score (0–1). Wtd. = Raw × Weigh (rounded to two decimal places). The weighted total is the sum of Wtd. scores. Values are mean ± standard deviation over 100 candidate solutions per generation. LoRA and Pix2PixHD-LoRA values represent mean ± standard deviation over 40 and 100 generated samples, respectively. The Pix2PixHD-LoRA total score standard deviation (±0.02) reflects cross-run model stability (see Table 5 for intra-population diversity).
Table 5. Evaluation Comparison of Pix2PixHD-LoRA Multi-Objective Optimization Results.
DimensionEvaluation IndicatorPix2PixHD-
LoRA-1
Pix2PixHD-
LoRA-2
Pix2PixHD-
LoRA-3
Raw *Wtd. *RawWtd.RawWtd.
Architectural
Fabric
Fabric Coverage Rate0.94 ± 0.050.11 ± 0.010.99 ± 0.020.12 ± 0.000.99 ± 0.020.12 ± 0.00
No. of Small Fabric Units0.87 ± 0.090.08 ± 0.010.9 ± 0.060.09 ± 0.010.88 ± 0.080.08 ± 0.01
No. of Large Fabric Units0.79 ± 0.060.06 ± 0.000.8 ± 0.060.06 ± 0.000.82 ± 0.060.06 ± 0.00
Average Fabric Size0.81 ± 0.160.10 ± 0.020.87 ± 0.120.11 ± 0.010.86 ± 0.110.10 ± 0.01
Standard Deviation of Fabric Size0.68 ± 0.260.05 ± 0.020.69 ± 0.230.05 ± 0.020.65 ± 0.230.05 ± 0.02
Street
Network
Street Network Density0.91 ± 0.050.10 ± 0.010.94 ± 0.010.10 ± 0.000.95 ± 0.010.11 ± 0.00
Minimum Cost Path0.67 ± 0.130.06 ± 0.010.7 ± 00.06 ± 0.000.7 ± 00.06 ± 0.00
Spatio-Temporal Accessibility0.9 ± 0.140.11 ± 0.020.96 ± 0.030.12 ± 0.000.98 ± 0.030.12 ± 0.00
Average Street Width0.91 ± 0.150.10 ± 0.021 ± 00.11 ± 0.001 ± 00.11 ± 0.00
Standard Deviation of Street Width0.65 ± 0.140.06 ± 0.010.74 ± 0.030.06 ± 0.000.75 ± 0.020.07 ± 0.00
Total Score *\8.08 ± 0.950.84 ± 0.078.58 ± 0.320.89 ± 0.038.58 ± 0.330.89 ± 0.02
* Raw = normalized indicator score (0–1). Wtd. = Raw × Weigh (rounded to two decimal places). The weighted total is the sum of Wtd. scores. Values are mean ± standard deviation over 100 candidate solutions per generation. Data represent mean ± standard deviation across the population of 100 candidate solutions at each generation. Generation 1 corresponds to the initial Pix2PixHD-LoRA outputs, Generations 2 and 3 are the first and second rounds of multi-objective optimization. Data represents the mean ± standard deviation of multiple runs of the hybrid model ( n = 100 ).
Disclaimer/Publisher’s Note: The statements, opinions and data contained in all publications are solely those of the individual author(s) and contributor(s) and not of MDPI and/or the editor(s). MDPI and/or the editor(s) disclaim responsibility for any injury to people or property resulting from any ideas, methods, instructions or products referred to in the content.