Urban Vitality in Metropolitan Fringe Areas as Land-Use Transition Interfaces: Nonlinear Associations with the Built Environment in the Chengdu Metropolitan Area, China




Abstract
1. Introduction
1.1. Metropolitan Fringe Areas as Land-Use Transition Interfaces
1.2. Urban Vitality Research and the Limits of Central-City Experience
1.3. Built Environment and the Nonlinear Turn in Vitality Studies
1.4. Research Gap and Our Study
2. Method
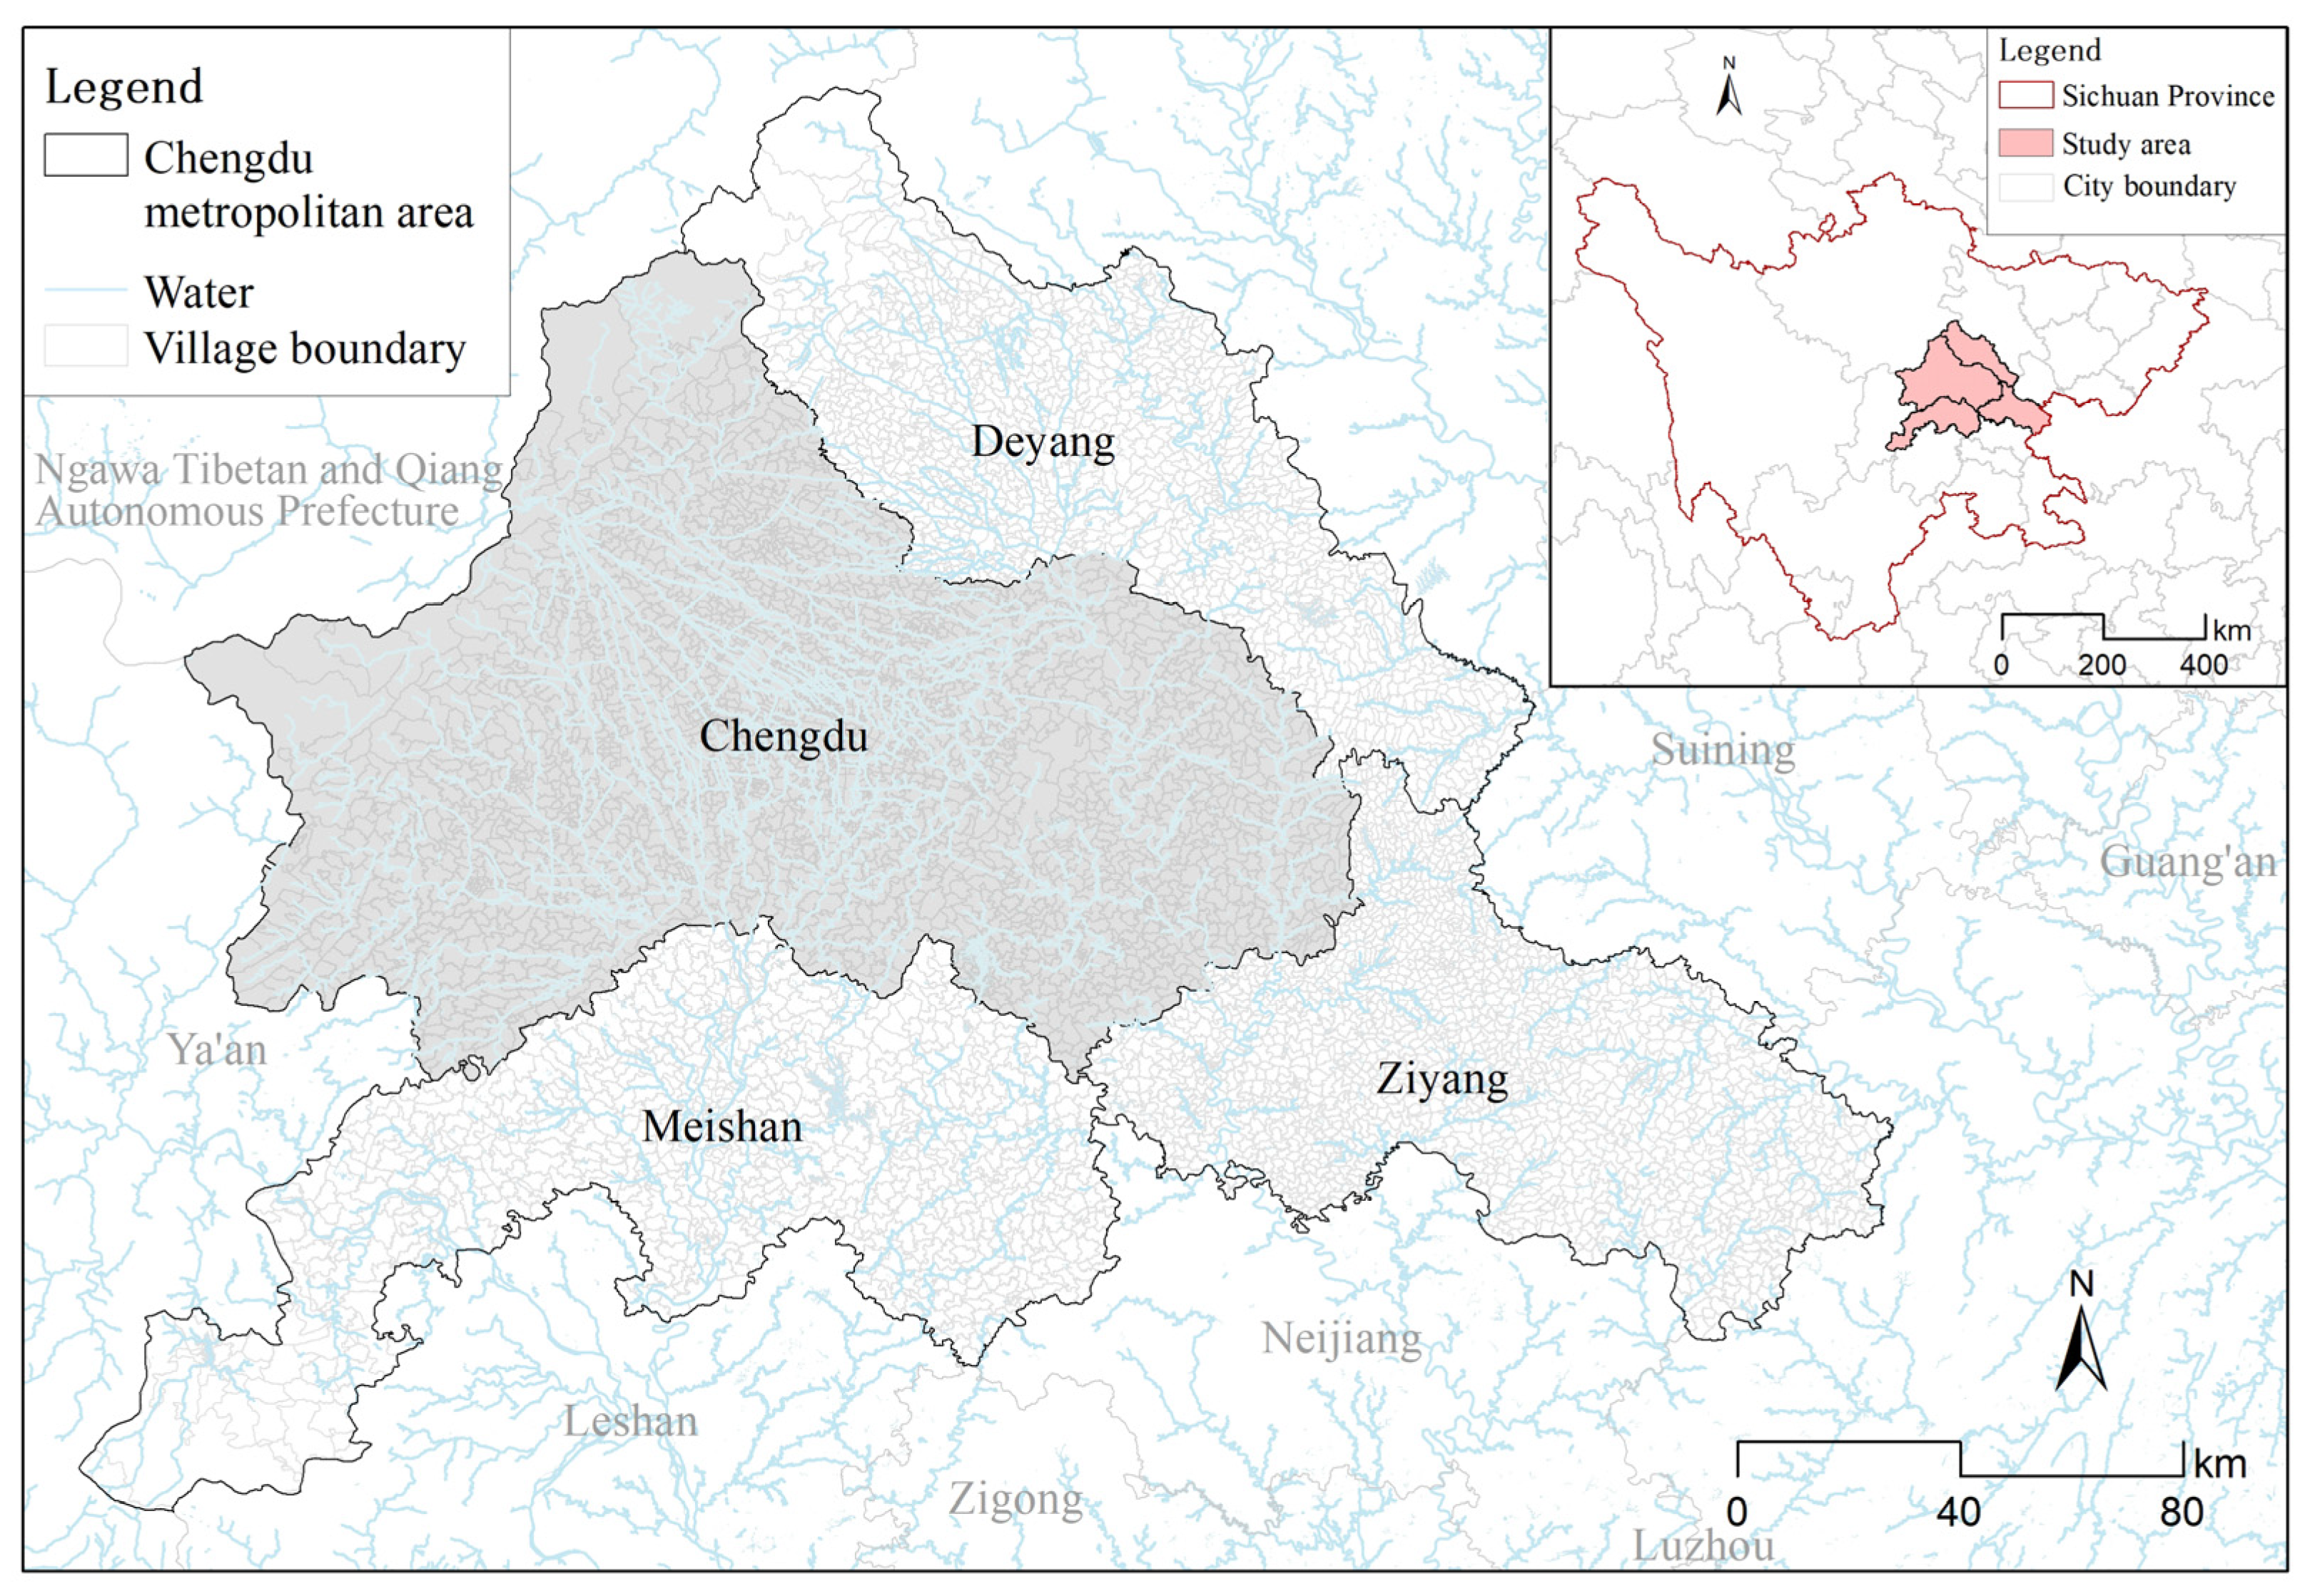
2.1. Study Area
2.2. Data Sources and Variable Construction
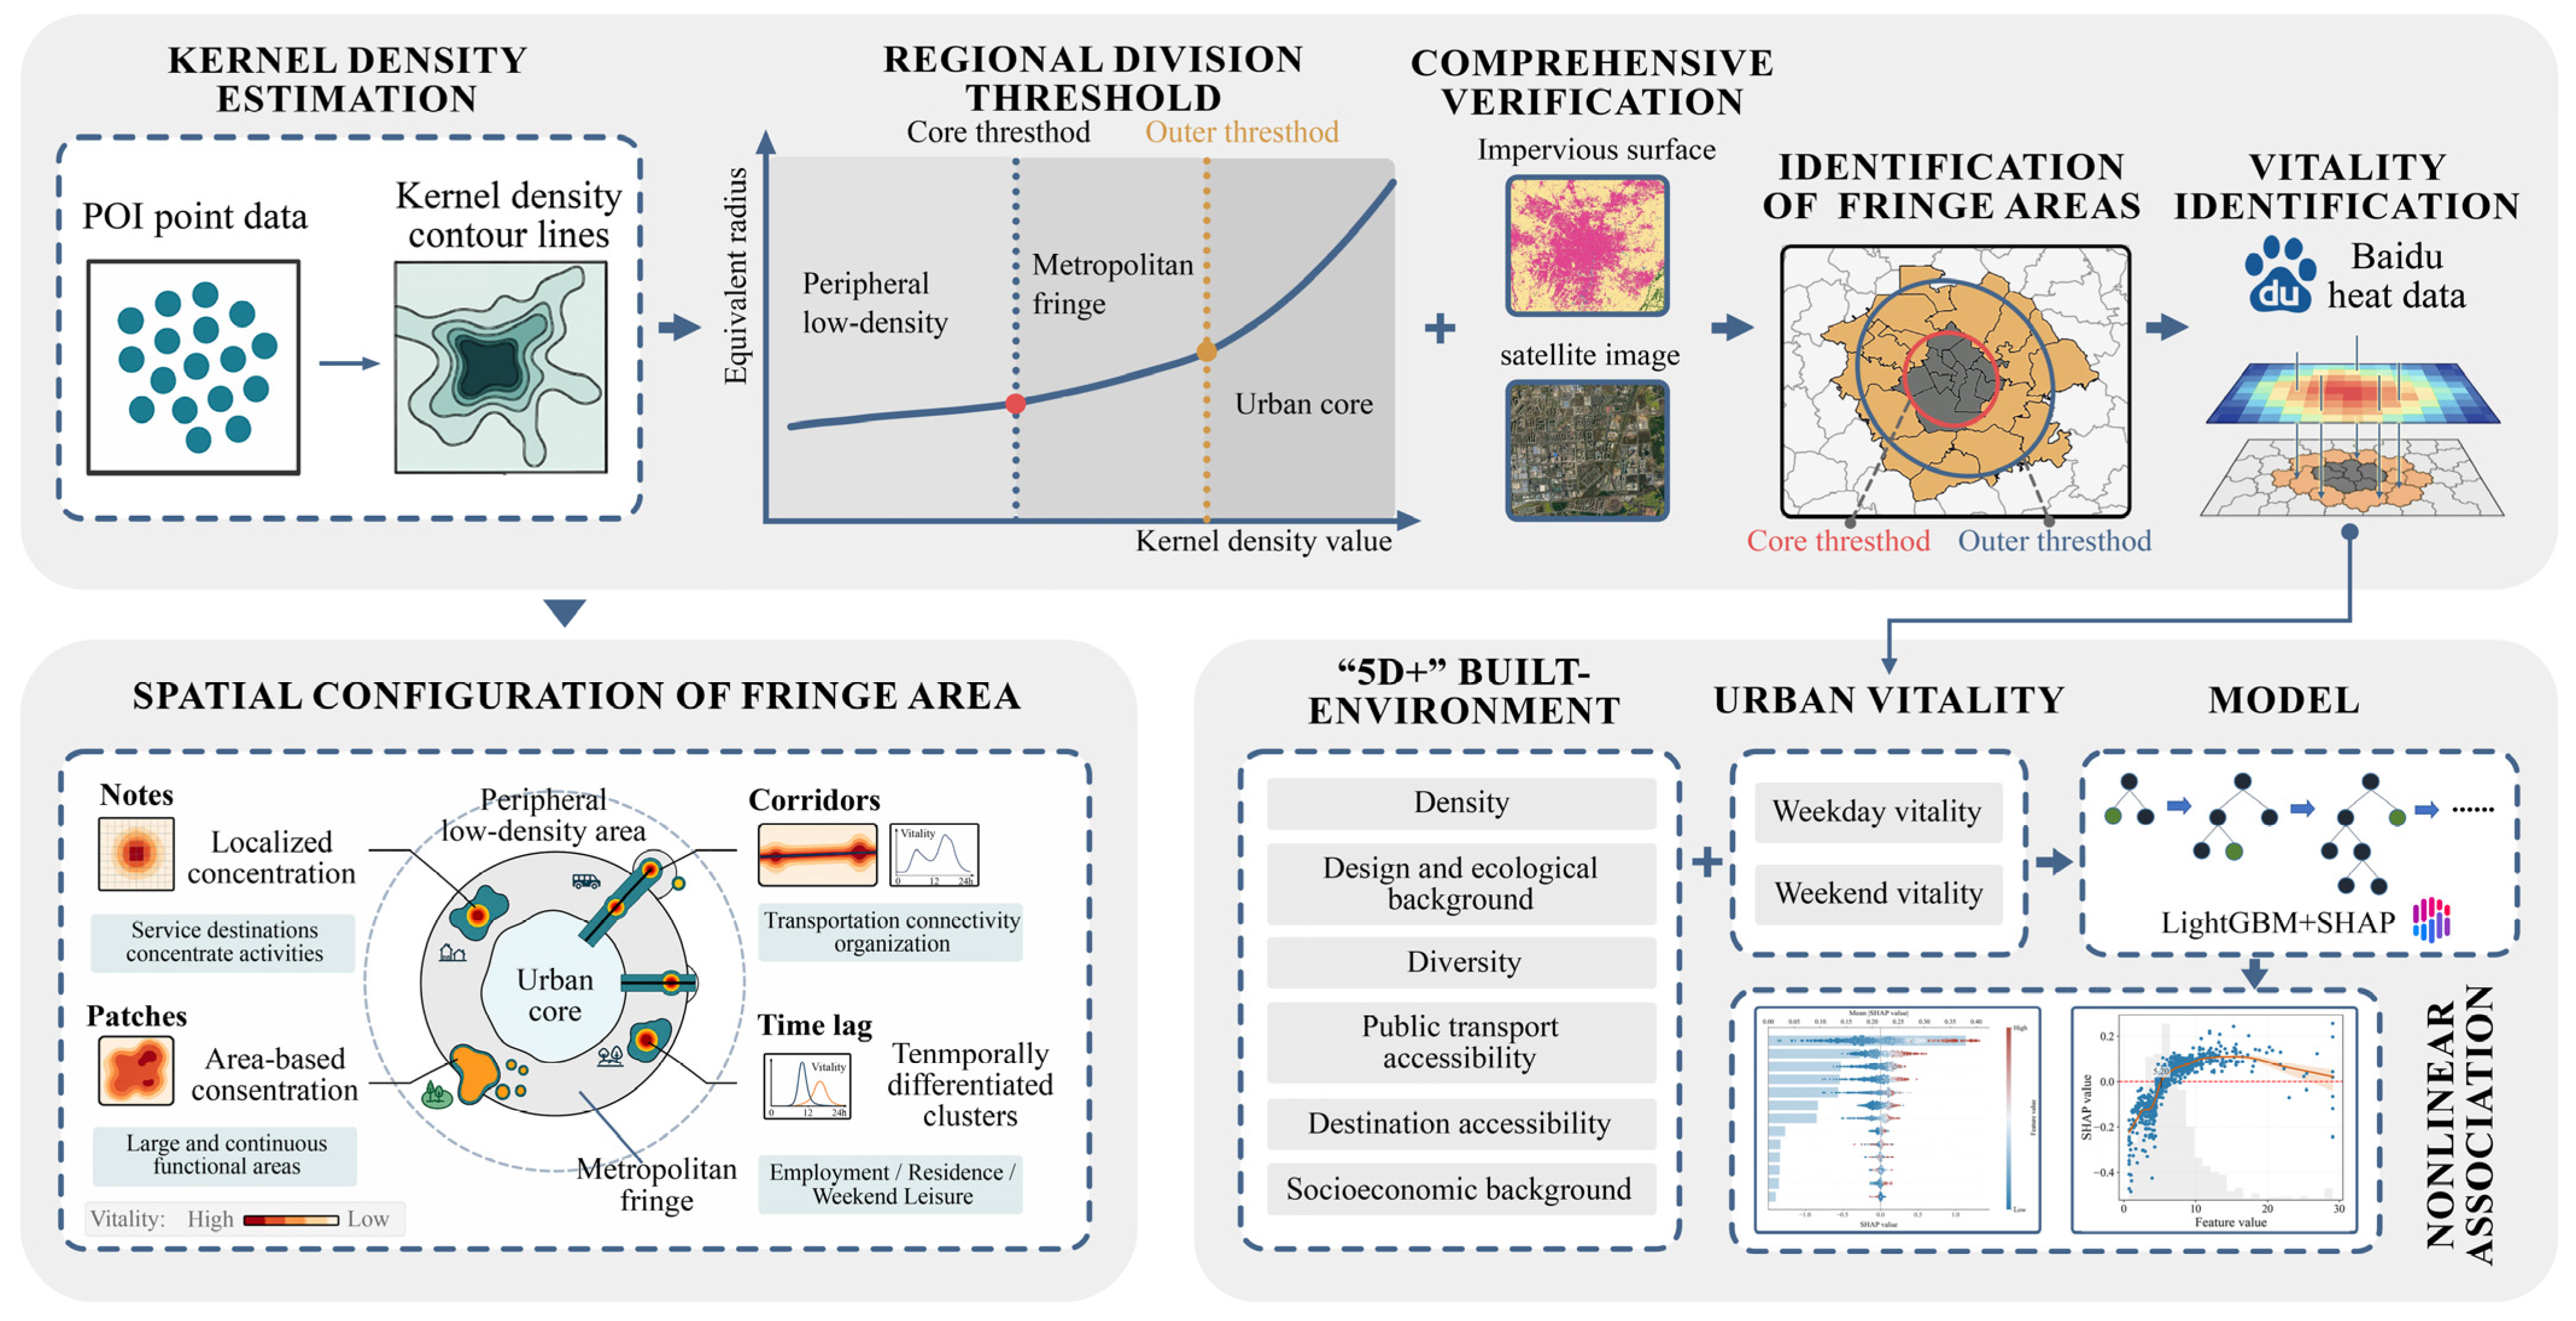
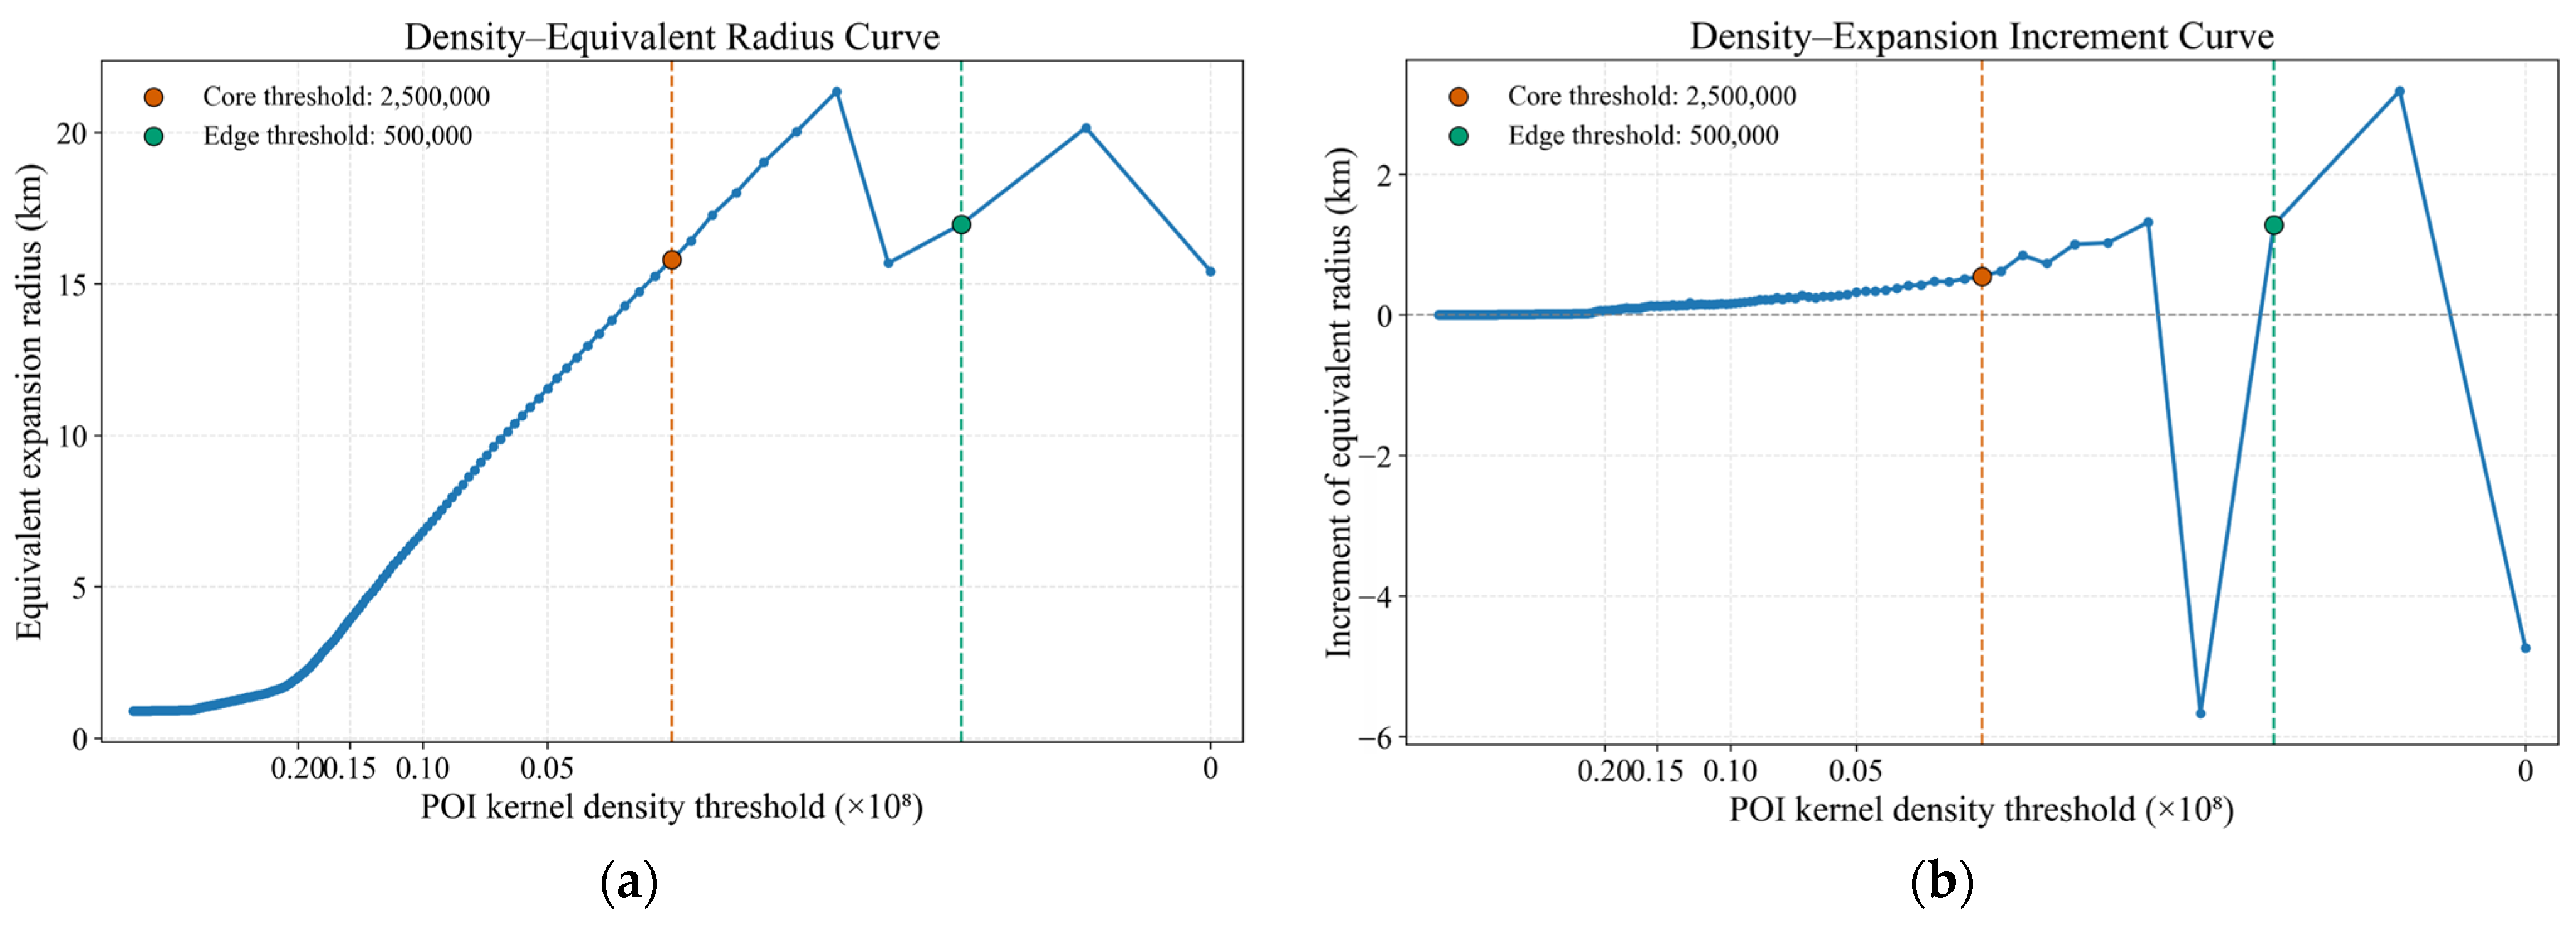
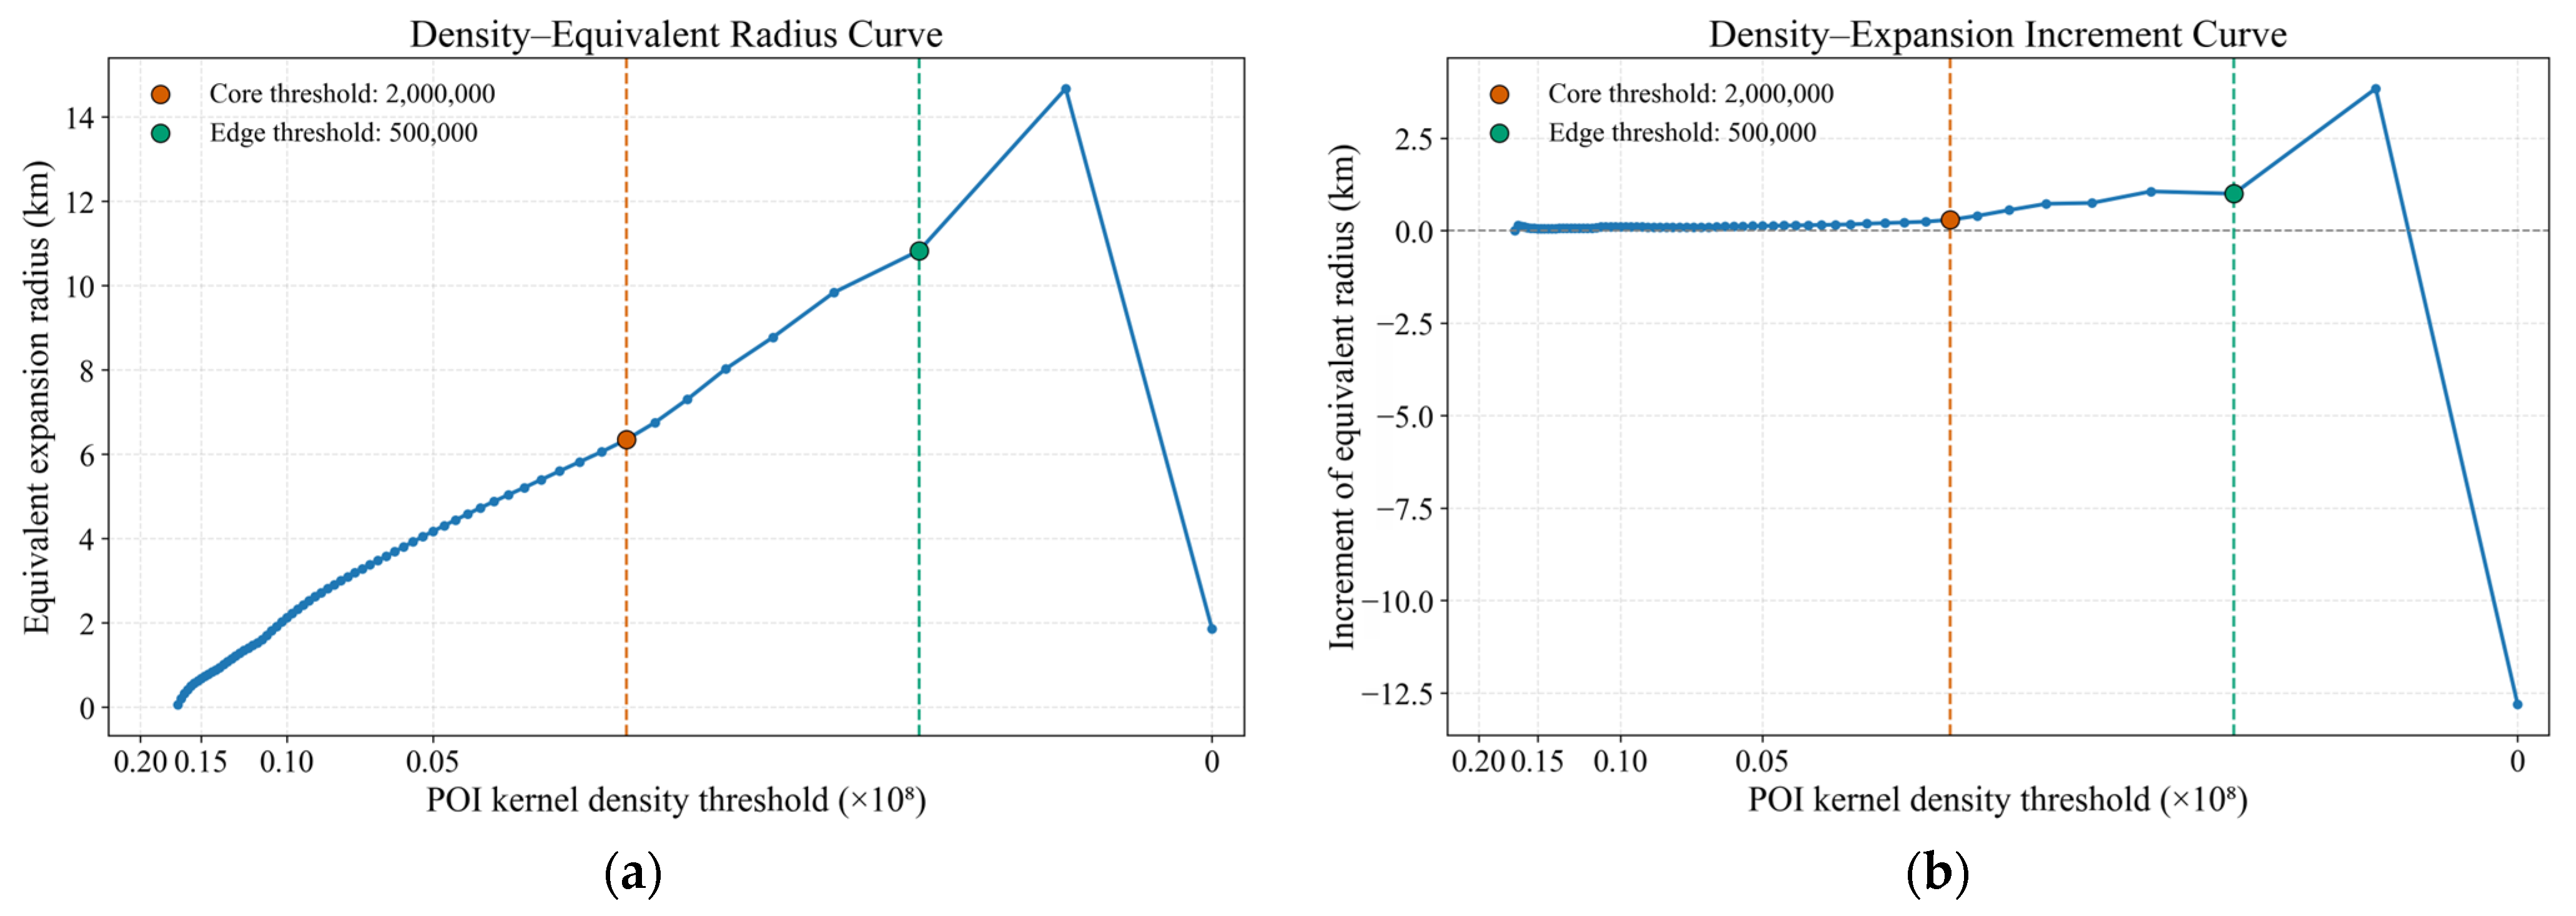
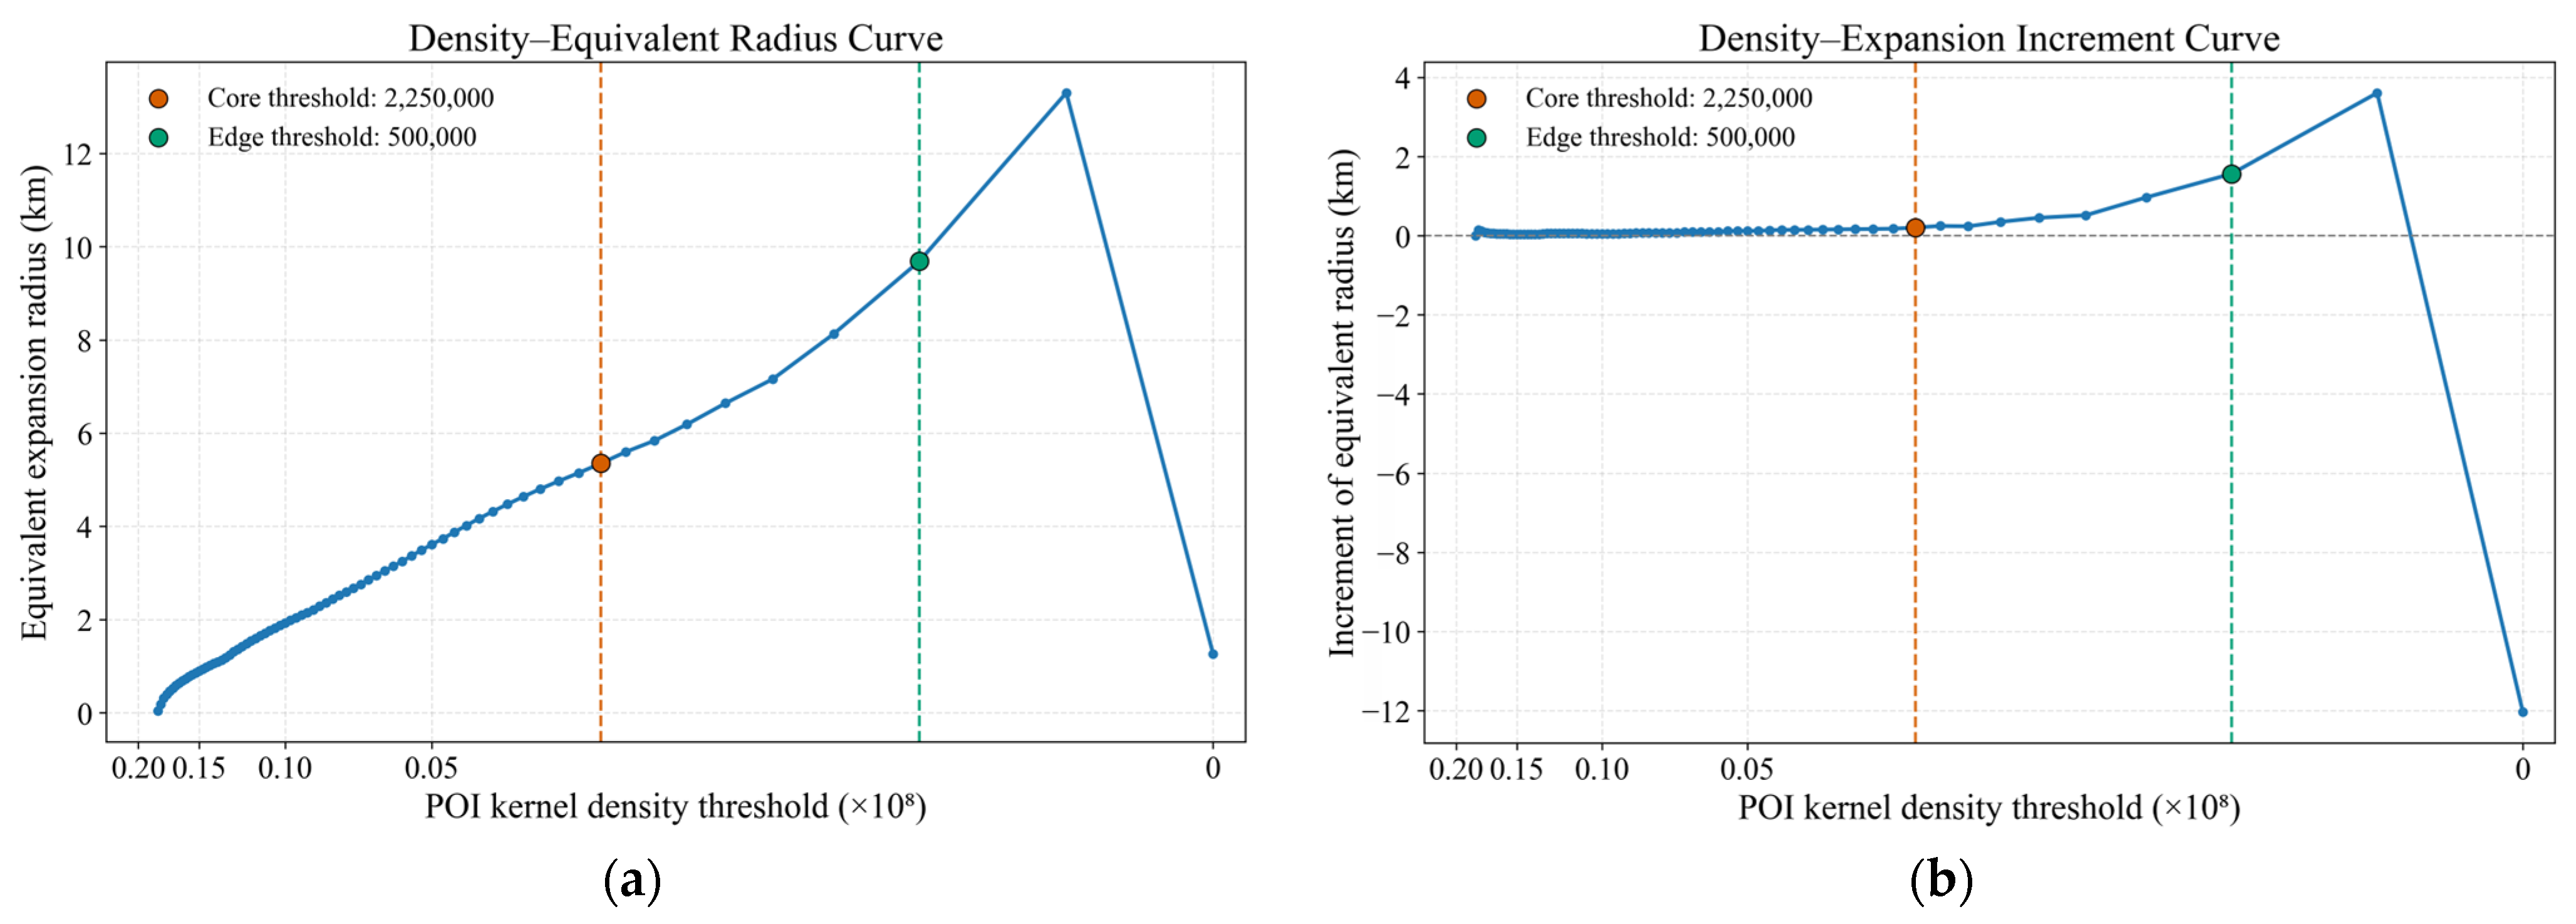
2.3. Delineation and Validation of Metropolitan Fringe Areas
2.4. Measurement of Urban Vitality and Temporal Difference
2.5. Interpretable Machine Learning and Model Evaluation
3. Results
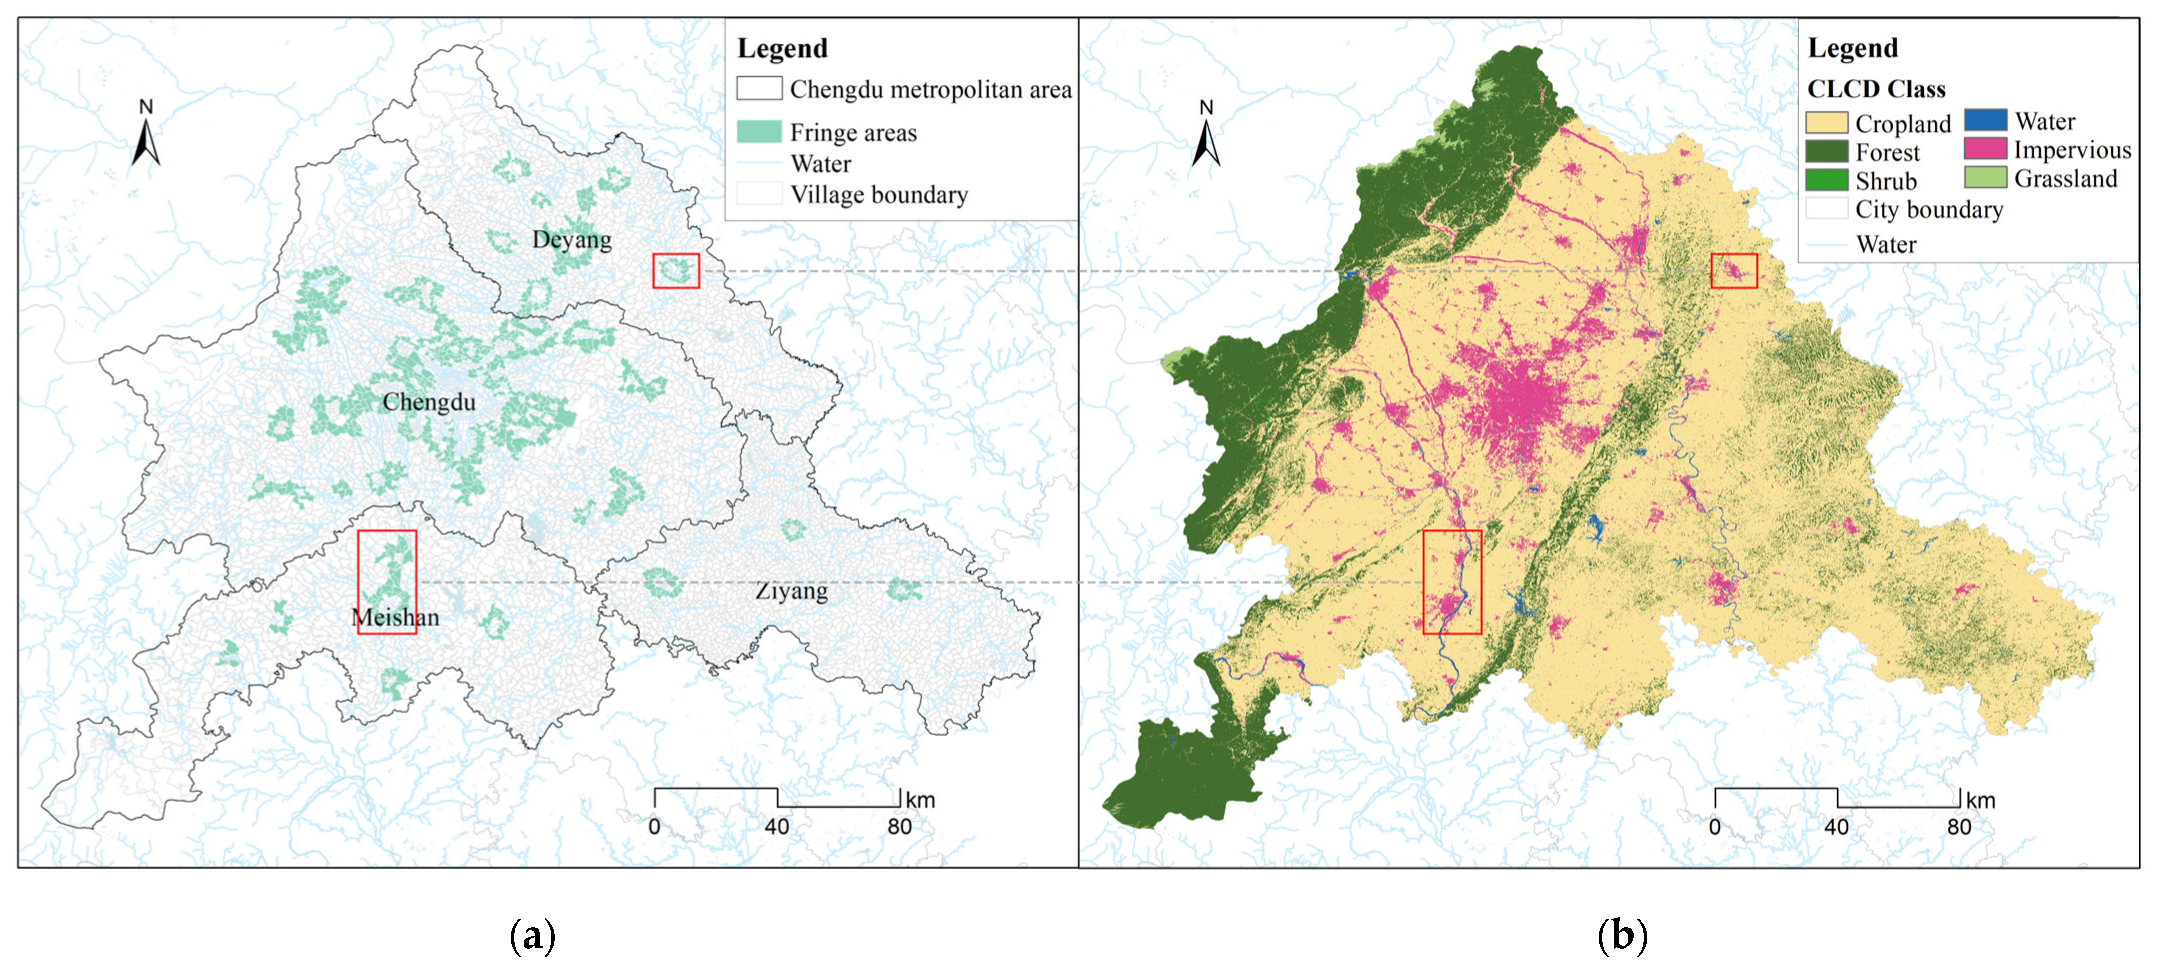
3.1. Delineation and Spatial Validation of Metropolitan Fringe Areas
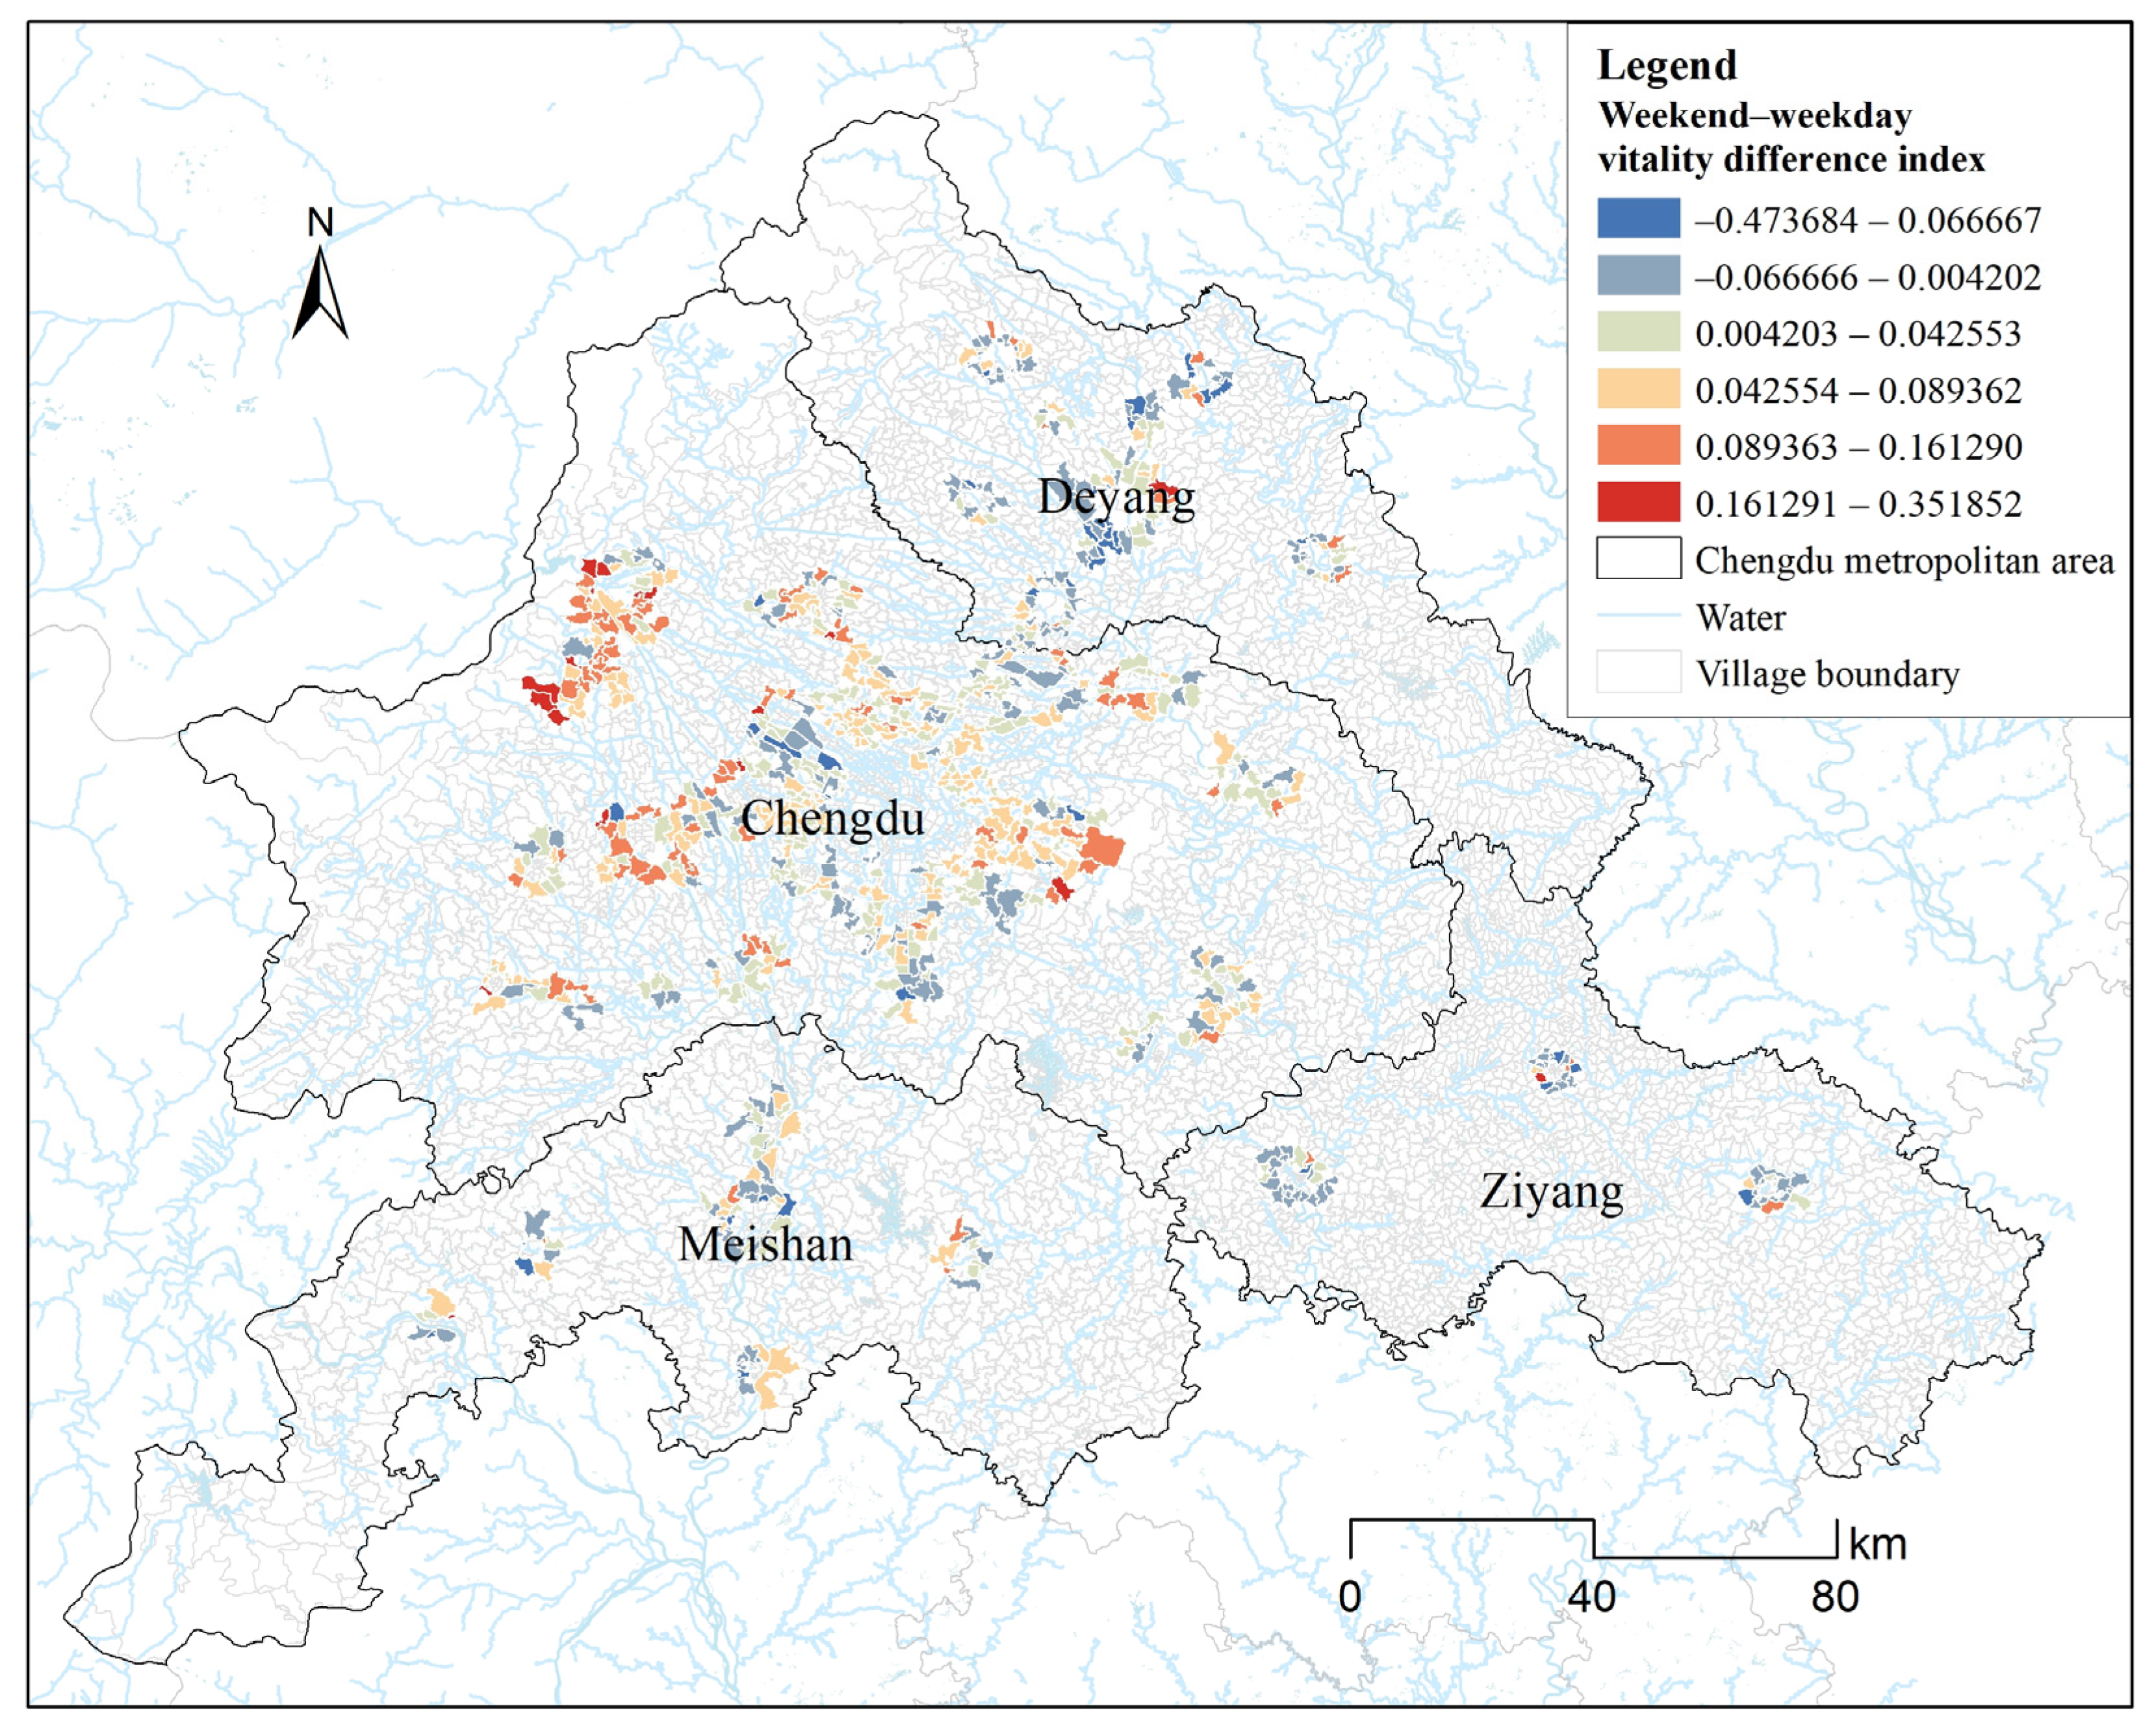
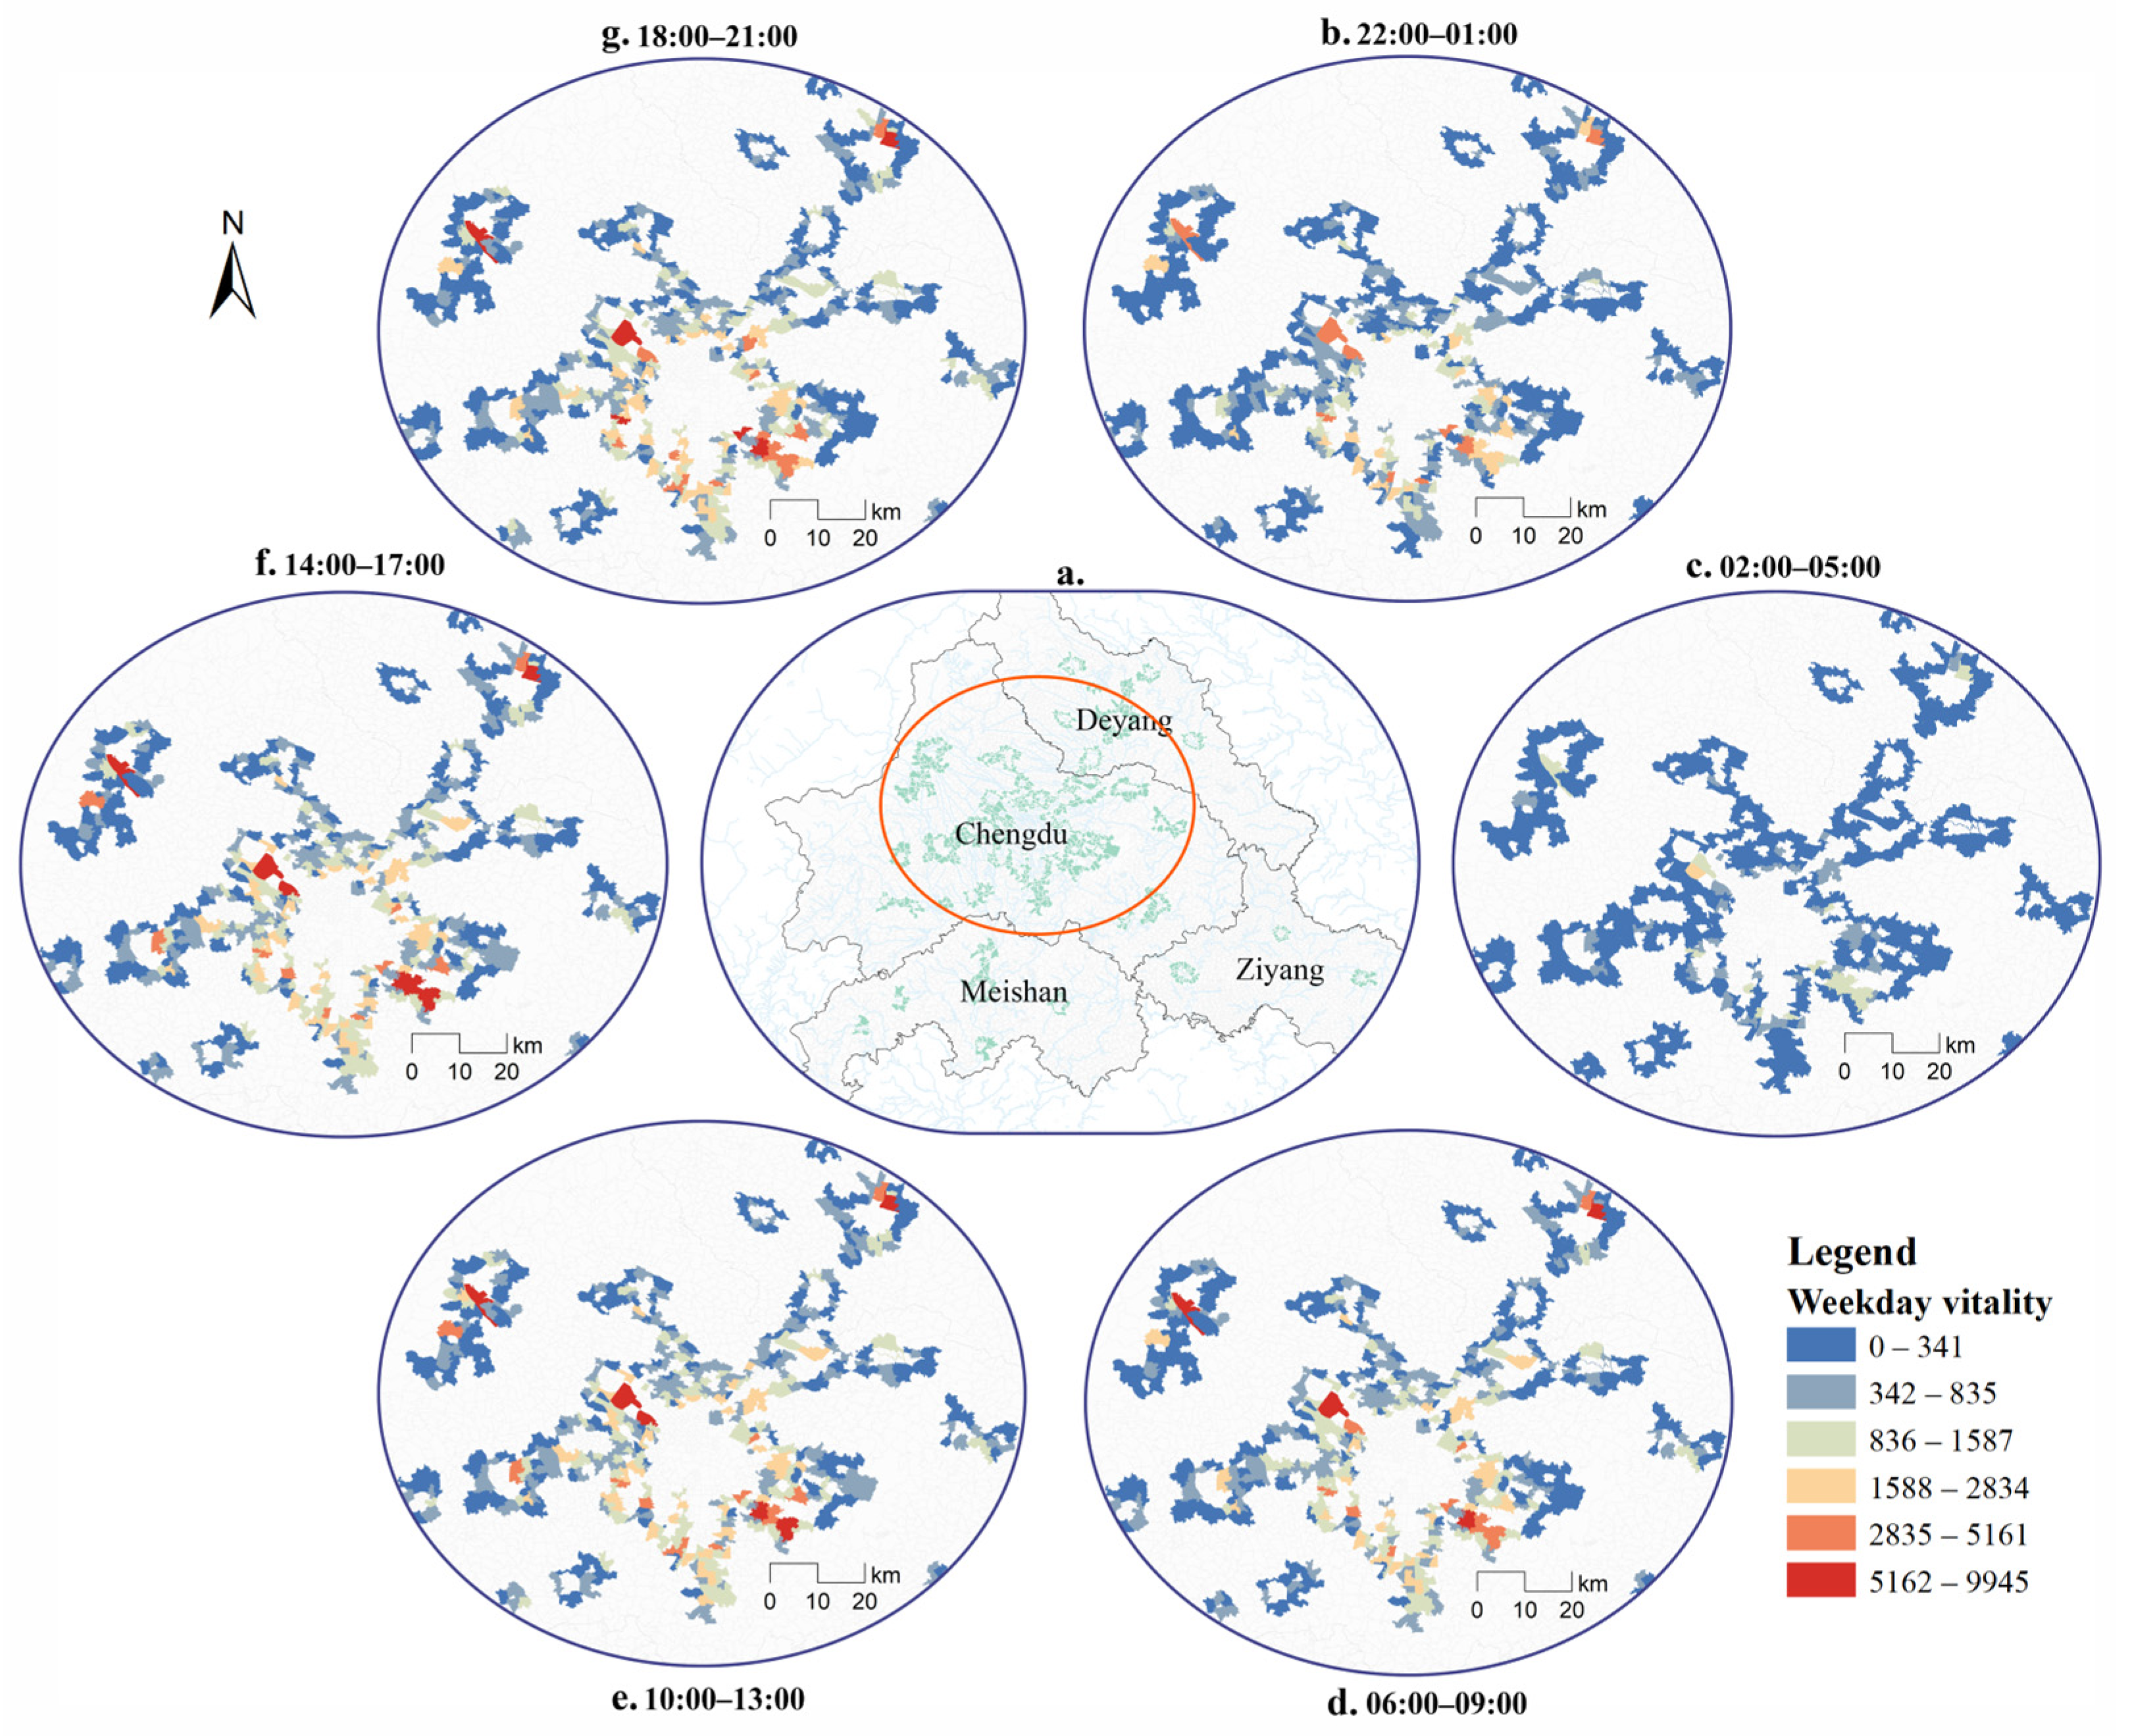
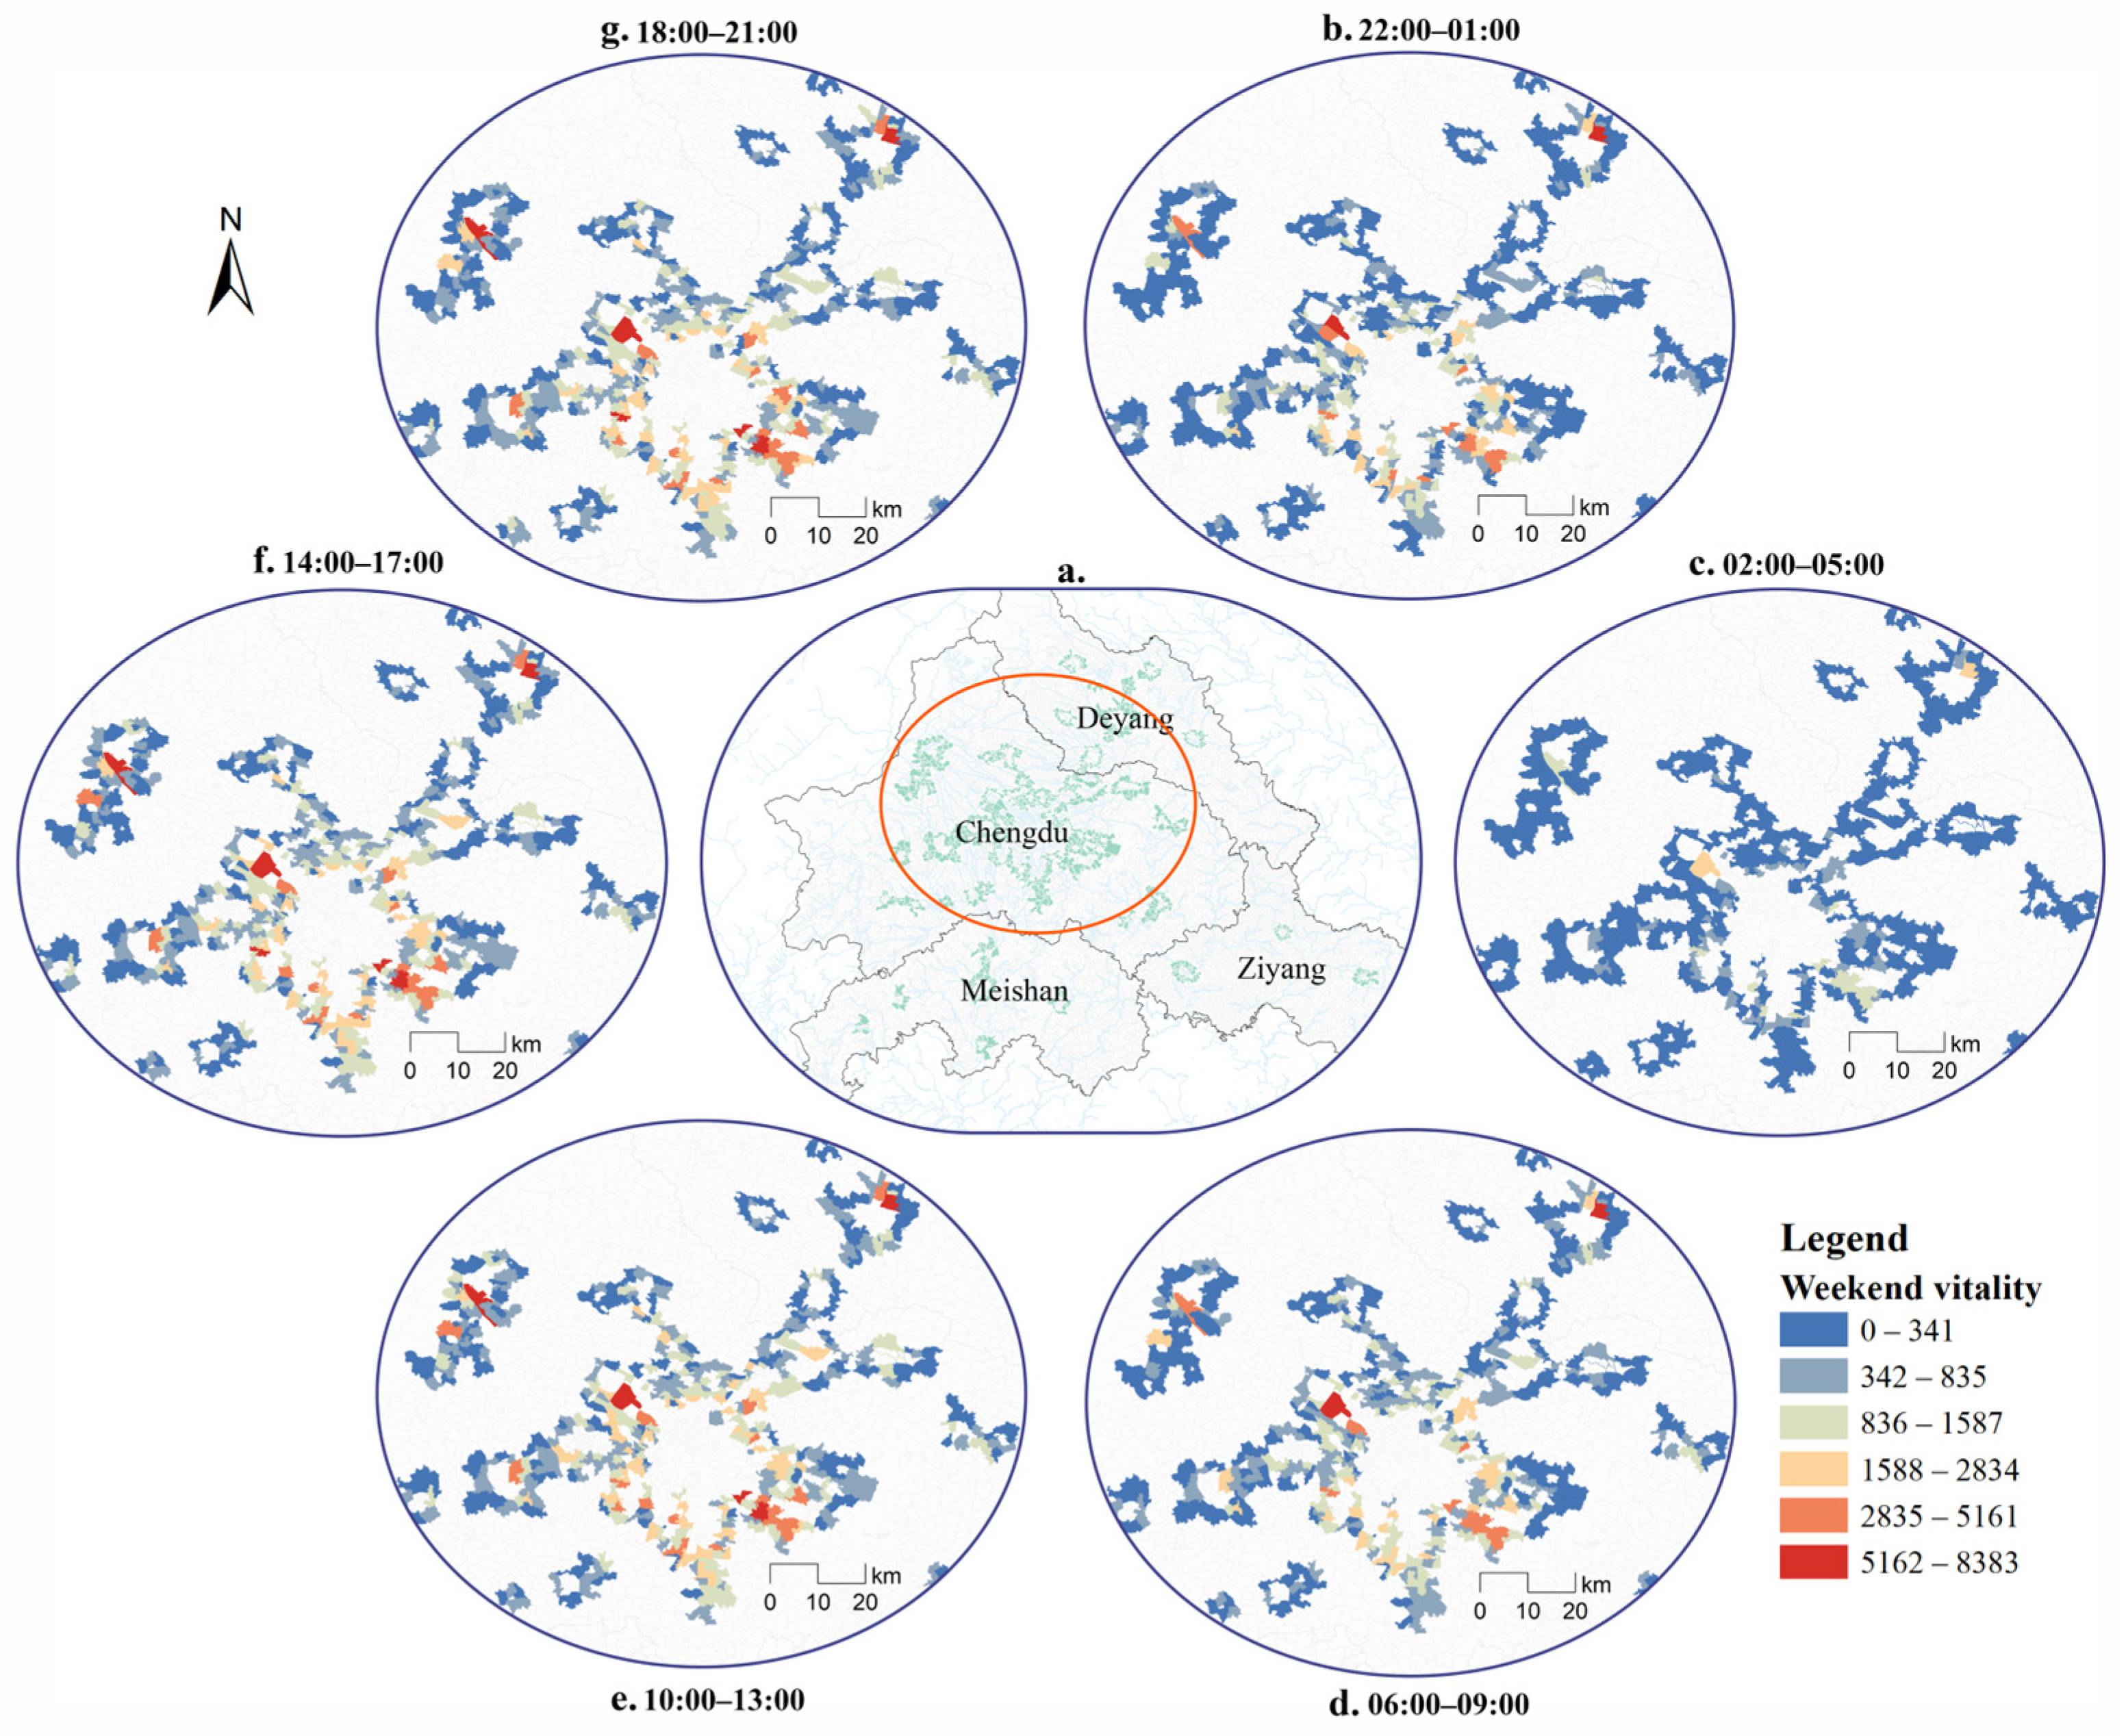
3.2. Spatiotemporal Patterns of Fringe-Area Vitality
3.3. An Interpretive Typology of Vitality Spaces in Metropolitan Fringe Areas
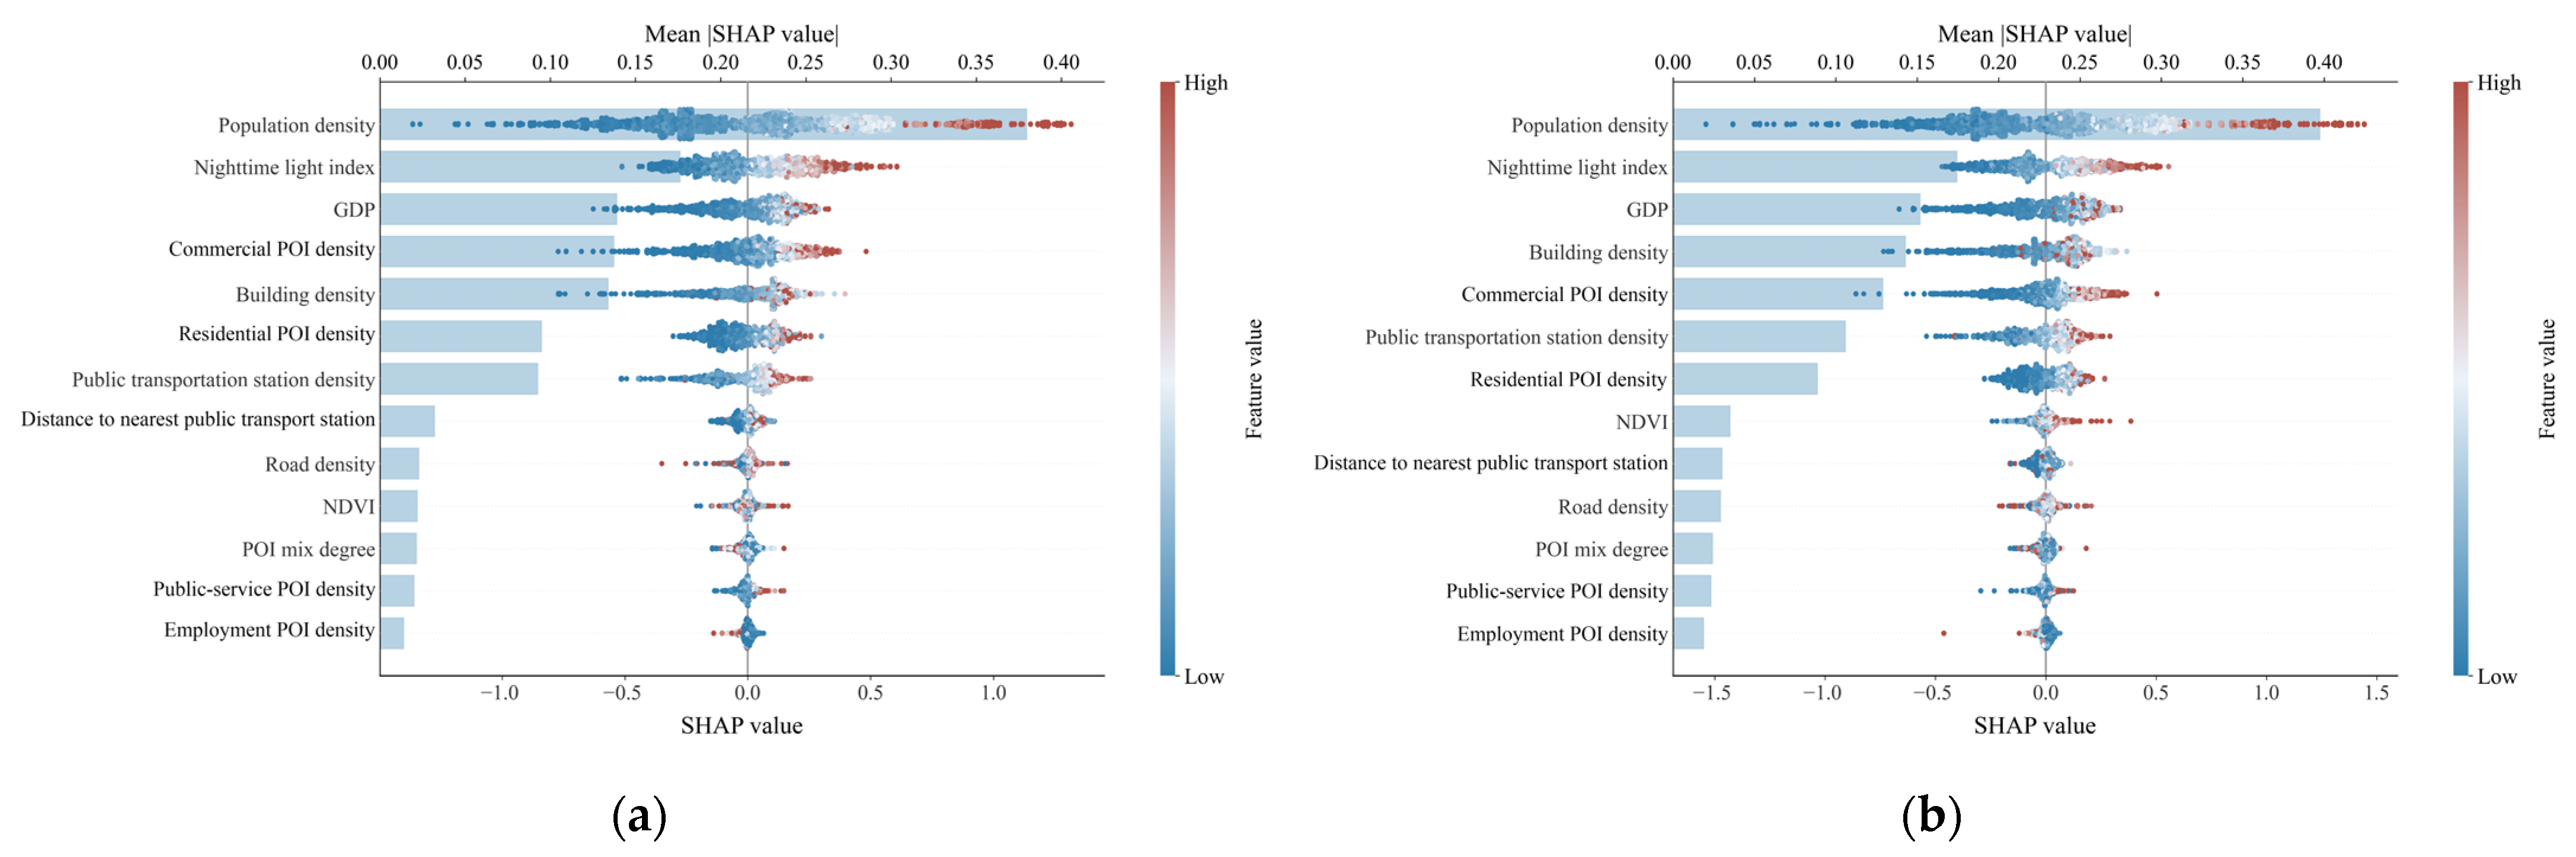
3.4. Model Performance and Variable Importance
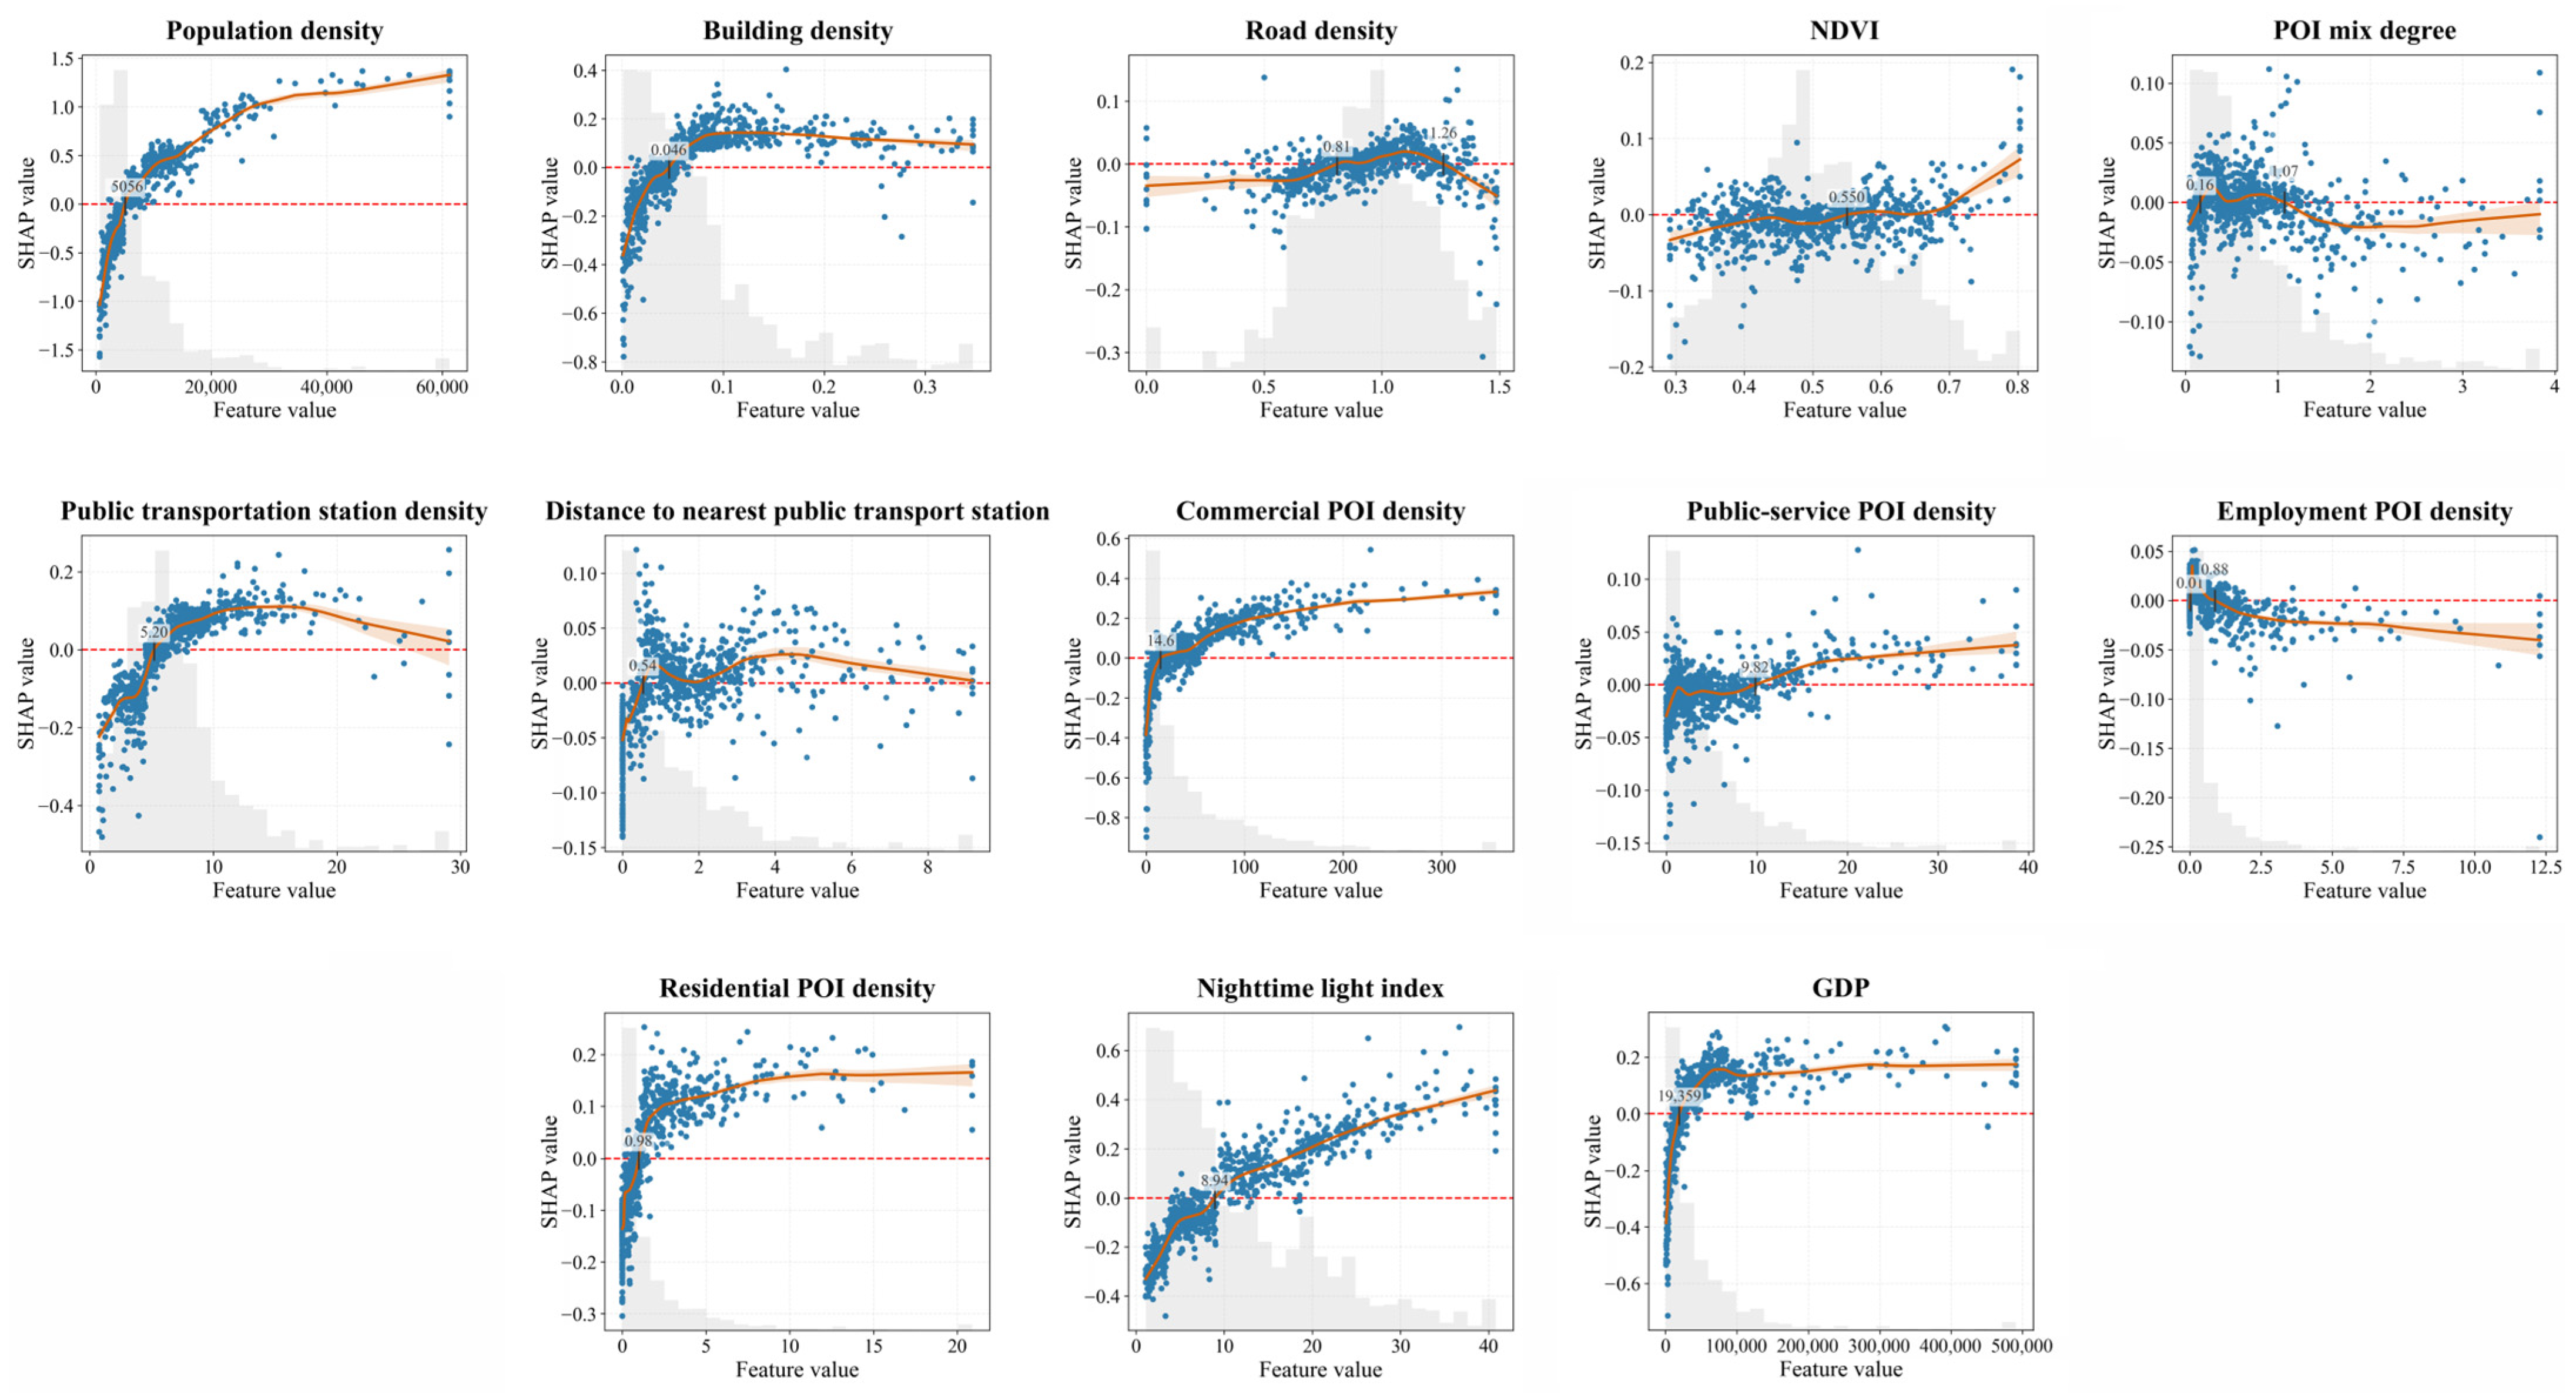
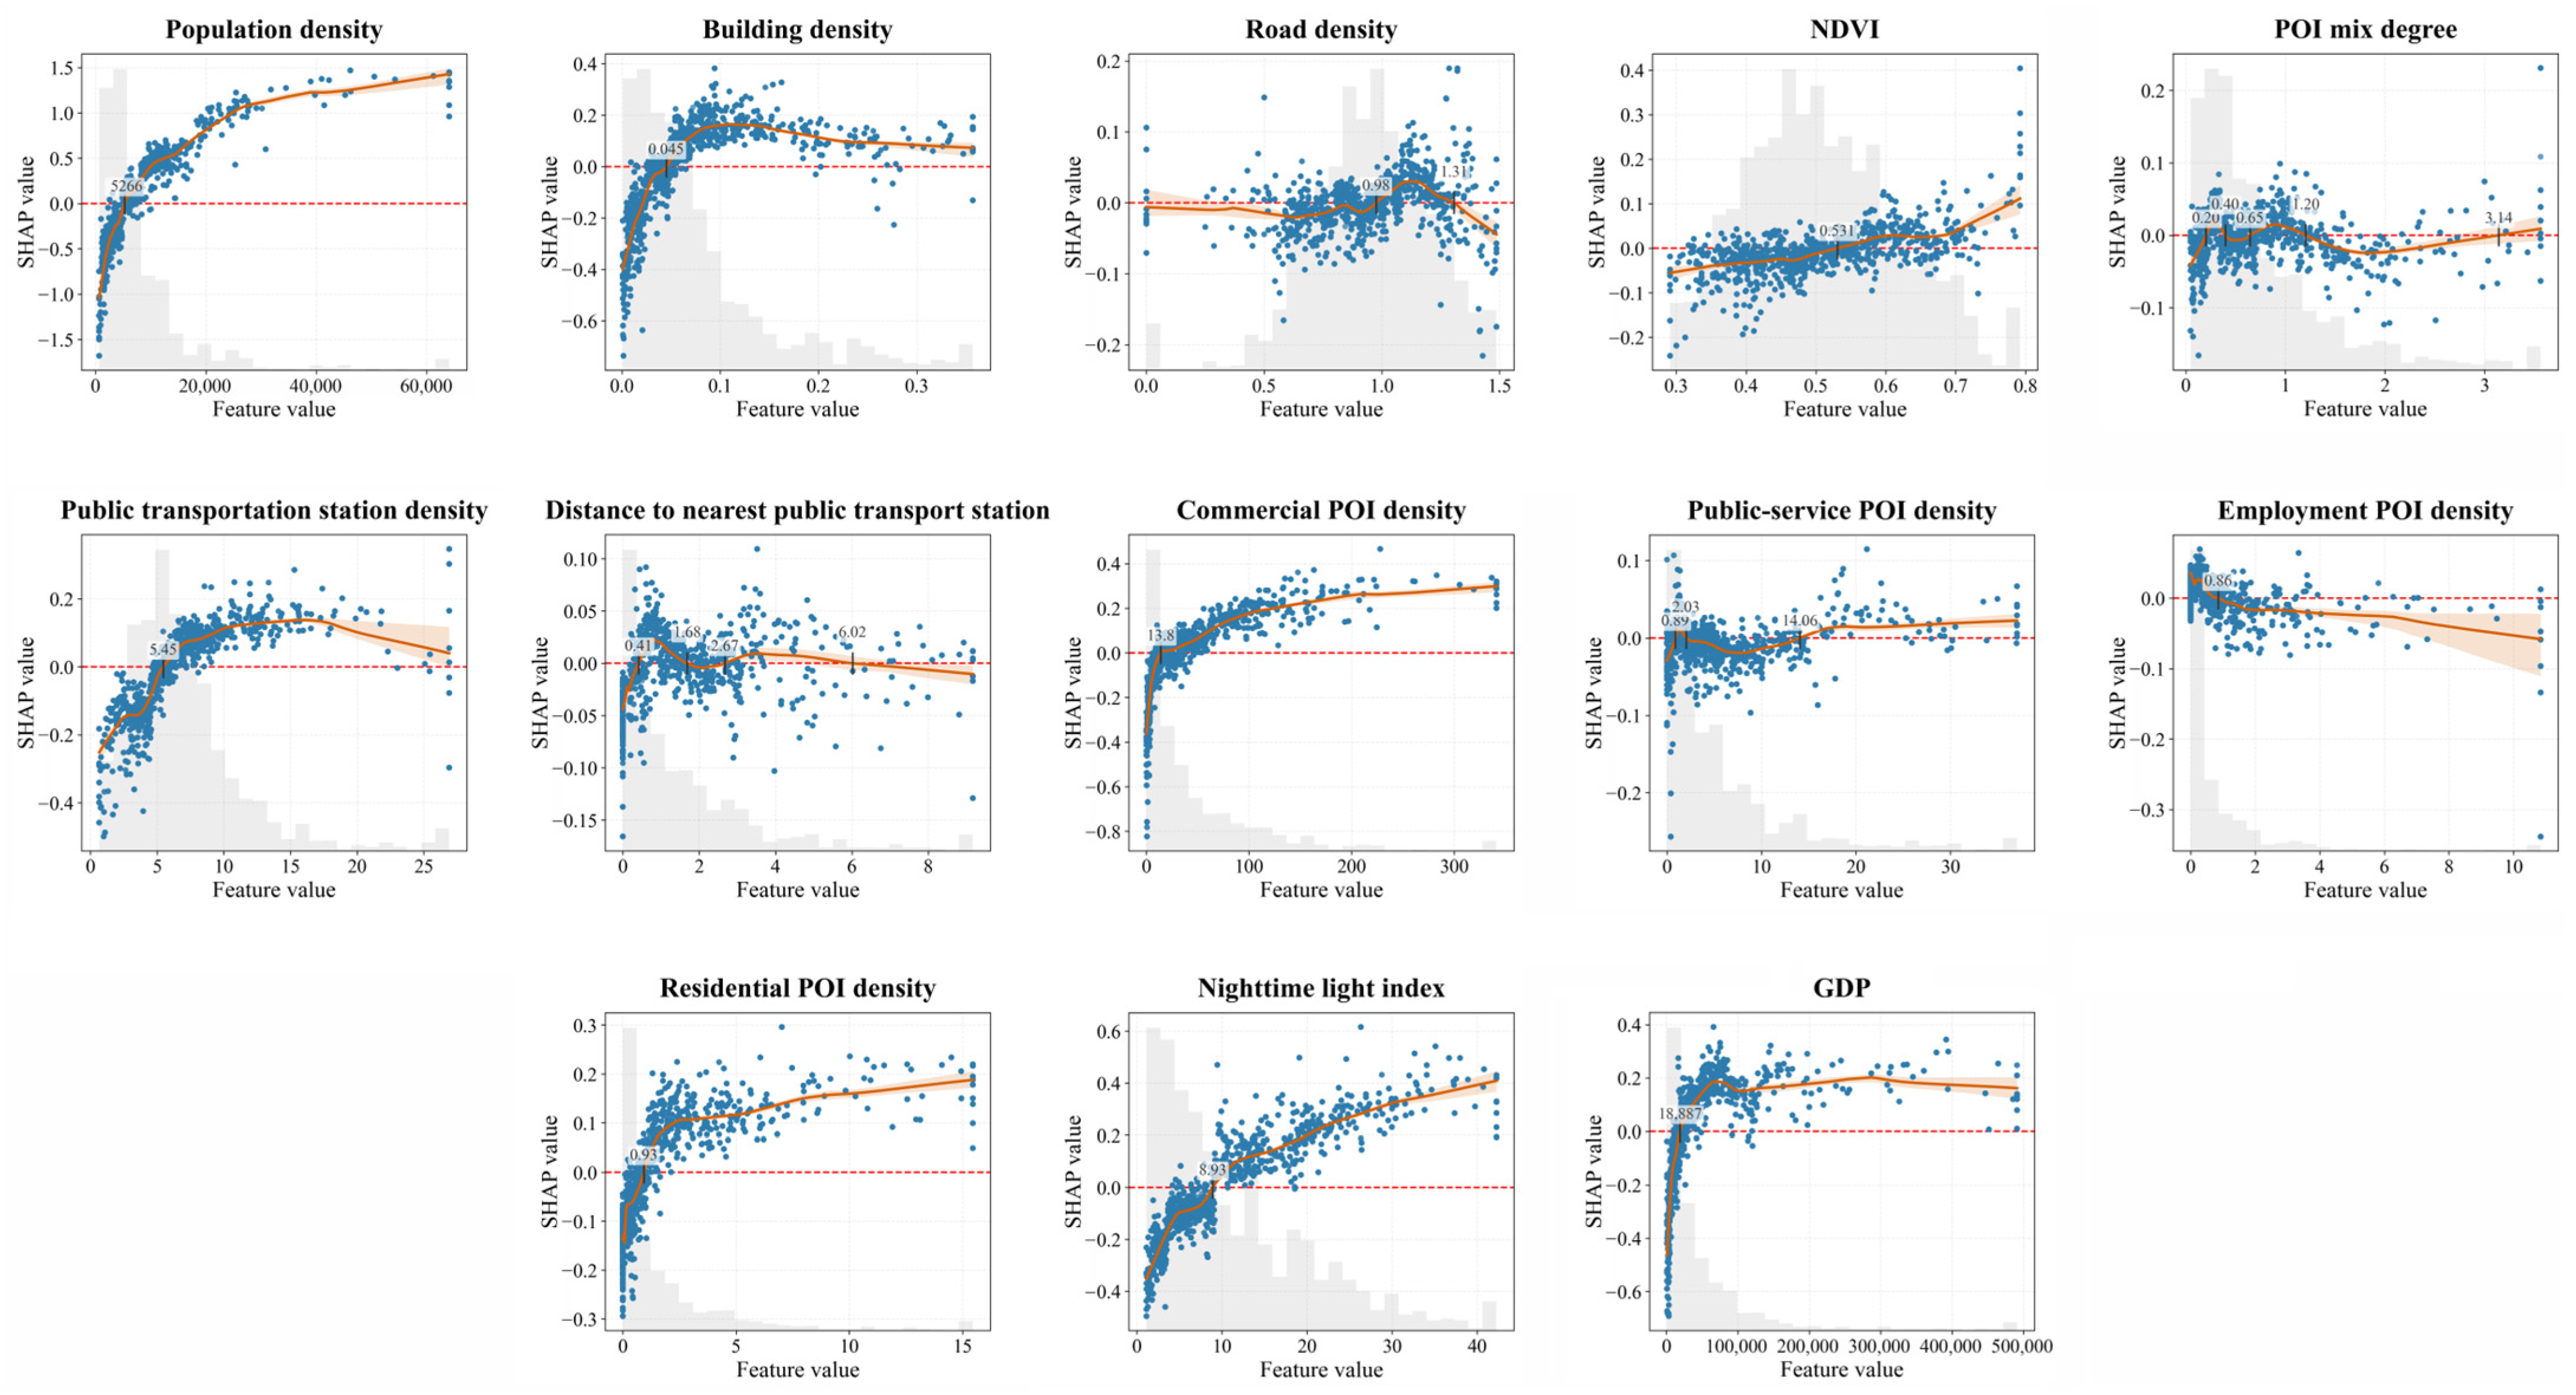
3.5. Nonlinear Built-Environment Associations and Saturation-like Patterns
4. Discussion
4.1. Metropolitan Fringe Vitality as a Product of Land-Use Transition
4.2. Nonlinear Associations and the Need for Sufficient Urbanity
4.3. Context-Dependent Meanings of Transport, Greenness, and Functional Mix
4.4. Planning Implications
4.5. Limitations and Future Research
5. Conclusions
Author Contributions
Funding
Data Availability Statement
Conflicts of Interest
Appendix A
Appendix A.1. Thresholds for Fringe-Area Delineation



| Threshold Scenario | Number of Selected Village Units | Total Area of Dissolved Village Polygons (km2) | Built-Up Land Area (km2) | Share of Built-Up Land (%) | Number of Spatially Connected Components |
|---|---|---|---|---|---|
| 70% | 540 | 1704.74 | 461.38 | 27.06 | 58 |
| 60% | 639 | 2201.40 | 537.84 | 24.43 | 47 |
| 50% | 786 | 2947.60 | 657.15 | 22.48 | 31 |
| 40% | 861 | 2983.96 | 669.17 | 22.43 | 32 |
| 30% | 883 | 3042.47 | 678.73 | 22.31 | 32 |
Appendix A.2. Model Robustness Test
| Time | Model | Random 5-Fold CV | Spatial-Block CV | Spatial Residual Moran’s I | p-Value | ||||
|---|---|---|---|---|---|---|---|---|---|
| RMSE | MAE | RMSE | MAE | ||||||
| Weekday | M0 | 0.6888 | 0.7446 | 0.6027 | 0.5112 | 0.9325 | 0.7534 | 0.2908 | <0.001 |
| M1 | 0.6887 | 0.7447 | 0.6034 | 0.4994 | 0.9437 | 0.7638 | 0.3073 | <0.001 | |
| M2 | 0.6891 | 0.7443 | 0.6029 | 0.4794 | 0.9623 | 0.7734 | 0.3308 | <0.001 | |
| M3 | 0.6889 | 0.7446 | 0.6038 | 0.5047 | 0.9387 | 0.7573 | 0.2972 | <0.001 | |
| Weekend | M0 | 0.7387 | 0.6611 | 0.5007 | 0.5314 | 0.8894 | 0.7045 | 0.3766 | <0.001 |
| M1 | 0.7386 | 0.6611 | 0.5007 | 0.5031 | 0.9159 | 0.7261 | 0.4111 | <0.001 | |
| M2 | 0.7386 | 0.6612 | 0.5009 | 0.5059 | 0.9133 | 0.7222 | 0.4051 | <0.001 | |
| M3 | 0.7386 | 0.6612 | 0.5005 | 0.5195 | 0.9007 | 0.7096 | 0.3886 | <0.001 | |
References
- Ravetz, J.; Sahana, M. Where is the peri-urban? Mapping the areas ‘around, beyond and between’. Front. Sustain. Cities 2025, 7, 1436287. [Google Scholar] [CrossRef] [Scilit]
- Follmann, A.; Kennedy, L.; Pfeffer, K.; Wu, F. Peri-urban transformation in the Global South: A comparative socio-spatial analytics approach. Reg. Stud. 2023, 57, 447–461. [Google Scholar] [CrossRef] [Scilit]
- Pino, A.; Martínez, J.; Alfaro, M. Criteria for the Delimitation of the Urban Fringe of Latin American Cities: A Review from the Global South. Land 2025, 14, 1276. [Google Scholar] [CrossRef] [Scilit]
- Gonçalves, J.; Gomes, M.C.; Ezequiel, S.; Moreira, F.; Loupa-Ramos, I. Differentiating peri-urban areas: A transdisciplinary approach towards a typology. Land Use Policy 2017, 63, 331–341. [Google Scholar] [CrossRef] [Scilit]
- López-Goyburu, P.; García-Montero, L.G. The urban-rural interface as an area with characteristics of its own in urban planning: A review. Sustain. Cities Soc. 2018, 43, 157–165. [Google Scholar] [CrossRef] [Scilit]
- Dong, Q.; Qu, S.; Qin, J.; Yi, D.; Liu, Y.; Zhang, J. A method to identify urban fringe area based on the industry density of POI. ISPRS Int. J. Geo-Inf. 2022, 11, 128. [Google Scholar] [CrossRef] [Scilit]
- Yu, J.; Meng, Y.; Zhou, S.; Zeng, H.; Li, M.; Chen, Z.; Nie, Y. Research on Spatial Delineation Method of Urban-Rural Fringe Combining POI and Nighttime Light Data-Taking Wuhan City as an Example. Int. J. Environ. Res. Public Health 2023, 20, 4395. [Google Scholar] [CrossRef] [Scilit] [PubMed]
- Scott, A.J.; Carter, C.; Reed, M.R.; Larkham, P.; Adams, D.; Morton, N.; Waters, R.; Collier, D.; Crean, C.; Curzon, R.; et al. Disintegrated development at the rural–urban fringe: Re-connecting spatial planning theory and practice. Prog. Plan. 2013, 83, 1–52. [Google Scholar] [CrossRef] [Scilit]
- Jacobs, J. The Death and Life of Great American Cities; Random House: New York, NY, USA, 1961. [Google Scholar]
- Montgomery, J. Making a city: Urbanity, vitality and urban design. J. Urban Des. 1998, 3, 93–116. [Google Scholar] [CrossRef] [Scilit]
- Ye, Y.; Li, D.; Liu, X. How block density and typology affect urban vitality: An exploratory analysis in Shenzhen, China. Urban Geogr. 2018, 39, 631–652. [Google Scholar] [CrossRef] [Scilit]
- Gehl, J. Life Between Buildings: Using Public Space; Island Press: Washington, DC, USA, 2011. [Google Scholar] [CrossRef] [Scilit]
- De Nadai, M.; Staiano, J.; Larcher, R.; Sebe, N.; Quercia, D.; Lepri, B. The death and life of great Italian cities: A mobile phone data perspective. In Proceedings of the 25th International Conference on World Wide Web, Montreal, QC, Canada, 11–15 April 2016; International World Wide Web Conferences Steering Committee: Geneva, Switzerland, 2016; pp. 413–423. [Google Scholar] [CrossRef] [Scilit]
- Wu, C.; Ye, X.; Ren, F.; Du, Q. Check-in behaviour and spatio-temporal vibrancy: An exploratory analysis in Shenzhen, China. Cities 2018, 77, 104–116. [Google Scholar] [CrossRef] [Scilit]
- Chen, T.; Hui, E.C.M.; Wu, J.; Lang, W.; Li, X. Identifying urban spatial structure and urban vibrancy in highly dense cities using georeferenced social media data. Habitat Int. 2019, 89, 102005. [Google Scholar] [CrossRef] [Scilit]
- Xia, C.; Yeh, A.G.O.; Zhang, A. Analyzing spatial relationships between urban land use intensity and urban vitality at street block level: A case study of five Chinese megacities. Landsc. Urban Plan. 2020, 193, 103669. [Google Scholar] [CrossRef] [Scilit]
- Li, X.; Li, Y.; Jia, T.; Zhou, L.; Hijazi, I.H. The six dimensions of built environment on urban vitality: Fusion evidence from multi-source data. Cities 2022, 121, 103482. [Google Scholar] [CrossRef] [Scilit]
- Chen, Y.; Yu, B.; Shu, B.; Yang, L.; Wang, R. Exploring the spatiotemporal patterns and correlates of urban vitality: Temporal and spatial heterogeneity. Sustain. Cities Soc. 2023, 91, 104440. [Google Scholar] [CrossRef] [Scilit]
- Jiang, Y.; Sun, Z.; Wei, D.; Zhao, P.; Yang, L.; Lu, Y. Revealing the spatiotemporal pattern of urban vibrancy at the urban agglomeration scale: Evidence from the Pearl River Delta, China. Appl. Geogr. 2025, 181, 103694. [Google Scholar] [CrossRef] [Scilit]
- Zhang, A.; Li, W.; Wu, J.; Lin, J.; Chu, J.; Xia, C. How can the urban landscape affect urban vitality at the street block level? A case study of 15 metropolises in China. Environ. Plan. B Urban Anal. City Sci. 2020, 48, 1245–1262. [Google Scholar] [CrossRef] [Scilit]
- Rui, J.; Li, X. Decoding vibrant neighborhoods: Disparities between formal neighborhoods and urban villages in eye-level perceptions and physical environment. Sustain. Cities Soc. 2024, 101, 105122. [Google Scholar] [CrossRef] [Scilit]
- Cervero, R.; Kockelman, K. Travel demand and the 3Ds: Density, diversity, and design. Transp. Res. Part D Transp. Environ. 1997, 2, 199–219. [Google Scholar] [CrossRef] [Scilit]
- Ewing, R.; Cervero, R. Travel and the built environment: A meta-analysis. J. Am. Plan. Assoc. 2010, 76, 265–294. [Google Scholar] [CrossRef] [Scilit]
- Lv, G.; Zheng, S.; Hu, W. Exploring the relationship between the built environment and block vitality based on multi-source big data: An analysis in Shenzhen, China. Geomat. Nat. Hazards Risk 2022, 13, 1593–1613. [Google Scholar] [CrossRef] [Scilit]
- Mellander, C.; Lobo, J.; Stolarick, K.; Matheson, Z. Night-time light data: A good proxy measure for economic activity? PLoS ONE 2015, 10, e0139779. [Google Scholar] [CrossRef] [Scilit] [PubMed]
- Liu, D.; Lu, Y.; Yang, L. Exploring non-linear effects of environmental factors on the volume of pedestrians of different ages using street view images and computer vision technology. Travel Behav. Soc. 2024, 36, 100814. [Google Scholar] [CrossRef] [Scilit]
- Li, C.; Zhou, Y.; Wu, M.; Xu, J.; Fu, X. Exploring nonlinear threshold effects and interactions between built environment and urban vitality at the block level using machine learning. Land 2025, 14, 1232. [Google Scholar] [CrossRef] [Scilit]
- Lyu, G.; Angkawisittpan, N.; Fu, X.; Sonasang, S. Investigating the relationship between built environment and urban vitality using big data. Sci. Rep. 2025, 15, 579. [Google Scholar] [CrossRef] [Scilit] [PubMed]
- Ke, G.; Meng, Q.; Finley, T.; Wang, T.; Chen, W.; Ma, W.; Ye, Q.; Liu, T.-Y. LightGBM: A highly efficient gradient boosting decision tree. Adv. Neural Inf. Process. Syst. 2017, 30. [Google Scholar]
- Shao, J.; Long, Y.; Liu, X.; Zheng, Y.; Song, Y.; Wang, J.; Liu, B.; Yang, J.; Chen, Y.; Zhang, F. Machine learning-based study on factors influencing street vitality in urban fringe commercial districts: A case of Wuhan. Front. Archit. Res. 2026, 15, 582–608. [Google Scholar] [CrossRef] [Scilit]
- Lundberg, S.M.; Lee, S.-I. A unified approach to interpreting model predictions. In Proceedings of the 31st International Conference on Neural Information Processing Systems (NIPS’17); Curran Associates Inc.: Red Hook, NY, USA, 2017; pp. 4768–4777. [Google Scholar]
- Wolch, J.R.; Byrne, J.; Newell, J.P. Urban green space, public health, and environmental justice: The challenge of making cities ‘just green enough’. Landsc. Urban Plan. 2014, 125, 234–244. [Google Scholar] [CrossRef] [Scilit]
- National Development and Reform Commission of the People’s Republic of China. Chengdu Metropolitan Area Development Plan; National Development and Reform Commission: Beijing, China, 2022. Available online: https://www.ndrc.gov.cn/xwdt/ztzl/xxczhjs/ghzc/202203/P020220310612774783269.pdf (accessed on 16 June 2026).
- Liu, Y.; Jiang, B. Research on the Development of Medium-sized Cities from the Perspective of a Metropolitan Area—A Case Study of Ziyang City in the Chengdu Metropolitan Area. Int. J. Environ. Sustain. Prot. 2022, 2, 1–10. [Google Scholar] [CrossRef] [Scilit]
- Shannon, C.E. A mathematical theory of communication. Bell Syst. Tech. J. 1948, 27, 379–423. [Google Scholar] [CrossRef] [Scilit]
- Peng, J.; Zhao, S.; Liu, Y.; Tian, L. Identifying the urban-rural fringe using wavelet transform and kernel density estimation: A case study in Beijing City, China. Environ. Model. Softw. 2016, 83, 286–302. [Google Scholar] [CrossRef] [Scilit]
- Tang, S.; Ta, N. How the built environment affects the spatiotemporal pattern of urban vitality: A comparison among different urban functional areas. Comput. Urban Sci. 2022, 2, 39. [Google Scholar] [CrossRef] [Scilit] [PubMed]
- Xu, N.; Wang, P. Rethinking the relationship between ecological conservation and urban land development: A spatial–machine learning integration approach. Habitat Int. 2026, 171, 103755. [Google Scholar] [CrossRef] [Scilit]
- Jiang, Y.; Liu, D.; Ren, L.; Grekousis, G.; Lu, Y. Tree abundance, species richness, or species mix? Exploring the relationship between features of urban street trees and pedestrian volume in Jinan, China. Urban For. Urban Green. 2024, 95, 128294. [Google Scholar] [CrossRef] [Scilit]
- Shlomo, O. Segregated urbanization: Urban-rural bordering in the Tel Aviv metropolitan fringe. Cities 2026, 175, 107090. [Google Scholar] [CrossRef] [Scilit]
- Openshaw, S. The Modifiable Areal Unit Problem; Geo Books: Norwich, UK, 1983. [Google Scholar]


| Type | Variable | Data Source | Time | Measurement | Interpretation |
|---|---|---|---|---|---|
| Vitality | Urban vitality | Baidu heatmap (http://rq.baidu.com/, accessed on 15 February 2026); 200 m × 200 m raster data | 10 July 2023–16 July 2023; hourly | Area-weighted aggregation of intersecting raster cells to village-level units | Reflects real-time urban activity intensity |
| Density | Population density | WorldPop: https://hub.worldpop.org/doi/10.5258/SOTON/WP00839 (accessed on 15 February 2026); 100 m × 100 m | 2024 | Total population within unit/unit area, person/km2 | Reflects population base |
| Building density | Zenodo database: https://zenodo.org/records/8174931 (accessed on 15 February 2026) | 22 July 2023 | Building footprint area/unit area | Reflects development intensity | |
| Design and ecological background | Road density | OpenStreetMap (https://www.openstreetmap.org/, accessed on 15 February 2026) | 1 January 2024 | Road length within unit/unit area, km/km2 | Reflects road-network connectivity and corridor linkage |
| NDVI | USGS EarthExplorer, Landsat 8 OLI/TIRS (https://earthexplorer.usgs.gov/, accessed on 15 February 2026) | 2024 | Landsat 8 imagery was used to calculate the Normalized Difference Vegetation Index (NDVI) | Reflects vegetation cover level | |
| Diversity | POI mix degree | Amap POI data (https://www.amap.com/, accessed on 15 February 2026) | 1 January 2024 | Shannon diversity index of POI categories | Reflects functional mixture and diversity |
| Public transport accessibility | Public transportation station density | Amap POI data (https://www.amap.com/, accessed on 15 February 2026); bus and metro stations | 2024 | Number of stations within unit area, stations/km2 | Reflects public transport station supply |
| Distance to nearest public transport station | Amap POI data (https://www.amap.com/, accessed on 15 February 2026); bus and metro stations | 2024 | Euclidean distance from village-unit centroid to nearest station | Reflects public transport proximity | |
| Destination accessibility | Commercial POI density | Amap POI data (business, shopping, finance, catering, etc.) | 1 January 2024 | Business POI count within unit area | Reflects concentration of commercial activity |
| Public-service POI density | Amap POI data (public service facilities) | 1 January 2024 | Public-service POI count within unit area | Reflects concentration of public-service facilities | |
| Employment POI density | Amap POI data (employment and work-related facilities) | 1 January 2024 | Employment POI count within unit area | Reflects concentration of employment and work facilities | |
| Residential POI density | Amap POI data (residential facilities) | 1 January 2024 | Residential POI count within unit area | Reflects residential function | |
| Socioeconomic background | Nighttime light index | NPP-VIIRS Nighttime Light Dataset (https://eogdata.mines.edu/, accessed on 15 February 2026) | 2023 | Mean nighttime light value within unit | Reflects economic activity level |
| GDP | Chinese Academy of Sciences Resource and Environmental Science Data Center (https://www.resdc.cn/, accessed on 15 February 2026); 1 km × 1 km grid | 2023 | Mean GDP grid value within unit | Reflects economic development level |
| Type | Time | Time Horizon | Time Interval |
|---|---|---|---|
| Weekday vitality | 10 July 2023–14 July 2023 | 24 h | 1 h |
| Weekend vitality | 15 July 2023–16 July 2023 | 24 h | 1 h |
| Model | N_Estimators | Max_Depth | Num_Leaves | Subsample | Random Seed |
| Weekday | 779 | 12 | 114 | 0.8228 | 42 |
| Weekend | 1106 | 8 | 63 | 0.8858 | 42 |
| City | Fringe Area/km2 | Share of Total Fringe Area (%) | Village Units | Mean POI Density (POIs/km2) |
|---|---|---|---|---|
| Chengdu | 2034.013 | 69.0058 | 516 | 53.5734 |
| Deyang | 435.8181 | 14.7855 | 142 | 52.9303 |
| Meishan | 326.4419 | 11.0749 | 72 | 29.4876 |
| Ziyang | 151.3232 | 5.13388 | 56 | 39.4916 |
| Total | 2947.5965 | 100 | 786 | - |
| Indicator | Mean | SD | Min | Max | Moran’s I | Z Value | Value |
|---|---|---|---|---|---|---|---|
| Weekday vitality | 118.2824 | 175.5027 | 0 | 1701 | 0.2303 | 10.2040 | <0.01 |
| Weekend vitality | 124.8779 | 182.6978 | 0 | 1668 | 0.2407 | 10.6439 | <0.01 |
| Weekend–weekday vitality difference index | 0.0296 | 0.0645 | −0.4737 | 0.3519 | 0.3005 | 13.123 | <0.01 |
| Type | Identification Basis | Temporal Rhythm | Land-Use Context | Planning Concern | Representative Example |
|---|---|---|---|---|---|
| Industrial-production | Employment/industrial POI, weekday high vitality | weekday high | industrial parks, logistics bases | jobs-housing-service mismatch |  |
| Residential-spillover | Residential POI, NTL, weekend/evening vitality | weekend/evening high | suburban communities, new towns | complete living circle |  |
| Transport-corridor | road density, station proximity, corridor location | node/corridor pattern | highways, rail stations | avoid ribbon sprawl |  |
| Ecological-recreation | NDVI, recreation POI, weekend increase | weekend high | parks, greenways, rural tourism | low-impact recreation |  |
| Comprehensive-service | mixed POI, public services | stable | campuses, hospitals, service nodes | functional coupling |  |
| Time | Model | Validation Strategy | R2 | RMSE | MAE | Spatial Residual Moran’ I | -Value |
|---|---|---|---|---|---|---|---|
| Weekday | LightGBM | Random 5-Fold CV | 0.6888 | 0.7446 | 0.6027 | ||
| Spatial-Block CV | 0.5112 | 0.9325 | 0.7534 | 0.2908 | <0.001 | ||
| OLS | Random 5-Fold CV | 0.3884 | 1.0389 | 0.8376 | |||
| Weekend | LightGBM | Random 5-Fold CV | 0.7387 | 0.6611 | 0.5007 | ||
| Spatial-Block CV | 0.5314 | 0.8894 | 0.7045 | 0.3766 | <0.001 | ||
| OLS | Random 5-Fold CV | 0.4236 | 1.0024 | 0.8053 |
| Rank | Weekday Variable | Mean Absolute SHAP | Weekend Variable | Mean Absolute SHAP |
|---|---|---|---|---|
| 1 | Population density | 0.3795 | Population density | 0.3972 |
| 2 | Nighttime light index | 0.1762 | Nighttime light index | 0.1743 |
| 3 | GDP | 0.1390 | GDP | 0.1516 |
| 4 | Commercial POI density | 0.1371 | Building density | 0.1427 |
| 5 | Building density | 0.1338 | Commercial POI density | 0.1287 |
Disclaimer/Publisher’s Note: The statements, opinions and data contained in all publications are solely those of the individual author(s) and contributor(s) and not of MDPI and/or the editor(s). MDPI and/or the editor(s) disclaim responsibility for any injury to people or property resulting from any ideas, methods, instructions or products referred to in the content. |
© 2026 by the authors. Licensee MDPI, Basel, Switzerland. This article is an open access article distributed under the terms and conditions of the Creative Commons Attribution (CC BY) license.
Share and Cite
Jiang, Y.; Zou, L.; Yan, Q.; Chen, J.; He, B.; Yang, H. Urban Vitality in Metropolitan Fringe Areas as Land-Use Transition Interfaces: Nonlinear Associations with the Built Environment in the Chengdu Metropolitan Area, China. Land 2026, 15, 1380. https://doi.org/10.3390/land15081380
Jiang Y, Zou L, Yan Q, Chen J, He B, Yang H. Urban Vitality in Metropolitan Fringe Areas as Land-Use Transition Interfaces: Nonlinear Associations with the Built Environment in the Chengdu Metropolitan Area, China. Land. 2026; 15(8):1380. https://doi.org/10.3390/land15081380
Chicago/Turabian StyleJiang, Yuxiao, Liping Zou, Qisheng Yan, Jie Chen, Bin He, and Haosen Yang. 2026. "Urban Vitality in Metropolitan Fringe Areas as Land-Use Transition Interfaces: Nonlinear Associations with the Built Environment in the Chengdu Metropolitan Area, China" Land 15, no. 8: 1380. https://doi.org/10.3390/land15081380
APA StyleJiang, Y., Zou, L., Yan, Q., Chen, J., He, B., & Yang, H. (2026). Urban Vitality in Metropolitan Fringe Areas as Land-Use Transition Interfaces: Nonlinear Associations with the Built Environment in the Chengdu Metropolitan Area, China. Land, 15(8), 1380. https://doi.org/10.3390/land15081380