Article

Spatiotemporal Evolution and Influencing Factors of Rural Settlements in a Metropolitan Hinterland: A Case Study of Changsha County, China


1
School of Architecture and Art, Central South University, Changsha 410075, China
2
College of Landscape Architecture and Art Design, Hunan Agricultural University, Changsha 410125, China
*
Author to whom correspondence should be addressed.
Land 2026, 15(7), 1173; https://doi.org/10.3390/land15071173
Submission received: 19 May 2026 / Revised: 23 June 2026 / Accepted: 26 June 2026 / Published: 29 June 2026

Abstract

Metropolitan hinterlands are zones of intense urban–rural factor flows and spatial restructuring, where understanding rural settlement evolution is crucial for revealing human–land relationship transformations. Taking Changsha County, the core hinterland of the Changsha–Zhuzhou–Xiangtan metropolitan area in central China, as a case study, we integrated landscape pattern indices, kernel density estimation, centroid migration, the Optimal Parameters-based Geographical Detector (OPGD), and Geographically Weighted Random Forest (GWRF) to analyze the spatiotemporal evolution of rural settlements from 1990 to 2020 and identify the factors associated with the spatial differentiation of rural settlement scale in 2020. The results showed that: (1) The scale of rural settlements continuously expanded, with the total area increasing by 69.7% while patch density declined by 26.7%, exhibiting a “dense south, sparse north” pattern. High-value kernel density zones progressively clustered toward the southwestern concentric zone, and the settlement centroid persistently migrated toward the urban core. (2) The output value of secondary and tertiary industries per unit area, NDVI, and living facility adequacy were identified as the core driving factors; GDP per capita, distance to cropland, and distance to major roads also exerted notable effects, and strong synergistic interactions were detected among these factors. (3) GWRF-SHAP analysis revealed pronounced spatial heterogeneity: NDVI exhibited a south-promotion, north-suppression bidirectional effect; distance to cropland showed the most stable positive influence; road proximity was significant only at transportation hubs; the output value of secondary and tertiary industries displayed a polarized “central driving, north–south suppression” pattern; and socioeconomic factors generally stimulated expansion in suburban areas while inhibiting it in remote hinterlands. This spatial divergence can be interpreted through the “south-industry, north-agriculture” structure: suburban industrial corridors are associated with externally oriented attraction, whereas remote agricultural hinterlands are more closely related to endogenous, resource-based upgrading. The study proposes a compound explanatory framework of “natural baseline constraints–locational guidance–socioeconomic dominance,” providing a scientific basis for differentiated spatial governance of rural settlements in metropolitan hinterlands.

1. Introduction

In recent years, with the continuous advancement of urbanization, rural areas have generally faced the dual challenges of persistent population outmigration and spatial structural imbalance [1,2]. According to statistical data, the permanent rural population in China decreased from 807.39 million in 2000 to 509.79 million in 2020, with an average annual decline rate of 2.33% and a cumulative decrease of 36.67%, indicating a dramatic reduction in the rural population. However, during the same period, the area of rural residential land increased from 127,512.76 km2 to 142,653.26 km2, representing a counter-trend increase of 11.87%. As a result, rural construction land continued to expand despite rapid population decline, leading to the dilemma of “population decrease but land expansion” and the inefficient utilization of construction land resources in rural areas in metropolitan hinterlands, which are among the regions most profoundly affected by urbanization and its associated impacts. The evolution of rural settlements in these areas is jointly driven by multiple factors, including urban expansion, population mobility, and policy regulation, exhibiting greater dynamism, complexity, and representativeness [3]. Therefore, systematically examining the spatiotemporal evolution patterns and underlying driving mechanisms of rural settlements in metropolitan hinterlands is of considerable theoretical and practical significance for optimizing territorial spatial layouts, improving land-use efficiency, and promoting urban–rural integration and rural revitalization.
Rural settlements are the primary residential spaces formed by the aggregation of rural residents to meet their production and living needs, and they also constitute an important component of rural construction land [4]. Research on rural settlements originated in the field of geography in Europe and North America during the nineteenth century and has gradually developed, through multidisciplinary integration, into a systematic theoretical framework encompassing spatial distribution, evolutionary mechanisms, and governance strategies [5]. With the acceleration of global urbanization and the increasing frequency of urban–rural interactions, the spatiotemporal evolution and restructuring of rural settlements have become core topics of common concern in international land system science, rural geography, and sustainability science. Against this background, research perspectives have continued to expand, gradually extending to multiple dimensions, including the spatiotemporal evolution of rural settlements [6,7,8,9], typological characteristics [10,11], influencing factors [7,8,12], land-use simulation [13,14], as well as the analysis of their interactive relationships with rural development and differentiated regulation strategies [15,16]. These studies have systematically revealed the development and transformation mechanisms of rural settlements.
In terms of conceptual connotation, rural settlements are understood differently across disciplines. Management studies tend to define them from the perspective of land ownership. Geography, by contrast, regards rural settlements as spatial systems composed of human, natural, and social elements and posits that they possess three fundamental attributes: systematicity (i.e., their internal elements form an interconnected system), multidimensionality (i.e., they are shaped by interacting social, economic, and spatial factors), and scale dependence (i.e., their patterns vary across spatial scales) [4,17]. From the perspective of Urban and Rural Planning, rural settlements are more often understood as the integrated outcome of coordinating spatial layout, functional organization, public service provision, and other elements with village planning and territorial spatial governance. Consequently, this perspective emphasizes the use of scientific planning instruments to optimize the allocation of spatial resources and to promote the orderly renewal and sustainable development of rural settlements [18].
Regarding research on spatiotemporal evolution, existing studies have primarily employed landscape ecological and geospatial analytical methods, such as landscape pattern indices and kernel density analysis [7,19,20,21], to examine the distribution characteristics and evolutionary patterns of rural settlements across multiple scales, including the national [4,22], provincial [7,12,23,24], municipal [10,25,26], county [8,27], and township levels [28]. Overall, the scale and density of rural settlements have exhibited increasing and spatial expansion trends in many regions worldwide, a phenomenon that is particularly pronounced in rapidly urbanizing developing countries. From a macro perspective, rural settlements are predominantly concentrated in areas with low elevation and gentle slopes and exhibit strong geographical orientations toward transportation networks, central places, and cultivated land resources [29,30]. At the micro scale, however, the spatial distribution of rural settlements demonstrates significant regional heterogeneity. In plains and economically developed areas, settlement forms tend to become more regularized and intensive, whereas hilly and mountainous regions as well as traditional agricultural areas generally exhibit a dispersed pattern characterized by “large dispersion and small agglomeration” [29]. In addition, phenomena of rural hollowing, such as “building new houses without demolishing old ones” and “outward expansion with internal vacancy,” are also widespread [31]. Nevertheless, relatively few studies have focused on county-level areas in metropolitan hinterlands, particularly lacking systematic dynamic analyses based on long-term time series, which has constrained a deeper understanding of the evolutionary mechanisms of rural settlements within urban–rural interaction zones as a special spatial unit. Over recent decades, driven jointly by rapid urbanization and the rural revitalization strategy in China, rural areas on the periphery of metropolitan circles have experienced dramatic differentiation and restructuring of land-use patterns, giving rise to complex urban–rural land-use transition trends and providing representative cases for validating and extending related theories.
Regarding influencing factors, the determinants affecting the optimization of rural settlement layouts can generally be categorized into three groups: natural geographical conditions, socioeconomic factors, and policy–institutional factors [32,33]. Natural geographical conditions constitute the initial spatial pattern and baseline constraints of rural settlements, socioeconomic development serves as the core driving force underlying their evolution, and policy institutions guide settlement layout adjustment and spatial restructuring through macro-level regulation [34,35]. In terms of research methods, the Geographical Detector has become one of the mainstream approaches for identifying the effects of natural conditions, locational characteristics, and socioeconomic factors on the distribution of rural settlements [14,21,36]. Numerous studies have demonstrated that factors such as elevation, slope, central-place accessibility—including access to roads and administrative centers—and GDP per capita possess significant explanatory power [7,12,14,21,25,37,38]. However, this method relies heavily on researchers’ experience in the discretization of spatial data and the selection of scale parameters, which may reduce the robustness of the results [39]. Meanwhile, some studies have employed the Geographically Weighted Regression (GWR) model to reveal the spatial differentiation of driving factors [40,41]. Nevertheless, because GWR typically adopts a single bandwidth, it is difficult to fully capture the multiscale effects of different driving factors. In contrast, Multiscale Geographically Weighted Regression (MGWR) assigns heterogeneous bandwidths to different variables, enabling more accurate characterization of local spatial processes and effectively revealing the differentiated influence mechanisms of various factors across spatial scales [42,43]. However, analyses based on both methods mainly rely on assumptions of linear relationships and therefore exhibit limitations in addressing the complex high-dimensional nonlinear relationships and interaction effects among variables within rural systems. The Geographically Weighted Random Forest (GWRF) model is a localized nonlinear machine learning model that integrates the advantages of Random Forest (RF) and Geographically Weighted Regression (GWR) [44]. This model can automatically capture complex nonlinear relationships and interaction effects among variables by constructing independent RF models for each spatial location, thereby more accurately revealing the spatial heterogeneity of different driving factors [45,46]. Consequently, it provides a new perspective for investigating the driving mechanisms underlying the evolution of rural human settlements across multiple spatial scales.
Taken together, previous studies have advanced our understanding of rural settlement evolution and its influencing factors through landscape-pattern analysis, spatial econometric modelling, and geographical detection. However, several aspects warrant further attention. First, most studies have focused on general rural areas or typical urban fringe areas, whereas county-level rural areas around megacities—a territorial type shaped by urban spillovers, industrial influence, and rural functional transformation—remain less examined. Second, in areas with favourable agricultural resources and a strong agricultural industrial base, the spatial differentiation of rural settlements may be shaped by agricultural production conditions, and the combination of influencing factors may differ from that in general non-agricultural areas. Finally, many studies still rely on traditional linear models or geographically weighted regression methods, leaving potential nonlinear relationships, interaction effects, and village-level spatial heterogeneity among influencing factors insufficiently explored.
In summary, this study selects Changsha County, a typical economically developed county located in the metropolitan hinterland of central China, as the study area and takes the period from 1990 to 2020 as the temporal framework. By comprehensively applying methods including landscape pattern indices, kernel density analysis, the centroid migration model, the Optimal Parameters-based Geographical Detector (OPGD) model, and the Geographically Weighted Random Forest (GWRF) model, this study systematically examines the spatiotemporal characteristics and influencing factors of rural settlement distribution. The findings are expected to provide scientific support for optimizing village spatial planning and regulating construction land use in Changsha County, while also offering theoretical paradigms and practical pathways for rural spatial governance and sustainable development in county-level areas surrounding megacities.

2. Theoretical Framework

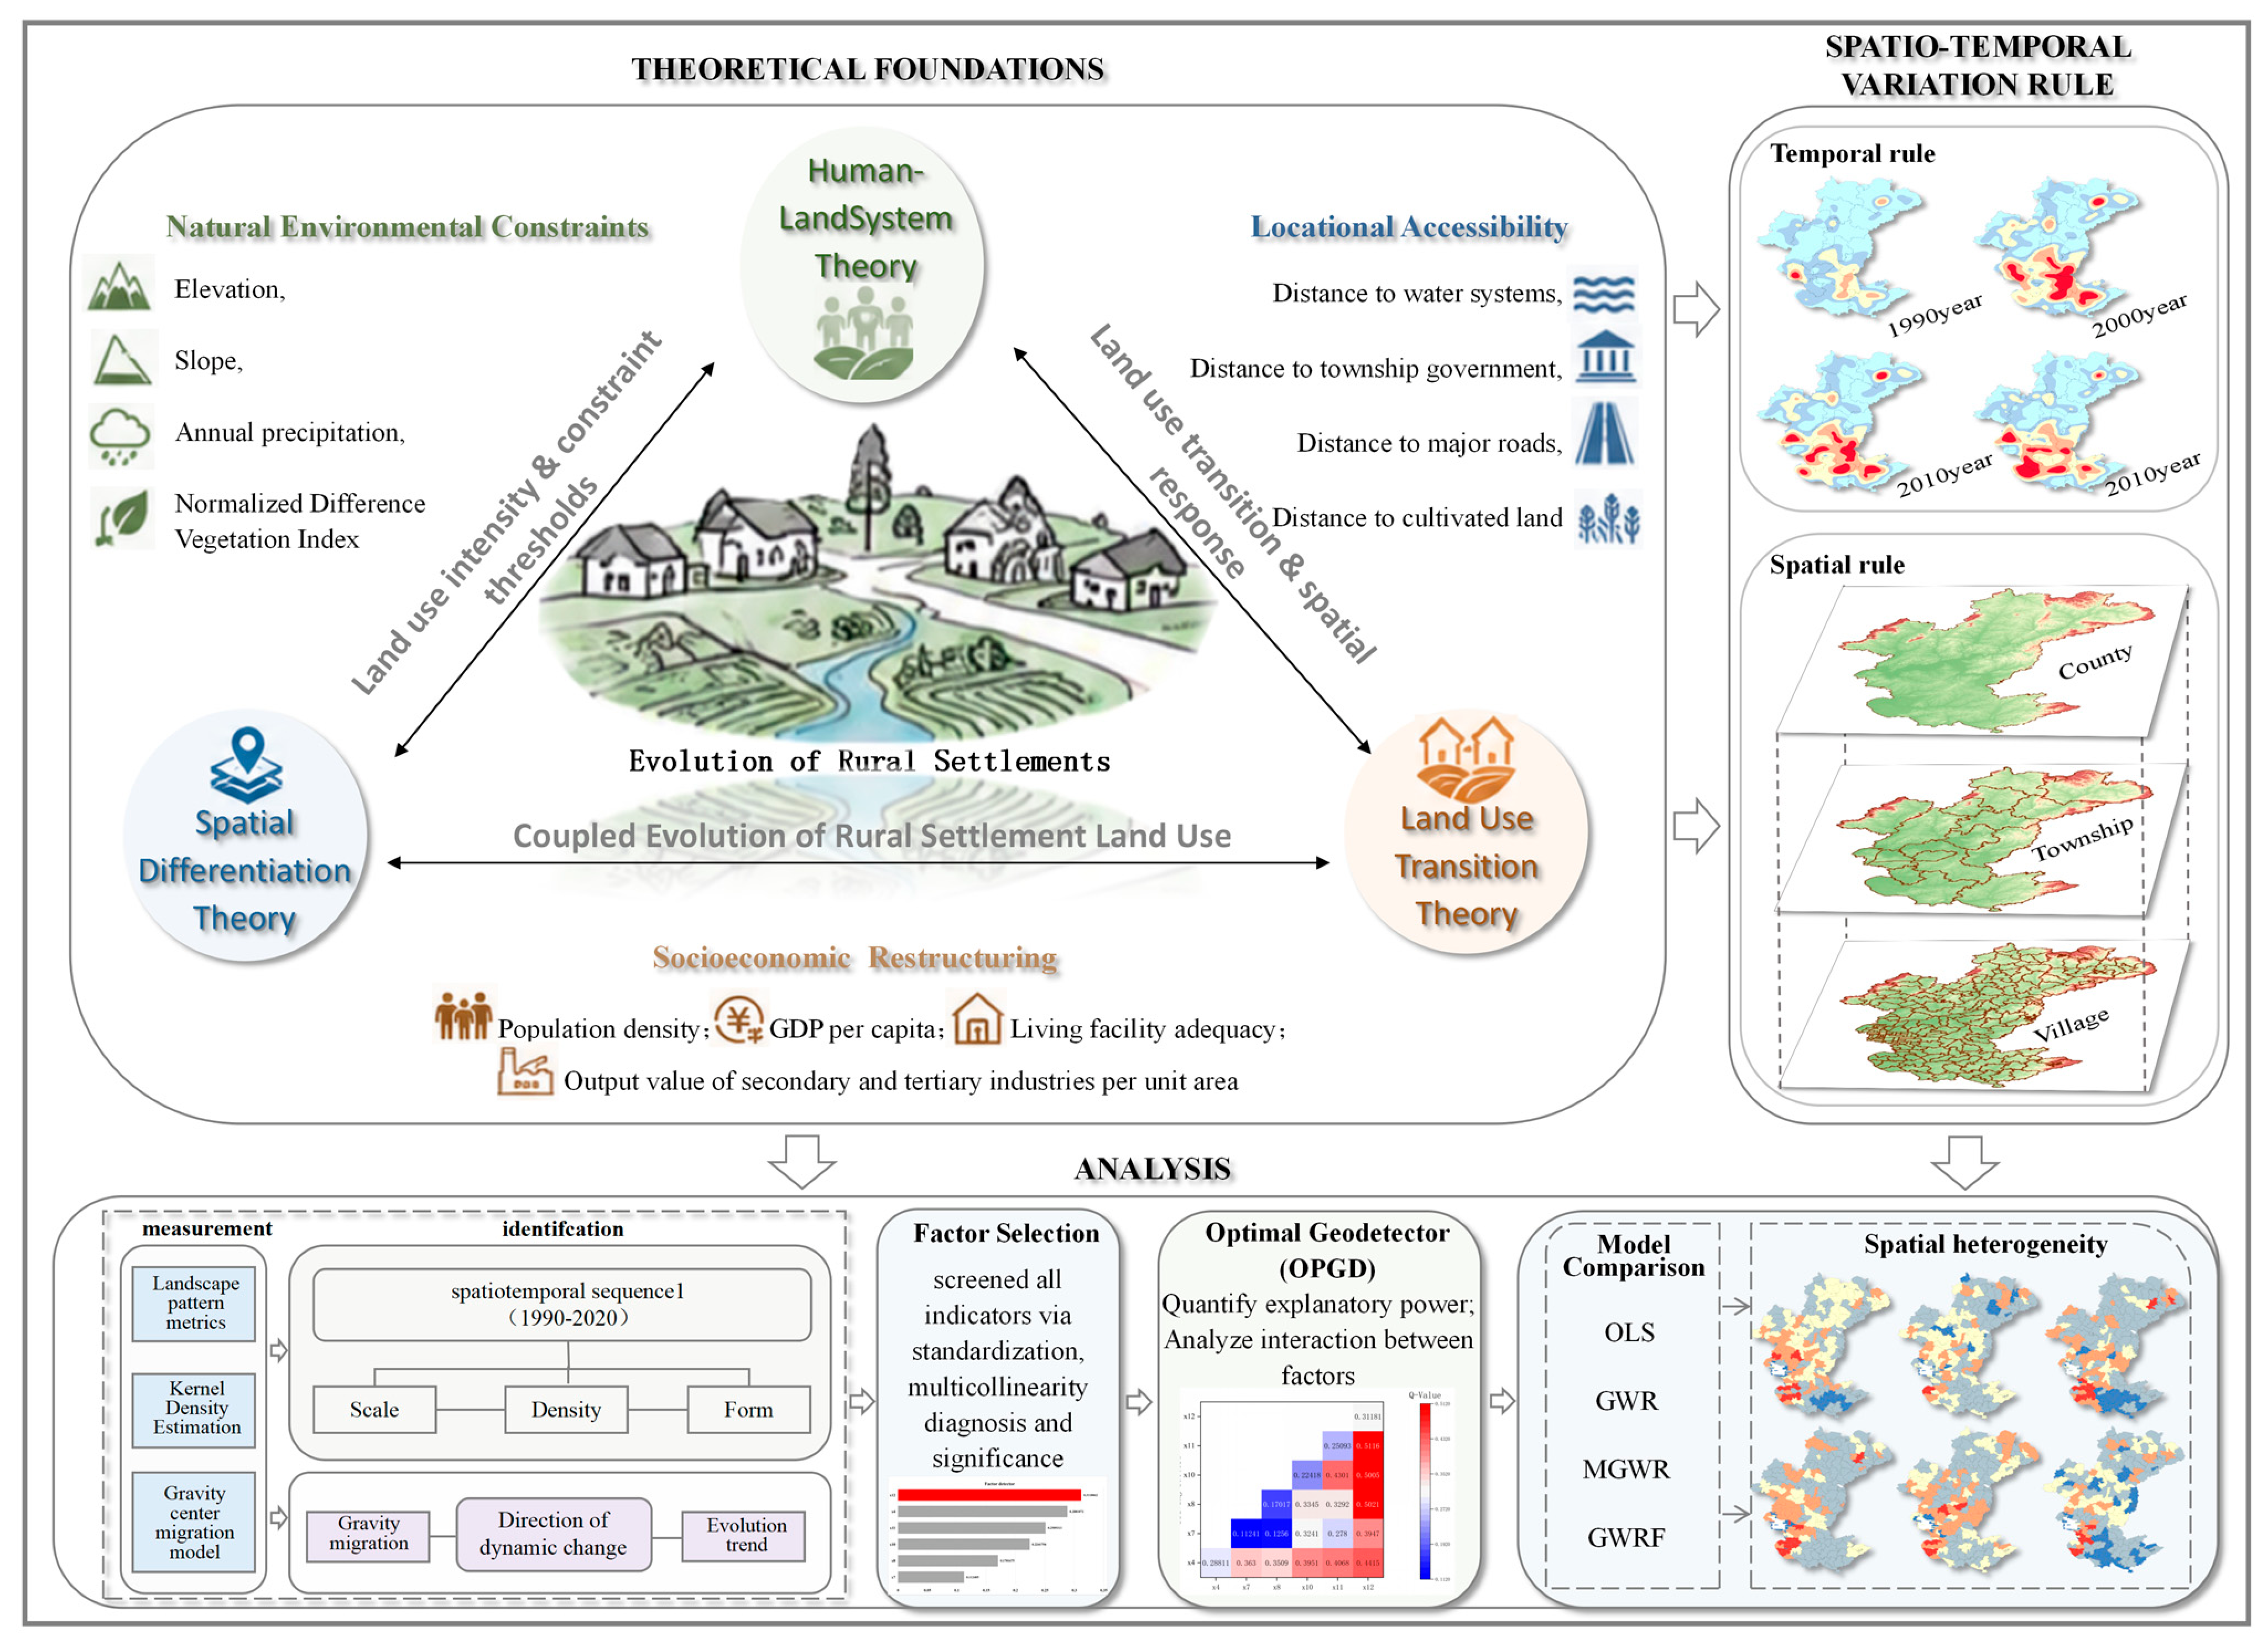
This study draws on human–land system theory, spatial differentiation theory, and land-use transition theory to construct an explanatory framework for understanding the spatiotemporal evolution and spatial differentiation of rural settlements in metropolitan hinterlands (Figure 1). Human–land system theory emphasizes the interactions among population, land, resources, environment, and socioeconomic activities, providing a general basis for interpreting rural settlements as spatial outcomes of long-term human–land interactions. Spatial differentiation theory highlights the uneven distribution of natural conditions, locational advantages, industrial foundations, and public service provision, thereby supporting the analysis of regional differences and spatial heterogeneity in rural settlement patterns. Land-use transition theory helps explain changes in rural residential land and the adjustment of human–land relationships under urbanization and rural transformation.
Based on these theoretical perspectives, this study understands rural settlement evolution as a spatial process shaped by natural environmental constraints, locational accessibility, and socioeconomic restructuring. Natural environmental constraints define the baseline suitability and ecological limits of settlement development; locational accessibility influences settlement concentration through access to roads, cultivated land, public services, and central places; and socioeconomic restructuring reshapes settlement scale through industrial development, facility provision, and changes in rural development capacity. Accordingly, this study expects these three dimensions to jointly affect the spatial differentiation of rural settlement scale, while their effects may vary across village-level units due to differentiated human–land interactions within the metropolitan hinterland. Empirically, multi-period land-use data from 1990 to 2020 are used to identify the long-term spatiotemporal evolution of rural settlements, while a 2020 administrative-village-level cross-sectional dataset is used to examine the explanatory power, interaction effects, and spatial heterogeneity of the associated factors using OPGD, GWRF, and SHAP.

3. Materials and Methods

3.1. Study Area

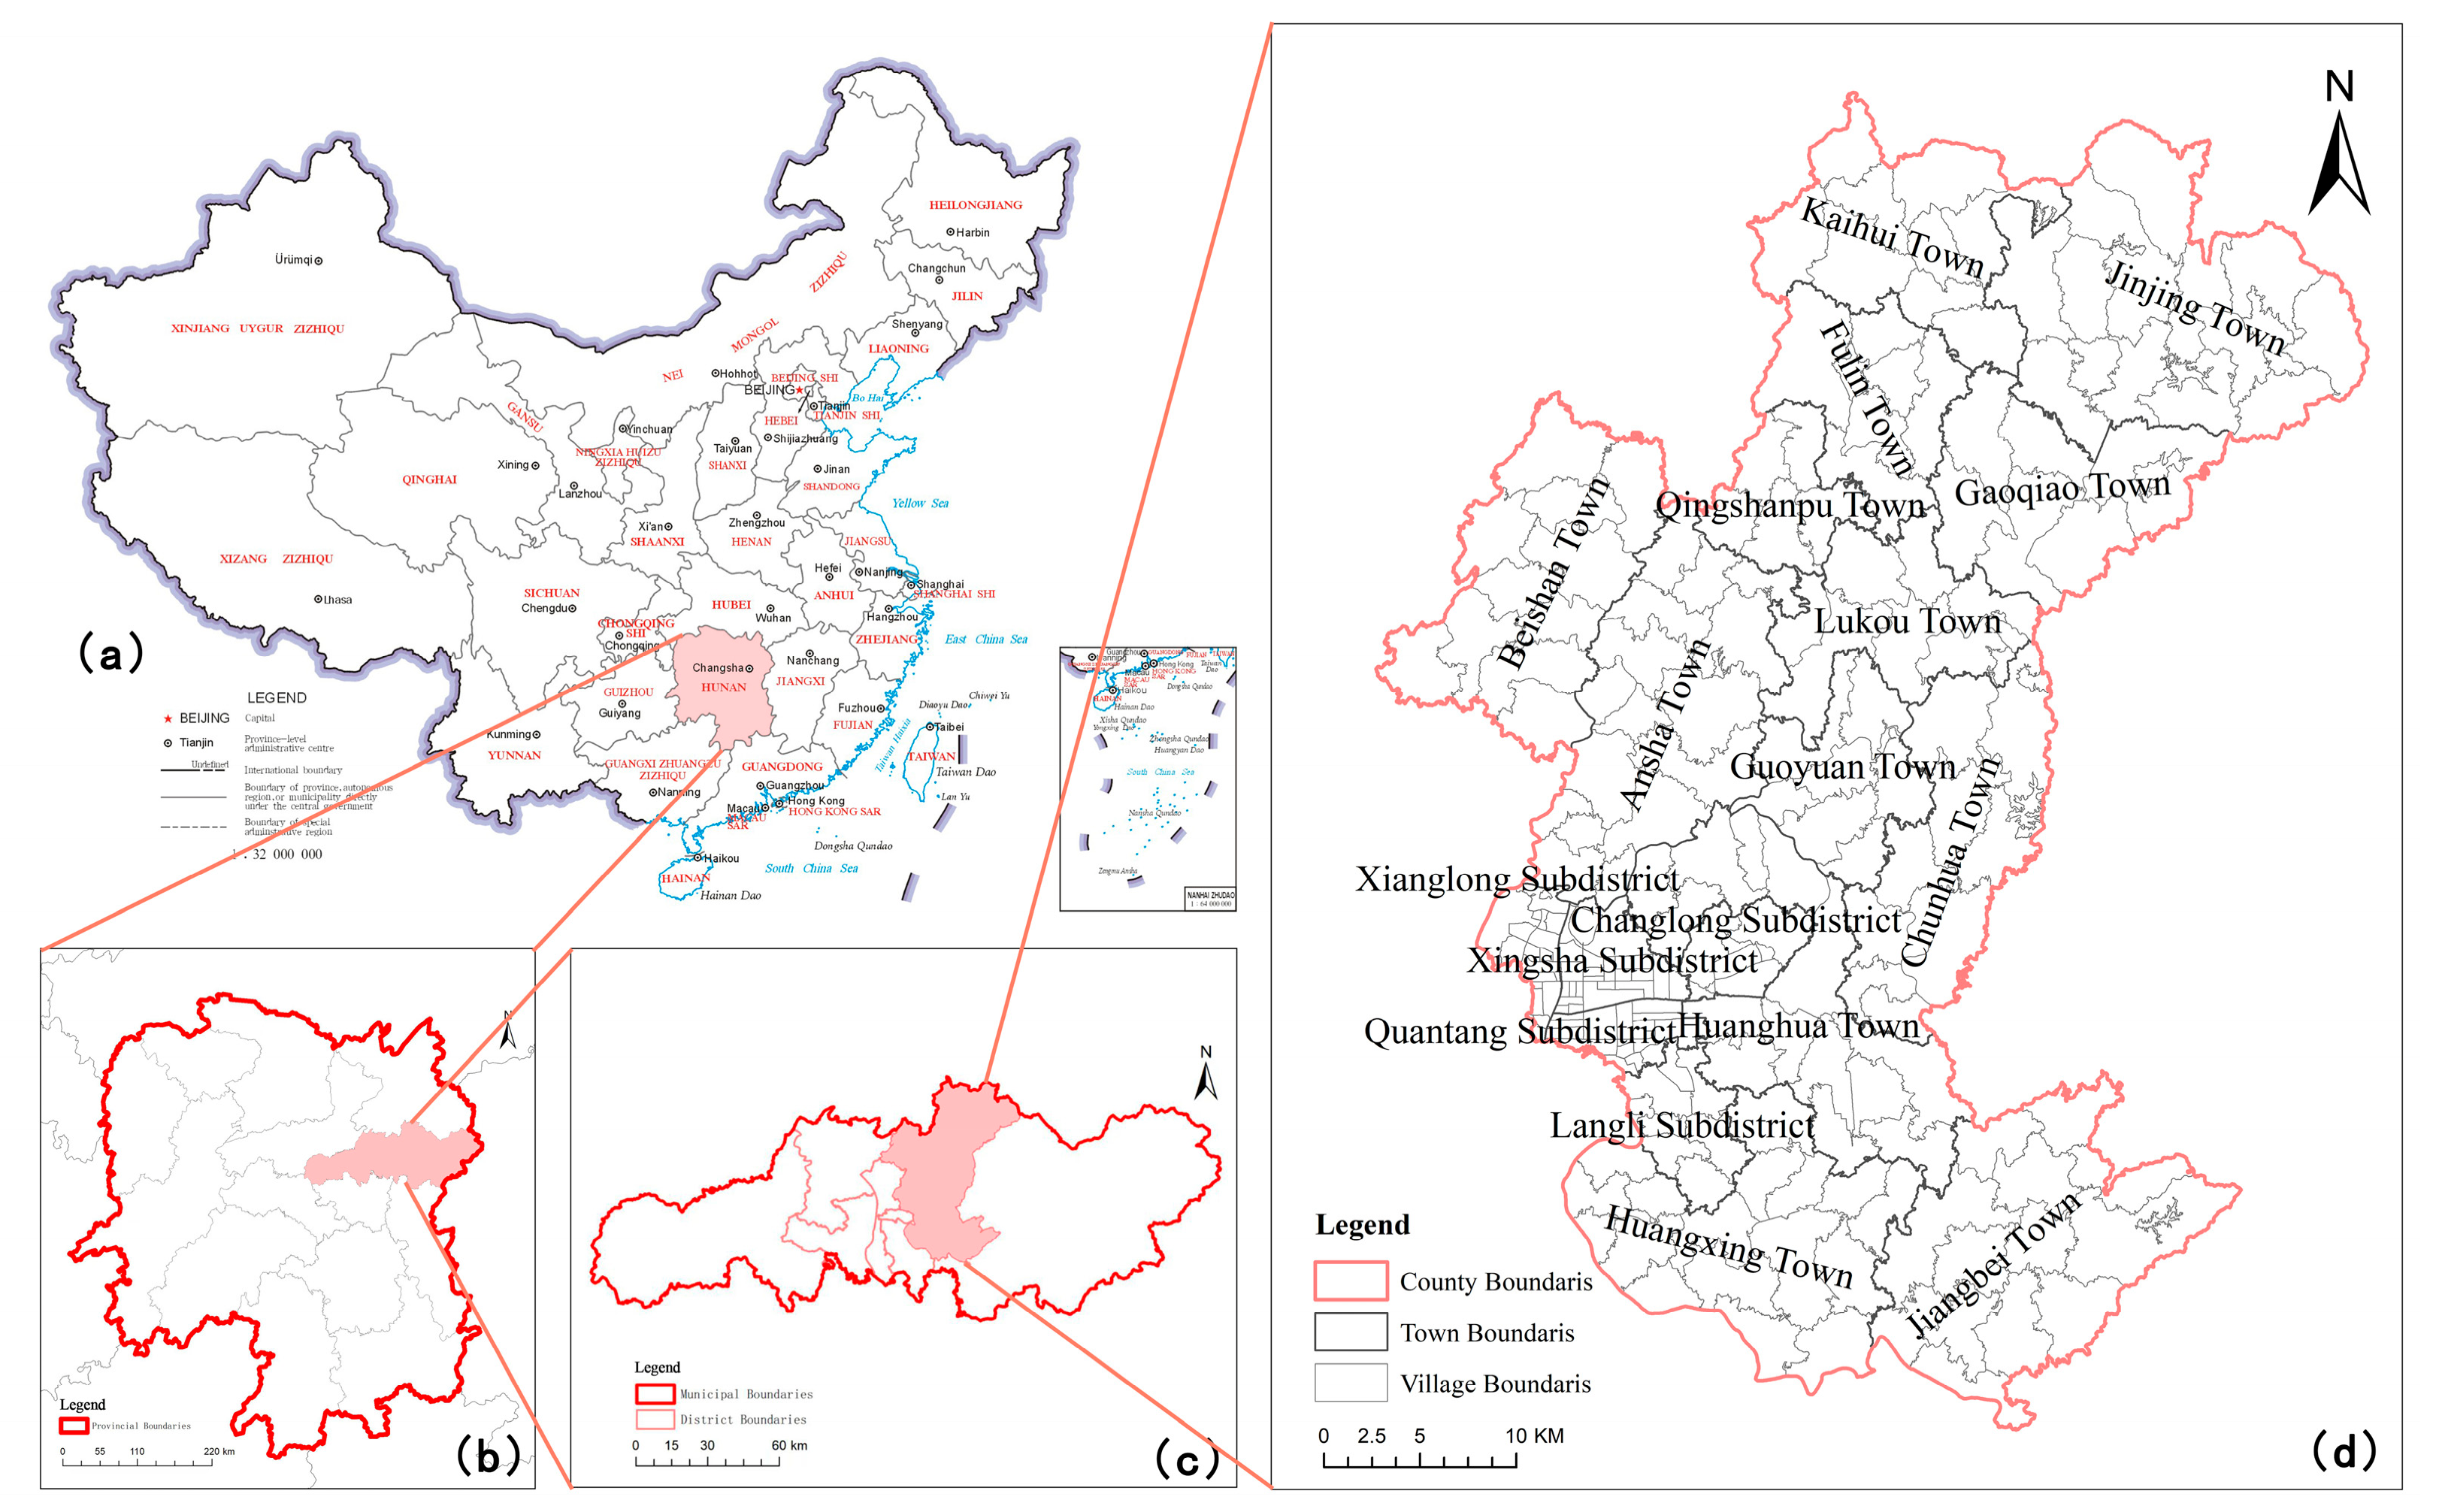
Changsha County is administratively affiliated with Changsha City, Hunan Province, and is located in the central core hinterland of Changsha City. It serves as a key supporting area for the Changsha–Zhuzhou–Xiangtan core growth pole within Hunan Province’s regional development framework of “one core, two sub-centers, three belts, and four zones” [47] (Figure 2). The county covers a total area of 1756 km2 and administers 13 towns and 5 subdistricts. The overall terrain slopes from the north, east, and south toward the central-western region, forming an irregular “dustpan-shaped” topography. The landform is dominated by granite plains, accompanied by hills and mountainous areas, resulting in diverse geomorphological types. Major first-order tributaries of the Xiangjiang River, including the Liuyang River and Laodao River, run throughout the county.
As one of China’s Top 100 Counties and the highest-ranked county in central and western China, Changsha County exhibits economic scale and urbanization levels significantly higher than those of typical county-level units. In 2024, the county had a permanent population of 1.4531 million and an urbanization rate of 75.92% [48]. It hosts globally renowned construction machinery enterprises such as Sany Heavy Industry and Sunward Intelligent, along with more than 40 Fortune Global 500 enterprises. Meanwhile, it has also been designated as a National Modern Agricultural Industrial Park, forming a coordinated development pattern between industry and agriculture. Significant differences in natural geographical conditions and development levels exist among the county’s 13 towns, providing a representative case for exploring the spatiotemporal evolution characteristics of rural settlements under different locational conditions.
As of 2020, Changsha County comprised 103 communities and 114 administrative villages [49]. Considering that this study focuses on rural settlements, village-level units without rural residential land were excluded according to the actual distribution of rural residential land extracted from the 2020 land-use data. Finally, 184 village-level administrative units were selected as the basic analytical units for the OPGD, OLS, GWR, MGWR, GWRF, and village-level SHAP analyses. These units cover the rural settlement areas distributed across the county’s 13 towns and 5 subdistricts.

3.2. Data Sources

To ensure consistency between the research units and data scales, while also considering model efficiency and the applicability of planning and regulation practices, this study used administrative villages as the basic spatial units of analysis. The datasets used in this study mainly included land-use data, digital elevation model (DEM) data, geographic base data, administrative boundary data, and socioeconomic data (Table 1).
The spatiotemporal evolution analysis of rural settlements was based on land-use data for 1990, 2000, 2010, and 2020. The 30 m resolution land-use data for Changsha County were obtained from the Resource and Environment Science Data Center of the Chinese Academy of Sciences (https://www.resdc.cn/ (accessed on 15 May 2026)). Rural residential land was extracted from the land-use data and used to analyze changes in settlement scale, landscape pattern, kernel density distribution, and centroid migration from 1990 to 2020.
The influencing-factor analysis was conducted using a 2020 cross-sectional dataset at the village-level administrative unit scale. For the 184 village-level administrative units, the dependent variable was the rural residential land area in 2020. Its mean, standard deviation, minimum, and maximum values were 0.31 km2, 0.38 km2, 0.0009 km2, and 2.59 km2, respectively. The explanatory variables included 12 indicators from three dimensions: natural environment, locational conditions, and socioeconomic development. Elevation and slope were derived from 30 m DEM data obtained from the Geospatial Data Cloud (https://www.gscloud.cn/ (accessed on 15 May 2026)). Annual precipitation and the Normalized Difference Vegetation Index (NDVI) were obtained from the Resource and Environment Science Data Center of the Chinese Academy of Sciences. Locational variables, including distance to water systems, distance to township government seats, distance to major roads, and distance to cultivated land, were generated through Euclidean distance analysis based on OpenStreetMap, the AutoNavi Maps API (AMap API; https://lbs.amap.com/ (accessed on 15 May 2026)), and the land-use data. The living facility adequacy indicator was calculated using points of interest (POIs), including public service and commercial service facilities, obtained from the AutoNavi Maps API.
County-, township-, and administrative-village-level boundary data were provided by the Changsha Municipal Bureau of Natural Resources and Planning. The 2020 permanent population data for each administrative village were obtained from the Seventh National Population Census and provided by the same bureau. Socioeconomic data, including GDP and the output value of secondary and tertiary industries, were mainly extracted from the Changsha Statistical Yearbook, the Changsha County Statistical Yearbook, township-level territorial spatial planning documents, and relevant village planning documents. These data were combined with village-level population and land-area data to calculate indicators such as GDP per capita and the output value of secondary and tertiary industries per unit area.
Since the current round of village planning in Hunan Province was mainly compiled between 2017 and 2020, slight temporal inconsistencies may exist among different village planning documents. To verify and correct the socioeconomic information recorded in these documents, the research team conducted 10 supplementary field surveys in 88 villages across the county’s 13 towns and 5 subdistricts during 2021 and 2022. The field surveys were mainly conducted through interviews and discussions with township governments and village committees, focusing on industrial development conditions and output-value information. For villages with obviously inconsistent data, the relevant information was corrected based on field verification; for villages whose planning documents were compiled relatively early, the socioeconomic information was updated to better correspond to the 2020 cross-sectional analysis. The verified and corrected information was then organized into village-level socioeconomic indicators, thereby improving the reliability and consistency of the dataset.

3.3. Methods

Landscape pattern index, kernel density estimation, and Centroid Migration Model were employed to characterize the spatiotemporal evolution of rural settlements in terms of scale dynamics, spatial agglomeration, and centroid shifts. Building upon this foundation, OPGD was used to identify the dominant driving factors and their interaction effects. Subsequently, OLS, GWR, MGWR, and GWRF models were compared to reveal the spatial heterogeneity of driving relationships and determine the optimal modeling approach. Finally, SHAP was integrated to interpret the local effects of the optimal model, thereby providing a systematic understanding of the driving mechanisms underlying rural settlement evolution.

3.3.1. Landscape Pattern Index Method

Landscape pattern indices can systematically characterize the structural composition and spatial configuration characteristics of landscapes through a series of quantitative indicators [23]. Based on the three dimensions of scale, density, and morphology, this study selected seven indices, including class area (CA), largest patch index (LPI), number of patches (NP), patch density (PD), landscape shape index (LSI), cohesion index (COHESION), and splitting index (SPLIT), to systematically analyze the spatiotemporal evolution of the rural settlement landscape pattern in Changsha County, thereby revealing its evolutionary characteristics in terms of scale distribution, agglomeration degree, and morphological structure.

3.3.2. Kernel Density Estimation

The Kernel Density Estimation (KDE) method can reflect the spatial agglomeration characteristics of geographical elements [22]. It enables the intuitive identification of settlement agglomeration centers and distribution trends, thereby providing a basis for analyzing their spatial evolution. The calculation formula is as follows:
F n x = 1 n h 2 i = 1 n k x x i h
where   F n x denotes the kernel density value; n represents the number of rural settlements; h is the search radius (bandwidth); k denotes the kernel density function; and x x i represents the distance between the rural settlement point to be estimated x and the sample point x i .

3.3.3. Centroid Migration Model

The centroid migration model describes the spatial displacement process of geographical elements by calculating their mean centers [50]. By calculating the centroid coordinates of rural settlements in Changsha County at four time points—1990, 2000, 2010, and 2020—this study reveals the migration trajectories and spatial evolution patterns of rural settlements. The calculation formula is as follows:
X = i = 1 n ( S i × X i ) i = 1 n S i
Y = i = 1 n ( S i × Y i ) i = 1 n S i
where X and Y represent the coordinates of the centroid of rural settlements; S i denotes the area of the i -th rural settlement patch; and X i and Y i represent the longitude and latitude coordinates of the i -th rural settlement, respectively.

3.3.4. Optimal Parameter-Based Geographical Detector (OPGD) Model

The Optimal Parameter-based Geographical Detector (OPGD) model can overcome the limitations of the traditional Geographical Detector model in terms of discretization methods and scale selection [36,51]. The OPGD evaluates the effectiveness of different discretization schemes through the q-statistic, where a larger q value indicates stronger explanatory power of the stratification. Based on the R programming language, this study compared four discretization methods within a classification range of 5–10 categories for rural settlement scale and determined the optimal parameters according to the principle of maximizing the q value, thereby analyzing the driving factors underlying the spatiotemporal evolution of rural settlements in Changsha County. The calculation formula is as follows:
q = 1 h = 1 l N h σ h 2 N σ 2 = 1 S S W S S T
S S W = h = 1 l N h σ 2 , S S T = N σ 2
In the formula, q represents the influencing factor of the rural settlement pattern, with a value range of [0, 1]. A higher value indicates stronger explanatory power of the factor. l is the number of influencing factors; N is the number of spatial units under study; and N h is the sample size of factor h. σ h 2 and σ 2 denote the variance within group h and the overall variance of rural settlements, respectively. S S W represents the sum of within-group variances, and S S T denotes the total variance of the study area.

3.3.5. Multiscale Geographically Weighted Regression Model (MGWR)

Multiscale Geographically Weighted Regression (MGWR) is an important extension of the traditional Geographically Weighted Regression (GWR) approach [42,43]. By estimating an optimal bandwidth for each explanatory variable independently, MGWR allows different influencing factors to operate at distinct spatial scales. This enables a more precise characterization of the spatial non-stationarity of variable relationships in local regions and significantly enhances the model’s adaptability and explanatory power in capturing complex geographical processes. The basic formula is as follows:
Y i = β b w 0 ( u i , v i ) + j = 1 k β b w j ( u i , v i ) X i j + E i
In the formula, ( u i , v i ) represents the coordinates of the i -th administrative unit; Y i denotes the observed value of the spatial correlation index at ( u i , v i ) ; X i j represents the observed value of the influencing factor X j . β b w j denotes the regression coefficient of the influencing factor under the optimal bandwidth; βbw0 represents the intercept at location ( u i , v i ) ; b w j and bw0 denote the optimal bandwidth for the j -th influencing factor and the intercept, respectively; and E i is the independent random error term of the i-th unit.

3.3.6. Geographically Weighted Random Forest Model (GWRF)

The Geographically Weighted Random Forest (GWRF) model is a spatial extension of the traditional Random Forest (RF) method [44]. Based on the concept of spatially varying coefficient models, GWRF consists of multiple local RF sub-models and does not require the assumption that the data follow a Gaussian distribution [46]. It can serve as an effective explanatory and predictive tool for addressing spatial heterogeneity and handling nonlinear relationships. In this study, the GWRF model is implemented using the “SpatialML” package in R. The formula is as follows:
Y i = a ( u i , v i ) x i + e
In the formula, Y i is the dependent variable of the i -th observation; a ( u i , v i ) x i represents the prediction of the RF model calibrated at location i ; ( u i , v i ) are the coordinates of spatial unit i ; and e is the error term.

4. Results

4.1. Spatiotemporal Evolution Characteristics of Rural Settlements in Changsha County

4.1.1. Spatiotemporal Evolution Characteristics of Landscape Patterns

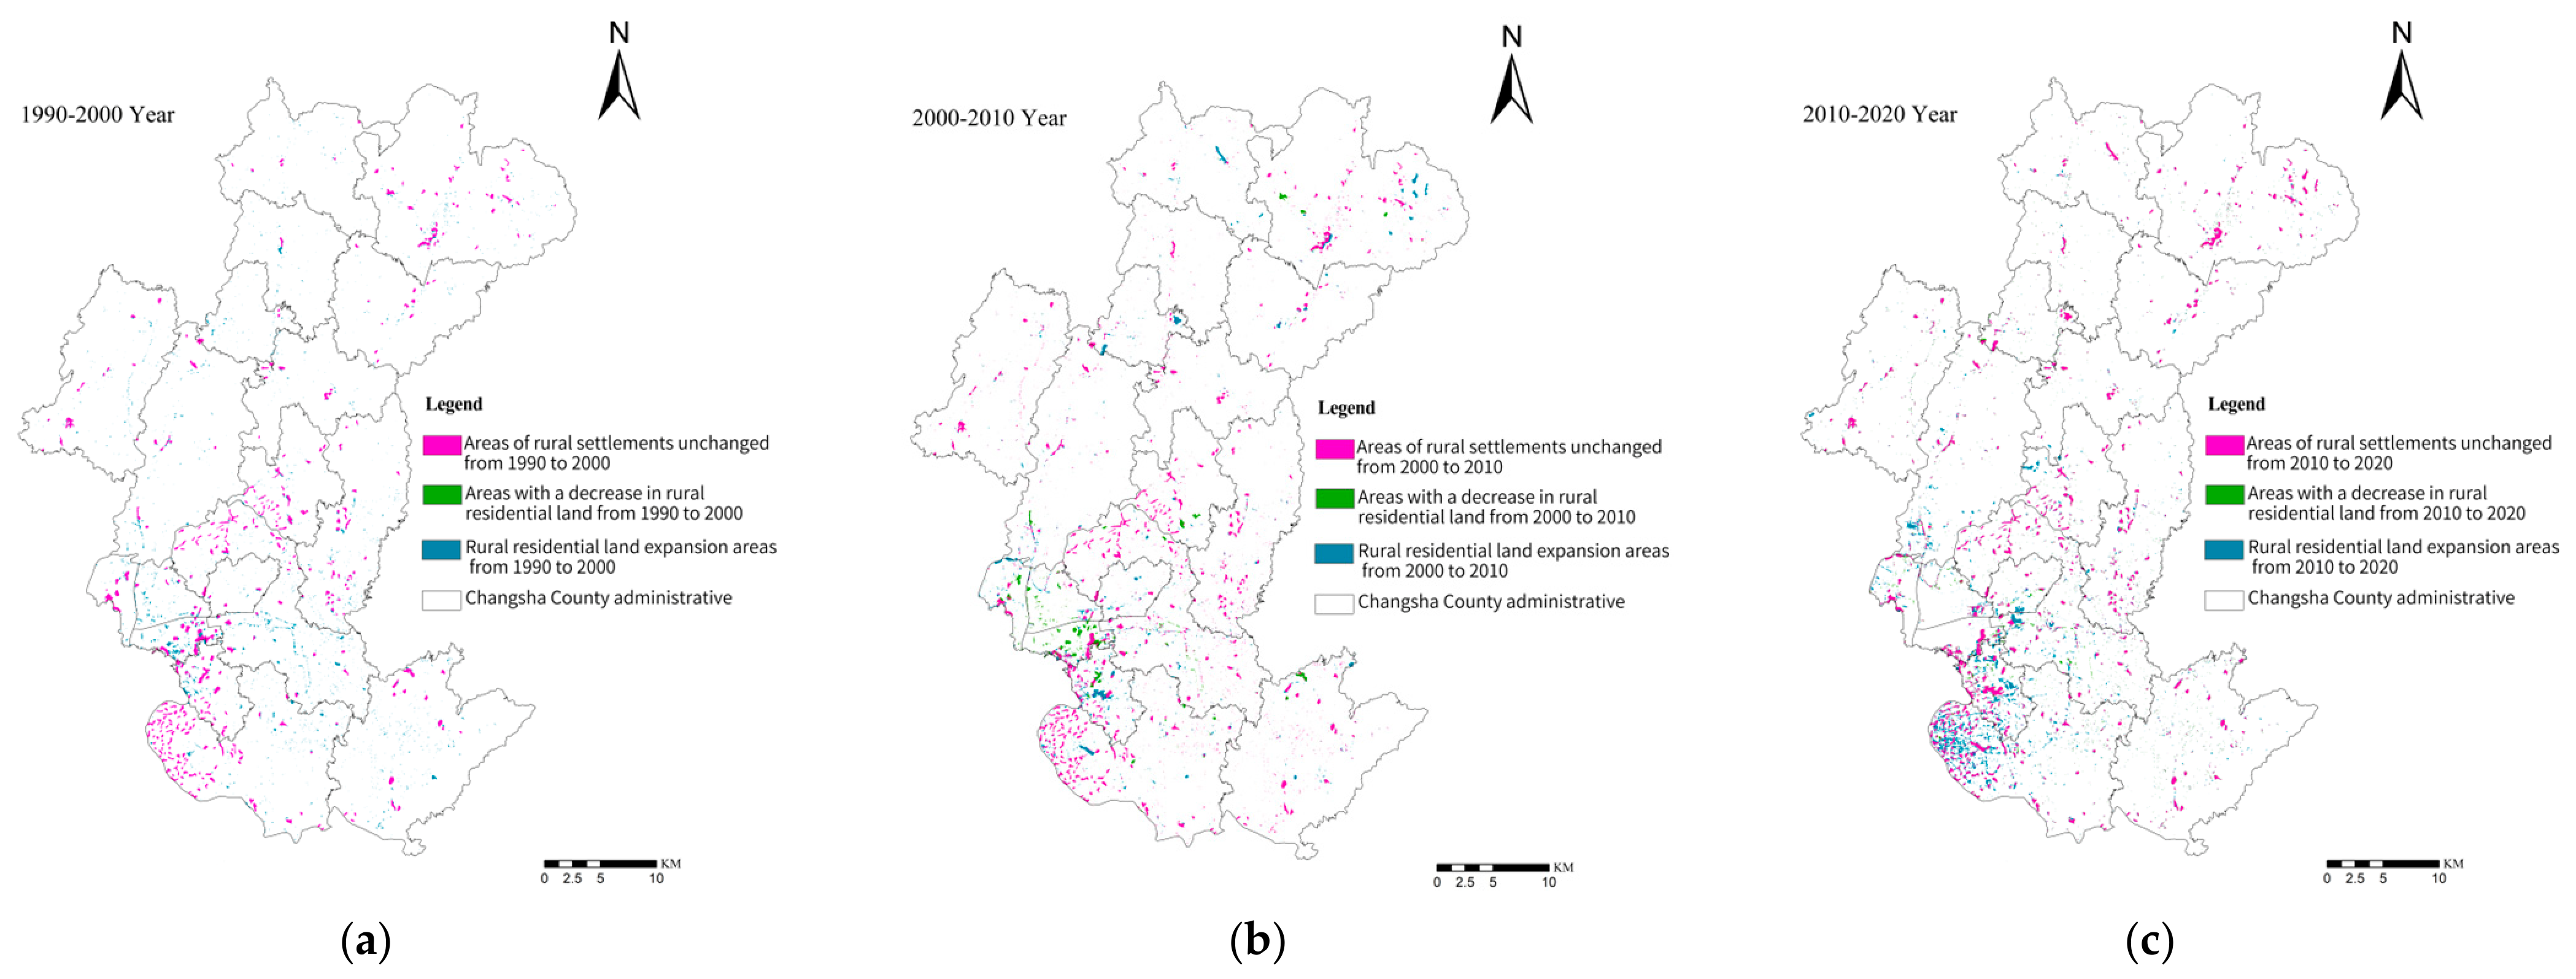
Based on the spatiotemporal distribution pattern of rural settlements (Figure 3), the spatial distribution of rural settlements in Changsha County from 1990 to 2020 was characterized by a “dense in the south and sparse in the north” pattern. Areas with concentrated rural settlement patches were mainly situated in the vicinity of highly urbanized zones in the southwestern part of Changsha County, including Langli Subdistrict, Huanghua Town, and the western part of Huangxing Town. In addition, rural settlement patches were relatively dense in Jinjing Town, located in the northeastern part of the county, and Jiangbei Town, situated in the southeastern part. In contrast, rural settlement patches in the northwestern and north-central regions of Changsha County were relatively scattered.
Based on the results of the landscape pattern index analysis (Table 2), the evolutionary characteristics of rural settlement patches in Changsha County from 1990 to 2020 were comprehensively analyzed from three aspects: scale, density, and morphology. In terms of scale characteristics, the class area (CA) of rural settlement patches continuously increased during the study period, with a total growth rate of 69.7%, among which the most significant expansion occurred during 2010–2020. The largest patch index (LPI) increased from 2.21% to 3.85%, representing an increase of 25.4%. Although slight fluctuations occurred in 2010, the overall trend remained upward, indicating an expansion in the size of dominant patches, with core settlement clusters strengthening their dominant position through the assimilation of surrounding smaller patches. This evolutionary pattern is highly consistent with the continuous implementation of township administrative restructuring policies in Changsha County since the 1990s, particularly the township mergers implemented in 2015, such as Jinjing–Shuangjiang, Kaihui–Baisha, and Huangxing–Ganshan, which effectively guided rural settlements to concentrate toward township centers and planned consolidation areas, thereby directly promoting the expansion of dominant patches and the overall intensification of spatial organization at the landscape scale.
In terms of density characteristics, the number of patches (NP) increased from 3058 to 3803, representing a growth of 24.4%, whereas patch density (PD) decreased from 90.66 to 66.44 patches per km2 of rural residential land, with a decline of 26.7%. This pattern of “increasing patch number but decreasing density,” together with the substantial increase in CA, indicates that the expansion of rural settlement land was manifested not only in the increase in patch quantity but also in the enlargement of individual patch sizes.
In terms of morphological characteristics, the landscape shape index (LSI) increased from 49.37 to 61.91, indicating that patch shapes became increasingly complex; the cohesion index (COHESION) increased by 5.7%, suggesting enhanced connectivity among patches; and the splitting index (SPLIT) decreased by 30.0%, reflecting a significant reduction in the spatial separation of patches. Particularly during 2010–2020, the trends of morphological integration and spatial agglomeration became most evident, with the spatial structure of rural settlements gradually evolving toward a more aggregated pattern.
Notably, the expansion of rural settlement patches did not occur in parallel with rural population growth. As shown above, the total area of rural residential land in Changsha County increased continuously from 33.73 km2 in 1990 to 57.24 km2 in 2020, representing an increase of approximately 69.70% and indicating a persistent expansion of rural settlement land. In contrast, the rural population of Changsha County decreased substantially from 711,400 to 350,000 during the same period, representing a decline of approximately 50.80%. Based on these two opposite trends, the per capita rural residential land area increased by approximately 244.93% from 1990 to 2020, indicating that rural settlement land expansion far outpaced rural population change. Although the population data and land-use data are not available at the same spatial resolution, the county-level trend clearly reveals a pronounced mismatch between rural population decline and rural residential land expansion. This pattern is consistent with the broader national phenomenon of “population decline but land expansion” in rural China and is even more prominent in Changsha County, further highlighting the practical necessity of regulating rural settlement land expansion and improving the efficiency of rural construction land use in metropolitan hinterlands.

4.1.2. Spatiotemporal Evolution Characteristics of Kernel Density

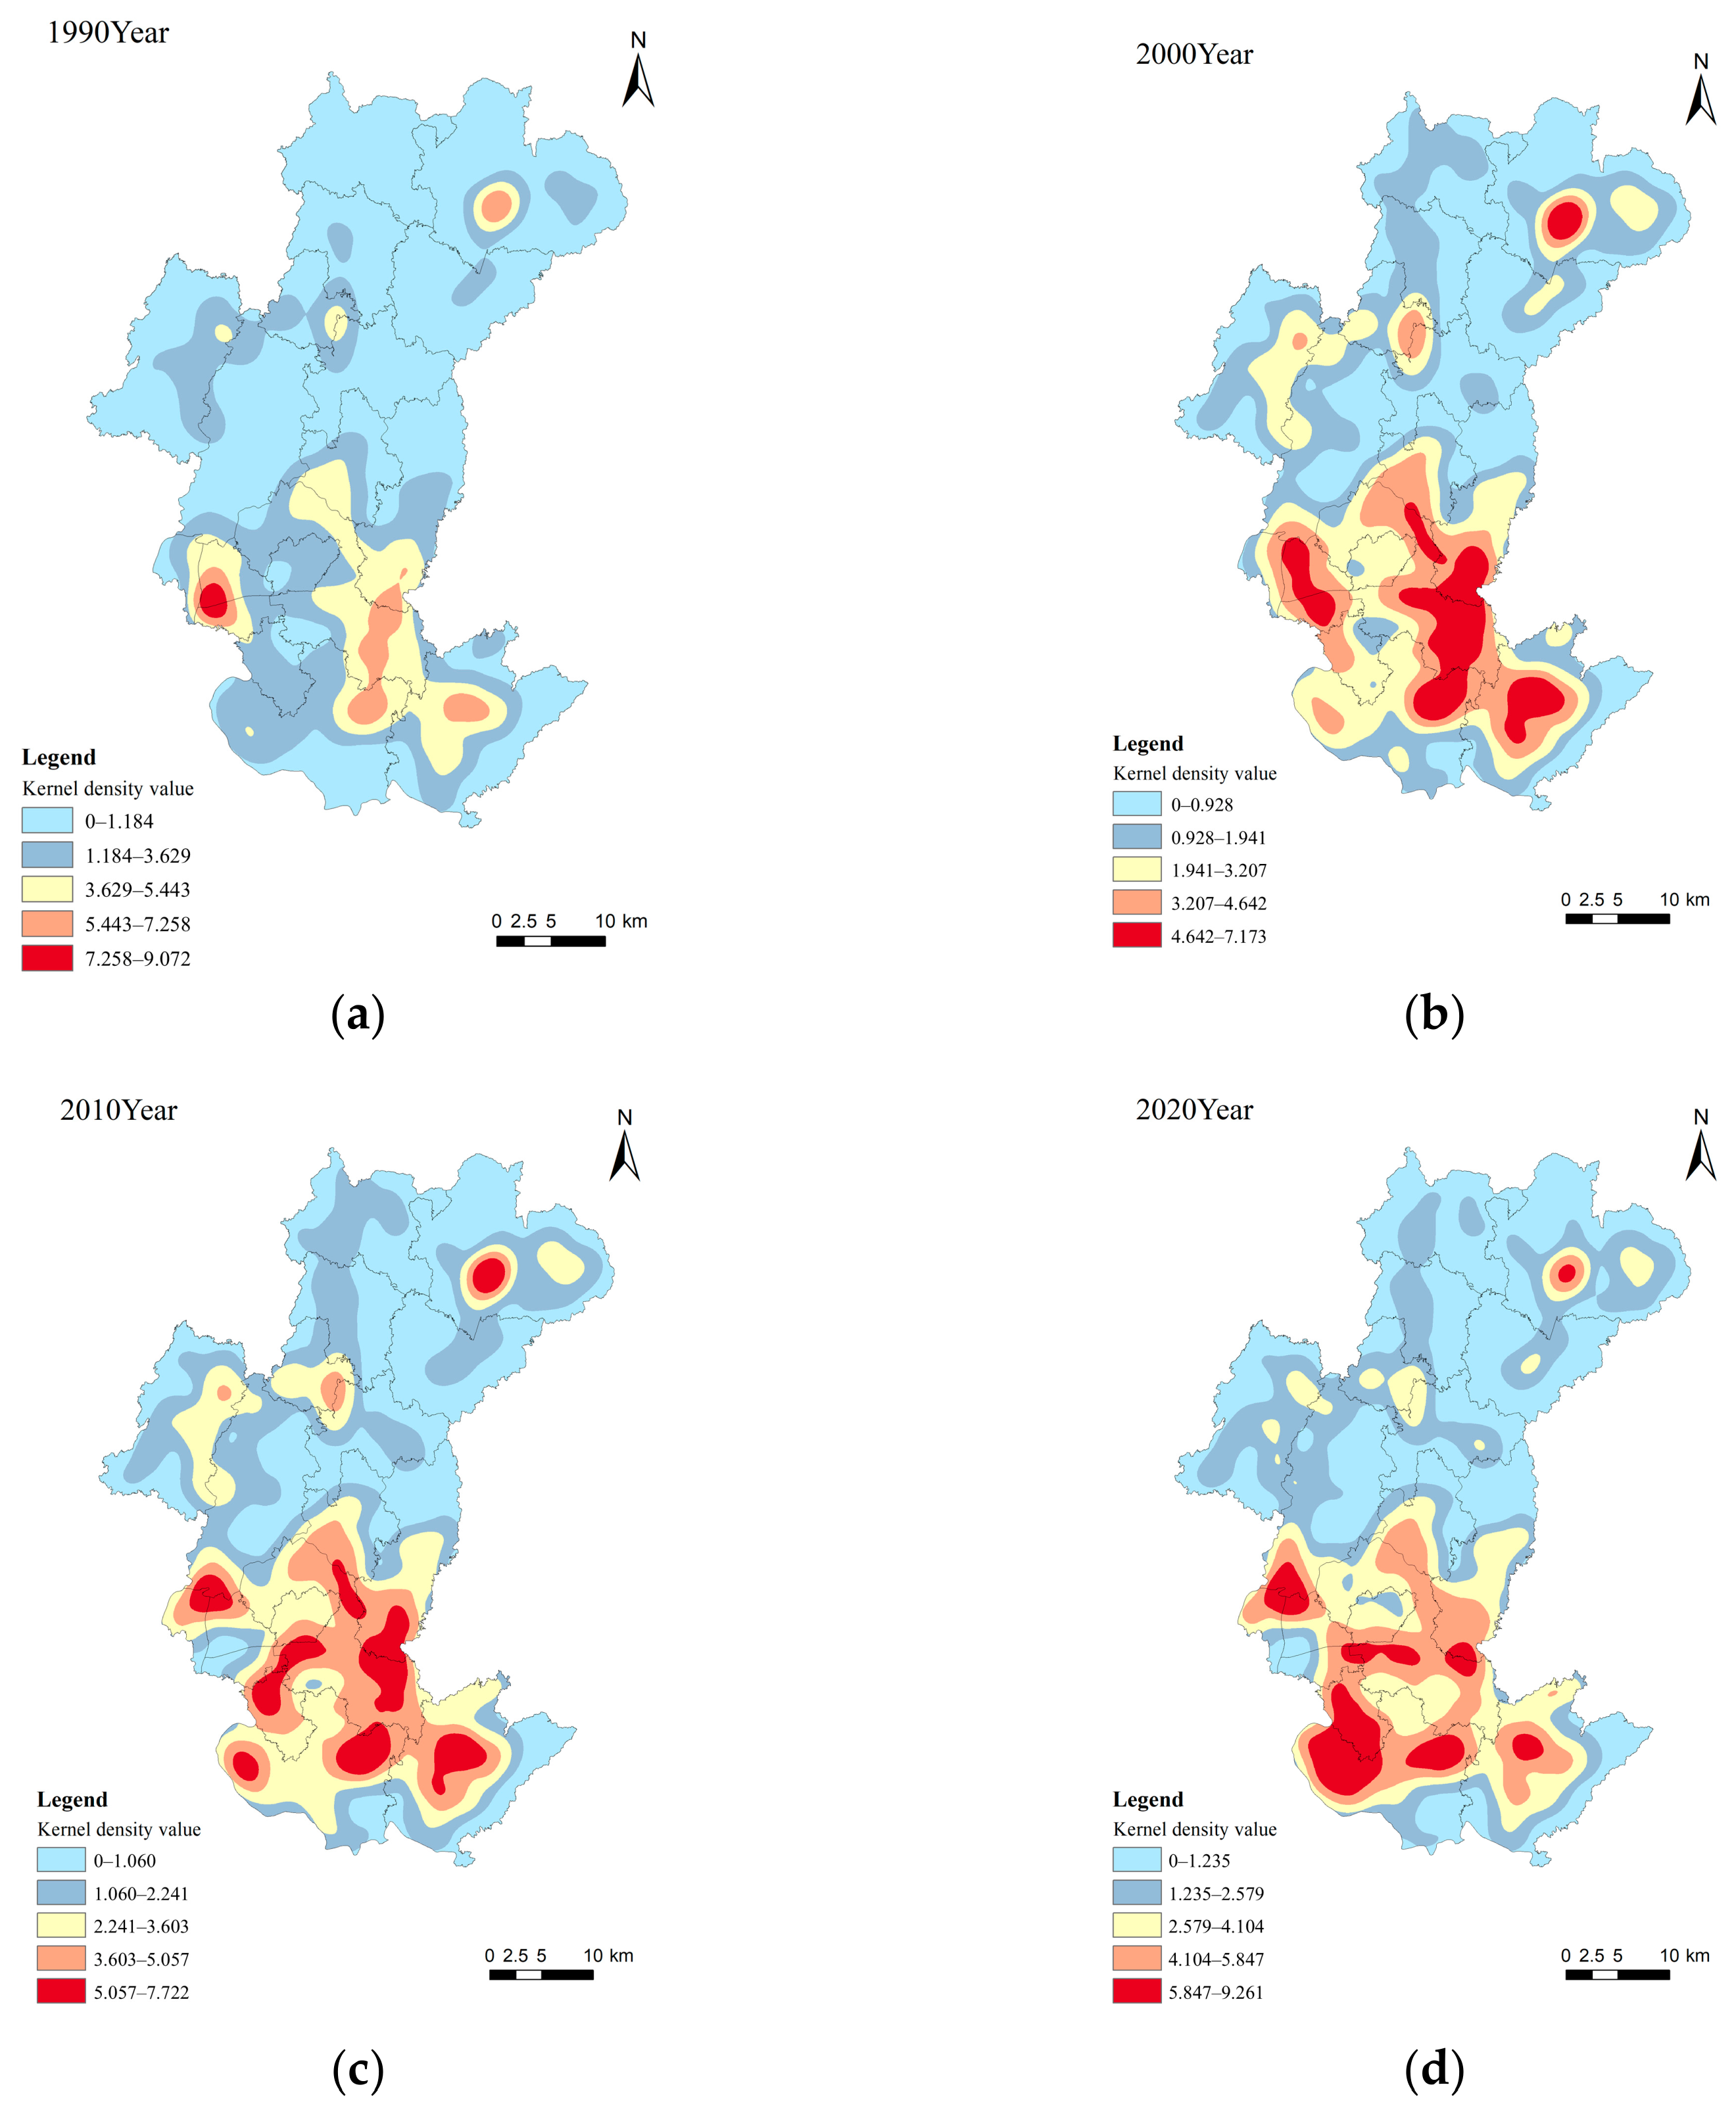
Based on the kernel density analysis results (Figure 4), rural settlements in Changsha County exhibited an overall multi-cluster distribution pattern from 1990 to 2020. The southern part of the county constituted a high-value kernel density agglomeration area, while several secondary core areas were distributed in the northwestern and northeastern regions. The high-value kernel density areas showed an evolutionary trend from a scattered multi-core pattern toward a concentric agglomeration pattern.
From the perspective of temporal change, the maximum kernel density value exhibited a fluctuating trend characterized by an initial decline followed by an increase, specifically decreasing from 9.07 patches/km2 in 1990 to 7.17 patches/km2 in 2000, and then increasing to 7.72 patches/km2 in 2010 and 9.26 patches/km2 in 2020. During 1990–2000, high-value areas in Xingsha Subdistrict, Quantang Subdistrict, and Langli Subdistrict contracted, while the focus of settlement expansion shifted toward Huanghua Town, Huangxing Town, and Jiangbei Town. During 2000–2010, the concentric agglomeration effect in the southern region intensified, and a new high-value area emerged in northwestern Huangxing Town, whereas Quantang Subdistrict and Xingsha Subdistrict transformed into low-value areas due to advancing urbanization. During 2010–2020, the high-density areas in Huangxing Town and Langli Subdistrict expanded significantly, and the overall density pattern gradually evolved into a concentric agglomeration structure concentrated in the southwestern part of the county.

4.1.3. Spatiotemporal Evolution Characteristics of Centroid Migration

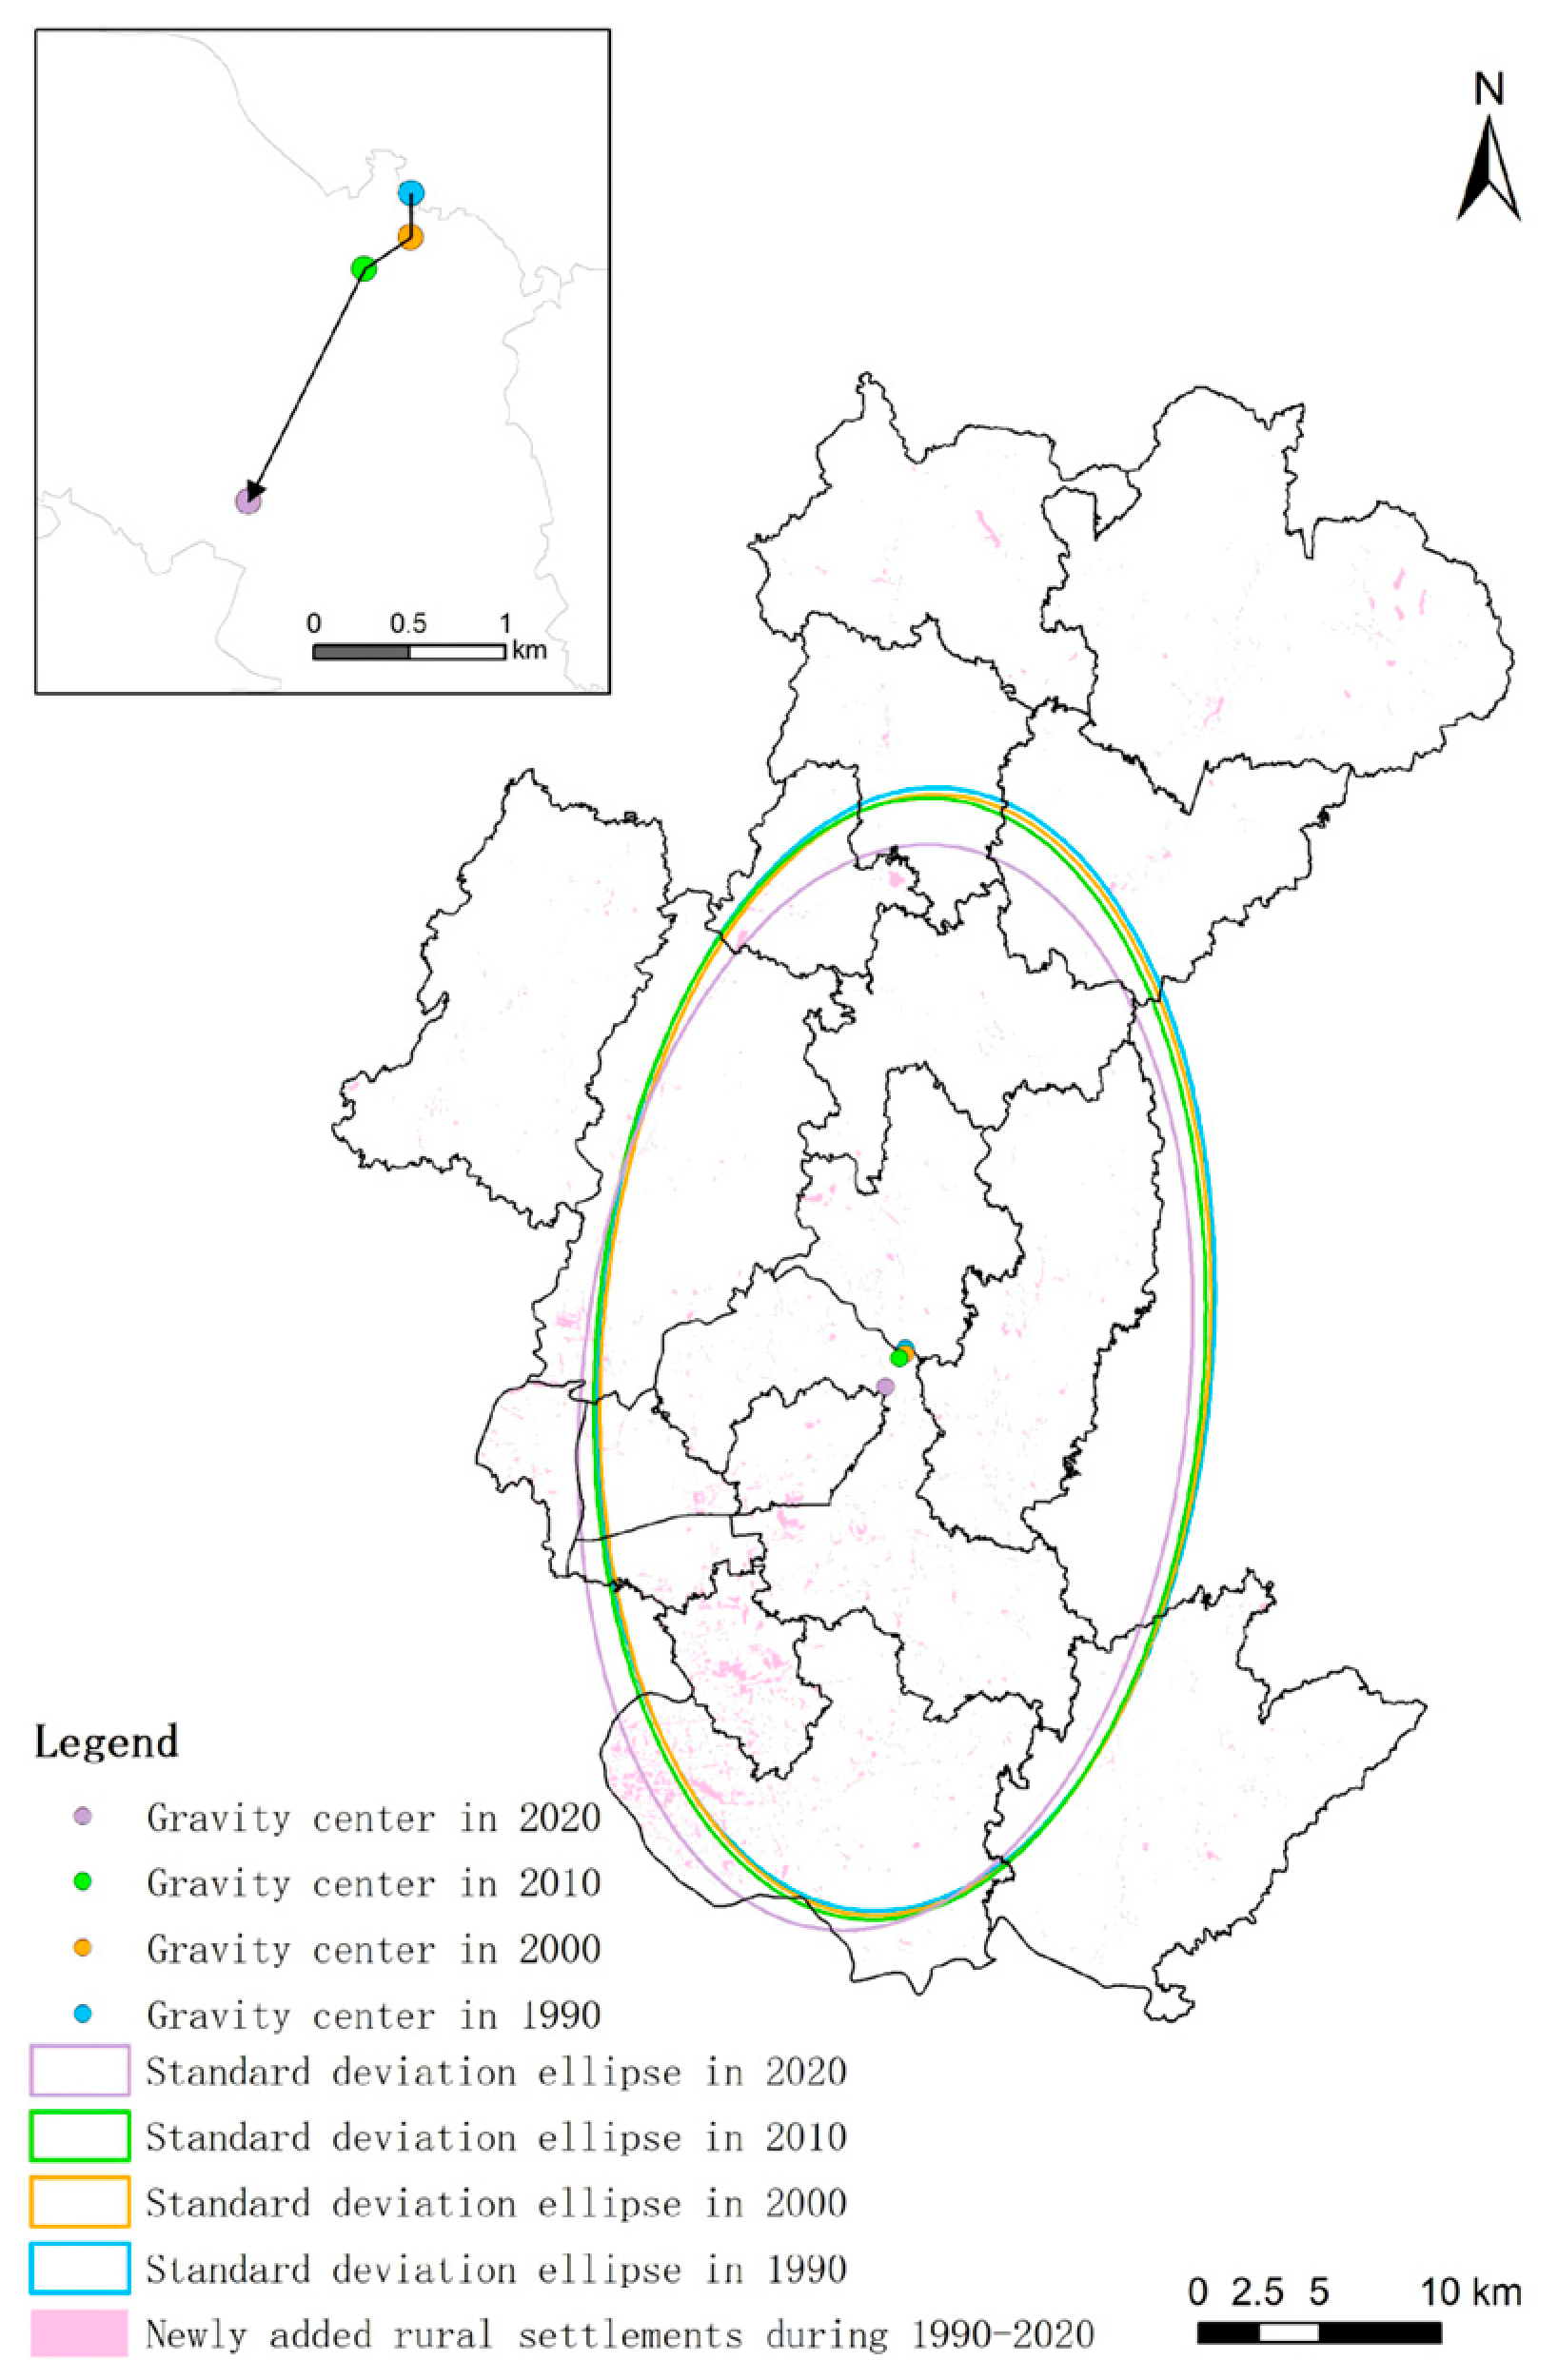
Based on the centroid migration analysis results (Figure 5), the centroid of rural settlements in Changsha County remained relatively stable overall from 1990 to 2020, exhibiting distinct stage-based migration characteristics. During the early stage (1990–2000), the centroid generally shifted southward under the influence of urban radiation effects and transportation conditions. During the middle stage (2000–2010), accompanied by the large-scale construction of economic development zones and industrial parks, rural settlements further agglomerated toward the southwest. During the later stage (2010–2020), driven jointly by the integration of the Changsha–Zhuzhou–Xiangtan urban agglomeration, township mergers, and land consolidation policies, the centroid accelerated its migration toward the southwest, while the trend of spatial agglomeration continued to intensify. This persistent southwestward migration trajectory directly reflects that the spatial development focus of rural settlements in Changsha County has been increasingly approaching the urban core area of Changsha City, with the “magnetic attraction effect” of the metropolitan core area playing an increasingly dominant role in county-level spatial restructuring.

4.2. Analysis of Influencing Factors on the Spatiotemporal Evolution of Rural Settlements in Changsha County

The spatiotemporal evolution of rural settlement patterns is jointly driven by natural environmental, locational, and socioeconomic factors. Among these, natural environmental factors constitute the fundamental baseline constraints for the formation and development of rural settlements. In this study, indicators such as elevation, slope, and average annual precipitation were selected. In addition, considering the characteristics of Changsha County as a major agricultural county, the Normalized Difference Vegetation Index (NDVI) was introduced to reflect the influence of agricultural production conditions on rural settlement distribution. Locational factors are also of critical importance, as rural settlements tend to be distributed near township governments, along transportation corridors, and adjacent to water systems and cultivated land. The proximity to these elements directly affects the convenience of transportation, access to public services, and agricultural activities, thereby profoundly influencing the spatial layout and evolutionary direction of rural settlements. Socioeconomic factors, particularly GDP per capita, population density, and the output value of secondary and tertiary industries per unit area, constitute the core endogenous driving forces underlying the spatial restructuring and functional transformation of rural settlements, and their influence on the spatiotemporal evolution of rural settlements has become increasingly significant.
In summary, to quantitatively reveal the influence mechanisms of different factors, this study takes administrative villages as the analytical units and rural residential land area as the dependent variable. Drawing upon previous research, as well as the actual conditions and data availability of Changsha County, 12 indicators were selected from the three dimensions mentioned above. The Optimal Parameters-based Geographical Detector (OPGD) and the Geographically Weighted Random Forest (GWRF) model were employed to investigate the influencing factors and driving mechanisms underlying the spatial differentiation of rural settlements.

4.2.1. Analysis of Driving Factors Based on the OPGD Model

Before applying the OPGD model, all 12 candidate explanatory variables were first examined using multicollinearity and significance diagnostics. Considering that this study is an exploratory spatial analysis and that stricter criteria such as VIF < 5 and p < 0.05 would make it difficult to retain a theoretically meaningful representative variable from the natural-environment dimension, we followed previous studies and used VIF > 7.5 and p > 0.10 as the screening thresholds [52,53]. The initial diagnostic results of the 12 candidate variables are shown in Table 3.
Based on the initial diagnostics, variables with weak statistical significance were first removed, and variables with severe multicollinearity were further assessed according to their collinearity relationships and theoretical relevance. In particular, both population density and GDP per capita showed high VIF values in the initial diagnostics, indicating strong collinearity between them. Since population density showed weak statistical significance, whereas GDP per capita met the p < 0.10 threshold and better represented local socioeconomic development, population density was removed, while GDP per capita was temporarily retained and re-tested with the remaining variables. After re-diagnosis, six variables were retained for subsequent analysis: NDVI, distance to major roads, distance to cultivated land, GDP per capita, living facility adequacy, and the output value of secondary and tertiary industries per unit area.
As shown in Table 4, the VIF values of all retained variables were below 3, indicating an acceptable level of multicollinearity in the final variable set. Among the retained variables, NDVI, distance to major roads, distance to cultivated land, and the output value of secondary and tertiary industries per unit area were significant at the 0.05 level, while GDP per capita and living facility adequacy were significant at the 0.10 level.
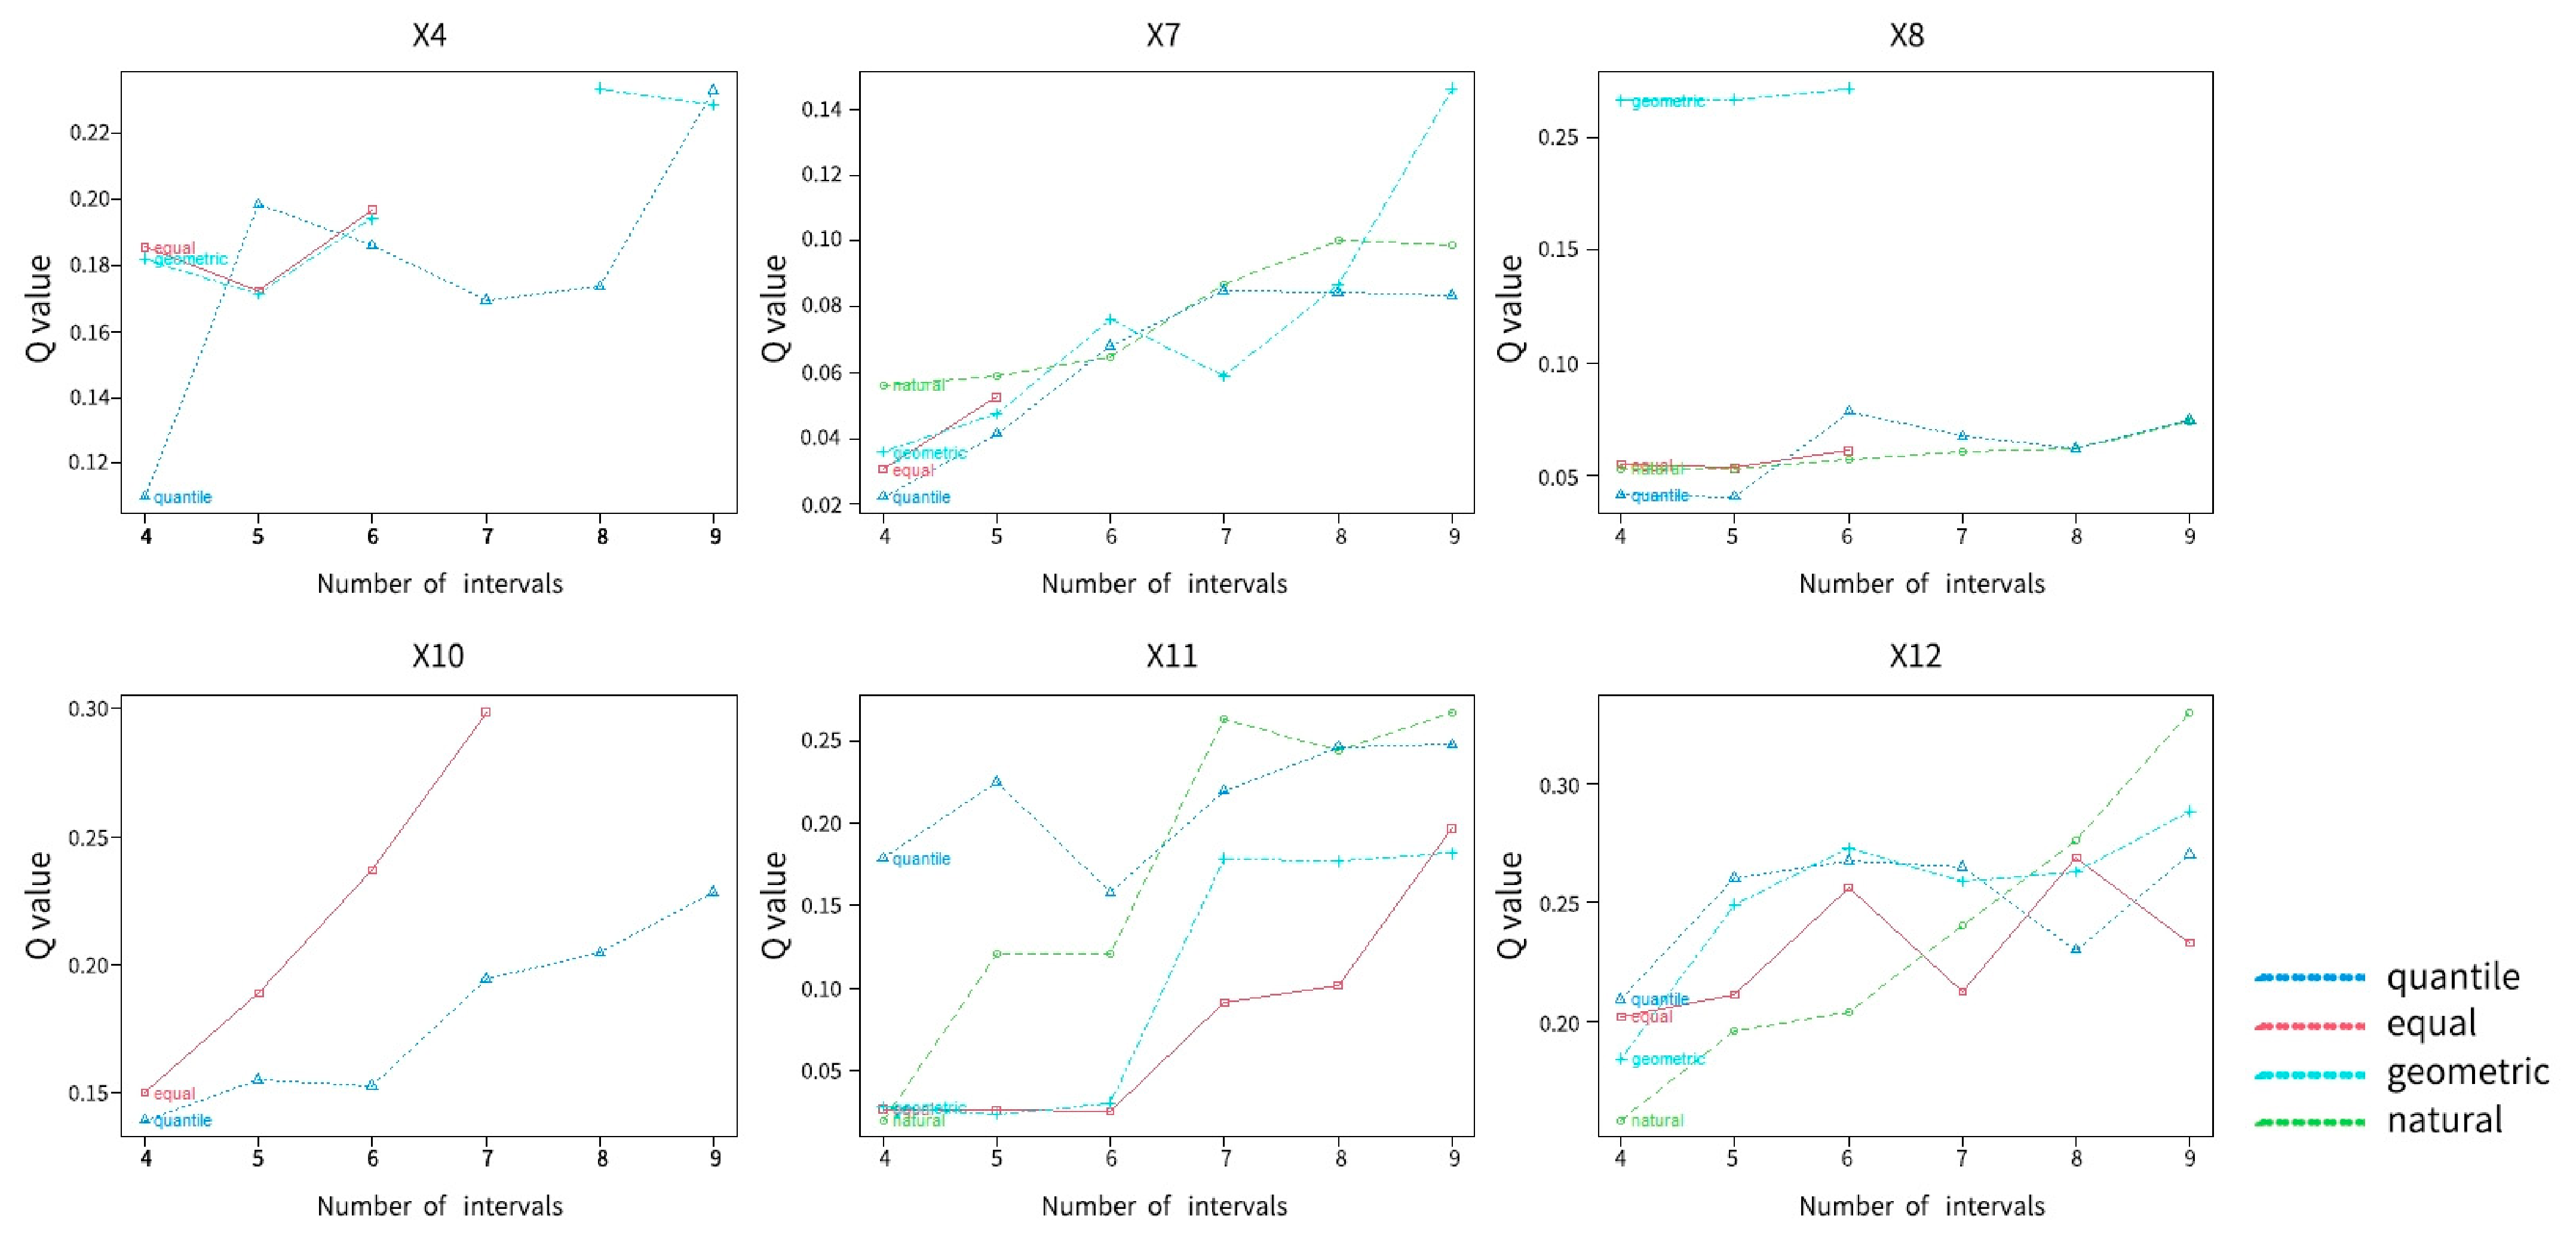
On this basis, the OPGD model was employed to discretize the retained explanatory variables and identify their explanatory power for the spatial differentiation of rural settlement scale in 2020. Specifically, four discretization methods, namely natural breaks, geometric intervals, equal intervals, and quantiles, were compared within classification intervals ranging from 5 to 10 categories. According to the principle of maximizing the q-statistic for each factor, the optimal discretization method and the corresponding number of categories were determined individually (Figure 6), thereby constructing the optimal parameter combination for the Geographical Detector analysis.
  • Factor Detection
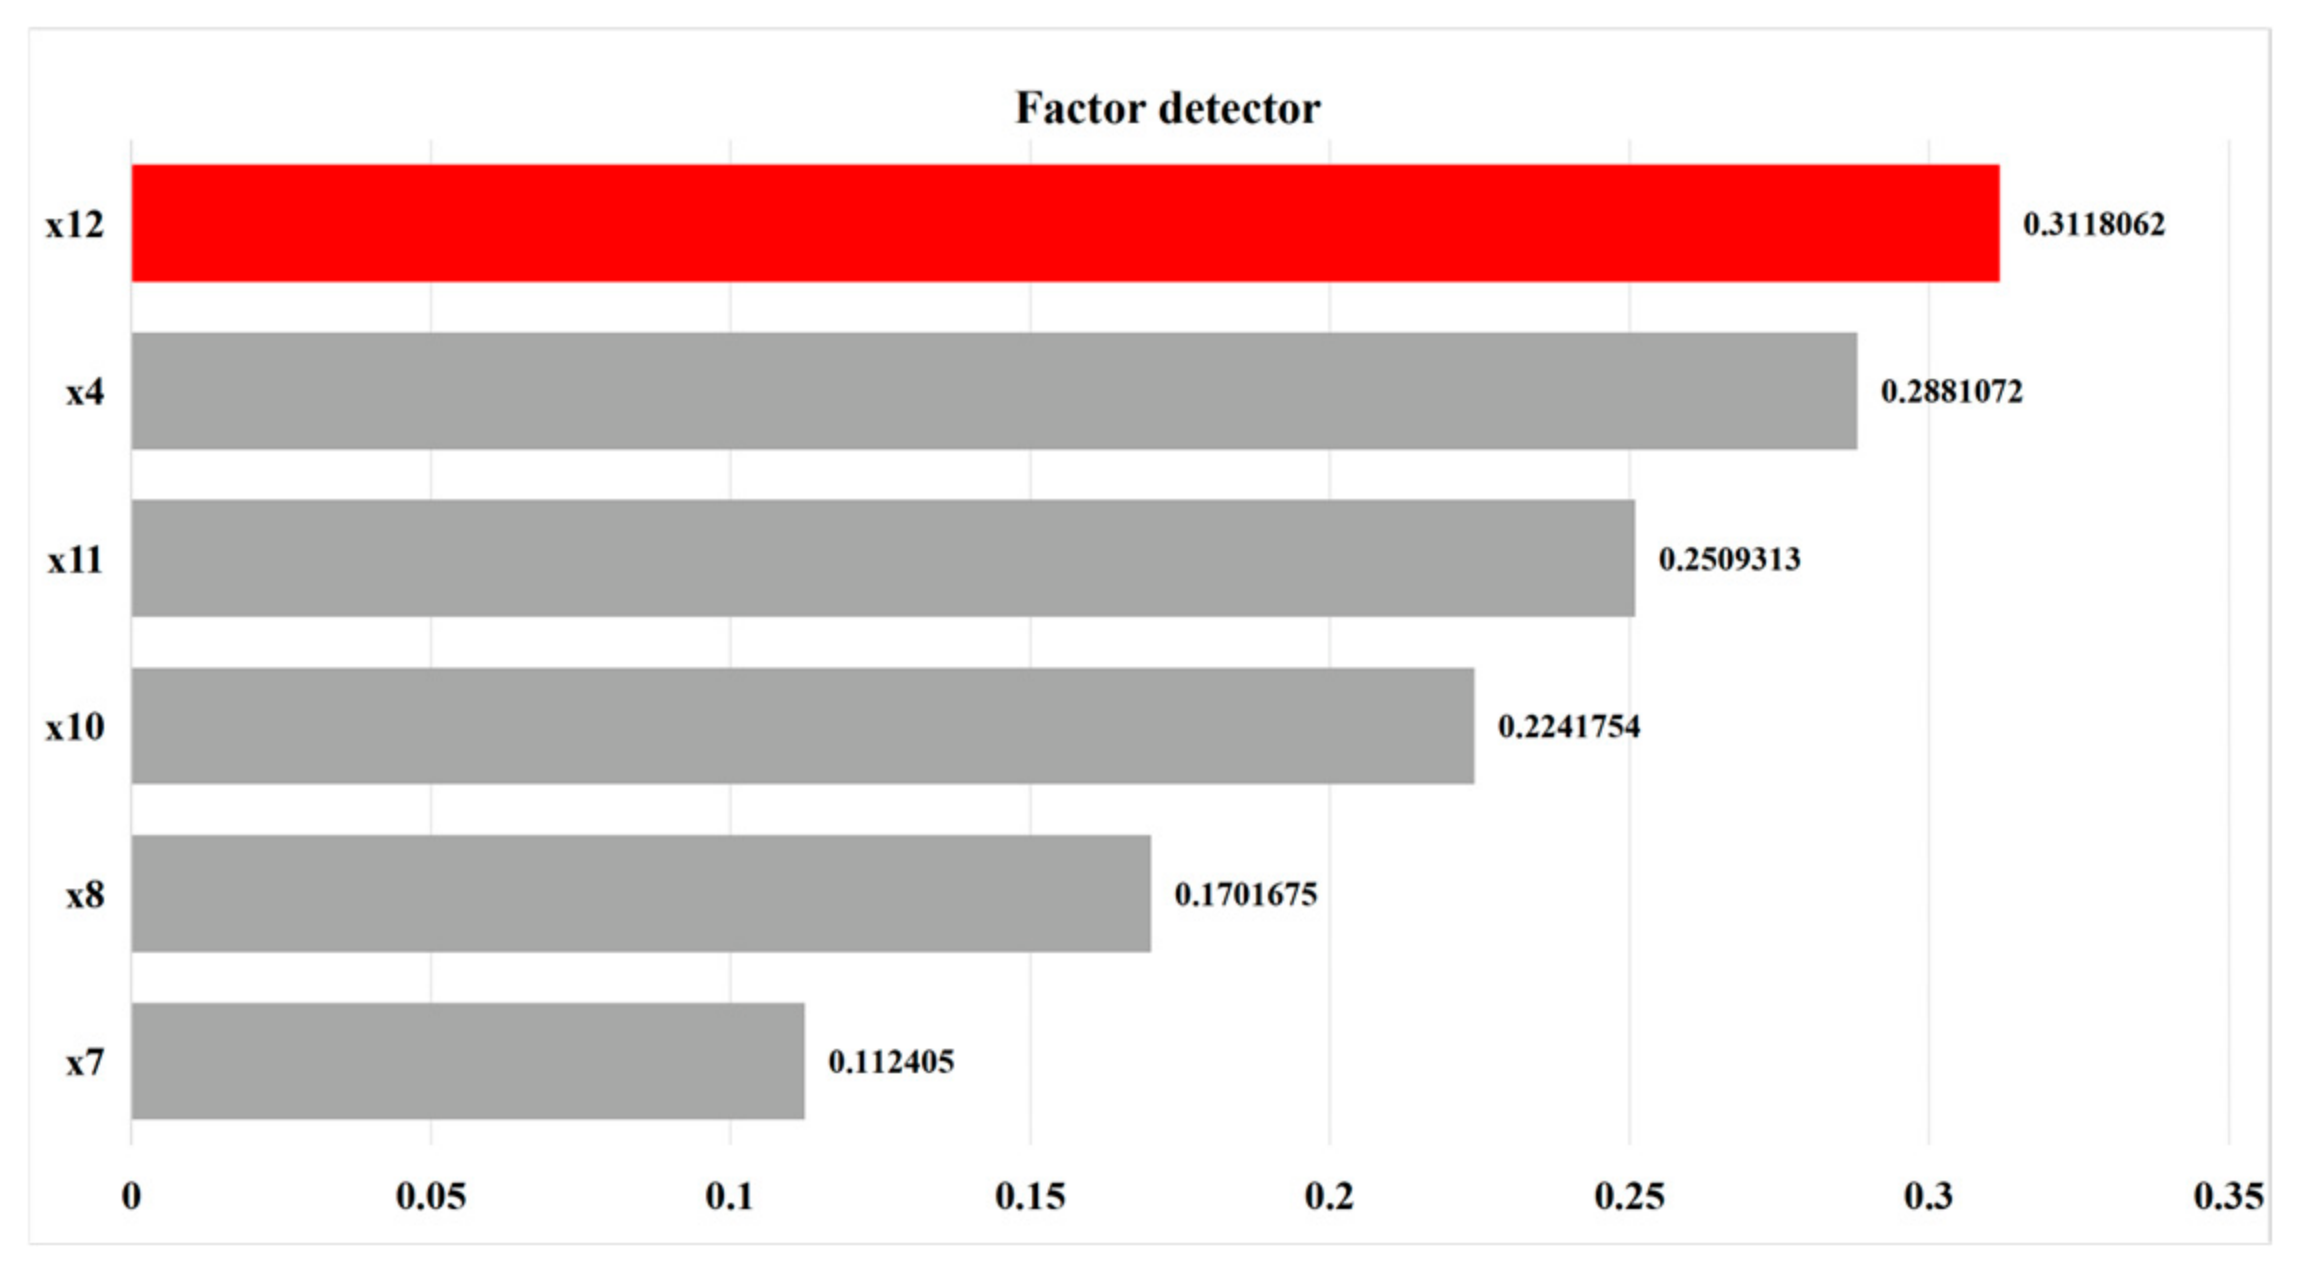
Six driving factors that passed the statistical tests were selected for factor detection (Figure 7). The explanatory power (q-statistic) of each factor, ranked from highest to lowest, was as follows: output value of secondary and tertiary industries per unit area (X12, 0.312) > NDVI (X4, 0.288) > living facility adequacy (X11, 0.251) > GDP per capita (X10, 0.224) > distance to cultivated land (X8, 0.170) > distance to major roads (X7, 0.112).
The results indicate that socioeconomic factors showed stronger explanatory power for the spatial differentiation of rural settlement scale in 2020 than natural environmental and locational factors overall. The output value of secondary and tertiary industries per unit area had the highest q-statistic, while living facility adequacy and GDP per capita also showed relatively high explanatory power, suggesting that industrial development, service provision, and local economic conditions were closely associated with the spatial differentiation of rural settlement scale. Among the natural environmental factors, NDVI ranked second in terms of overall explanatory power, indicating that vegetation-cover conditions and the ecological–agricultural landscape pattern were closely related to the spatial pattern of rural settlements in Changsha County. In contrast, the explanatory power of locational factors was relatively weak overall. At the global level, distance to cultivated land showed stronger explanatory power than distance to major roads, suggesting that cultivated-land accessibility remained an important locational condition for rural settlements. However, this global result reflects the average explanatory power at the county scale, while the local contribution of cultivated-land accessibility varies across different types of village-level units, as further revealed by the GWRF-SHAP results in Section 4.2.2.
2.
Interaction Detection
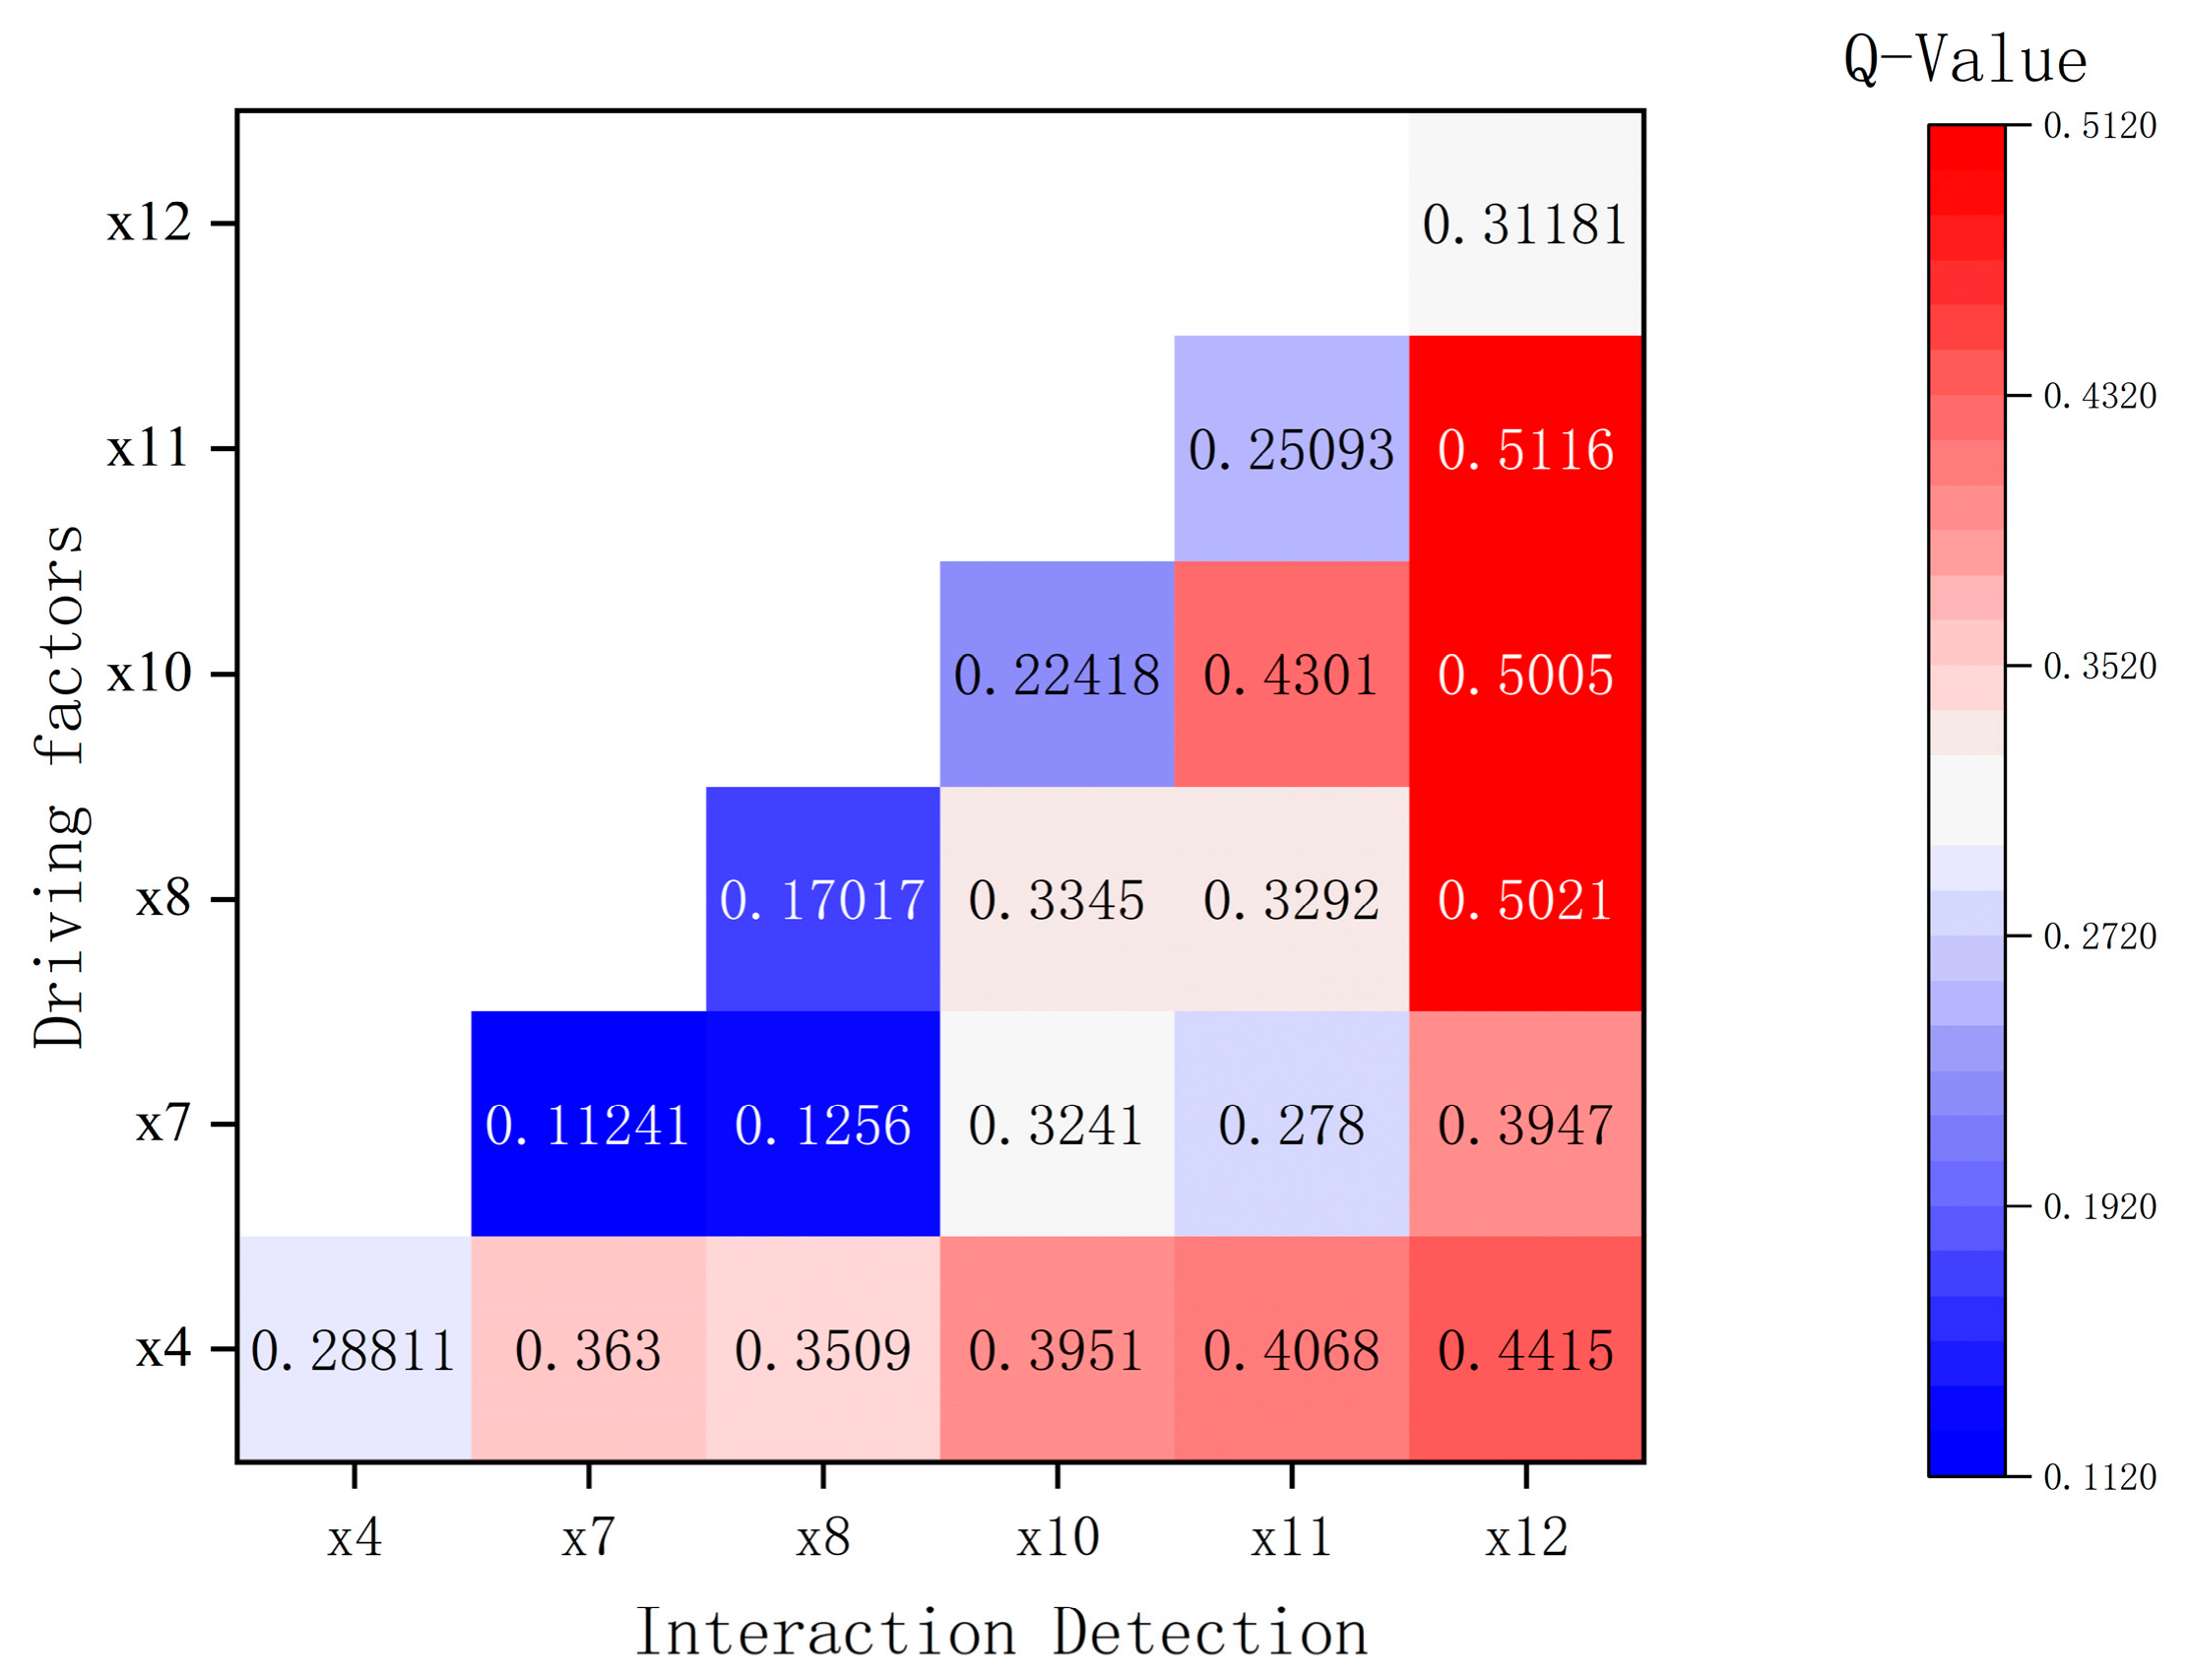
According to the interaction detection results (Figure 8), the coupling effects between socioeconomic factors and various natural environmental and locational factors were highly significant, reflecting the complex characteristics of rural settlement distribution driven by the synergistic effects of multiple factors.
Among the various interaction combinations, the interaction between NDVI and the output value of secondary and tertiary industries per unit area exhibited the strongest explanatory power (X4 ∩ X12, q = 0.512), indicating that when favorable agricultural baseline conditions spatially overlap with large-scale secondary and tertiary industries developed on the basis of agricultural resources, the two jointly constitute the strongest compound driving force shaping rural settlement patterns. The interaction between the output value of secondary and tertiary industries per unit area and distance to cultivated land was also highly significant (X12 ∩ X8, q = 0.502), suggesting that the combined effects of industrial non-agriculturalization and spatial non-agriculturalization represent another core compound driving force underlying the differentiation of rural settlement scale. In addition, the interaction between NDVI and living facility adequacy (X4 ∩ X11, q = 0.442), as well as that between NDVI and GDP per capita (X4 ∩ X10, q = 0.407), also reached relatively high levels, jointly reflecting the significant synergistic mechanisms between natural baseline conditions, public service provision, and economic development level.

4.2.2. Spatial Heterogeneity Analysis of Influencing Factors Based on the GWRF Model

To identify the optimal model, this study sequentially employed the OLS, GWR, MGWR, and GWRF models to conduct regression analyses on the influencing factors of the spatial distribution of rural settlements in Changsha County, with the aim of selecting the optimal regression model to reveal their mechanisms at the global, local, and multiscale levels.
The model comparison results are shown in Table 5. The GWRF model achieved the highest R2 value (0.739). However, because adjusted R2 and AICc are mainly applicable to OLS, GWR, and MGWR, this study further introduced MAE and RMSE as common prediction-error metrics for all four models to ensure a more comparable evaluation. The results show that GWRF produced the lowest prediction errors, with an MAE of 0.277 and an RMSE of 0.510. Compared with MGWR, the best-performing geographically weighted linear model, GWRF reduced MAE by 37.3% and RMSE by 22.3%. These results indicate that GWRF had better predictive accuracy and was more suitable for capturing nonlinear relationships and spatial heterogeneity in the spatial differentiation of rural settlement scale in 2020.
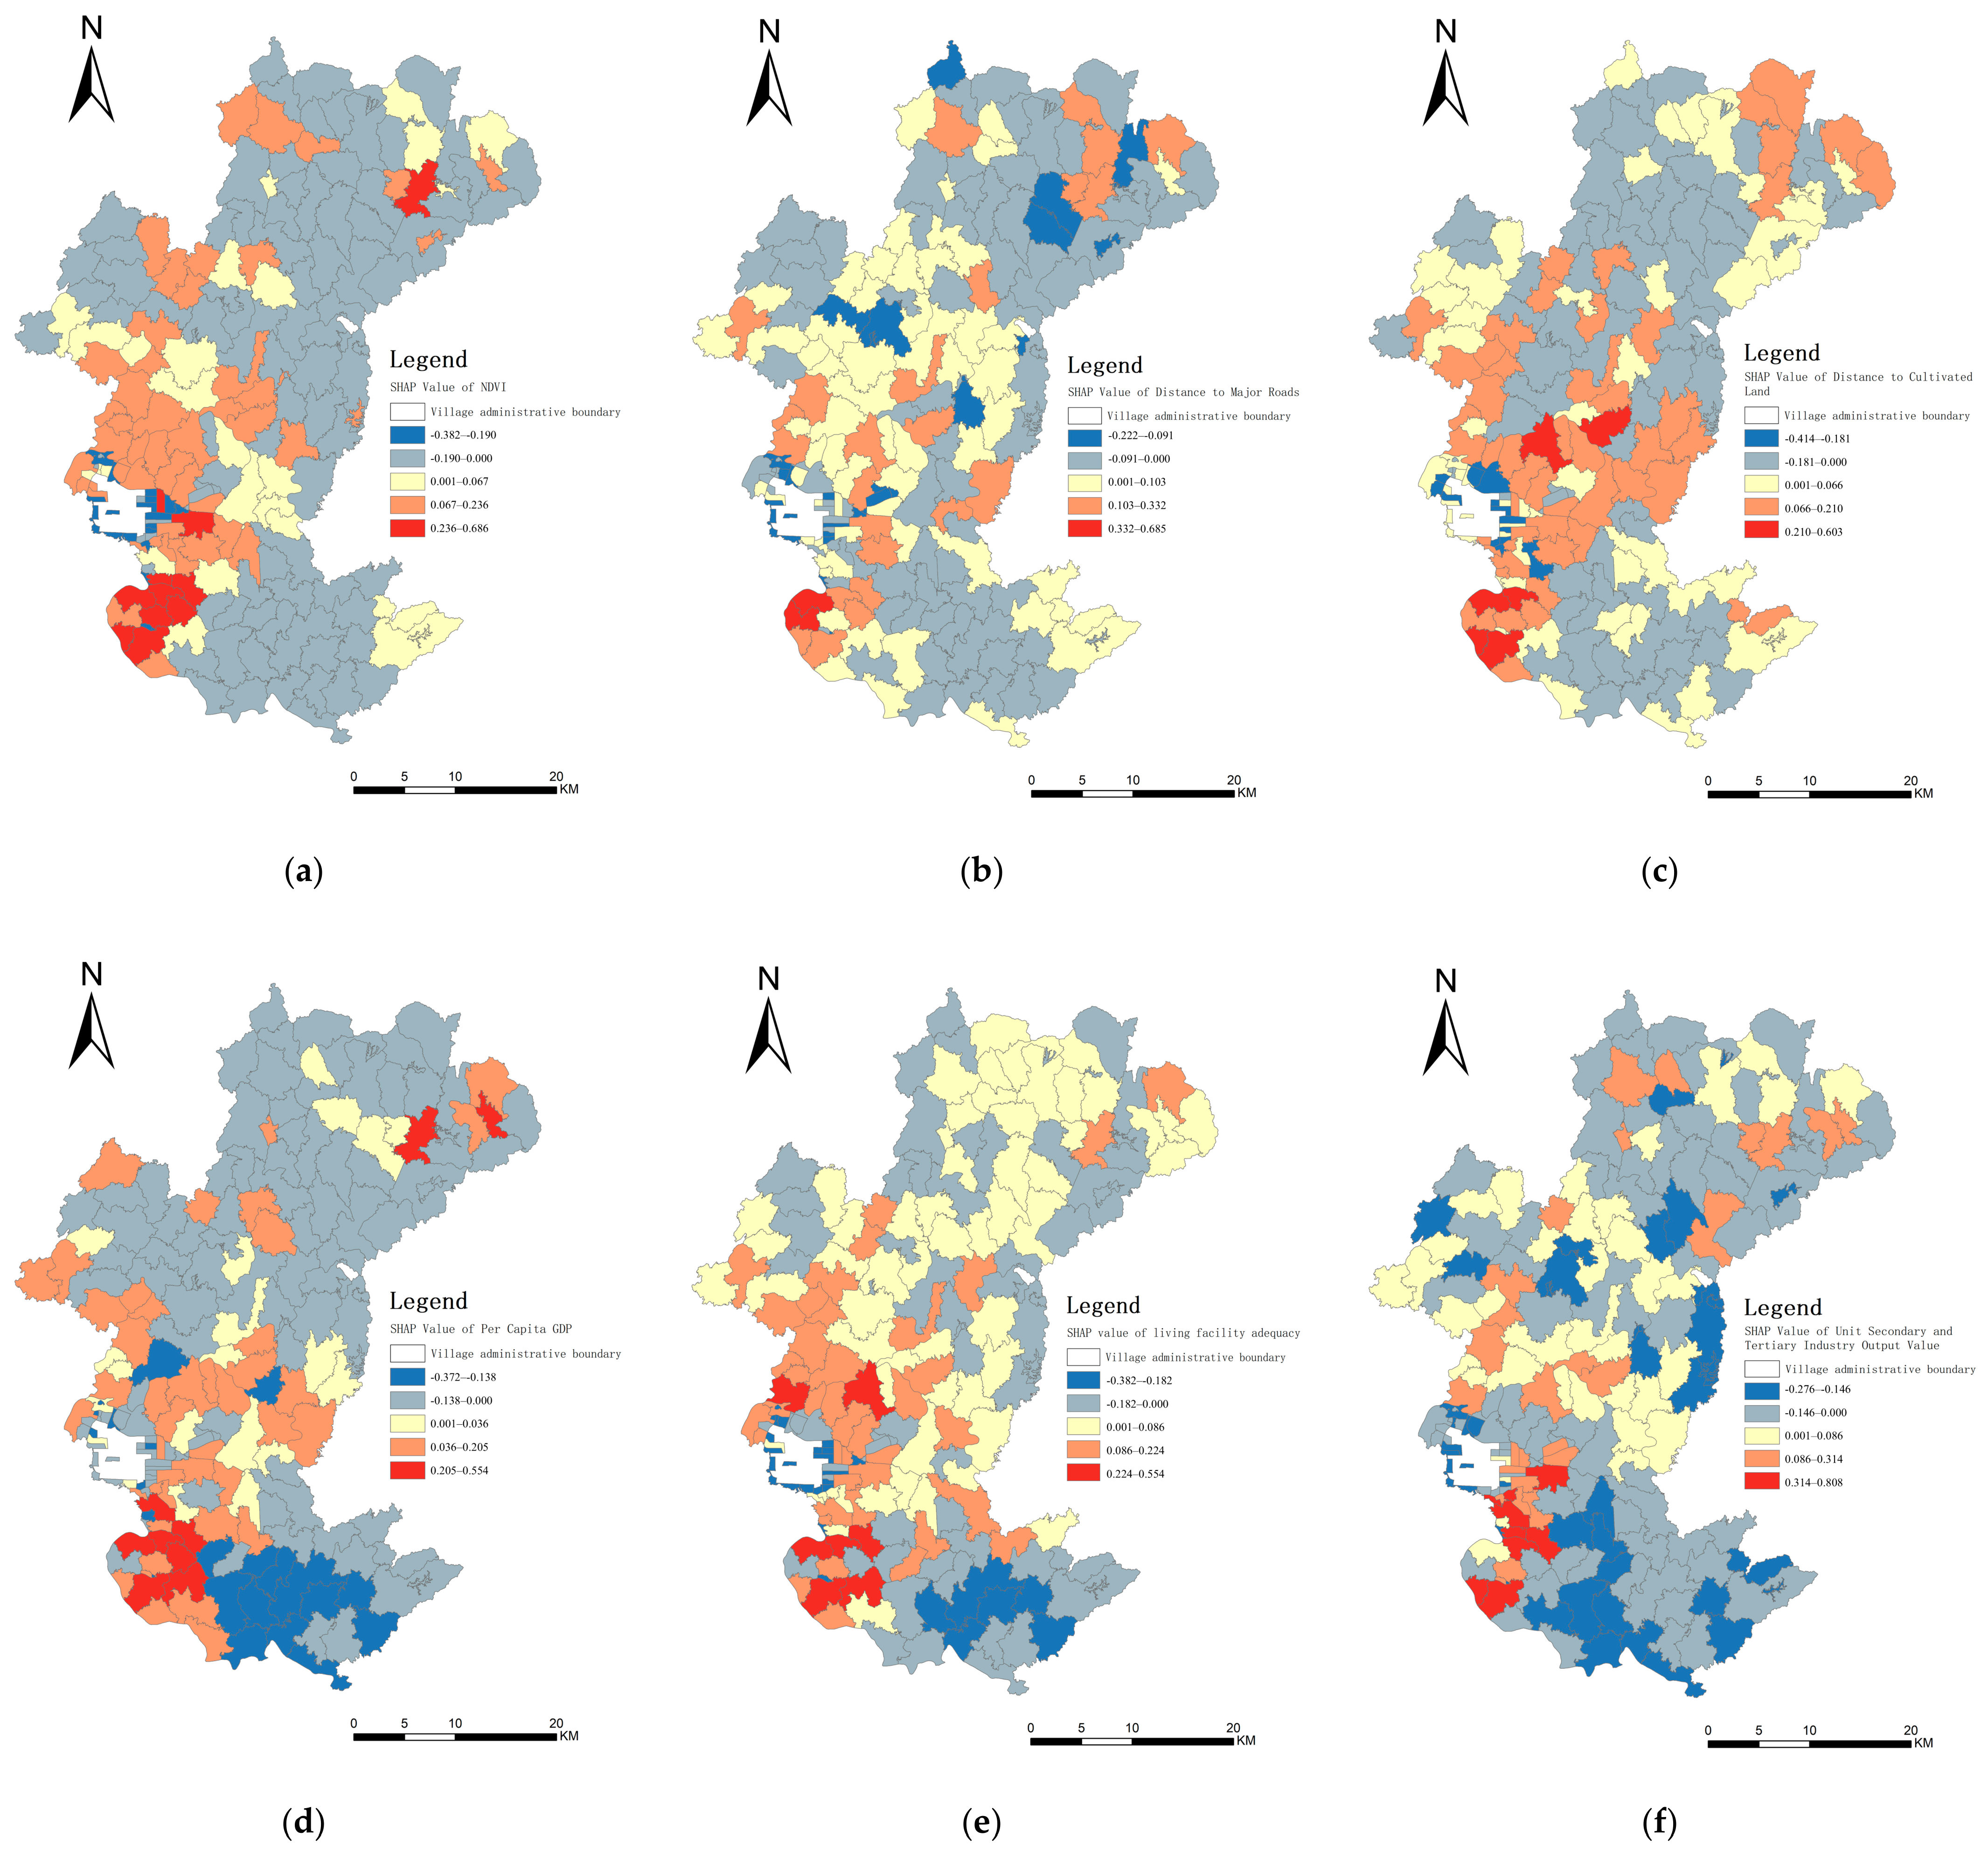
On this basis, localized modeling was conducted using the Geographically Weighted Random Forest (GWRF) model, and SHAP values (Shapley Additive Explanations) were introduced to perform attribution analysis for each administrative village individually. SHAP values reflect the marginal contribution of each factor to the model prediction results (Figure 9), where positive values indicate that the factor tends to promote the expansion of rural settlement scale, whereas negative values indicate an inhibitory effect.
  • Spatial Heterogeneity Analysis of Natural Environmental Factors
The Normalized Difference Vegetation Index (NDVI, X4) is an important indicator for characterizing village-level vegetation coverage and the ecological–agricultural landscape pattern in Changsha County. Its mean SHAP value was slightly negative, indicating a weak negative association between higher vegetation coverage and the spatial differentiation of rural settlement scale at the county level. This reflects the baseline constraining role of natural environmental conditions in rural settlement distribution. Meanwhile, NDVI exhibited pronounced spatial heterogeneity: 42.56% of the village-level units showed positive contributions, whereas 57.44% showed negative contributions. Among them, high-value areas with positive effects were mainly concentrated in the hilly plain regions of the central and southern parts of the county, including Huangxing Town, Huanghua Town, and Ansha Town. Under the functional zoning pattern of “industry in the south and agriculture in the north” in Changsha County, although these areas primarily function as industrial and urban zones, the contiguous high-quality cultivated land constitutes the production foundation of suburban agriculture. Rural settlements therefore possess dual attributes of agricultural residence and industrial support, resulting in a positive relationship in which “higher NDVI corresponds to larger settlement scale.” Negative effects were mainly distributed in two types of regions. The first included northern hilly and mountainous areas such as Jinjing Town and Beishan Town, where extensive forest land associated with high NDVI values is constrained by terrain slope and difficult to convert into construction space, thereby constituting baseline constraints on rural settlement expansion. The second included urbanization core areas such as Xingsha Subdistrict, where large areas of cultivated land have been occupied, vegetation coverage has declined, and traditional agricultural production functions have weakened, resulting in the shrinkage of rural settlement scale and forming a chain effect of “urbanization advancement–agricultural baseline degradation–settlement contraction”. This reflects a land-use transition process in which urban expansion, the weakening of agricultural landscape functions, and the contraction of rural settlement space occur simultaneously.
2.
Spatial Heterogeneity Analysis of Locational Factors
Distance to major roads (X7) showed a slightly positive overall contribution to rural settlements, indicating that transportation accessibility was generally weakly associated with rural settlement scale at the county level and played a stronger role only in specific locations. Its spatial differentiation exhibited a distinct “threshold effect”: positive contributions were mainly concentrated in villages along national, provincial, and county roads, particularly Guangda Community and Gansheng Village in Huangxing Town. In these areas, transport hubs and high-level road networks strengthened the connections between villages, industrial nodes, urban functional areas, and public service centers, making road accessibility more strongly associated with rural settlement scale. In most remote hilly areas and ordinary agricultural villages, although the association was generally negative, the absolute SHAP values were below 0.10, indicating that road distance had no obvious effect on settlement-scale differentiation in most rural villages. The strongest negative contributions were mainly distributed in highly urbanized areas such as Xingsha and Quantang. This pattern does not indicate an extreme intensification of distance constraints; rather, it reflects the functional shift of roads from “serving rural areas” to “supporting urban functions,” where high accessibility is more closely related to urban construction, industrial organization, and the functional replacement of rural settlement space.
Distance to cultivated land (X8) was one of the locational factors with relatively high overall contribution. Its mean SHAP value showed a clear positive contribution among the six retained factors, indicating that cultivated-land accessibility remained closely associated with the spatial differentiation of rural settlement scale at the county level. This result is consistent with the global finding from the geographical detector model that distance to cultivated land had stronger explanatory power than distance to major roads. However, this relationship should not be understood as spatially uniform across all village-level units and should be interpreted together with the local heterogeneity revealed by the GWRF-SHAP results. Specifically, 55.9% of the villages showed positive contributions, with high-value positive areas widely distributed in traditional farming areas in the central and southern parts of the county, such as Guoyuan Town, Chunhua Town, and Lukou Town. This pattern reflects a production-oriented spatial relationship characterized by “living adjacent to cultivated land,” indicating that farming convenience remains an important locational condition for rural settlement distribution in traditional agricultural areas. In contrast, 44.1% of the villages showed negative contributions, with high-value negative areas concentrated in urbanization core areas such as Xingsha and Quantang Subdistricts. In these areas, urban construction and industrial functions have increasingly reshaped rural space, and the locational logic of rural settlements has gradually shifted from proximity to agricultural production toward closer linkages with urban functions and construction space.
3.
Spatial Heterogeneity Analysis of Socioeconomic Factors
GDP per capita (X10) reflects the economic development level of village-level units. Its mean SHAP value was slightly positive, but the proportion of villages with positive contributions was relatively low, indicating that the effect of economic growth on rural settlement scale was not universal but spatially selective. Positive contributions were mainly concentrated in economically stronger suburban villages and characteristic industrial clusters in the southwest, such as Huangxing New Village in Huangxing Town. In contrast, some agriculture-oriented villages and villages located at the periphery of industrial corridors mostly showed weak negative contributions, suggesting that higher income levels do not necessarily translate into local housing demand or settlement-scale growth.
Living facility adequacy (X11) reflects the provision of public and commercial service facilities at the village level. Its mean SHAP value was slightly positive, but the relatively large standard deviation indicates clear spatial variation in both the direction and intensity of its contribution. High-value positive contributions were mainly concentrated in suburban industrial corridors, including Huangxing Town, Huanghua Town, and Langli Subdistrict, suggesting that educational, medical, and commercial facilities are more clearly associated with larger rural settlement scale when coupled with industrial development and suburban locational advantages. Negative contributions were mainly distributed in the junction area between eastern Huangxing Town and western Jiangbei Town. Although these areas have a certain level of facility provision, their service hierarchy and industrial support remain relatively limited, making it difficult to form a stable capacity for local population agglomeration. Compared with the output value of secondary and tertiary industries per unit area, the explanatory role of living facility adequacy is more localized and conditional.
In the OPGD analysis, the output value of secondary and tertiary industries per unit area (X12) showed the strongest explanatory power among the six retained factors. It had an overall positive SHAP contribution, and its standard deviation ranked highest among the six retained factors, indicating a pronounced spatial polarization in its contribution to the spatial differentiation of rural settlement scale. Positive contributions were concentrated in the industrial corridor across the central part of the county, extending from west to east and covering suburban towns adjacent to the urban core area of Changsha, such as Huangxing Town, Huanghua Town, and Langli Subdistrict, as well as transitional areas undertaking industrial spillover, including Chunhua Town and Lukou Town. These areas have relatively strong non-agricultural industrial foundations, and industrial and service-sector development has strengthened the links among residential demand, public service provision, and rural spatial restructuring, thereby providing important socioeconomic support for the differentiation of rural settlement scale. In the south, represented by Jiangbei Town and peripheral villages surrounding Huangxing Town, the capacity to absorb industrial spillovers remains relatively limited despite proximity to industrial core areas; therefore, the positive contribution of industrial support to rural settlement scale is constrained. The northern areas are mainly composed of remote agricultural towns such as Jinjing Town, Kaihui Town, and Fulin Town, where the development of non-agricultural industries remains limited and rural settlement expansion lacks industrial support. Overall, the output value of secondary and tertiary industries per unit area exhibited a spatially polarized pattern characterized by positive agglomeration in the central industrial corridor and insufficient contributions in the northern and southern peripheral areas. This pattern highlights the key role of non-agricultural industrialization in shaping the spatial differentiation of rural settlements in metropolitan hinterlands, as well as its spatially uneven effects.

5. Discussion

5.1. Rural Settlement Transition in Metropolitan Hinterlands: Human–Land Mismatch and a Compound Driving Pattern

The results indicate that rural settlement evolution in Changsha County exhibited a pronounced mismatch between population change and land use. From 1990 to 2020, rural settlement land continued to expand, whereas the rural population declined substantially during the same period, forming a typical pattern of “population decrease but land expansion.” This mismatch indicates a clear asynchrony between rural settlement land expansion and rural population change, reflecting the practical pressure on rural construction-land-use efficiency and spatial governance in metropolitan hinterlands under rapid urbanization. Similar patterns have also been observed in county-level areas surrounding major Chinese metropolises such as Beijing, Shanghai, and Guangzhou, suggesting that the coexistence of rural population decline and rural construction land expansion has become a common issue in the spatial transformation of metropolitan hinterlands.
The centroid of rural settlements continuously migrated southwestward, further indicating that the spatial focus of rural settlements in Changsha County has gradually shifted toward the main urban area of Changsha and its suburban industrial corridors. This pattern is consistent with the overall direction of county-level urbanization, industrial spatial agglomeration, and strengthened transport connections, highlighting the important influence of the metropolitan core and its suburban functional spaces on the organization of rural space in the hinterland. From the perspective of land-use transition theory, rural settlements in Changsha County no longer represent the simple expansion of agriculture-oriented residential space but have gradually evolved into a more complex spatial system shaped by urban–rural factor flows, industrial linkages, and changes in rural residential functions.
The long-term land-use data and the 2020 village-level cross-sectional model reveal the spatial transformation of rural settlements in Changsha County from two complementary perspectives: process identification and pattern explanation. The former characterizes the expansion, agglomeration, and centroid migration of rural settlements from 1990 to 2020, while the latter further explains the influencing factors associated with the spatial differentiation of rural settlement scale in 2020. The OPGD and GWRF-SHAP results show that the spatial differentiation of rural settlement scale is closely associated with natural environmental constraints, locational accessibility, and socioeconomic restructuring. Among these dimensions, socioeconomic factors, especially the output value of secondary and tertiary industries per unit area, showed stronger explanatory power, whereas vegetation-cover conditions, cultivated-land accessibility, and road accessibility exhibited more evident spatial heterogeneity. Overall, the spatial differentiation of rural settlement scale in Changsha County presents a compound driving pattern of “natural baseline constraints–locational guidance–socioeconomic dominance.

5.2. Spatial Differentiation Mechanisms: External Linkage, Endogenous Upgrading, and Transitional Coordination

Unlike many metropolitan fringe areas where economic and locational factors tend to play a dominant role, Changsha County is not only an industrially developed county but also a county with a strong agricultural foundation. NDVI showed relatively high explanatory power, and distance to cultivated land also exhibited strong spatial contributions in traditional agricultural areas, indicating that the ecological–agricultural background and cultivated-land accessibility remain important in explaining the spatial differentiation of rural settlement scale. This differs to some extent from the differentiation patterns commonly observed in other metropolitan suburban areas, where economic and locational factors tend to dominate while the role of natural environmental factors becomes relatively weaker.
The underlying mechanisms can be further understood within the “south-industry, north-agriculture” development pattern of Changsha County. In southern suburban towns with developed industries and high levels of urbanization, such as Huangxing Town, Huanghua Town, and Langli Subdistrict, rural settlements are adjacent to the metropolitan core of Changsha. The expansion of rural settlements in these areas cannot be attributed simply to the natural growth of the local agricultural population; rather, it is more closely related to rural spatial restructuring under industrialization, urbanization, and metropolitan functional spillovers. Industrial corridors formed along major transport routes have strengthened the connections between villages, industrial nodes, urban functional areas, and public service centers. Under the combined functions of industrial support, suburban services, and agricultural residence, rural settlements have shown a continuous expansion trend. This mechanism can be summarized as an externally linked corridor-based driving pathway.
In remote suburban towns dominated by agriculture, such as Jinjing Town, Kaihui Town, and Fulin Town, although the level of non-agricultural industrialization is relatively low, the traditional human–land relationship logic of “living adjacent to cultivated land” remains visible. However, development in these areas has gradually moved beyond the traditional single-cropping agricultural model. Through agricultural industrialization, large-scale farming, leisure agriculture, and red cultural tourism, these areas have gradually formed a rural spatial organization characterized by the integrated development of primary, secondary, and tertiary industries. The layout of rural settlements is more closely integrated with agricultural resource utilization, ecological conservation, and tourism service functions. This mechanism can be summarized as an endogenous upgrading pathway driven by resource endowments.
Between these two development contexts, transitional zones such as Jiangbei Town and the southern fringe of Huangxing Town exhibit more complex spatial characteristics. These areas are located between the suburban industrial corridor and the agricultural–ecological hinterland. Their capacity to absorb industrial spillovers is relatively limited, while the upgrading of agricultural, ecological, and service functions remains insufficient. As a result, the contributions of socioeconomic development, facility provision, and industrial support tend to be weaker or more unstable. This transitional pattern suggests that rural settlement differentiation in metropolitan hinterlands is not a simple binary contrast between urban expansion and agricultural persistence, but a multi-path restructuring process shaped by the uneven coupling of external urban influence and endogenous rural development capacity.

5.3. Planning Implications for Differentiated Regulation of Rural Settlement Layouts

The spatially differentiated mechanisms identified above indicate that rural settlement layout regulation in Changsha County should not adopt a “one-size-fits-all” approach. Instead, differentiated, gradual, and function-oriented regulation strategies should be developed according to different spatial restructuring pathways. Specifically, rural settlement governance can be optimized around three types of areas—externally linked areas, endogenous upgrading areas, and transitional coordination areas—with corresponding emphasis on construction-land efficiency, resource-endowment utilization, and the improvement of public services.
For externally linked suburban industrial corridor areas, such as Huangxing Town, Huanghua Town, and Langli Subdistrict, rural settlements are closely connected with industrial functional zones, transport corridors, and public service nodes. Therefore, the priority should be to promote industry–residence integration and intensive use of construction land. Regulation in these areas should not simply restrict settlement scale but should improve the coordination between rural settlements, industrial space, and living-service space through the guidance of concentrated construction areas, the optimization of public service facilities, and the revitalization of inefficient construction land. Under the requirements of territorial spatial land-use control, the market-oriented use of collectively owned commercial construction land, the reuse of idle rural homesteads, and the redevelopment of stock construction land may be promoted in an orderly manner, so as to shift suburban industrial corridor areas from extensive expansion toward quality-oriented renewal.
For endogenous upgrading of agricultural and ecological areas, such as Jinjing Town, Kaihui Town, and Fulin Town, regulation should be guided by cultivated-land protection, ecological conservation, and the continuation of rural characteristics, while avoiding a uniform centralized resettlement approach. Rural settlements in these areas are closely associated with cultivated land, forest land, characteristic agricultural resources, and rural tourism resources. Spatial regulation should respect the village texture formed by terrain adaptation and proximity to cultivated land; strictly control inefficient and disorderly expansion; and reserve appropriate construction space for agricultural industrialization, agricultural product processing, leisure agriculture, red cultural tourism, and basic public service improvement. Where conditions permit, scattered homesteads may be guided toward moderate concentration in central villages or settlements with better public service conditions, but this process should remain compatible with agricultural production, ecological protection, and villagers’ everyday needs.
For transitional coordination areas, such as Jiangbei Town and the southern fringe of Huangxing Town, the focus should be on improving spatial connectivity, public service provision, and industrial linkage capacity, rather than simply applying the logic of suburban industrial expansion or traditional agricultural protection. Villages with the potential to receive industrial spillovers may strengthen their functional connections with suburban industrial corridors through improved transport links, infrastructure upgrading, and service-node development. Villages with stronger agricultural and ecological resource foundations may be guided toward resource-based pathways such as agricultural industrialization, ecological conservation, and rural tourism. For villages experiencing persistent population decline and low construction-land-use efficiency, gradual homestead consolidation, idle construction land revitalization, and classified withdrawal mechanisms may be explored on the basis of villagers’ willingness and rights protection.
Overall, rural settlement regulation in metropolitan hinterlands should shift from single-scale construction-land management toward refined governance based on “type identification–functional adaptation–spatial optimization.” The externally linked, endogenous upgrading, and transitional coordination areas identified in this study can provide a spatial diagnostic basis for delineating concentrated construction areas, approving rural housing construction, allocating public service facilities, implementing disaster avoidance measures, protecting cultivated land, and regulating ecological space. By translating empirical identification into differentiated guidance for village planning and territorial spatial land-use control, the governance efficiency of rural construction land in metropolitan hinterlands can be further improved, supporting the sustainable use of rural settlement space and integrated urban–rural development.

5.4. Limitations

This study still has several limitations. Due to the difficulty in obtaining long-term socioeconomic data at the village level, the analysis of influencing factors associated with the spatial differentiation of rural settlement scale was mainly based on 2020 village-level cross-sectional data, which limited the ability to fully capture the temporal evolution and lagged effects of different factors. In addition, policy-institutional factors, such as land consolidation and rural homestead reform, are difficult to quantify and were therefore not incorporated into the analytical models. Future research could integrate multi-period panel data and policy quantification methods to further deepen the understanding of the dynamic mechanisms underlying rural settlement evolution.

6. Conclusions

This study selected Changsha County, a typical county located within the hinterland of a major metropolis, as the study area. From the perspective of “pattern–process–mechanism,” multiple methods, including landscape pattern indices, kernel density analysis, the centroid migration model, the Optimal Parameters-based Geographical Detector (OPGD), and the Geographically Weighted Random Forest (GWRF) model, were comprehensively employed to systematically reveal the spatiotemporal evolution characteristics of rural settlements from 1990 to 2020 and identify the factors associated with the spatial differentiation of rural settlement scale in 2020. The main conclusions are as follows:
  • The scale of rural settlements continuously expanded, while their spatial distribution exhibited a polarized pattern characterized by “dense in the south and sparse in the north,” with the centroid persistently shifting toward the southwestern urban core area. From 1990 to 2020, the patch area of rural settlements in Changsha County increased by 69.7%, whereas patch density decreased by 26.7%, indicating an intensive expansion trend characterized by “increasing quantity but decreasing density.” The overall spatial distribution displayed a “dense south–sparse north” pattern, with enhanced connectivity among patches and a significant reduction in spatial separation, suggesting that the spatial structure of rural settlements gradually evolved toward agglomeration. High-value kernel density areas evolved from an early scattered multi-core pattern into a concentric agglomeration pattern centered on Huangxing Town and Langli Subdistrict in the southwestern part of the county, reflecting a pronounced spatial polarization effect. Meanwhile, the centroid of rural settlement distribution continuously migrated southwestward, with the spatial development focus increasingly approaching the urban core area of Changsha City, thereby demonstrating an overall evolutionary trend of concentration toward the southwestern part of the county.
  • The spatial differentiation of rural settlement scale in 2020 was associated with multiple factors, among which socioeconomic factors showed stronger explanatory power, while significant interaction enhancement effects existed among the retained factors. The OPGD results indicate that the explanatory power of the factors ranked from highest to lowest as follows: output value of secondary and tertiary industries per unit area > NDVI > living facility adequacy > GDP per capita > distance to cultivated land > distance to major roads. Overall, the influence of socioeconomic factors was significantly greater than that of natural environmental and locational factors. Interaction detection further revealed significant synergistic enhancement effects among the driving factors, indicating that the coupling effects between socioeconomic factors and natural environmental and locational factors jointly shaped the complex spatial pattern of rural settlements.
  • The SHAP contributions of different influencing factors exhibited pronounced spatial heterogeneity, revealing differentiated mechanisms underlying the spatial differentiation of rural settlement scale. The GWRF-SHAP results indicate that NDVI showed bidirectional spatial contributions, reflecting the differentiated role of ecological–agricultural landscape patterns across different areas. Distance to cultivated land showed clear positive contributions in traditional agricultural areas, indicating that cultivated-land accessibility remains an important locational condition for rural settlement distribution. Distance to major roads exhibited a threshold-like pattern, with positive contributions mainly concentrated along major transport corridors and transport nodes. The output value of secondary and tertiary industries per unit area exhibited a spatially polarized contribution pattern, with positive agglomeration in the central industrial corridor and insufficient contributions in the northern and southern peripheral areas. GDP per capita and living facility adequacy showed more spatially selective and localized associations with rural settlement scale, and their explanatory roles were weaker than that of the output value of secondary and tertiary industries per unit area. Overall, under the “south-industry, north-agriculture” development pattern, the spatial differentiation of rural settlement scale in Changsha County can be further summarized into three rural spatial restructuring pathways: external linkage, endogenous upgrading, and transitional coordination, corresponding respectively to suburban industrial corridors, northern agricultural–ecological areas, and intermediate transitional zones. Together, these pathways reveal the multi-path restructuring characteristics of rural settlement differentiation in metropolitan hinterlands.

Author Contributions

Conceptualization, J.F.; Methodology, J.F.; Validation S.H.; Writing—original draft, J.F.; Writing—review and editing, B.Z.; Visualization, S.H.; Funding acquisition, L.S. All authors have read and agreed to the published version of the manuscript.

Funding

This study was supported by the China National Development Program (Grant No. 2024YFD1600401), Ministry of Science and Technology, China.

Data Availability Statement

The land use data, DEM data, and NDVI data are publicly available from the Resource and Environment Science and Data Center of the Chinese Academy of Sciences (https://www.resdc.cn/ (accessed on 15 May 2026)). River network and road network data are available from OpenStreetMap (https://www.openstreetmap.org/ (accessed on 15 May 2026)). Administrative boundary data were provided by the Changsha Natural Resources and Planning Bureau, and field survey data were collected by the research group, both of which are subject to third-party licensing and privacy restrictions and therefore cannot be made publicly available. Processed data are available from the corresponding author upon reasonable request.

Acknowledgments

We sincerely thank the Changsha Natural Resources and Planning Bureau for providing administrative boundary data. We also acknowledge the research group members who participated in the long-term field surveys and data collection.

Conflicts of Interest

The authors declare no conflicts of interest.

References

  1. Liu, Y. Research on the urban-rural integration and rural revitalization in the new era in China. Acta Geogr. Sin. 2018, 73, 637–650. [Google Scholar] [CrossRef]
  2. Zhou, G.; Wu, G.; Luo, Y.; Yu, X. Research framework and important issues of rural modernization based on a geographical perspective. Acta Geogr. Sin. 2025, 80, 2552–2572. [Google Scholar] [CrossRef]
  3. Sun, Y.; Chen, C.; Yang, H. Exploring the spatial patterns of rural multifunctionality in China’s metropolitan hinterland and its driving forces: The case of Shanghai-Suzhou-Jiaxing-Huzhou region. Habitat Int. 2025, 165, 103562. [Google Scholar] [CrossRef] [Scilit]
  4. Zhang, B.; Cai, W.; Zhang, F.; Jiang, G.; Guan, X. Progress and prospects of micro-scale research on rural residential land in China. Prog. Geogr. 2016, 35, 1049–1061. [Google Scholar] [CrossRef] [Scilit]
  5. Chen, F.; Chen, C. The evolutionary trajectory of the rural settlements in Southern Jiangsu in the past 20 years: From the perspective of urbanization and land use. J. Geogr. Sci. 2024, 34, 1615–1635. [Google Scholar] [CrossRef] [Scilit]
  6. Bittner, C.; Sofer, M. Land use changes in the rural–urban fringe: An Israeli case study. Land Use Policy 2013, 33, 11–19. [Google Scholar] [CrossRef] [Scilit]
  7. Sun, Z.; Hu, T.; Li, C.; Yang, F.; Zhou, K. Study on the spatiotemporal evolution characteristics and influencing factors of rural settlements in the Xiangjiang River Basin. Res. Soil Water Conserv. 2024, 31, 344–353. [Google Scholar] [CrossRef]
  8. Tong, Y.; Niu, H.; Fan, L.; Lin, H. Factors affecting rural settlements distribution and their temporal and spatial heterogeneity in hilly region of Southern Henan Province. Res. Soil Water Conserv. 2022, 29, 387–393. [Google Scholar] [CrossRef]
  9. Li, Y.; Guo, X.; Ma, Y.; Yu, C. Spatio-temporal evolution and driving factors of settlements in ecologically fragile srea of Northwestern Sichuan. Chin. J. Soil Sci. 2023, 54, 253–262. [Google Scholar] [CrossRef]
  10. Song, W.; Li, H. Spatial pattern evolution of rural settlements from 1961 to 2030 in Tongzhou District, China. Land Use Policy 2020, 99, 105044. [Google Scholar] [CrossRef] [Scilit]
  11. Wang, L.; Zeng, J. Spatial differentiation characteristics and types classification of rural settlements in southwest Shandong: A case study of Heze city. Geogr. Res. 2021, 40, 2235–2251. [Google Scholar] [CrossRef]
  12. Xu, X.; Xu, L.; Zhou, D.; Xu, Y. Spatiotemporal evolution and influencing factors of rural settlements in Jiangxi Province. Res. Soil Water Conserv. 2024, 31, 320–330. [Google Scholar] [CrossRef]
  13. Yang, Z.; Tian, L. Sustainability assessment based on PLUS simulation of future land use change: A case study of Jiangxi Province. Sci. Geogr. Sin. 2024, 44, 1826–1836. [Google Scholar] [CrossRef]
  14. Liu, H.; Liu, W.; Wan, M.; Ma, F.; Wu, N.; Liu, J. Analysis and prediction of spatiotemporal evolution of carbon storage in Ningxia Hui Autonomous Region based on the PLUS-InVEST-OPGD Model. Environ. Sci. 2026, 47, 4094–4106. [Google Scholar] [CrossRef] [Scilit] [PubMed]
  15. Ma, W.; Zhu, D.; Jiang, G. Research on land use structure transition of rural settlements facing the rural vitalization. Geogr. Res. 2022, 41, 2615–2630. [Google Scholar] [CrossRef]
  16. Feng, J.; Ma, G.; Li, J.; Zhu, C. Strategies of rural settlement consolidation cased on population density and adaptability of layout: A case of Huating, Gansu Province. Chin. J. Soil Sci. 2022, 53, 768–776. [Google Scholar] [CrossRef]
  17. Feng, D.; Long, H.; Wang, K.; Jiang, Y.; Huang, Y. Review and prospect of research on spatial layout optimization of rural residential areas in China. Geogr. Res. 2024, 43, 2215–2232. [Google Scholar] [CrossRef]
  18. Qian, J.; Wen, J.; Wang, T. The spatial and temporal evolution of rural settlements in plain water network areas and its influencing factors: A case study of Suzhou City. Mod. Urban Res. 2025, 37–43+57. [Google Scholar] [CrossRef]
  19. Gorbenkova, E.; Shcherbina, E. Historical-Genetic features in rural settlement system: A case study from Mogilev district (Mogilev Oblast, Belarus). Land 2020, 9, 165. [Google Scholar] [CrossRef] [Scilit]
  20. Wang, Z.; E, S.; Chen, J. Decoupling of rural population and settlement in the Three Gorges Reservoir areas in the past 40 years and its driving effect. Trans. CSAE 2022, 38, 273–284. [Google Scholar] [CrossRef]
  21. Pan, W.; A, R.; Yang, X.; Ma, Y.; Liu, J. Spatial and temporal evolution characteristics and driving mechanism of rural settlements in Arid Areas in past 43 years. Chin. J. Soil Sci. 2025, 56, 1510–1523. [Google Scholar] [CrossRef]
  22. Liu, J.; Liu, Y.; Li, Y.; Hu, Y. Coupling analysis of rural residential land and rural population in China during 2007–2015. J. Nat. Resour. 2018, 33, 1861–1871. [Google Scholar] [CrossRef] [Scilit]
  23. Wang, Z.; Ou, L.; Chen, M. Evolution characteristics, drivers and trends of rural residential land in mountainous economic circle: A case study of Chengdu-Chongqing area, China. Ecol. Indic. 2023, 154, 110585. [Google Scholar] [CrossRef] [Scilit]
  24. Sun, Y.; Gao, J.; Tong, D.; Li, G. Spatio-temporal evolution characteristics and influencing factors of rural settlements in Guangdong Province based on GTWR model. Sci. Geogr. Sin. 2023, 43, 1249–1258. [Google Scholar] [CrossRef]
  25. Li, X.; Liu, Q. Analysis of the spatial-temporal evolution and driving factors of rural residential areas in metropolitan fringe: A case study of Tianjin. J. Ecol. Rural Environ. 2022, 38, 1309–1317. [Google Scholar] [CrossRef]
  26. Wang, W.; Li, S.; Shao, C.; Yang, T.; Hu, H.; Deng, X.; Sun, Z. Study on the evolution of rural residential landscape pattern based on remote sensing: A case study of Dezhou City, Shandong Province. Chin. J. Agric. Resour. Reg. Plan. 2024, 45, 146–155. [Google Scholar]
  27. Fu, Y.; Wang, X.; Liu, J.; Wei, F.; Pu, J.; Zhang, X.; Weng, Q. Spatial-temporal evolution of typical rural settlements in northern Jiangsu Province: A case study of Donghai County. J. China Agric. Univ. 2023, 28, 208–222. [Google Scholar] [CrossRef]
  28. Liu, Y.; Liu, X.; Yang, Q.; He, H.; Song, Y.; Liu, X. Spatial layout optimization of rural settlements in Qinling-Bashan Mountains based on resilience theory: A case study of Dongan Town, Chengkou County. J. Southwest Univ. (Nat. Sci. Ed.) 2023, 45, 165–175. [Google Scholar] [CrossRef]
  29. Yang, Z.; Yang, D.; Geng, J.; Tian, F. Evaluation of suitability and spatial distribution of rural settlements in the Karst mountainous area of China. Land 2022, 11, 2101. [Google Scholar] [CrossRef] [Scilit]
  30. Luo, G.; Wang, B.; Luo, D.; Wei, C. Spatial agglomeration characteristics of rural settlements in poor mountainous areas of Southwest China. Sustainability 2020, 12, 1818. [Google Scholar] [CrossRef] [Scilit]
  31. Ma, L.; Tao, T.; Yao, Y.; Li, Y. Renovation potential evaluation and type identification of rural idle residential land: A case study of Yuzhong County, Longzhong Loess Hilly Region, China. Land 2023, 12, 163. [Google Scholar] [CrossRef] [Scilit]
  32. Chen, S.; Wang, X.; Lin, Q. Spatial pattern characteristics and influencing factors of mountainous rural settlements in metropolitan fringe area: A case study of Pingnan County, Fujian Province. Heliyon 2024, 10, e26606. [Google Scholar] [CrossRef] [Scilit] [PubMed]
  33. Chen, W.; Duan, B.; Bian, J.; Zeng, J. Decoding the formation mechanisms of rural settlements expansion patterns in transitional China. Land Use Policy 2025, 154, 107561. [Google Scholar] [CrossRef] [Scilit]
  34. Rosner, A.; Wesołowska, M. Deagrarianisation of the Economic Structure and the Evolution of Rural Settlement Patterns in Poland. Land 2020, 9, 523. [Google Scholar] [CrossRef] [Scilit]
  35. Lou, R.; Wang, D. Rural Settlement Optimization for Ecologically Sensitive Area Evaluations Based on Geo-Proximity and the Soil–Water Conservation Capacity. Land 2024, 13, 1071. [Google Scholar] [CrossRef] [Scilit]
  36. Wang, J.; Xu, C. Geodetector: Principle and prospective. Acta Geogr. Sin. 2017, 72, 116–134. [Google Scholar] [CrossRef]
  37. Yang, B.; Wang, Z.; Zhang, H.; Tan, L. Spatial pattern evolution characteristics and driving mechanism of rural settlements in high mountain areas with poverty. Trans. CSAE 2021, 37, 285–293. [Google Scholar] [CrossRef]
  38. Niyogakiza, A.; Liu, Q. GIS-Driven Multi-Criteria Assessment of Rural Settlement Patterns and Attributes in Rwanda’s Western Highlands (Central Africa). Sustainability 2025, 17, 6406. [Google Scholar] [CrossRef] [Scilit]
  39. Zhang, R.; Cheng, Y.; Zhang, X.; Fang, X.; Ma, Q.; Ren, L. Spatial-temporal pattern and driving factors of flash flood disasters in Jiangxi Province analyzed by optimal parameters-based Geographical Detector. Geogr. Geo-Inf. Sci. 2021, 37, 72–80. [Google Scholar] [CrossRef] [Scilit]
  40. Sofue, Y.; Kohsaka, R. Conversion patterns of agricultural lands in plains and mountains: An analysis of underpinning factors by temporal comparison with geographically weighted regression in depopulating rural Japan. Environ. Sustain. Indic. 2024, 22, 100346. [Google Scholar] [CrossRef] [Scilit]
  41. Ma, X.; Zha, X. Spatial structure evolvement and impact factors of rural settlements in the Qinba Mountain Area: A case study of Ningqiang County in Shaanxi Province, China. Mt. Res. 2020, 38, 726–739. [Google Scholar] [CrossRef]
  42. Zhou, X.; Wang, Z.; Liu, Y.; Cheng, Y.; Zhou, Y.; Zhang, J. Factors influencing the evolution of rural settlements based on MGWR: A case study of Haikou City. Trop. Geogr. 2023, 43, 1599–1610. [Google Scholar] [CrossRef]
  43. Guo, H.; Dong, L.; Wu, L.; Liu, Y. Tackling spatial heterogeneity in geographical analysis: An overview. Acta Geogr. Sin. 2025, 80, 567–585. [Google Scholar] [CrossRef]
  44. Wu, D.; Zhang, Y.; Xiang, Q. Geographically weighted random forests for macro-level crash frequency prediction. Accid. Anal. Prev. 2024, 194, 107370. [Google Scholar] [CrossRef] [Scilit] [PubMed]
  45. Li, Z.; Du, Z.; Bi, S.; Ye, T.; Zhang, Q.; Chen, Y. Prediction of soil salinity and analysis of influencing factors in coastal plains based on geographically weighted random forests. Environ. Sci. 2025, 46, 4982–4992. [Google Scholar] [CrossRef] [Scilit] [PubMed]
  46. Zhang, Y.; Ge, J.; Wang, S.; Dong, C. Optimizing urban green space configurations for enhanced heat island mitigation: A geographically weighted machine learning approach. Sustain. Cities Soc. 2025, 119, 106087. [Google Scholar] [CrossRef] [Scilit]
  47. People’s Government of Hunan Province. The 14th Five-Year Plan for National Economic and Social Development of Hunan Province and the Long-Range Objectives Through 2035; Hunan Provincial People’s Government: Changsha, China, 2021. Available online: https://www.hunan.gov.cn/topic/hnsswgh/ghqw/202103/t20210325_15073824.html (accessed on 15 May 2026).
  48. Changsha County Bureau of Statistics. Statistical Communiqué of Changsha County on the 2024 National Economic and Social Development; Changsha County Bureau of Statistics: Changsha, China, 2025. Available online: http://m.csx.gov.cn/zwgk/zfxxgkml/fdzdgknr/sjkf/sjgb/202505/t20250507_11839664.html (accessed on 15 May 2026).
  49. Changsha County Statistics Bureau. Statistical Yearbook of National Economic and Social Development of Changsha County (2020); Changsha County Statistics Bureau: Changsha, China, 2021. Available online: http://www.csx.gov.cn/zwgk/bmxxgkml/xtjj/sjyfx/tjnj/202209/t20220927_10822399.html (accessed on 15 May 2026).
  50. Zhang, B.; Zhang, Z.; Zhou, Y. Characteristics of center of gravity migration of rural settlements in China and its indicative significance. Acta Sci. Nat. Univ. Pekin. 2024, 60, 874–882. [Google Scholar] [CrossRef]
  51. Song, Y.; Wang, J.; Ge, Y.; Xu, C. An optimal parameters-based geographical detector model enhances geographic characteristics of explanatory variables for spatial heterogeneity analysis: Cases with different types of spatial data. GIScience Remote Sens. 2020, 57, 593–610. [Google Scholar] [CrossRef] [Scilit]
  52. Chen, Z.; Dong, H. Spatial and temporal evolution patterns and driving mechanisms of rural settlements: A case study of Xunwu County, Jiangxi Province, China. Sci. Rep. 2024, 14, 24342. [Google Scholar] [CrossRef] [Scilit] [PubMed]
  53. Wang, S.; Xun, J. Evaluation and influencing factors of regional protection level of traditional villages in Southwest China. Acta Geogr. Sin. 2022, 77, 474–491. [Google Scholar] [CrossRef] [Scilit]
Figure 1. Analytical framework of the study.
Land 15 01173 g001
Figure 2. Geographic location of the study area: (a) location of Hunan Province in China; (b) location of Changsha City within Hunan Province; (c) location of Changsha County within Changsha City; (d) township and village administrative divisions of Changsha County.
Land 15 01173 g002
Figure 3. Spatial distribution change of rural residential patches in Changsha County from 1990 to 2020: (a) 1990–2000 year; (b) 2000–2010 year; (c) 2010–2020 year.
Land 15 01173 g003
Figure 4. Evolution characteristics of kernel density distribution of rural settlements from 1990 to 2020: (a) 1990 year; (b) 2000 year; (c) 2010 year; (d) 2020 year.
Land 15 01173 g004
Figure 5. Centroid migration of rural settlements in Changsha County from 1990 to 2020.
Land 15 01173 g005
Figure 6. Comparison of q-statistics under Different Discretization Methods and Classification Numbers.
Land 15 01173 g006
Figure 7. Factor detection results of driving factors on the spatial distribution of rural settlements in Changsha County.
Land 15 01173 g007
Figure 8. Interaction effects of driving factors on the area of rural settlement patches in Changsha County.
Land 15 01173 g008
Figure 9. Spatial distribution of GWRF SHAP Value for rural settlement patches driving factors: (a) NDVI; (b) Distance to Major Roads; (c) Distance to Cultivated Land; (d) Per Capita GDP; (e) living facility adequacy; (f) output value of secondary and tertiary Unit Secondary and Tertiary Industry Output Value.
Land 15 01173 g009
Table 1. Data sources of influencing factors for rural settlements in Changsha County.
Target LayerIndicator LayerCalculation MethodData Source
natural environmentalelevation (X1)Average altitude of the area where the village is locatedhttp://www.gscloud.cn
slope (X2)Average slope of the area where the village is locatedhttp://www.gscloud.cn
annual
precipitation (X3)
Annual average precipitation of the area where the village is locatedhttps://www.resdc.cn
Normalized Difference Vegetation Index (X4)Average NDVI value of the area where the village is locatedhttps://www.resdc.cn
locationaldistance to water systems (X5)Euclidean distance from the village to the nearest major water bodyhttps://lbs.amap.com
distance to township government (X6)Euclidean distance from the village to the seat of the township governmenthttps://lbs.amap.com
distance to major roads (X7)Euclidean distance from the village to the nearest national, provincial or county highwayhttps://openstreetmap.org
distance to cultivated land (X8)Euclidean distance from the village to the nearest cultivated landhttps://www.resdc.cn
socioeconomicpopulation density (X9)Population quantity per unit land areaChangsha Municipal Bureau of Natural Resources and Planning
GDP per capita (X10)Ratio of regional gross domestic product to permanent resident populationChangsha Municipal Bureau of Natural Resources and Planning
living facility adequacy (X11)Number of public service facilities (schools, hospitals, commercial outlets, post offices, etc.) in the area where the village is locatedhttps://lbs.amap.com
output value of secondary and tertiary industries per unit area (X12)Total output value of secondary and tertiary industries per unit land areaChangsha Municipal Bureau of Natural Resources and Planning
Table 2. Temporal changes of landscape pattern metrics for rural settlements in Changsha County.
YearClass Area/(km2)Largest Patch Index/(%)Number of Patches/(n)Patch Density /(n/km2)Landscape Shape IndexCohesion IndexSplitting Index
199033.732.21305890.6649.3784.85291.74
200037.352.38316284.6651.6785.35287.38
201042.692.28344280.6256.7386.25268.61
202057.243.85380366.4461.9189.68204.38
Note: Class area refers to rural residential land area. Patch density was calculated as PD = NP/CA, where NP is the number of rural settlement patches and CA is the rural residential land area measured in km2.
Table 3. Initial multicollinearity and significance diagnostic results of the 12 candidate explanatory variables.
Indicator LayerVIFSignificanceDecision
elevation (X1)7.730.707Removed
slope (X2)3.7890.46Removed
annual precipitation (X3)6.6630.53Removed
Normalized Difference Vegetation Index (X4)6.2750.037Retained
distance to water systems (X5)2.550.528Removed
distance to township government (X6)1.7210.844Removed
distance to major roads (X7)1.6581<0.001Retained
distance to cultivated land (X8)2.879<0.001Retained
population density (X9)89.1180.121Removed due to severe multicollinearity
GDP per capita (X10)68.4320.088Temporarily retained for further testing
living facility adequacy (X11)2.6980.087Retained
output value of secondary and tertiary industries per unit area (X12)2.517<0.001Retained
Table 4. Multicollinearity and significance test results of the final retained explanatory variables.
Primary IndicatorSecondary IndicatorCodeVIFSignificance
Natural GeographyNDVIX42.4380.001
Spatial LocationDistance to Major RoadsX71.467<0.001
Distance to Cultivated LandX81.130.001
Socioeconomic FactorsGDP per CapitaX101.1160.081
Living Facility AdequacyX112.5600.098
Output Value of Secondary and Tertiary Industries per Unit AreaX121.216<0.001
Table 5. Comparison of OLS, GWR, MGWR and GWRF Models.
Dependent VariableModel MetricsOLS ModelGWR ModelMGWR ModelGWRF
Model
CAR20.3200.5490.5700.739
adj R20.2980.4710.494-
AICc494.968468.035461.017-
MAE0.5600.4440.4420.277
RMSE0.8520.6710.6560.510
Note: Adjusted R2 and AICc are reported for OLS, GWR, and MGWR where applicable. MAE and RMSE are used as common prediction-error metrics for comparing all four models.
Disclaimer/Publisher’s Note: The statements, opinions and data contained in all publications are solely those of the individual author(s) and contributor(s) and not of MDPI and/or the editor(s). MDPI and/or the editor(s) disclaim responsibility for any injury to people or property resulting from any ideas, methods, instructions or products referred to in the content.