Assessing the Impact of Innovation-Oriented Urban Policy on Urban Ecological Resilience: Empirical Evidence from 271 Cities in China



Abstract
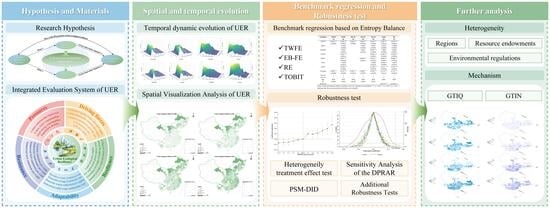
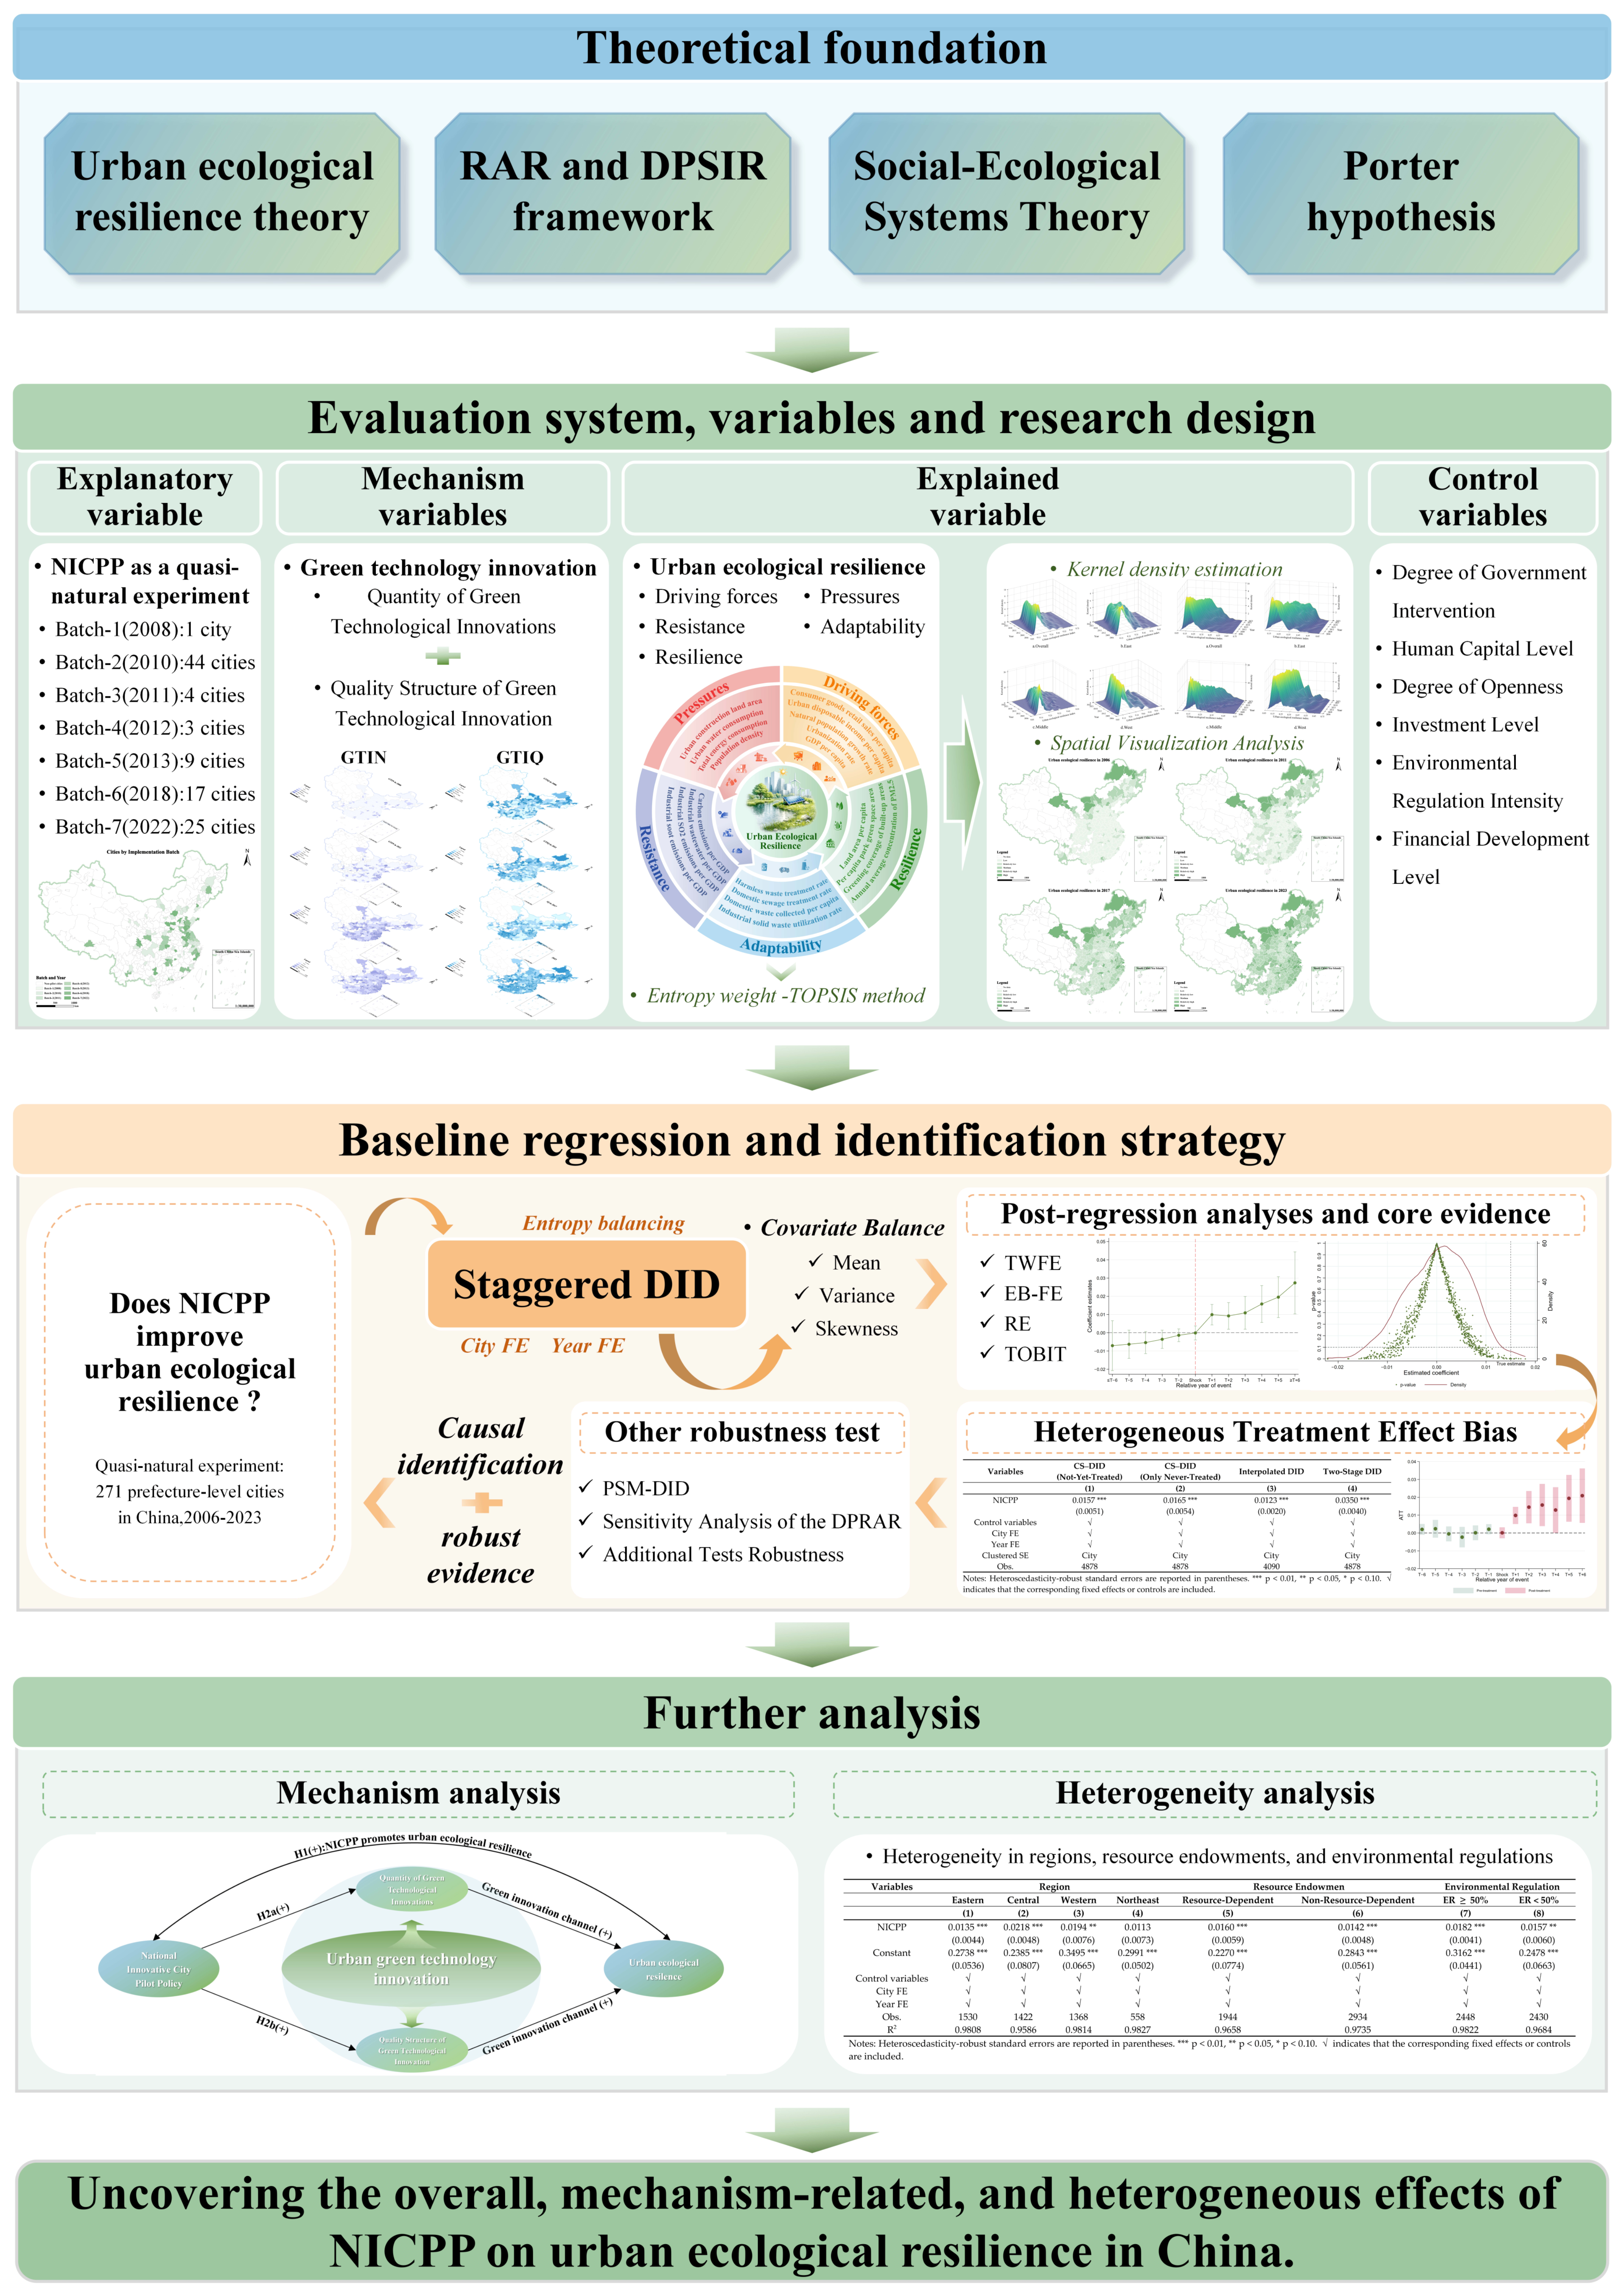
1. Introduction
2. Policy Context and Research Hypothesis
2.1. Policy Context
2.2. Research Hypothesis
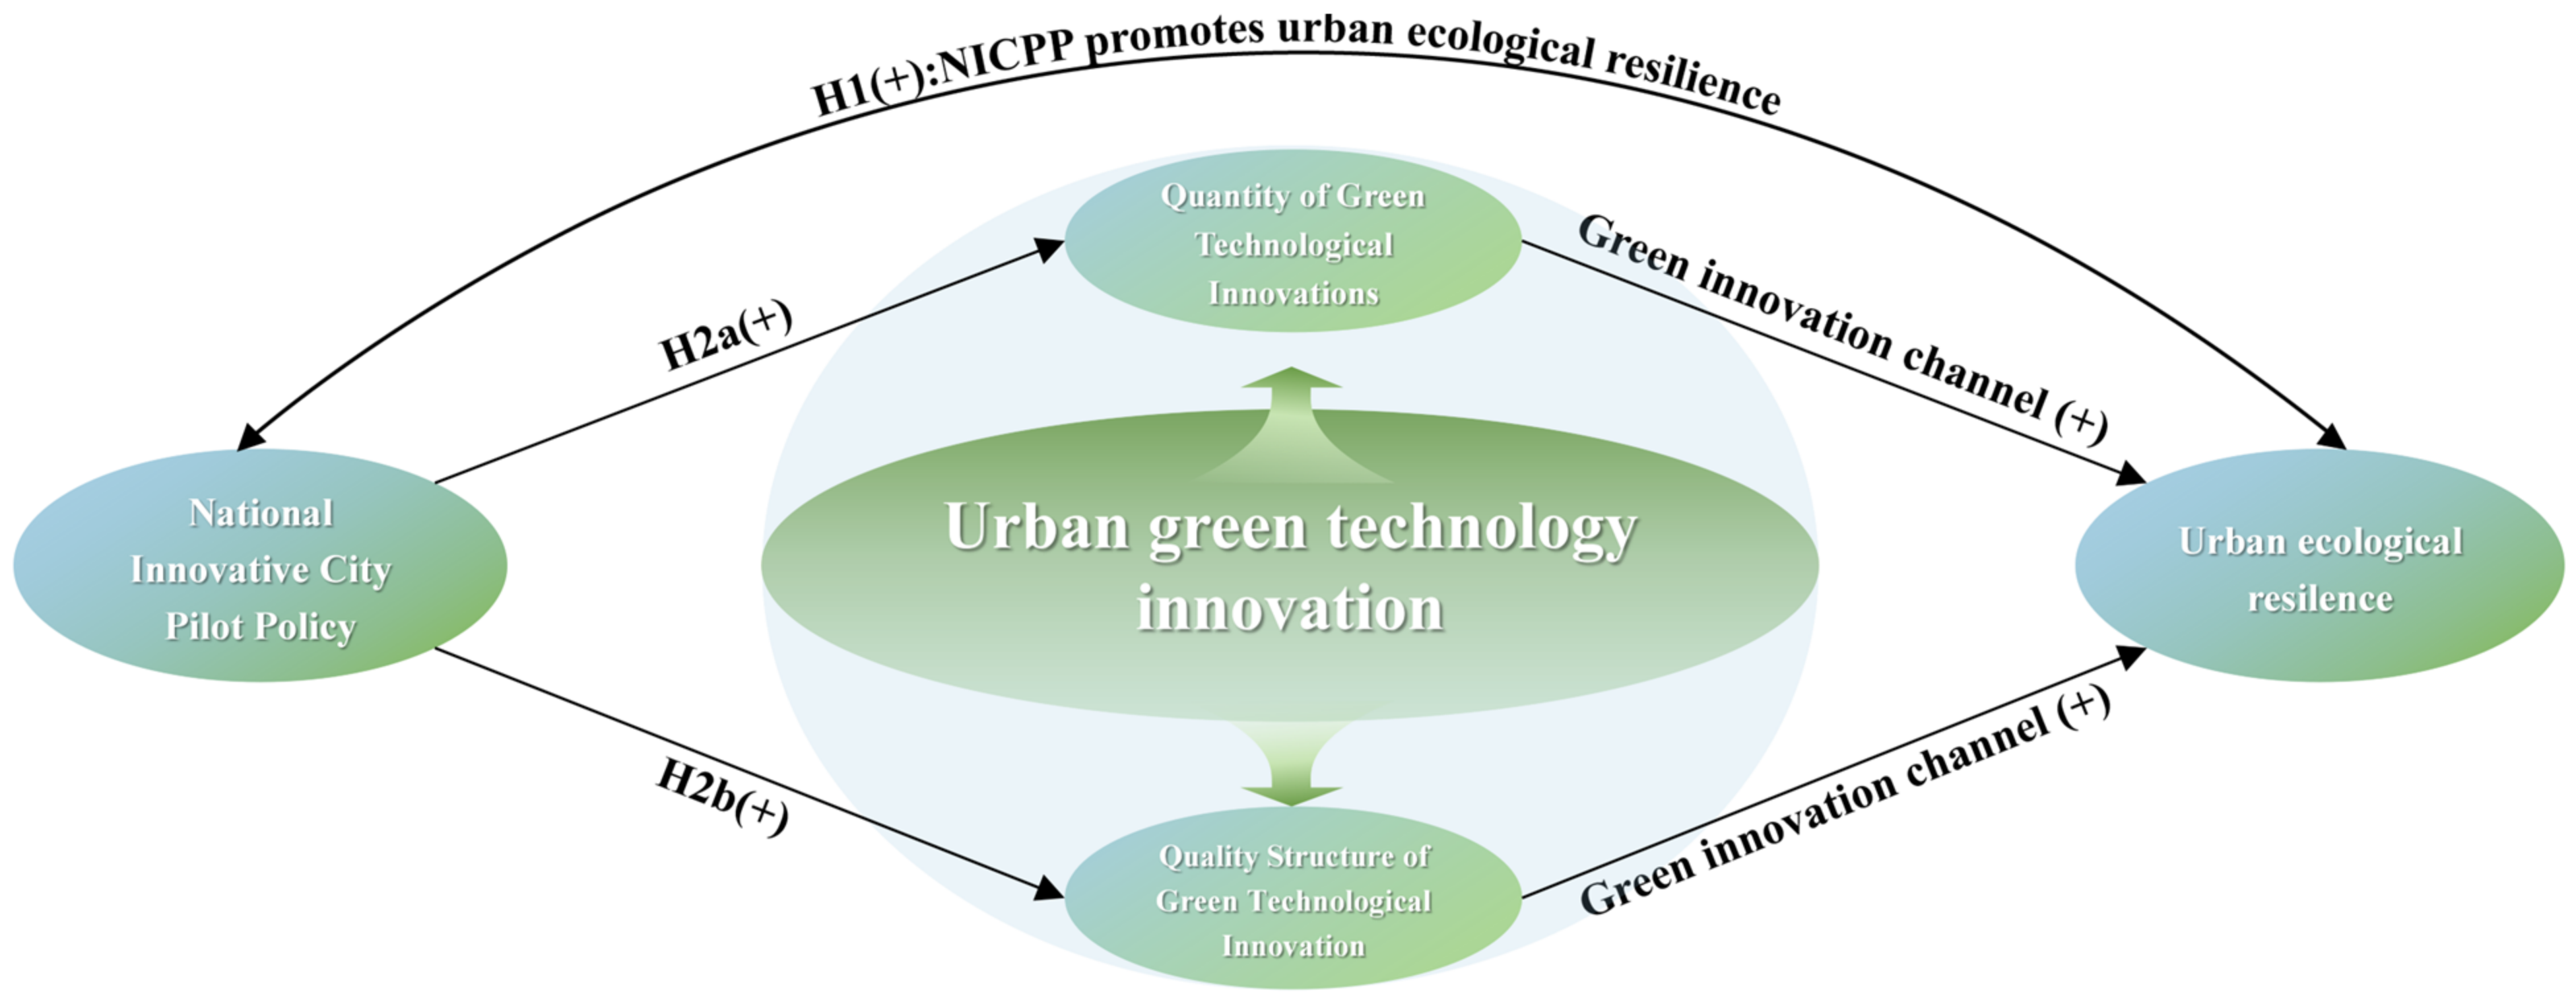
2.2.1. Direct Effects
2.2.2. Green Innovation Effect
3. Empirical Design and Data
3.1. Methodology
3.1.1. Entropy Weight–TOPSIS Method
3.1.2. Kernel Density Estimation
3.1.3. Differences–in–Differences
3.1.4. Entropy Balancing Method
- (1)
- Moment balance constraint.
- (2)
- Normalization constraint.
- (3)
- Nonnegativity constraint.
3.1.5. Callaway and Sant’Anna DID Method
3.2. Definition and Measurement of Variables
3.2.1. Explained Variable
- (1)
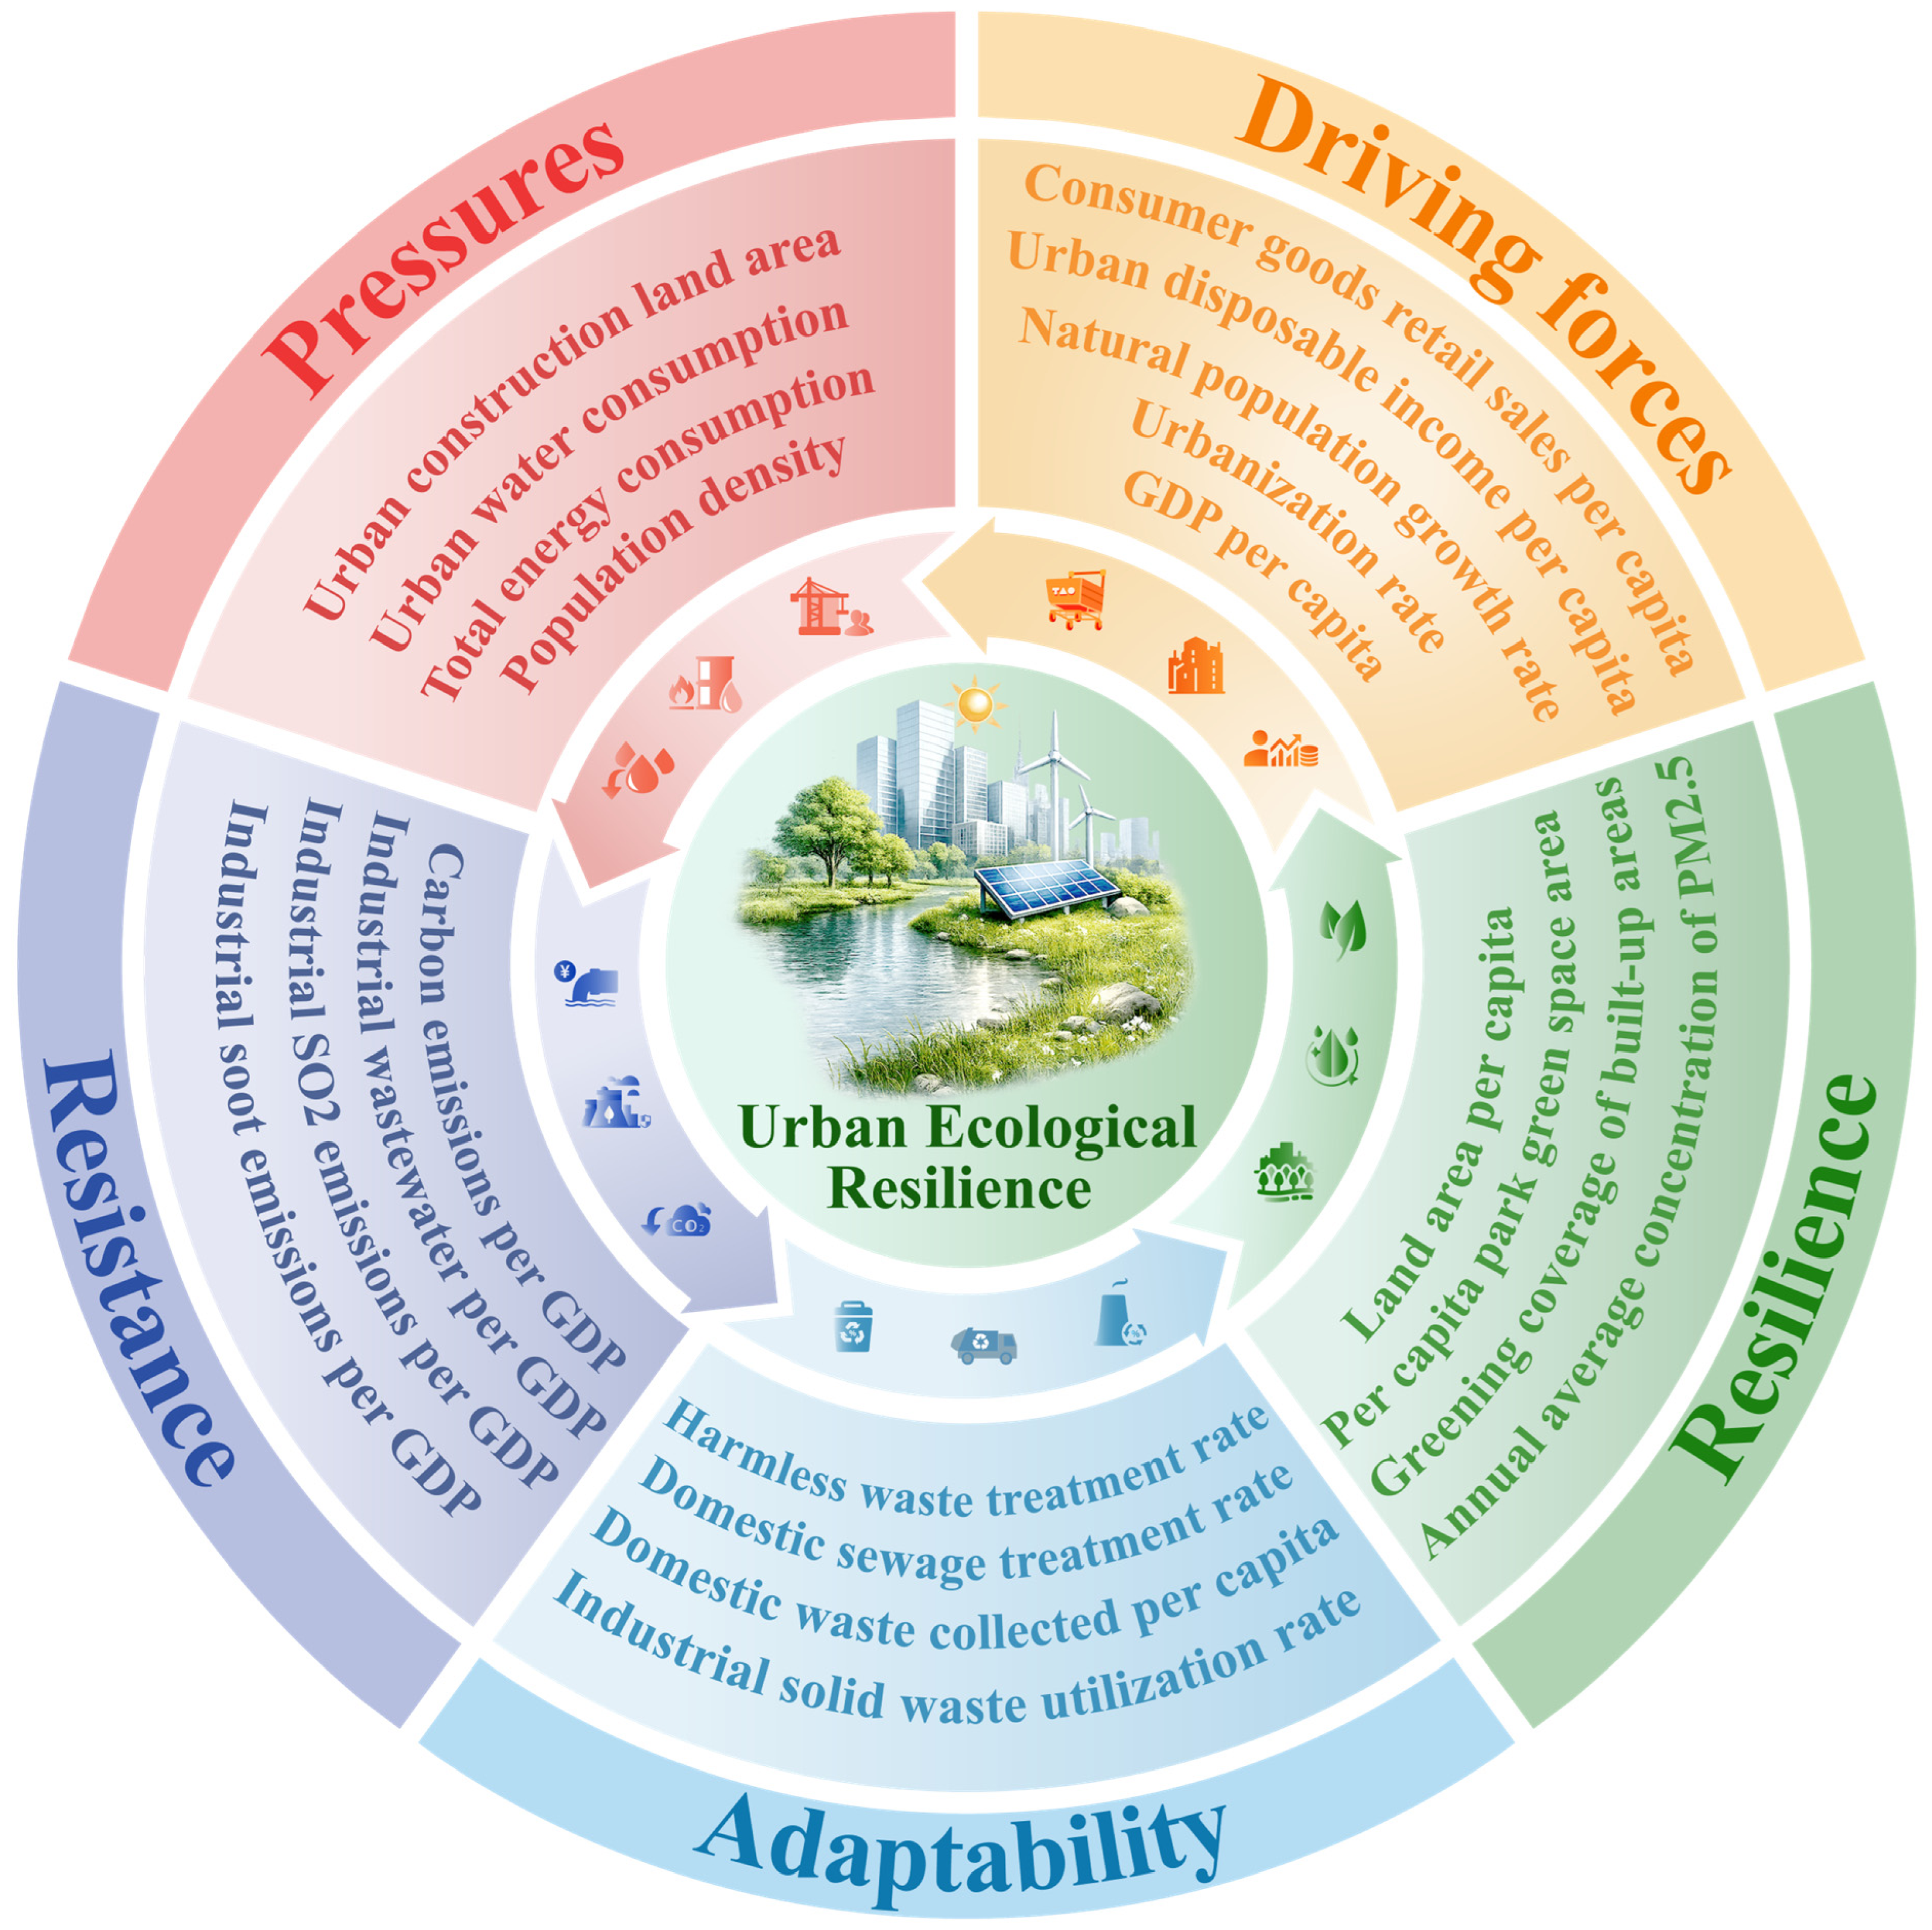
- The driving forces dimension captures the antecedent socioeconomic conditions that initiate ecological change and reflects the source-level influence of human activities on urban ecosystems [15]. These indicators constitute the socioeconomic foundation for urban ecological development and governance, while the associated resource and spatial demands are captured separately by the pressure dimension. The rate of natural population increase [14] affects future population size and thereby alters resource demand and environmental loads. Urban residents’ disposable income per capita [14], per capita GDP [69], and retail sales of consumer goods per capita [15] characterize urban development foundations and potential governance capacity from the perspectives of individual purchasing power, regional economic development, and the scale of social consumption, respectively. The urbanization rat [13] mainly reflects urban development and the concentration of infrastructure and public services, although excessive land demand associated with rapid urbanization may exceed ecosystem carrying capacity.
- (2)
- In this study, the pressure dimension is defined as capturing the actual constraints imposed on urban ecosystems as socioeconomic drivers operate through population concentration, spatial expansion, and resource consumption. Population density [69] reveals the current population pressure on environmental carrying capacity. Compared with the urbanization rate, urban construction land area [70] more directly reflects the pressure exerted by spatial expansion on land resources and ecological space. Total energy consumption [69] indicates the scale of urban metabolism and the associated demand for resources, while water consumption in urban districts [13] reflects the direct intensity of water-resource consumption generated by urban socioeconomic activities. Accordingly, the pressure dimension reveals the pathways through which socioeconomic drivers are transformed into resource and spatial constraints and defines the external conditions facing the subsequent endogenous responses of urban ecosystems.
- (3)
- The resistance dimension represents the capacity of urban ecosystems to withstand disturbances and buffer or absorb external shocks under external pressure. This study measures resistance using pollutant and carbon-emission intensities per unit of economic output, thereby reflecting a city’s ability to control environmental loads and reduce disturbance intensity at a given level of economic activity. Industrial wastewater discharge per unit of GDP [71] captures the water-pollution load associated with each unit of output, and its variation may reflect cleaner production technologies, wastewater treatment capacity, and industrial restructuring. Industrial sulfur dioxide emissions per unit of GDP [15] and carbon emissions per unit of GDP [15] reflect the capacity to alleviate atmospheric pollution and carbon-emission pressures through cleaner energy structures and low-carbon transition, respectively. Industrial soot and dust emissions per unit of GDP [15] measure the capacity to limit the diffusion and deposition impacts of particulate pollution generated by industrial production. Lower values of the above indicators indicate that a city generates less environmental disturbance through technological regulation and structural optimization while maintaining economic output, thereby exhibiting stronger ecosystem resistance.
- (4)
- The adaptability dimension measures the capacity of urban ecosystems to maintain dynamic equilibrium under sustained external pressure through structural optimization, process regulation, and functional reorganization. The domestic wastewater treatment ratio [15] reflects the capacity of cities to reduce water pollution loads and control water environmental risks through wastewater collection and purification systems under sustained wastewater pressure. The integrated recycling rate of general industrial solid waste [72] indicates the capacity of industrial systems to reuse waste resources and optimize material-metabolism pathways. Per capita domestic waste collected and transported [10] reflects the volume of household waste generated per resident that enters formal collection and transportation systems; an increase may result from improved collection coverage and service capacity, but may also be affected by greater waste generation. The safe disposal rate of domestic waste [15] indicates the degree to which cities control environmental risks at the final disposal stage. Accordingly, adaptability is operationalized through improvements in pollution treatment, resource reuse, and waste management, capturing the capacity of cities to restore systemic balance under persistent external pressure.
- (5)
- The resilience dimension measures the capacity of urban ecosystems to restore ecological functions, improve environmental quality and re-establish a stable state after external disturbances. Land area per resident [71] represents the land-resource foundation available for ecological regulation, spatial reorganization, and functional recovery following disturbance. Park green area per resident [15] reflects the provision of public ecological space and provides important support for microclimate regulation, ecosystem-service recovery, and improvements in residents’ environmental well-being. The green coverage rate in built-up areas [16] captures the coverage and spatial continuity of urban green infrastructure, helping to strengthen landscape connectivity and promote the restoration of damaged ecosystems. Mean annual PM2.5 concentration [10] reflects the actual level of pollution-load reduction and environmental-quality recovery after disturbance. Together, these indicators characterize the comprehensive capacity of urban ecosystems for spatial restoration, green support, and environmental-quality recovery.
3.2.2. Core Explanatory Variables
3.2.3. Control Variables
- (1)
- Human capital level (HCI)
- (2)
- Degree of openness (OPEN)
- (3)
- Government intervention (GOV)
- (4)
- Investment level (INV)
- (5)
- Environmental regulation (ER)
- (6)
- Financial development level (FIN)
3.2.4. Mechanism Variables
- (1)
- (2)
- GTIQ denotes the ratio of green invention patents relative to all green patent submissions. It reflects the structural transformation of urban GTI from scale expansion toward the accumulation of high-value innovation [29].
3.3. Data
4. Results
4.1. Spatiotemporal Dynamics of UER
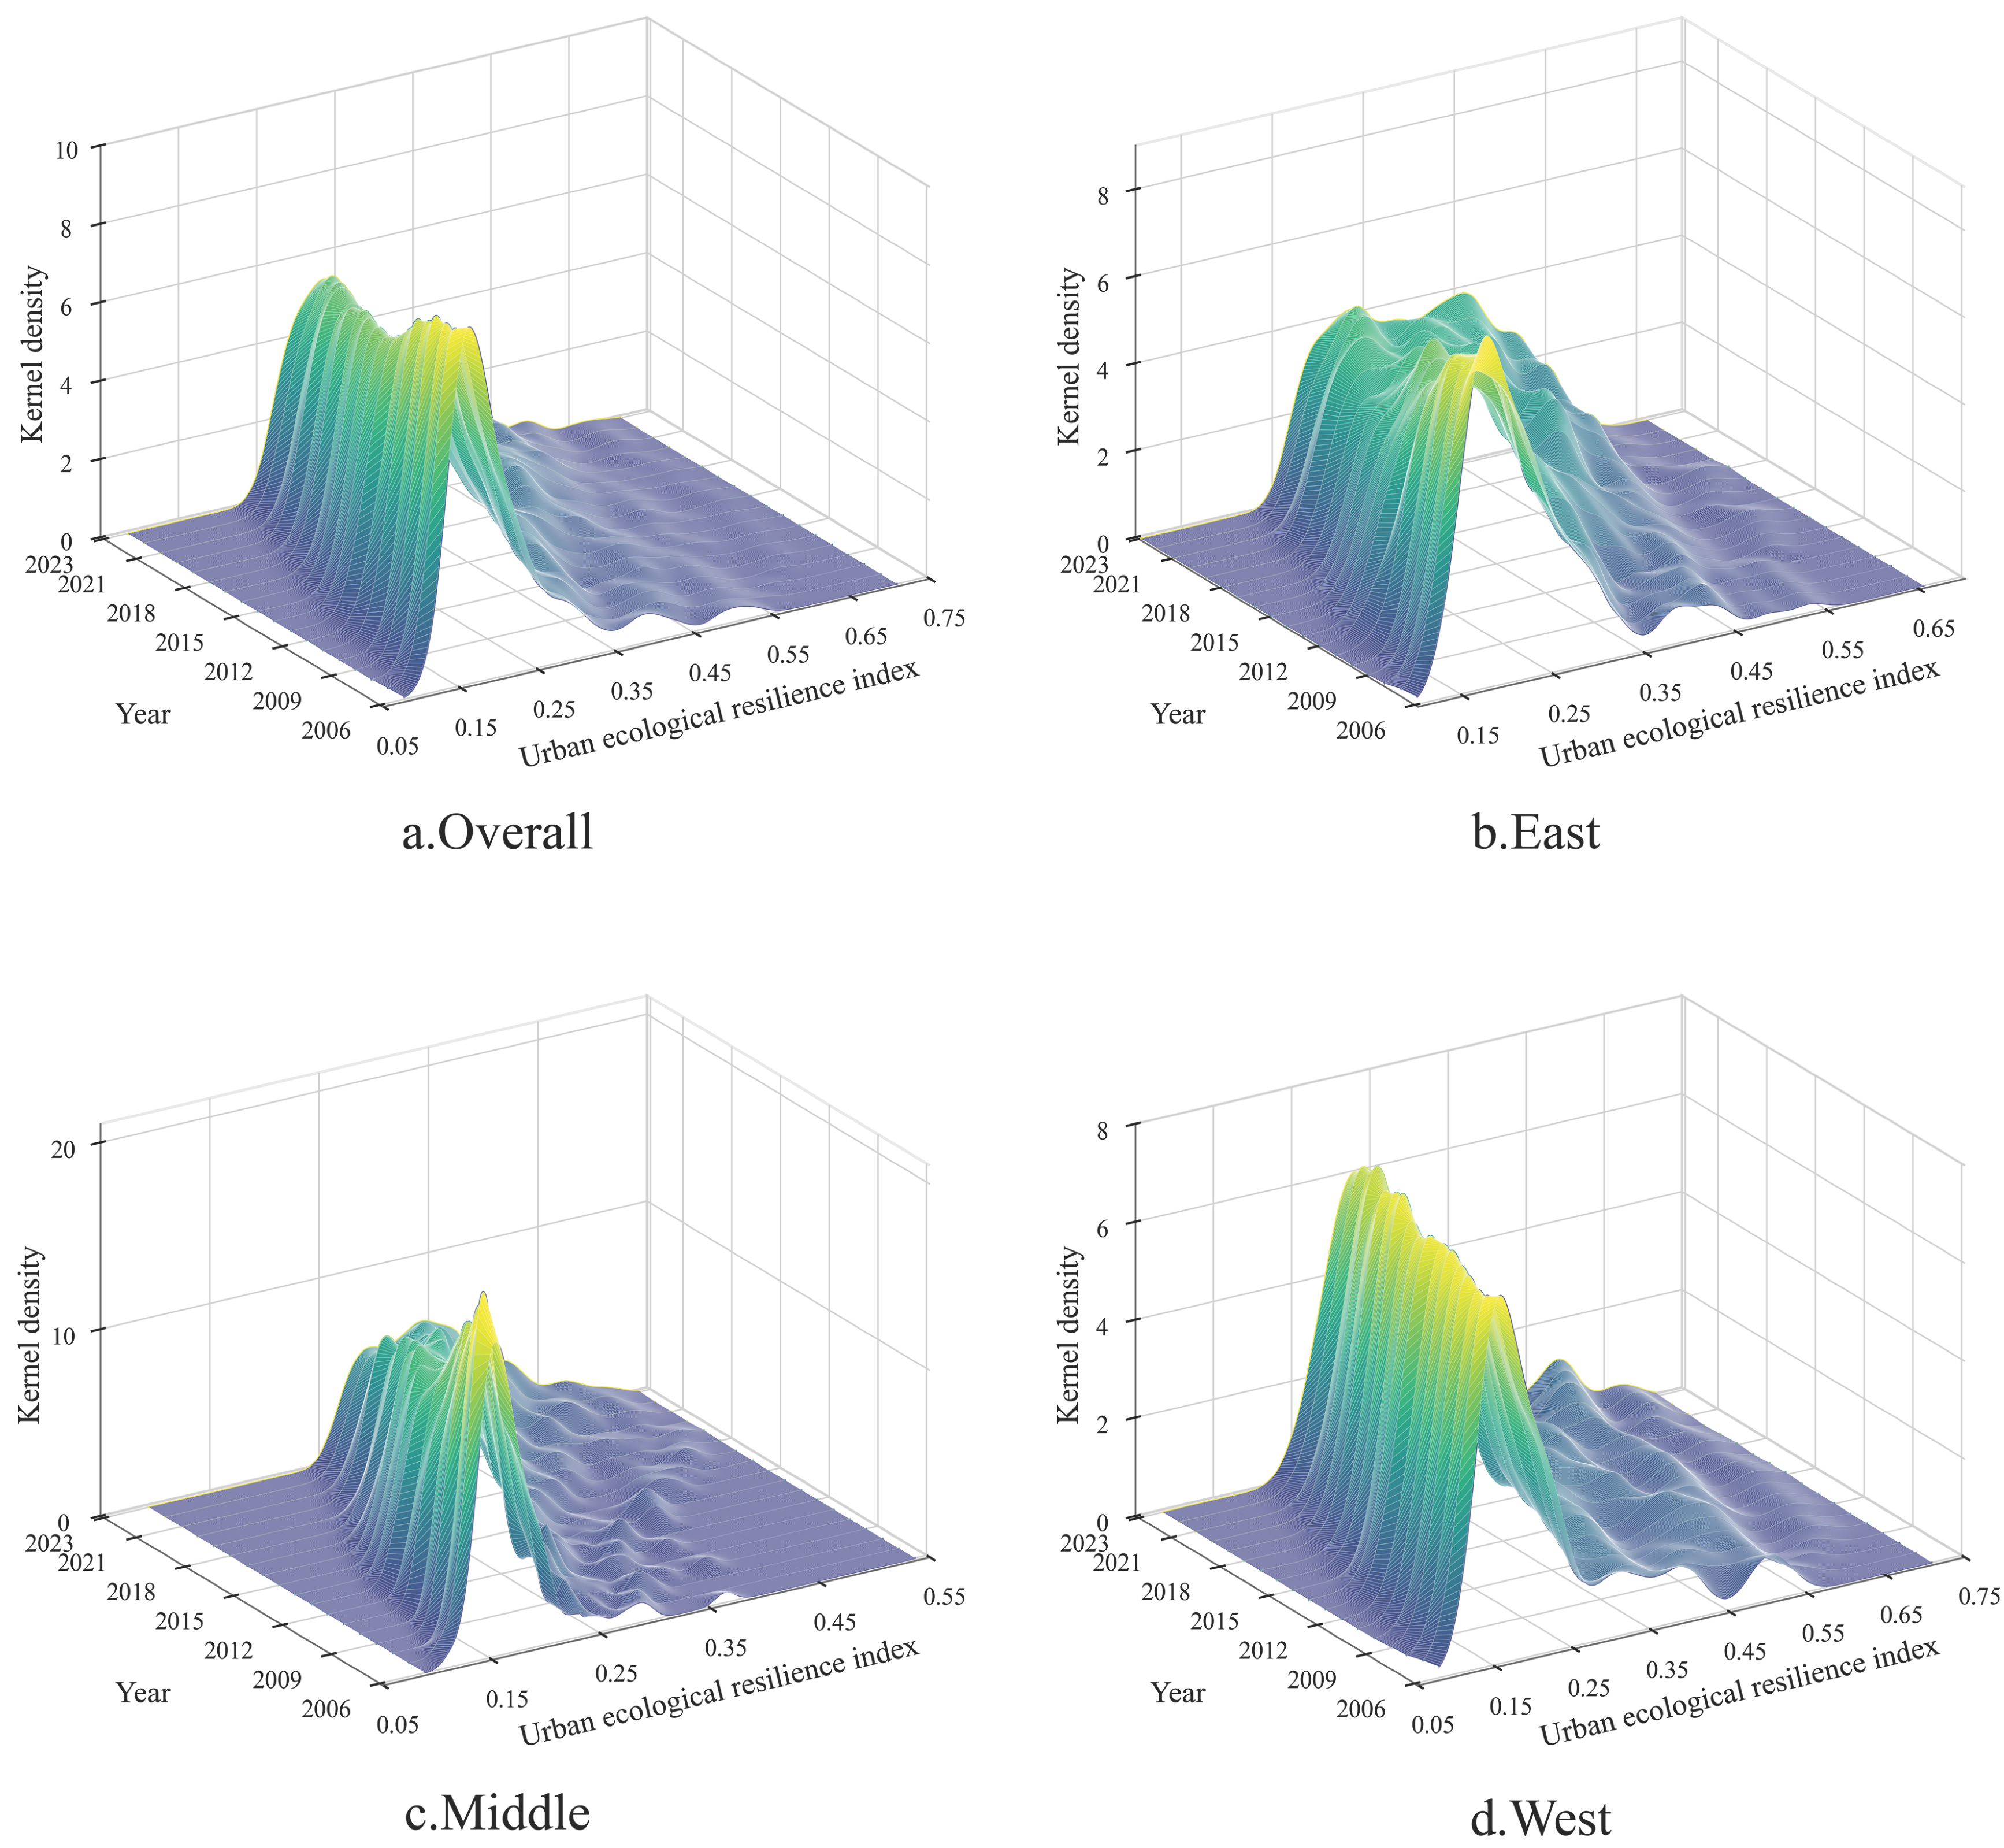
4.1.1. Temporal Evolution Trends of UER
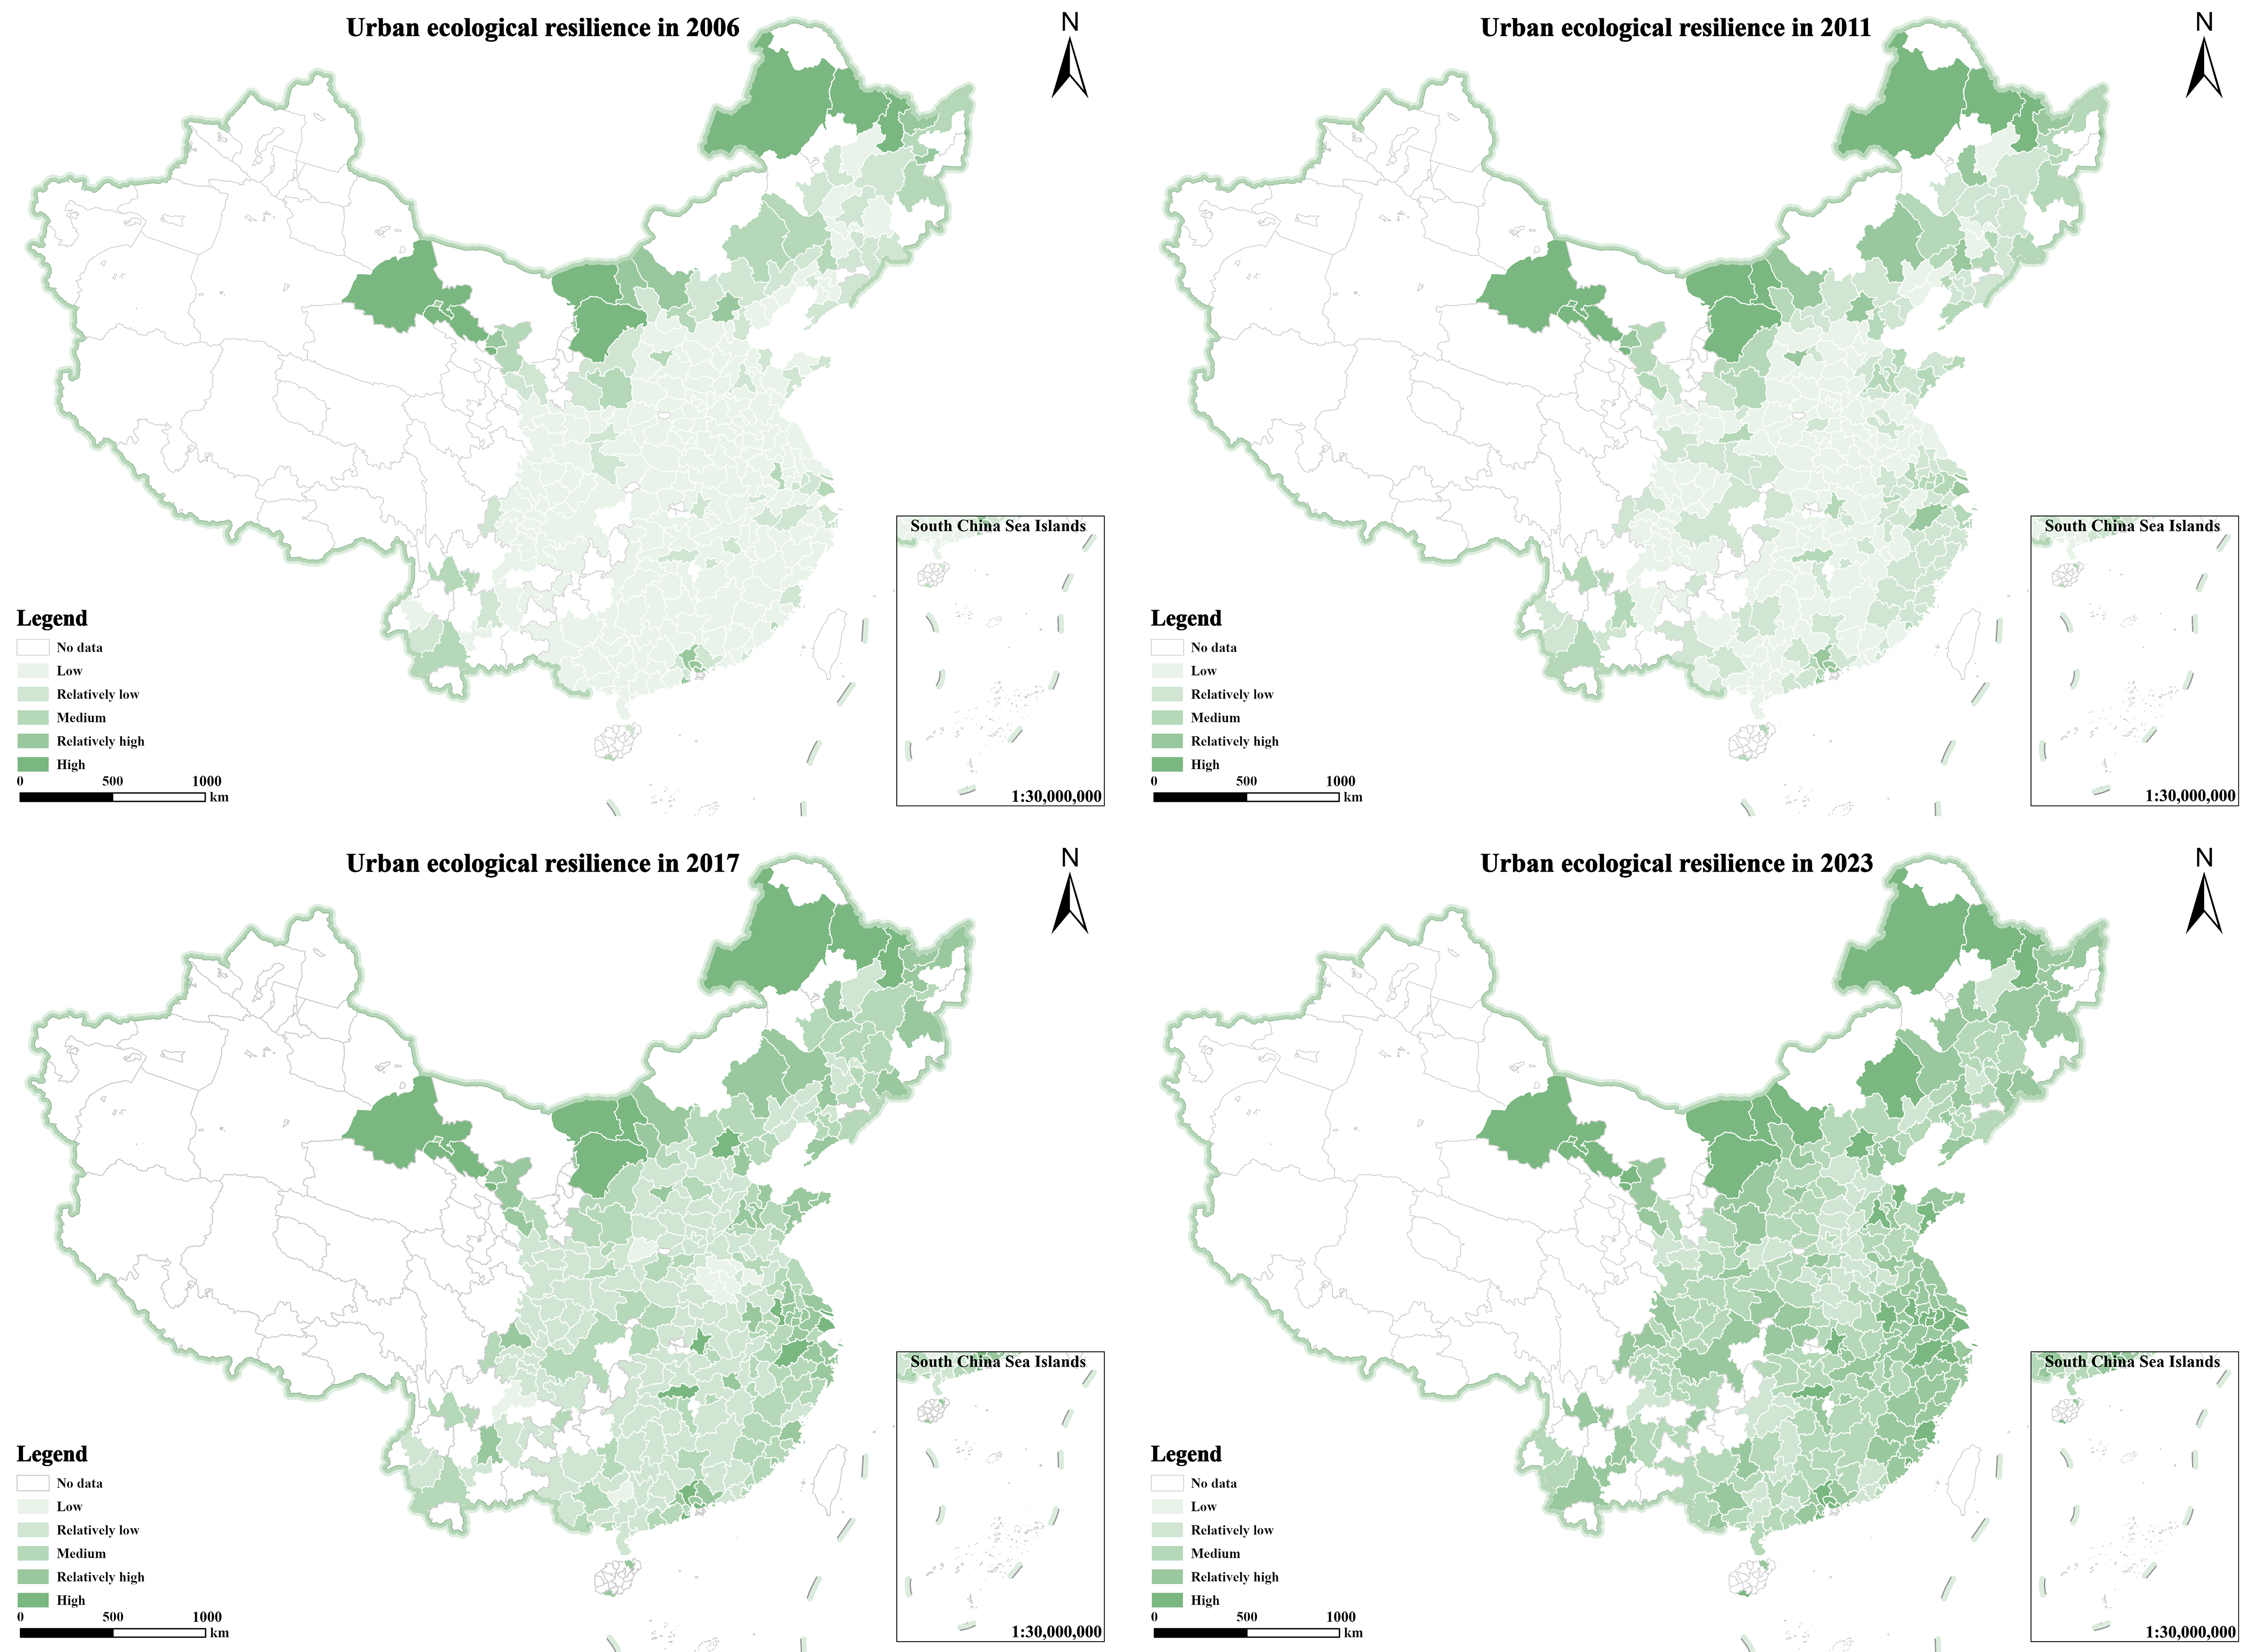
4.1.2. Spatial Distribution Patterns of UER
4.2. Baseline Regression Results
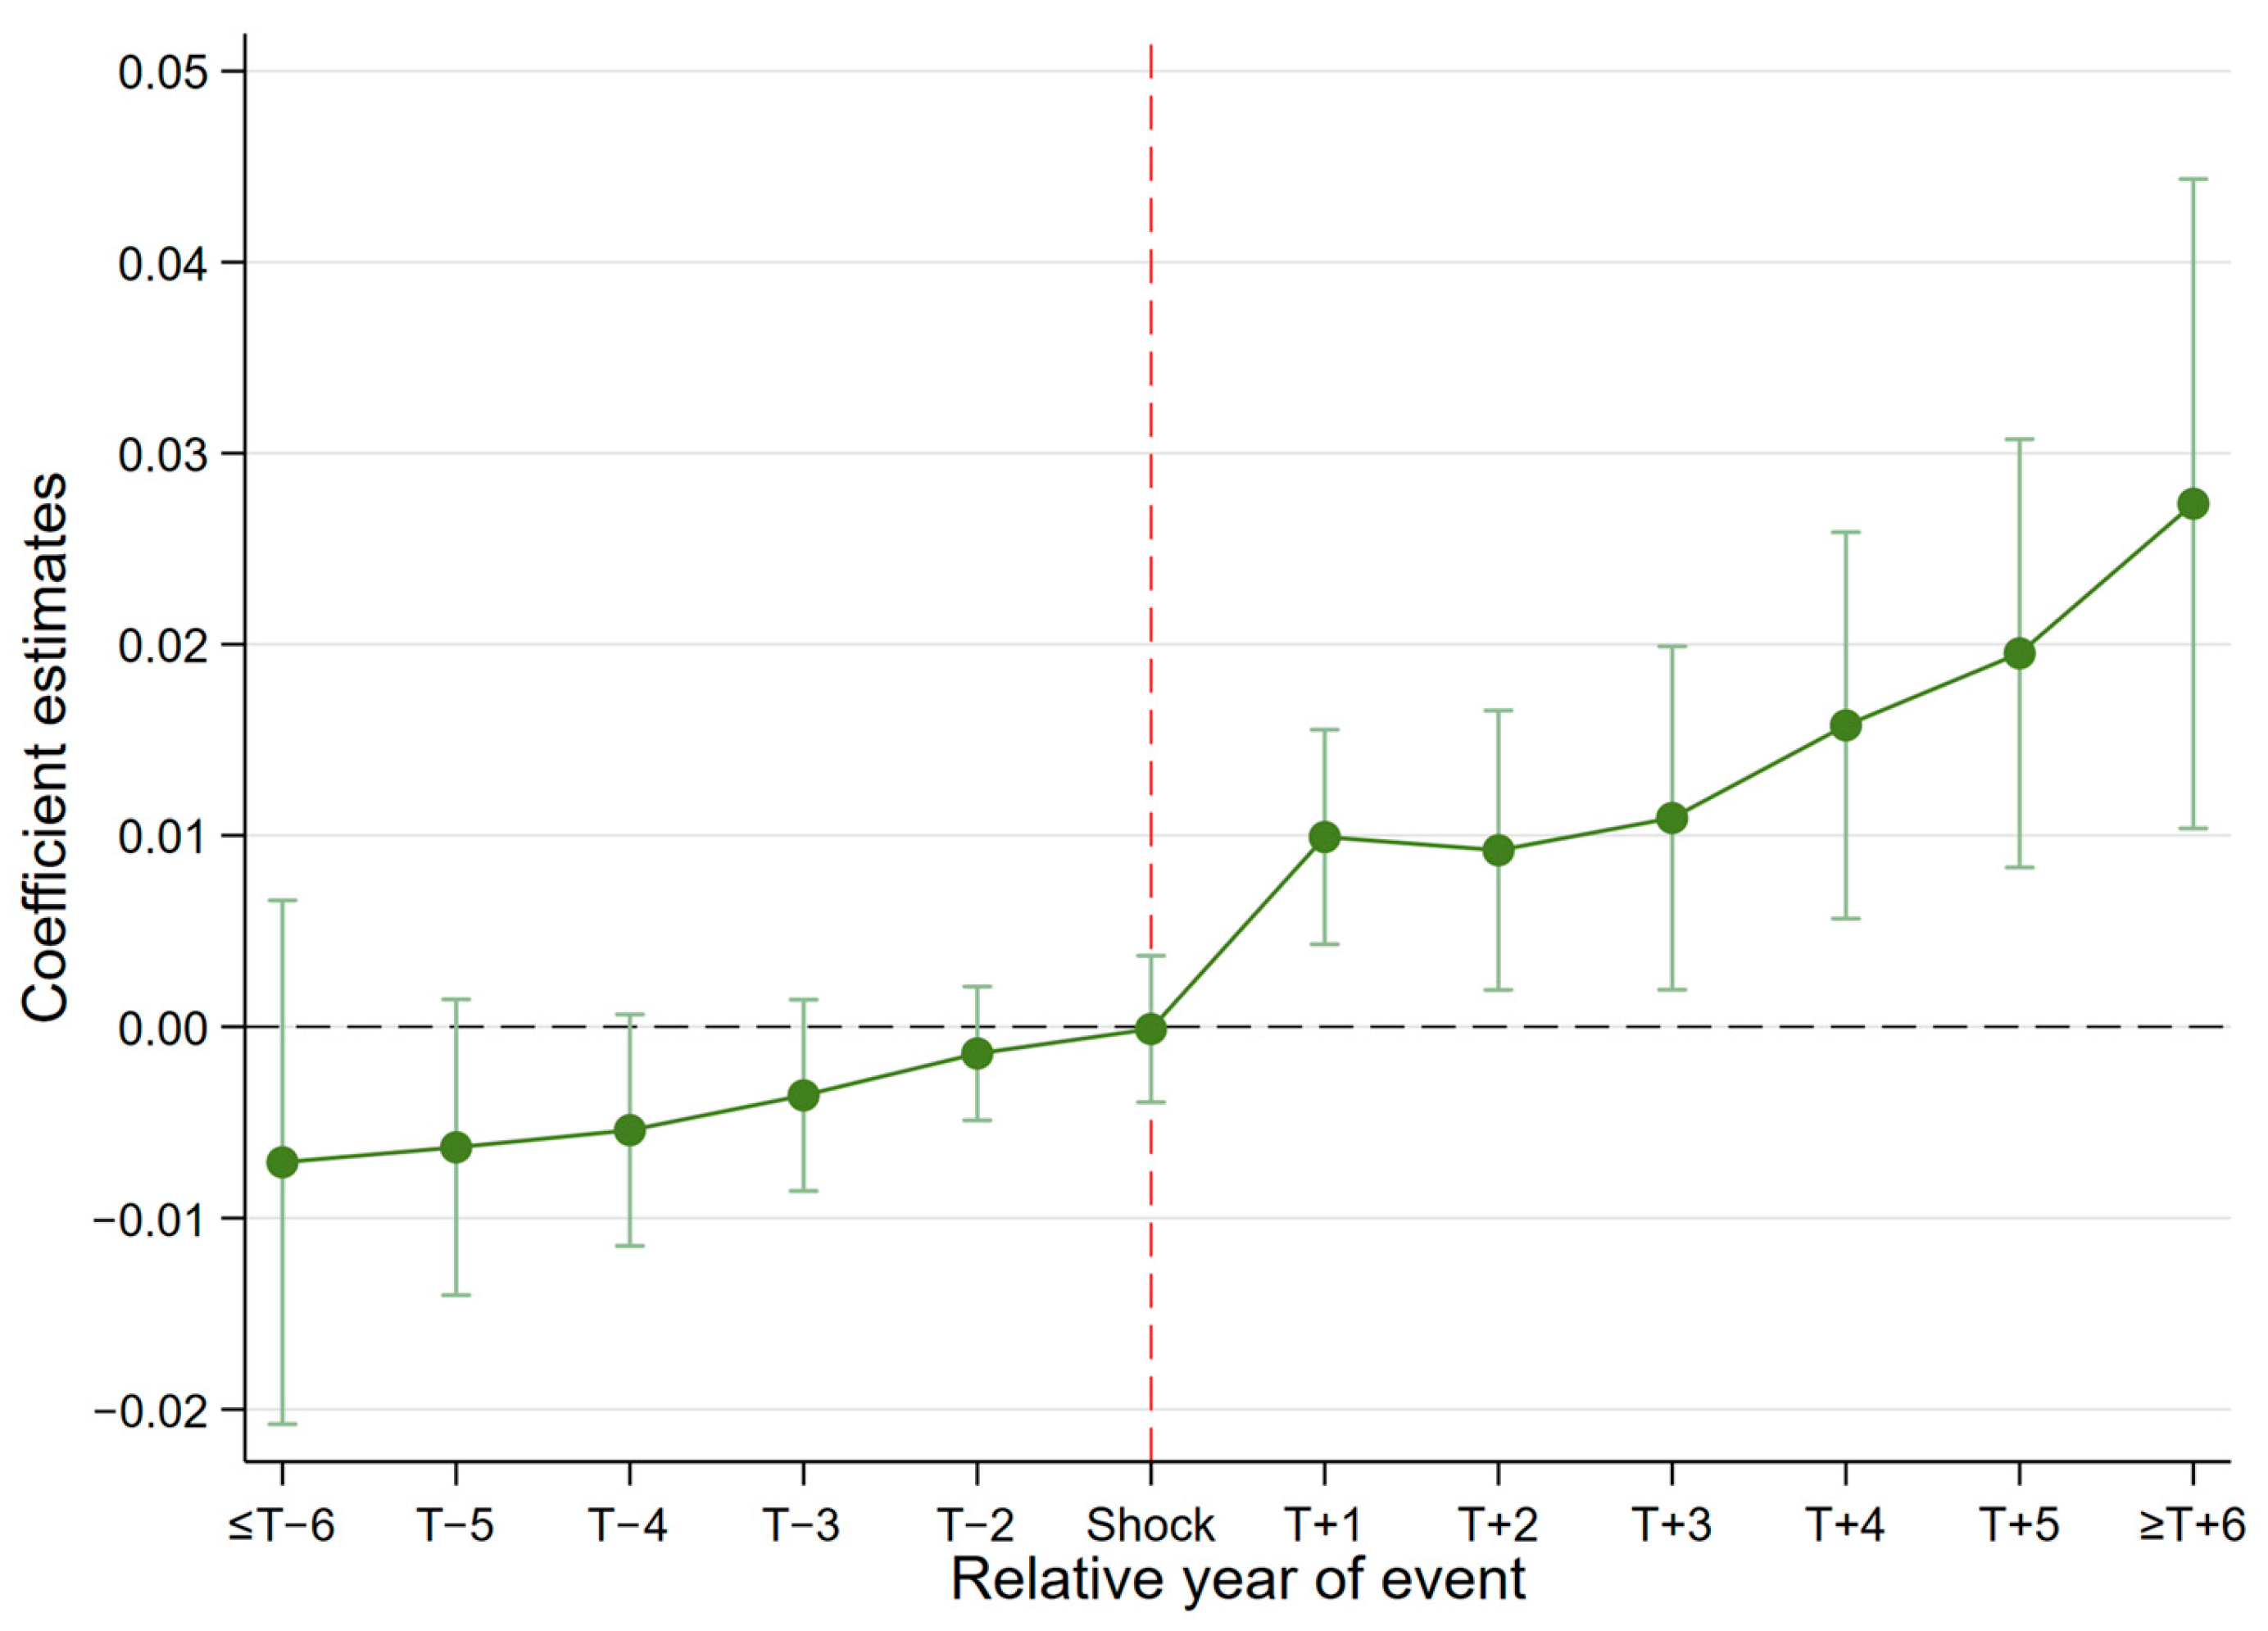
4.3. Parallel Trend Test
4.4. Testing Heterogeneous Treatment Effects Using Modern DID Methods
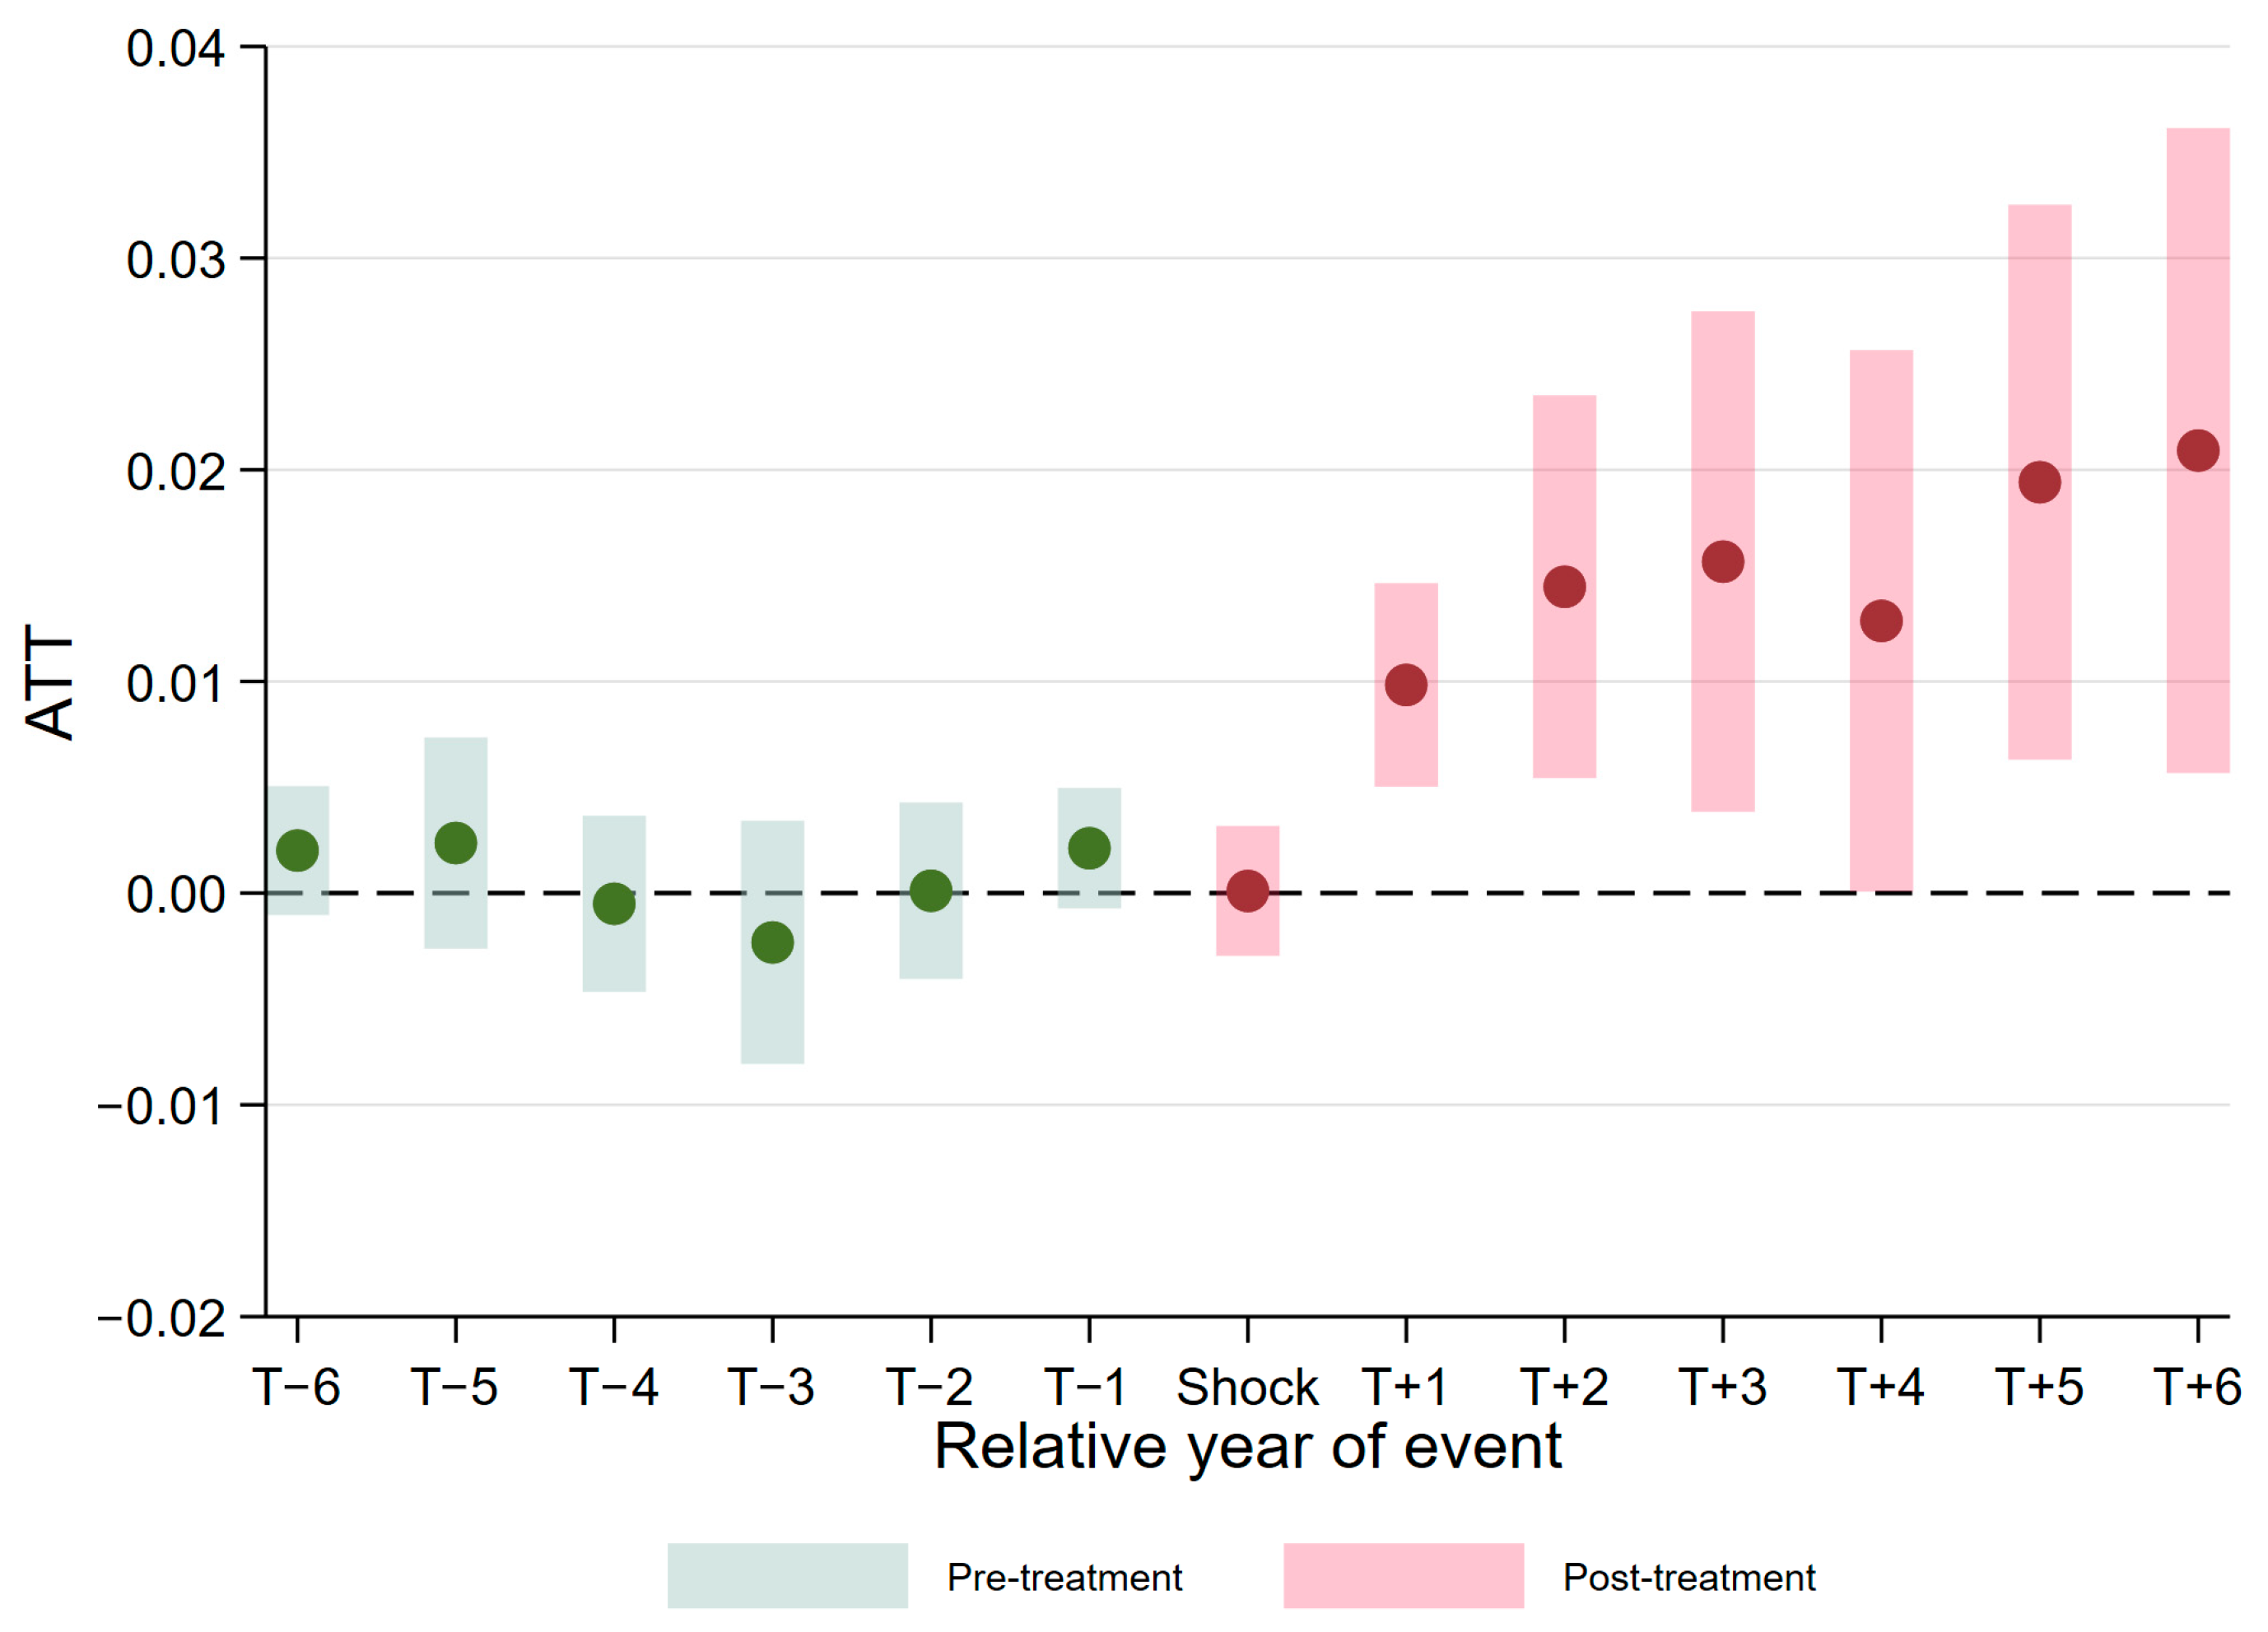
4.4.1. Dynamic Effects Based on CS–DID
4.4.2. Robustness Checks Using Other Modern DID Estimators
4.5. Placebo Test
4.6. PSM–DID
4.7. Comparative Validation and Sensitivity Analysis of the DPRAR Framework
4.8. Additional Robustness Tests
4.8.1. Excluding the Influence of Contemporaneous Policies
4.8.2. Alternative Variable Measurement Method
5. Further Analysis
5.1. Mechanism Analysis
5.2. Heterogeneity Analysis
5.2.1. Regional Heterogeneity
5.2.2. Heterogeneity by Urban Resource Endowment
5.2.3. Heterogeneity by Environmental Regulation Intensity
6. Discussion
6.1. Spatiotemporal Differences in the Evolution of Urban Resilience
6.2. Impact of the NICPP on UER and Its Mechanism Explanation
6.3. Heterogeneity of UER Across Different Types of Cities
7. Conclusions and Implications for Policy
7.1. Main Findings
- (1)
- From 2006 to 2023, UER in Chinese cities continued to increase overall, but regional differentiation remained evident. The spatial evolution pattern was characterized by coastal enhancement, nodal agglomeration, and catch-up in the central region.
- (2)
- The NICPP significantly enhances urban UER. Dynamic effect analysis further revealed that this effect exhibited certain time-lagged and cumulative characteristics.
- (3)
- The mechanism analysis reveals that the NICPP can further positively affect UER by increasing GTIN and improving GTIQ.
- (4)
- A further exploration of heterogeneity reveals that the positive contribution of the NICPP toward UER is stronger across Central and Western China, resource-dependent areas, and cities with stronger environmental regulation.
7.2. Policy Implications
- (1)
- Policy makers should refine the policy design and performance targets of the NICPP. Pilot implementation should avoid placing excessive emphasis on innovation output, economic growth, and industrial expansion, while overlooking urban ecosystem carrying capacity and the quality of green development. In addition to existing indicators of innovation capacity and development performance, the assessment system could incorporate more binding indicators related to resource use efficiency, pollutant emission intensity, green and low-carbon transition outcomes, ecological space protection, and environmental governance performance. Moreover, integrating the NICPP more closely with broader ecological goals is essential. This involves weaving the “dual carbon” agenda, ecological civilization construction, and the push for new quality productive forces into the very fabric of innovative city design. Such alignment would help innovative city construction better coordinate innovation-driven development, green transition, and ecological improvement, which contributes institutional support to the long-term improvement of UER. More broadly, developing countries may draw lessons from the NICPP when designing innovation-oriented institutions to reduce the risk of resource-intensive rebound effects while balancing innovation-driven development with ecological sustainability.
- (2)
- The support structure of the NICPP should be optimized with green technological innovation (GTI) as a key transmission channel, coordinating improvements in both GTIN and GTIQ. GTI should not be assessed by patent volume alone, but also by the share of high-quality invention patents, technology transformation efficiency, and real-world ecological outcomes. Policy support should therefore target key scenarios such as pollution control, energy efficiency improvement, ecological restoration, and green infrastructure construction to strengthen the linkage between green R&D, technology transformation, and urban governance needs, thereby increasing the share of invention patents within overall green technological innovation. By encouraging original R&D over incremental modifications, this approach improves the structure of green innovation and enhances cities’ capacity to recover from and adapt to ecological shocks.
- (3)
- Given the heterogeneity of urban conditions in China, the NICPP should strengthen differentiated policy implementation and targeted support. The government should classify pilot entry thresholds, assessment indicators, and dynamic exit mechanisms according to cities’ innovation foundations, ecological pressures, and governance capacities to avoid simple expansion and homogenized implementation. At the regional level, the eastern region should shift from “incremental expansion” to “quality spillovers”, with a focus on strengthening breakthroughs in key green technologies, cross-city technology commercialization, and experience diffusion. The central region should continue to maintain the policy advantages of the NICPP. Given that the western region faces substantial resource and environmental constraints while increasingly engaging in industrial gradient relocation, local governments should strengthen green innovation infrastructure and improve mechanisms for technology transfer and commercialization. Relevant authorities should promote policy synergy among the NICPP, environmental access regulation, green finance, and industrial upgrading policies, thereby enhancing the GTI and the capacity for green industrial transformation. In the northeastern region, the NICPP should be integrated with the green renewal of old industrial bases and the reconstruction of innovation systems, while obsolete capacity should be withdrawn through stricter regulatory measures. On the basis of the development characteristics of different cities, NICPP policy resources should be prioritized for resource-dependent cities and cities with stronger environmental regulation. The former should focus on clean production transformation, resource recycling, and ecological restoration in mining areas, whereas the latter should strengthen the synergy between innovation incentives and green constraints. For cities with weak environmental regulation foundations that have already been included in the pilot program, shortcomings in governance standards, monitoring capacity, and coordinated enforcement should be addressed as soon as possible.
Supplementary Materials
Author Contributions
Funding
Data Availability Statement
Conflicts of Interest
References
- Deuskar, C.; Murray, S.; Leiva Molano, J.S.; Khan, I.A.; Maria, A. Banking on Cities: Investing in Resilient and Low-Carbon Urbanization; World Bank: Washington, DC, USA, 2025. [Google Scholar] [CrossRef]
- Zhou, X.; Li, M.; Huang, X.; Liu, T.; Zhang, H.; Qi, X.; Wang, Z.; Qin, Y.; Geng, G.; Wang, J.; et al. Urban Meteorology–Chemistry Coupling in Compound Heat–Ozone Extremes. Nat. Cities 2025, 2, 847–856. [Google Scholar] [CrossRef]
- Pérez, P.A.; Quiroz, W.; Echeveste, P. Coupled Pollution and Water Scarcity Heighten Ecological Degradation and Social Vulnerability in Global Dryland Rivers. Environ. Res. 2026, 293, 123708. [Google Scholar] [CrossRef] [PubMed]
- Scrivner, E.; Mladenov, N.; Biggs, T.; Grant, A.; Piazza, E.; Garcia, S.; Lee, C.M.; Ade, C.; Tufillaro, N.; Grötsch, P.; et al. Hyperspectral Characterization of Wastewater in the Tijuana River Estuary Using Laboratory, Field, and EMIT Satellite Spectroscopy. Sci. Total Environ. 2025, 981, 179598. [Google Scholar] [CrossRef] [PubMed]
- Afzal, M.T.; Tripathi, N.K.; Ninsawat, S.; Pal, I. Urban Heatwave Vulnerability Assessment and Ecological Evaluation of Land Use/Land Cover in Karachi, Pakistan: A Developing Megacity Perspective. Environ. Sustain. Indic. 2025, 28, 100965. [Google Scholar] [CrossRef]
- Duan, Z.; Zhu, X. The Carbon Paradox in Urban China: High-Quality Development under the Dual-Control Policy. Sustain. Cities Soc. 2025, 130, 106585. [Google Scholar] [CrossRef]
- Xu, X.; Chen, L.; Du, X.; Chen, Q.; Yuan, R. Development Pathways for Low Carbon Cities in China: A Dual Perspective of Effectiveness and Efficiency. Ecol. Indic. 2024, 169, 112848. [Google Scholar] [CrossRef]
- Chen, F.; Zhu, L.; Zhang, H.; Li, Y. Innovation-Driven Cities: Reconciling Economic Growth and Ecological Sustainability. Sustain. Cities Soc. 2025, 121, 106230. [Google Scholar] [CrossRef]
- Meerow, S.; Newell, J.P.; Stults, M. Defining Urban Resilience: A Review. Landsc. Urban Plan. 2016, 147, 38–49. [Google Scholar] [CrossRef]
- Yin, S.; Zhou, Y.; Zhang, C.; Wu, N. Impact of Regional Integration Policy on Urban Ecological Resilience: A Case Study of the Yangtze River Delta Region, China. J. Clean. Prod. 2024, 485, 144375. [Google Scholar] [CrossRef]
- Feng, X.; Zeng, F.; Loo, B.P.Y.; Zhong, Y. The Evolution of Urban Ecological Resilience: An Evaluation Framework Based on Vulnerability, Sensitivity and Self-Organization. Sustain. Cities Soc. 2024, 116, 105933. [Google Scholar] [CrossRef]
- Sa, H.; Chang, W.; Wu, Q. Spatio-Temporal Evolution and Influencing Factors of Ecological Resilience: A Human-Land Relationship Perspective. Land 2026, 15, 433. [Google Scholar] [CrossRef]
- Zhao, R.; Fang, C.; Liu, H.; Liu, X. Evaluating Urban Ecosystem Resilience Using the DPSIR Framework and the ENA Model: A Case Study of 35 Cities in China. Sustain. Cities Soc. 2021, 72, 102997. [Google Scholar] [CrossRef]
- Xu, C.; Huo, X.; Hong, Y.; Yu, C.; de Jong, M.; Cheng, B. How Urban Greening Policy Affects Urban Ecological Resilience: Quasi-Natural Experimental Evidence from Three Megacity Clusters in China. J. Clean. Prod. 2024, 452, 142233. [Google Scholar] [CrossRef]
- Lan, C.; Li, X.; Peng, B.; Li, X. Unlocking Urban Ecological Resilience: The Dual Role of Environmental Regulation and Green Technology Innovation. Sustain. Cities Soc. 2025, 128, 106466. [Google Scholar] [CrossRef]
- Lee, C.-C.; Yan, J.; Li, T. Ecological Resilience of City Clusters in the Middle Reaches of Yangtze River. J. Clean. Prod. 2024, 443, 141082. [Google Scholar] [CrossRef]
- Zhong, X.; Zheng, R.; Chen, W.; Lv, L.; Wei, Z. Regional Differences, Dynamic Evolution, and Driving Factors of Ecological Resilience in China’s Urban Agglomerations. Sci. Rep. 2025, 15, 36791. [Google Scholar] [CrossRef] [PubMed]
- Gao, K.; Yuan, Y. Government Intervention, Spillover Effect and Urban Innovation Performance: Empirical Evidence from National Innovative City Pilot Policy in China. Technol. Soc. 2022, 70, 102035. [Google Scholar] [CrossRef]
- Zhang, S.; Wang, X. Does Innovative City Construction Improve the Industry–University–Research Knowledge Flow in Urban China? Technol. Forecast. Soc. Change 2022, 174, 121200. [Google Scholar] [CrossRef]
- Xu, Y.; Wang, Z.-C.; Tao, C.-Q. Can Innovative Pilot City Policies Improve the Allocation Level of Innovation Factors?—Evidence from China. Technol. Forecast. Soc. Change 2024, 200, 123135. [Google Scholar] [CrossRef]
- Zhao, W.; Toh, M.Y. Impact of Innovative City Pilot Policy on Industrial Structure Upgrading in China. Sustainability 2023, 15, 7377. [Google Scholar] [CrossRef]
- Zuo, X.; Zhang, X. How Do Innovation-Driven Policies Affect Urban Green Land Use Efficiency? Evidence from China’s Innovative City Pilot Policy. Land 2025, 14, 1034. [Google Scholar] [CrossRef]
- Qin, Y.; Zhang, H.; Liang, W. Can Dual-Pilot Policy of Innovative City and Carbon Trading Promote Carbon Productivity? Empirical Evidence from Dual-Pilot City in China. Technol. Forecast. Soc. Change 2025, 221, 124360. [Google Scholar] [CrossRef]
- Gupta, J.; Scholtens, J.; Perch, L.; Dankelman, I.; Seager, J.; Sánder, F.; Stanley-Jones, M.; Kempf, I. Re-Imagining the Driver–Pressure–State–Impact–Response Framework from an Equity and Inclusive Development Perspective. Sustain. Sci. 2020, 15, 503–520. [Google Scholar] [CrossRef]
- Gao, K.; Yuan, Y. The Effect of Innovation-Driven Development on Pollution Reduction: Empirical Evidence from a Quasi-Natural Experiment in China. Technol. Forecast. Soc. Change 2021, 172, 121047. [Google Scholar] [CrossRef]
- Fan, M.; Zhang, Z.; Wei, Y.; Sun, S. Does Innovative City Pilot Policy Improve Carbon Reduction? Quasi-Experimental Evidence from China. Environ. Res. 2024, 262, 119748. [Google Scholar] [CrossRef] [PubMed]
- Li, Z.; Lin, B. Quantity or Quality? The Impact Assessment of Environmental Regulation on Green Innovation. Environ. Impact Assess. Rev. 2025, 110, 107726. [Google Scholar] [CrossRef]
- Dang, J.; Motohashi, K. Patent Statistics: A Good Indicator for Innovation in China? Patent Subsidy Program Impacts on Patent Quality. China Econ. Rev. 2015, 35, 137–155. [Google Scholar] [CrossRef]
- Li, L.; Li, M.; Ma, S.; Zheng, Y.; Pan, C. Does the Construction of Innovative Cities Promote Urban Green Innovation? J. Environ. Manag. 2022, 318, 115605. [Google Scholar] [CrossRef] [PubMed]
- Borrás, S.; Edquist, C. The Choice of Innovation Policy Instruments. Technol. Forecast. Soc. Change 2013, 80, 1513–1522. [Google Scholar] [CrossRef]
- Herring, H.; Roy, R. Technological Innovation, Energy Efficient Design and the Rebound Effect. Technovation 2007, 27, 194–203. [Google Scholar] [CrossRef]
- Akcigit, U.; Hanley, D.; Serrano-Velarde, N. Back to Basics: Basic Research Spillovers, Innovation Policy, and Growth. Rev. Econ. Stud. 2021, 88, 1–43. [Google Scholar] [CrossRef]
- Porter, M.E.; Linde, C.V.D. Toward a New Conception of the Environment-Competitiveness Relationship. J. Econ. Perspect. 1995, 9, 97–118. [Google Scholar] [CrossRef]
- Mbanyele, W.; Wang, F. Environmental Regulation and Technological Innovation: Evidence from China. Environ. Sci. Pollut. Res. 2022, 29, 12890–12910. [Google Scholar] [CrossRef] [PubMed]
- Meng, F.; Xu, Y.; Zhao, G. Environmental Regulations, Green Innovation and Intelligent Upgrading of Manufacturing Enterprises: Evidence from China. Sci. Rep. 2020, 10, 14485. [Google Scholar] [CrossRef] [PubMed]
- Lv, C.; Shao, C.; Lee, C.-C. Green Technology Innovation and Financial Development: Do Environmental Regulation and Innovation Output Matter? Energy Econ. 2021, 98, 105237. [Google Scholar] [CrossRef]
- Jaffe, A.B.; Newell, R.G.; Stavins, R.N. A Tale of Two Market Failures: Technology and Environmental Policy. Ecol. Econ. 2005, 54, 164–174. [Google Scholar] [CrossRef]
- Ramanathan, R.; He, Q.; Black, A.; Ghobadian, A.; Gallear, D. Environmental Regulations, Innovation and Firm Performance: A Revisit of the Porter Hypothesis. J. Clean. Prod. 2017, 155, 79–92. [Google Scholar] [CrossRef]
- Chen, T.; Li, Y.; Zhang, Y.; Ji, H.; Wang, X.; He, J.; Liu, Q.; Zhang, H. Coupling Renewable Energy with Urban Greening: Quantifying the Sustainable Development Potential of Photovoltaic-Green Roofs. Sustain. Cities Soc. 2025, 133, 106866. [Google Scholar] [CrossRef]
- Zhang, H.; Li, X.; Zhu, J. Blockchain-Enabled Governance of Greenwashing in the Building Material Supply Chain: A Differential Game Approach. J. Build. Eng. 2025, 114, 114021. [Google Scholar] [CrossRef]
- Hafez, F.S.; Sa’di, B.; Safa-Gamal, M.; Taufiq-Yap, Y.H.; Alrifaey, M.; Seyedmahmoudian, M.; Stojcevski, A.; Horan, B.; Mekhilef, S. Energy Efficiency in Sustainable Buildings: A Systematic Review with Taxonomy, Challenges, Motivations, Methodological Aspects, Recommendations, and Pathways for Future Research. Energy Strategy Rev. 2023, 45, 101013. [Google Scholar] [CrossRef]
- Wu, K.; Ding, J.; Lin, J.; Zheng, G.; Sun, Y.; Fang, J.; Xu, T.; Zhu, Y.; Gu, B. Big-Data Empowered Traffic Signal Control Could Reduce Urban Carbon Emission. Nat. Commun. 2025, 16, 2013. [Google Scholar] [CrossRef] [PubMed]
- Zhou, Y.; Wu, N.; Zhang, C.; Wang, Q.; Chen, Z.; Yin, S. How Green Technological Innovation Shapes Urban Ecological Resilience: Structural, Governance, and Fiscal Pathways in the Yangtze River Economic Belt. J. Clean. Prod. 2026, 543, 147607. [Google Scholar] [CrossRef]
- Rodriguez, M.; Fu, G.; Butler, D.; Yuan, Z.; Cook, L. The Effect of Green Infrastructure on Resilience Performance in Combined Sewer Systems under Climate Change. J. Environ. Manag. 2024, 353, 120229. [Google Scholar] [CrossRef] [PubMed]
- Wan, P.; Zhang, H. Enhancing Urban Water Ecological Resilience through Sponge City Initiatives: Evidence from China. Urban Clim. 2026, 65, 102755. [Google Scholar] [CrossRef]
- Lee, H.; Sam, K.; Coulon, F.; De Gisi, S.; Notarnicola, M.; Labianca, C. Recent Developments and Prospects of Sustainable Remediation Treatments for Major Contaminants in Soil: A Review. Sci. Total Environ. 2024, 912, 168769. [Google Scholar] [CrossRef] [PubMed]
- Rodrigues, B.N.; Favoreti, A.L.F.; Molina Júnior, V.E.; Silva, C.M.; Canteras, F.B. Green Infrastructure for Urban Climate Mitigation and Adaptation: Methods, Strategies, and Typology Selection Based on Ecosystem Services. Int. J. Environ. Sci. Technol. 2025, 22, 17383–17404. [Google Scholar] [CrossRef]
- Xiao, J.; Lu, Y.; Yu, J.; Yu, M.; Xiao, X.; Shah, S.P. Post-Earthquake Construction Waste Reuse: Advancing Green Reconstruction and Sustainability. Low-Carbon Mater. Green Constr. 2025, 3, 2. [Google Scholar] [CrossRef]
- He, S.; Liu, J.; Ying, Q. Externalities of Government-Oriented Support for Innovation: Evidence from the National Innovative City Pilot Policy in China. Econ. Model. 2023, 128, 106503. [Google Scholar] [CrossRef]
- Liu, Y.; Deng, W.; Wen, H.; Li, S. Promoting Green Technology Innovation through Policy Synergy: Evidence from the Dual Pilot Policy of Low-Carbon City and Innovative City. Econ. Anal. Policy 2024, 84, 957–977. [Google Scholar] [CrossRef]
- Frondel, M.; Horbach, J.; Rennings, K. End-of-Pipe or Cleaner Production? An Empirical Comparison of Environmental Innovation Decisions across OECD Countries. Bus. Strategy Environ. 2007, 16, 571–584. [Google Scholar] [CrossRef]
- Cheng, Y.; Du, K.; Yao, X. Stringent Environmental Regulation and Inconsistent Green Innovation Behavior: Evidence from Air Pollution Prevention and Control Action Plan in China. Energy Econ. 2023, 120, 106571. [Google Scholar] [CrossRef]
- Miao, C.; Chen, Z.; Zhang, A. Green Technology Innovation and Carbon Emission Efficiency: The Moderating Role of Environmental Uncertainty. Sci. Total Environ. 2024, 938, 173551. [Google Scholar] [CrossRef] [PubMed]
- Dai, L.; Yang, A.; Song, G. Regional Synergy between Green Technology Innovation and Low Carbon Development in China: A Quantitative Study of Provinces and Economic Belts. Energy Rep. 2025, 13, 1085–1094. [Google Scholar] [CrossRef]
- Liu, H.; Cai, X.; Zhang, Z.; Wang, D. Can Green Technology Innovations Achieve the Collaborative Management of Pollution Reduction and Carbon Emissions Reduction? Evidence from the Chinese Industrial Sector. Environ. Res. 2025, 264, 120400. [Google Scholar] [CrossRef] [PubMed]
- Huang, Y.; Lu, S.; He, Z.; Ma, S.; Yu, H.; Pan, X.; Huang, W. Establishment and Application of Safety Evacuation Scheme Evaluation Model with Entropy Weight and TOPSIS for University Dormitories in China. Sci. Rep. 2026, 16, 6824. [Google Scholar] [CrossRef] [PubMed]
- Chen, J.-Q.; He, Y.-L.; Cheng, Y.-C.; Fournier-Viger, P.; Huang, J.Z. A Multiple Kernel-Based Kernel Density Estimator for Multimodal Probability Density Functions. Eng. Appl. Artif. Intell. 2024, 132, 107979. [Google Scholar] [CrossRef]
- Silverman, B.W. Using Kernel Density Estimates to Investigate Multimodality. J. R. Stat. Soc. Ser. B (Methodol.) 1981, 43, 97–99. [Google Scholar] [CrossRef]
- Tao, M.; Wen, L.; Sheng, M.S.; Poletti, S. Appraising the Role of Energy Conservation and Emission Reduction Policy for Eco-Friendly Productivity Improvements: An Entropy-Balancing DID Approach. Energy Econ. 2024, 132, 107422. [Google Scholar] [CrossRef]
- Beck, T.; Levine, R.; Levkov, A. Big Bad Banks? The Winners and Losers from Bank Deregulation in the United States. J. Financ. 2010, 65, 1637–1667. [Google Scholar] [CrossRef]
- Hainmueller, J. Entropy Balancing for Causal Effects: A Multivariate Reweighting Method to Produce Balanced Samples in Observational Studies. Polit. Anal. 2012, 20, 25–46. [Google Scholar] [CrossRef]
- Cao, J.; Li, W.; Bilokha, A. Low-Carbon City Initiatives and Analyst Behaviour: A Quasi-Natural Experiment. J. Financ. Stab. 2022, 62, 101042. [Google Scholar] [CrossRef]
- Basu, R.; Naughton, J.P.; Wang, C. The Regulatory Role of Credit Ratings and Voluntary Disclosure. Account. Rev. 2022, 97, 25–50. [Google Scholar] [CrossRef]
- Kurz, C.F.; Krzywinski, M.; Altman, N. Propensity Score Weighting. Nat. Methods 2025, 22, 638–640. [Google Scholar] [CrossRef] [PubMed]
- Goodman-Bacon, A. Difference-in-Differences with Variation in Treatment Timing. J. Econom. 2021, 225, 254–277. [Google Scholar] [CrossRef]
- Callaway, B.; Sant’Anna, P.H.C. Difference-in-Differences with Multiple Time Periods. J. Econom. 2021, 225, 200–230. [Google Scholar] [CrossRef]
- Sant’Anna, P.H.C.; Zhao, J. Doubly Robust Difference-in-Differences Estimators. J. Econom. 2020, 219, 101–122. [Google Scholar] [CrossRef]
- Wu, X.; Li, M.; Chen, Z.; Li, Q.; Feng, H. An Explainable Machine Learning Framework Coupled with the PLUS Model for Ecological Resilience Simulation and Zoning under SSP-RCP Scenarios: A Case Study in Eastern Jilin, China. Environ. Model. Softw. 2026, 200, 106952. [Google Scholar] [CrossRef]
- Wei, Y.; Zhu, X.; Li, Y.; Yao, T.; Tao, Y. Influential Factors of National and Regional CO2 Emission in China Based on Combined Model of DPSIR and PLS-SEM. J. Clean. Prod. 2019, 212, 698–712. [Google Scholar] [CrossRef]
- Li, C.; Wang, Y.; Qing, W.; Li, C.; Yang, Y. Differential Evaluation of Ecological Resilience in 45 Cities along the Yangtze River in China: A New Multidimensional Analysis Framework. Land 2024, 13, 1588. [Google Scholar] [CrossRef]
- Li, G.; Wang, L. Study of Regional Variations and Convergence in Ecological Resilience of Chinese Cities. Ecol. Indic. 2023, 154, 110667. [Google Scholar] [CrossRef]
- Huang, J.; Zhong, P.; Zhang, J.; Zhang, L. Spatial-Temporal Differentiation and Driving Factors of Ecological Resilience in the Yellow River Basin, China. Ecol. Indic. 2023, 154, 110763. [Google Scholar] [CrossRef]
- Zhang, R.; Wen, L.; Jin, Y.; Zhang, A.; Gil, J.M. Synergistic Impacts of Carbon Emission Trading Policy and Innovative City Pilot Policy on Urban Land Green Use Efficiency in China. Sustain. Cities Soc. 2025, 118, 105955. [Google Scholar] [CrossRef]
- Zhang, X. Research on the Dynamic Mechanism of Digital Economy System Coupling to Enhance Urban Ecological Resilience. Environ. Sci. Pollut. Res. 2024, 31, 22507–22527. [Google Scholar] [CrossRef] [PubMed]
- Alsubaie, M.S.; Tanveer, M.; Mahmood, H. The Moderating Effect of Geopolitical Risk in the Nexus between Trade Openness, FDI, and Carbon Emissions in Saudi Arabia. Environ. Sustain. Indic. 2025, 28, 100967. [Google Scholar] [CrossRef]
- Du, X.; Qin, Y.; Xie, Y. Green Regulation, Trade Friendliness, and Local Policy Adaptation. J. Environ. Econ. Manag. 2026, 135, 103262. [Google Scholar] [CrossRef]
- Guo, D.; Qiao, L. Government Environmental Concern and Urban Green Development Efficiency: Structural and Technological Perspectives. J. Clean. Prod. 2024, 450, 142016. [Google Scholar] [CrossRef]
- Ahmad, M.; Satrovic, E. Role of Economic Complexity and Government Intervention in Environmental Sustainability: Is Decentralization Critical? J. Clean. Prod. 2023, 418, 138000. [Google Scholar] [CrossRef]
- McDonald, R.I.; Mansur, A.V.; Ascensão, F.; Colbert, M.; Crossman, K.; Elmqvist, T.; Gonzalez, A.; Güneralp, B.; Haase, D.; Hamann, M.; et al. Research Gaps in Knowledge of the Impact of Urban Growth on Biodiversity. Nat. Sustain. 2020, 3, 16–24. [Google Scholar] [CrossRef]
- Jiang, W.; Wang, K.-L.; Miao, Z. How Does Internet Development Affect Urban Eco-Resilience: Evidence from China. Econ. Change Restruct. 2024, 57, 49. [Google Scholar] [CrossRef]
- Fu, S.; Liu, J.; Wang, J.; Tian, J.; Li, X. Enhancing Urban Ecological Resilience through Integrated Green Technology Progress: Evidence from Chinese Cities. Environ. Sci. Pollut. Res. 2024, 31, 36349–36366. [Google Scholar] [CrossRef] [PubMed]
- Guo, J.; Tan, X.; Cheng, Y.; Chen, X. Financing Climate-Resilient Infrastructure through Long-Term Green Bond. Ecol. Econ. 2026, 239, 108757. [Google Scholar] [CrossRef]
- Lei, H.; Gao, R.; Ning, C.; Sun, G. Green Finance and Corporate Green Innovation. Financ. Res. Lett. 2025, 72, 106577. [Google Scholar] [CrossRef]
- de Rassenfosse, G.; Dernis, H.; Guellec, D.; Picci, L.; van Pottelsberghe de la Potterie, B. The Worldwide Count of Priority Patents: A New Indicator of Inventive Activity. Res. Policy 2013, 42, 720–737. [Google Scholar] [CrossRef]
- Nagaoka, S.; Yamauchi, I. Information Constraints and Examination Quality in Patent Offices: The Effect of Initiation Lags. Int. J. Ind. Organ. 2022, 82, 102839. [Google Scholar] [CrossRef]
- Borusyak, K.; Jaravel, X.; Spiess, J. Revisiting Event-Study Designs: Robust and Efficient Estimation. Rev. Econ. Stud. 2024, 91, 3253–3285. [Google Scholar] [CrossRef]
- Gardner, J. Two-Stage Differences in Differences. arXiv 2022, arXiv:2207.05943. [Google Scholar] [CrossRef]
- Hagemann, A. Placebo Inference on Treatment Effects When the Number of Clusters Is Small. J. Econom. 2019, 213, 190–209. [Google Scholar] [CrossRef]
- Qi, Y.; Tang, Y.; Bai, T. Impact of Smart City Pilot Policy on Heterogeneous Green Innovation: Micro-Evidence from Chinese Listed Enterprises. Econ. Change Restruct. 2024, 57, 67. [Google Scholar] [CrossRef]
- Han, H.; Gu, R.; Yang, Y. Impacts of Low-Carbon City Pilot Policy on Ecological Well-Being Performance across Chinese Cities: A Spatial Difference-in-Difference Analysis. Sustain. Cities Soc. 2025, 118, 105864. [Google Scholar] [CrossRef]
- Lu, H.; Cheng, Z.; Yao, Z.; Xue, A. Impacts of Pilot Carbon Emission Trading Policies on Urban Environmental Pollution: Evidence from China. J. Environ. Manag. 2024, 359, 121016. [Google Scholar] [CrossRef] [PubMed]
- Zhang, Y.; Wang, C.; Liu, X.; Zhang, X.; Dagestani, A.A. Does the National Ecological Civilization Pilot Zone Achieve a “Win-Win” Circumstance for the Environment and the Economy: Empirical Evidence from China. Appl. Econ. 2025, 57, 10771–10787. [Google Scholar] [CrossRef]
- Jiang, T. Mediating Effects and Moderating Effects in Causal Inference. China Ind. Econ. 2022, 5, 100–120. [Google Scholar] [CrossRef]
- Ononogbo, C.; Nwosu, E.C.; Nwakuba, N.R.; Nwaji, G.N.; Nwufo, O.C.; Chukwuezie, O.C.; Chukwu, M.M.; Anyanwu, E.E. Opportunities of Waste Heat Recovery from Various Sources: Review of Technologies and Implementation. Heliyon 2023, 9, e13590. [Google Scholar] [CrossRef] [PubMed]
- Lu, X.; Lu, Z. How Does Green Technology Innovation Affect Urban Carbon Emissions? Evidence from Chinese Cities. Energy Build. 2024, 325, 115025. [Google Scholar] [CrossRef]
- Wang, N.; Wei, C.; Zhao, X.; Wang, S.; Ren, Z.; Ni, R. Does Green Technology Innovation Reduce Anthropogenic PM2.5 Emissions? Evidence from China’s Cities. Atmos. Pollut. Res. 2023, 14, 101699. [Google Scholar] [CrossRef]
- Anas, M.; Zhang, W.; Bakhsh, S.; Ali, L.; Işık, C.; Han, J.; Liu, X.; Rehman, H.U.; Ali, A.; Huang, M. Moving towards Sustainable Environment Development in Emerging Economies: The Role of Green Finance, Green Tech-innovation, Natural Resource Depletion, and Forested Area in Assessing the Load Capacity Factor. Sustain. Dev. 2024, 32, 3004–3020. [Google Scholar] [CrossRef]
- Hunjra, A.I.; Zhao, S.; Tan, Y.; Bouri, E.; Liu, X. How Do Green Innovations Promote Regional Green Total Factor Productivity? Multidimensional Analysis of Heterogeneity, Spatiality and Nonlinearity. J. Clean. Prod. 2024, 467, 142935. [Google Scholar] [CrossRef]
- Zheng, J.; Yuan, B.; Wu, J.; Chen, S. The Impact of Manufacturing Agglomeration on Green Development Performance: Evidence from the Yangtze River Economic Belt in China. J. Clean. Prod. 2024, 471, 143407. [Google Scholar] [CrossRef]
- Wang, Z.; Wu, G.; Miao, Z.; Liu, Y.; Guo, A. How Resource-Exhausted City Transition Program Enable Green Technological Innovation: Evidence from County-Level Macro and Micro Perspectives in China. Energy 2025, 337, 138503. [Google Scholar] [CrossRef]
- Zhou, X.; Wang, H.; Duan, Z.; Zhou, G. Exploring the Impacts of Urbanization on Ecological Resilience from a Spatiotemporal Heterogeneity Perspective: Evidence from 254 Cities in China. Environ. Dev. Sustain. 2024. [Google Scholar] [CrossRef]
- Tian, M.; Sun, Z. Does the Innovative City Pilot Policy Improve Urban Resilience? Evidence from China. Sustainability 2024, 16, 9985. [Google Scholar] [CrossRef]
- Fan, F.; Zhang, K.; Dai, S.; Wang, X. Decoupling Analysis and Rebound Effect between China’s Urban Innovation Capability and Resource Consumption. Technol. Anal. Strateg. Manag. 2023, 35, 478–492. [Google Scholar] [CrossRef]
- Cao, X.; Liu, M.; Du, H. Green Finance and Urban Economic Resilience. Financ. Res. Lett. 2026, 87, 109001. [Google Scholar] [CrossRef]
- Yu, Y.; Xu, N. Making Data More Open and Green: A Study on the Pathways of Public Data Platform Opening to Enhance Urban Ecological Resilience. Sustainability 2026, 18, 2764. [Google Scholar] [CrossRef]
- Zhang, M.; Hong, Y.; Zhu, B. Does National Innovative City Pilot Policy Promote Green Technology Progress? Evidence from China. J. Clean. Prod. 2022, 363, 132461. [Google Scholar] [CrossRef]
- Liu, B.; Li, Z.; Yang, X.; Wang, J.; Qiu, Z. National Innovative City and Green Technology Progress: Empirical Evidence from China. Environ. Sci. Pollut. Res. 2023, 31, 36311–36328. [Google Scholar] [CrossRef] [PubMed]
- Fu, L.; Han, X.; Peng, J. The Impact of Innovation-Driven Policies on Urban Resilience. Humanit. Soc. Sci. Commun. 2025, 12, 484. [Google Scholar] [CrossRef]
- Zhang, R.; Ying, W.; Wu, K.; Sun, H. The Impact of Innovative Human Capital Agglomeration on Urban Green Development Efficiency: Based on Panel Data of 278 Cities in China. Sustain. Cities Soc. 2024, 111, 105566. [Google Scholar] [CrossRef]
- Zhang, X.; Wang, X.; Tang, C.; Lv, T.; Peng, S.; Wang, Z.; Meng, B. China’s Cross-Regional Carbon Emission Spillover Effects of Urbanization and Industrial Shifting. J. Clean. Prod. 2024, 439, 140854. [Google Scholar] [CrossRef]
- Wang, Z.; Chen, S.; Cui, C.; Liu, Q.; Deng, L. Industry Relocation or Emission Relocation? Visualizing and Decomposing the Dislocation between China’s Economy and Carbon Emissions. J. Clean. Prod. 2019, 208, 1109–1119. [Google Scholar] [CrossRef]
- Yue, L.; Miao, J.; Ahmad, F.; Draz, M.U.; Guan, H.; Chandio, A.A.; Abid, N. Investigating the Role of International Industrial Transfer and Technology Spillovers on Industrial Land Production Efficiency: Fresh Evidence Based on Directional Distance Functions for Chinese Provinces. J. Clean. Prod. 2022, 340, 130814. [Google Scholar] [CrossRef]
- Zheng, H.; Ge, L. Carbon Emissions Reduction Effects of Sustainable Development Policy in Resource-Based Cities from the Perspective of Resource Dependence: Theory and Chinese Experience. Resour. Policy 2022, 78, 102799. [Google Scholar] [CrossRef]
- Ruan, W.; Li, Y.; Zhang, S.; Liu, C.-H. Evaluation and Drive Mechanism of Tourism Ecological Security Based on the DPSIR-DEA Model. Tour. Manag. 2019, 75, 609–625. [Google Scholar] [CrossRef]
- Hao, Y.; Deng, Y.; Lu, Z.-N.; Chen, H. Is Environmental Regulation Effective in China? Evidence from City-Level Panel Data. J. Clean. Prod. 2018, 188, 966–976. [Google Scholar] [CrossRef]





| Target Layer | Dimension | Indicator | Unit | Effect | Weight | Reference |
|---|---|---|---|---|---|---|
| Urban ecological resilience | Driving forces | Per capita GDP | CNY per inhabitant | + | 0.1054 | Wei et al. [69] |
| Urban residents’ disposable income per capita | CNY per inhabitant | + | 0.0851 | Xu et al. [14] | ||
| Retail sales of consumer goods per capita | CNY per inhabitant | + | 0.1023 | Lan et al. [15] | ||
| Rate of natural population increase | % | − | 0.0315 | Xu et al. [14] | ||
| Urbanization rate | % | + | 0.0522 | Zhao et al. [13] | ||
| Pressures | Population density | persons/km2 | − | 0.0125 | Wei et al. [69] | |
| Urban construction land area | km2 | − | 0.0134 | Li et al. [70] | ||
| Total energy consumption | 104 tce | − | 0.0141 | Wei et al. [69] | ||
| Water consumption in urban districts | tonnes | − | 0.0312 | Zhao et al. [13] | ||
| Resistance | Carbon emissions per unit of GDP | tons/100 million RMB | − | 0.0189 | Yin et al. [10] | |
| Industrial wastewater discharge per unit of GDP | tons/100 million RMB | − | 0.0186 | Li and Wang [71] | ||
| Industrial sulfur dioxide emissions per unit of GDP | tons/100 million RMB | − | 0.0158 | Lan et al. [15] | ||
| Industrial soot and dust emissions per unit of GDP | tons/100 million RMB | − | 0.0159 | Lan et al. [15] | ||
| Adaptability | Domestic wastewater treatment ratio | % | + | 0.0207 | Lan et al. [15] | |
| Integrated recycling rate of general industrial solid waste | % | + | 0.0279 | Huang et al. [72] | ||
| Per capita domestic waste collected and transported | 104 tons/person | + | 0.1368 | Yin et al. [10] | ||
| Safe disposal rate of domestic waste | % | + | 0.0141 | Lan et al. [15] | ||
| Resilience | Park green area per resident | m2/person | + | 0.0456 | Lan et al. [15] | |
| Green coverage rate in built-up areas | % | + | 0.0239 | Lee et al. [16] | ||
| Land area per resident | m2/person | + | 0.1812 | Li and Wang [71] | ||
| Mean annual PM2.5 concentration | μg/m3 | − | 0.0328 | Yin et al. [10] |
| Variable Type | Metric | Abbreviation | Calculation Method | Unit |
|---|---|---|---|---|
| Explained variable | Urban ecological resilience | UER | Composite measurement | - |
| Core explanatory variable | National Innovative City Pilot Policy | NICPP | - | - |
| Control variables | Government intervention | GOV | Share of local government expenditure in the Gross Regional Product (GRP) | % |
| Human capital level | HCI | Ratio of students enrolled in regular higher education institutions to registered population | % | |
| Trade openness | OPEN | Share of aggregate imports and exports in GRP | % | |
| Investment level | INV | Share of fixed asset investment in GRP | % | |
| Environmental regulation intensity | ER | Share of 15 eco-environmental keywords in total word frequency of government reports | % | |
| Financial development level | FIN | Proportion of year-end institutional credit and savings within the GRP | % | |
| Mechanism variables | Quantity of green technology innovation | GTIN | Ratio of green invention patent applications to permanent population | Applications per 10,000 persons |
| Quality structure of green technology innovation | GTIQ | Ratio of green invention patent applications to total green patent applications | % |
| Variable | Mean | SD | Min | Max | N | VIF | 1/VIF |
|---|---|---|---|---|---|---|---|
| UER | 0.2953178 | 0.1013528 | 0.1148678 | 0.6780835 | 4878 | / | / |
| NICPP | 0.1812218 | 0.3852413 | 0 | 1 | 4878 | 1.50 | 0.666159 |
| lnHCI | −4.582678 | 1.132313 | −10.89109 | −1.689681 | 4878 | 1.95 | 0.511903 |
| lnOPEN | −2.527983 | 1.43893 | −7.988895 | 1.253828 | 4878 | 1.56 | 0.641482 |
| lnGOV | −1.803308 | 0.4401029 | −2.74432 | −0.6192042 | 4878 | 2.19 | 0.455784 |
| lnINV | −0.2652872 | 0.6879533 | −5.785093 | 2.521394 | 4878 | 1.16 | 0.864100 |
| lnER | −4.96166 | 0.4600748 | −9.34243 | −3.646118 | 4878 | 1.09 | 0.916384 |
| lnFIN | 0.7777335 | 0.4316762 | −0.5312336 | 3.058775 | 4878 | 2.19 | 0.456501 |
| Variables | Mean | Variance | Skewness | ||||||
|---|---|---|---|---|---|---|---|---|---|
| Treated | Control | Treated | Control | Treated | Control | ||||
| Before | After | Before | After | Before | After | ||||
| lnHCI | −3.775 | −5.026 | −3.775 | 0.8948 | 0.9403 | 0.8949 | −0.08421 | −0.6956 | −0.08418 |
| lnOPEN | −1.71 | −2.977 | −1.71 | 1.223 | 1.967 | 1.224 | −0.3623 | 0.0399 | −0.3663 |
| lnGOV | −2.071 | −1.657 | −2.071 | 0.09714 | 0.1859 | 0.09717 | 0.07314 | 0.1032 | 0.07384 |
| lnINV | −0.3214 | −0.2345 | −0.3214 | 0.4058 | 0.5078 | 0.4058 | −1.097 | −1.233 | −1.097 |
| lnER | −4.937 | −4.975 | −4.937 | 0.1483 | 0.2459 | 0.1483 | −0.7241 | −2.298 | −0.7241 |
| lnFIN | 0.9343 | 0.6918 | 0.9343 | 0.2155 | 0.1496 | 0.2156 | 0.2987 | 0.3031 | 0.2995 |
| Variables | TWFE | TWFE | EB–FE | EB–FE | EB–FE | Tobit | RE |
|---|---|---|---|---|---|---|---|
| (1) | (2) | (3) | (4) | (5) | (6) | (7) | |
| NICPP | 0.0346 *** | 0.0302 *** | 0.0244 *** | 0.0229 *** | 0.0150 *** | 0.0307 *** | 0.0309 *** |
| (0.0036) | (0.0033) | (0.0060) | (0.0036) | (0.0021) | (0.0013) | (0.0033) | |
| lnHCI | −0.0021 | 0.0059 | 0.0023 | −0.0011 | −0.0008 | ||
| (0.0020) | (0.0062) | (0.0035) | (0.0009) | (0.0020) | |||
| lnOPEN | 0.0003 | 0.0033 | 0.0160 *** | 0.0007 | 0.0008 | ||
| (0.0016) | (0.0035) | (0.0033) | (0.0006) | (0.0015) | |||
| lnGOV | −0.0421 *** | −0.0603 *** | −0.0427 *** | −0.0429 *** | |||
| (0.0061) | (0.0067) | (0.0026) | (0.0058) | ||||
| lnINV | 0.0071 *** | 0.0099 *** | 0.0103 *** | 0.0069 *** | 0.0068 *** | ||
| (0.0018) | (0.0027) | (0.0015) | (0.0007) | (0.0018) | |||
| lnER | −0.0020 | −0.0006 | −0.0020 ** | −0.0019 | |||
| (0.0014) | (0.0023) | (0.0009) | (0.0014) | ||||
| lnFIN | −0.0196 *** | −0.0280 *** | −0.0177 *** | −0.0170 *** | |||
| (0.0056) | (0.0054) | (0.0024) | (0.0053) | ||||
| Constant | 0.2890 *** | 0.2123 *** | 0.3365 *** | 0.3588 *** | 0.2768 *** | 0.1178 *** | 0.1191 *** |
| (0.0006) | (0.0182) | (0.0015) | (0.0252) | (0.0234) | (0.0111) | (0.0209) | |
| City FE | √ | √ | √ | √ | √ | √ | √ |
| Year FE | √ | √ | √ | √ | √ | √ | √ |
| Obs. | 4878 | 4878 | 4878 | 4878 | 4878 | 4878 | 4878 |
| R2 | 0.9550 | 0.9619 | 0.9638 | 0.9635 | 0.9733 | ||
| Wald test | 1514.93 *** | 215.442 *** |
| Variables | CS–DID (Not-Yet-Treated) | CS–DID (Only Never-Treated) | Interpolated DID | Two-Stage DID |
|---|---|---|---|---|
| (1) | (2) | (3) | (4) | |
| NICPP | 0.0157 *** | 0.0165 *** | 0.0123 *** | 0.0350 *** |
| (0.0051) | (0.0054) | (0.0020) | (0.0040) | |
| Control variables | √ | √ | √ | √ |
| City FE | √ | √ | √ | √ |
| Year FE | √ | √ | √ | √ |
| Clustered SE | City | City | City | City |
| Obs. | 4878 | 4878 | 4090 | 4878 |
| Variables | K-Nearest Neighbors Matching | Radius Matching | Kernel Matching |
|---|---|---|---|
| (1) | (2) | (3) | |
| NICPP | 0.0146 *** | 0.0108 *** | 0.0128 *** |
| (0.0021) | (0.0025) | (0.0023) | |
| lnHCI | 0.0052 | 0.0053 | 0.0048 |
| (0.0037) | (0.0042) | (0.0039) | |
| lnOPEN | 0.0167 *** | 0.0180 *** | 0.0169 *** |
| (0.0034) | (0.0036) | (0.0035) | |
| lnGOV | −0.0628 *** | −0.0650 *** | −0.0648 *** |
| (0.0069) | (0.0082) | (0.0075) | |
| lnINV | 0.0096 *** | 0.0113 *** | 0.0107 *** |
| (0.0016) | (0.0020) | (0.0018) | |
| lnER | −0.0015 | −0.0029 | −0.0014 |
| (0.0024) | (0.0027) | (0.0025) | |
| lnFIN | −0.0246 *** | −0.0215 *** | −0.0221 *** |
| (0.0055) | (0.0068) | (0.0058) | |
| Constant | 0.2739 *** | 0.2672 *** | 0.2687 *** |
| (0.0241) | (0.0288) | (0.0261) | |
| City FE | √ | √ | √ |
| Year FE | √ | √ | √ |
| Obs. | 4303 | 3091 | 3648 |
| R2 | 0.9748 | 0.9787 | 0.9771 |
| Variables | DRAR–EB–FE | DP−20%RAR–EB–FE | DP+20%RAR–EB–FE |
|---|---|---|---|
| (1) | (2) | (3) | |
| NICPP | 0.0154 *** | 0.0157 *** | 0.0158 *** |
| (0.0041) | (0.0040) | (0.0039) | |
| lnHCI | 0.0037 | 0.0033 | 0.0030 |
| (0.0060) | (0.0060) | (0.0059) | |
| lnOPEN | 0.0167 ** | 0.0162 ** | 0.0158 ** |
| (0.0081) | (0.0079) | (0.0077) | |
| lnGOV | −0.0620 *** | −0.0608 *** | −0.0595 *** |
| (0.0134) | (0.0132) | (0.0130) | |
| lnINV | 0.0107 *** | 0.0102 *** | 0.0097 *** |
| (0.0034) | (0.0033) | (0.0033) | |
| lnER | −0.0010 | −0.0012 | −0.0013 |
| (0.0034) | (0.0034) | (0.0033) | |
| lnFIN | −0.0271 *** | −0.0278 *** | −0.0283 *** |
| (0.0085) | (0.0083) | (0.0081) | |
| Constant | 0.2716 *** | 0.2745 *** | 0.2781 *** |
| (0.0469) | (0.0464) | (0.0459) | |
| City FE | √ | √ | √ |
| Year FE | √ | √ | √ |
| Obs. | 4878 | 4878 | 4878 |
| R2 | 0.9749 | 0.9747 | 0.9743 |
| Variables | Pressure–TWFE | Pressure–TWFE | Pressure–EB–FE | Pressure–EB–FE |
|---|---|---|---|---|
| (1) | (2) | (3) | (4) | |
| NICPP | −0.0414 *** | −0.0374 *** | −0.0203 ** | −0.0227 *** |
| (0.0061) | (0.0056) | (0.0089) | (0.0060) | |
| lnHCI | 0.0132 *** | 0.0237 *** | ||
| (0.0030) | (0.0090) | |||
| lnOPEN | −0.0003 | 0.0106 | ||
| (0.0023) | (0.0107) | |||
| lnGOV | 0.0156 * | −0.0019 | ||
| (0.0086) | (0.0166) | |||
| lnINV | 0.0071 ** | 0.0166 ** | ||
| (0.0032) | (0.0066) | |||
| lnER | 0.0066 *** | 0.0069 | ||
| (0.0023) | (0.0053) | |||
| lnFIN | 0.0093 | 0.0343 ** | ||
| (0.0086) | (0.0158) | |||
| Constant | 0.8643 *** | 0.9790 *** | 0.7996 *** | 0.9109 *** |
| (0.0011) | (0.0252) | (0.0023) | (0.0731) | |
| City FE | √ | √ | √ | √ |
| Year FE | √ | √ | √ | √ |
| Obs. | 4878 | 4878 | 4878 | 4878 |
| R2 | 0.9593 | 0.9613 | 0.9592 | 0.9637 |
| Variables | SCPP−EB−FE | LCCP−EB−FE | CETPP−EB−FE | NECPZ−EB−FE | All−EB−FE |
|---|---|---|---|---|---|
| (1) | (2) | (3) | (4) | (5) | |
| DID | 0.0149 *** | 0.0149 *** | 0.0153 *** | 0.0162 *** | 0.0160 *** |
| (0.0040) | (0.0039) | (0.0040) | (0.0038) | (0.0036) | |
| SCPP | 0.0045 | 0.0049 | |||
| (0.0055) | (0.0055) | ||||
| LCCP | 0.0009 | 0.0011 | |||
| (0.0045) | (0.0043) | ||||
| CETPP | 0.0076 | 0.0021 | |||
| (0.0081) | (0.0073) | ||||
| NECPZ | 0.0207 ** | 0.0199 ** | |||
| (0.0089) | (0.0088) | ||||
| lnHC | 0.0024 | 0.0023 | 0.0027 | 0.0023 | 0.0025 |
| (0.0062) | (0.0061) | (0.0064) | (0.0062) | (0.0063) | |
| lnOPEN | 0.0157 ** | 0.0160 ** | 0.0159 ** | 0.0150 ** | 0.0146 ** |
| (0.0074) | (0.0076) | (0.0075) | (0.0075) | (0.0070) | |
| lnGOV | −0.0601 *** | −0.0604 *** | −0.0606 *** | −0.0596 *** | −0.0596 *** |
| (0.0131) | (0.0133) | (0.0129) | (0.0130) | (0.0130) | |
| lnINV | 0.0102 *** | 0.0103 *** | 0.0100 *** | 0.0095 *** | 0.0095 *** |
| (0.0034) | (0.0033) | (0.0033) | (0.0032) | (0.0032) | |
| lnER | −0.0007 | −0.0005 | −0.0005 | −0.0014 | −0.0015 |
| (0.0034) | (0.0033) | (0.0033) | (0.0033) | (0.0033) | |
| lnFIN | −0.0281 *** | −0.0277 *** | −0.0248 *** | −0.0219 *** | −0.0210 ** |
| (0.0081) | (0.0084) | (0.0080) | (0.0082) | (0.0084) | |
| Constant | 0.2752 *** | 0.2761 *** | 0.2731 *** | 0.2648 *** | 0.2616 *** |
| (0.0467) | (0.0469) | (0.0466) | (0.0466) | (0.0475) | |
| City FE | √ | √ | √ | √ | √ |
| Year FE | √ | √ | √ | √ | √ |
| Obs. | 4878 | 4878 | 4878 | 4878 | 4878 |
| R2 | 0.9733 | 0.9733 | 0.9734 | 0.9739 | 0.9740 |
| Variables | UER_PCA–FE | UER_PCA–FE | UER_PCA–EB–FE | UER_PCA–EB–FE |
|---|---|---|---|---|
| (1) | (2) | (3) | (4) | |
| NICPP | 0.0113 *** | 0.0077 ** | 0.0160 ** | 0.0113 *** |
| (0.0041) | (0.0036) | (0.0063) | (0.0041) | |
| lnHCI | 0.0075 ** | 0.0105 | ||
| (0.0032) | (0.0087) | |||
| lnOPEN | −0.0005 | −0.0039 | ||
| (0.0022) | (0.0049) | |||
| lnGOV | −0.0416 *** | −0.0430 *** | ||
| (0.0080) | (0.0108) | |||
| lnINV | 0.0045 ** | 0.0056 | ||
| (0.0021) | (0.0041) | |||
| lnER | 0.0034 | 0.0060 * | ||
| (0.0029) | (0.0034) | |||
| lnFIN | −0.0411 *** | −0.0606 *** | ||
| (0.0077) | (0.0186) | |||
| Constant | 0.4579 *** | 0.4671 *** | 0.5458 *** | 0.5793 *** |
| (0.0007) | (0.0284) | (0.0016) | (0.0624) | |
| City FE | √ | √ | √ | √ |
| Year FE | √ | √ | √ | √ |
| Obs. | 4878 | 4878 | 4878 | 4878 |
| R2 | 0.9694 | 0.9740 | 0.9796 | 0.9849 |
| Variables | UERt+1–FE | GTINt+1–FE | GTIQt+1–FE | UERt+1–EB–FE | GTINt+1–EB–FE | GTIQt+1–EB–FE |
|---|---|---|---|---|---|---|
| (1) | (2) | (3) | (4) | (5) | (6) | |
| NICPP | 0.0301 *** | 0.5099 *** | 0.0529 *** | 0.0156 *** | 0.3637 *** | 0.0461 ** |
| (0.0033) | (0.0684) | (0.0108) | (0.0043) | (0.0689) | (0.0182) | |
| lnHCI | −0.0020 | −0.2212 *** | −0.0263 * | 0.0016 | −0.7042 *** | −0.0900 ** |
| (0.0020) | (0.0569) | (0.0136) | (0.0063) | (0.1453) | (0.0369) | |
| lnOPEN | 0.0000 | −0.0694 ** | 0.0132 | 0.0142 * | −0.1196 | 0.0266 * |
| (0.0016) | (0.0301) | (0.0088) | (0.0078) | (0.0813) | (0.0149) | |
| lnGOV | −0.0399 *** | −0.0648 | 0.0185 | −0.0563 *** | 0.0289 | −0.0399 |
| (0.0059) | (0.0886) | (0.0245) | (0.0120) | (0.2221) | (0.0442) | |
| lnINV | 0.0081 *** | −0.0902 ** | 0.0169 ** | 0.0117 *** | −0.2118 ** | 0.0313 ** |
| (0.0018) | (0.0348) | (0.0078) | (0.0036) | (0.1003) | (0.0132) | |
| lnER | −0.0012 | −0.1221 *** | −0.0213 ** | 0.0027 | −0.3895 ** | −0.0212 |
| (0.0014) | (0.0322) | (0.0095) | (0.0032) | (0.1938) | (0.0151) | |
| lnFIN | −0.0238 *** | −0.3251 *** | −0.0245 | −0.0345 *** | −0.6569 *** | −0.0445 |
| (0.0056) | (0.0891) | (0.0269) | (0.0091) | (0.1887) | (0.0330) | |
| Constant | 0.2279 *** | −1.4123 *** | 0.2762 *** | 0.3064 *** | −3.4441 *** | −0.0131 |
| (0.0179) | (0.4747) | (0.0938) | (0.0431) | (1.1529) | (0.2125) | |
| City FE | √ | √ | √ | √ | √ | √ |
| Year FE | √ | √ | √ | √ | √ | √ |
| Clustered SE | City | City | City | City | City | City |
| Obs. | 4607 | 4607 | 4607 | 4607 | 4607 | 4607 |
| R2 | 0.9647 | 0.7563 | 0.4167 | 0.9747 | 0.8703 | 0.5693 |
| Variables | Region | Resource Endowmen | Environmental Regulation | |||||
|---|---|---|---|---|---|---|---|---|
| Eastern | Central | Western | Northeast | Resource-Dependent | Non-Resource-Dependent | ER ≥ 50% | ER < 50% | |
| (1) | (2) | (3) | (4) | (5) | (6) | (7) | (8) | |
| NICPP | 0.0135 *** | 0.0218 *** | 0.0194 ** | 0.0113 | 0.0160 *** | 0.0142 *** | 0.0182 *** | 0.0157 ** |
| (0.0044) | (0.0048) | (0.0076) | (0.0073) | (0.0059) | (0.0048) | (0.0041) | (0.0060) | |
| Constant | 0.2738 *** | 0.2385 *** | 0.3495 *** | 0.2991 *** | 0.2270 *** | 0.2843 *** | 0.3162 *** | 0.2478 *** |
| (0.0536) | (0.0807) | (0.0665) | (0.0502) | (0.0774) | (0.0561) | (0.0441) | (0.0663) | |
| Control variables | √ | √ | √ | √ | √ | √ | √ | √ |
| City FE | √ | √ | √ | √ | √ | √ | √ | √ |
| Year FE | √ | √ | √ | √ | √ | √ | √ | √ |
| Obs. | 1530 | 1422 | 1368 | 558 | 1944 | 2934 | 2448 | 2430 |
| R2 | 0.9808 | 0.9586 | 0.9814 | 0.9827 | 0.9658 | 0.9735 | 0.9822 | 0.9684 |
Disclaimer/Publisher’s Note: The statements, opinions and data contained in all publications are solely those of the individual author(s) and contributor(s) and not of MDPI and/or the editor(s). MDPI and/or the editor(s) disclaim responsibility for any injury to people or property resulting from any ideas, methods, instructions or products referred to in the content. |
© 2026 by the authors. Licensee MDPI, Basel, Switzerland. This article is an open access article distributed under the terms and conditions of the Creative Commons Attribution (CC BY) license.
Share and Cite
Li, J.; Peng, B.; Li, X.; Lan, C.; Cheng, J. Assessing the Impact of Innovation-Oriented Urban Policy on Urban Ecological Resilience: Empirical Evidence from 271 Cities in China. Land 2026, 15, 1317. https://doi.org/10.3390/land15071317
Li J, Peng B, Li X, Lan C, Cheng J. Assessing the Impact of Innovation-Oriented Urban Policy on Urban Ecological Resilience: Empirical Evidence from 271 Cities in China. Land. 2026; 15(7):1317. https://doi.org/10.3390/land15071317
Chicago/Turabian StyleLi, Junxi, Bei Peng, Xingwei Li, Chenlin Lan, and Jie Cheng. 2026. "Assessing the Impact of Innovation-Oriented Urban Policy on Urban Ecological Resilience: Empirical Evidence from 271 Cities in China" Land 15, no. 7: 1317. https://doi.org/10.3390/land15071317
APA StyleLi, J., Peng, B., Li, X., Lan, C., & Cheng, J. (2026). Assessing the Impact of Innovation-Oriented Urban Policy on Urban Ecological Resilience: Empirical Evidence from 271 Cities in China. Land, 15(7), 1317. https://doi.org/10.3390/land15071317