1. Introduction
African climate-related hazards are increasing in frequency, intensity, and spatial complexity across Sub-Saharan Africa under the combined effects of climate change, hydro-climatic variability, land degradation, and rapid socio-economic transformations [
1,
2]. Droughts, floods, forest fires, and extreme heat now represent major constraints for sustainable development, food security, biodiversity conservation, and territorial planning in many African regions [
3]. Their impacts are further amplified by demographic growth, urban expansion, mining development, and increasing pressure on natural resources, which heighten the exposure and vulnerability of populations and ecosystems.
In Senegal, these dynamics are particularly pronounced in inland territories where livelihoods remain highly dependent on climate-sensitive natural resources and where institutional capacities for disaster prevention and management remain uneven [
3]. The Kedougou region, located in southeastern Senegal within the Sudano-Guinean climatic zone, illustrates these cumulative pressures. The region combines high biodiversity, important forest ecosystems, rapidly expanding mining activities, strong demographic growth, and increasing climatic variability. In recent decades, recurrent drought episodes, intense rainfall events, forest fires, and heat waves have significantly affected agricultural production systems, settlements, ecosystems, and local infrastructure [
4]. The coexistence of these hazards within the same territory highlights the necessity of moving beyond isolated hazard assessments toward integrated multi-risk approaches capable of capturing interactions, cumulative effects, and territorial vulnerabilities [
5].
Although several environmental threats affect the region, this study specifically focuses on droughts, floods, forest fires, and extreme heat because they represent the most recurrent and socio-economically significant climate-related hazards identified by both institutional reports and previous scientific studies in southeastern Senegal [
4,
6]. These hazards directly affect agriculture, water resources, biodiversity, public health, and infrastructure, while also exhibiting strong spatial interactions. In contrast, other environmental processes such as land degradation or locust invasions, although important, were not explored because they either constitute longer-term degradation dynamics or lack sufficiently consistent multi-temporal spatial datasets over the 1995–2024 period.
Recent advances in remote sensing and Geographic Information Systems (GISs) have considerably improved the capacity to monitor and map environmental hazards over large territories and long temporal periods [
7]. Satellite-derived indices such as the Normalised Burn Ratio (NBR), Modified Normalised Difference Water Index (MNDWI), Vegetation Health Index (VHI), and Land Surface Temperature (LST) are now widely used for wildfire detection, flood mapping, drought monitoring, and heat stress assessment [
8,
9]. The emergence of cloud computing platforms such as Google Earth Engine (GEE) has further strengthened these approaches by facilitating access to long-term multi-source satellite archives and enabling reproducible analyses at regional and continental scales [
10].
At the same time, Multi-Criteria Decision-Making (MCDM) methods, particularly the Analytic Hierarchy Process (AHP), have become increasingly used for environmental risk assessment and spatial prioritisation [
11,
12]. AHP enables the integration of heterogeneous indicators while explicitly accounting for the relative importance of criteria through pairwise comparisons. In Africa, several studies have successfully applied AHP to flood susceptibility [
13], drought vulnerability, and land degradation assessments [
14]. However, most existing studies remain focused on single hazards and generally rely on expert weighting schemes defined solely by researchers. This “top-down” approach often limits the operational relevance of results because it insufficiently incorporates local institutional priorities and territorial knowledge.
The need for integrated multi-hazard frameworks has been increasingly highlighted in the international literature. In Nepal, Khatakho et al. [
15] demonstrated the effectiveness of combining remote sensing data, GIS, and multi-criteria approaches for assessing simultaneous exposure to floods, landslides, and earthquakes. Their work showed that integrated assessments provide a more realistic representation of territorial risk than isolated hazard analyses. Similarly, Mladineo et al. [
16] applied a GIS-based multi-risk framework in Croatia to analyse interactions between floods, earthquakes, and marine hazards in urban areas, emphasising the importance of considering cumulative exposure. In Japan, Sharma, and Miyazaki [
17] demonstrated how AHP-based approaches integrating socio-economic vulnerability and physical hazards could support resilient land use planning in highly exposed territories.
Despite these advances, several major limitations remain within the current multi-risk literature, particularly in West Africa. First, most studies have been conducted in Asian or European contexts, whereas semi-arid African regions remain comparatively underrepresented despite their high vulnerability to climate variability [
5]. Second, many studies focus on static single-hazard assessments without explicitly analysing the spatial overlap and cumulative interactions between multiple hazards. Third, methodological frameworks often remain weakly connected to operational decision-making processes because local institutional knowledge and stakeholder priorities are rarely integrated into hazard weighting procedures. Finally, many existing approaches insufficiently address issues of reproducibility, uncertainty, and long-term temporal dynamics.
Another important limitation concerns the predominance of deterministic and retrospective approaches in multi-risk studies. While historical hazard mapping is essential for understanding past and present dynamics, it does not fully capture future climate-related uncertainties or the evolving adaptive capacities of populations and ecosystems. Recent research increasingly advocates for integrated frameworks combining hazard occurrence, exposure, vulnerability, and adaptive capacity in order to support anticipatory risk governance and disaster risk reduction [
5]. Nevertheless, retrospective analyses based on long-term satellite observations remain indispensable for establishing reliable environmental baselines and identifying recurrent spatial patterns of vulnerability.
In this context, the present study proposes an integrated and reproducible framework for multi-hazard risk assessment in the Kedougou region of Senegal. The approach combines multi-source satellite data processed through Google Earth Engine, multi-criteria analysis using the Analytic Hierarchy Process (AHP), and participatory weighting based on institutional surveys conducted with key Senegalese agencies involved in disaster risk management, environmental monitoring, hydrology, meteorology, and territorial planning.
The originality of this study lies not in the isolated use of remote sensing or AHP methodologies, which are already well established, but in their integration within a long-term multi-hazard framework specifically adapted to a poorly documented semi-arid West African context. The study also contributes by combining satellite-derived hazard assessment with locally informed participatory weighting in order to better reflect territorial priorities and operational realities.
The main objective of this research is therefore to develop and apply a reproducible framework for assessing and mapping multi-hazard risk in the Kedougou region between 1995 and 2024. More specifically, the study aims to achieve the following:
- (i)
Characterise the spatial and temporal dynamics of forest fires, droughts, floods, and extreme heat using multi-source satellite data processed through Google Earth Engine;
- (ii)
Assess socio-economic, environmental, and physical vulnerabilities associated with each hazard;
- (iii)
Integrate institutional perceptions and territorial priorities through a participatory AHP approach;
- (iv)
Produce an integrated multi-hazard risk map identifying the most exposed municipalities, populations, and agricultural areas;
- (v)
Provide spatial decision support information for territorial planning, disaster risk reduction, and climate adaptation in the Kedougou region.
By combining remote sensing, participatory weighting, and spatial multi-risk analysis, this study contributes to ongoing efforts to strengthen evidence-based climate risk governance in semi-arid African regions facing increasing environmental and socio-economic pressures.
Specifically, this study addresses three research questions: (1) What are the spatial and temporal dynamics of forest fires, drought, floods, and extreme heat in the Kedougou region over the period 1995–2024? (2) Which municipalities exhibit chronic multi-hazard exposure warranting priority risk reduction interventions? (3) How can an integrated remote sensing, AHP, and participatory framework, disseminated through open-access platforms, support territorial governance in a data-scarce context?
2. Study Area
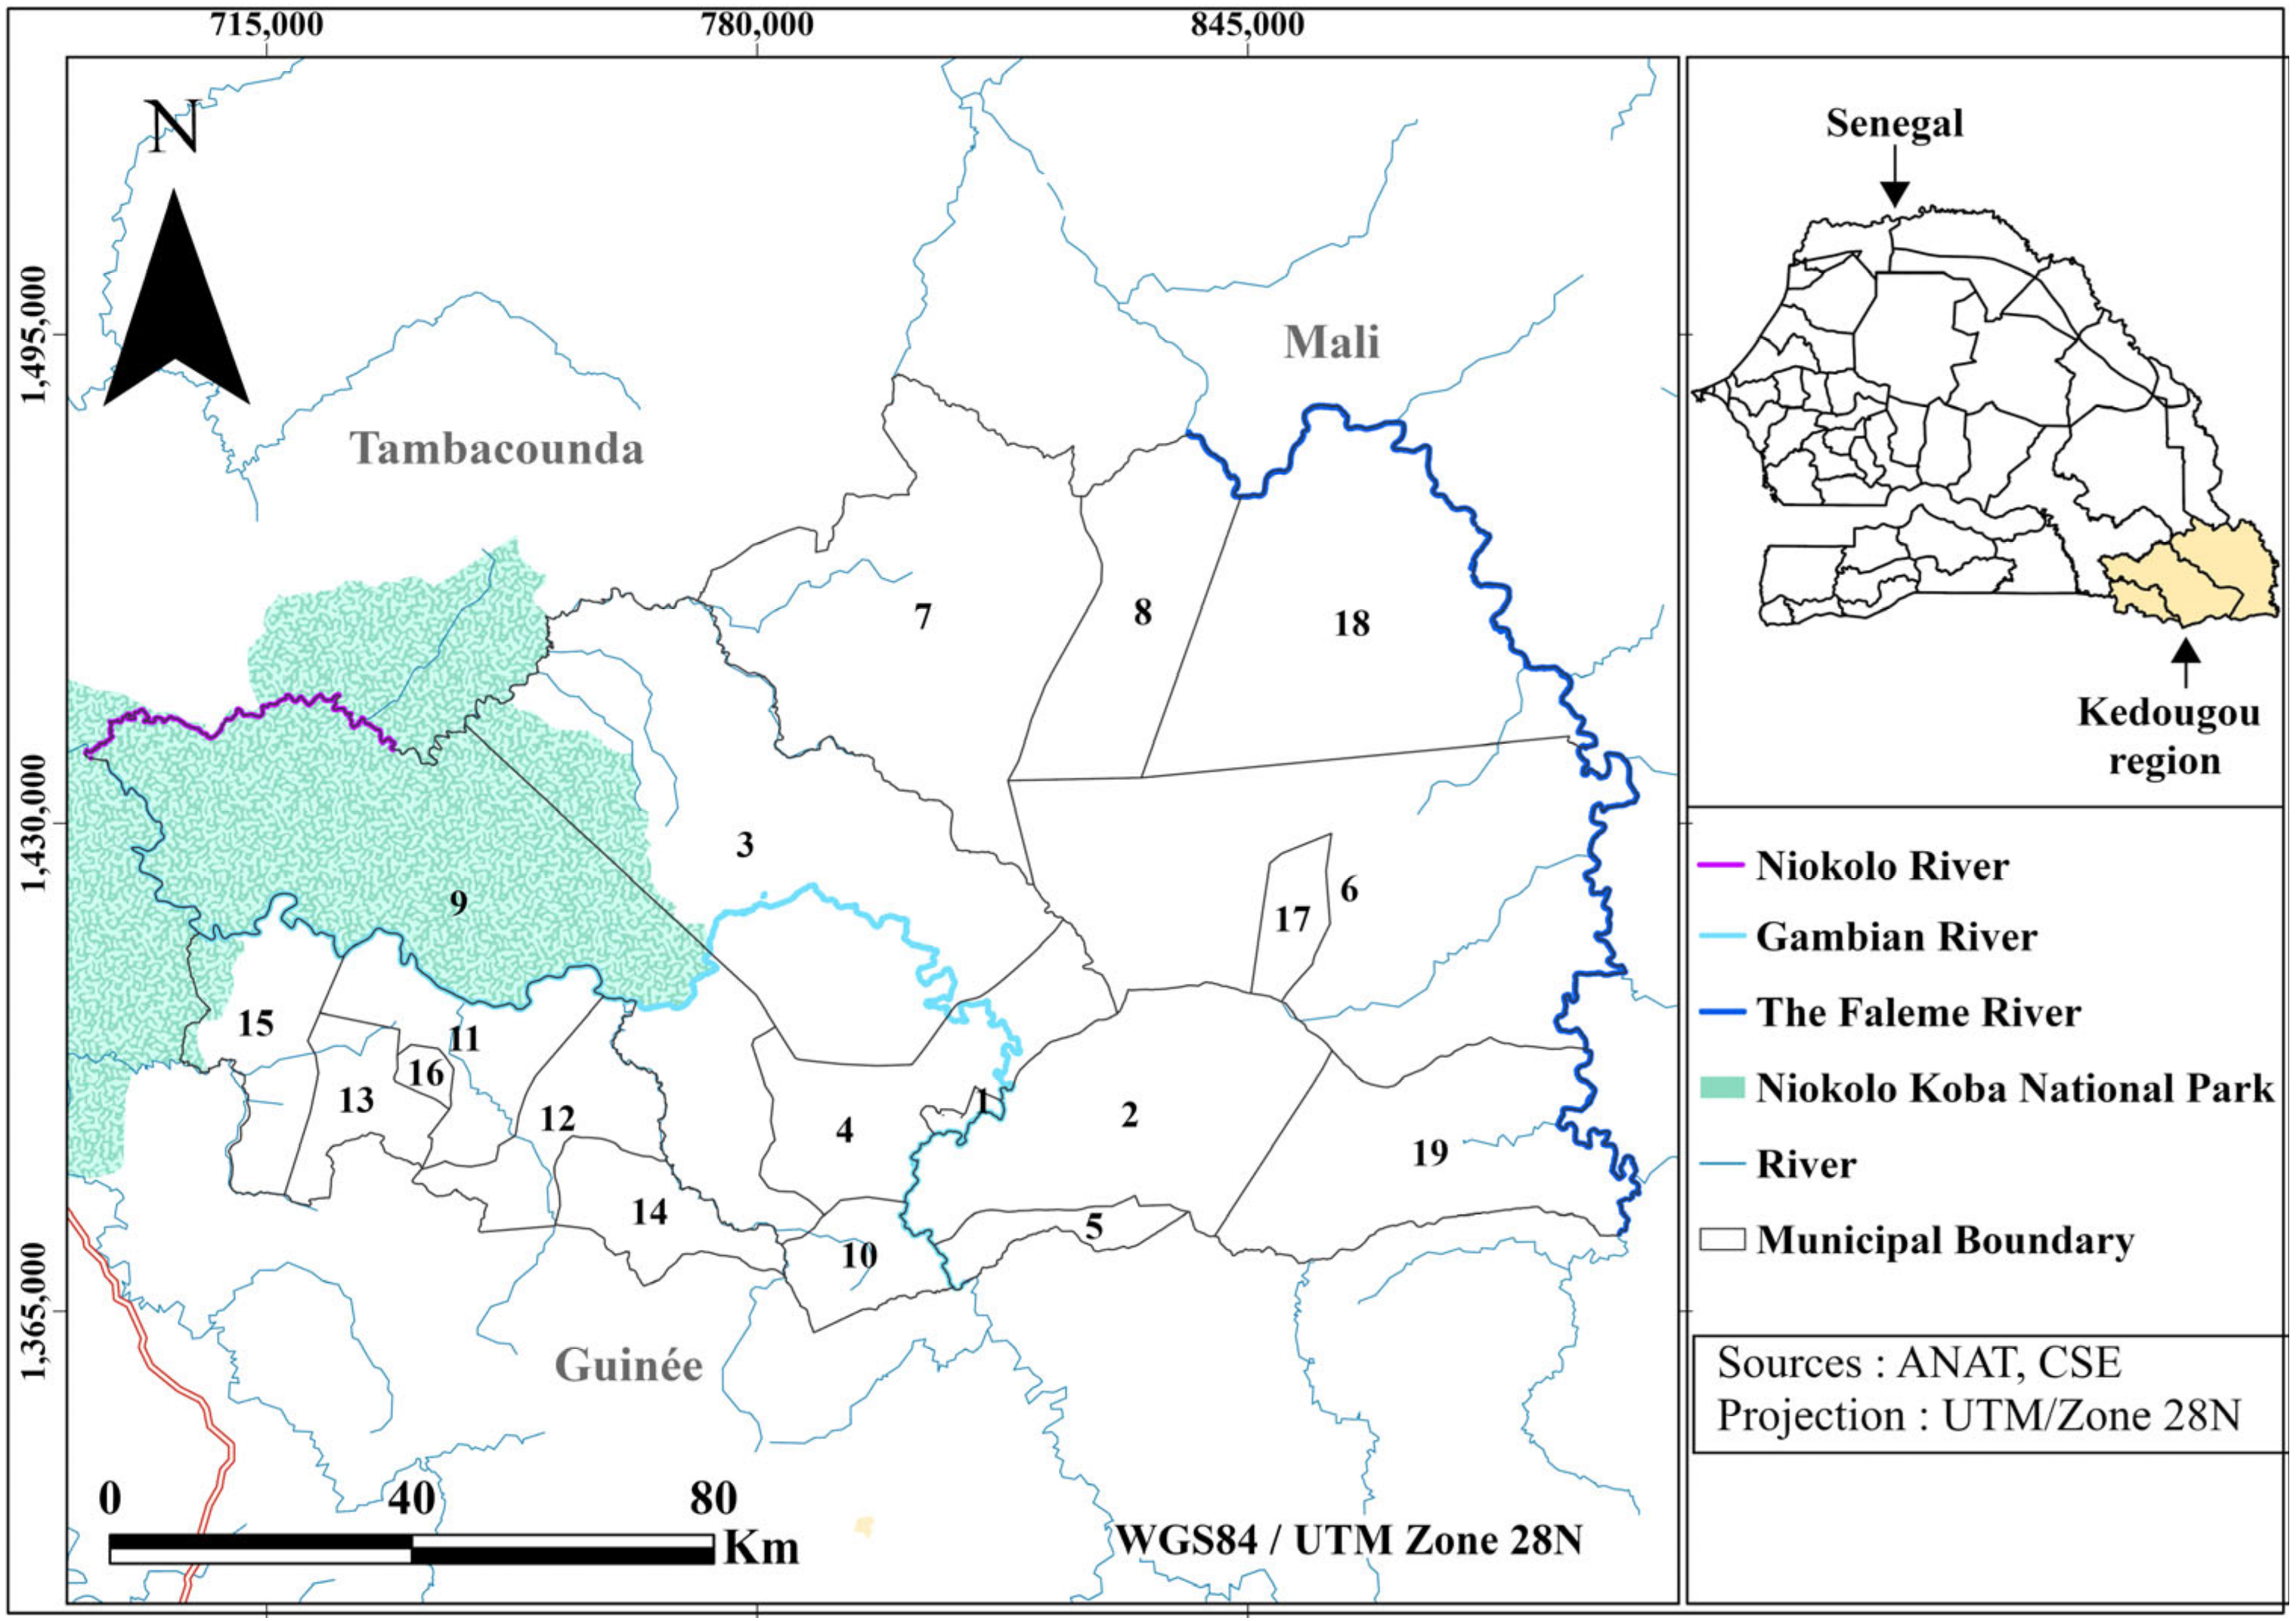
The Kedougou region is located in the extreme south-east of Senegal, bordered by the Tambacounda region to the north and west, Mali to the east and Guinea to the south. Elevated to the status of a region in 2008, it covers a total area of 16,896 km
2 and comprises three departments and 19 municipalities (
Figure 1). In 2023, its population was estimated at 245,147 inhabitants, with an average density of 15 inhabitants per km
2 [
18]. The region is experiencing rapid population growth, with the average intercensal growth rate rising from 2.7% (1988/2002) to 4.8% (2013/2023), mainly due to improved access, international migration, and gold mining [
19].
Figure 1.
Location of the study area. The inset in the top right-hand corner shows the location of our study area in Senegal. The central map depicts the Kedougou region with its 19 municipalities, set against a background showing rivers, cultivated areas, and the Niokolo-Koba National Park. The 19 municipalities are numbered from 1 to 19. The corresponding names are provided in
Table 1.
Figure 1.
Location of the study area. The inset in the top right-hand corner shows the location of our study area in Senegal. The central map depicts the Kedougou region with its 19 municipalities, set against a background showing rivers, cultivated areas, and the Niokolo-Koba National Park. The 19 municipalities are numbered from 1 to 19. The corresponding names are provided in
Table 1.
Table 1.
List of the 19 municipalities of the Kedougou region, their department affiliation, and surface area (km2).
Table 1.
List of the 19 municipalities of the Kedougou region, their department affiliation, and surface area (km2).
| Number | Municipality | Department | Area (km2) |
|---|
| 1 | Kedougou | Kedougou | 32 |
| 2 | Dindefello | Kedougou | 252 |
| 3 | Dar salam | Salemata | 470 |
| 4 | Kevoye | Salemata | 410 |
| 5 | Ethiolo | Salemata | 274 |
| 6 | Dakately | Salemata | 307 |
| 7 | Oubadji | Salemata | 496 |
| 8 | Salemata | Salemata | 44 |
| 9 | Saraya | Saraya | 155 |
| 10 | Missirah sirimana | Saraya | 1702 |
| 11 | Medina baffe | Saraya | 1036 |
| 12 | Dimboli | Kedougou | 1158 |
| 13 | Tomboronkoto | Kedougou | 2349 |
| 14 | Bandafassi | Kedougou | 699 |
| 15 | Fongolembi | Kedougou | 157 |
| 16 | Bembou | Saraya | 2452 |
| 17 | Sabodala | Saraya | 1822 |
| 18 | Khossanto | Saraya | 741 |
| 19 | Ninefecha | Kedougou | 2390 |
According to the Köppen–Geiger classification [
20], the Kedougou region falls within the Aw (tropical savannah) and BSh (hot semi-arid climate) climate zone.
Kedougou has a tropical climate, characterised by alternating rainy seasons (June–October, 800–1200 mm/year) and long dry seasons (November–May, temperatures > 40 °C). Irregular and intense rainfall causes localised flooding, as in 2013 and 2024, leading to the loss of cultivated land. Interannual rainfall variability and the frequency of extreme events are exacerbated by climate change [
21]. The dry season is marked by significant water stress, exacerbated by El Niño events [
22].
In environmental terms, Kedougou presents a diverse ecological mosaic. However, artisanal mining and extensive agriculture are leading to deforestation and soil degradation, increasing the risk of erosion, desertification, and forest fires [
23].
The exclusive use of remote sensing data in this study is primarily justified by the scarcity of continuous and spatially distributed in situ observational data in the Kedougou region. Ground-based records on forest fires, river discharge, precipitation, and surface temperature are either absent, geographically limited to the regional capital, or discontinued over the study period. In this context, Landsat satellite archives represent the only available source of spatially consistent and temporally continuous data covering the entire region over the 1995–2024 period.
3. Materials and Methods
3.1. Data Used
This study mainly uses temporal satellite data and local data (
Table 2). Series of Landsat 5, 7, and 8 images covering the period 1995–2024 were processed using Google Earth Engine (GEE) (
https://earthengine.google.com/). These were used to calculate various multispectral indices (NBR for forest fires, NDVI/VCI/TCI/VHI for drought, MNDWI for floods, and LST for heat) in order to detect and quantify hazards. Additional data were used: MODIS images for land cover (V061 version), the Global Human Settlement Layer (GHSL, P2023A version) product for population density, the MERIT Hydro database for rivers, and the SRTM digital terrain model (30 m) for altitude, etc. In addition, local data were integrated for vulnerability: administrative boundaries, detailed land cover maps (agriculture, forests), and demographic information. All spatial layers were harmonised in local metric projection (UTM Zone 28 N) and normalised as needed.
3.2. Methodological Approach
In this study, ‘hazard’ is operationalised as the recurrence of observed extreme conditions across three decadal periods, which serves as a proxy for frequency of occurrence.
The methodological approach for studying natural hazards in the Kedougou region is based on a combination of proven methods and analyses specific to the local context, combining tools such as Google Earth Engine (GEE), Python 3.10.11, KoboToolbox (
https://www.kobotoolbox.org/), ArcGIS Pro 3.5, and MapX (
https://app.mapx.org/), an open-source geospatial tool dedicated to the management and visualisation of environmental and risk data [
24].
This study also uses a rigorous analytical framework and methods such as multi-temporal analysis (1995–2024), spectral indices calculation (NDVI, MNDWI, NBR, and LST), and multi-criteria analysis using AHP and participatory surveys. Our approach effectively integrates remote sensing, socio-economic analysis, and multi-criteria analysis to map hazards, assess socio-environmental vulnerability, and prioritise risks according to local realities.
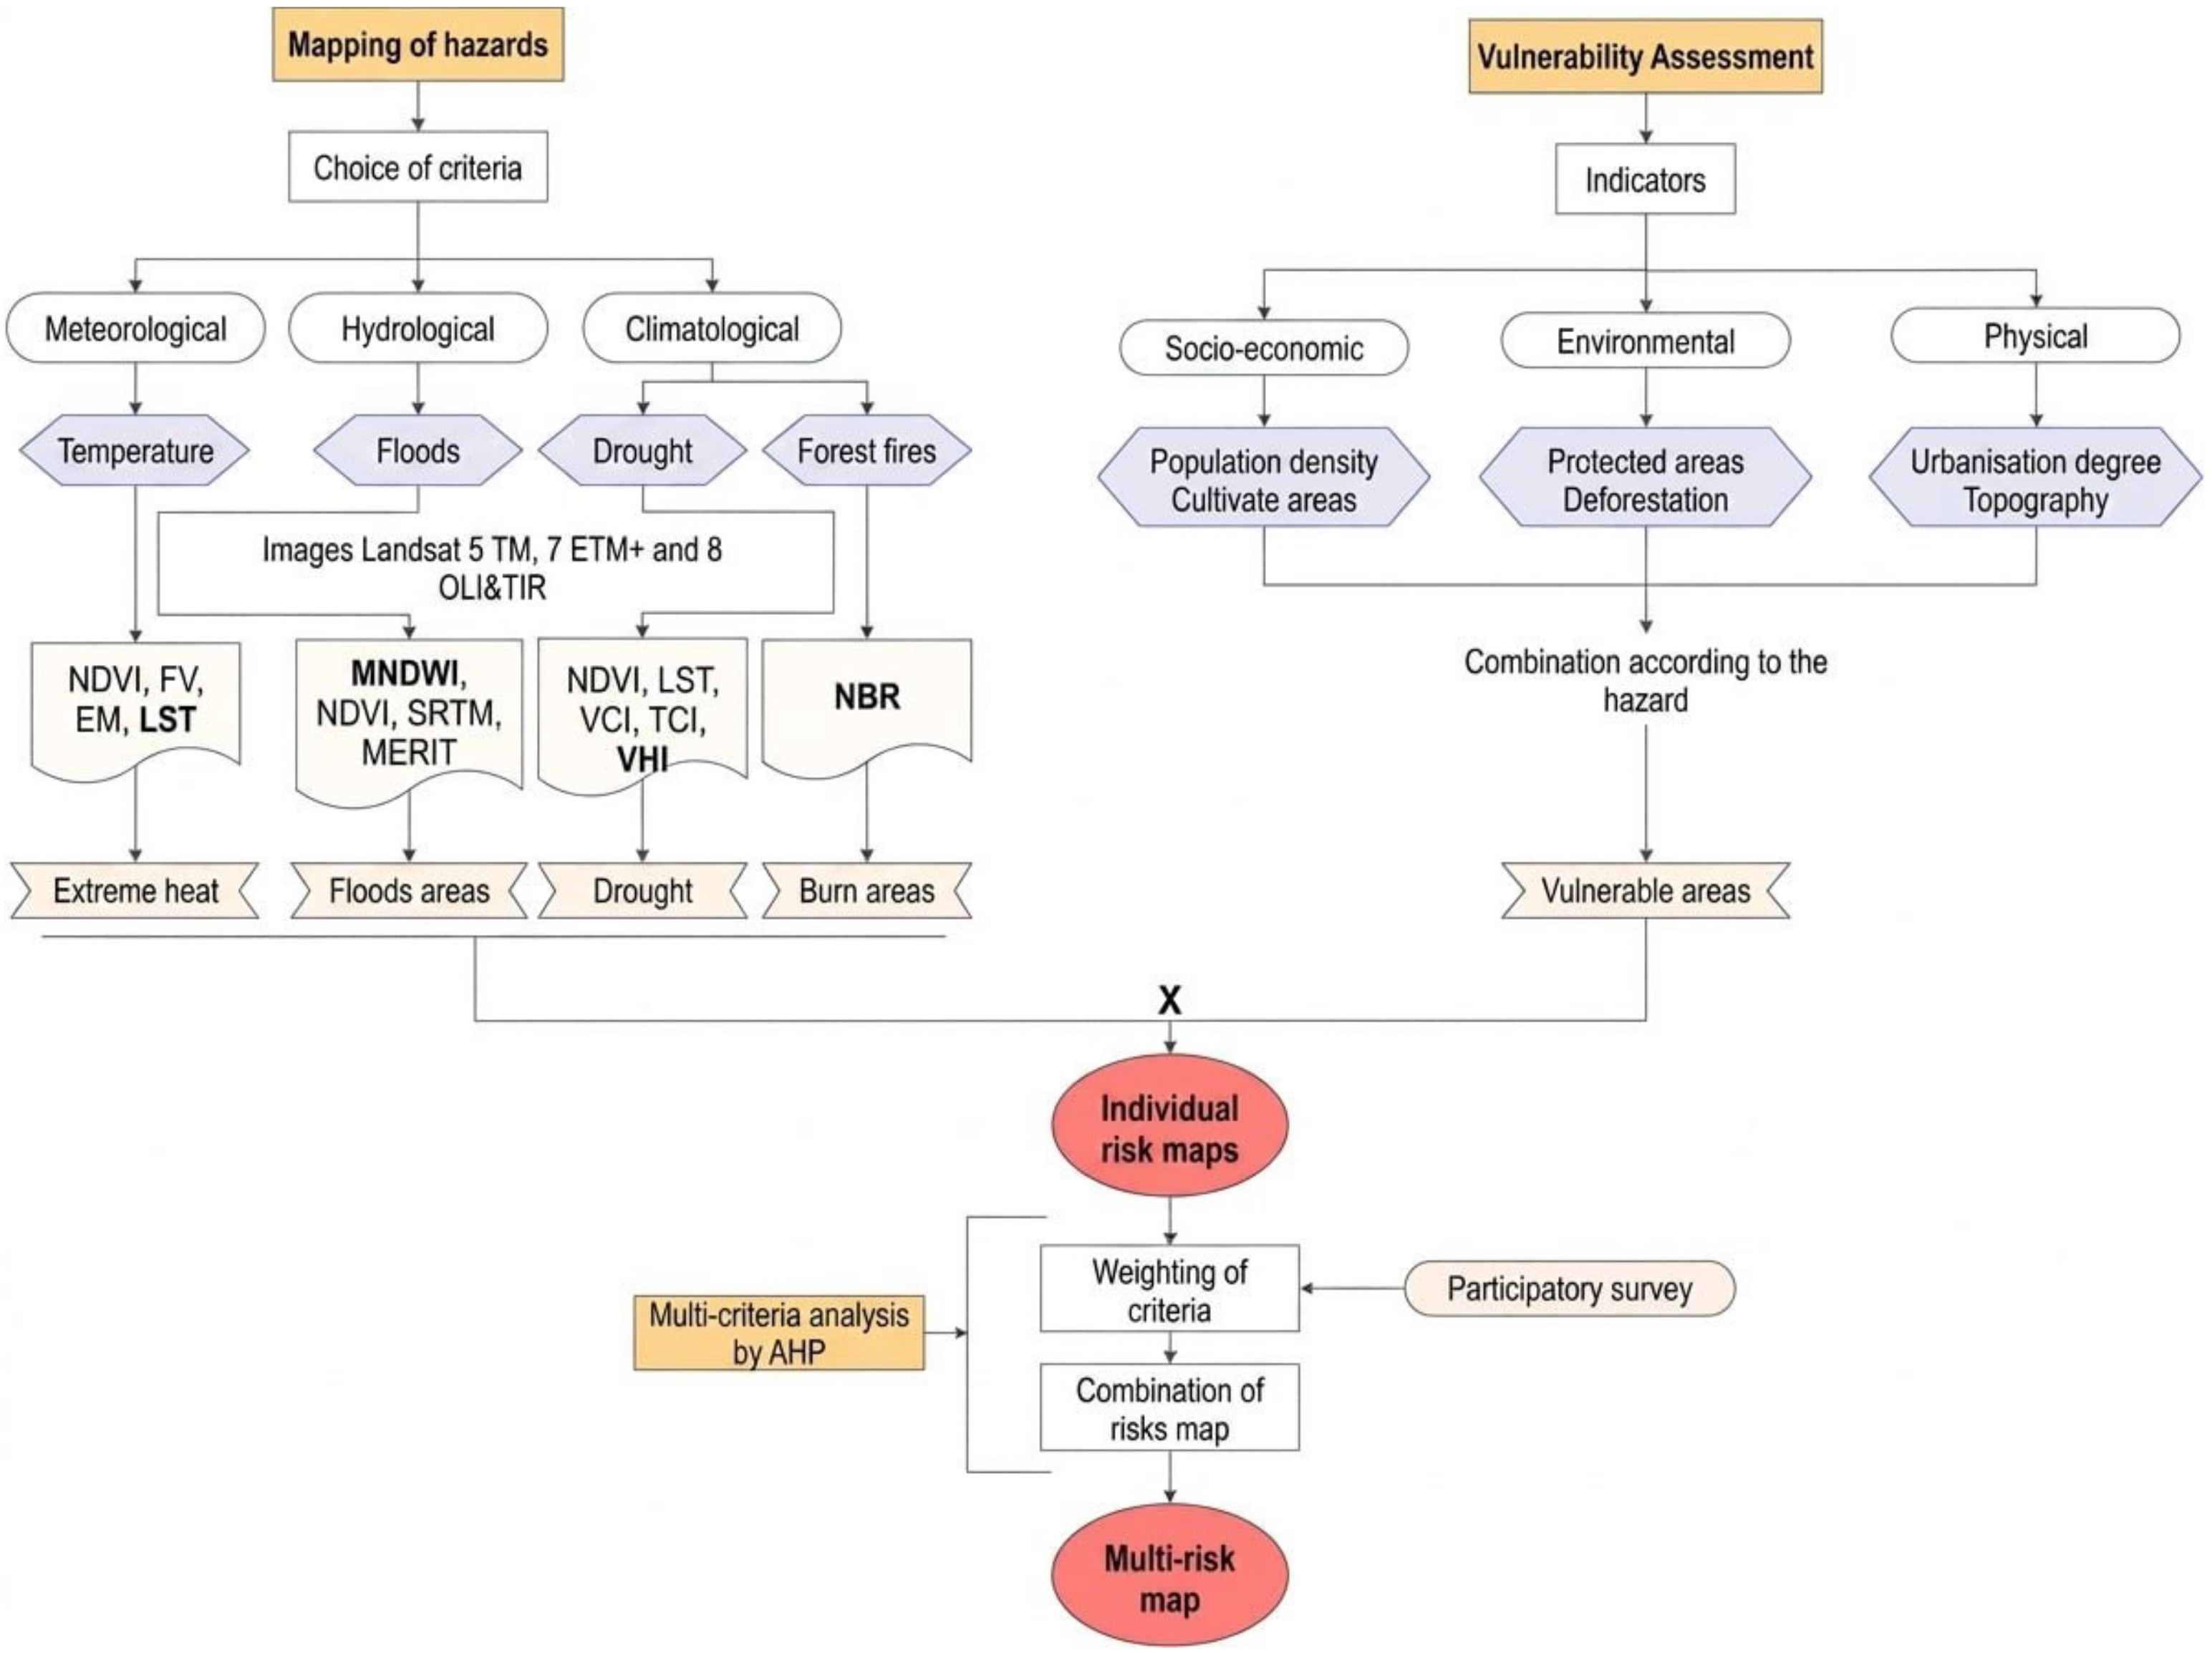
Hazards such as droughts, flooding, forest fires, and extreme temperatures were mapped individually using satellite data, including Landsat images processed on Google Earth Engine (GEE). This use of remote sensing made it possible to accurately identify large-scale areas affected by these hazards.
At the same time, vulnerability was assessed by integrating various socio-economic, environmental, and physical indicators. This approach made it possible to determine how the specific characteristics of the Kedougou region influence its sensitivity to the hazards identified. By combining this information, the risk is calculated for each hazard by multiplying the recurrence of the hazard by the corresponding vulnerability [
25]. Finally, to obtain an overall view of the risks, AHP, a multi-criteria analysis method developed by Thomas L. Saaty in 1980 [
11], is applied. This technique made it possible to weight and combine the various risks according to their relative importance, resulting in an integrated multi-risk map.
Figure 2 below provides a comprehensive overview of the methodological approach.
3.3. Individual Hazard Maps
The hazard mapping for the three study periods (1995–2004, 2005–2014, and 2015–2024) covers three generations of Landsat satellites. The three generations of Landsat satellites (TM/Landsat 5, ETM+/Landsat 7, and OLI-TIRS/Landsat 8) exhibit differences in spectral response that may introduce biases if not corrected. All images were processed to the Collection 2 Tier 1 (C02/T1_L2) surface reflectance level distributed by the USGS, which applies atmospheric correction using the LaSRC code for OLI-TIRS and LEDAPS for TM/ETM+ [
26]. At this level of processing, inter-sensor spectral comparisons are considered sufficiently consistent for the calculation of normalised indices [
27]. A cloud and shadow mask was applied on a pixel-by-pixel basis via the QA_PIXEL channel (bits 3 and 4), in accordance with USGS recommendations [
28]. For Landsat 7, missing scan lines (SLC-off, since May 2003) were masked via the same channel. The spectral bands were uniformly renamed (
Table 3) to allow for the application of identical formulas regardless of the sensor generation. The DN values for CO
2 reflectance are converted to physical reflectance (0–1) using the following: ρ = DN × 2.75 × 10
−5 − 0.2, in accordance with USGS metadata (2021).
3.3.1. Forest Fires
The assessment of forest fire risk is based on a retrospective analysis of burned areas, using satellite data from different periods. The methodology uses the Normalised Burn Ratio (NBR) index, calculated from the near-infrared (NIR) and short-wave infrared (SWIR) spectral bands of Landsat satellites [
29], according to the following formula:
This index is widely recognised for its ability to detect burned areas and estimate the severity of fires [
30]. For the Landsat series, the NBR is calculated using band 4 (NIR) and band 7 (SWIR) for Landsat 5 and 7, and bands 5 (NIR) and 7 (SWIR2) for Landsat 8.
This index exploits the contrasting spectral response of burned and unburned surfaces: healthy vegetation exhibits high NIR reflectance and low SWIR reflectance, while fire-affected surfaces show the inverse pattern—reduced NIR due to charcoal absorption and elevated SWIR due to soil and ash exposure—resulting in markedly lower NBR values [
30]. For each decadal period (1995–2004, 2005–2014, and 2015–2024), all available cloud-masked Landsat images are processed, and pixels exhibiting persistently low NBR values across the period are classified as recurrently burned. This temporal aggregation reduces false positives from ephemeral soil exposure or seasonal vegetation senescence, improving the spatial reliability of fire scar detection over long time series [
31].
Recurrence is defined at the decadal period level: a pixel classified as burned in one, two, or all three decadal composites is assigned low, moderate, or high recurrence, respectively. This does not imply burning in every year of a decade, but rather the detection of a burned signal in the composite for that ten-year period.
3.3.2. Drought
The literature distinguishes between four types of drought: meteorological, agricultural, hydrological, and socio-economic [
32]. In Kedougou, where 70% of the population depends on rain-fed agriculture, it is agricultural drought, defined as a soil moisture deficit affecting crop development and vegetation health, that has the most direct socio-economic consequences [
33]. The VHI [
34,
35] was selected for three reasons. (i) It combines the VCI (reflecting vegetation water stress relative to its historical values) and the TCI (capturing surface thermal stress), two simultaneous manifestations of agricultural drought [
36]. (ii) It can be calculated entirely from Landsat bands available on GEE, ensuring methodological consistency with the other hazards. (iii) Its robustness in semi-arid environments of sub-Saharan Africa comparable to Kedougou has been documented [
37,
38]. The alternatives were ruled out for the following reasons: the SPI [
39] is purely meteorological and does not reflect vegetation conditions; the PDSI requires station data that are unavailable at the sub-regional scale; and the NDDI [
40] does not capture the thermal component.
Drought is monitored using indices derived from remote sensing, in particular the Vegetation Health Index (VHI) [
41]. The VHI is a combination of the Vegetation Condition Index (VCI), which compares the current NDVI to historical extreme values [
42], and the Temperature Condition Index (TCI), which measures thermal stress via LST [
34].
The NDVI is calculated to assess vegetation health, with higher values associated with dense, healthy vegetation. The formula for calculating the NDVI is as follows:
Thermal bands have been used to determine the Land Surface Temperature (LST). This corresponds to band 6 for Landsat 5 and 7, and bands 10 and 11 for Landsat 8. The satellites’ TIR sensors measure radiance at the top of the atmosphere (TOA), from which brightness temperatures can be derived using Planck’s law [
43]. The formulas used at each stage to convert the numerical value into the Land Surface Temperature are presented in
Table 4 [
37]:
The Landsat sensor constants K1 and K2 are given in
Table 5. The central wavelength (λ) values for the different thermal bands are listed in
Table 6. In addition, we used Landsat 8 band 10 due to the greater calibration uncertainty associated with TIRS band 11 [
37].
The VCI and TCI are derived to measure vegetation conditions and heat stress, respectively. Their combination, the VHI, characterises the overall health of vegetation [
36].
Droughts based on the VHI are classified into five categories, in accordance with the recommendations of [
35].
Table 7 shows different drought conditions based on VCI, TCI, and VHI values.
Drought is mapped by identifying areas with a low VHI (<30%) [
35], thus assessing the recurrence of water stress over each period. These indices were developed using the following equations [
44]:
The weighting coefficient α is set to 0.5, assigning equal contributions to the VCI and TCI [
35,
45]. This standard value is applied uniformly across all periods and land cover types, consistent with established practice in data-scarce semi-arid environments.
3.3.3. Flood
The mapping of flooded areas uses the Modified Normalised Difference Water Index (MNDWI) [
46], defined as follows:
For each ten-year period, all available Landsat images following cloud masking were used, without any a priori seasonal selection, in order to maximise temporal coverage across the entire hydrological cycle. The ee.Reducer.percentile ([10, 40]) reducer produces two composites: P10, which captures the lowest reflectance conditions, corresponding to permanently or very frequently flooded water surfaces; and P40, which represents average conditions slightly above the median, reflecting areas subject to recurrent flooding whilst excluding extreme values linked to residual atmospheric effects or ephemeral water bodies following brief rainfall. The P10–P40 difference in the MNDWI thus isolates recurrently flooded areas by excluding permanent water bodies (already present in P40) and non-recurrent ephemeral flooding. This approach is directly inspired by the Global Surface Water Explorer [
47], which demonstrated its robustness for mapping water bodies on a global scale using multi-decadal time series.
Additional masks are applied to improve accuracy, including an elevation mask (SRTM) that excludes high areas, thus targeting low-lying areas prone to flooding [
48], an NDVI mask to eliminate dense vegetation [
49], and a mask of permanent watercourses using the MERIT/Hydro database [
50].
3.3.4. Extreme Heat
The study of extreme heat is based on mapping the Land Surface Temperature (LST) [
51], the estimation of which is influenced by vegetation and surface emissivity [
52]. The LST is obtained by converting spectral luminance at the top of the atmosphere (Lλ) into the brightness temperature (TB), then applying an emissivity correction (ϵ) [
53]. The LST correction formula is as follows:
Extreme heat zones are identified where the LST exceeds 42 °C. This threshold is consistent with the 90th-percentile-based approach recommended for detecting heat extremes in satellite LST time series [
54], and is corroborated by regional climatological evidence: the 95th percentile of the daily maximum air temperature at the Kedougou meteorological station is 40.72 °C [
55], and the eastern part of Senegal, including the Kedougou region, is documented as experiencing the highest frequency and intensity of heat waves in the country due to its continental Sahelian climate [
56]. Given that the daytime LST over bare soils and degraded agricultural areas systematically exceeds the air temperature by 3–8 °C in semi-arid environments, an LST threshold of 42 °C represents a conservative lower bound for identifying areas experiencing extreme thermal stress conditions in the Kedougou region.
3.3.5. Validation of Hazard Maps
Hazard maps undergo a rigorous validation process that allows the results obtained through remote sensing to be compared with independent reference data [
57]. In this study, the validation of hazard maps for the period 2015–2024 was carried out using two complementary approaches: (i) quantitative spatial validation by calculating the geographical overlap between the generated map and a highly reliable reference dataset, for the hazards of forest fires, floods, and extreme heat; (ii) a qualitative temporal validation based on agreement with the SPEI (Standardised Precipitation Evapotranspiration Index) for drought hazards, for which the satellite data available on Google Earth Engine have spatial resolutions that are too coarse for direct spatial validation. The main metric used for spatial validation is the overlap rate (OR), defined as the ratio of the area of the intersection to the area of the reference layer:
The validation of the map of burnt areas was carried out using the MODIS MCD64A1 product (Collection 6), which provides monthly mapping of burnt areas at a spatial resolution of 500 m. This product, developed by Giglio et al. [
58], is recognised as the global benchmark for the detection of burnt areas. Pixels detected as burnt by the MCD64A1 product over the period 2015–2024 were spatially aggregated across the Kedougou region to form the reference layer.
The flood map was validated using Sentinel-1 imagery, whose C-band radar backscatter data enable the detection of flooded areas with a spatial resolution of 10 m, regardless of atmospheric conditions and cloud cover. This approach is in line with the recommendations of the Copernicus Emergency Management Service and has been validated in numerous African contexts, notably in Senegal by Sy et al. [
59], who used GEE to map the floods of 2022. The flooded areas detected by Sentinel-1 over the period 2015–2024 were used as an independent spatial reference.
The validation of the extreme heat map was carried out using the MODIS MOD11A2 product (Collection 6.1), which provides estimates of the Land Surface Temperature (LST) at a spatial resolution of 1 km, with an 8-day frequency [
60]. Pixels with an LST exceeding the threshold of 42 °C over the period 2015–2024 formed the reference layer.
For drought, none of the available GEE datasets had a spatial resolution fine enough to allow for validation by direct spatial intersection. Validation was therefore carried out temporally, by comparing changes in drought levels detected by the VHI with values from the SPEI (Standardised Precipitation Evapotranspiration Index) provided by the CSIC’s SPEI Global Drought Monitor portal [
61].
This validation was conducted as a temporal trend comparison rather than a pixel-by-pixel spatial validation: the evolution of the VHI-derived dry area extent (km2) across the three decadal periods was compared with SPEI anomaly trends for the same periods over the Kedougou region.
3.4. Assessment of Corresponding Vulnerabilities
The assessment of vulnerability to natural hazards is multidimensional, incorporating physical, environmental, and socio-economic indicators [
62]. This integrated approach to measuring vulnerability provides a comprehensive assessment [
63].
Vulnerability to natural hazards is not a fixed value, but varies according to the type of phenomenon studied [
64], as each has its own characteristics that modulate both the exposure and sensitivity of populations and ecosystems. Vulnerability to natural hazards was assessed using a continuous weighted composite index, which recognises vulnerability as a spatially continuous function of socio-economic, physical, and environmental exposure (
Table 8).
For each hazard, a normalised Vulnerability Index (VI) was computed as a weighted linear combination of n standardised indicator layers.
The continuous vulnerability index for a pixel x at time t is defined as follows:
where VI (x, t) is the vulnerability index at pixel x and period t; Wi is the normalised weight of indicator i (Σwi = 1); and Ni (x, t) is the normalised value of indicator i at pixel x and at period t.
Like hazards, it is treated temporally to identify areas where sensitivity to issues has persisted or increased over the thirty years of the study (1995–2024).
3.5. Risk Calculation
Natural risk is conceptualised as the result of the interaction between the recurrence of a hazard and the sensitivity of the assets at stake. In accordance with the definition of Thouret and D’ercole [
25], as well as the theoretical frameworks of Blaikie et al. [
65] and Wisner et al. [
62], the methodology applies the following fundamental equation:
In this model, vulnerability is comprehended in a multidimensional manner. It explicitly integrates the exposure of assets through physical and socio-economic indicators. Thus, exposure parameters (such as population density, the extent of cultivated areas, and the degree of urbanisation) are directly included in the calculation of vulnerability. This approach allows for the consideration that exposure is not an isolated factor, but an intrinsic component of the social and environmental vulnerability of the territory.
To ensure consistent mathematical integration, the calculation process follows several rigorous steps: after modelling each hazard by recurrence and characterising its corresponding vulnerability, the two components are normalised on a common scale ranging from 0 to 1. This scaling step is essential for cross-referencing heterogeneous data.
The final risk is calculated on the Google Earth Engine (GEE) platform. By multiplying the image of the recurring hazard by that of vulnerability, the system generates a spatialised risk map. The affected areas (in km2) are then accurately quantified using the ee.Image.pixelArea() function, allowing the risk to be classified into different levels of impact.
The normalised composite risk index (range 0–1) is classified into three levels using equal interval boundaries: low risk (0–0.33), medium risk (0.33–0.66), and high risk (0.66–1.00).
3.6. Multi-Risk Study
Multi-risk assessment aims to go beyond single risk analyses by synthesising the various risks to which a territory is exposed. This approach is essential for strategic territorial planning, as it identifies areas where several threats accumulate or are exacerbated. The methodology adopted is based on a combination of local expert knowledge, gathered through surveys, and a multi-criteria analysis structured using the Analytic Hierarchy Process (AHP) method.
3.6.1. Participatory Survey
The multi-risk map is generated by combining risks using the AHP multi-criteria analysis model [
11]. The AHP was chosen because it allows the consistency of the weighting to be verified by calculating the Consistency Ratio (CR) [
17].
The weights of the criteria (risks) were determined based on the results of a participatory survey conducted in six Senegalese institutions. This participatory survey aimed to gather local stakeholders’ perceptions and priorities regarding the main natural hazards in order to assign degrees of importance to these hazards based on their severity and potential impact in the local context.
The methodological approach for the survey of six (6) Senegalese institutions was based on the use of a questionnaire sent in March 2025. The KoboToolbox platform was used to create a simple and accessible online form, facilitating data collection.
The questions focus on perceptions of the impact and significance of each risk on populations and ecosystems and the challenges encountered in natural risk management. The questionnaire was then distributed to a sample of institutions such as the Centre for Ecological Monitoring (CSE), the National Civil Aviation and Meteorology Agency (ANACIM), the Directorate for Water Resource Planning Management (DGPRE), the National Agency for Land Use Planning (ANAT), the Directorate for Flood Prevention and Management (DPGI), and the Regional Water and Forestry Inspectorate (IREF) in Kedougou. The responses were used to weight the risks according to their severity and impact, in order to incorporate these weights into the overall multi-criteria analysis of the project.
Each institution assigns a score of 1 to 5 to four criteria (drought, forest fires, extreme heat, and flooding). These scores reflect the perceived importance of each risk.
The data collected was filtered and analysed in Excel before being processed with Python to determine, using statistical functions, the weight to be assigned to each of the natural risks studied. Finally, the weights were assigned to the risks on GEE.
3.6.2. Multi-Criteria Analysis Using the AHP
The AHP was chosen for the study because weighting by pairwise comparison is much better than direct weighting. It has the advantage of verifying the consistency of the weighting by calculating the consistency ratio and allows inconsistent results to be dealt with [
17].
Based on the assessments collected from six institutions, the questionnaire scores were transformed into pairwise comparison matrices, reflecting the relative importance of the criteria in pairs.
For each institution k, a pairwise comparison matrix Ak was constructed based on the importance scores Si assigned to the risks. Each element
of this matrix represents the ratio of the importance of risk i relative to risk j:
and symmetrically,
. An aggregate judgement matrix A (
Table S1) was then obtained by calculating the geometric mean of the six individual matrices:
This 4 × 4 matrix (for the four risks) summarises the collective judgement of the experts.
This step is crucial in collaborative multi-criteria analyses, allowing several opinions to be harmonised in order to arrive at a common judgement [
66].
The priority weight
of each risk (representing its relative importance in the multi-risk index) is obtained by calculating the principal eigenvector of matrix A, corresponding to its largest eigenvalue λmax. This amounts to solving the following equation:
The eigenvector w is then normalised so that the sum of its components equals 1, thus providing the final risk weights
.
The logical consistency of comparisons is verified by calculating the Consistency Index (CI) and the Consistency Ratio (CR):
where IR is Saaty’s Random Index for an n-order matrix. An RC ≤ 0.1 indicates satisfactory consistency of judgements, thus validating the reliability of the calculated weights [
67]. In this study, an RC of 0.08 was obtained, confirming the robustness of the aggregation of expert opinions.
The multi-risk map is ultimately generated by a weighted linear combination of the four normalised individual risk maps. Thus, the Multi-Risk Index (MRI) is formalised by the following weighted summation equation:
where n corresponds to the number of hazards considered (n = 4), Wi represents the priority weight derived from the Analytic Hierarchy Process (AHP) (
Table 9), and Ri corresponds to the normalised individual natural risk. This formalisation allows heterogeneous data to be aggregated within a robust framework, validated by a Consistency Ratio (CR) of 0.08, ensuring that the combination of risks respects the decision-making logic of the consulted experts. The multi-risk map is then reclassified into categories (low, medium, high) for interpretation.
4. Results
4.1. Hazard Mapping
4.1.1. Forest Fires
Analysis using the NBR index [
30] reveals a major spatio-temporal change. Over the period 1995–2004, fires affected 2253.9 km
2 (13.3% of the Kedougou region). Between 2005 and 2024, a radical decline was observed, with only 1.2% of the area burned between 2015 and 2024. The recurrence map identifies hot spots where 472.7 km
2 (2.8%) burned systematically during all three study periods, while 685.1 km
2 (4.1%) were affected during two periods.
Spatially, the highest fire recurrence is concentrated in the northern and central parts of the region, particularly in municipalities with extensive savannah cover and agricultural–forest interfaces.
4.1.2. Drought
The use of the VHI [
35] confirms a regional climate shift. Between 1995 and 2004, only 107 km
2 (0.6%) were classified as ‘dry’ areas (VHI < 30%). This area increased tenfold to approximately 2020 km
2 (11.9%) after 2005. Although the recurring drought over thirty years is localised (6.9 km
2), more than 2946.5 km
2 (17.4%) have experienced severe water stress at least once.
4.1.3. Flooding
The MNDWI [
46] was used to isolate flooded areas, showing a peak of 235 km
2 (1.4%) between 2005 and 2014. This increase is attributed to a combination of post-drought rainfall [
68] and unplanned urbanisation reducing soil infiltration [
69]. The department of Saraya is the most exposed due to the overflowing of the Falémé River and water erosion accentuated by steep slopes reaching 61.6% [
70].
4.1.4. Extreme Heat
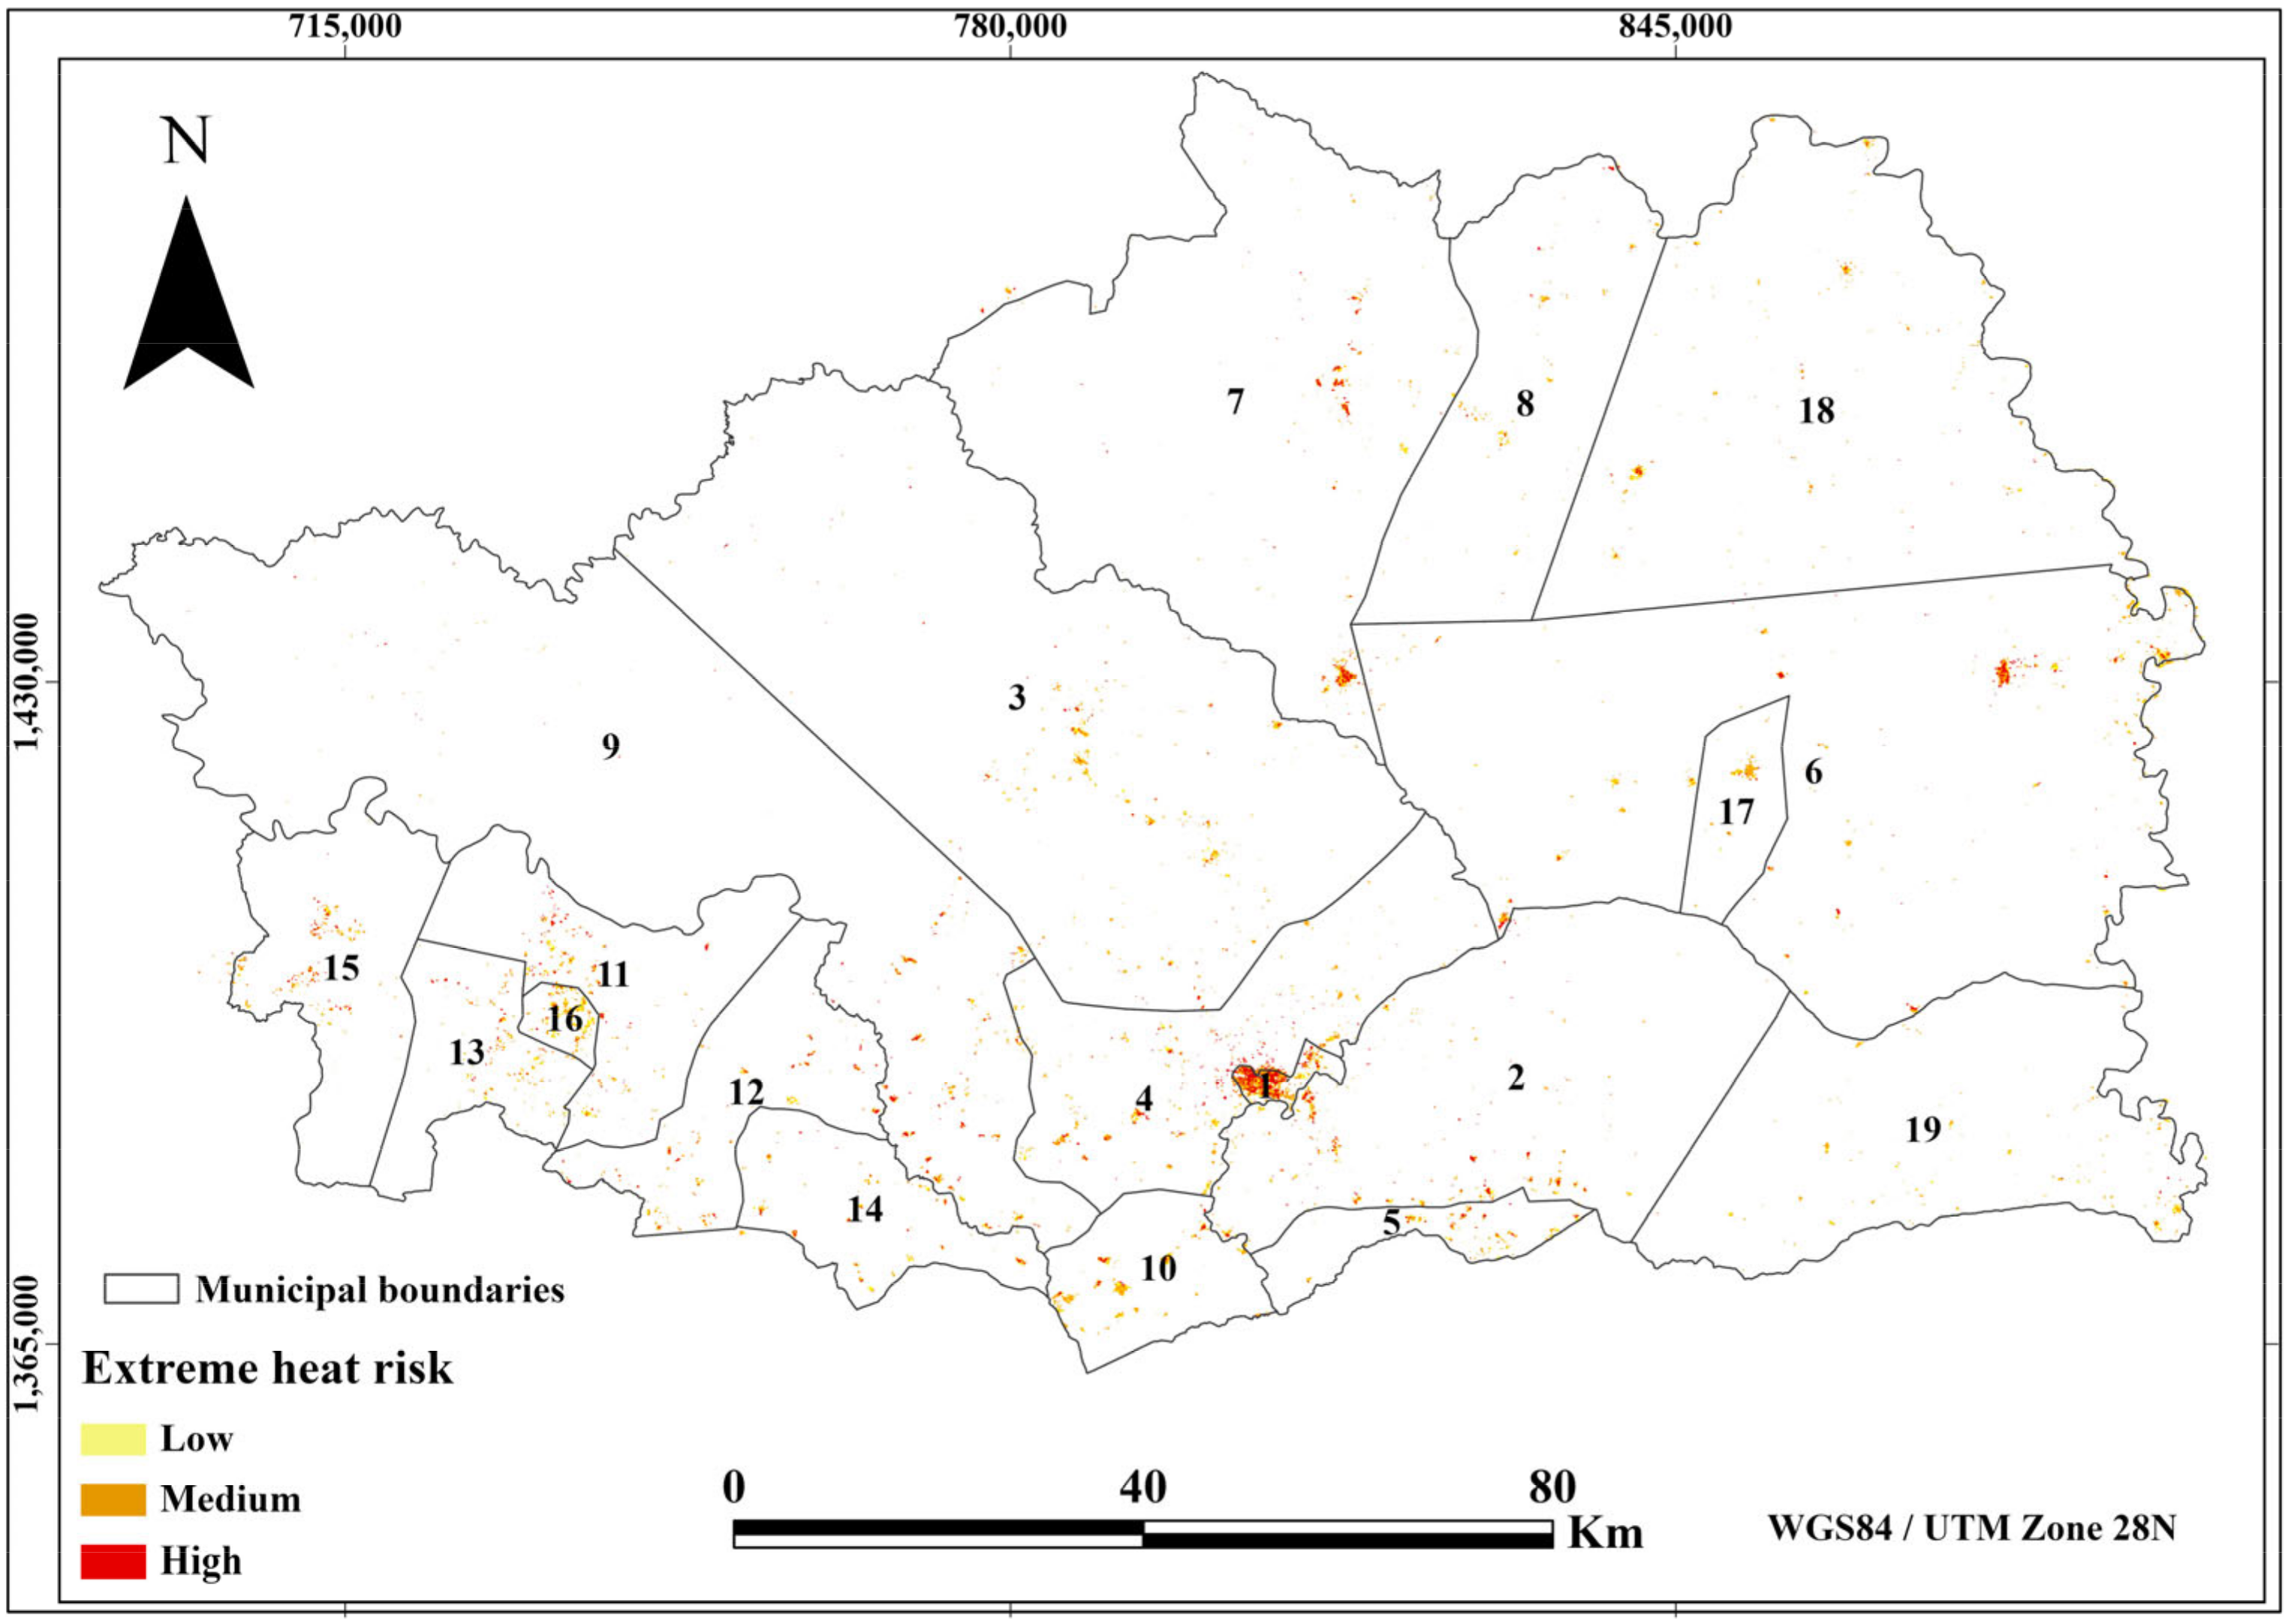
The analysis of the Land Surface Temperature (LST) reveals significant exposure to extreme heat across the Kedougou region. Using a threshold based on the 90th percentile, our results indicate that 25.2 km2 are exposed to high-recurrence extreme heat and 62.3 km2 to medium-recurrence extreme heat.
The spatial distribution of extreme heat zones shows a progressive expansion from 9127 km2 (54.0% of the region) between 1995 and 2004 to 2228.3 km2 (13.2%) between 2015 and 2024, with 984.5 km2 (5.8%) exposed during all three periods. High-recurrence zones are concentrated around Kedougou town and Sabodala, where the combination of low vegetation cover and expanding impervious surfaces amplifies surface temperatures.
4.1.5. Validation of Natural Hazards
Table 10 presents the results of spatial intersection validation for the three hazards assessed quantitatively (forest fires, floods, and extreme heat) for the period 2015–2024.
The overlap rates obtained (44–59%) are consistent with the differences in spatial resolution and detection principles between the Landsat sensors and the reference sources. For forest fires, the rate of 59.2% is mainly explained by the difference in spatial resolution between Landsat (30 m) and the MODIS MCD64A1 product (500 m): due to its coarse resolution, MODIS aggregates several small burnt areas into a single pixel, leading to an overestimation of reference areas and, consequently, a partial overlap rate with the finer-resolution Landsat mapping [
58]. For floods, the 43.9% overlap reflects the inherent differences between optical (Landsat) and radar (Sentinel-1) detection: the latter, which is unaffected by the frequent cloud cover during the rainy season, is capable of detecting flooded areas inaccessible to optical sensors during intense rainfall events [
59,
71], which mechanically explains why the Sentinel-1 reference area is larger than that mapped by Landsat. For extreme heat, the rate of 50% is mainly attributable to the spatial generalisation induced by the kilometre-scale resolution of MODIS MOD11A2, which smooths out local thermal variations and enlarges areas exceeding the 42 °C threshold compared to 30 m Landsat detection.
The drought map was validated by comparing the VHI derived from Landsat images with the SPEI values provided by the CSIC’s SPEI Global Drought Monitor [
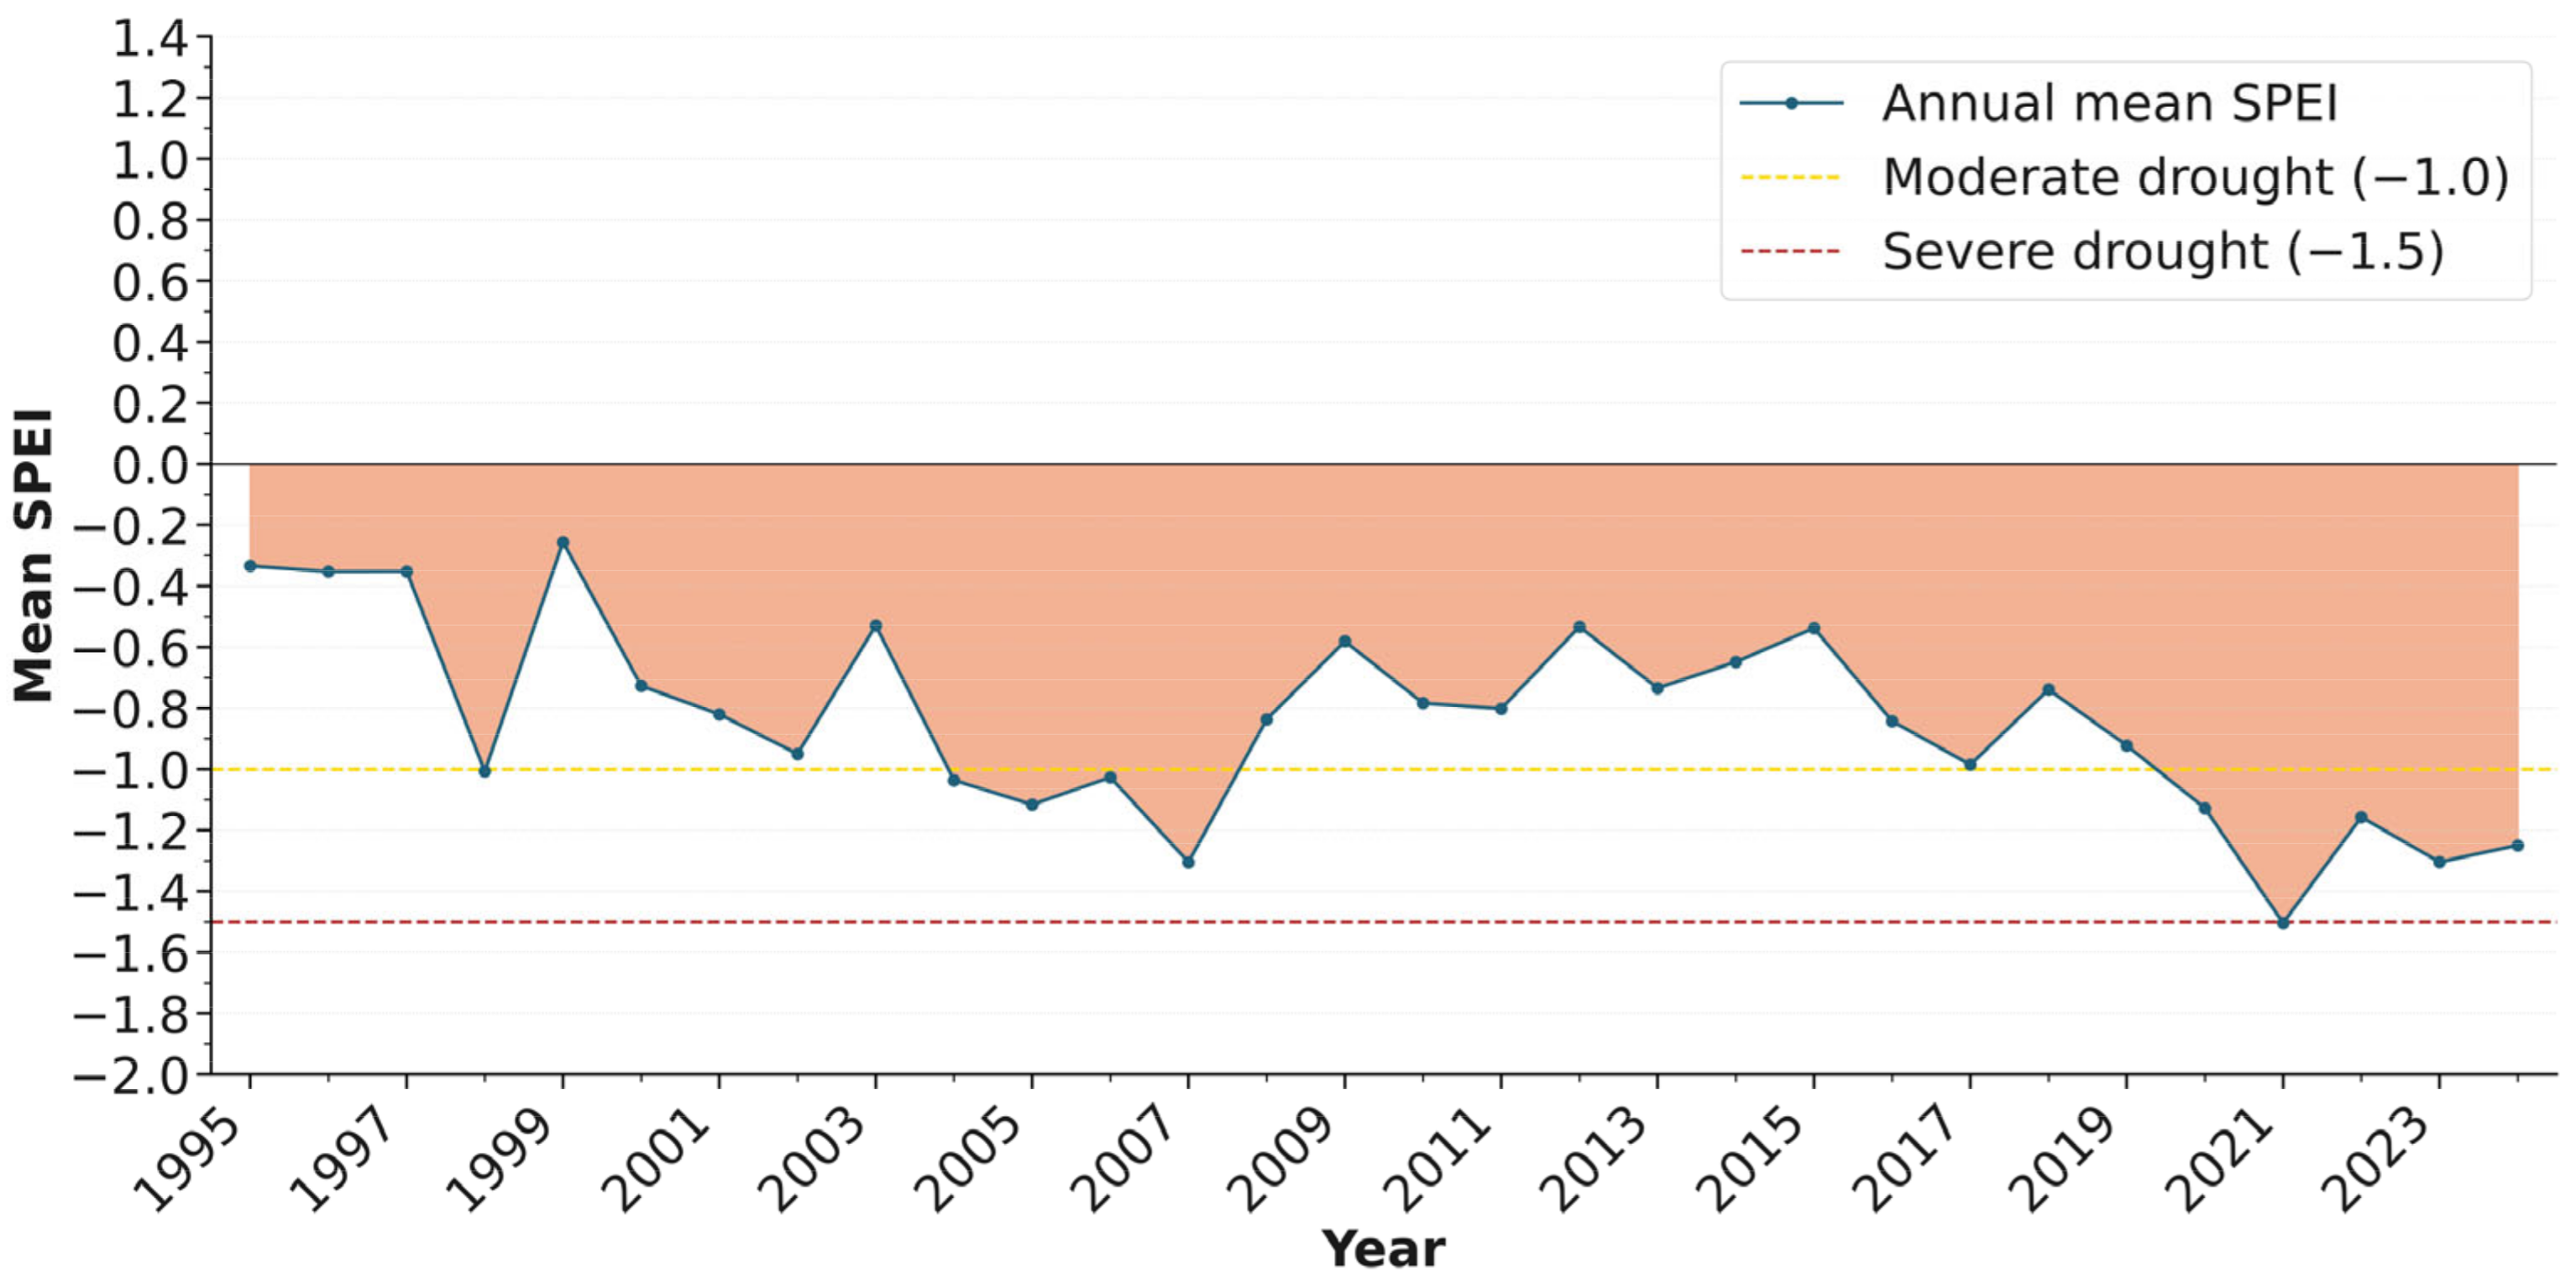
61]. As shown in
Figure 3 of the thesis, the SPEI exhibits persistently negative values throughout the study period (1995–2024), reflecting a chronic water deficit in the Kedougou region. This trend is consistent with the VHI results: the area of zones classified as dry (VHI < 30%) increases significantly in the 2005–2014 period, rising from 107 km
2 (0.6% of the region) in the 1995–2004 period to 2023 km
2 (12%) in the 2005–2014 period, then remaining at 2018 km
2 (11.9%) over the 2015–2024 period. This spatial expansion corresponds precisely to the phases in which the SPEI exhibits its most pronounced negative values, particularly during the drought episodes of 2006–2007 and 2011, thereby confirming the ability of the Landsat-derived VHI to accurately reflect drought dynamics in the region, in line with the work of Faye et al. [
72] on the progressive aridification of Senegal.
4.2. Vulnerability Assessment
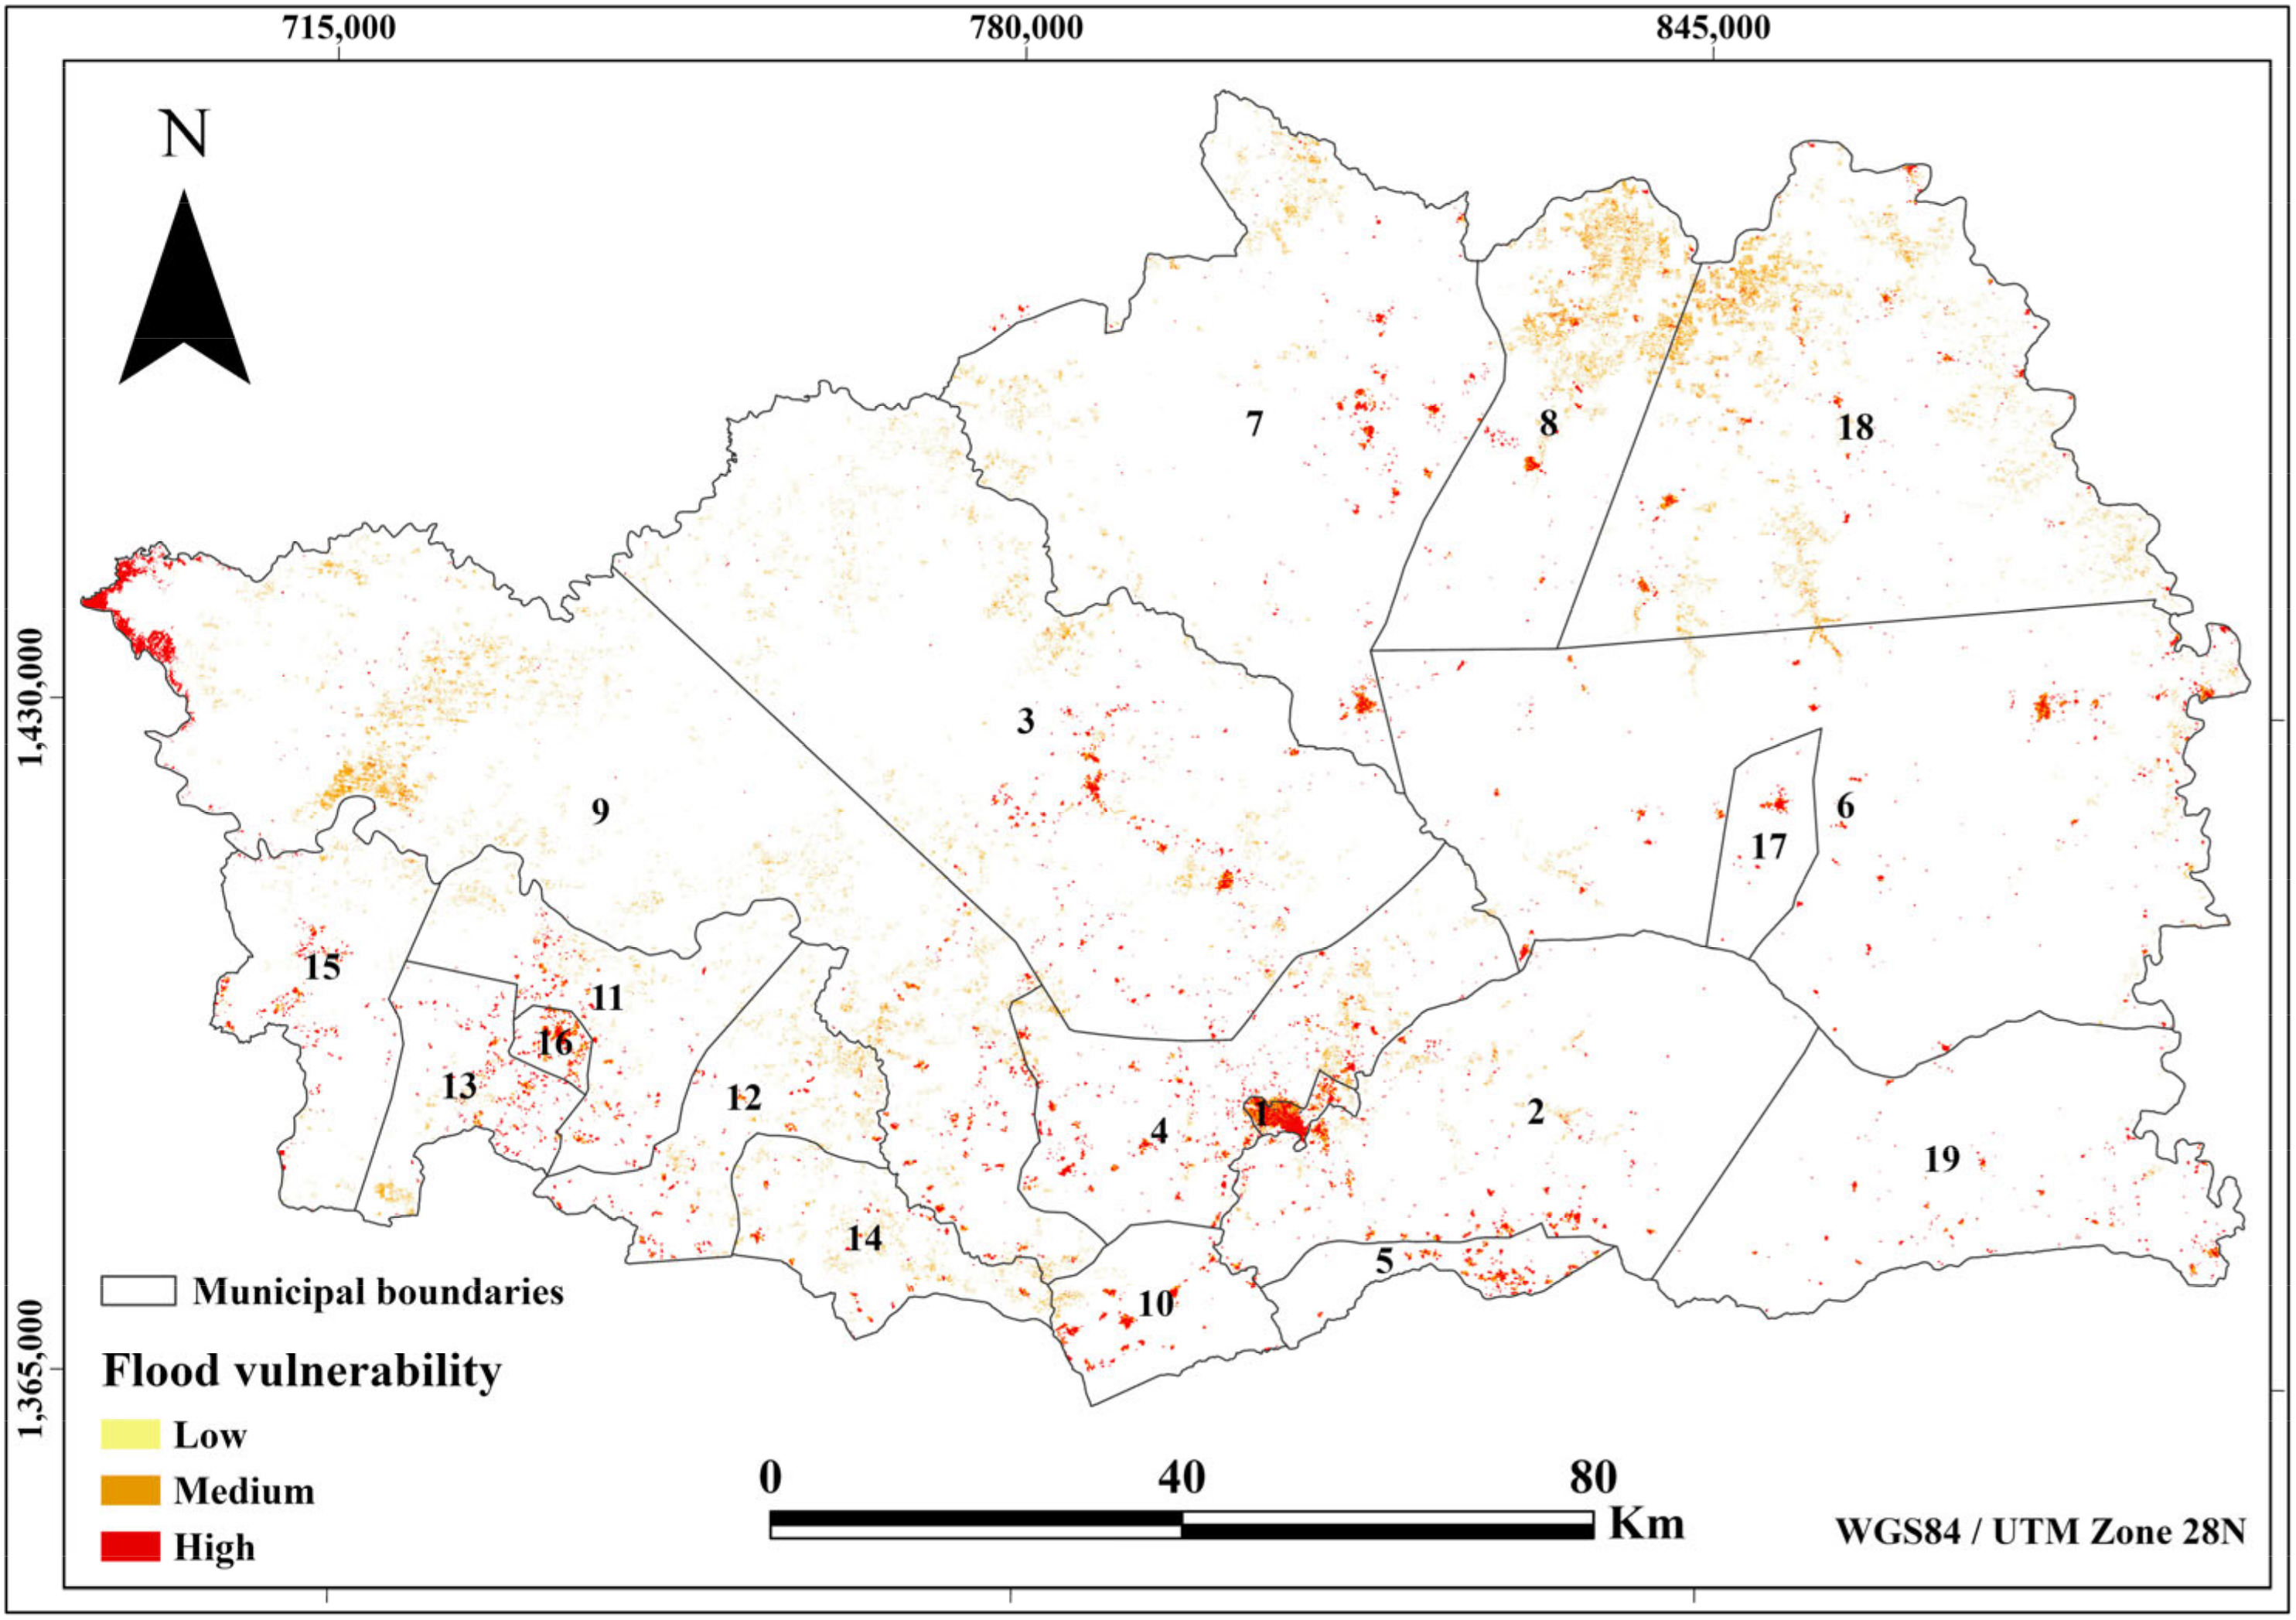
Analysis of the vulnerability of the Kedougou region to the four natural hazards between 1995 and 2024 reveals contrasting trends, influenced by specific physical, environmental, and socio-economic indicators. The overall results show a steady increase in vulnerable areas between 1995 and 2024 for all hazards (
Table 11).
This trend is mainly driven by the expansion of agricultural land and increasing urbanisation, with built-up areas increasing from 2.4% to 7.2% of the region’s total area. This anthropogenic dynamic reduces the natural regulatory capacities of ecosystems, such as soil infiltration, while increasing the density of assets exposed to climate shocks. For example, flood vulnerability mapping allows us to visualise the convergence of these physical and socio-economic factors across the territory, illustrating the areas where sensitivity has been most recurrent over the three decades of the study (
Figure 4).
4.3. Mapping of Individual Risks
The risk for each phenomenon was quantified by crossing the hazard intensity (frequency of recurrence over 30 years) with the corresponding vulnerability (exposure of physical, environmental, and socio-economic stakes). Each component was first normalised on a scale from 0 to 1.
4.3.1. Forest Fire Risk
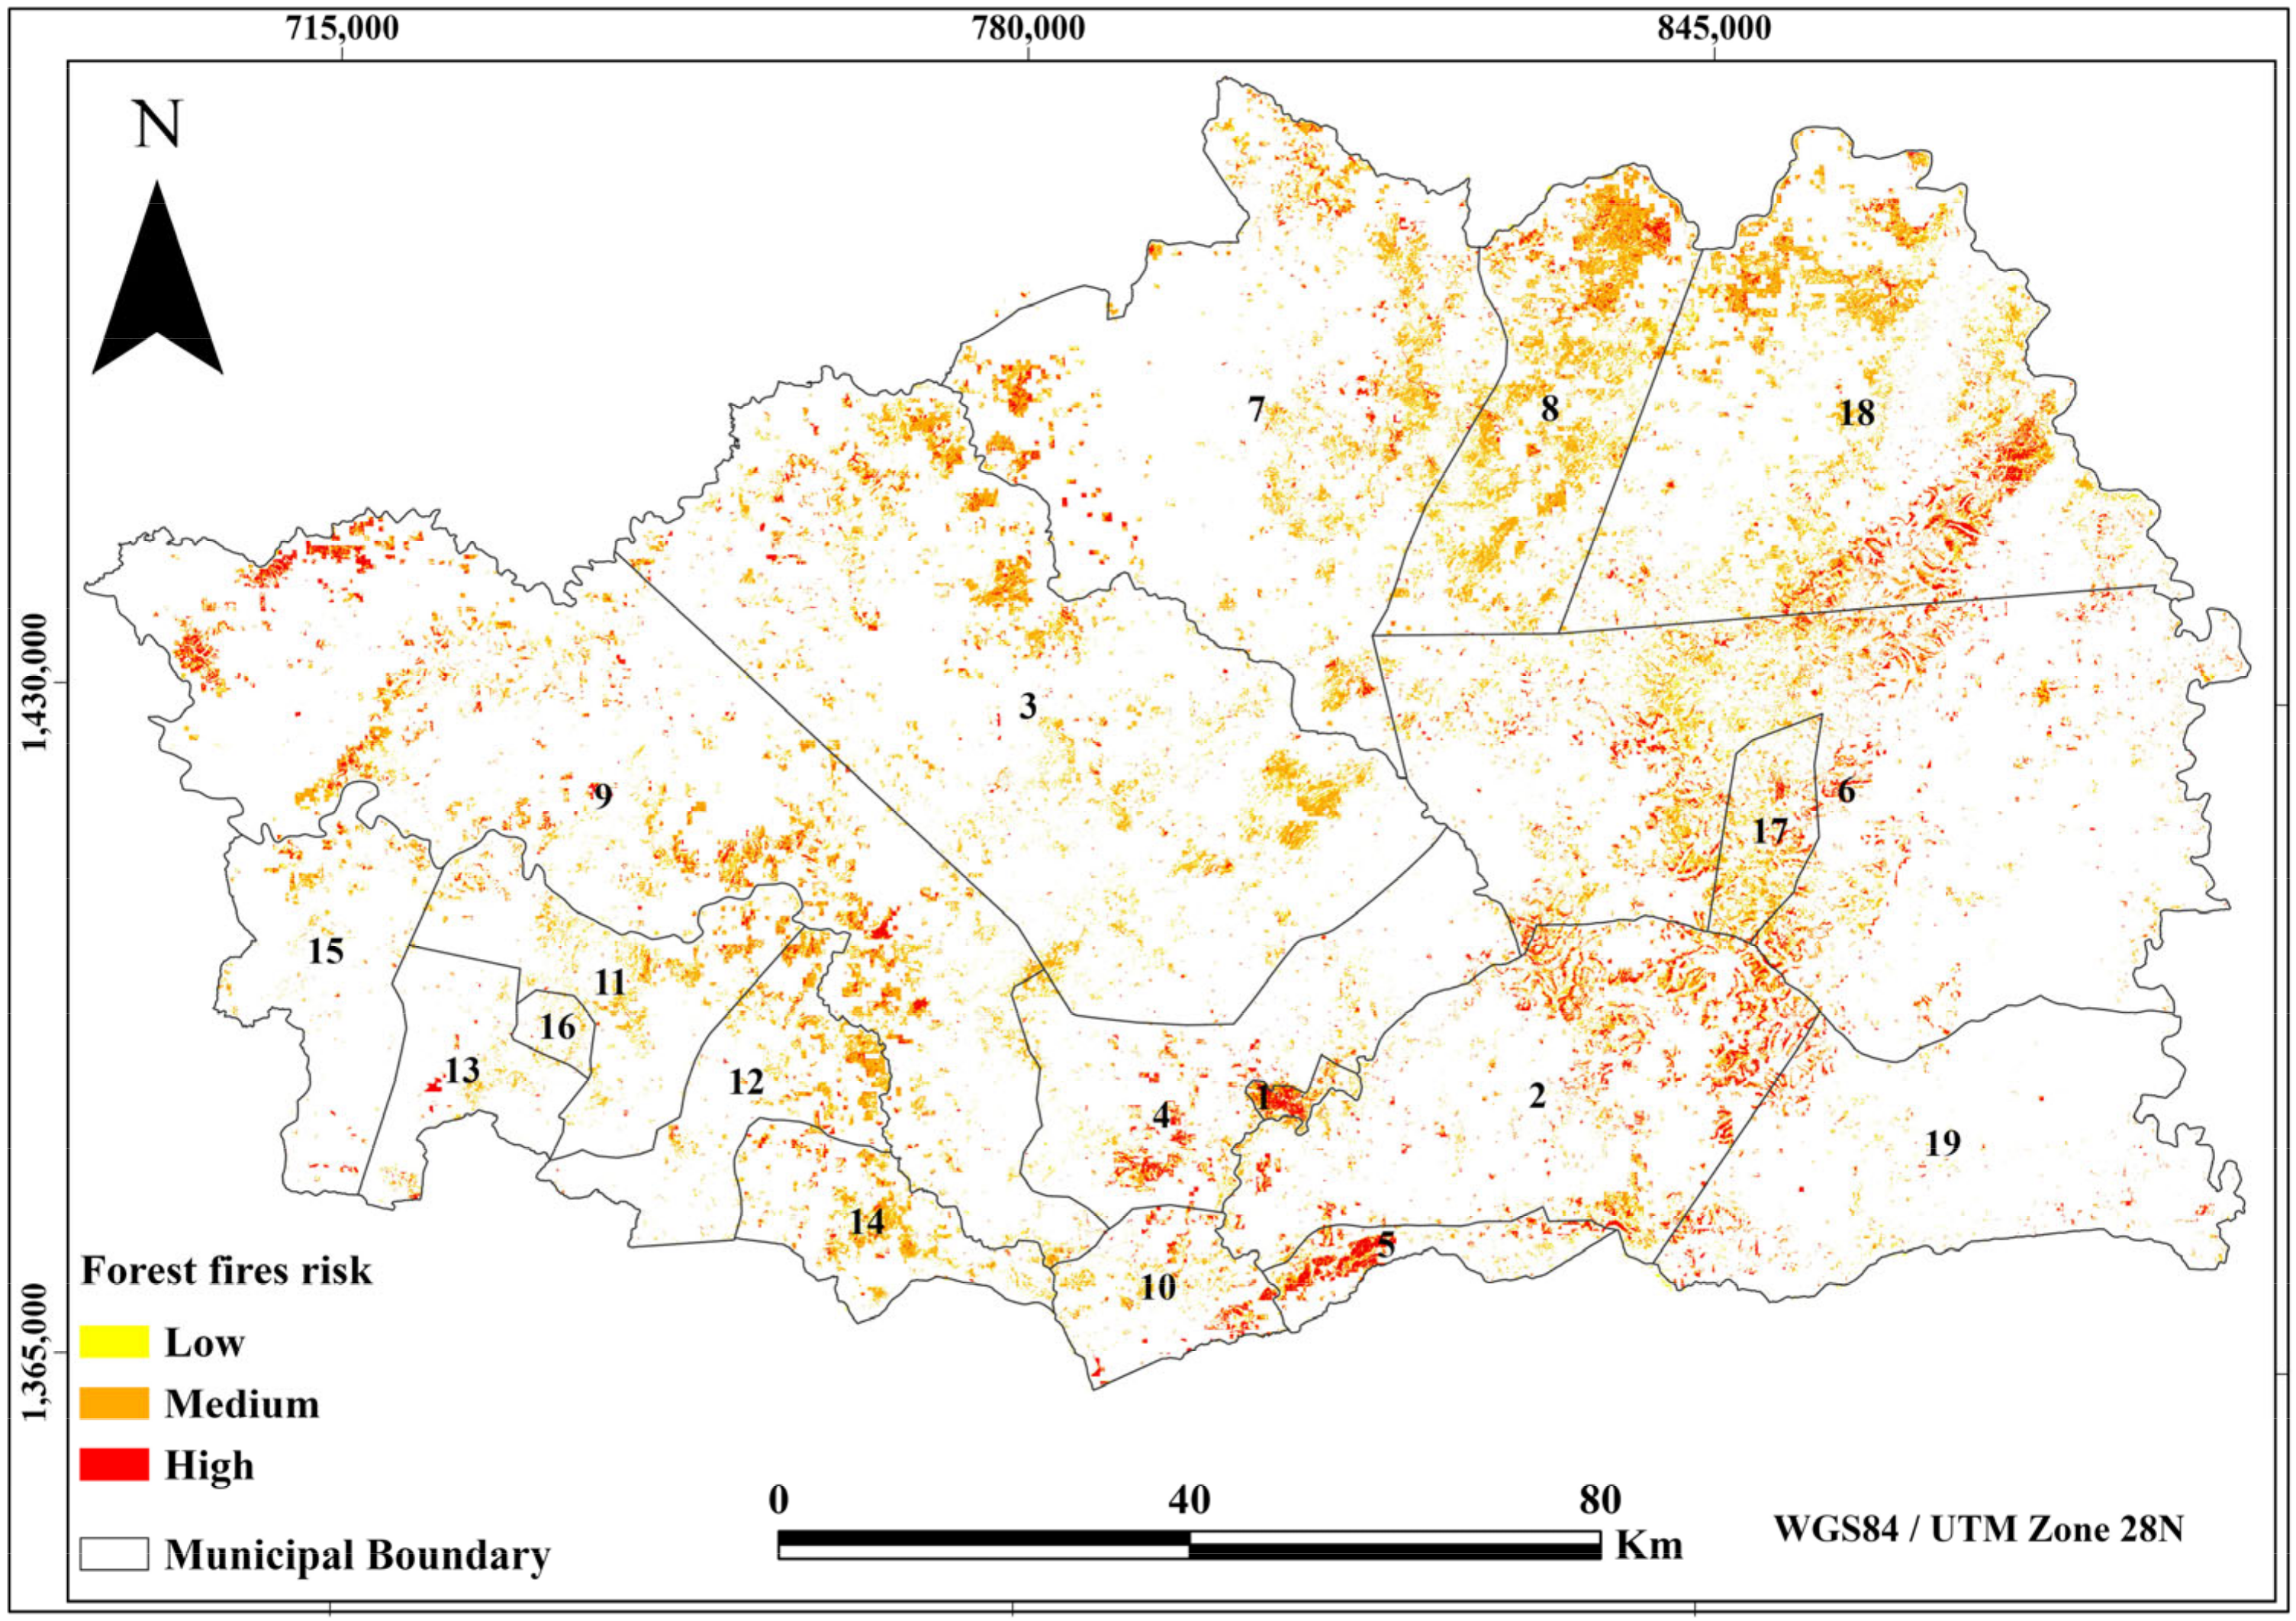
In the region of Kedougou, the risk of forest fires is major. The significance of this risk is corroborated by macro-regional assessments from the Think Hazard tool [
73], which categorises the Kedougou area as subject to ‘high’ hazard recurrence (over 50% chance that a significant hazard will occur within the next 10 years). This external estimate confirms the relevance of our detailed results, which identify 65.4 km
2 (0.4% of the region) as high-risk areas, while 1317.2 km
2 (7.8%) are exposed to medium risk (
Figure 5).
High fire risk is predominantly concentrated in the central and northern municipalities, particularly Ninefecha, Missirah Sirimana, and Khossanto, which collectively account for the largest share of medium-to-high fire risk areas. Low fire risk zones (10.3 km2) are mostly located in the southern mountainous areas of the Salémata department, where the population density and agricultural pressure are lower.
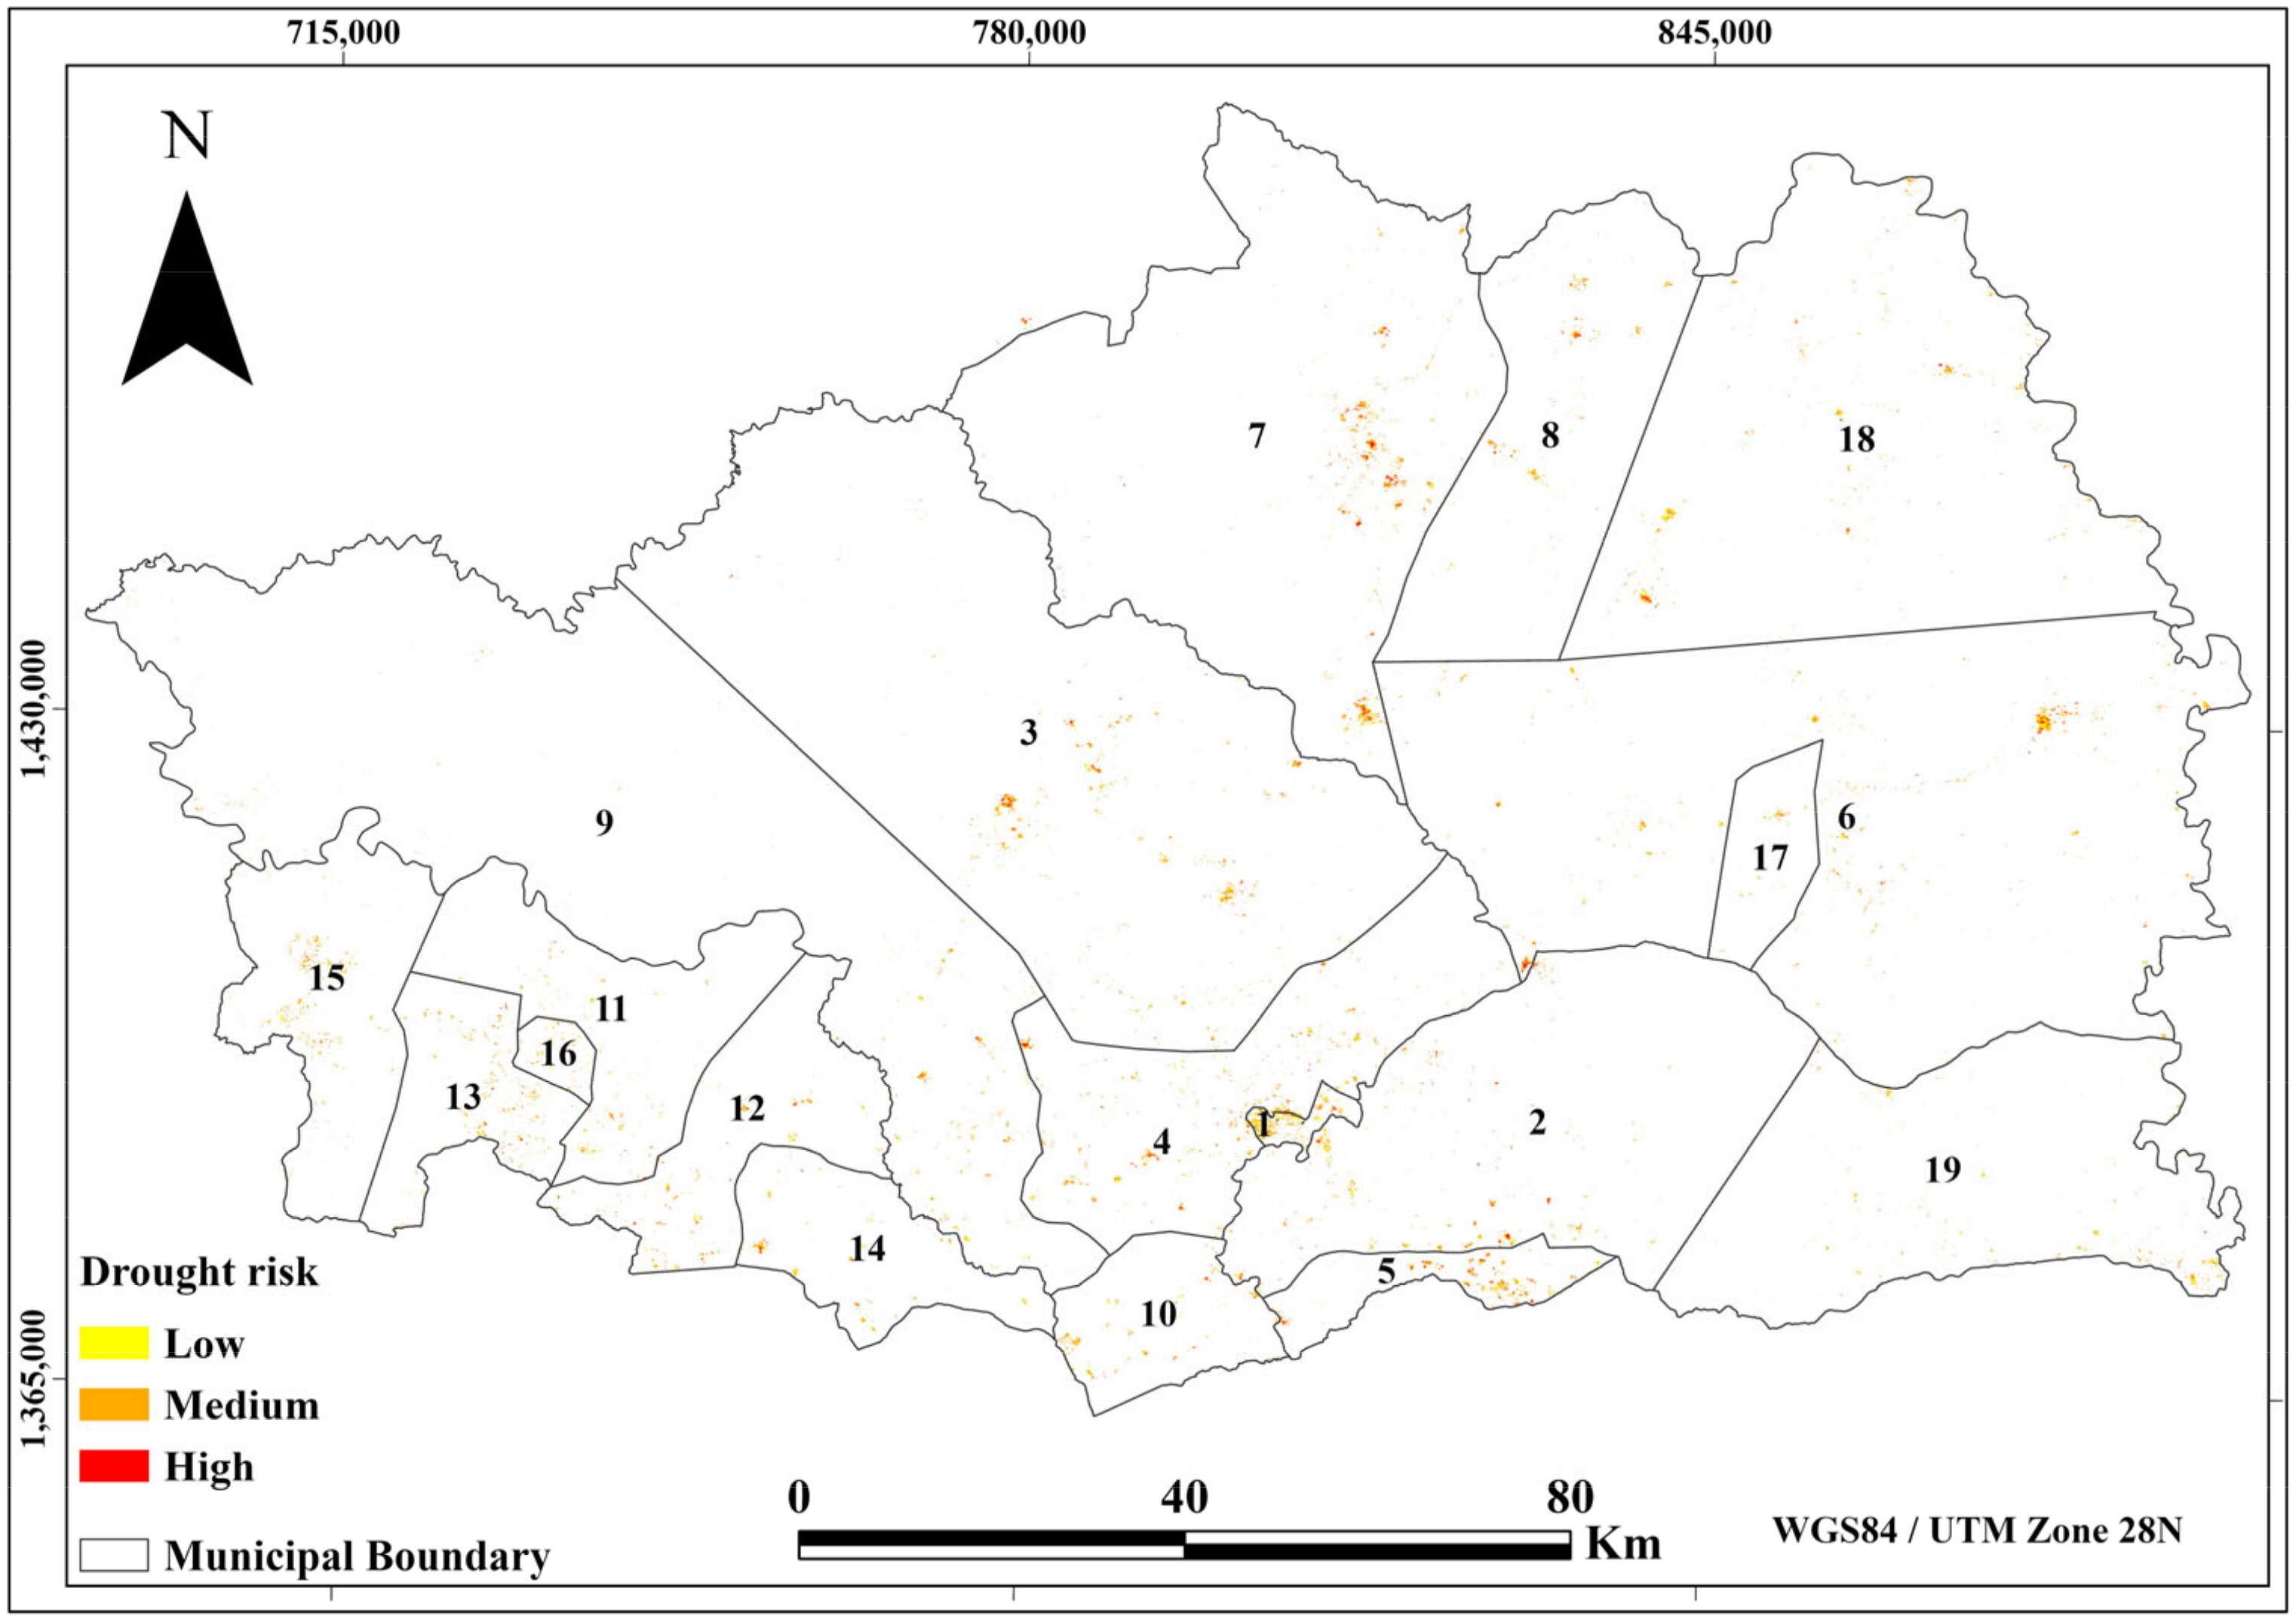
4.3.2. Drought Risk
The risk of drought in Kedougou manifests through the combination of high rainfall variability and increased environmental vulnerability. Our results indicate that an area of 4.8 km
2 is subject to a high risk level, while 29.8 km
2 present a medium risk (
Figure 6).
High and medium drought risk zones are spatially concentrated in municipalities where both VHI deficit recurrence and the cultivated land density are highest. The municipalities of Sabodala, Kedougou, and Tomboronkoto present the greatest drought risk exposure.
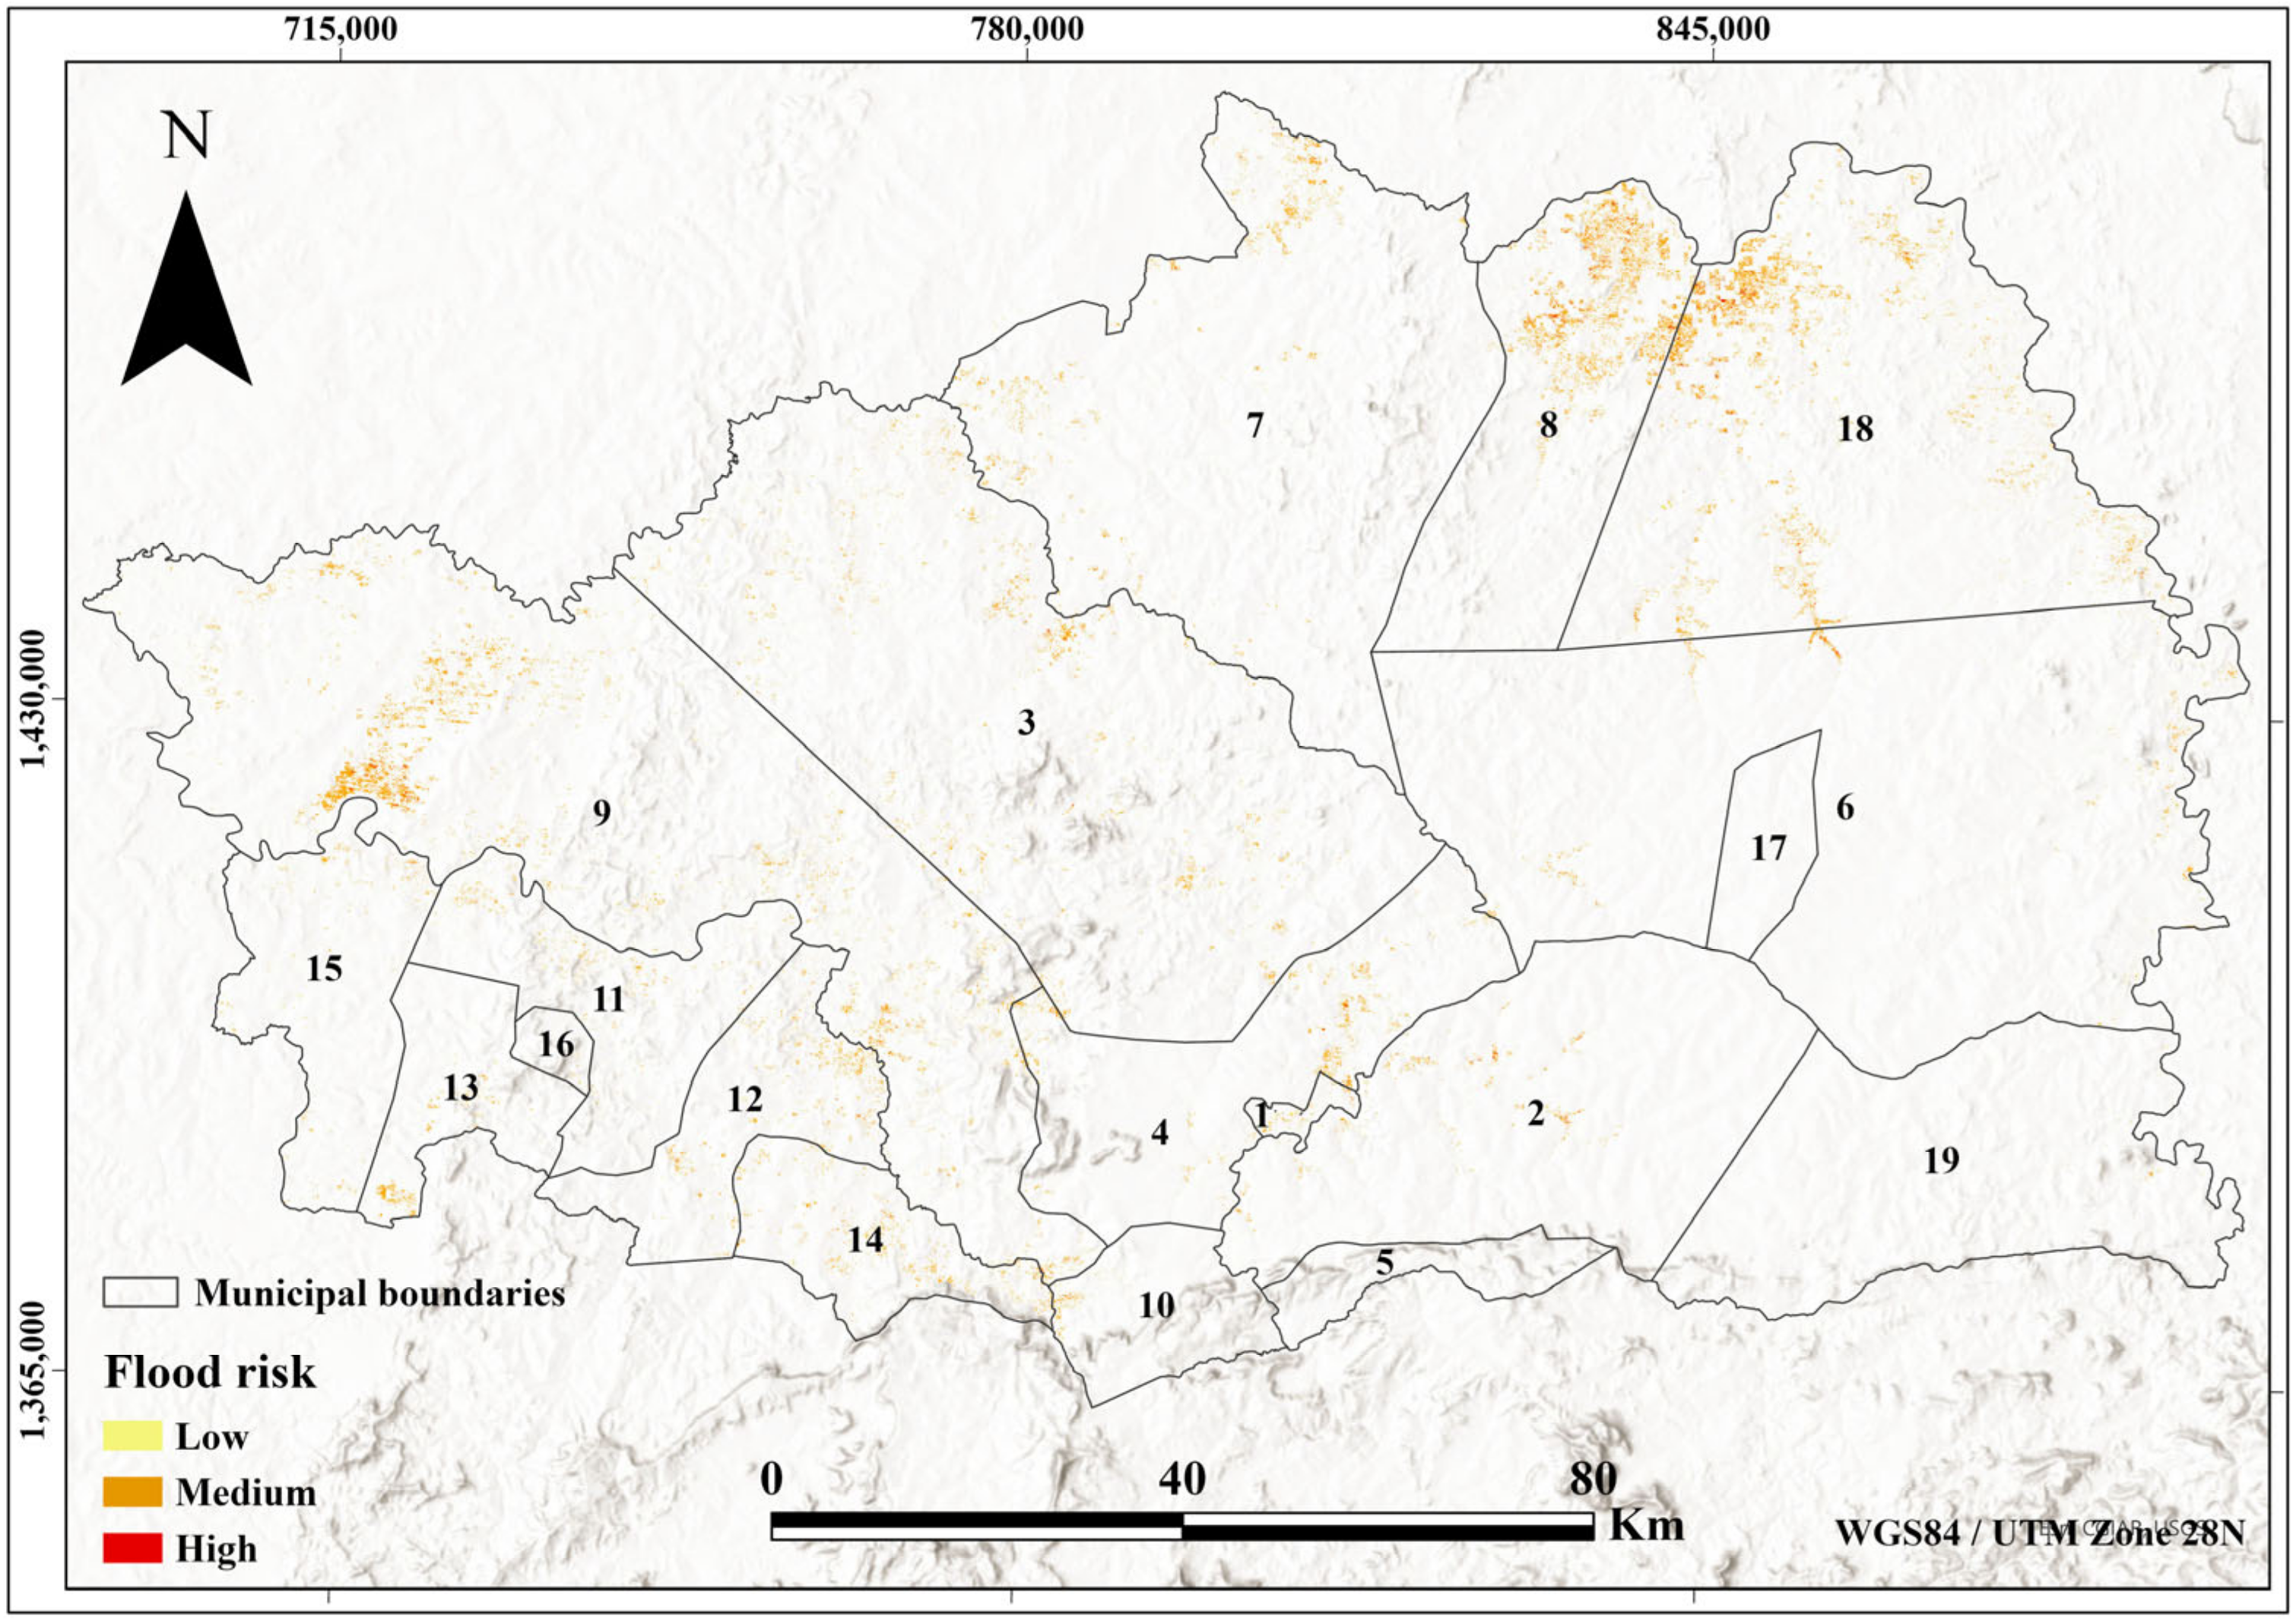
4.3.3. Flood Risk
The analysis of flood risk, combining the MNDWI and SRTM topographic data, reveals that 3.9 km
2 are subject to high risk and 173.6 km
2 to medium risk (
Figure 7).
The department of Saraya (north-east of Kedougou) appears to be the area most affected by this risk. Within Saraya, flood risk is spatially correlated with proximity to the Falémé River corridor and with low-altitude zones, where the majority of high-risk pixels are concentrated. The municipalities of Missirah and Khossanto also record notable medium flood risk areas, linked to their low-lying topography along secondary watercourses.
4.3.4. Extreme Heat Risk
The risk of extreme heat results from the interaction between a growing climatic hazard and significant socio-economic vulnerability. Our results indicate that 25.2 km
2 present a high risk and 62.3 km
2 a medium risk (
Figure 8).
High extreme heat risk is geographically concentrated in and around Kedougou town and Sabodala, where the combination of LST exceedance and high population density produces the most critical exposure conditions.
4.4. Multi-Risk Mapping
The multi-risk assessment integrates the risk of droughts, floods, forest fires, and extreme heat via an AHP (Analytic Hierarchy Process) multi-criteria analysis, weighted by participatory surveys with local institutions. This approach allows for the risks to be hierarchised according to their perceived impact and frequency of occurrence.
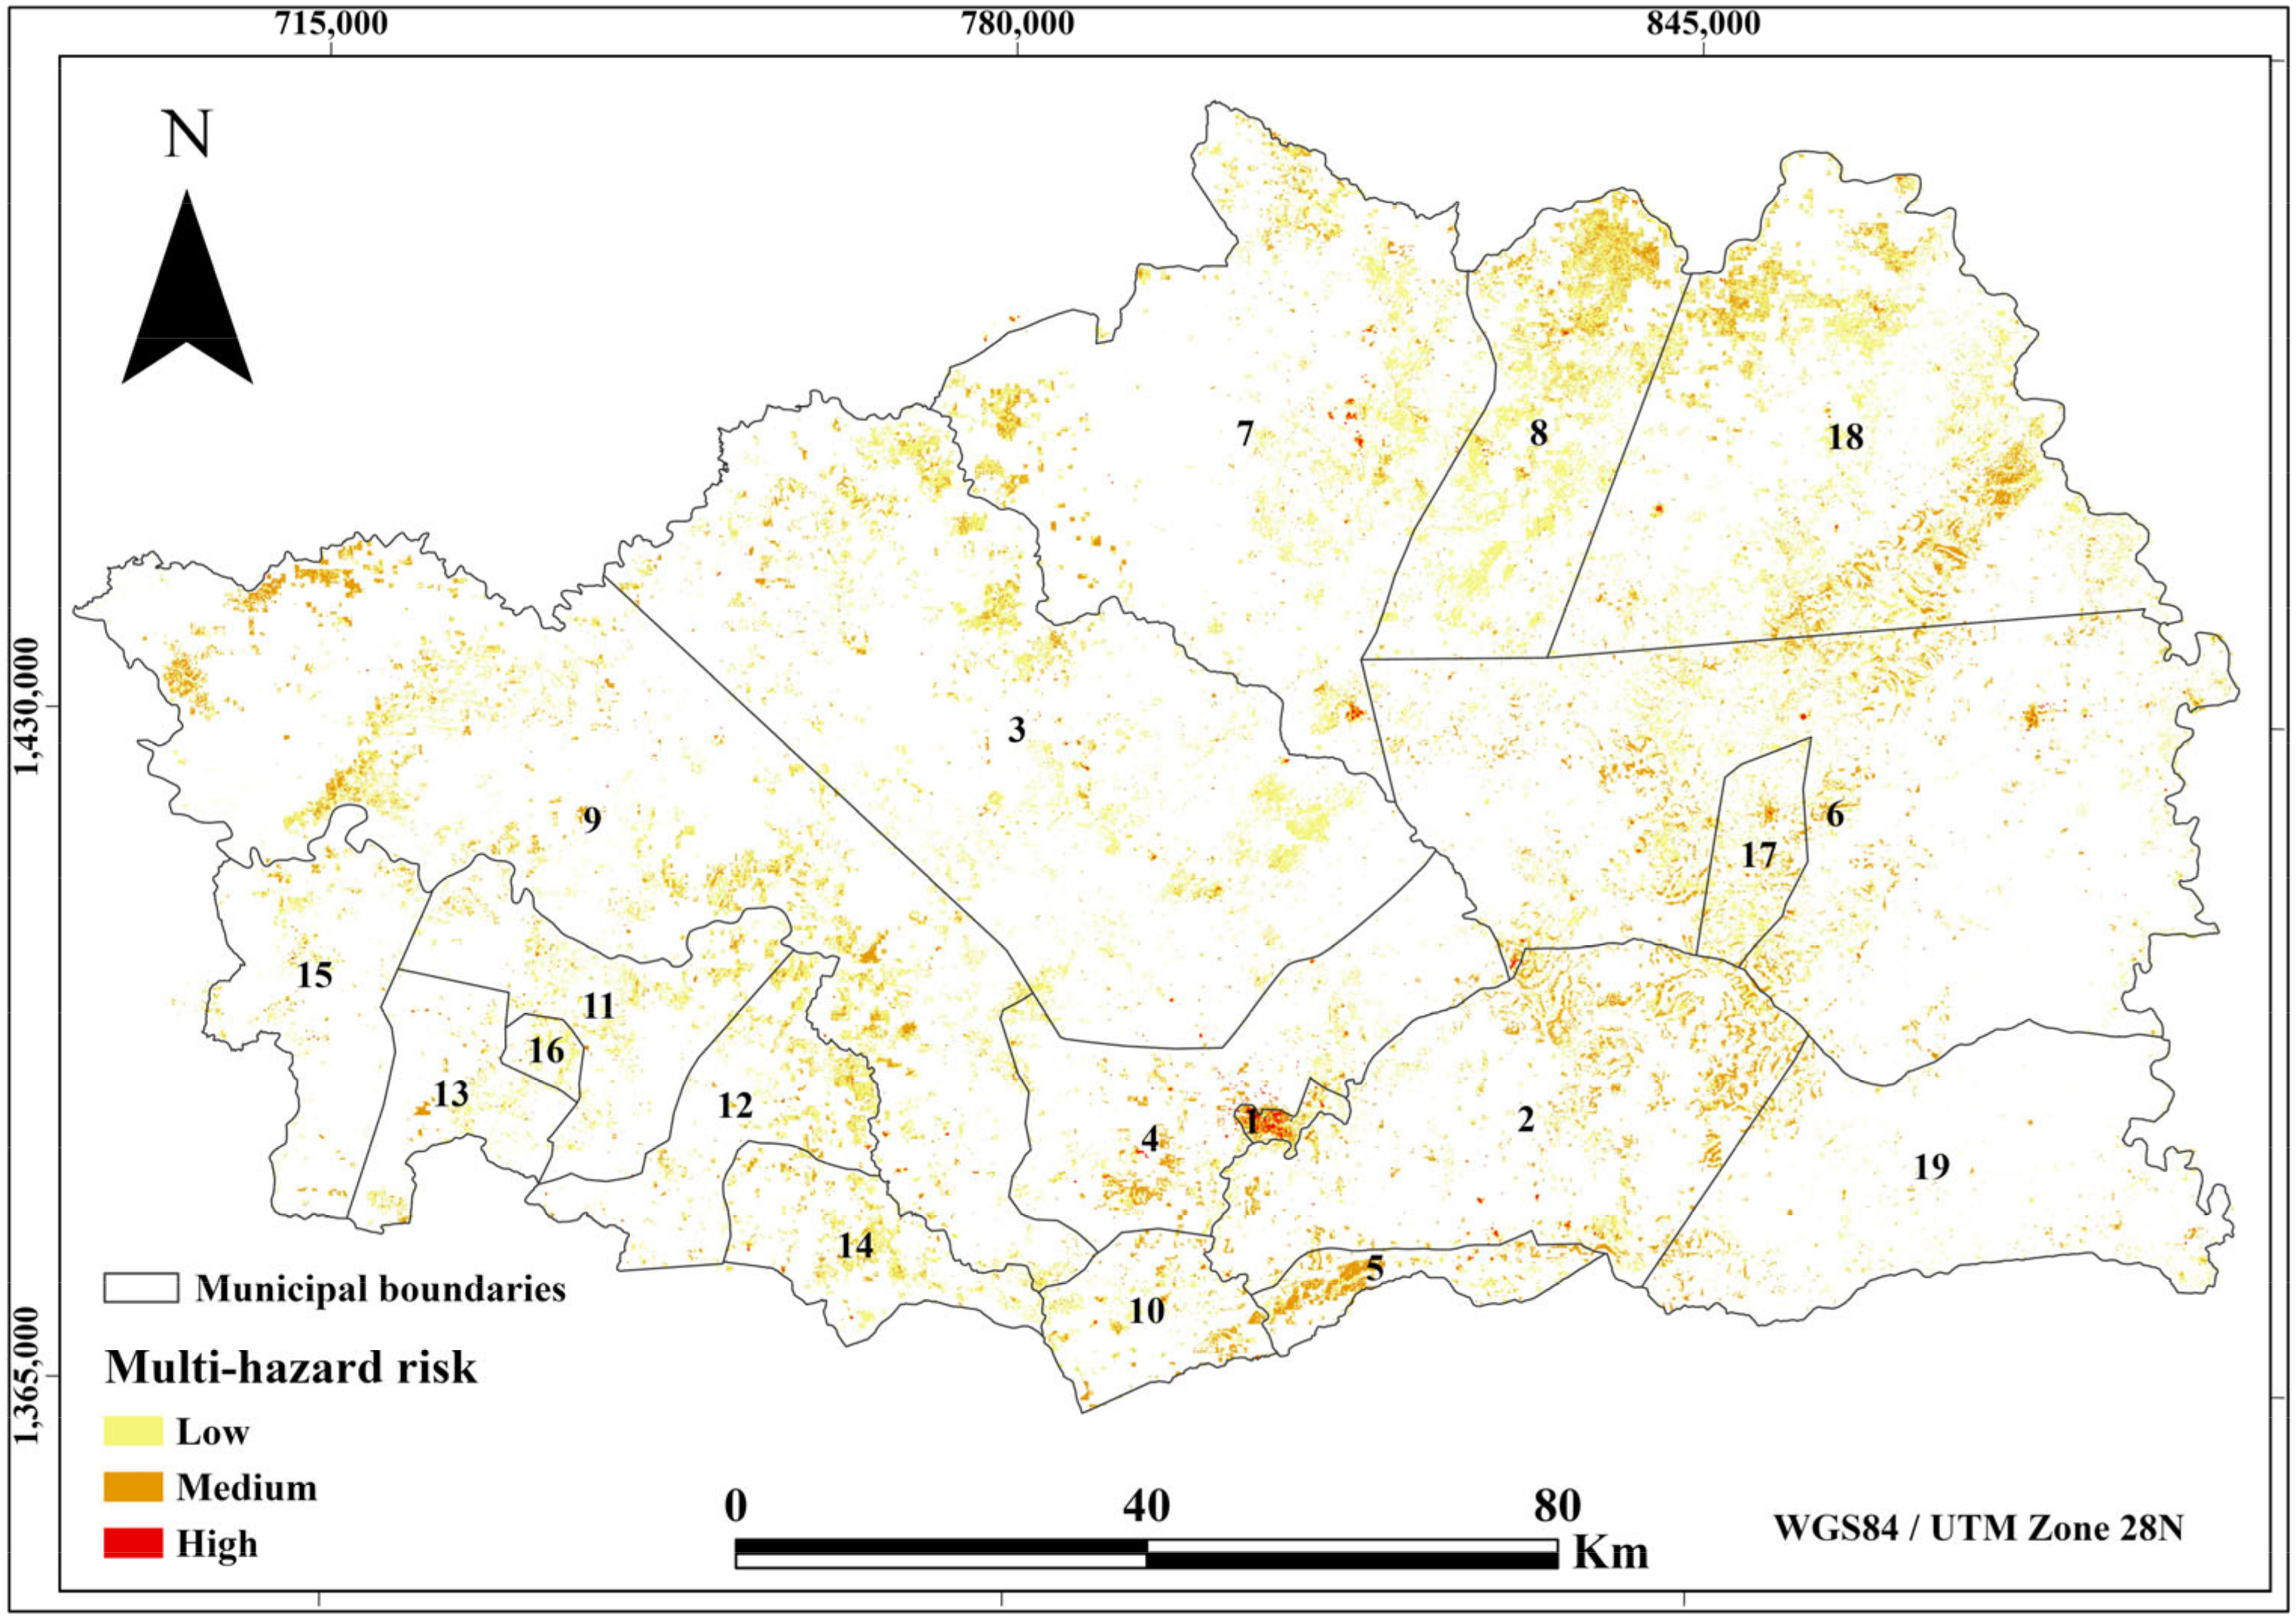
Figure 9 presents the multi-risk map for the Kedougou region. As this figure shows, densely populated areas and those with robust ecosystems exhibit medium to high multi-risk levels. These zones are systematically characterised by medium to high levels of risk related to floods, forest fires, and extreme heat. Analysing
Figure 9, it is observed that in the Kedougou region, 76.1 km
2 (0.5% of the area) experience a high multi-risk level, 683.4 km
2 (4% of the region) display a medium multi-risk level, and 2148.81 km
2 (12.7% of the region) are characterised by a fairly low multi-risk level.
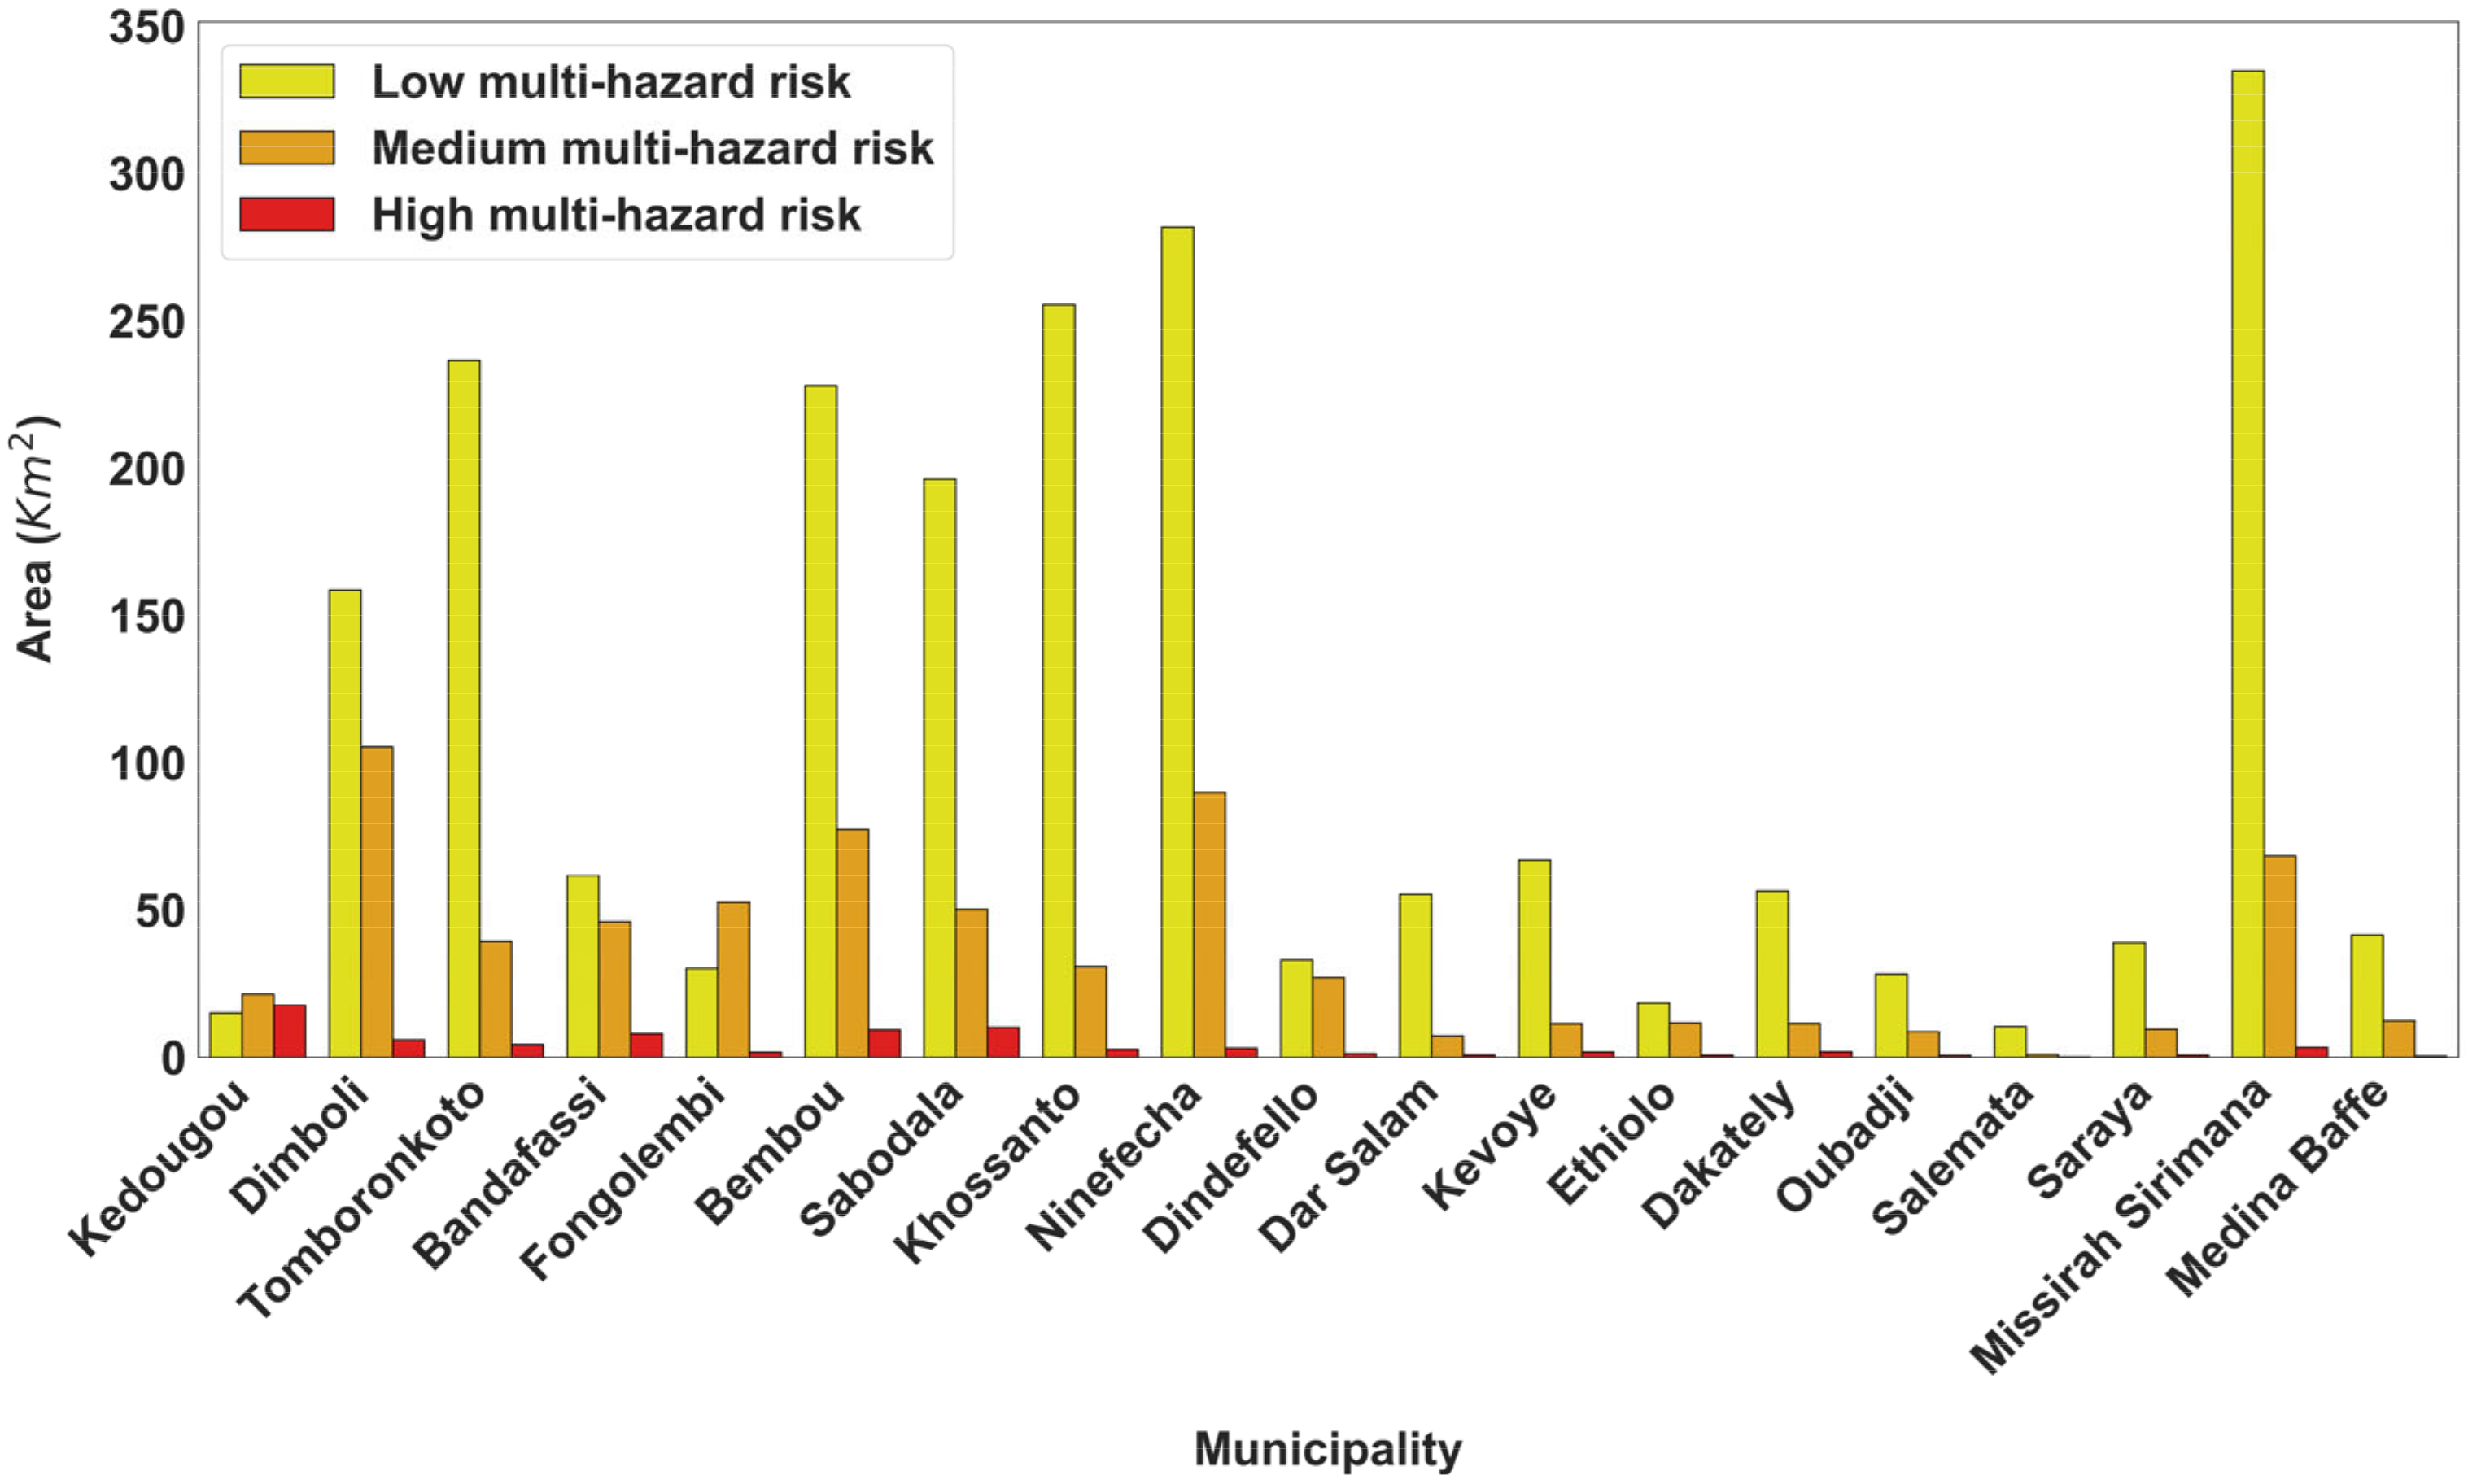
A closer examination of the municipalities exposed to multiple risks shows that the municipalities of Missirah Sirimana (406.7 km
2), Ninefecha (374.9 km
2), Bembou (314.7 km
2), and Khossanto (289.2 km
2) account for the largest areas at risk, but these are predominantly characterised by low risk, reflecting their vast territorial extent rather than an inherently high level of vulnerability. In contrast, the municipality of Kedougou stands out clearly from the others due to the structure of its distribution: although it is not the largest (54.4 km
2), it has the highest proportion of high-risk areas, covering 17.7 km
2 or 55.6% of its total area, making it the most exposed municipality in the region (
Figure 10). This singularity is likely due to the concentration of human activities, infrastructure, and urbanised areas characteristic of a regional capital.
To a lesser extent, the municipalities of Sabodala (10.3 km2 at high risk), Bembou (9.3 km2), and Bandafassi (8.1 km2) also have a significant number of areas at high risk, likely linked to their intensive mining and agricultural activities. In contrast, the municipalities of Salemata (0.2 km2), Medina Baffé (0.5 km2), Oubadji (0.7 km2), and Ethiolo (0.8 km2) remain very minimally affected by high risk (areas of less than 1 km2).
The population exposed to multiple risks is estimated by intersecting the risk zones with the GHSL population layer. Approximately 33,889 people, or 13.5% of Kedougou’s population, are estimated to be exposed. By also intersecting the risk zones with the cultivated areas layer, the area of cultivated land exposed to risk is 18.9 km2.
According to the results of our questionnaire, it is noted that floods and forest fires are the most significant in Kedougou due to their frequency of occurrence and the severity of their economic and environmental impacts.
4.5. Publication on MapX
The study results have been published on the MapX platform, which centralises over 2000 spatial datasets in open data, covering information on natural hazards, population vulnerability, land use, infrastructure, and numerous other environmental themes.
The platform allows for the overlay and interactive exploration of these different layers, facilitating the identification of areas exposed to forest fires, droughts, floods, and extreme heat, as well as the assessment of cultivated land and vulnerable populations. MapX thus provides open and practical access to multi-risk data, enabling local institutions and decision makers to visualise and utilise the results for planning, prevention, and integrated risk management in the Kedougou region.
5. Discussion
5.1. Contribution of Remote Sensing to Long-Term Multi-Hazard Assessment
This study demonstrates the significant potential of remote sensing for the long-term assessment of multiple natural hazards in semi-arid environments such as the Kedougou region. By combining multi-temporal Landsat archives spanning nearly three decades (1995–2024) with cloud-based processing through Google Earth Engine, the study provides a coherent framework for analysing the spatial evolution of droughts, floods, forest fires, and extreme heat within a single territorial system. The use of established spectral indices (NBR, VHI, MNDWI, and LST) ensured methodological consistency with previous studies while enabling comparative analyses between hazards [
8,
9].
The results confirm that multi-temporal satellite observations are highly effective for identifying long-term environmental transformations and hazard recurrence patterns. The marked decline in burned areas after 2005, for instance, coincides with the implementation of Senegal’s Forestry Policy (2005–2025), suggesting that environmental governance measures may have contributed to reducing fire occurrence [
74]. However, policy implementation in Kedougou remains incomplete: while 175 fire management committees have been established across the region’s municipalities (IREF-Kedougou) [
19], 91% of them reportedly lack operational equipment [
75]. The observed decline in burned areas therefore likely reflects a combination of partial policy effects, progressive biomass reduction through deforestation, and possible inter-sensor sensitivity differences between Landsat 5 TM, 7 ETM+, and 8 OLI. Similar relationships between land management policies and burned area dynamics have been documented elsewhere in Sub-Saharan Africa [
76]. Conversely, the significant expansion of drought-prone areas after 2005 reflects broader regional aridification trends already identified in West Africa under climate variability and increasing temperatures [
77].
The spatial validation results obtained for forest fires (59.2%), floods (43.9%), and extreme heat (50%) indicate moderate but acceptable agreement between Landsat-derived hazard maps and independent reference datasets. These overlap rates are consistent with differences in spatial resolution, sensor characteristics, and detection principles between Landsat imagery and the MODIS or Sentinel-1 reference products [
58,
71]. Although not perfect, these results demonstrate that the proposed framework captures the main spatial patterns of hazard occurrence across the region.
However, important methodological limitations remain. Hazard mapping based on retrospective satellite observations primarily reflects past and present conditions and therefore cannot directly predict future hazard trajectories under climate change. In addition, the moderate overlap rates highlight uncertainties linked to sensor resolution, cloud cover, and the differing physical properties captured by optical and radar imagery. Future work could strengthen validation procedures through the integration of higher-resolution datasets, field observations, hydrological station records, or historical disaster inventories.
The study also reveals the importance of considering temporal dynamics rather than relying solely on static hazard maps. While several previous studies in West Africa focused on isolated years or short periods, the 30-year perspective adopted here allows for the identification of persistent hotspots and long-term environmental transitions. Such historical baselines are essential for future scenario modelling and climate adaptation planning.
5.2. Added Value of an Integrated Multi-Risk Perspective
One of the principal contributions of this research lies in moving beyond traditional single-hazard assessments toward a spatially integrated multi-risk framework. In many existing studies, hazards are analysed independently, which limits the capacity to identify territories simultaneously exposed to multiple interacting threats [
5]. By integrating droughts, floods, forest fires, and extreme heat within a unified analytical framework, this study provides a more realistic representation of territorial risk in Kedougou.
The results reveal important spatial disparities in multi-risk exposure. Municipalities such as Kedougou, Sabodala, Bembou, and Bandafassi emerge as the most critical hotspots due to the convergence of multiple hazards with high concentrations of population, mining activities, agricultural land, and urban infrastructure. In contrast, municipalities such as Salemata or Oubadji remain comparatively less exposed despite experiencing certain individual hazards. These findings demonstrate that risk cannot be interpreted solely through hazard recurrence but must also consider the spatial distribution of vulnerability and exposure.
The integrated framework also highlights how hazards interact differently across the territory. Flood risks remain spatially concentrated but generate substantial impacts where they intersect with vulnerable low-lying settlements and cultivated areas. Drought, by contrast, exhibits a much broader spatial footprint and exerts chronic pressure on ecosystems and agricultural livelihoods. Forest fires are strongly associated with wooded savannahs, agricultural burning practices, and expanding human activities, whereas extreme heat mainly affects urbanised and densely populated zones where heat island effects amplify thermal exposure.
These findings are consistent with recent international studies emphasising that overlapping hazard zones possess specific exposure profiles that cannot be adequately captured through isolated hazard analyses [
15,
16,
78]. The present study therefore confirms the relevance of integrated multi-risk approaches for supporting territorial planning and prioritising adaptation interventions in complex socio-environmental systems.
Nevertheless, the adopted framework remains essentially additive and deterministic. Although the weighted aggregation approach allows multiple hazards to be synthesised into a single index, it does not fully model cascading effects, feedback loops, or nonlinear interactions between hazards. For example, drought conditions may increase fire susceptibility, while deforestation linked to mining activities may simultaneously exacerbate flood vulnerability and surface heating. Future research could therefore explore probabilistic or systems-based multi-risk approaches capable of explicitly representing interdependencies among hazards.
Multi-hazard approaches have been applied in West Africa in prior studies, including flood and landslide risk mapping in Greater Abidjan [
79], climate change projections for West African flood hazards [
80], and multi-criteria flood risk assessment in Niger [
81]. Our study complements these works by providing the first integrated multi-hazard recurrence framework for the Kedougou region, combining four hazard types over a 30-year period with participatory AHP weighting, a methodological combination not previously applied in this territory.
5.3. Vulnerability, Exposure, and Human Driver Risk
The results strongly underline the central role of vulnerability and human-induced environmental change in shaping risk patterns across Kedougou. Although climatic variability constitutes the primary driver of hazard occurrence, the severity of impacts largely depends on socio-economic exposure, land use dynamics, and ecosystem degradation.
Rapid demographic growth, artisanal and industrial mining expansion, agricultural encroachment, and unplanned urbanisation have significantly transformed the territorial structure of the region over the past three decades [
6,
82]. These processes have increased exposure by concentrating populations and economic activities in environmentally sensitive areas while simultaneously reducing the natural regulatory capacities of ecosystems.
The vulnerability assessment demonstrates that different hazards are associated with distinct vulnerability structures. Flood vulnerability is strongly linked to urbanisation, population density, and low-altitude areas exposed to runoff concentration and river overflow. Drought vulnerability primarily affects rain-fed agricultural systems and degraded forest ecosystems with reduced water retention capacity. Forest fire vulnerability is closely associated with wooded savannahs, slash-and-burn agricultural practices, and increasing anthropogenic pressure on forest resources. Extreme heat vulnerability is amplified by urban heat island effects generated by expanding built-up surfaces.
Unlike earlier approaches relying on binary classifications, this study adopts a continuous weighted vulnerability index integrating socio-economic, physical, and environmental indicators. This approach allows for a more nuanced representation of territorial sensitivity and partially addresses criticisms frequently directed at oversimplified vulnerability assessments. However, important dimensions remain insufficiently represented, particularly adaptive capacity, access to health services, income disparities, transportation accessibility, and institutional resilience. These dimensions are increasingly recognised as critical components of disaster risk frameworks [
63,
83].
The study therefore confirms that risk in Kedougou is not simply the consequence of “natural” hazards but rather emerges from the interaction between climatic processes and human-induced territorial transformations. This observation aligns with broader debates in disaster studies emphasising that disasters are socially constructed through vulnerability, exposure, and unequal development trajectories rather than resulting solely from environmental events.
5.4. Contributions and Limitations of the Participatory AHP Approach
The integration of participatory weighting through institutional surveys constitutes another important contribution of this study. Unlike conventional AHP applications relying exclusively on researcher-defined criteria, the weighting process here incorporated perceptions from Senegalese institutions involved in meteorology, hydrology, forestry, environmental management, territorial planning, and disaster risk reduction.
This participatory approach strengthens the operational relevance of the resulting multi-risk map by ensuring that hazard prioritisation reflects local institutional realities and management concerns. The acceptable Consistency Ratio (CR = 0.08) confirms the logical coherence of the weighting process and validates the reliability of aggregated expert judgments.
The results indicate that floods and forest fires were perceived as the most critical hazards due to their frequency and socio-economic impacts. This institutional prioritisation corresponds closely with observed territorial dynamics, particularly in mining and rapidly urbanising areas where infrastructure, settlements, and agricultural systems remain highly exposed.
However, several limitations must be acknowledged. First, the institutional sample remains relatively small, involving only six agencies. Although these institutions possess strong technical expertise, the weighting process may therefore reflect predominantly administrative perspectives rather than the full diversity of local experiences and perceptions. Second, the study did not directly include local communities, farmers, or vulnerable populations, whose experiential knowledge could substantially enrich the interpretation of risk patterns and adaptive capacities.
Future research could strengthen the participatory dimension by incorporating community-based surveys, citizen science approaches, or participatory GIS methodologies. Comparing institutional AHP weighting with alternative data-driven weighting approaches such as entropy methods or machine learning-based feature importance analyses could also help evaluate the robustness of the weighting scheme.
5.5. Implications of Decision Making and Territorial Governance
The publication of the results on the MapX platform significantly enhances the operational value of the study. By allowing the interactive visualisation and overlay of hazards, vulnerabilities, population density, land use, and infrastructure, the platform transforms scientific outputs into practical decision-support tools for territorial planning and disaster risk reduction.
The multi-risk maps can support several concrete applications in the Kedougou region. Local authorities may use them to identify priority zones for flood prevention infrastructure, wildfire surveillance, ecosystem restoration, or climate adaptation planning. In highly exposed municipalities such as Kedougou, Sabodala, and Bembou, the results could inform urban expansion control, mining regulation, settlement planning, and agricultural adaptation strategies. The maps also provide a spatial basis for targeting vulnerable populations and cultivated areas during emergency response operations.
More broadly, the use of open-access datasets and reproducible cloud-based processing frameworks enhances the scalability of the methodology. The approach could be adapted to other semi-arid regions of Senegal and West Africa facing similar combinations of climate variability, rapid land use change, and institutional constraints. Nevertheless, transferring the methodology to other territories would require adapting hazard thresholds, vulnerability indicators, and participatory weighting procedures to local environmental and socio-economic contexts.
5.6. Limitations and Future Research Perspectives
Despite its contributions, the study presents several methodological and conceptual limitations. First, the spatial resolution of Landsat imagery (30 m) constrains the detection of highly localised hazards and fine-scale urban vulnerability patterns. Second, the analysis remains largely retrospective and deterministic, focusing on historical recurrence rather than probabilistic future scenarios. Third, although the vulnerability framework integrates multiple indicators, adaptive capacity and institutional resilience remain only partially represented.
The Landsat-based flood hazard map likely underestimates true flood exposure during peak rainy season events, as persistent cloud cover prevents optical image acquisition precisely when flooding is most intense. The low Sentinel-1 SAR overlap rate (43.9%) reflects this cloud-induced detection gap rather than a methodological failure, and future work should consider integrating SAR-based flood mapping to complement the optical approach.
The drought component of this study focuses exclusively on agricultural drought, operationalised through the VHI, and does not capture hydrological drought (river discharge deficits) or socio-economic drought (water access constraints). The flood hazard maps delineate the geographic extent of recurrently inundated zones but do not inventory the exposed assets within them including infrastructure, buildings, and agricultural land, which would be required for quantitative risk assessment. Both dimensions are identified as priorities for future research.
The study also does not explicitly quantify uncertainty propagation within the multi-risk model. Although the AHP consistency ratio validates the internal coherence of expert judgments, sensitivity analyses exploring how variations in hazard thresholds or weighting schemes affect the final multi-risk classification were not performed. Such analyses would strengthen the robustness and transparency of the framework.
Future research could therefore focus on several improvements:
- (i)
Integrating higher-resolution satellite imagery and local field observations;
- (ii)
Incorporating predictive climate scenarios and machine learning approaches for hazard forecasting;
- (iii)
Modelling adaptive capacity and socio-economic resilience indicators;
- (iv)
Conducting sensitivity and uncertainty analyses;
- (v)
Integrating community-based participatory approaches;
- (vi)
Developing probabilistic multi-risk frameworks capable of modelling cascading and interacting hazards.
These perspectives are particularly important in the context of accelerating climate change and increasing socio-environmental pressures across semi-arid African regions.
5.7. Broader Implications of Sustainable Development
Overall, this study confirms the necessity of integrated multi-risk approaches for climate-vulnerable regions such as Kedougou, where environmental degradation, climatic variability, demographic growth, and economic transformation increasingly interact. By combining remote sensing, vulnerability analysis, participatory weighting, and spatial decision-support tools, the proposed framework contributes to strengthening evidence-based territorial governance and disaster risk reduction strategies.
The results directly support four Sustainable Development Goals in the Kedougou context: SDG 2, by identifying drought hotspots for priority distribution of drought-resilient crop varieties; SDG 11, by delineating flood-prone zones to guide urban planning exclusion decisions in the Kedougou and Saraya municipalities; SDG 13, by providing the multi-hazard baseline required for the regional climate adaptation plan (PNACC); and SDG 15, by targeting reforestation and firebreak programmes in chronically fire-affected municipalities. In contexts characterised by increasing climatic uncertainty and limited institutional resources, such integrated frameworks are essential for shifting from reactive disaster response toward proactive and anticipatory risk governance.
6. Conclusions
The main objective of this study was to develop a method for the assessment and multi-risk mapping of the Kedougou region, integrating climatological, meteorological, hydrological, and environmental criteria to support decision making in risk management and land use planning. Upon completion of the work, it is evident that the combination of advanced geospatial technologies, multi-criteria analyses, and institutional consultations through a participatory approach provides an effective response to the challenges posed by the multiplicity of natural hazards.
The proposed method, based on AHP (Analytic Hierarchy Process) multi-criteria analysis and the use of satellite data via Google Earth Engine (GEE), has thus demonstrated its ability to effectively meet the stated objective of this analysis. The combination of remote sensing data and qualitative knowledge collected through institutional surveys has enabled the production of an integrated multi-risk map. This hybrid approach, combining the rigour of remote sensing indices (NDVI, MNDWI, NBR, LST) and the contextualisation of participatory surveys, revealed that 17.21% of the Kedougou region, or 2908.3 km2, is exposed to a multi-risk level ranging from low to high, affecting approximately 33,889 people (or 13.5% of Kedougou’s population) and 18.99 km2 of cultivated land. This significant quantitative result highlights the importance of proactive risk management and underscores the necessity of implementing targeted intervention strategies.
The originality of this research lies in its ability to cross the objective and subjective dimensions of risk. By integrating the perceptions of local institutions such as ANAT, DPGI, and CSE, via the AHP, the method assigns differentiated weights to hazards, reflecting territorial priorities. For example, forest fires (28.1% weighting) are deemed more critical than drought (17.5%) due to their immediate impact on biodiversity and economic activities.
Furthermore, the reproducibility of the methodology, ensured by the use of standardised tools and open-access satellite data, opens interesting prospects for the application of this approach in other regions of Senegal and Africa, taking into account the specificities of each region. By adapting vulnerability criteria and hazard parameters to local specificities, this method constitutes a genuine strategic tool for planning and land use management in varied contexts. In Senegal, areas such as Saint-Louis, threatened by salinisation and coastal erosion, or Casamance, which is vulnerable to deforestation and irregular rainfall, could benefit from this approach by replicating our study and adjusting the hazard criteria. On an African scale, the semi-arid regions of the Sahel, such as Mali, Niger, and Burkina Faso face similar challenges, and could adapt the method by integrating local indicators.
Moreover, the extension of our retrospective model towards predictive models constitutes a natural evolution of this research. By integrating climate scenarios from international organisation projections or by using machine learning approaches, it would be possible to move from a descriptive analysis to a predictive approach. This would allow for not only tracking the current evolution of risks but also for anticipating future fluctuations, thereby offering the possibility to proactively adjust prevention strategies and intervention plans.
In summary, this work lays the foundations for the proactive and integrated management of natural hazards, where technological innovation and local contextualisation are combined to build resilient territories capable of meeting the climatic challenges of the 21st century. This approach fosters integrated and anticipatory management of natural hazards, contributing to strengthening the resilience of territories in the face of present and future climatic challenges.