


Abstract
Rapid urbanization, climate change, and uneven regional development have increasingly intensified spatial heterogeneity in food security. As one of China’s major commercial grain-producing areas, the Main Grain-Producing Region in the Middle Reaches of the Yangtze River (MGPR-MRYR) plays a critical role in ensuring national food security. However, existing studies have paid limited attention to spatial heterogeneity and driving mechanisms at the urban agglomeration scale. Taking the Wuhan (WUA), Changsha–Zhuzhou–Xiangtan (CZXUA), and Poyang Lake (PYLUA) urban agglomerations as analytical units, this study constructs a multidimensional food security evaluation framework covering supply security, production resource security, and circulation–consumption security. Based on panel data from 2013 to 2023, the entropy weight method, kernel density estimation (KDE), Theil index decomposition, spatial autocorrelation analysis, and the optimal-parameter geographical detector (OPGD) model were employed. Food security levels in the MGPR-MRYR exhibited an overall upward trend, particularly after 2020, although significant spatial heterogeneity persisted among urban agglomerations. A spatial pattern of “higher in the west than east, and inland over lakeside” emerged, with significant positive clustering gradually expanding westward. Intra-agglomeration disparities—especially within the WUA—contributed more to regional inequality than inter-agglomeration differences. Agricultural machinery power and rural population remained the dominant driving factors, while the influence of urbanization and annual precipitation increased over time. All factor interactions showed enhancement effects, indicating that food security is shaped by the synergistic interplay of natural, socioeconomic, and agricultural production factors. This study reveals the transition of driving mechanisms from traditional factor dependence to multi-factor system synergy. These findings suggest that food security governance in rapidly urbanizing grain-producing regions should shift from uniform policies to differentiated, synergy-oriented strategies tailored to each urban agglomeration’s development stage and resource constraints.
1. Introduction
Food security is a fundamental pillar of national stability and human well-being, shaping sustainable development at global and regional scales. Since the beginning of the 21st century, global progress has been made in reducing hunger. However, hunger and malnutrition remain severe global issues. Climate change, geopolitical conflicts, and mounting pressures on natural resources increasingly destabilize food systems [1]. In Africa, one in five people faced hunger in 2023. This reflects the combined effects of conflict, climate shocks, and economic instability [2]. The United Nations report The State of Food Security and Nutrition in the World 2025 notes that global progress against hunger remains insufficient. Rising food prices erode dietary quality, and social inequality is growing. China, as the world’s most populous nation, has shown notable food self-sufficiency. It supports nearly 20% of the global population with about 9% of the world’s arable land and 6% of its freshwater resources [3]. To address growing uncertainties, China has announced a new action plan to increase grain production capacity. This plan further reinforces the national strategy of strengthening grain production capacity through farmland protection and agricultural technology [4].
Despite notable advancements in food security research, three critical knowledge gaps remain, limiting a comprehensive understanding of food security patterns at the urban agglomeration scale. First, existing assessment frameworks still face limitations in capturing the multidimensional interactions among production capacity, resource constraints, and circulation systems under rapid urbanization. Evaluation approaches have gradually evolved from single-model methods toward more integrated analytical frameworks, including PCA–AHP combinations [5], BP neural network models [6], remote sensing-based CASA models [7], entropy-weight methods [8], spatial econometric models [9], and obstacle degree models [10]. However, most existing studies still focus primarily on production capacity or economic dimensions, while insufficient attention has been paid to production resource security and circulation and consumption security. As a result, current frameworks fail to comprehensively reflect the multidimensional characteristics of food security, particularly under the complex interactions between urbanization, resource constraints, and regional development at the urban agglomeration scale.
Second, spatial heterogeneity in food security at the urban agglomeration scale remains insufficiently examined. Existing studies have investigated food security at global, national, regional, and local scales, with most research in China focusing on provincial and municipal levels and relatively limited attention paid to county-level assessments [11,12]. Previous studies have shown that food security is shaped by technological development, policy support, resource endowments, and urban–rural disparities, resulting in significant spatial heterogeneity between grain-producing and grain-consuming areas, as well as between traditional agricultural regions and rapidly urbanizing areas [13,14].
However, urban agglomerations are not merely administrative aggregations of cities. They represent integrated territorial systems characterized by intensive population mobility, land-use transition, industrial restructuring, and resource circulation. Different cities within the same urban agglomeration often exhibit substantial disparities in development stages, industrial structures, agricultural foundations, and ecological conditions. Such intra-agglomeration heterogeneity may reshape regional food security patterns through differentiated agricultural production capacities, uneven land resource allocation, and varying food circulation systems. Nevertheless, existing studies have rarely examined food security from the perspective of intra-agglomeration spatial differentiation, and the mechanisms through which urban agglomeration heterogeneity influences food security patterns remain insufficiently understood.
The three major urban agglomerations in the Main Grain-Producing Region in the Middle Reaches of the Yangtze River (MGPR-MRYR)—the Wuhan Urban Agglomeration (WUA), the Changsha–Zhuzhou–Xiangtan Urban Agglomeration (CZXUA), and the Poyang Lake Urban Agglomeration (PYLUA)—show pronounced differences in development pathways, resource endowments, and environmental conditions, providing an appropriate case for examining the spatial differentiation of food security within rapidly urbanizing grain-producing regions.
Third, the interactive and scale-dependent effects of driving factors on food security remain insufficiently understood. Previous studies have shown that population dynamics, climate variability, globalization, and agricultural adaptation strategies all influence food security outcomes [15,16,17,18]. However, most existing research relies on traditional linear regression or correlation analysis, which is often inadequate for identifying nonlinear relationships and interaction effects among multiple factors. In addition, systematic comparisons of factor explanatory power across spatial scales remain limited. Despite the growing body of food security research, limited attention has been paid to the spatial differentiation, dynamic evolution, and driving mechanisms of food security within urban agglomerations. In particular, the relationships among urbanization, regional inequality, and food security remain insufficiently integrated within a unified analytical framework.
To address these gaps, this study takes the MGPR-MRYR as the study area and uses the WUA, CZXUA, and PYLUA as analytical units. Based on city-level panel data from 2013 to 2023, a multidimensional food security evaluation framework is constructed from the perspectives of supply security, production resource security, and circulation and consumption security. By integrating the entropy weight method, KDE, Theil index decomposition, spatial autocorrelation analysis, and the OPGD model, this study addresses the following questions: (1) How have food security levels evolved spatially and temporally within the urban agglomerations of the MGPR-MRYR? (2) What spatial disparities, agglomeration characteristics, and dynamic distribution patterns exist in regional food security? (3) How do natural ecological, socioeconomic, and agricultural production factors jointly shape the spatial heterogeneity of food security in rapidly urbanizing grain-producing regions?
This study contributes to the existing literature in three aspects. First, it extends food security research from traditional administrative scales to the urban agglomeration scale, highlighting the importance of intra-regional heterogeneity in understanding food security dynamics. Second, by integrating spatial disparity analysis, spatial autocorrelation, kernel density estimation, and optimal-parameter geographical detectors, this study reveals the multidimensional spatiotemporal differentiation and interaction mechanisms of food security within major grain-producing urban agglomerations. Third, the findings provide empirical evidence for differentiated regional governance and coordinated development strategies aimed at balancing urbanization and food security in rapidly urbanizing agricultural regions.
2. Materials and Methods
2.1. Study Area
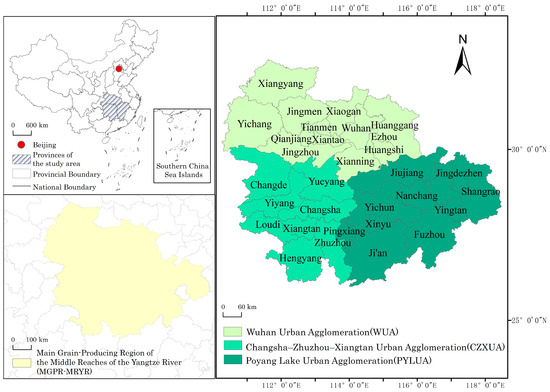
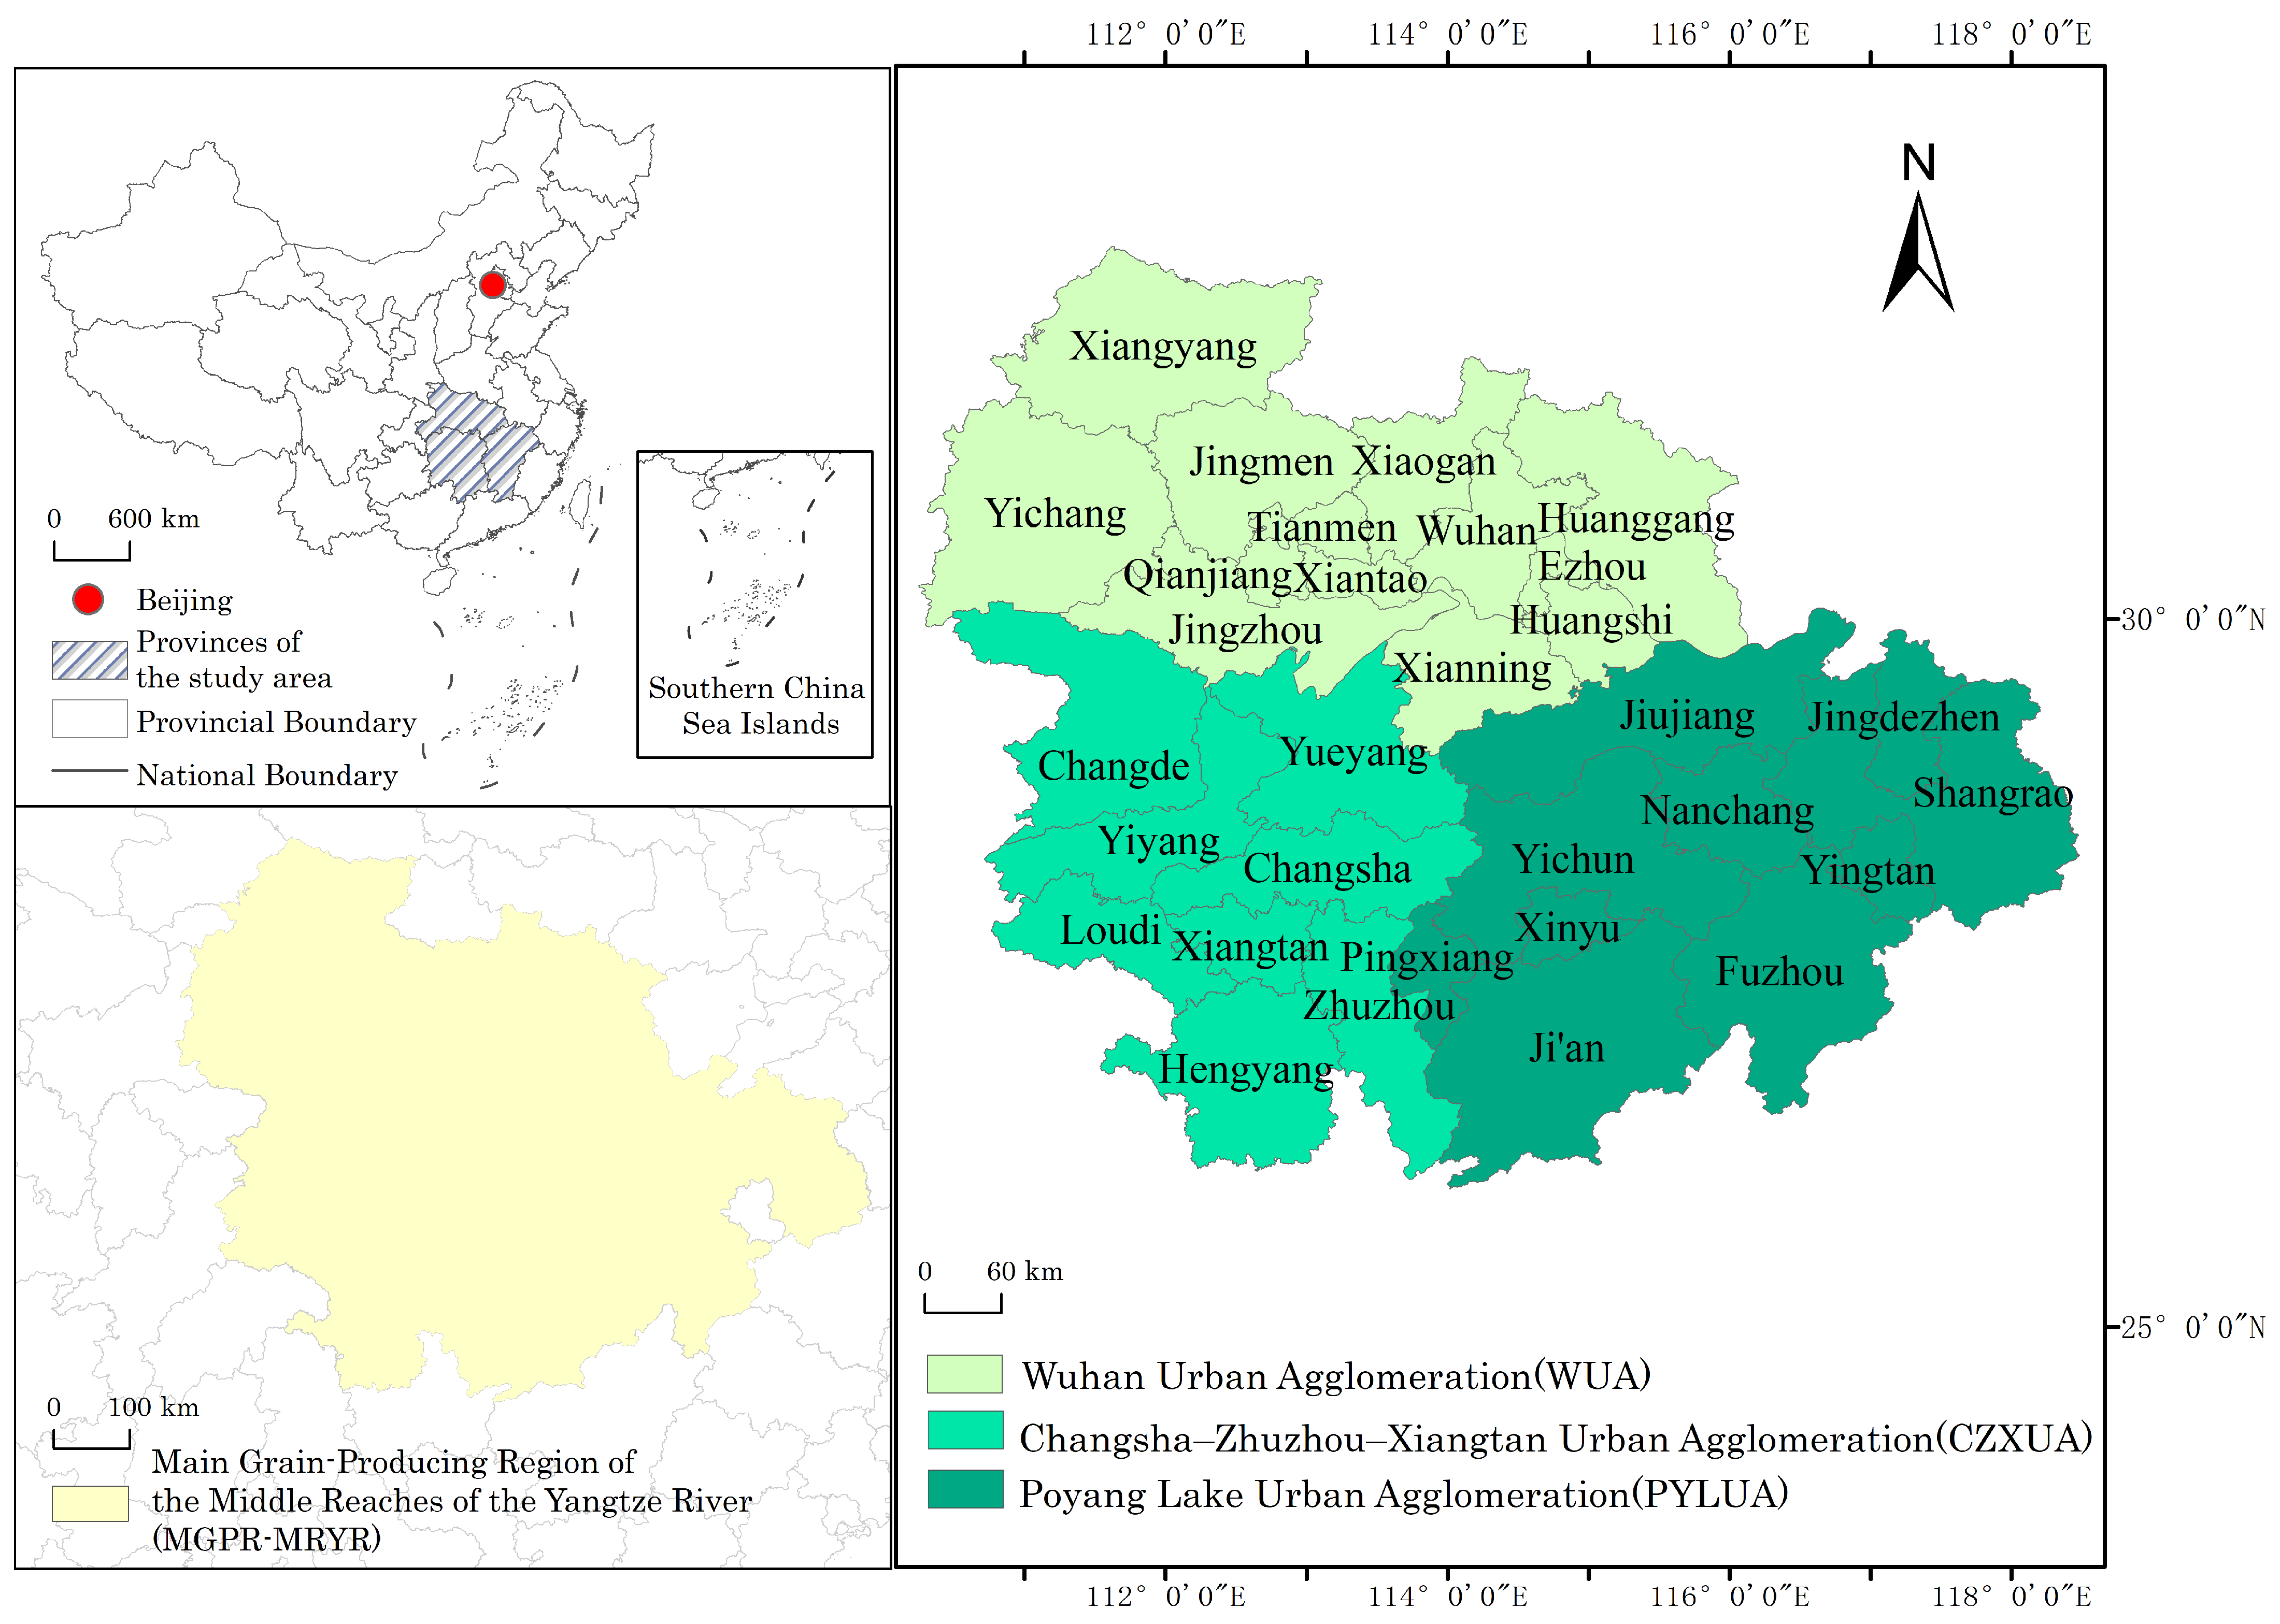
The MGPR-MRYR is located in central China, approximately between 24°27′–33°20′ N and 110°15′–118°28′ E (Figure 1). The region includes the WUA, the CZXUA, and the PYLUA, covering major areas of Hubei, Hunan, and Jiangxi provinces. As one of China’s major grain-producing regions, the MGPR-MRYR plays an important role in ensuring national food security while also functioning as a major growth pole for urbanization and regional economic development.
Figure 1.
Location of the study area.
The three urban agglomerations exhibit substantial heterogeneity in development pathways, industrial structures, agricultural modernization levels, resource endowments, and ecological conditions. The WUA is characterized by relatively high urbanization intensity and industrial concentration, the CZXUA demonstrates strong manufacturing and transportation advantages, while the PYLUA possesses comparatively prominent ecological and agricultural resource advantages. These differences may reshape food security patterns through differentiated agricultural production capacities, land resource allocation, infrastructure development, and food circulation systems.
Due to the coexistence of intensive grain production and rapid urbanization, as well as the pronounced heterogeneity among urban agglomerations, the MGPR-MRYR provides an appropriate case for examining the spatiotemporal differentiation and driving mechanisms of food security within rapidly urbanizing grain-producing regions.
2.2. Methodology
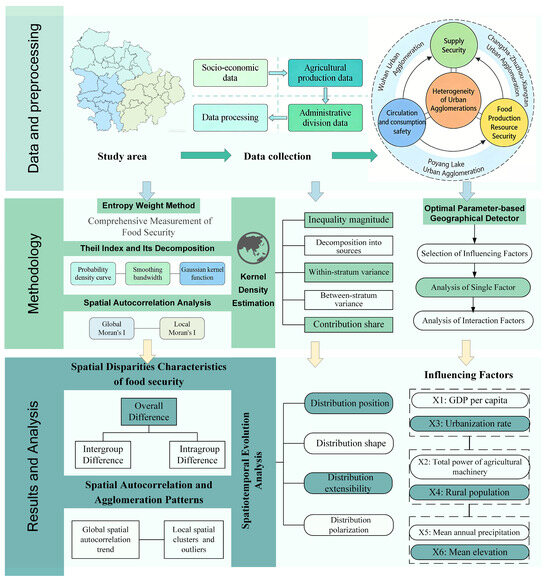
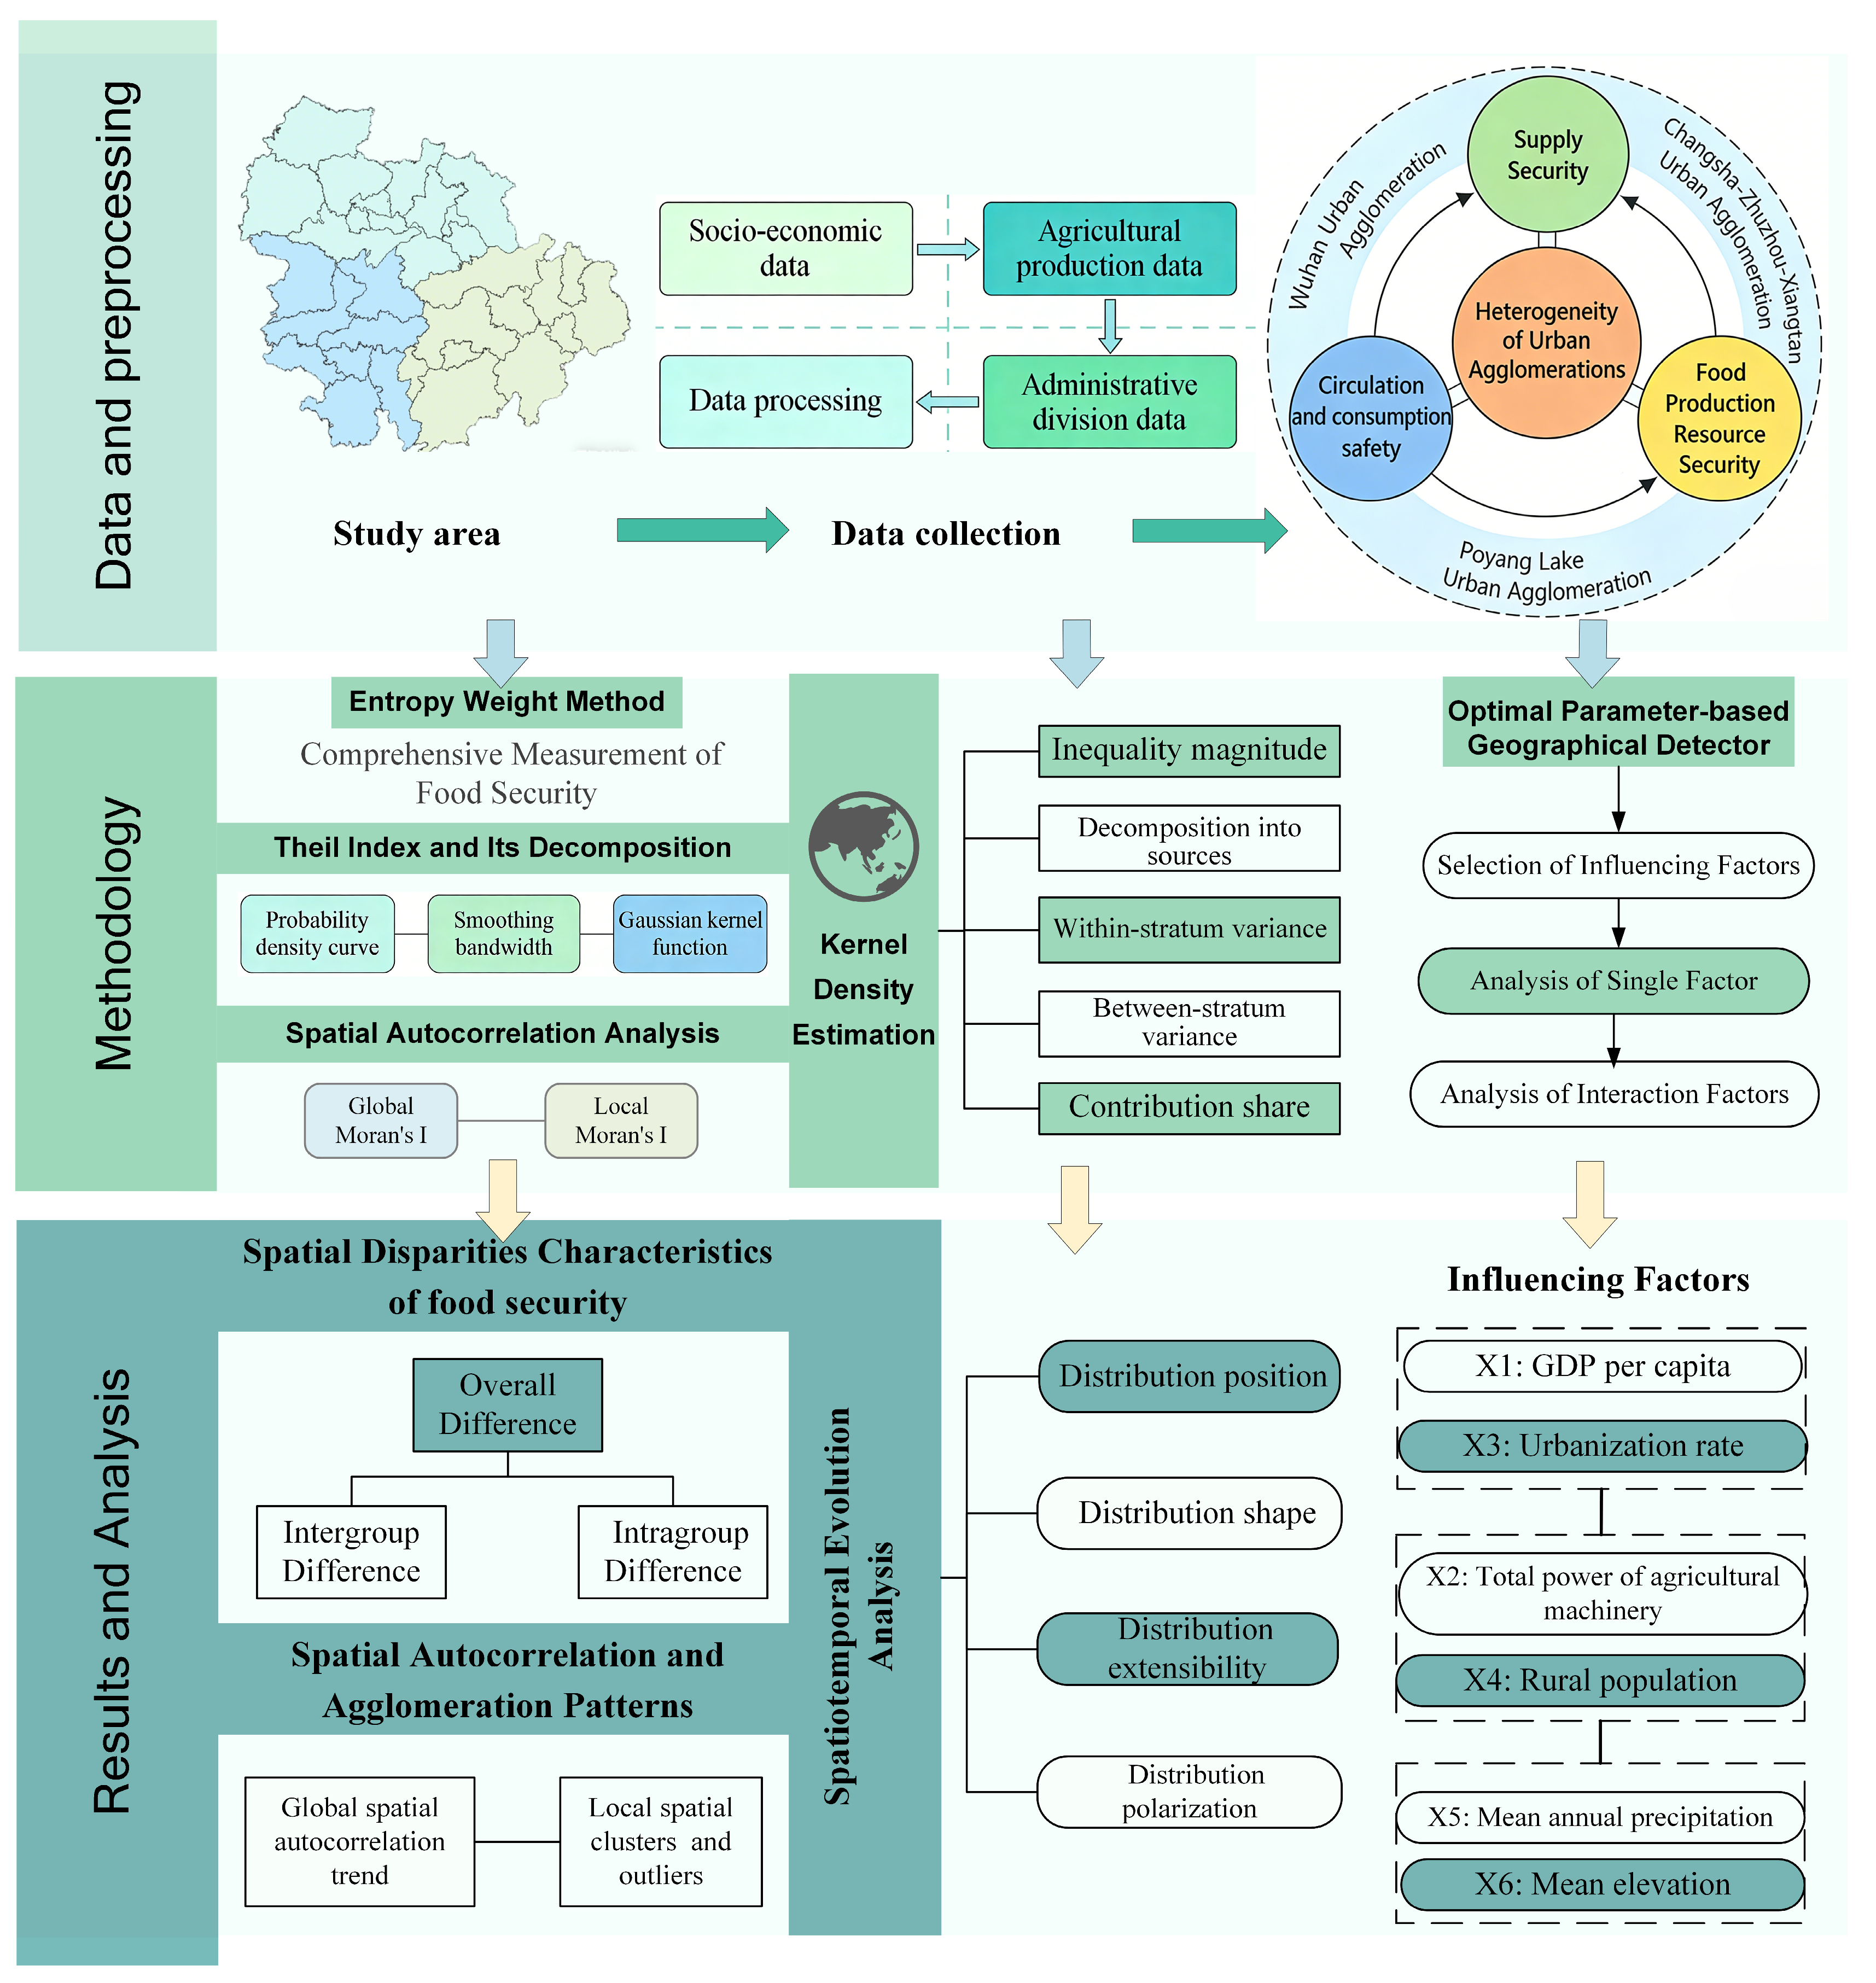
To systematically investigate the spatiotemporal evolution, regional disparities, spatial dependence, and driving mechanisms of food security within urban agglomerations in the MGPR-MRYR, this study constructed a multi-method analytical framework (Figure 2). Specifically, the entropy weight method was employed to measure food security levels, the Theil index was used to quantify regional disparities, Moran’s I index was applied to examine spatial autocorrelation characteristics, KDE was adopted to reveal dynamic distributional evolution, and the OPGD model was utilized to identify the explanatory power of influencing factors.
Figure 2.
Research methodology framework diagram.
2.2.1. Indicator Selection
Considering the multidimensional characteristics of food security within rapidly urbanizing urban agglomerations [19,20,21,22,23], this study constructs an evaluation index system from three dimensions: supply security, production resource security, and circulation–consumption security (Table 1). These dimensions jointly reflect the regional capacity to maintain stable grain production, ensure agricultural resource support, and sustain efficient food circulation and consumption under urban–rural transformation.
Table 1.
Food security evaluation indicator system.
Specifically, supply security emphasizes the stability and adequacy of regional grain production and reflects the fundamental capacity of food supply systems. Production resource security focuses on the availability and support conditions of key agricultural production factors, including cultivated land, labor, and agricultural inputs, which are strongly influenced by urban expansion, resource allocation, and land-use transition within urban agglomerations. Circulation–consumption security reflects the accessibility and socioeconomic support conditions of food systems, capturing the impacts of population concentration, market development, and regional economic transformation on food distribution and consumption capacity.
Compared with traditional food security assessments conducted at the national or household level, the urban agglomeration perspective emphasizes spatial heterogeneity, urban–rural interactions, and regional factor mobility. Therefore, the selected indicators aim to comprehensively characterize the dynamic relationships among urbanization, agricultural systems, and regional food security in the MGPR-MRYR urban agglomerations.
2.2.2. Entropy Weight Method
To comprehensively evaluate regional food security levels within urban agglomerations, the entropy weight method was employed to determine indicator weights objectively. Compared with subjective weighting approaches, the entropy weight method assigns weights according to the degree of variation among indicators, thereby reducing potential subjective bias and improving the comparability of multidimensional indicators [24].
Data Standardization:
To eliminate dimensional differences among indicators, positive and negative indicators were standardized using the min–max normalization method. Where represents the standardized value for the -th indicator in the -th year, is the observed value of the -th indicator in the -th year, and and are the minimum and maximum values of the -th indicator [25,26].
Entropy Calculation:
In Formula (2), where denotes the proportion of the -th indicator in the -th year, is the total number of evaluation years. is the entropy value of the -th indicator.
Weight Calculation:
where denotes the weight of the -th indicator (j = 1, 2, …, m), and m is the total number of indicators, quantifies the degree of variation in them -th indicator,.
Comprehensive Index Calculation:
In Formula (4), multiply each standardized value by its weight and sum across all indicators to obtain the comprehensive food security index for year .
2.2.3. Kernel Density Estimation
KDE is a nonparametric method for probability density estimation that does not require presupposing a distribution form. It estimates the true density curve of a continuous variable using only sample data and a smoothing kernel function, effectively characterizing the spatial or temporal distribution patterns of indicators [27]. This study employs the Gaussian kernel function and the optimal bandwidth automatically selected by MATLAB R2024a to dynamically analyze the distributional evolution of food security levels. The mathematical formulation is as follows:
The kernel function measures the contribution of each sample point to the target point . The coefficient serves as a normalization factor, where is the total number of samples. The bandwidth scales the kernel function, thereby controlling the smoothness of the final density curve [28,29], as shown in Formula (5).
2.2.4. Theil Index and Its Decomposition
The Theil index measures income, resource, or development inequality using information entropy. Its main advantage is decomposability: it fully splits inequality into within- and between-group differences, clearly identifying structural or spatial sources. The index captures the “information distance”—the gap between actual and perfectly equal distributions—where higher values mean greater disparity [30]. The formula is as follows:
According to the Theil Index:
where represents the Theil index for the overall food security level score, where = 31, , indicating 31 groups based on 31 cities. signifies the comprehensive food security score for the -th city, while denotes the average of the food security scores across all 31 cities [31].
The overall difference is:
The Intergroup Difference is:
The intragroup difference is:
Then, the intergroup difference in urban agglomerations is:
The contribution rate of urban agglomeration is:
where denotes the Theil index for the -th region, represents the proportion of units in the -th region relative to the total number of units, indicates the average food security level score for the -th region, and signifies the composite food security level score for the -th city within the -th region [32].
2.2.5. Spatial Autocorrelation Model
To examine the spatial dependence and clustering characteristics of food security levels within urban agglomerations in the MGPR-MRYR, this study employs Moran’s I index to analyze spatial autocorrelation and potential spatial spillover effects among neighboring cities. Specifically, the Global Moran’s I index is used to evaluate the overall spatial association of food security levels across the study area, while the Local Moran’s I index is applied to identify localized clustering patterns and spatial heterogeneity, including high–high and low–low agglomeration characteristics [33,34]. The formula for the Global Moran’s I index is expressed as follows:
In Formula (12), denotes the Global Moran’s I index; and are the comprehensive index of food security level for samples and , respectively; is the average value of food security level; is the number of cities in the study area; is the spatial weight matrix. ranges from , where indicates appositive spatial autocorrelation in the food security level, signifies a negative spatial autocorrelation, and suggests no significant spatial correlation [35,36].
To capture local spatial associations between regions, this study further uses the Local Moran’s I index. This index characterizes the spatial correlation between a specific city and its neighboring cities. The formula is as follows:
In Formula (13), where denotes the Local Moran’s I index, and the definitions of the remaining variables are consistent with those in Formula (1). indicates that the food security level of a city is spatially homogeneous with its neighbors, demonstrating positive spatial autocorrelation, while signifies spatial heterogeneity between the city and its surrounding cities, indicating negative spatial autocorrelation [37,38].
2.2.6. Optimal-Parameter-Based Geographical Detector
OPGD model is suitable for detecting spatial heterogeneity and identifying the explanatory power of socioeconomic, resource, and environmental factors on regional food security patterns. Compared with the traditional Geographical Detector model, OPGD improves the objectivity of factor discretization by automatically selecting the optimal discretization scheme and parameter combination, thereby enhancing the reliability and interpretability of the result [39,40]. In this study, multiple discretization approaches were tested, and the optimal classification scheme was selected based on the explanatory power (q-value) of each factor. A larger q-value indicates stronger explanatory power of the influencing factor on food security levels. The mathematical formulation is as follows:
where represents the detection value of the food security level, ranging from [0, 1]; denotes the number of strata for the influencing factor ; and indicate the number of units in stratum and the entire region, respectively; and are the variances of the food security level in stratum and the entire region, respectively; and refer to the sum of within-stratum variances and the total variance of the entire region. Additionally, this study uses interaction detection between two factors to further examine whether the explanatory power is enhanced, weakened, or independent when they act jointly [41]. The interaction types are presented in Table 2.
Table 2.
Types of interactions and basis of judgment.
To improve the robustness of the OPGD results, five discretization methods (Natu-ral Breaks, Quantiles, Equal Intervals, Geometric Intervals, and Standard Deviation) with 4–6 intervals were tested for each explanatory variable. The optimal discretization scheme was selected according to the maximum q-statistic, and all reported q-values passed significance tests ().
2.3. Data
The data for this study were primarily sourced from the Hubei Statistical Yearbook, Hunan Statistical Yearbook, Jiangxi Statistical Yearbook, Hubei Rural Statistical Yearbook, and Hunan Rural Statistical Yearbook. Supplementary data were obtained from prefecture-level city statistical yearbooks, the EPS data platform, provincial social development bulletins, and water resources bulletins. To address missing values in individual years, interpolation methods were applied to ensure the dataset’s completeness and accuracy.
3. Results
3.1. Measurement Results of Food Security Levels
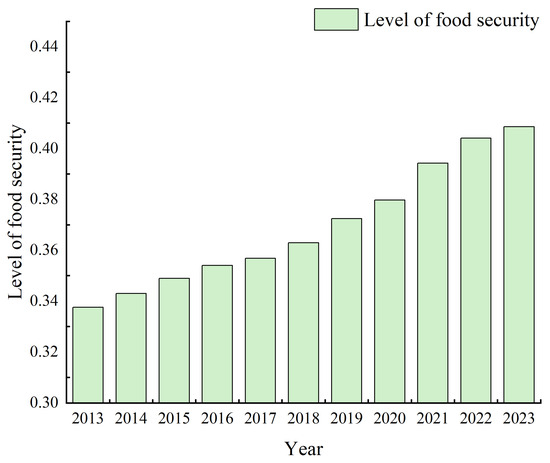
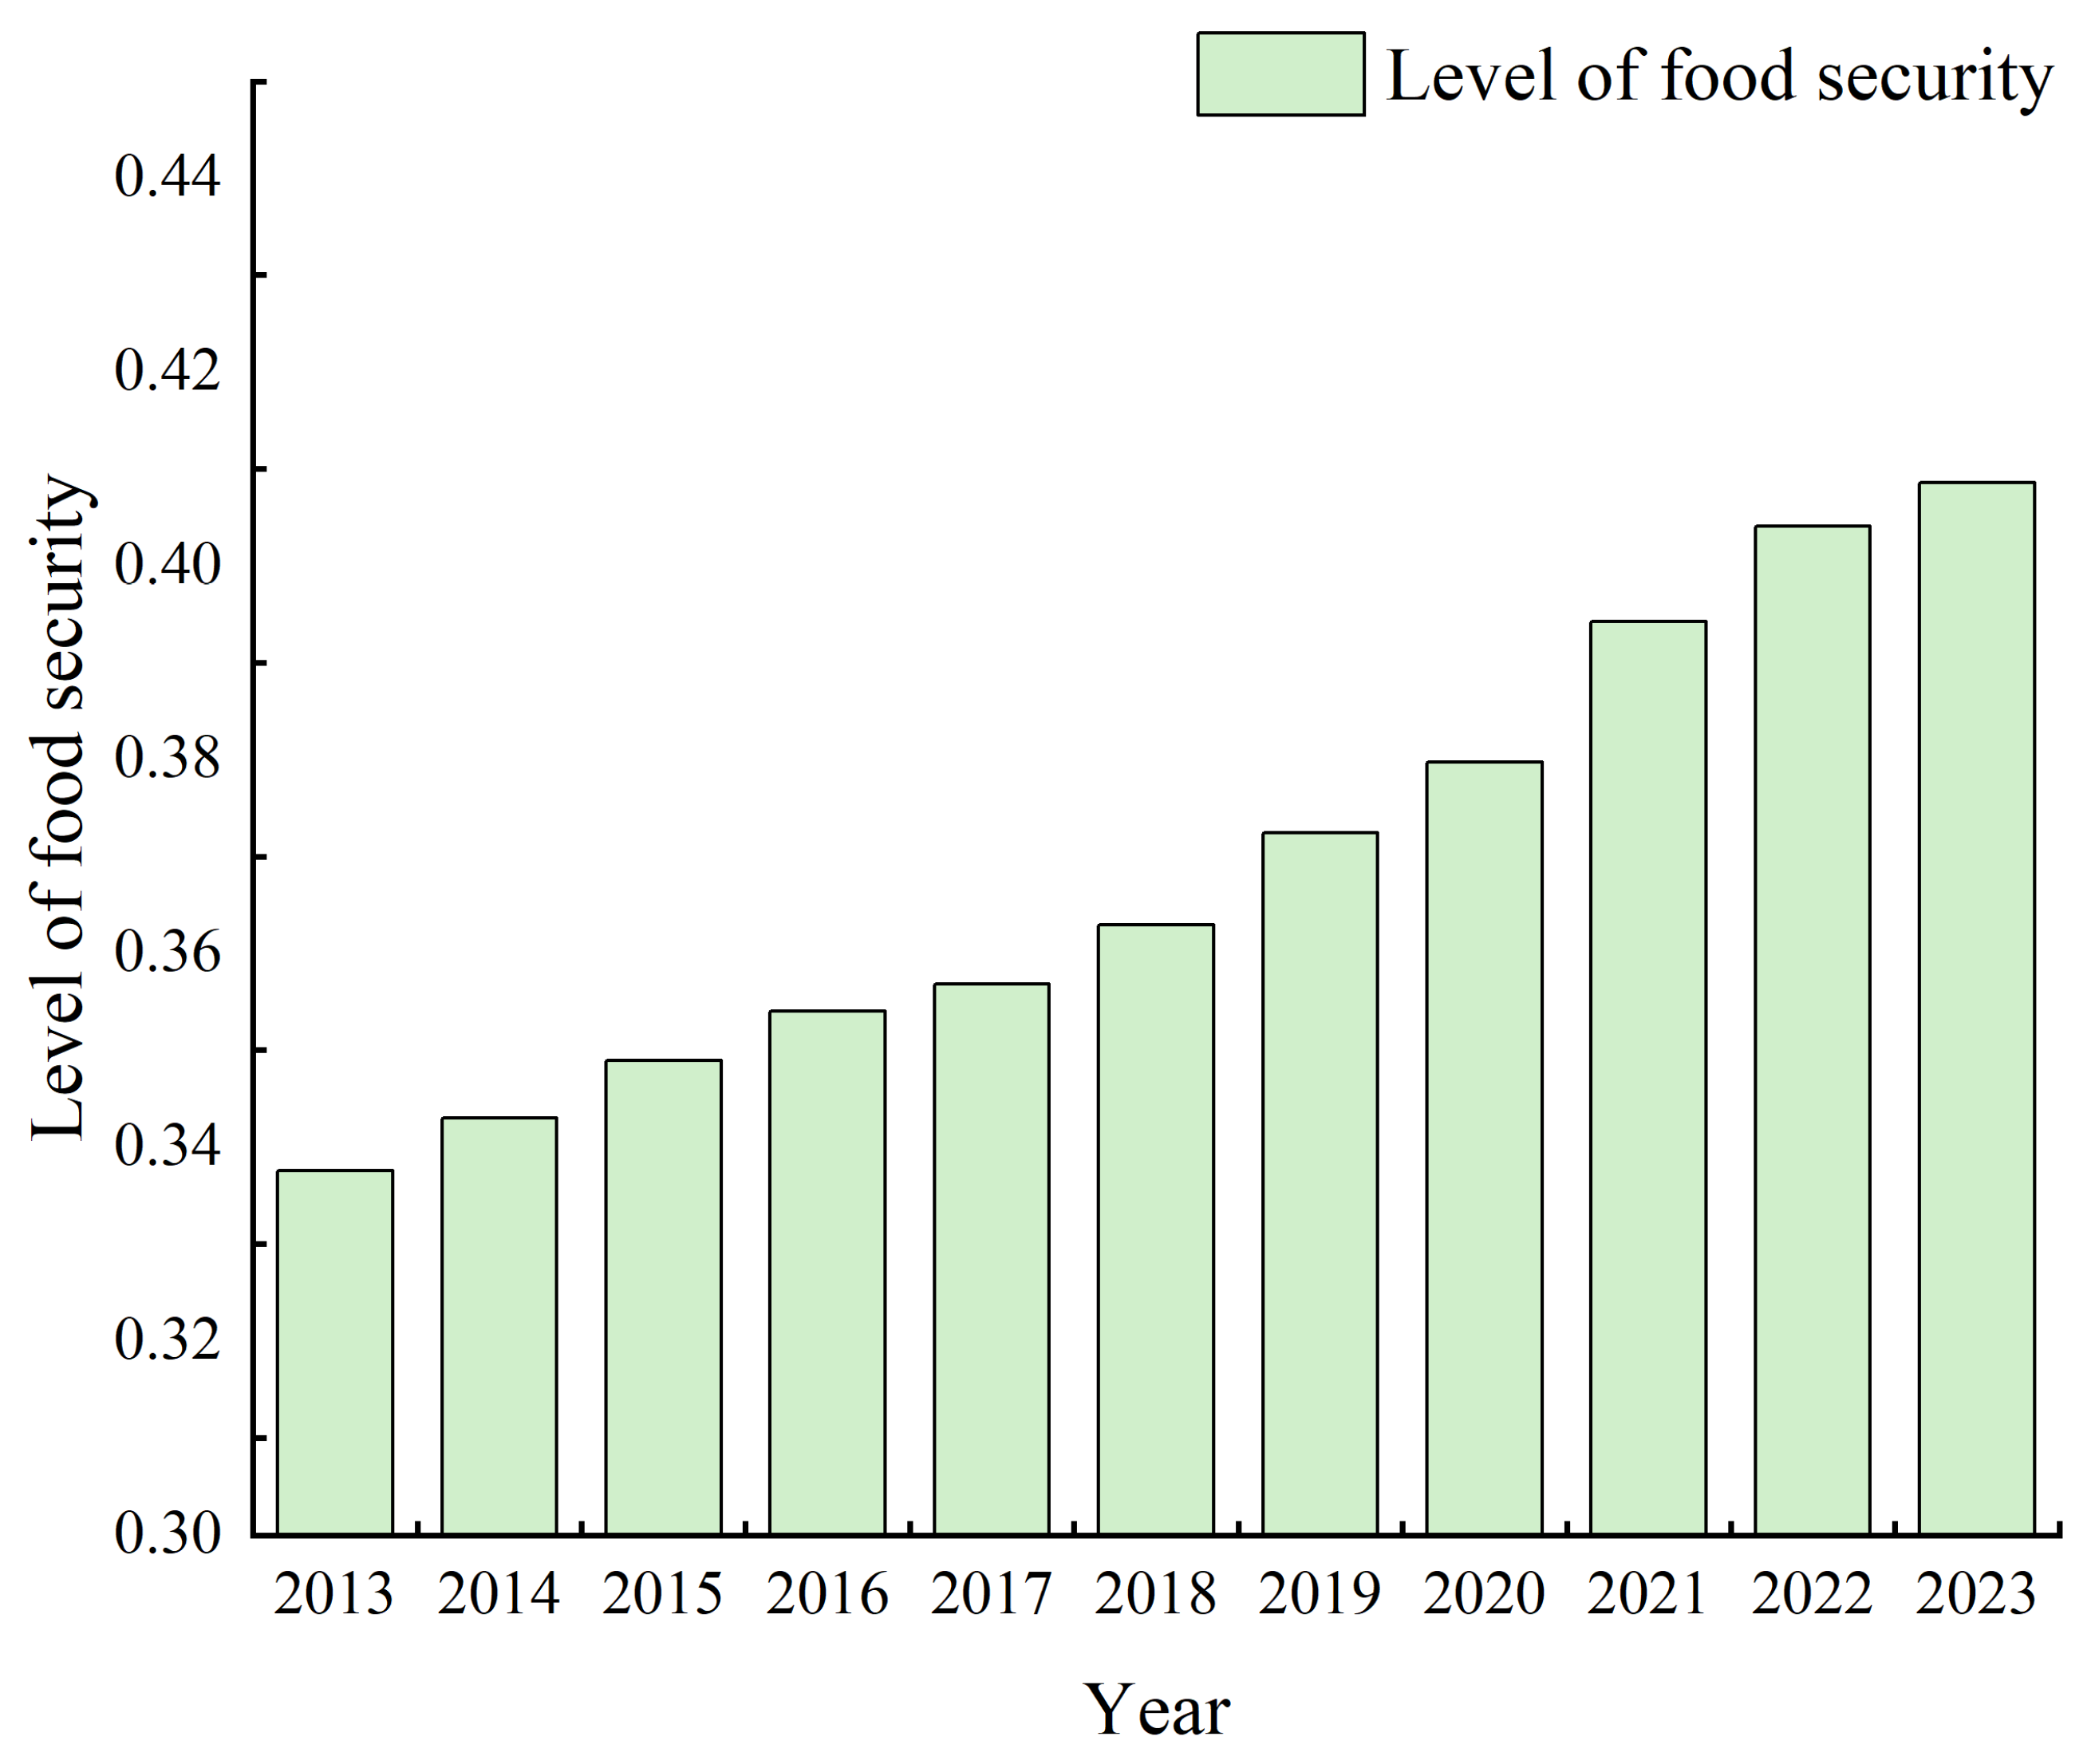
The entropy weight method was employed to calculate the comprehensive food security scores for the MGPR-MRYR and its three major urban agglomerations from 2013 to 2023. Figure 3 illustrates the annual average change trend of the comprehensive food security score in the MGPR-MRYR.
Figure 3.
Trend in the Mean Food Security Score of the MGPR-MRYR from 2013 to 2023.
From 2013 to 2023, the food security index increased steadily, although the growth process showed periodic fluctuations. In the early stage, improvements were relatively moderate due to the limited scale of agricultural modernization and the persistence of traditional small-scale farming systems. After 2020, the upward trend became more pronounced. This period coincided with the strengthening of China’s national food security strategy. Following the 2020 Central Economic Work Conference, greater emphasis was placed on seed security and cultivated land protection. Subsequently, the Action Plan for Revitalizing the Seed Industry was implemented, while the Party and Government Accountability System for Food Security was further institutionalized. Together with the accelerated construction of high-standard farmland, these measures may have contributed to improvements in agricultural production capacity and resource security, thereby supporting the observed increase in food security levels across the MGPR-MRYR.
Despite the overall improvement, significant spatial heterogeneity was observed among the three urban agglomerations (Table 3). The WUA exhibited the most substantial growth and maintained the highest food security level throughout the study period. Traditional grain-producing cities such as Xiangyang, Jingzhou, and Jingmen consistently performed at relatively high levels, reflecting their strong agricultural foundations, favorable cultivated land conditions, and comparatively mature agricultural production systems. In contrast, cities located in eastern Hubei generally remained at lower levels, revealing a clear core–periphery differentiation pattern within the agglomeration.
Table 3.
Comprehensive Scores for Food Security Levels in Three Major Urban Agglomerations, 2013–2023.
The CZXUA showed moderate growth overall. Food security improvement was mainly supported by traditional agricultural cities such as Changde and Hengyang, whereas highly urbanized core cities, including Changsha and Zhuzhou, experienced relatively limited growth. This pattern suggests that rapid urban expansion and industrial transformation may have weakened the comparative advantages of agricultural production in some metropolitan areas.
Compared with the other two urban agglomerations, the PYLUA exhibited the slowest growth and generally remained at relatively low levels. Only a few cities, such as Ji’an and Shangrao, demonstrated noticeable improvement during the later stage of the study period. The relatively weak performance of the PYLUA reflects constraints related to agricultural resource endowment, infrastructure conditions, and uneven regional development capacity, which collectively limited the improvement of regional food security.
From a broader spatial perspective, the MGPR-MRYR gradually formed a differentiated spatial pattern characterized by “higher levels in the western inland areas and lower levels in the eastern lakeside regions.” High-value areas were mainly concentrated in traditional grain-producing regions with strong agricultural resource support, while low-value areas were largely distributed in regions experiencing rapid urbanization and relatively weak agricultural production capacity. This finding indicates that urbanization intensity, agricultural resource allocation, and regional development differences jointly shaped the spatial evolution of food security within the urban agglomerations.
3.2. Spatial Disparities and Clustering Characteristics of Food Security
To further investigate the spatial differentiation characteristics of food security within the MGPR-MRYR, the Theil index and Moran’s I were employed to analyze regional disparities and spatial clustering patterns from 2013 to 2023. The results indicate that regional food security inequality gradually intensified during the study period, while significant spatial agglomeration characteristics became increasingly evident.
As shown in Table 4, the overall Theil index increased from 0.1015 in 2013 to 0.1476 in 2023, indicating an expansion of regional food security disparities. Decomposition results further revealed that intra-agglomeration disparities consistently contributed more than inter-agglomeration disparities throughout the study period. This finding suggests that food security inequality within the MGPR-MRYR was primarily driven by uneven development among cities within the same urban agglomeration rather than by differences between urban agglomerations themselves. The increasing dominance of intra-agglomeration disparities reflects the differentiated impacts of urbanization, agricultural modernization, and resource allocation across cities.
Table 4.
Theil Index and Contribution Rate of Food Security in the MGPR-MRYR, 2013–2023.
Among the three urban agglomerations, the WUA contributed most significantly to overall regional inequality. Its internal disparity increased from 0.1629 in 2013 to 0.2243 in 2023, with contribution rates consistently exceeding 40%, indicating an increasingly pronounced spatial differentiation within the agglomeration. The CZXUA exhibited relatively moderate disparity levels, with contribution rates generally ranging from 27% to 30%. Although regional inequality increased slightly over time, its overall disparity remained comparatively stable. The PYLUA showed the lowest disparity contribution throughout the study period. However, this relatively low disparity was accompanied by generally lower food security levels across most cities, suggesting limited overall development rather than strong regional balance.
The results of Global Moran’s I further demonstrate significant spatial clustering characteristics of food security within the MGPR-MRYR. As shown in Table 5, Global Moran’s I values remained significantly positive throughout the study period, increasing from 0.140 in 2013 to 0.198 in 2023 (p < 0.05). Meanwhile, all Z-scores exceeded 1.96 after 2017, confirming increasingly significant positive spatial autocorrelation among cities. These results indicate that food security levels within the MGPR-MRYR were not randomly distributed but gradually evolved toward stronger regional agglomeration and spatial dependence.
Table 5.
Global Moran’s I of food security in the MGPR-MRYR.
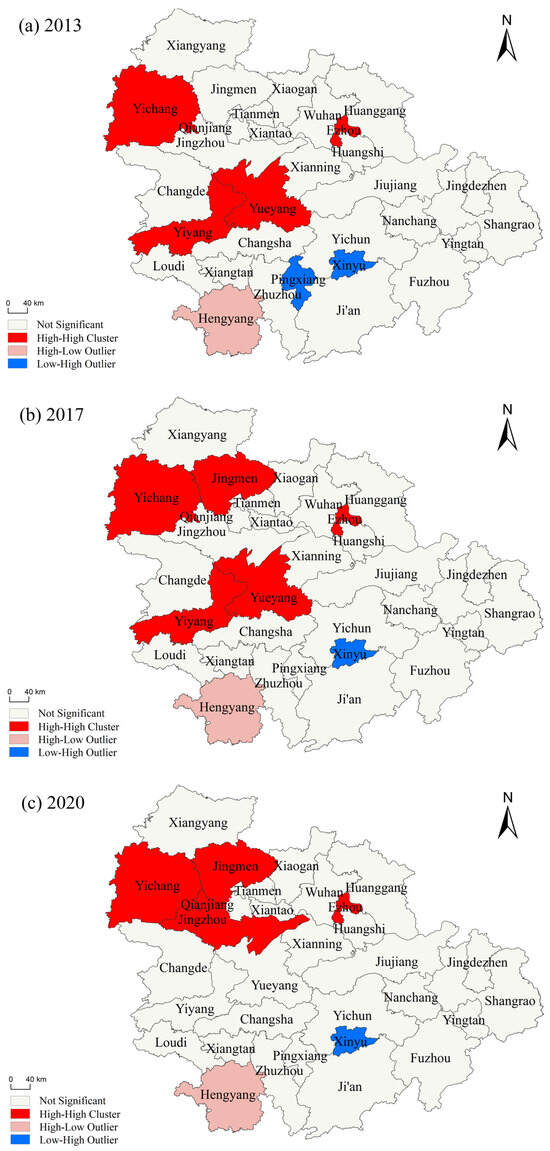
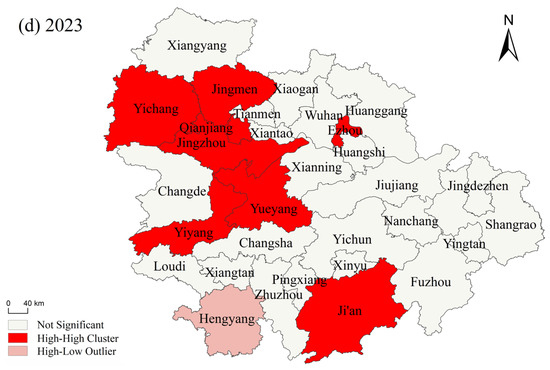
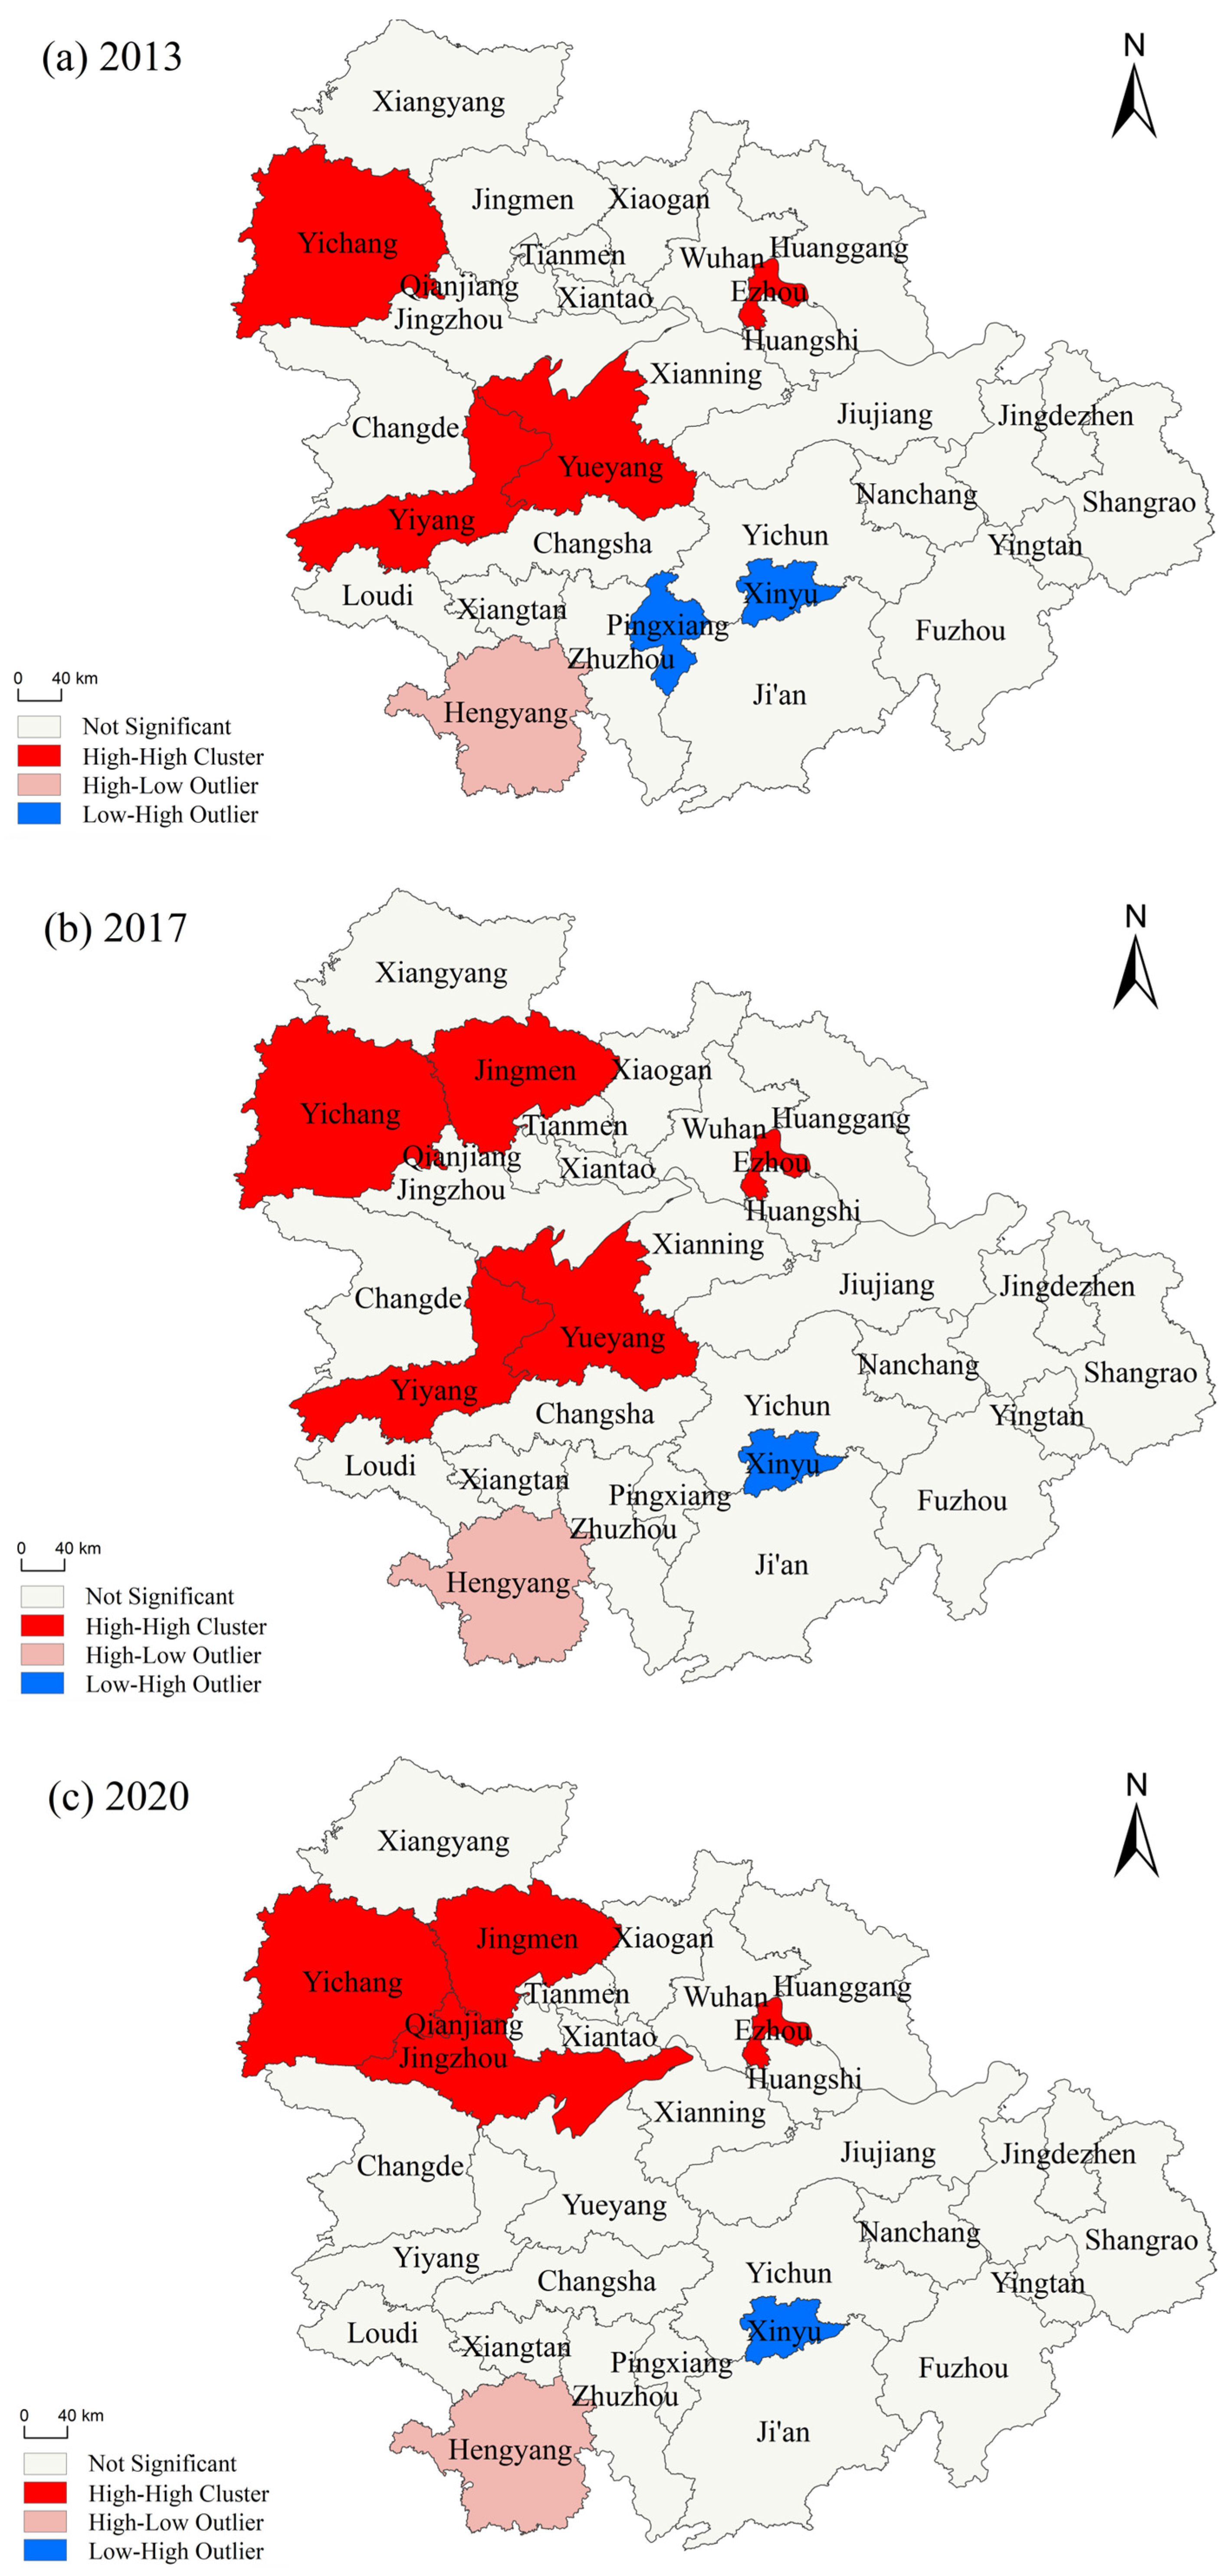
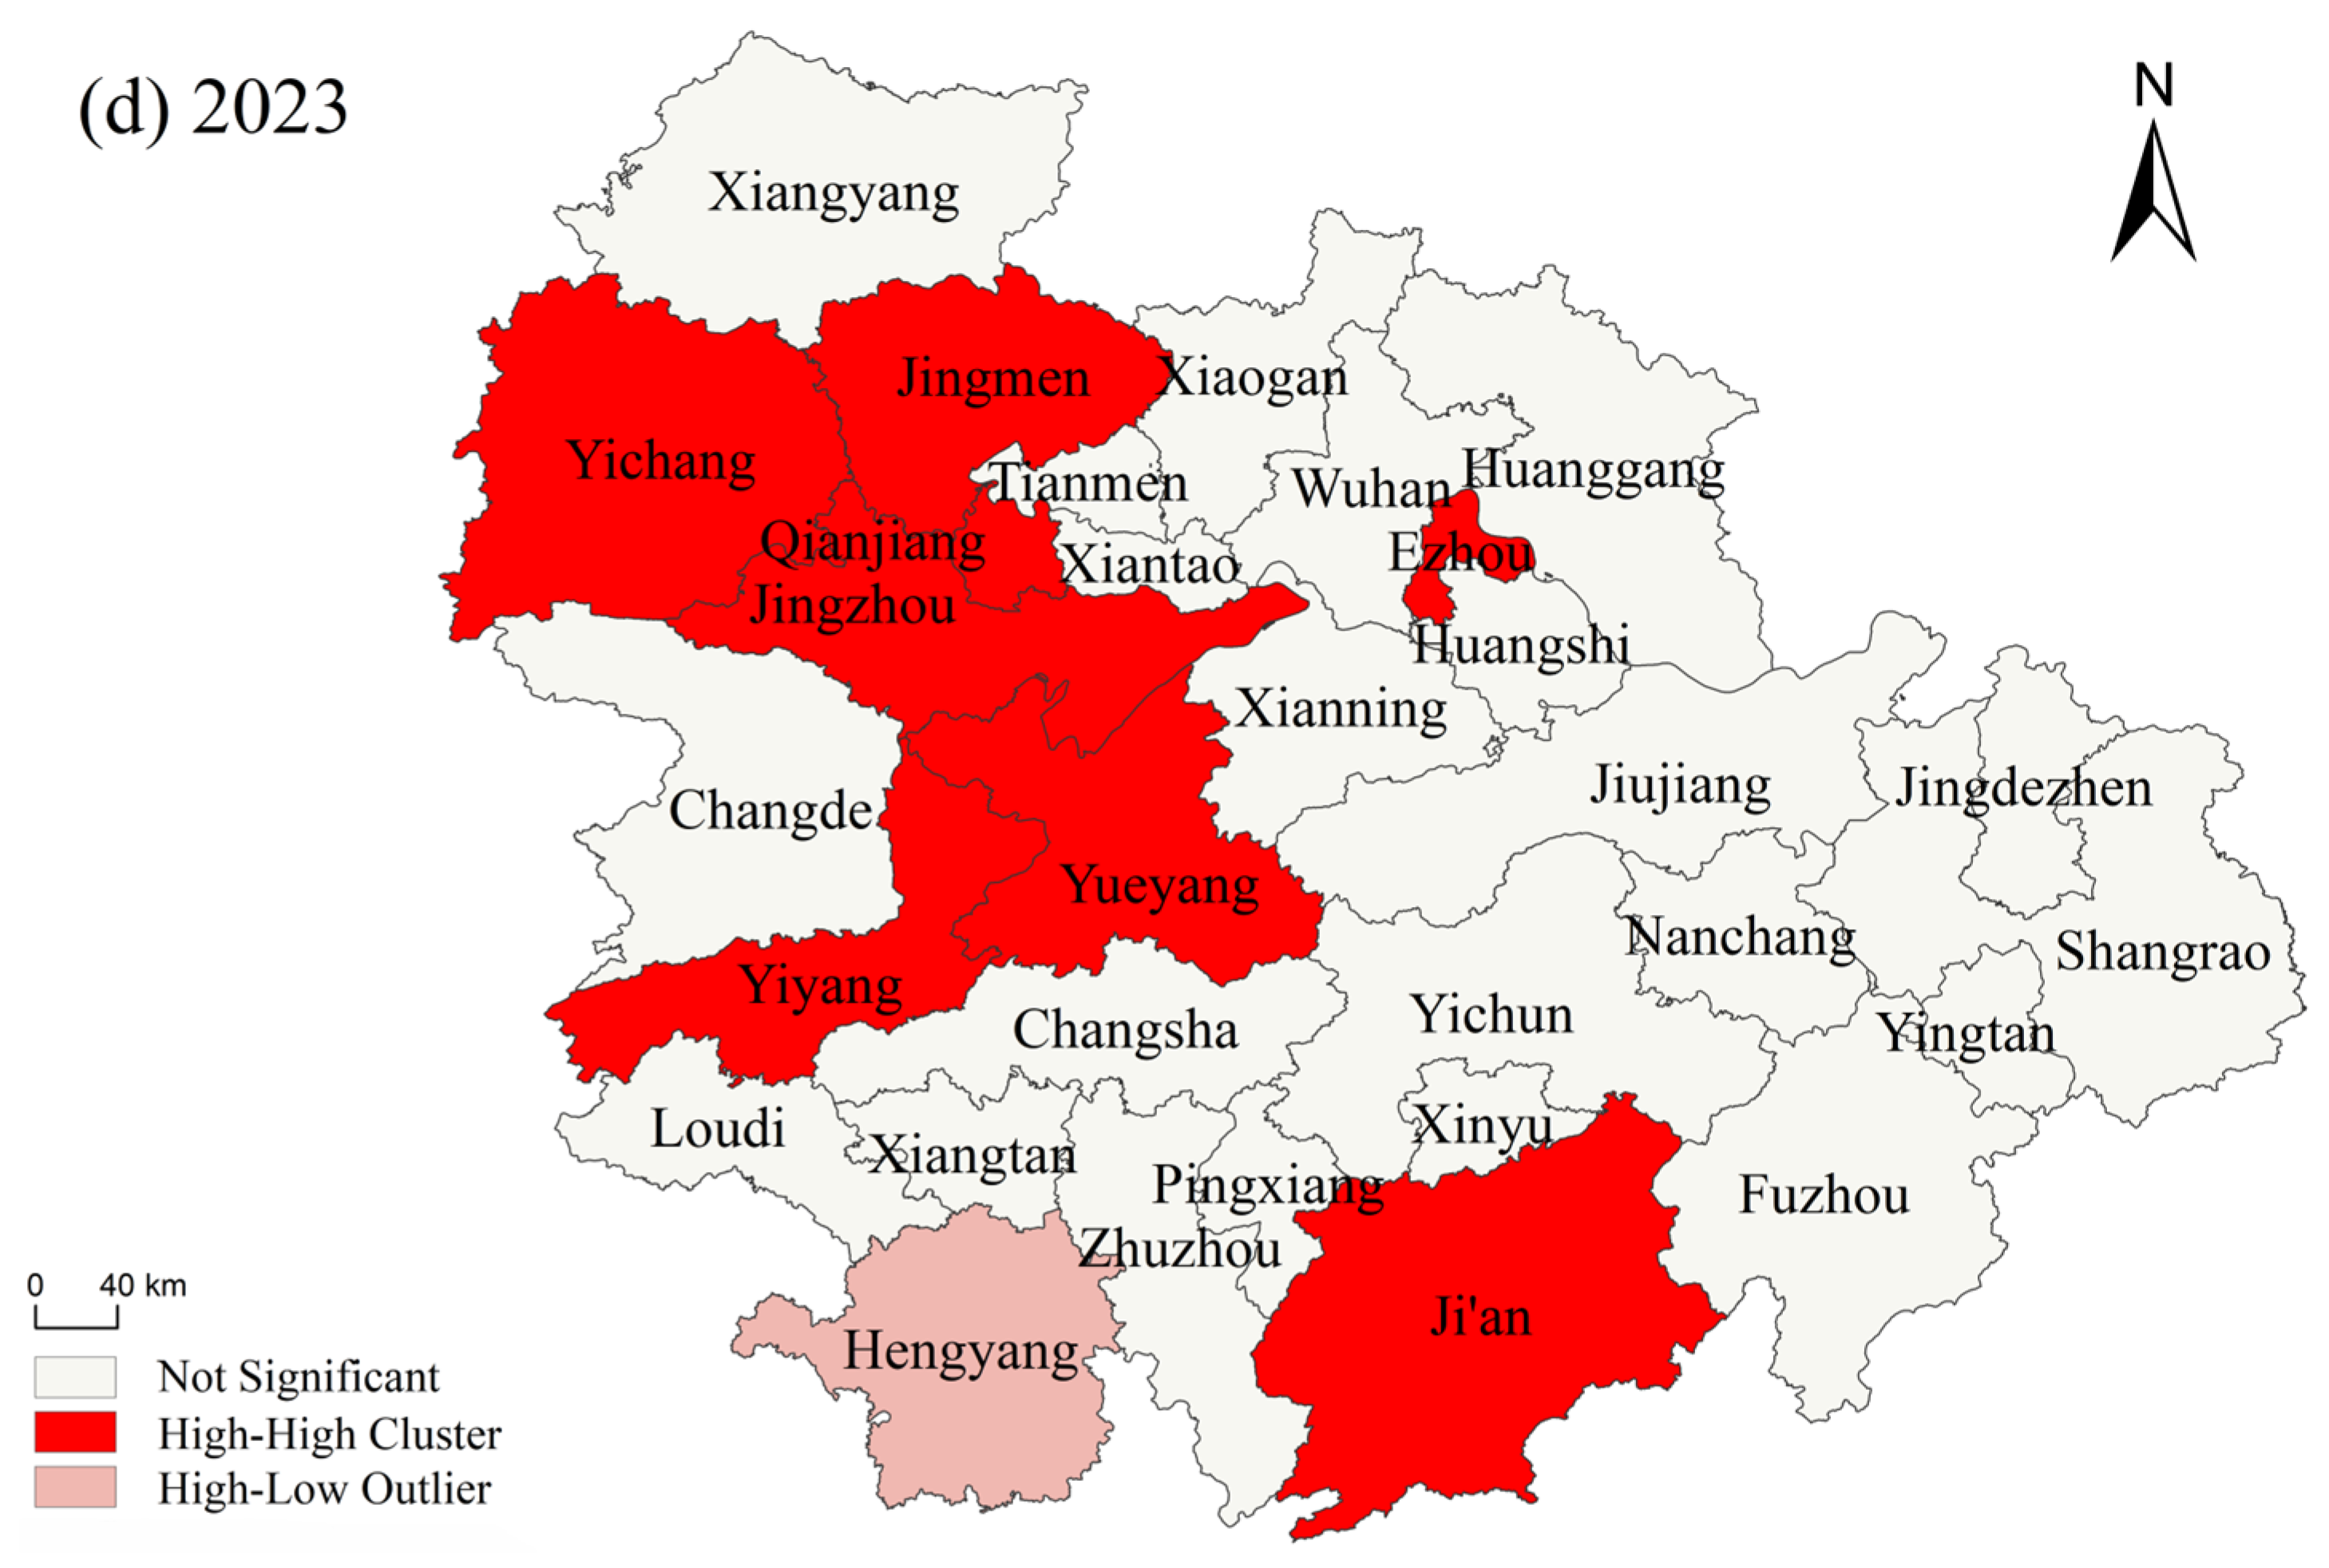
The LISA cluster maps shown in Figure 4 further reveal the dynamic evolution of local spatial clustering characteristics. In the early stage of the study period, high–high clusters were mainly concentrated in parts of the WUA and CZXUA, reflecting the concentration of relatively high food security levels in traditional agricultural regions with favorable cultivated land conditions and relatively stable grain production systems. In contrast, low–high clusters mainly appeared in parts of the PYLUA, indicating relatively weak local food security conditions surrounded by higher-level neighboring cities.
Figure 4.
LISA cluster map of Moran’s I in the MGPR-MRYR.
During the middle stage of the study period, high–high clusters gradually expanded and formed more contiguous spatial connections, particularly within the central and western WUA. This indicates that agricultural modernization, regional infrastructure improvement, and strengthened agricultural support increasingly enhanced the spatial spillover effects of food security. Nevertheless, some high–low and low–high clusters persisted, suggesting that regional polarization and uneven agricultural transformation remained unresolved. By 2023, Figure 4 shows that high–high clusters further expanded into parts of the CZXUA and PYLUA, while low–high clusters gradually disappeared. This trend suggests that food security within the MGPR-MRYR gradually evolved toward stronger regional agglomeration and spatial dependence. However, the persistence of certain high–low clusters also indicates that significant disparities remained between core agricultural areas and surrounding cities under uneven urbanization and agricultural development processes.
Overall, the combined results of the Theil index and Moran’s I demonstrate that food security within the MGPR-MRYR exhibited increasingly significant spatial differentiation and clustering characteristics during the study period. Urbanization intensity, agricultural modernization, cultivated land conditions, and regional resource allocation jointly shaped the evolving spatial structure of food security across the urban agglomerations.
3.3. Dynamic Evolution of Food Security Distribution
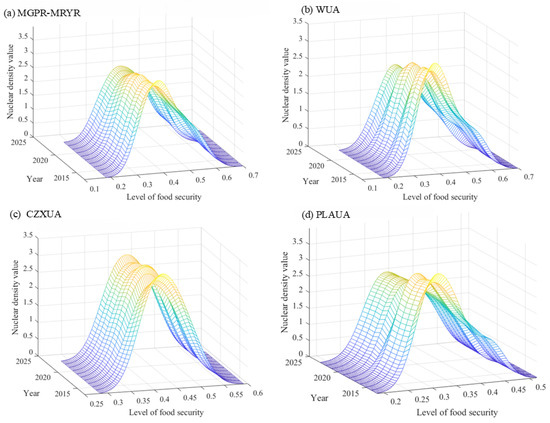
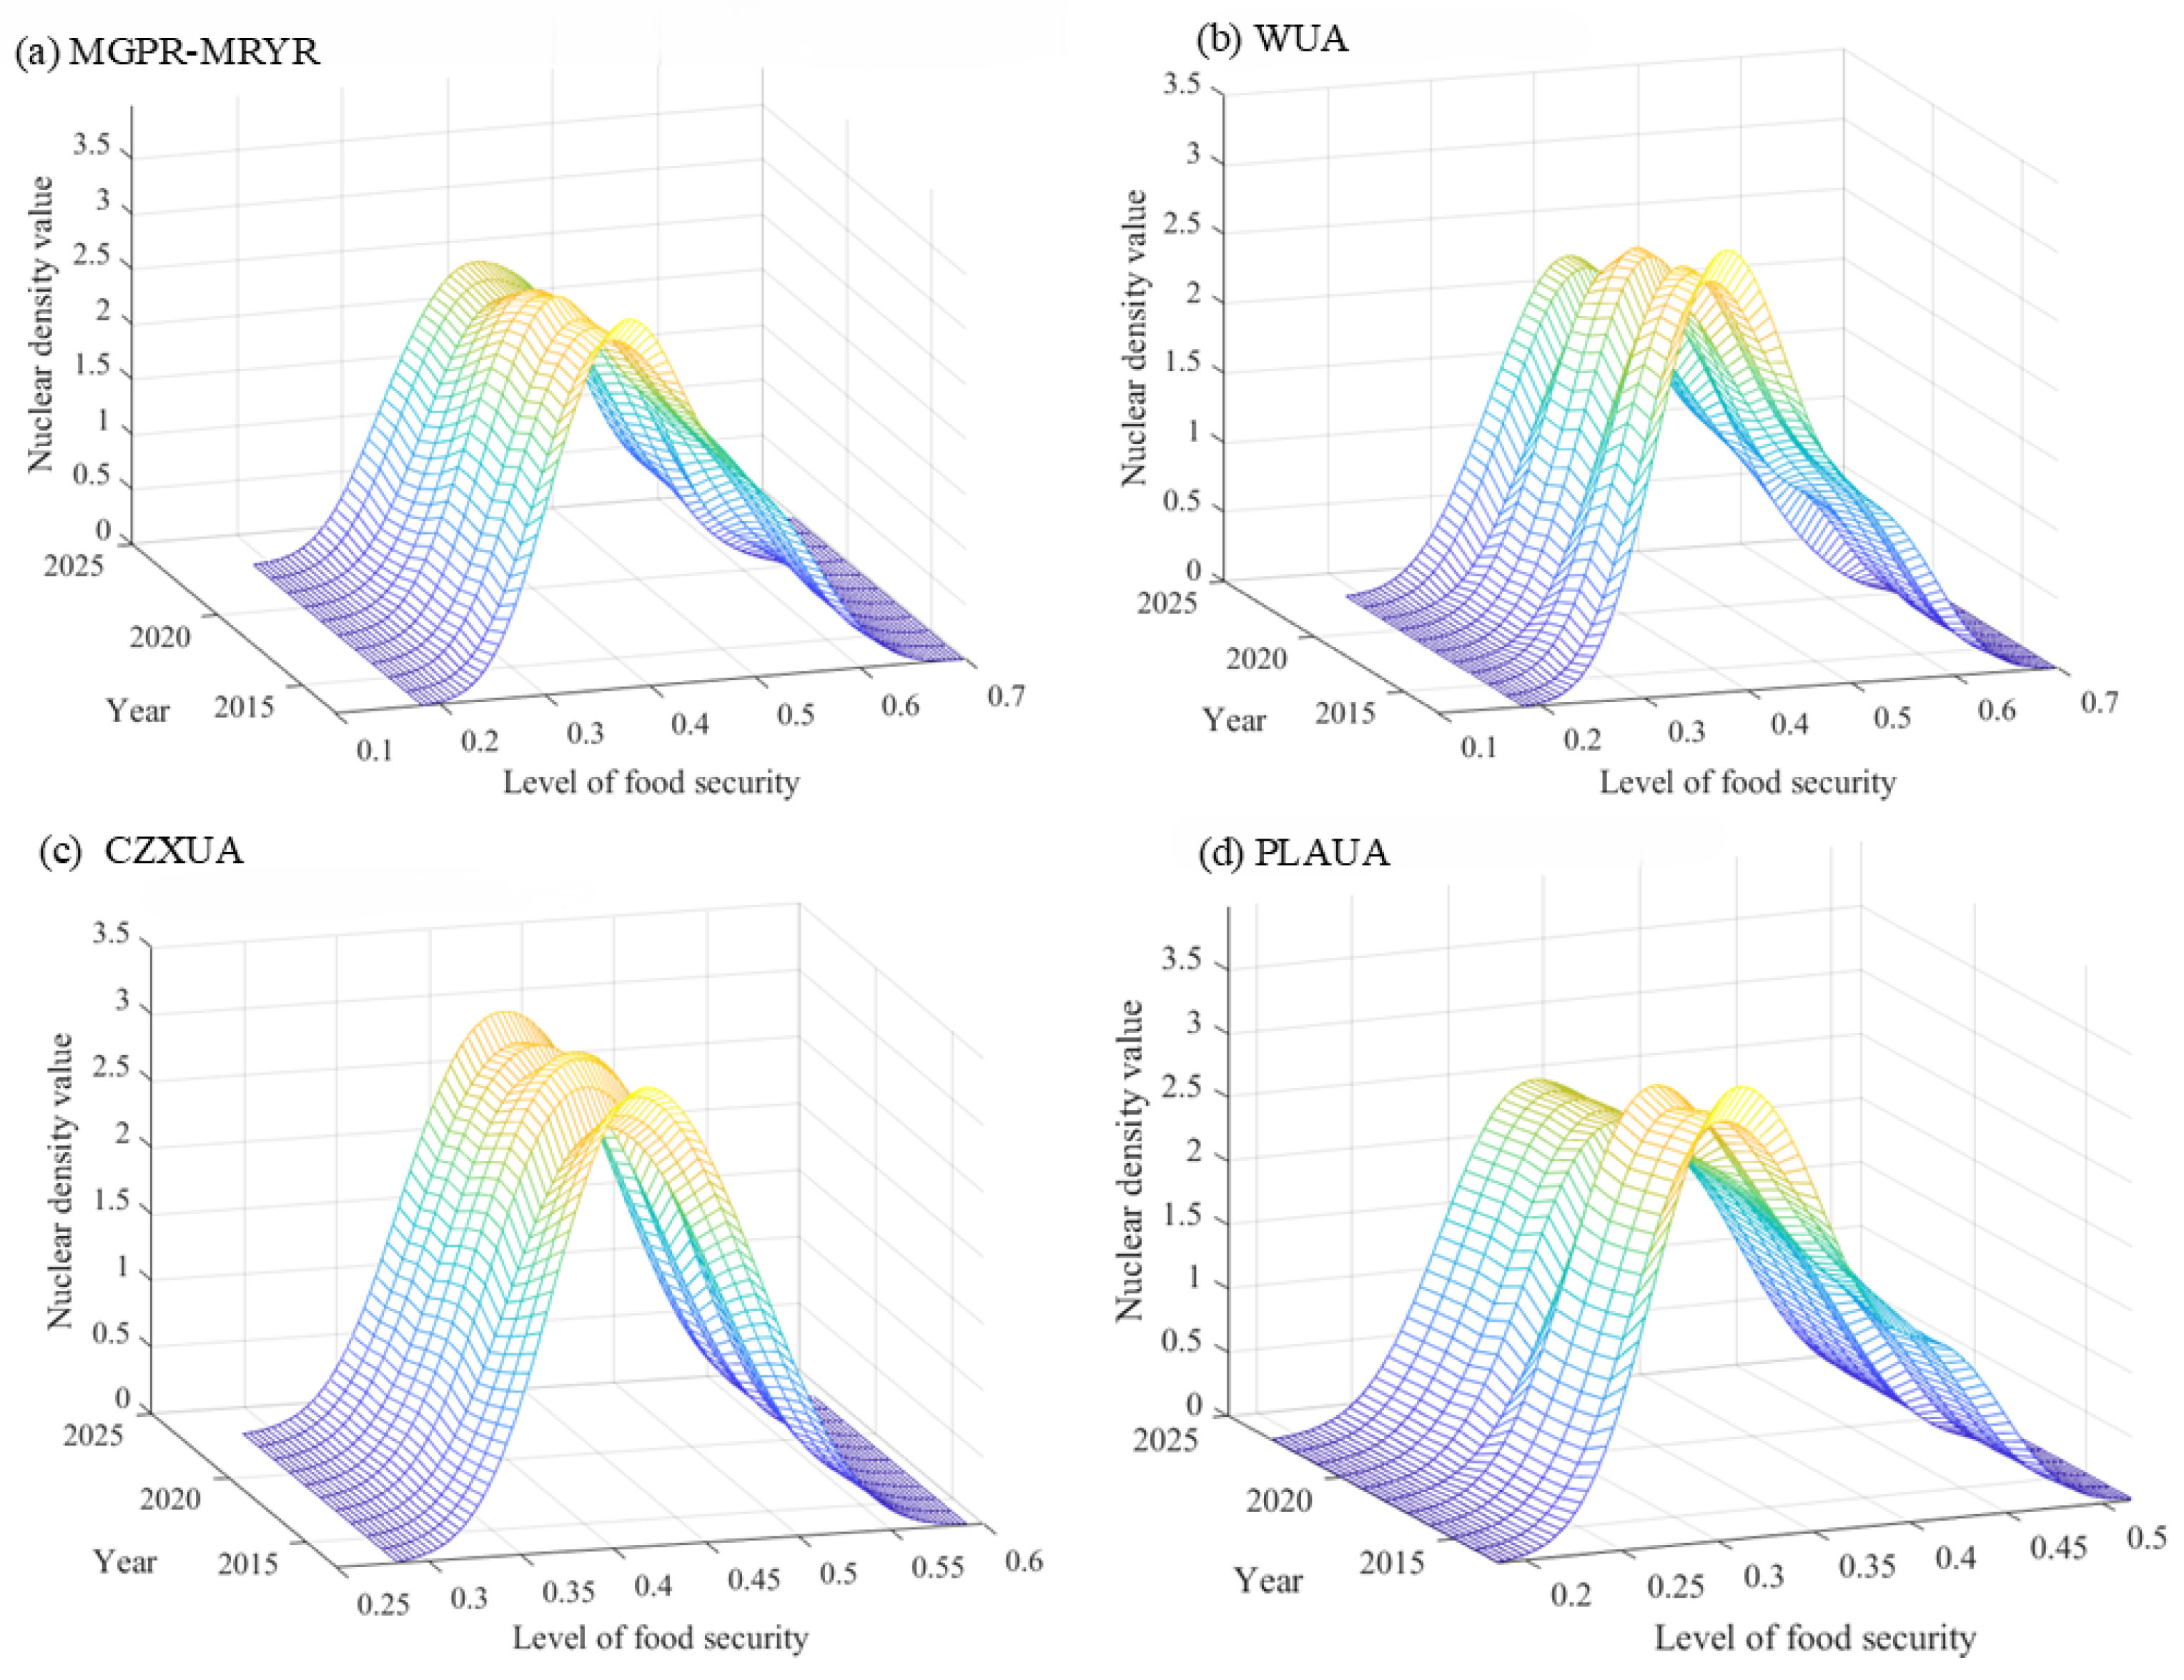
The kernel density estimation results reveal a continuous improvement in food security levels across the MGPR-MRYR during 2013–2023 (Figure 5a). The overall distribution curve gradually shifted to the right, indicating an increase in regional food security levels. Meanwhile, the peak of the distribution became flatter and wider, suggesting growing heterogeneity among cities. The emergence of a secondary peak in the later period further indicates a tendency toward distributional polarization, implying that the improvement in food security was not evenly shared across the region.
Figure 5.
Dynamic Distribution of Food Security Levels.
Significant differences were observed among the three urban agglomerations (Figure 5b–d). The WUA exhibited the most pronounced rightward shift in the kernel density curve, reflecting the fastest improvement in food security levels. In addition, its distribution gradually evolved from a multi-peak to a single-peak pattern, indicating a reduction in internal disparities and a tendency toward convergence. The CZXUA showed a relatively stable unimodal distribution throughout the study period, suggesting balanced development and moderate improvement. By contrast, the PYLUA displayed only a limited rightward shift and maintained a relatively flat distribution, indicating weak growth momentum and persistent low-level development.
Overall, the kernel density results indicate that food security in the MGPR-MRYR experienced a process of simultaneous improvement and differentiation. Although the overall level increased substantially, uneven development among urban agglomerations remained evident. This finding is consistent with the Theil index results showing expanding regional disparities and the Moran’s I results indicating increasing spatial agglomeration, together suggesting that food security advantages became increasingly concentrated in specific agricultural core areas.
3.4. Driving Mechanisms of Food Security
3.4.1. Selection of Influencing Factors
Building upon the theoretical framework linking urbanization, agricultural production, and food security, this study examined the determinants of food security from three dimensions: socioeconomic development, agricultural production, and natural environmental conditions [42,43,44,45,46]. These dimensions jointly influence food security through resource allocation, production capacity, and environmental constraints.
Accordingly, six representative variables were selected for OPGD analysis. GDP per capita (X1) and urbanization rate (X3) were used to characterize socioeconomic development; total power of agricultural machinery (X2) and rural population (X4) were employed to represent agricultural production capacity; and mean annual precipitation (X5) and mean elevation (X6) were selected to reflect natural environmental conditions. Together, these variables provide a comprehensive basis for identifying the key drivers and interaction mechanisms underlying the spatial differentiation of food security in the MGPR-MRYR.
3.4.2. Effects of Individual Factors
The OPGD results indicate substantial differences in the explanatory power of individual factors on the spatial heterogeneity of food security in the MGPR-MRYR (Table 6). Overall, agricultural production factors exhibited the strongest explanatory power throughout the study period, while the influence of socioeconomic and natural environmental factors showed notable temporal changes.
Table 6.
Detection results of driving factors.
Among all variables, total power of agricultural machinery (X2) consistently ranked first, with q-values exceeding 0.72 in all years. Rural population (X4) remained the second most influential factor, although its explanatory power showed a slight decline over time. These results suggest that agricultural production capacity remained the fundamental determinant of food security across the region.
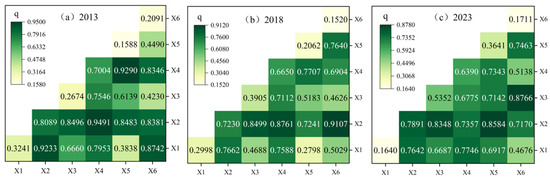
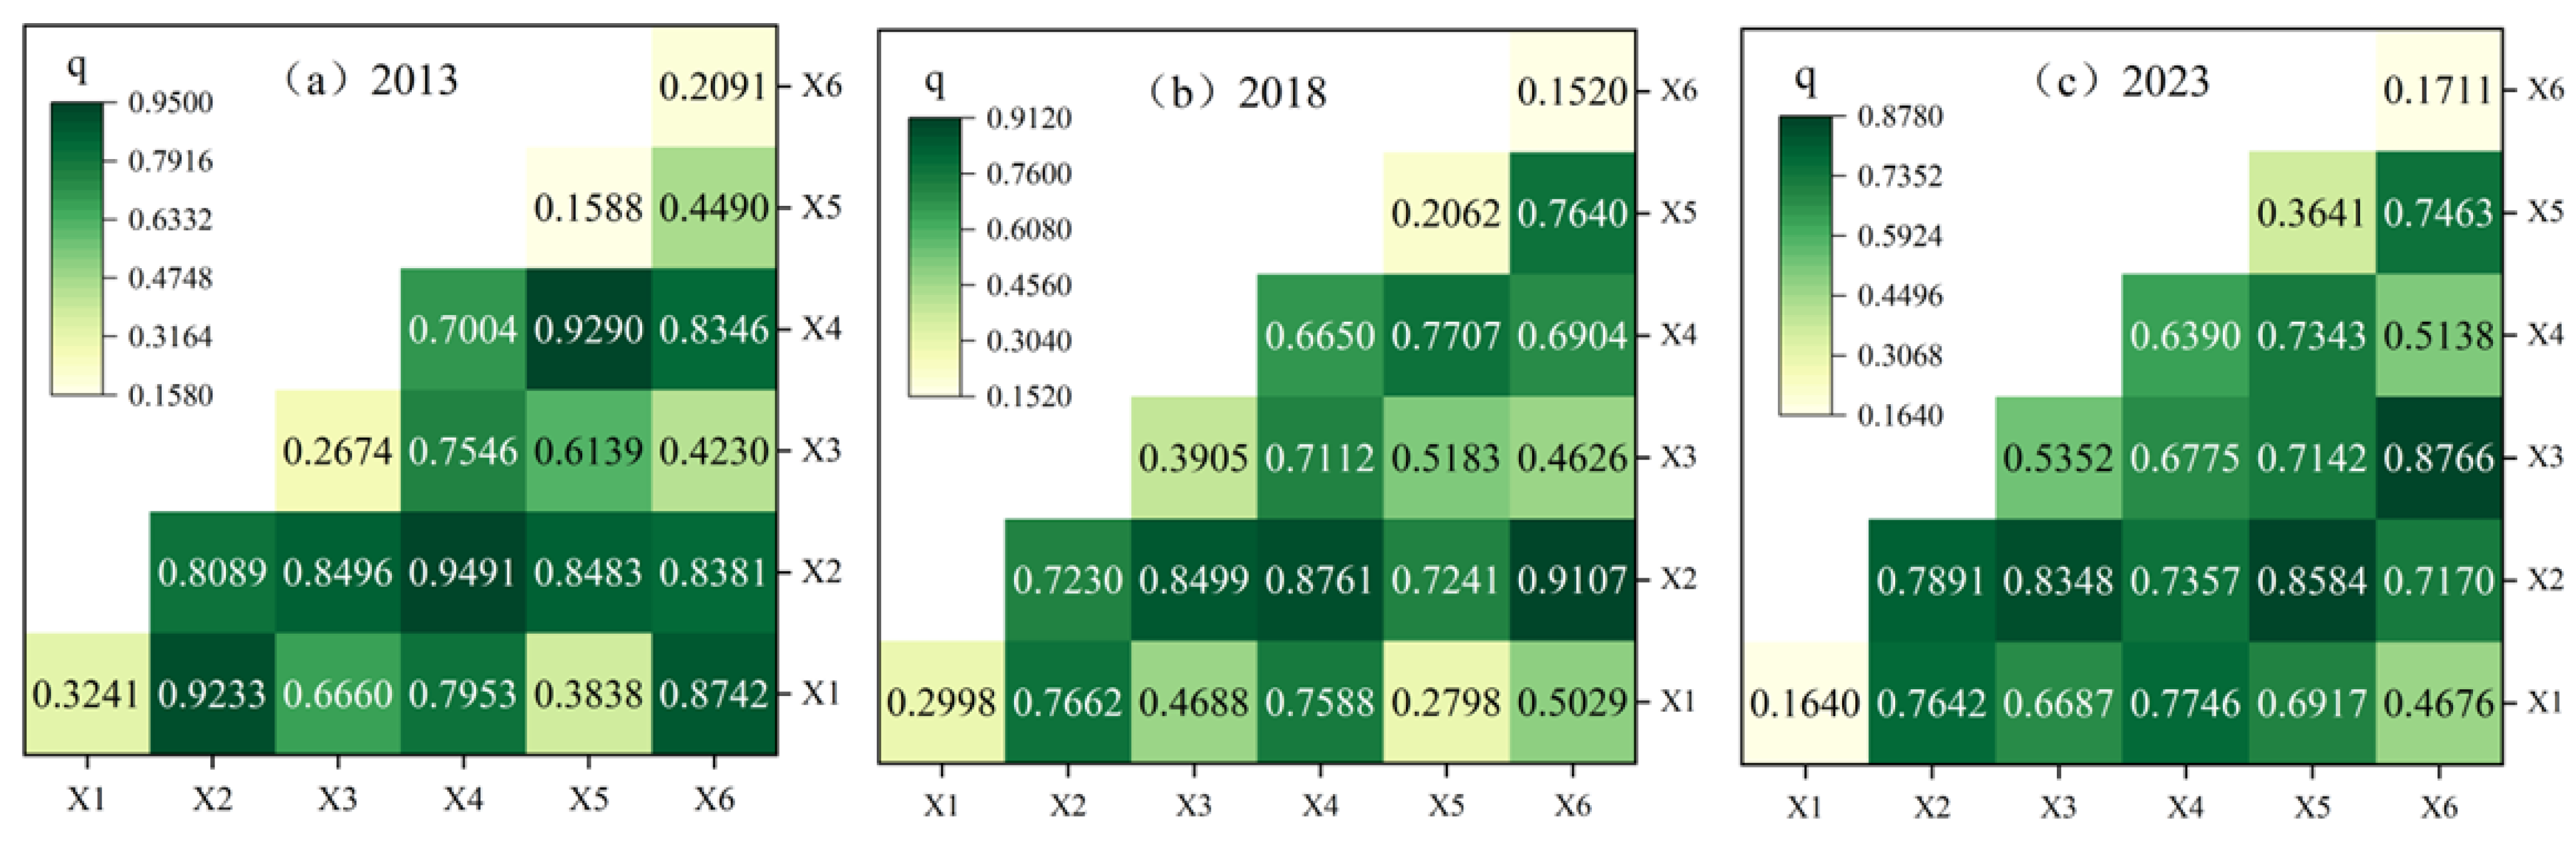
In contrast, the influence of socioeconomic factors exhibited divergent trends. The explanatory power of urbanization rate (X3) increased substantially from 0.2674 in 2013 to 0.5352 in 2023, indicating that urbanization has become an increasingly important factor shaping the spatial differentiation of food security. Conversely, GDP per capita (X1) showed a gradual decline in explanatory power, suggesting that economic growth alone was insufficient to explain variations in food security levels.
Among natural environmental factors, mean annual precipitation (X5) displayed a continuous increase in explanatory power, with its q-value rising from 0.1588 to 0.3641 during the study period. By contrast, mean elevation (X6) maintained relatively low explanatory power throughout the period. These findings indicate that climatic conditions, particularly water availability, have become increasingly important in influencing regional food security patterns. The significance test results confirmed that all reported q-values were statistically significant , supporting the robustness of the factor de-tection results.
3.4.3. Interaction Effects of Driving Factors
The interaction detector results reveal that the combined effects of any two factors exerted stronger explanatory power than individual factors alone (Figure 6). All interactions exhibited either two-factor enhancement or nonlinear enhancement, indicating that food security in the MGPR-MRYR is jointly shaped by multiple dimensions rather than by a single determinant.
Figure 6.
Results of factor interaction detection.
Agricultural production factors remained at the core of the interaction network throughout the study period. Interactions involving total power of agricultural machinery (X2), particularly X2X4, X2X3, and X2X5, consistently showed strong explanatory power, suggesting that production capacity plays a fundamental role in influencing food security patterns.
Meanwhile, the influence of socioeconomic and environmental interactions increased over time. Interactions involving urbanization rate (X3) became progressively more prominent, especially in combination with mean annual precipitation (X5) and mean elevation (X6). By 2023, the interaction between urbanization rate and mean elevation (X3X6) exhibited the highest explanatory power among all factor pairs, indicating that the combined effects of urban expansion and environmental constraints have become increasingly important in shaping regional food security. Overall, the results demonstrate that food security in the MGPR-MRYR is driven by the synergistic effects of agricultural production, socioeconomic development, and natural environmental conditions, with interaction effects generally exerting stronger explanatory power than individual factors.
4. Discussion
4.1. Spatial Differentiation Characteristics of Food Security
The observed spatial differentiation of food security reflects the combined effects of cultivated land distribution, agricultural specialization, and differentiated urbanization processes across the MGPR-MRYR. Rather than being primarily characterized by differences between urban agglomerations, regional inequality is dominated by disparities within urban agglomerations themselves. This finding differs from many provincial- or national-scale studies that emphasize cross-regional gaps, highlighting the necessity of taking urban agglomerations as basic governance units [47].
The contrasting patterns observed among the three urban agglomerations reflect different combinations of agricultural resource endowment, urbanization intensity, and development trajectories. These differences have generated distinct forms of food security evolution, ranging from the polarized core–periphery structure of the WUA to the relatively balanced development pathway of the CZXUA and the resource-constrained development pattern of the PYLUA.
This spatial divergence reflects a universal rule in rapidly urbanizing grain-producing regions: metropolitan cores tend to prioritize urban construction and industrial development, while traditional agricultural zones retain comparative advantages in grain production, leading to a “food security paradox” in highly urbanized core areas. Similar patterns [48,49,50] have been reported in other rapidly urbanizing regions worldwide, where urban expansion and uneven resource allocation have generated increasing spatial disparities in food security outcomes. These observations suggest that the coexistence of food security improvement and spatial inequality may represent a broader characteristic of food systems undergoing rapid socioeconomic transformation.
From a theoretical perspective, these findings provide empirical support for the conceptual framework proposed in this study. Rapid urbanization does not affect food security directly; rather, it reshapes the allocation of land, labor, and agricultural resources across cities, thereby generating spatial inequalities within urban agglomerations. These inequalities, in turn, contribute to differentiated food security outcomes among cities. The results therefore suggest that the relationship between urbanization and food security is mediated by spatial inequality, highlighting spatial inequality as a key mechanism through which urbanization shapes food security outcomes. Accordingly, food security evolution in rapidly urbanizing grain-producing regions should be understood as a spatially differentiated process rather than a uniform regional phenomenon.
These findings also have important policy implications. They suggest that food security governance in the middle reaches of the Yangtze River should move beyond homogeneous policy approaches and adopt differentiated spatial regulation strategies tailored to the functional positioning, resource endowments, and development trajectories of individual urban agglomerations.
4.2. Main Factors Affecting Food Security
The driving mechanisms of food security in the MGPR-MRYR have gradually evolved from a traditional factor-driven model toward a more integrated and synergistic system. This transition reflects the combined influence of agricultural modernization, urbanization, and environmental constraints on regional food security patterns.
Agricultural production factors remain the fundamental basis of food security. The persistent importance of agricultural machinery and rural labor indicates that grain production in major grain-producing regions still depends heavily on production efficiency and factor endowment. However, the weakening marginal influence of these traditional factors suggests that further improvements in food security can no longer rely solely on increasing production inputs, but increasingly require structural optimization and technological upgrading.
The accelerated improvement in food security after 2020 may also reflect the effects of strengthened national food security governance. Policies emphasizing seed security and cultivated land protection following the 2020 Central Economic Work Conference, the implementation of the Action Plan for Revitalizing the Seed Industry, the institutionalization of the Party and Government Accountability System for Food Security, and the accelerated construction of high-standard farmland have provided important institutional support for sustaining grain production capacity in major grain-producing regions.
Another notable finding is that all factor interactions exhibit enhancement effects, indicating that the spatial differentiation of food security cannot be explained by individual factors alone. The widespread enhancement effects suggest that food security should be understood as a coupled socio-ecological system shaped by the interaction of agricultural production, urbanization, and environmental conditions [51,52,53]. However, it should be noted that the OPGD results identify statistical associations rather than causal relationships. Therefore, the observed patterns should be interpreted as indicative of potential explanatory mechanisms rather than definitive causal pathways. Effective governance therefore requires coordinated interventions across agricultural modernization, urban development, and climate adaptation rather than relying on single-factor policy measures.
4.3. Heterogeneous Development Pathways of Urban Agglomerations
The results reveal pronounced heterogeneity in the evolutionary pathways of food security among the three urban agglomerations. Such differences are closely associated with variations in resource endowment, urbanization processes, agricultural production conditions, and development trajectories.
The WUA represents a typical core–periphery pattern characterized by strong internal polarization. While several agricultural core cities have maintained high food security levels, peripheral areas have experienced comparatively slower improvement. This pattern reflects uneven agricultural development and differentiated urbanization processes, which have contributed to increasing intra-agglomeration disparities.
In contrast, the CZXUA exhibits a relatively balanced development trajectory with lower internal disparities. The coordinated relationship between agricultural production and urbanization has enabled the region to maintain stable food security performance while avoiding excessive spatial polarization. This finding suggests that balanced urban–rural development can help mitigate potential conflicts between urban expansion and agricultural production.
The PYLUA follows a markedly different pathway. Constrained by complex terrain conditions, fragmented cultivated land resources, and relatively weak agricultural modernization, the region has maintained comparatively low food security levels throughout the study period. These structural constraints limit economies of scale and reduce the efficiency of agricultural production, thereby weakening the region’s capacity to achieve sustained improvements in food security.
Overall, the contrasting development trajectories of the three urban agglomerations indicate that food security in major grain-producing regions is shaped not only by agricultural production capacity but also by the interaction between urbanization, resource endowment, and regional development conditions. This highlights the necessity of adopting differentiated governance strategies that account for regional heterogeneity rather than relying on uniform policy approaches.
4.4. Policy Implications
Before discussing specific policy recommendations, several theoretical implications of the findings deserve emphasis. First, by adopting urban agglomerations as the analytical unit, this study extends food security research beyond traditional national and provincial scales and reveals substantial intra-agglomeration heterogeneity. Second, the findings suggest that urbanization influences food security indirectly through spatial inequality and resource reallocation processes, highlighting spatial inequality as an important mechanism linking urbanization and food security. Third, the widespread enhancement effects identified by the OPGD model indicate that food security should be understood as a coupled socio-ecological system jointly shaped by interactions among agricultural, socioeconomic, and environmental factors.
The findings suggest that food security governance in the MGPR-MRYR should move beyond uniform policy approaches and adopt differentiated strategies that account for regional heterogeneity. Given the significant disparities among urban agglomerations, policy interventions should be tailored to local development conditions, agricultural resource endowments, and urbanization trajectories.
For the WUA, priority should be given to narrowing the internal development gap and strengthening coordination between core agricultural areas and peripheral cities. Establishing cross-regional mechanisms for cultivated land protection, agricultural infrastructure investment, and benefit-sharing may help reduce spatial inequality and enhance the diffusion of agricultural development advantages.
For the CZXUA, which exhibits relatively balanced development, policy efforts should focus on improving the quality and efficiency of agricultural production. Promoting modern agricultural technologies, smart agriculture, and integrated urban–rural development can further enhance food security resilience while maintaining the existing balance between urbanization and agricultural production.
For the PYLUA, food security governance should emphasize adaptive and ecology-oriented development pathways. Considering the constraints imposed by complex terrain and fragmented cultivated land resources, greater attention should be paid to moderate-scale management, ecological agriculture, agricultural infrastructure improvement, and regional cooperation. Such measures may help strengthen agricultural sustainability while maintaining ecological security.
More broadly, the increasing importance of interactions among urbanization, environmental conditions, and agricultural production suggests that food security can no longer be addressed solely through production-oriented policies. Future governance should promote the coordinated development of agricultural modernization, climate adaptation, and urban planning, thereby enhancing the long-term sustainability and resilience of food security in major grain-producing regions.
5. Conclusions
Using panel data for 31 cities in the MGPR-MRYR from 2013 to 2023, this study constructed a multidimensional food security evaluation framework and systematically examined the spatiotemporal evolution, regional disparities, spatial dependence, and driving mechanisms of food security at the urban agglomeration scale. The main conclusions are as follows.
First, food security levels in the MGPR-MRYR showed an overall upward trend during the study period, although significant spatial differentiation persisted. A relatively stable spatial pattern was observed, with higher food security levels concentrated in western and inland areas and comparatively lower levels in eastern and lakeside areas. Regional inequality was primarily driven by intra-agglomeration disparities rather than inter-agglomeration differences. Among the three urban agglomerations, the WUA exhibited the most pronounced internal polarization, the CZXUA maintained relatively balanced development, and the PYLUA remained at comparatively low food security levels. In addition, significant positive spatial autocorrelation was identified, indicating an increasing tendency toward spatial clustering of food security.
Second, the dynamic evolution of food security displayed a pattern of simultaneous improvement and differentiation. KDE results showed a continuous rightward shift in the overall distribution, indicating a general increase in food security levels. However, persistent heterogeneity and emerging polarization were also observed, suggesting that improvements were unevenly distributed across cities and urban agglomerations. These findings highlight the coexistence of overall progress and regional imbalance in food security development.
Third, the driving mechanism of food security has gradually evolved from a traditional factor-driven model toward a multidimensional and synergistic system. Agricultural machinery power and rural population remained the most important determinants throughout the study period, reflecting the continued importance of agricultural production capacity in major grain-producing regions. Meanwhile, the explanatory power of urbanization and annual precipitation increased substantially, indicating the growing influence of socioeconomic transformation and environmental conditions. Furthermore, all factor interactions exhibited enhancement effects, demonstrating that food security is jointly shaped by agricultural production, urbanization, and natural environmental factors rather than by any single determinant.
This study contributes to the food security literature in three respects. First, by adopting urban agglomerations as the analytical unit, it extends existing food security research beyond traditional national and provincial scales and provides new evidence on spatial heterogeneity within major grain-producing regions. Second, it offers an integrated perspective for understanding the relationships among urbanization, regional inequality, and food security, highlighting the importance of differentiated governance strategies in rapidly urbanizing agricultural regions.
Several limitations should be acknowledged. Although the OPGD model effectively identifies explanatory power, it cannot reveal causal relationships, nonlinear thresholds, or effect directions. In addition, some potentially important indicators, such as grain self-sufficiency and storage capacity, were not included due to data availability constraints. The Entropy Weight Method, while reducing subjective bias, assumes indicator independence and may not fully capture complex interactions among agro-economic variables. Future studies could incorporate county-level data, spatial econometric approaches, interpretable machine learning methods, and multi-objective weighting techniques to further explore causal mechanisms and nonlinear effects of food security evolution.
Author Contributions
Conceptualization, Y.M. and B.L.; methodology, Y.M. and B.L.; software, B.L. and X.M.; validation, Y.M., B.L. and X.M.; formal analysis, Y.M., B.L. and X.M.; data curation, B.L. and X.M.; writing—original draft preparation, Y.M., B.L. and X.M.; writing—review and editing, Y.M., B.L., and X.M.; visualization, Y.M. and B.L.; funding acquisition, Y.M.; Y.M. and B.L. contributed equally to this work and share first authorship. All authors have read and agreed to the published version of the manuscript.
Funding
This research was funded by the National Social Science Fund of China, grant number 23BGL208.
Institutional Review Board Statement
Not applicable.
Informed Consent Statement
Not applicable.
Data Availability Statement
The original contributions presented in the study are included in the article. Further inquiries can be directed to the corresponding author.
Acknowledgments
We are indebted to the anonymous reviewers and editor.
Conflicts of Interest
The authors declare no conflicts of interest.
Abbreviations
| MGPR-MRYR | Main Grain-Producing Region in the Middle Reaches of the Yangtze River |
| WUA | Wuhan Urban Agglomeration |
| CZXUA | Changsha–Zhuzhou–Xiangtan Urban Agglomeration |
| PYLUA | Poyang Lake Urban Agglomeration |
| KDE | Kernel Density Estimation |
| OPGD | Optimal-Parameter Geographical Detector |
References
- Ishangulyyev, S.; Kim, S.; Lee, S. Understanding Food Loss and Waste-Why Are We Losing and Wasting Food? Foods 2019, 8, 297. [Google Scholar] [CrossRef] [Scilit]
- Simane, B.; Kapwata, T.; Naidoo, N.; Cissé, G.; Wright, C.; Berhane, K. Ensuring Africa’s Food Security by 2050: The Role of Population Growth, Climate-Resilient Strategies, and Putative Pathways to Resilience. Foods 2025, 14, 262. [Google Scholar] [CrossRef] [Scilit] [PubMed]
- Wu, G.; Xia, B.; Dong, S.; Zhang, J.; Li, Z.; Yang, G. Spatio-Temporal Differentiation and Driving Factors of County-Level Food Security in the Yellow River Basin: A Case Study of Ningxia, China. Land 2024, 13, 1885. [Google Scholar] [CrossRef] [Scilit]
- Wei, K.; Lou, C.; Sun, Z.; Guan, X. Research on optimizing the planting structure of food crops from the perspective of water-energy resources constraints-evidence from Henan province toward the “15th Five-Year Plan” period. Front. Sustain. Food Syst. 2025, 9, 1575631. [Google Scholar] [CrossRef] [Scilit]
- Hou, Y.; Liang, X. Research on Food Security Risk Assessment and Early Warning in China Based on BP Neural Network Model. J. Food Qual. 2022, 2022, 5245752. [Google Scholar] [CrossRef] [Scilit]
- Wang, M.; Hu, S.; Sakradzija, M.; Zang, Y.; Tiando, D. Spatiotemporal cropland dynamics and sustainable pathways in the Yangtze river economic belt. Sci. Rep. 2026, 16, 7698. [Google Scholar] [CrossRef] [Scilit]
- Shi, S.; Ye, Y.; Xiao, R. Evaluation of Food Security Based on Remote Sensing Data-Taking Egypt as an Example. Remote Sens. 2022, 14, 2876. [Google Scholar] [CrossRef] [Scilit]
- Jiang, Q.; Rong, Z.; Yuan, Z. Research on the Construction of China’s Provincial Food Security Evaluation System and Regional Performance-Based on the “Great Food View”. Agriculture 2023, 13, 1240. [Google Scholar] [CrossRef] [Scilit]
- Cheng, J.; Yin, S. Evaluation of Food Security in North China Based on Food Production Level. Foods 2024, 13, 2189. [Google Scholar] [CrossRef] [Scilit]
- Wang, Y.; Liu, X.; Song, M.; Dou, C. Evaluation of Food Security in Different Grain Functional Areas in China Based on the Entropy Weight Extended Matter Element Model. Foods 2025, 14, 1111. [Google Scholar] [CrossRef] [Scilit]
- Liu, T.; Shen, W. Regional differences, spatial temporal evolution and dynamic evolution of food security in China. Sci. Rep. 2025, 15, 35180. [Google Scholar] [CrossRef] [Scilit] [PubMed]
- Wang, J.; Tong, M. Shanxi province food security evaluation research. Sci. Rep. 2025, 15, 897. [Google Scholar] [CrossRef] [Scilit]
- Wei, Y.; Fang, D.; Wei, X.; Ye, Z. Assessing the equilibrium of food supply and demand in China’s food security framework: A comprehensive evaluation, 1980–2017. Front. Sustain. Food Syst. 2024, 8, 1326839. [Google Scholar] [CrossRef] [Scilit]
- Wang, S.; Wu, H.; Li, J.; Xiao, Q.; Li, J. Assessment of the Effect of the Main Grain-Producing Areas Policy on China’s Food Security. Foods 2024, 13, 654. [Google Scholar] [CrossRef] [Scilit]
- Abbas, S.; Haider, A.; Kousar, S.; Lu, H.; Lu, S.; Liu, F.; Li, H.; Miao, C.; Feng, W.; Ahamad, M.; et al. Climate variability, population growth, and globalization impacting food security in Pakistan. Sci. Rep. 2025, 15, 4225. [Google Scholar] [CrossRef] [Scilit] [PubMed]
- Balcilar, M.; Olasehinde-Williams, G.; Tokar, B. Achieving National Food Security in Sub-Saharan African Countries: The Role of Foreign Agricultural Aid. Food Energy Secur. 2025, 14, e70042. [Google Scholar] [CrossRef] [Scilit]
- Rashidi, T.; Pakravan-Charvadeh, M.; Gholamrezai, S.; Rahimian, M. Unveiling the nexus of climate change, adaptation strategies, and food security: Insights from small-scale farmers in zagros mountains in Iran. Environ. Res. 2024, 252, 118691. [Google Scholar] [CrossRef] [Scilit]
- Onyeneke, R.; Atta-Ankomah, R.; Chikezie, C.; Ihebuzor, U.; Obieche, N. The Role of Institutional Quality, Foreign Direct Investments, Financial Development and Official Development Assistance in Promoting Agricultural Development in Africa. In Natural Resources Forum; Blackwell Publishing Ltd.: Oxford, UK, 2025. [Google Scholar] [CrossRef] [Scilit]
- Li, L.; Huang, X.; Wu, D.; Yang, H. Construction of ecological security pattern adapting to future land use change in Pearl River Delta, China. Appl. Geogr. 2023, 154, 102946. [Google Scholar] [CrossRef] [Scilit]
- Li, X.; Xu, X.; Yin, R. Spatial optimization of agricultural production from the perspective of “Greater Food Concept” in Yangzhou, China. Ecol. Indic. 2024, 169, 112805. [Google Scholar] [CrossRef] [Scilit]
- Wang, X.; Du, R.; Cai, H.; Lin, B.; Dietrich, J.; Stevanovic, M.; Lotze-Campen, H.; Popp, A. Assessing the impacts of technological change on food security and climate change mitigation in China’s agriculture and land-use sectors. Environ. Impact Assess. Rev. 2024, 107, 107550. [Google Scholar] [CrossRef] [Scilit]
- Wang, L.; Zhang, S.; Xiong, Q.; Liu, Y.; Liu, Y.; Liu, Y. Spatiotemporal dynamics of cropland expansion and its driving factors in the Yangtze River Economic Belt: A nuanced analysis at the county scale. Land Use Policy 2022, 119, 106168. [Google Scholar] [CrossRef] [Scilit]
- Lv, T.; Qiu, R.; Fu, S.; Zhao, Q.; Chen, A. Unveiling Spatiotemporal Evolution and the Influence of Net Carbon Sinks in Cultivated Land Systems in the Middle Reaches of the Yangtze River. Land Degrad. Dev. 2026, 37, 582–599. [Google Scholar] [CrossRef] [Scilit]
- Huang, J.; Sun, Z.; Du, M. Differences and Drivers of Urban Resilience in Eight Major Urban Agglomerations: Evidence from China. Land 2022, 11, 1470. [Google Scholar] [CrossRef] [Scilit]
- Srdjevic, B.; Medeiros, Y.; Faria, A. An objective multi-criteria evaluation of water management scenarios. Water Resour. Manag. 2004, 18, 35–54. [Google Scholar] [CrossRef] [Scilit]
- Qiao, W.; Xie, Y.; Liu, J.; Huang, X. The Impacts of Urbanization on Carbon Emission Performance: New Evidence from the Yangtze River Delta Urban Agglomeration, China. Land 2025, 14, 12. [Google Scholar] [CrossRef] [Scilit]
- Rambaut, A.; Drummond, A.; Xie, D.; Baele, G.; Suchard, M. Posterior Summarization in Bayesian Phylogenetics Using Tracer 1.7. Syst. Biol. 2018, 67, 901–904. [Google Scholar] [CrossRef] [Scilit]
- Cai, X.; Wu, Z.; Cheng, J. Using kernel density estimation to assess the spatial pattern of road density and its impact on landscape fragmentation. Int. J. Geogr. Inf. Sci. 2013, 27, 222–230. [Google Scholar] [CrossRef] [Scilit]
- Zhou, X.; Jiang, T. Metamodel selection based on stepwise regression. Struct. Multidiscip. Optim. 2016, 54, 641–657. [Google Scholar] [CrossRef] [Scilit]
- Jiang, W.; Yuan, L.; Wang, W.; Cao, R.; Zhang, Y.; Shen, W. Spatio-temporal analysis of vegetation variation in the Yellow River Basin. Ecol. Indic. 2015, 51, 117–126. [Google Scholar] [CrossRef] [Scilit]
- Shorrocks, A.F. The Class of Additively Decomposable Inequality Measures. Econometrica 1980, 48, 613–625. [Google Scholar] [CrossRef] [Scilit]
- Zhang, W.; Bao, S. Created unequal: China’s regional pay inequality and its relationship with mega-trend urbanization. Appl. Geogr. 2015, 61, 81–93. [Google Scholar] [CrossRef] [Scilit]
- Yao, P.; Fan, H.; Wu, Q.; Ouyang, J.; Li, K. Compound impact of COVID-19, economy and climate on the spatial distribution of global agriculture and food security. Sci. Total Environ. 2023, 880, 163105. [Google Scholar] [CrossRef] [Scilit]
- Yang, Y.; Qi, C.; Gu, Y.; Gui, C. Coordinated Development and Spatiotemporal Evolution Trends of China’s Agricultural Trade and Production from the Perspective of Food Security. Foods 2025, 14, 2538. [Google Scholar] [CrossRef] [Scilit]
- Ben, Y.; Zhang, Y.e.; Xu, J. Spatial coupling mechanisms of food security and regional economies: Empirical examination of core-periphery dynamics in Jiangsu Province (2001–2024). Front. Sustain. Food Syst. 2025, 9, 1614887. [Google Scholar] [CrossRef] [Scilit]
- Lee, C.-C.; Li, J.; Zeng, M. Construction of China’s food security evaluation index system and spatiotemporal evolution. Environ. Sci. Pollut. Res. 2024, 31, 25014–25032. [Google Scholar] [CrossRef] [Scilit]
- Jung, W.; Kim, A.H.; Stoeffler, Q.; Goudarzi, S.; Benotsmane, R.; Shah, V. Targeting urban poverty and food insecurity: A community-informed spatial analysis and machine learning approach. Sustain. Cities Soc. 2025, 134, 106799. [Google Scholar] [CrossRef] [Scilit]
- Zhao, Z.; Fu, Y.; Wang, H.; Ahmad, B.; Jin, F. Optimizing soybean-pig integration zones in China: A multi-algorithm approach using random forest, LSTM, and clustering for feed grain and meat security balance. Front. Sustain. Food Syst. 2025, 9, 1488994. [Google Scholar] [CrossRef] [Scilit]
- Li, X.; Yu, K.; Xu, G.; Li, P.; Li, Z.; Shi, P.; Jia, L. Exploring ecosystem service dynamics and drivers in the upper and middle Yellow River Basin under large-scale ecological restoration. Ecol. Eng. 2025, 217, 107643. [Google Scholar] [CrossRef] [Scilit]
- Gao, J.; Li, F.; Gao, H.; Zhou, C.; Zhang, X. The impact of land-use change on water-related ecosystem services: A study of the Guishui River Basin, Beijing, China. J. Clean. Prod. 2017, 163, S148–S155. [Google Scholar] [CrossRef] [Scilit]
- Wang, J.F.; Li, X.H.; Christakos, G.; Liao, Y.L.; Zhang, T.; Gu, X.; Zheng, X.Y. Geographical Detectors-Based Health Risk Assessment and its Application in the Neural Tube Defects Study of the Heshun Region, China. Int. J. Geogr. Inf. Sci. 2010, 24, 107–127. [Google Scholar] [CrossRef] [Scilit]
- Zhou, H.; Shen, Q.; Qian, S.; Gulayozov, M.; Li, J.; Zhu, C. The Spatiotemporal Patterns and Driving Mechanisms of Cultivated Land Conversion to Non-Agricultural Uses in Jiangsu Province, China. Land 2025, 14, 2347. [Google Scholar] [CrossRef] [Scilit]
- Zheng, X.; Zhu, M.; Shi, Y.; Pei, H.; Nie, W.; Nan, X.; Zhu, X.; Yang, G.; Bao, Z. Equity Analysis of the Green Space Allocation in China’s Eight Urban Agglomerations Based on the Theil Index and GeoDetector. Land 2023, 12, 795. [Google Scholar] [CrossRef] [Scilit]
- Zhang, M.; Ning, L.; Li, J.; Wang, Y. Study on Spatial Pattern Changes and Driving Factors of Land Use/Cover in Coastal Areas of Eastern China from 2000 to 2022: A Case Study of Jiangsu Province. Land 2025, 14, 2031. [Google Scholar] [CrossRef] [Scilit]
- Liu, Q.; Fu, L.; Xiong, J.; Liu, J.; Shen, G.; Yong, Z.; Xu, Y.; Jia, Q.; Li, Q. Enhancing flash flood susceptibility modeling using the optimal parameter geographical detector (OPGD) method. Adv. Space Res. 2025, 76, 4838–4857. [Google Scholar] [CrossRef] [Scilit]
- Zhao, H.; Gai, Y.; Wang, F.; Cui, L.; Du, Y.; Wang, H.; Tang, L.; Yang, H. Investigation into the supply-demand relationship of carbon sequestration in the yellow river basin using the optimal parameter geographical detector model. Sci. Rep. 2025, 15, 29079. [Google Scholar] [CrossRef] [Scilit]
- Laingen, C.R. Creating a Dynamic Regional Model of the U.S. Corn Belt. Int. J. Appl. Geospat. Res. 2017, 8, 19–29. [Google Scholar] [CrossRef] [Scilit]
- Frimpong, S.; Frimpong, H.; Owusu, A.B.; Boateng, I.D.; Adjei, B. Livelihood Changes, Spatial Anticontagion Policy Effects, and Structural Resilience of National Food Systems in a Sub-Saharan African Country Context: A Panel Machine Learning Approach. Soc. Sci. 2023, 12, 618. [Google Scholar] [CrossRef] [Scilit]
- Hemerijckx, L.-M.; De Vos, K.; Kaunda, J.O.; Van Rompaey, A. Future scenarios for urban agriculture and food security in sub-Saharan Africa: Modelling the urban land-food system in an agent-based approach. Comput. Environ. Urban Syst. 2025, 118, 102258. [Google Scholar] [CrossRef] [Scilit]
- Choithani, C.; Jaleel Cp, A.; Rajan, S.I. Rural-urban transition and food security in India. Glob. Food Secur. 2024, 42, 100780. [Google Scholar] [CrossRef] [Scilit]
- Manderbach, J.; Tanzer, M.; Breitmeier, H.; Schwindenhammer, S. Sustainable urban food system policies as a new realm for transnational city networks. Int. J. Urban Sustain. Dev. 2025, 17, 120–135. [Google Scholar] [CrossRef] [Scilit]
- Lynam, J.; Byerlee, D.; Moock, J.L. The organizational challenge of international agricultural research: The fifty-year odyssey of the CGIAR. Food Policy 2024, 124, 102617. [Google Scholar] [CrossRef] [Scilit]
- Papargyropoulou, E.; Bridge, G.; Woodcock, S.; Strachan, E.; Rowlands, J.; Boniface, E. Impact of food hubs on food security and sustainability: Food hubs perspectives from Leeds, UK. Food Policy 2024, 128, 102705. [Google Scholar] [CrossRef] [Scilit]

Disclaimer/Publisher’s Note: The statements, opinions and data contained in all publications are solely those of the individual author(s) and contributor(s) and not of MDPI and/or the editor(s). MDPI and/or the editor(s) disclaim responsibility for any injury to people or property resulting from any ideas, methods, instructions or products referred to in the content. |
© 2026 by the authors. Licensee MDPI, Basel, Switzerland. This article is an open access article distributed under the terms and conditions of the Creative Commons Attribution (CC BY) license.