Article

Evolution of Drought, Water Balance and Aridity in Romania Since AD 1901 Assessed from Weather Station Data


1
Institute of Geography, Romanian Academy, 023993 Bucharest, Romania
2
Faculty of Geography and Geology, Alexandru Ioan Cuza University, 700505 Iași, Romania
3
VisualFlow, 020099 Bucharest, Romania
*
Author to whom correspondence should be addressed.
Land 2026, 15(6), 978; https://doi.org/10.3390/land15060978
Submission received: 28 April 2026 / Revised: 30 May 2026 / Accepted: 2 June 2026 / Published: 3 June 2026
(This article belongs to the Section Land, Soil and Water)

Abstract

Drought and related climate features (aridity, water balance) in Romania since 1961 are well documented, but studies spanning longer periods are limited and typically rely on modelled or sparse observational data. This study presents an analysis of drought, water balance and aridity in Romania over 123 years (1901–2023), using monthly data from 156 weather stations included in the RoCliHom dataset. Drought evolution is analyzed using the Standardized Precipitation Index (SPI) and Standardized Precipitation Evapotranspiration Index (SPEI). Aridity is examined with the De Martonne Aridity Index. The non-parametric Mann–Kendall test is used for trend detection, which allows a fair comparison with previous studies on drought and aridity in Romania. Trend magnitude is calculated with Sen’s slope estimator. Our results show a clear increase in evapotranspiration as a sign of climate warming over the country since the beginning of the 20th century. Annual precipitation amount presents no major changes. Water balance has decreased in July and August at 40% and 85% of the locations, respectively. During the growing season, drought has intensified within the last seven, six and five decades, but there are no significant changes over the full period of study in this respect. We found strong negative correlations between SPEI and North Atlantic Oscillation, Northern Annular Mode and Arctic Oscillation teleconnection indices. The evolution over the 123-year period shows that the drought episodes that occurred in recent decades are not without precedent in the long-term climatic context.

1. Introduction

Research on drought represents an important area of inquiry due to its profound impacts on water resources, agriculture, and ecosystems worldwide [1,2]. Over the past decades, the understanding of meteorological drought has evolved from simple precipitation deficits to complex indices incorporating evapotranspiration and temperature effects [3,4]. This evolution reflects the increasing recognition of drought as a multifaceted phenomenon with significant socio-economic and environmental consequences [5,6]. For instance, droughts have been linked to 85% of natural disasters globally and cause substantial agricultural losses, emphasizing the need for accurate characterization and monitoring [5]. Increases in the frequency and intensity of drought were demonstrated in many regions, including Asia, Africa, and Europe, underscoring their growing significance under climate change [7,8].
Meteorological drought is commonly defined as an extended period of deficient precipitation relative to normal conditions, leading to water scarcity [3,5]. Despite extensive research, some knowledge gaps persist regarding the spatiotemporal variability and propagation characteristics of meteorological drought across diverse climatic and geographic contexts [9,10]. Indices like the Standardized Precipitation Index (SPI) [11] and the Standardized Precipitation Evapotranspiration Index (SPEI) are broadly used, the latter being considered more suitable because of the sensitivity to temperature and evapotranspiration effects [12]. Moreover, the linkage between meteorological drought and subsequent hydrological or agricultural droughts is not fully understood, complicating early warning and risk management [13,14]. These gaps hinder the elaboration of comprehensive strategies for drought mitigation, particularly in areas that are sensitive to climate variability [15,16].
Romania is the largest country in southeastern Europe, with an area of 238,391 km2, and with elevation ranging from 0 to 2544 m.a.s.l. [17]. The mountainous (Carpathians), highlands, and lowland regions are fairly equally distributed over the country. The country features a temperate-continental climate characterized by four distinct seasons (hot summers, cold winters, and moderate springs and autumns), and with multiple climatic influences: oceanic in the West, semi-arid in the East, Mediterranean in the South-West, and Pontic in the southeastern region closed to the Black Sea. Previous climatic studies found a consistent warming signal over the entire country in summer and spring [18,19], with hot thermal extremes also showing increasing trends [20], which led to an accelerated decrease in snow depth [21,22]. Increasing frequencies of rain showers since 1961 were also demonstrated [23,24]. Clearly, these changes had affected the agricultural [25,26,27] and forest ecosystems [28,29], the natural streamflow variability [30], as well as the human biometeorological comfort during heat and cold waves [31,32].
In this context, analyzing the evolution of these phenomena using an observational dataset spanning over more than a century is essential for assessing climate-related risks. The socio-economic profile of Romania provides an additional and compelling justification for such analyses, offering insights into the high level of vulnerability to hydroclimatic variability, with direct implications for population health. At the same time, these changes affect key economic sectors, particularly agriculture: the utilized agricultural area in Romania covers ≈57% of the territory (according to the Romanian Ministry of Agriculture and Rural development), placing the country among those with the largest agricultural resources in Europe, and highlighting its significant socio-economic importance. The cumulative impacts on health and the economy, water resources, and ecosystems highlight the need for such analyses to better understand and respond to these changes.
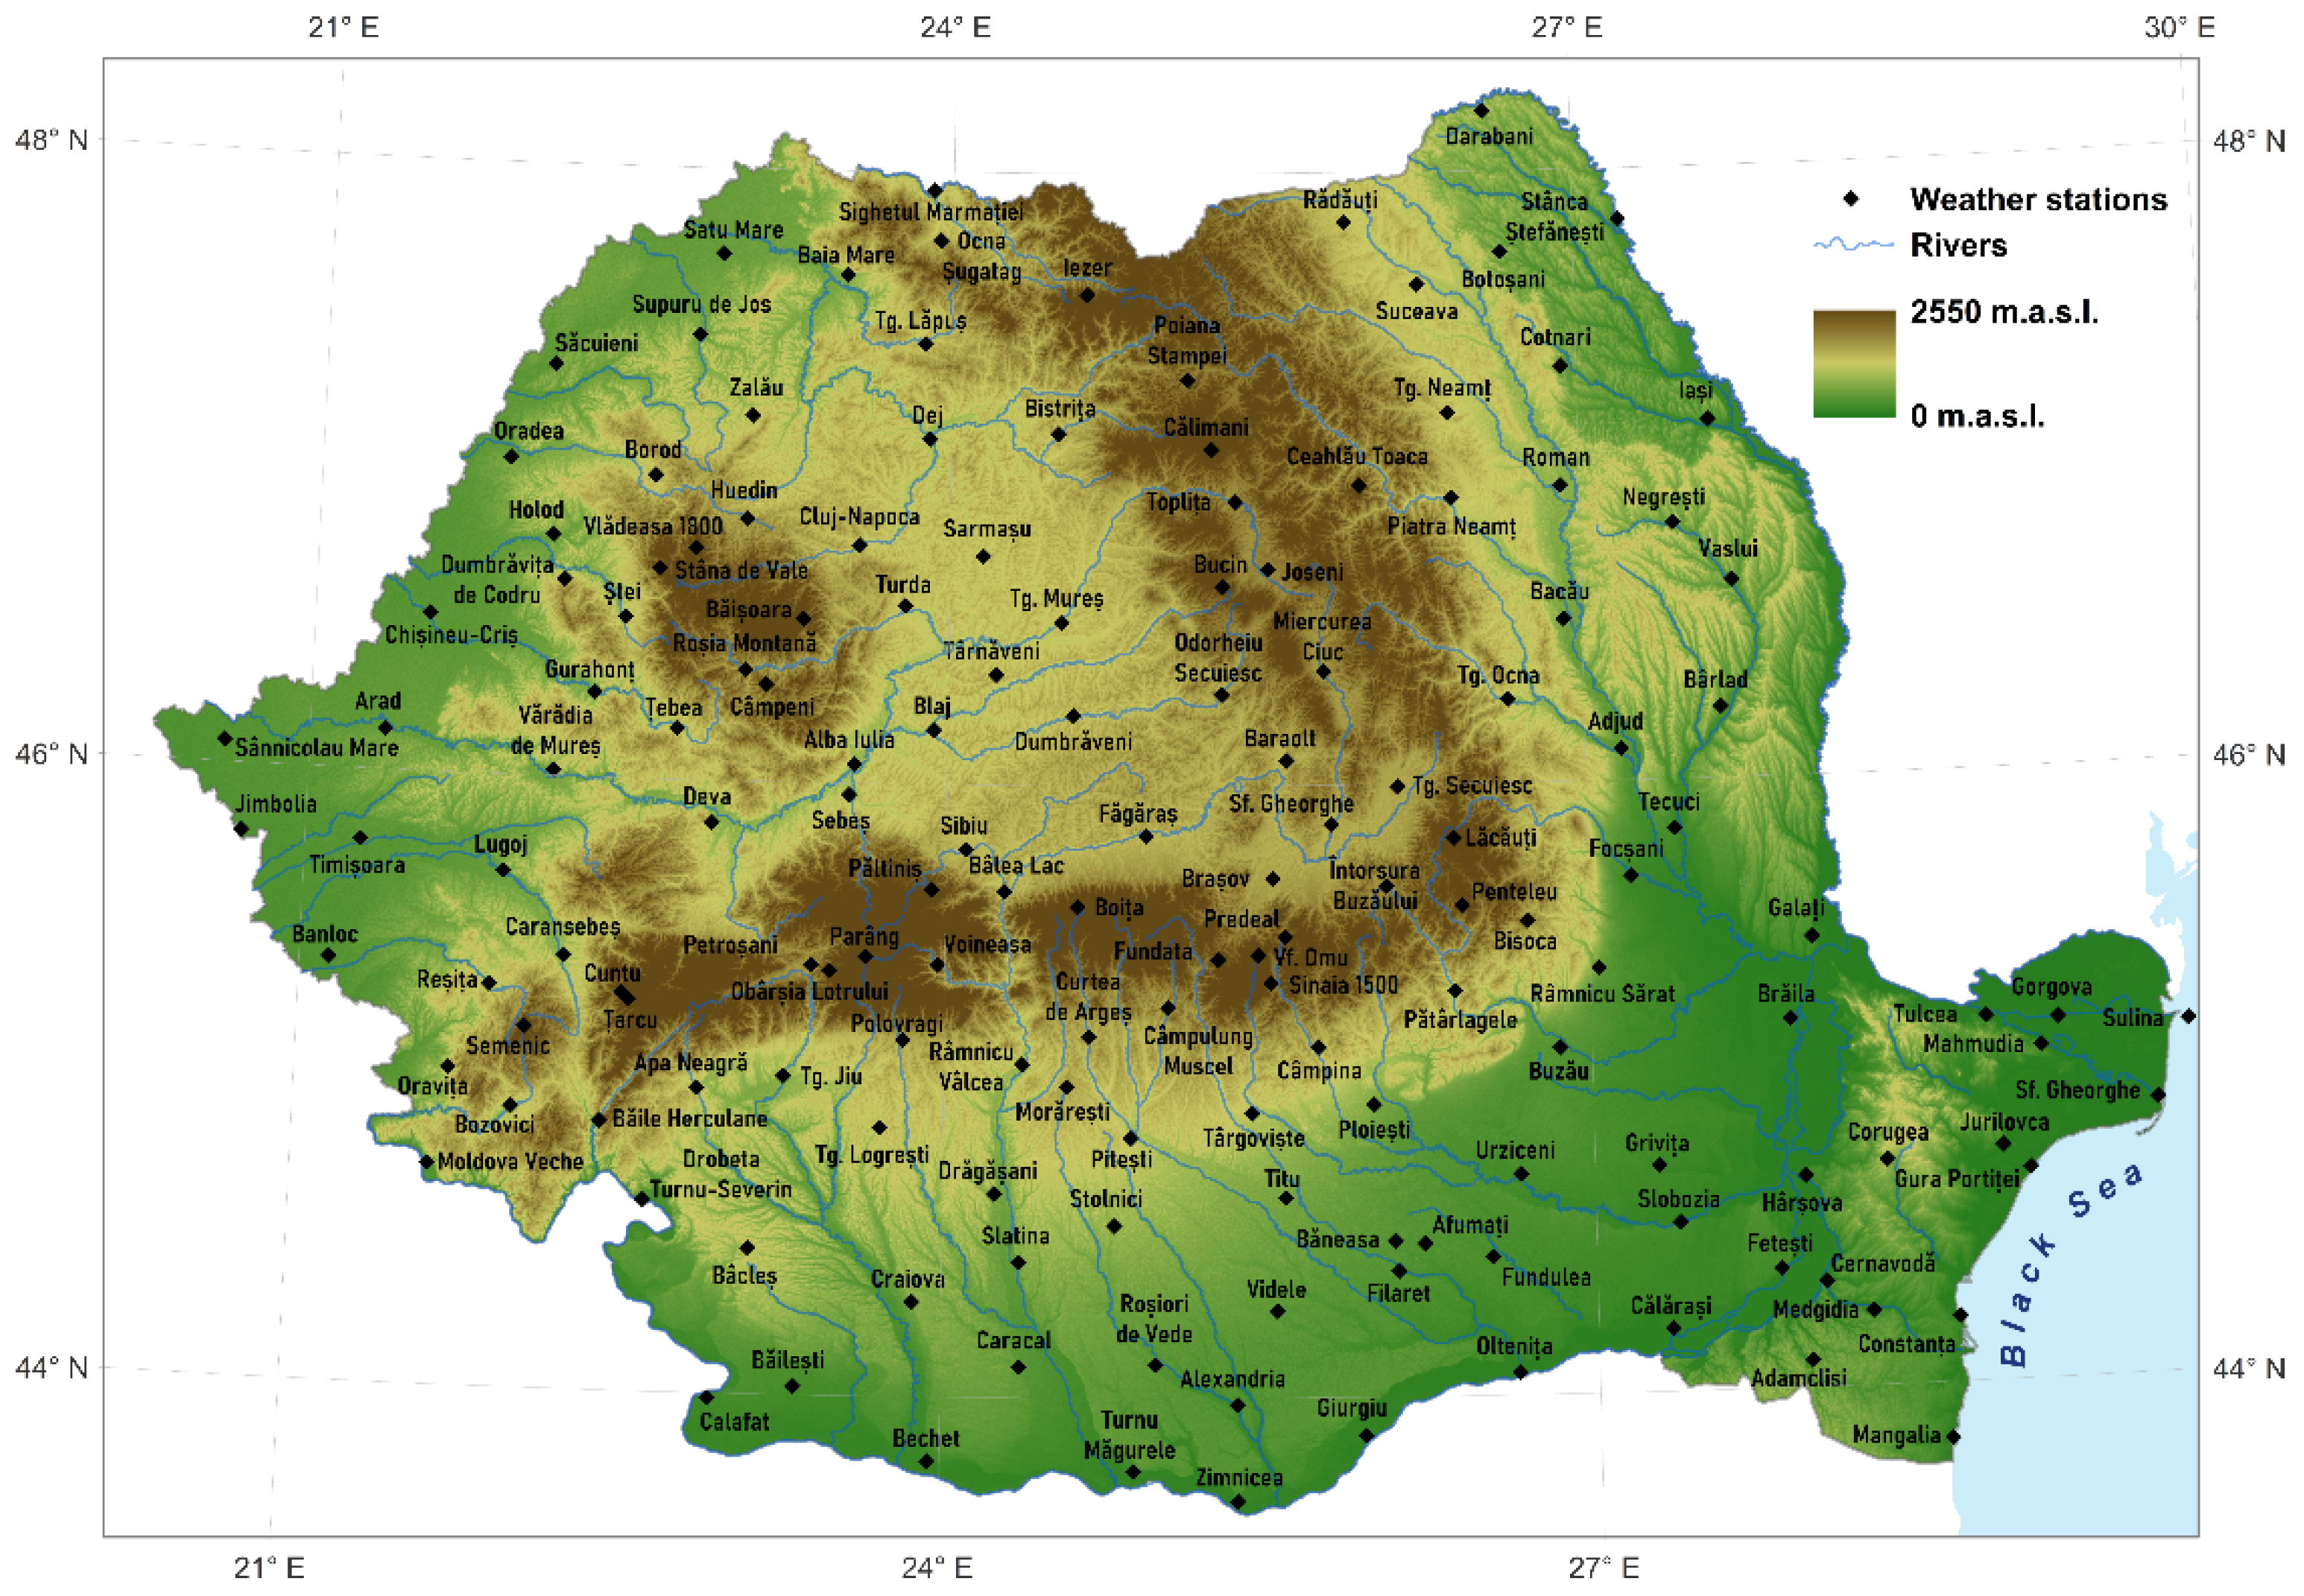
This paper presents a long-term analysis of drought, aridity and water balance in Romania over a period of 123 years (1901–2023), using high quality data from 156 meteorological stations evenly distributed across the country—both spatially and elevation-wise (Figure 1). While drought assessment in Romania is well documented since the 1960s, studies covering longer periods are few, using either modelled/proxy data, or sparse observations.

2. Materials and Methods

2.1. Climatological Data and Indices

RoCliHom (Romanian Climate Homogenized Dataset) [33,34] is a station-based, homogenized dataset that contains monthly time series of precipitation and (mean, minimum and maximum) air temperature over Romania, covering the period 1901–2023. The homogenization of the dataset includes quality control and breakpoint detection to eliminate the non-climatic biases. Historical inconsistencies related to changes in measurement instruments, methodology, personnel of the weather stations or station relocations were also addressed. However, within the 1901–2023 period, the national meteorological network has been subjected to several changes: there were two significant declines in the number of stations during the two world wars (especially during the first one); from the end of World War 2 until 1960, there was a fast increase in the number of weather stations; other changes concern the implementation of the World Meteorological Organization’s new measurement standards in 1961, and the introduction of automatic measurements in 2001–2003. Therefore, as also stated by the authors, the gap-free, homogenized dataset might still contain undetected errors or some inhomogeneities—despite the state-of-the-art homogenization procedure [33].
The analysis was conducted over the entire period of data availability (1901–2023).
The following parameters were tested for trends:
  • Monthly precipitation amount;
  • Monthly mean air temperature;
  • Standardized Precipitation Index (SPI) during the growing season (Apr–Sep);
  • Standardized Precipitation Evapotranspiration Index (SPEI) during the growing season (Apr–Sep);
  • De Martonne Aridity Index (IDM), at annual scale;
  • Potential evapotranspiration (PET), using the Hargreaves–Samani formula [35], on a monthly basis; this formula computes PET using precipitation and minimum and maximum air temperature data, without taking into account the wind contribution to PET.
  • Monthly water balance, defined here as the difference between the precipitation amount and PET—at a monthly scale.
Formulated in 1993 by McKee et al. [36], SPI is a dimensionless statistical indicator—based entirely on precipitation—used to characterize meteorological drought. Its computation consists of the following steps: the data values are fitted on a probability distribution function (PDF); the results are then used to find the cumulative probability of a precipitation event; lastly, the cumulative probability distribution is converted into a standard normal distribution, with mean 0 and variance 1, which represents the value of SPI. Here, we analyzed the 6-month SPI values over the interval April–September, based on the gamma PDF:
g ( x ) = 1 β α Γ ( α ) x a 1 e x / β
where α > 0 represents a shape parameter, β > 0 is a parameter of scale, Γ denotes the gamma function, and x > 0 is the cumulated precipitation amount over the period of interest (e.g., 6 months).
SPEI was introduced in 2010 by Vicente-Serrano et al. [37], and also considers the effect of temperature on drought conditions—an important aspect in the context of climate change. The computation of SPEI is based on the original SPI, but the index uses the difference between precipitation and PET for a given time interval (instead of using only precipitation as an input). This leads to a simple climatic representation of the water balance, computed at different time scales to obtain SPEI.
Developed by geographer Emmanuel de Martonne in 1926, IDM assesses how dry or wet a climate is by evaluating the relationship between precipitation and temperature. It is computed using the following formula:
I D M = P T + 10
where P is the mean annual precipitation in (mm), and T is the mean annual air temperature (°C).

2.2. Teleconnection Indices

To examine possible linkages with large-scale atmospheric circulation, we used the following teleconnection indices:
  • North Atlantic Oscillation (NAO) Index, station-based, as defined by Hurrel [38] at annual scale, retrieved from https://climatedataguide.ucar.edu.
  • Northern Annular Mode (NAM) Index. Hurrell’s wintertime SLP-based NAM is defined as the first EOF of winter SLP over the 20–90° N domain [39]. It explains 23% of the extended winter (December–March) mean variance, being dominated by the NAO structure in the Atlantic region. Positive values are associated with lower-than-average sea level pressures over the Arctic. NAM has a zonally symmetric pattern. Retrieved from https://climatedataguide.ucar.edu.
  • East Atlantic (EA) pattern [40], which is the second prominent mode of low-frequency variability over the North Atlantic. EA appears as a leading mode in all months, and its pattern consists of a North–South dipole of anomaly centres crossing the North Atlantic from East to West. It has a similar structure to the NAO. Retrieved from https://www.cpc.ncep.noaa.gov.
  • East Atlantic/West Russia (EAWR) Index, retrieved from https://www.cpc.ncep.noaa.gov. EAWR (also known as Eurasia-2) [40] consists of four main anomaly centres, and is one of the three prominent teleconnection patterns affecting Eurasia throughout the year.
  • Arctic Oscillation (AO), retrieved from https://www.cpc.ncep.noaa.gov. It is the dominant mode of variability in the Northern Hemisphere [41]. The index is obtained by projecting the AO loading pattern to the daily anomaly 1000 mb height field over the 20–90° N latitude range.
  • The Scandinavia pattern (SCA), retrieved from https://www.cpc.ncep.noaa.gov. SCA, which is also known as the Eurasia-1 pattern) [40] comprises a primary circulation centre over Scandinavia, and weaker centres of opposite sign over western Europe and eastern Russia/western Mongolia. In its positive phase, SCA is related to below-average temperatures across central Russia and western Europe, with below-average precipitation across Scandinavia, and with above-average precipitation across central and southern Europe.
  • Atlantic Multidecadal Oscillation (AMO) Index, smoothed, based upon the average anomalies of sea surface temperatures (SST) in the North Atlantic basin, in this case over the 0–70° N latitude domain. The index is a coherent mode of natural variability occurring in the North Atlantic Ocean with an estimated period of 60–80 years [42]. Retrieved from https://psl.noaa.gov.
  • Polar-Eurasia (POL) pattern, defined by fluctuations in the strength of the circumpolar vortex and typically features two to three main pressure anomaly centres. POL is a recurring pattern linking Arctic atmospheric circulation to weather across Eurasia. It is retrieved from https://www.cpc.ncep.noaa.gov.

2.3. Trend Analysis and Correlation

The statistical significance of trends was evaluated with the Mann–Kendall (MK) test, which is a nonparametric, rank-based procedure appropriate for non-normally distributed data, for time series containing outliers and for non-linear trends [43,44], widely applied on climatological, hydrological and environmental time series. The null and alternative hypotheses for a trend in the random variable x are:
H 0 : Pr x j > x i = 0.5 ,   j > i                                             H A : Pr x j < x i 0.5 ,   t w o s i d e d   t e s t
The test statistic S is computed as:
S = k = 1 n 1 j = k + 1 n s g n ( x j x k )
where xj and xk represent the data values in years j and k, respectively, with j > k; n denotes the total number of years; sgn() is the sign function, defined as:
s g n x j x k =       1 ,   if   x j x k > 0       0 ,   if   x j x k = 0 1 ,   if   x j x k < 0
For large values of n, the distribution of S is reasonably approximated by a normal distribution with mean 0 and standard deviation σ S :
σ S = n n 1 2 n + 5 i = 1 m t i ( i ) ( i 1 ) ( 2 i + 5 ) 18
The standard deviation of S from Equation (6) includes a correction for tied values (i.e., observations that have the same value), ti denoting the number of ties of extent i. Then, the standard normal variate ZS is used for hypothesis testing.
Z S = S 1 σ S ,   if   S > 0 0                   ,   if   S = 0 S 1 σ S ,   if   S < 0
The null hypothesis is rejected at significance level α if |Z| > Zα/2 (two-tail test), where Zα/2 is the value of the standard normal distribution with a probability of exceedance α/2. In this study, the significance level (two-tailed test) was fixed at 10%.
Trend magnitude was computed using the Theil–Sen slope estimator (also called the Kendall–Theil robust line), a robust, nonparametric method for estimating linear trends, which is not sensitive to outliers [45]. It requires the computation of slopes between all pairs i of the variable x:
β i = x j x k j k ,   with   j   >   k ;   i   =   1 ,   ,   n ;   j   =   2 ,   ,   n ;   k   =   1 ,   ,   n     1 ;
For n values in the time series x, this will result in N = n(n − 1)/2 values of βi. The slope estimate b is the median of βi, i = 1, …, N.
Linkages with large-scale teleconnection patterns were performed with Spearman’s rho correlation coefficient, a rank-based, nonparametric approach to estimate the monotonic association between two random variables. Spearman’s rho is computed from the difference d between the ranks of independently sorted variables x and y [45]:
ρ = 1 6 i = 1 n d i 2 n ( n 2 1 )
Under the null hypothesis of no correlation between x and y, the distribution of ρ is approximated by a normal distribution with mean μρ and variance:
μ ρ = 0 σ ρ 2 = 1 / ( n 1 )
The random variables x and y are considered correlated at the significance level α if ρ > Z α / 2 / n 1 for a two-tailed test. In this study, we used the 5% and 1% significance levels, i.e., the p-values of 0.05 and 0.01, respectively.

3. Results and Discussion

3.1. Precipitation, Air Temperature, Potential Evapotranspiration and Water Balance

Trend results are summarized in Table 1, and a summary statistic of the magnitude of trends is shown in Table 2.
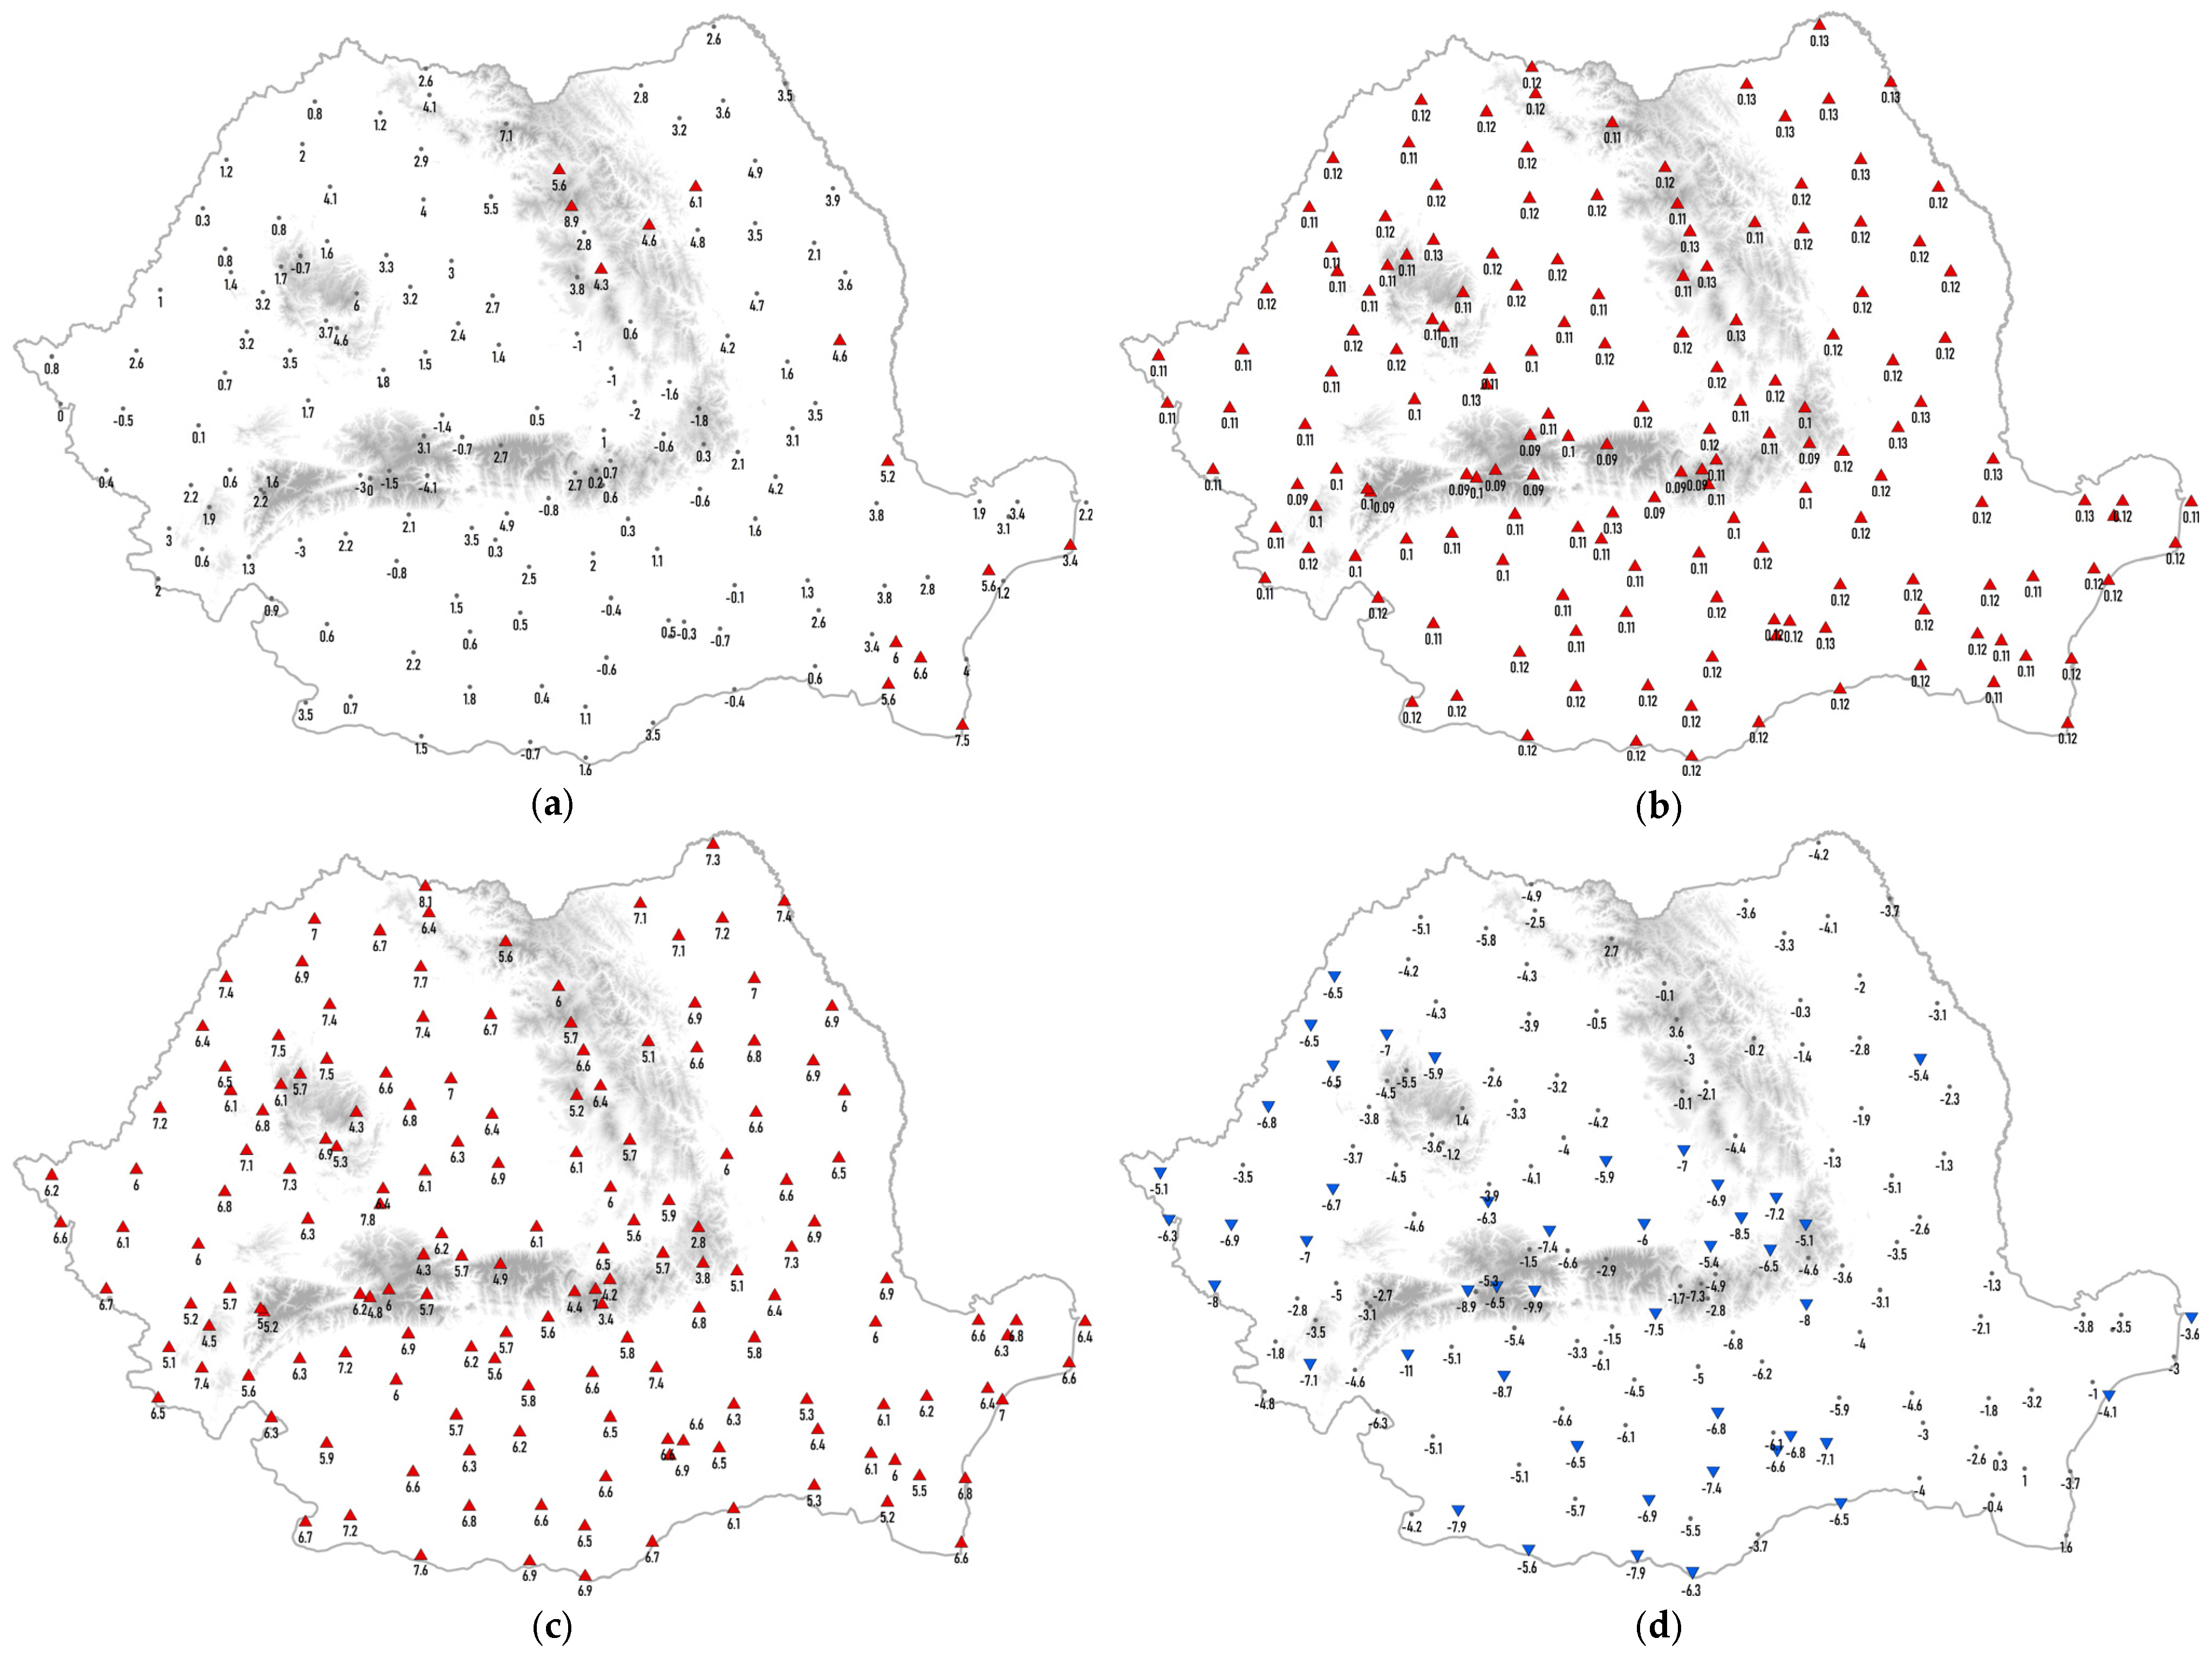
Annual precipitation had slightly increased since 1901 at some stations in northern, eastern and southeastern Romania (Figure 2a). Nevertheless, most of the stations do not present significant trends. Annual air temperature and PET show statistically significant increasing trends at all stations (Figure 2b,c). Water balance presents decreasing trends in about one third of the locations, most of them located in the central, western and southern parts of the country (Figure 2d).
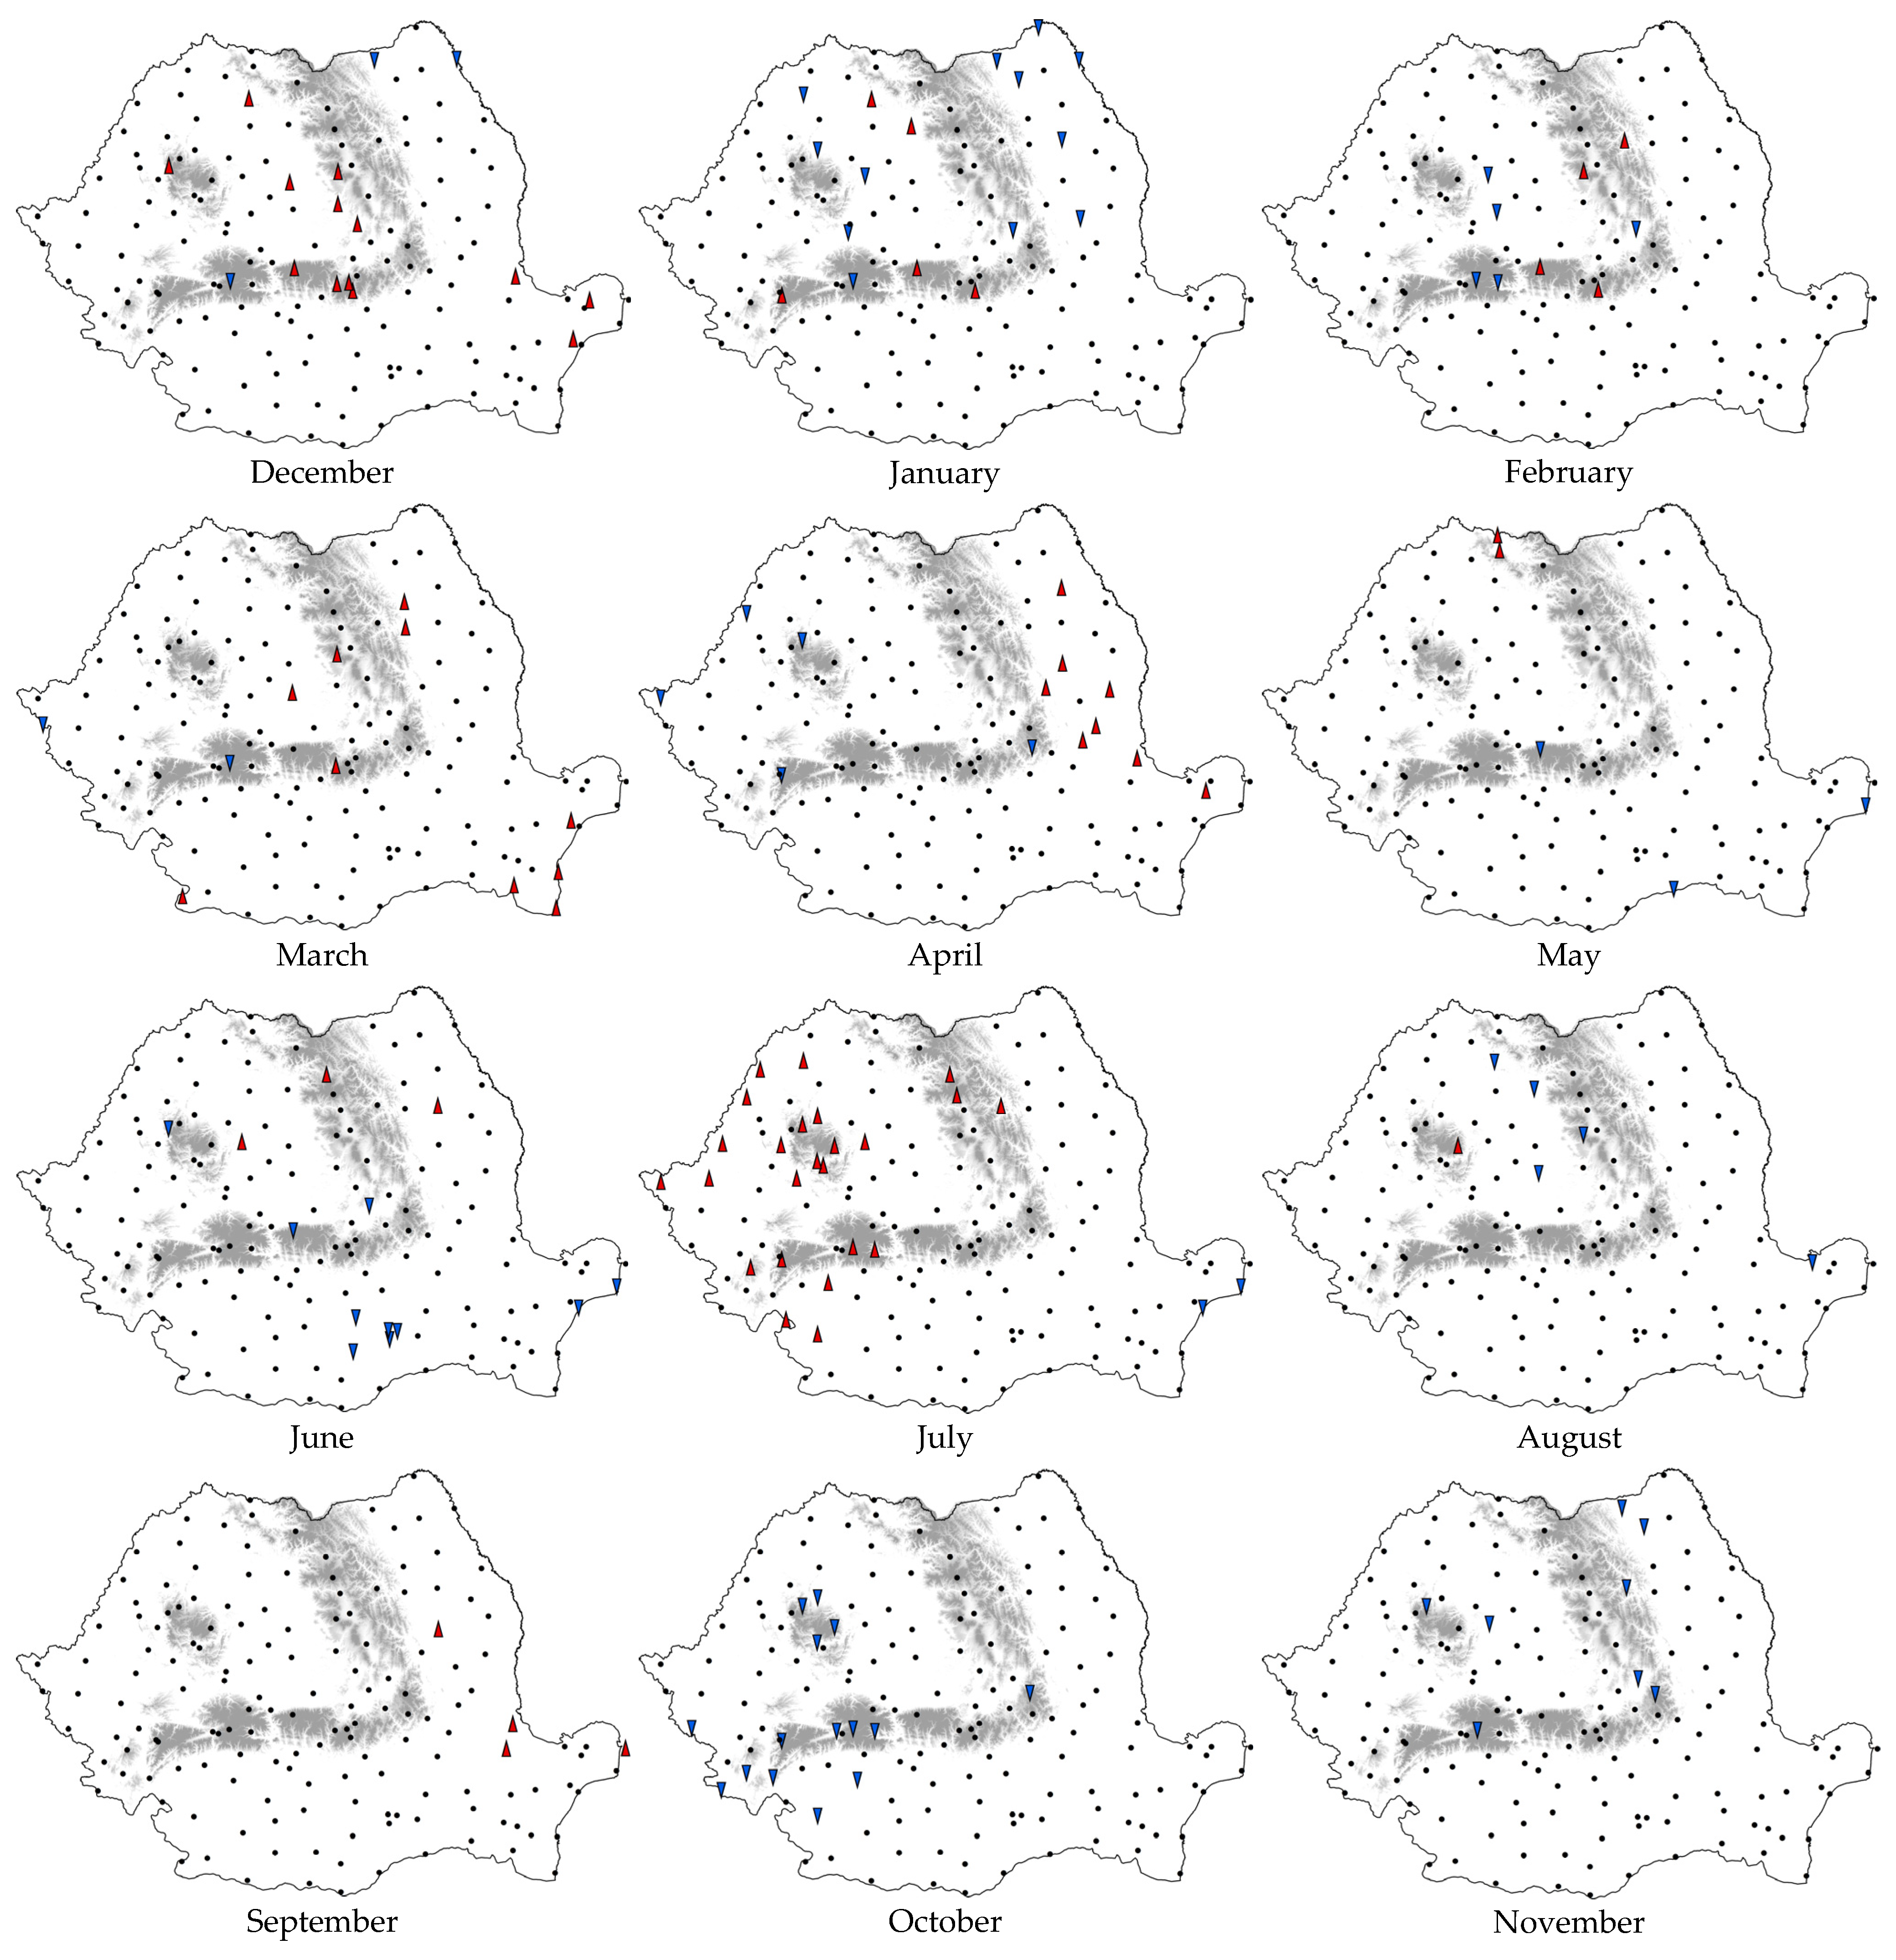
The same stable situation on precipitation trends can be seen in all months (Figure 3). In July, there are increasing trends at some stations in the western part of the Carpathians and in some western lowlands, while in October, an opposite pattern is shown. However, stations presenting no significant trend are predominant in all months.
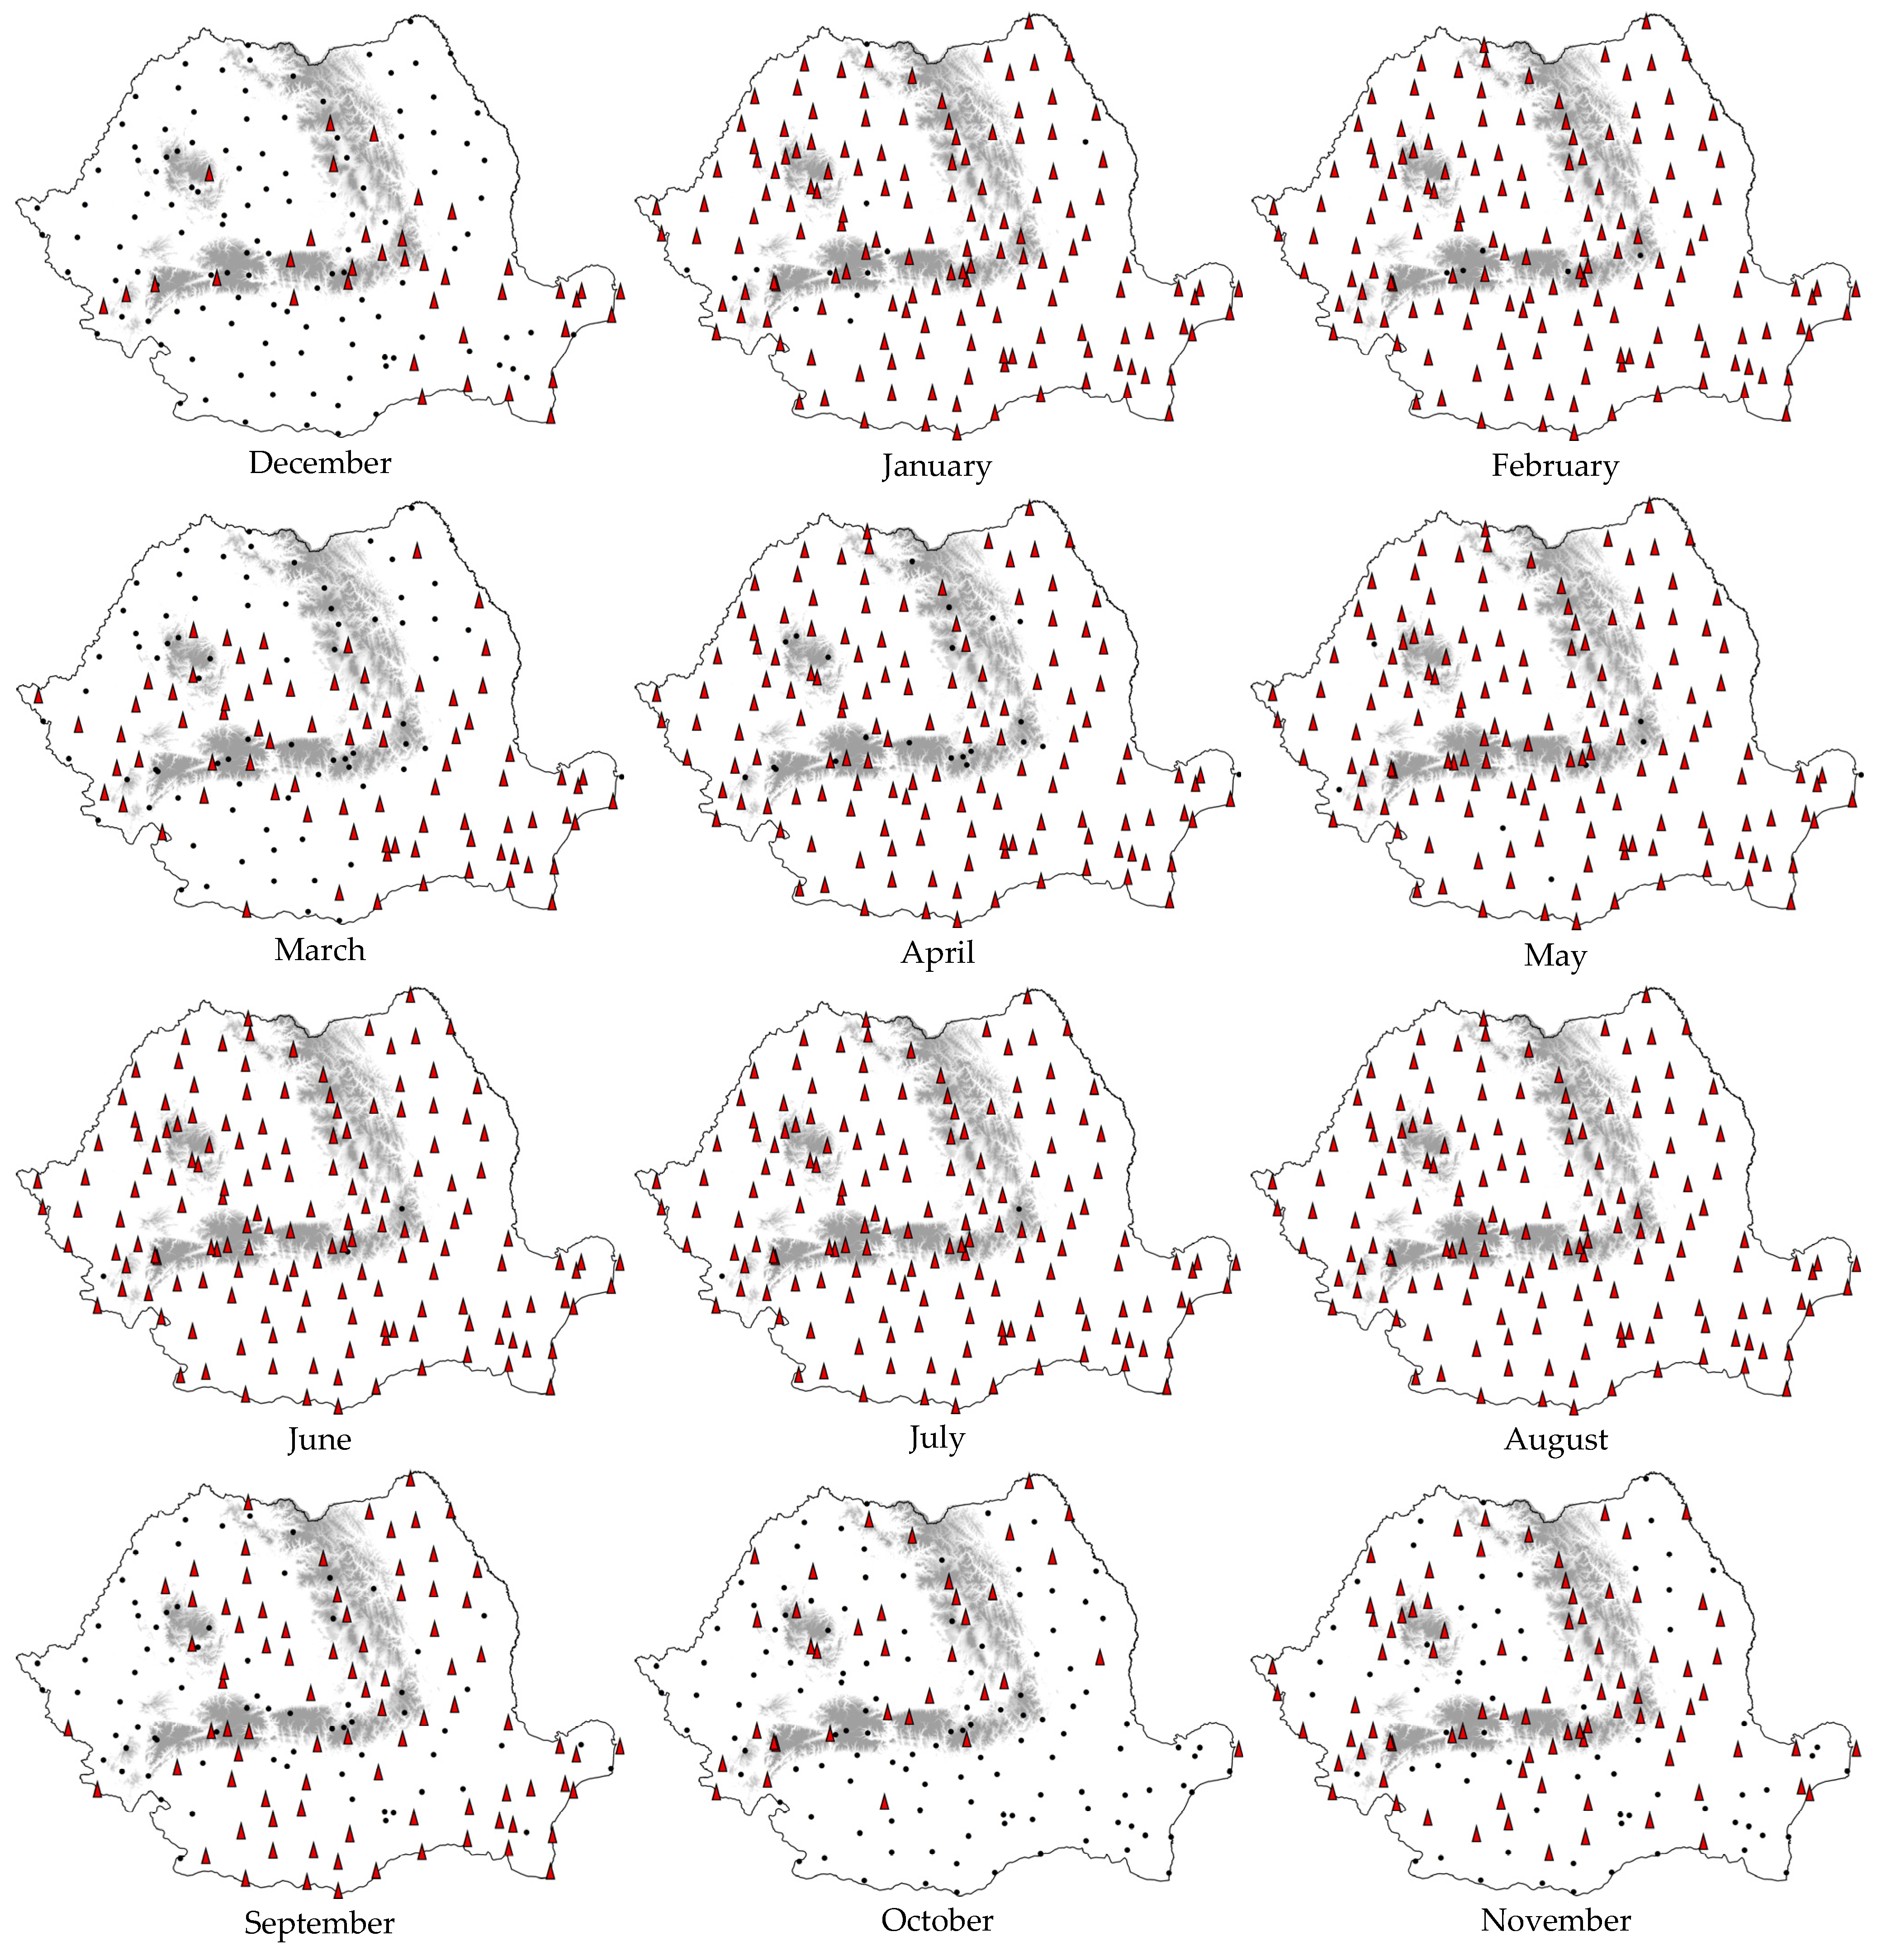
At the monthly scale, increasing temperatures are vastly predominant in January, February, and from mid-spring until the end of summer (April–August) (Figure 4).
PET presents increasing trends in all seasons, in particular in summer and spring (Figure 5). The pattern of trends is similar to the spatial distribution of trends in air temperature in all months except December and January, when almost all stations show no trend. However, these PET increases might be attenuated by the predominant decreases in mean wind speed that were observed over the region [46,47]—since wind speed was not involved in our PET estimation. The results are in fair agreement with other findings from shorter study periods [48]. As in the case of air temperature, all significant trends are upward.
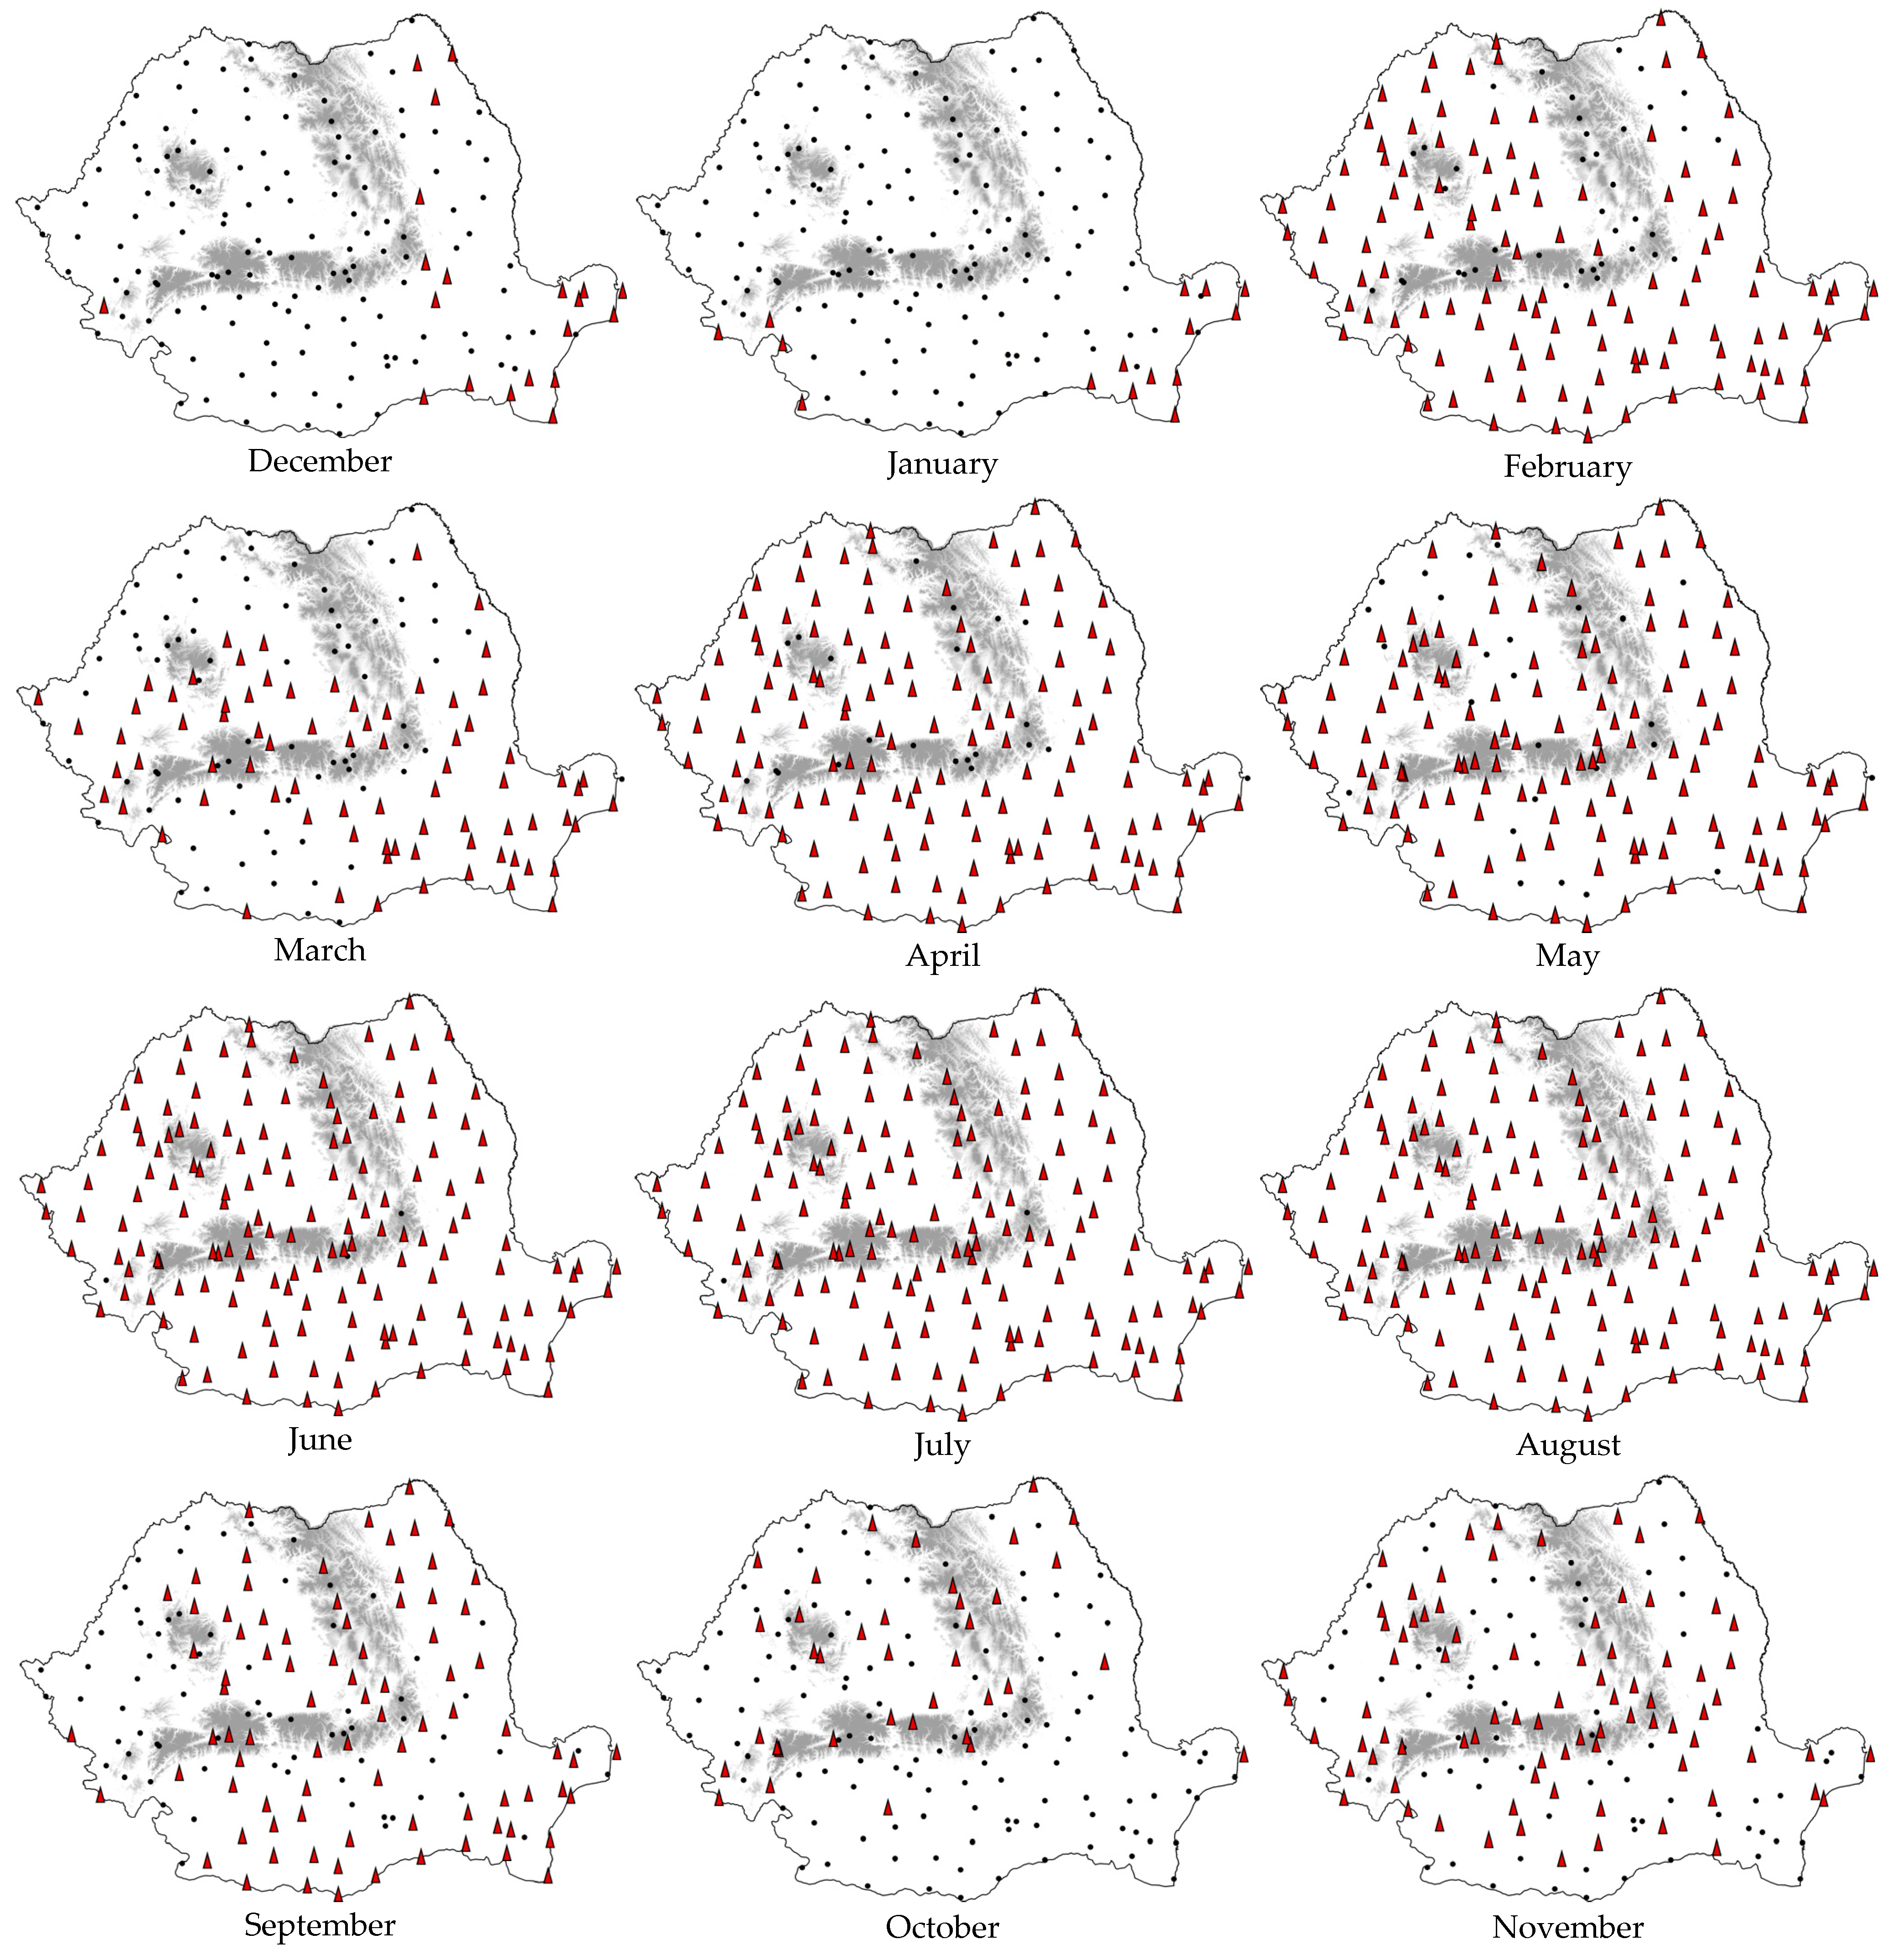
Water balance appears stable in all months except July and August (Figure 6), when 40% and 85% of the stations show statistically significant decreases, respectively. This decline affected the ripening of grapevine (and of other autumn crops), highlighting the effect of rising air temperature on the water balance, with no significant increases in precipitation occurring. Similar results were found in analyses over shorter periods (since 1961), where decreasing trends in summer water balance were primarily due to the increases in evapotranspiration [49].

3.2. Drought (SPEI and SPI) and Aridity

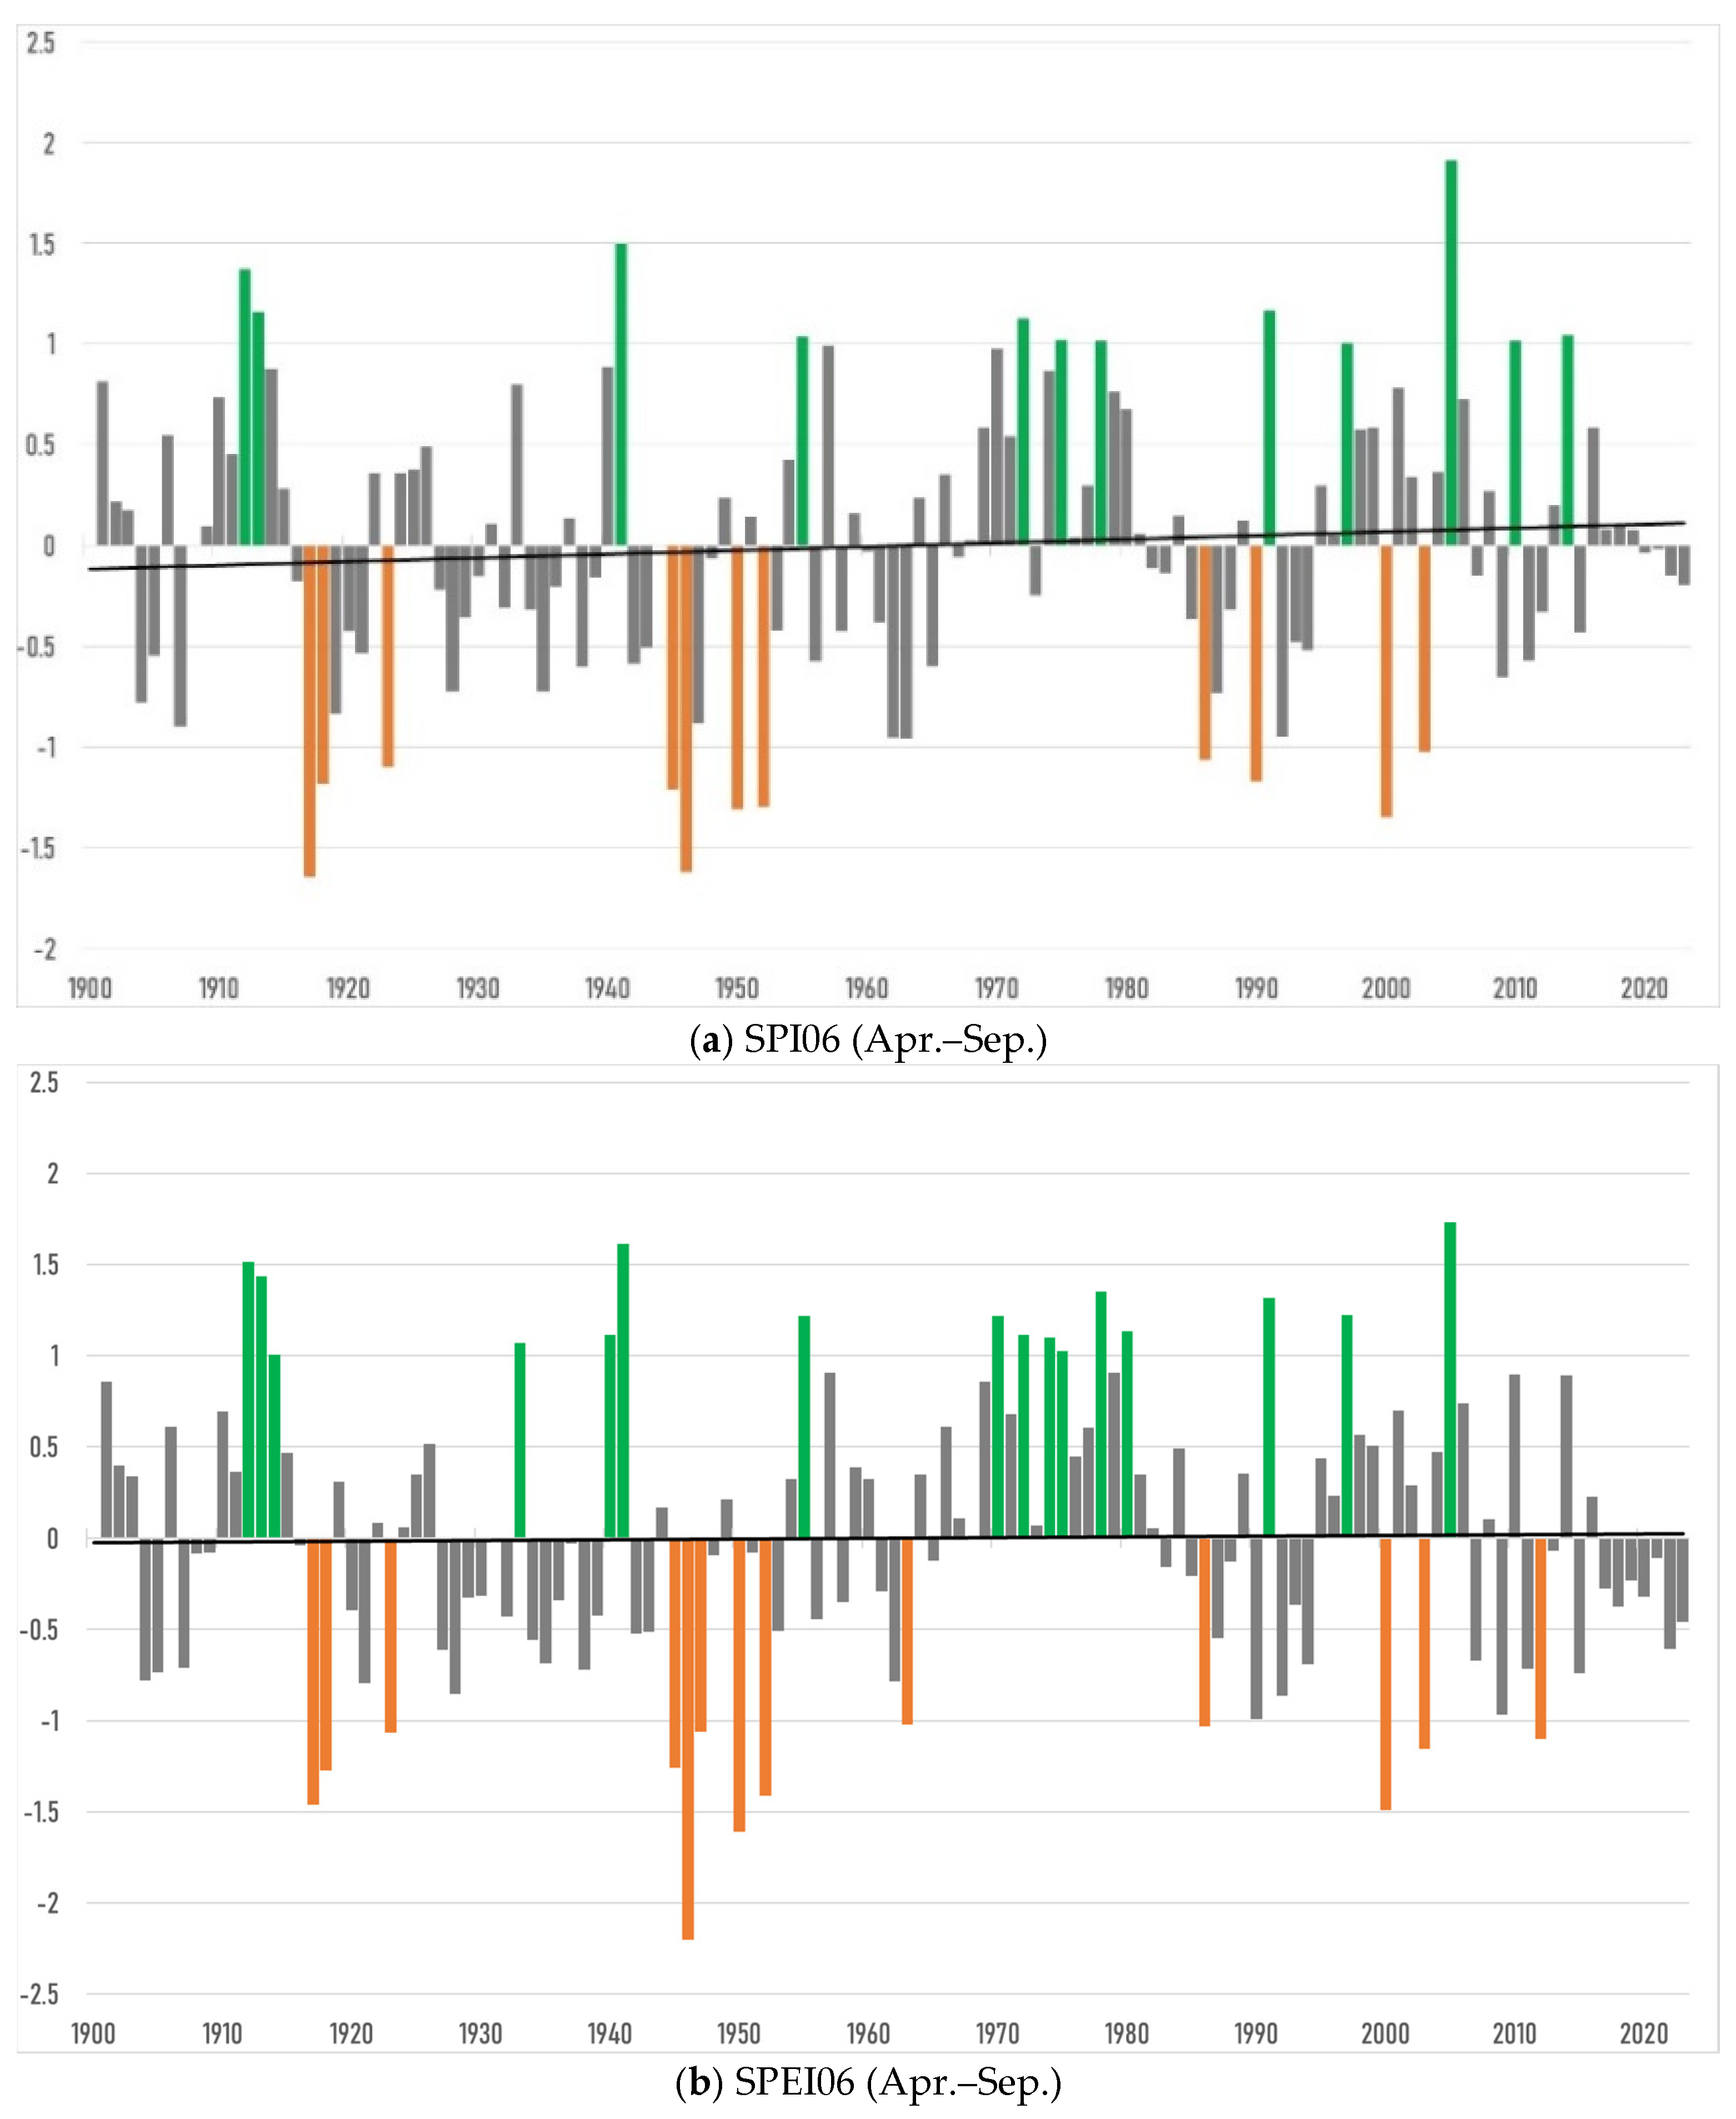
Both drought indices managed to reproduce the country-wide drought chronology (Figure 7), highlighting the major drought episodes during the 1918–1920 and 1947–1948 periods that were confirmed by previous studies (which were done on a considerably smaller number of locations) [50,51].
Also, both indices show that the episodes of drought that occurred within the last 5–7 decades were not unprecedented—as they seemed to be from studies dealing with shorter periods.
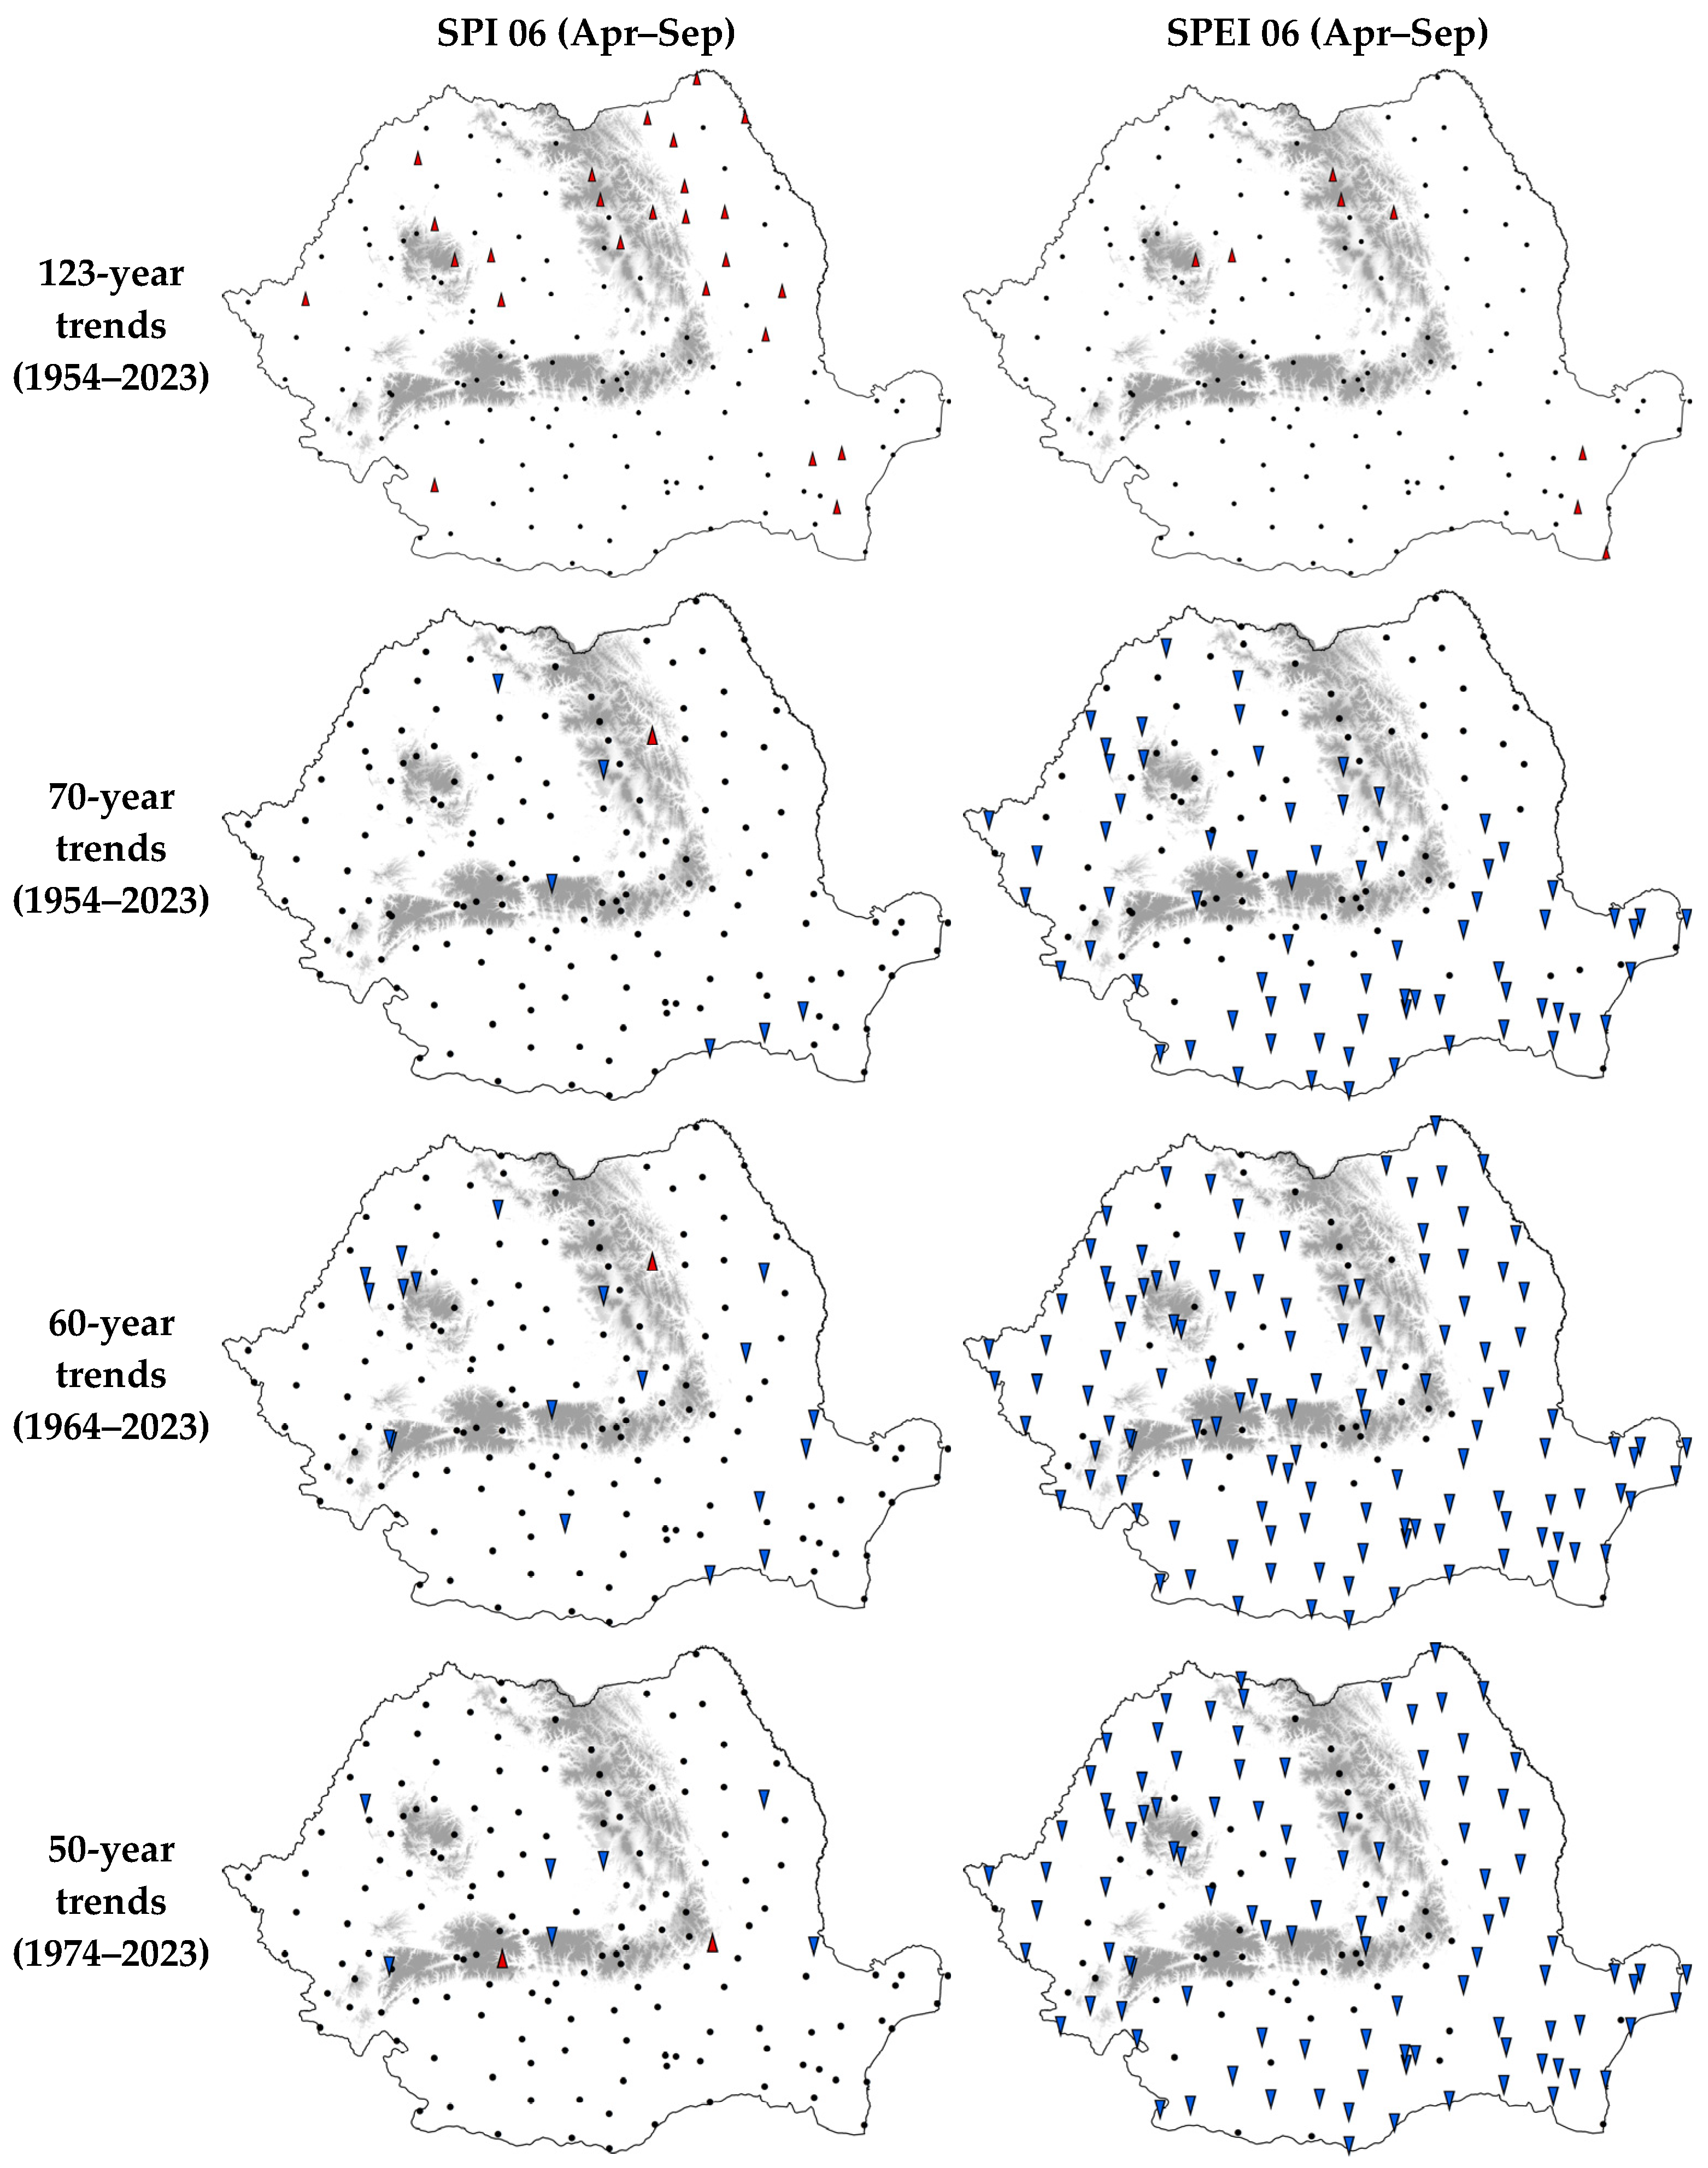
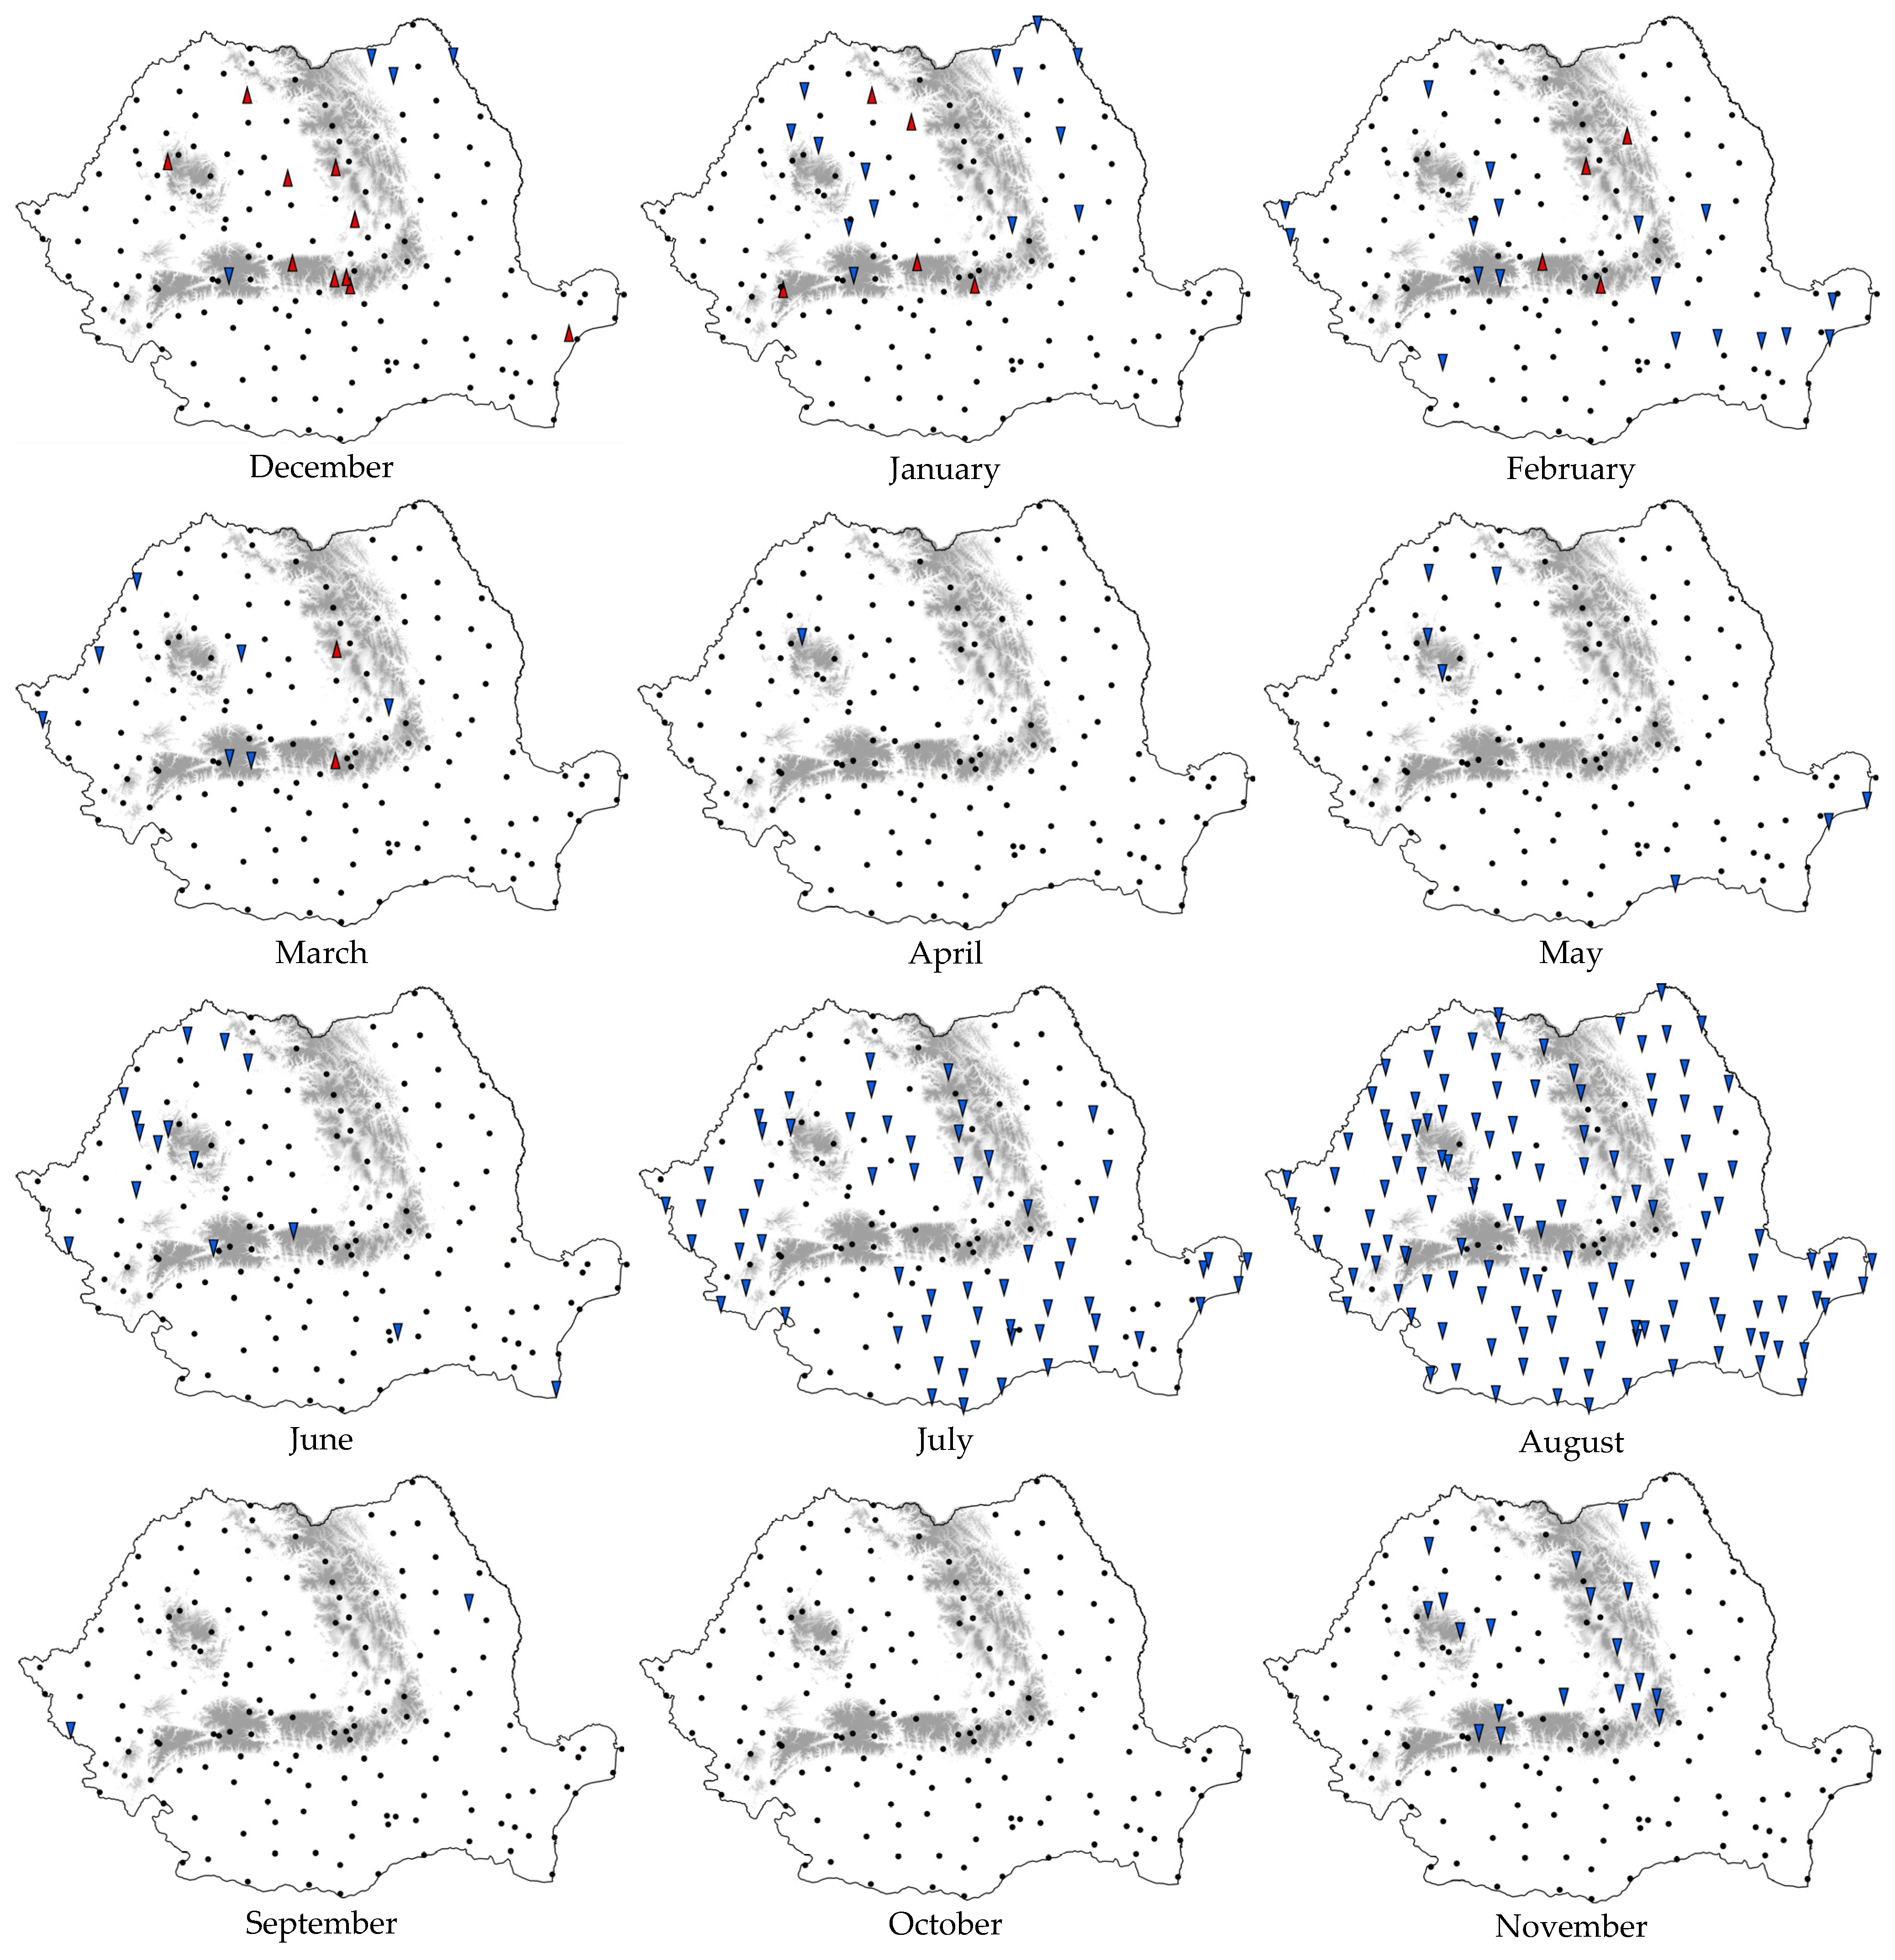
As seen in Figure 8, SPEI managed to capture the drought trends more effectively than SPI, as it also takes into account the evolution of evapotranspiration, which had increased due to the country-wide warming. For the last 70, 60 and 50 years of the study period, SPEI showed an increase in drought during the growing season. The 70-year trend pattern (1954–2023) is in agreement with previous findings over a similar period [52]. Nevertheless, there are almost no significant trends for longer periods (ending in 2023).
The De Martonne Aridity Index presents statistically significant trends at only 9% of the stations, indicating a stable situation over the entire 123-year period.

3.3. Teleconnections

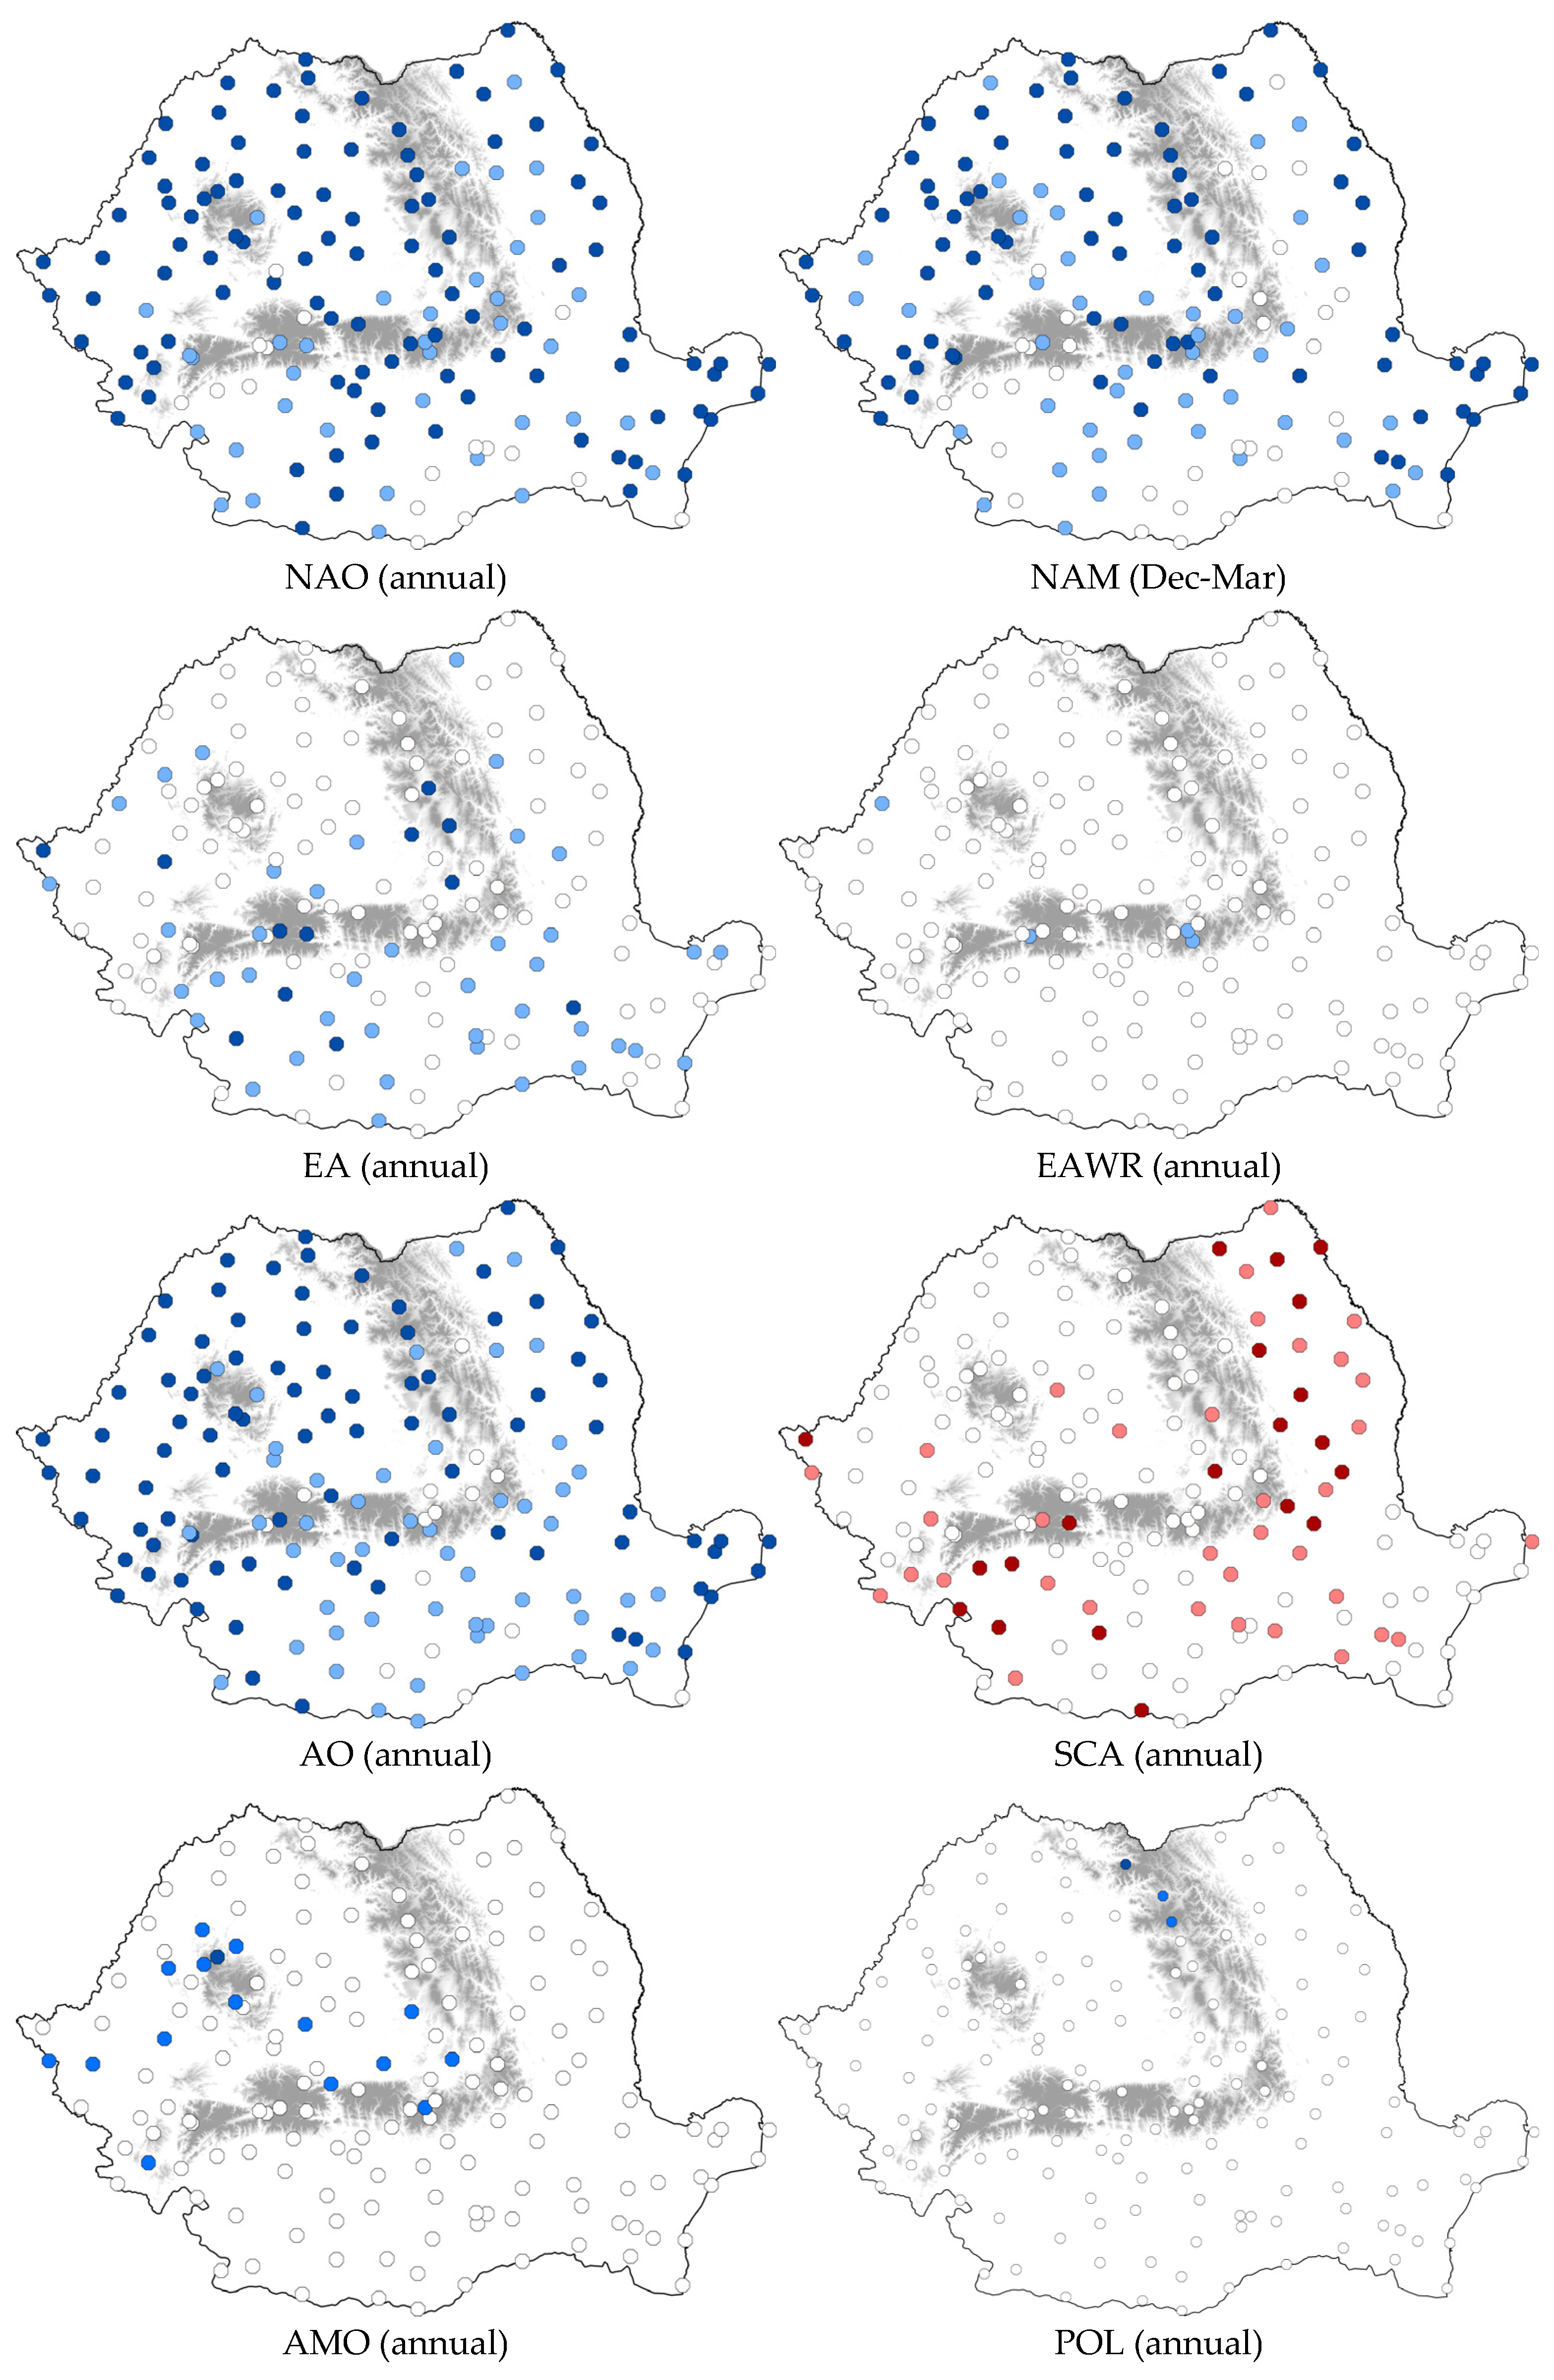
To investigate linkages between annual drought and large-scale atmospheric circulation, we computed Spearman’s rho monotonic correlation coefficient between SPEI and the teleconnection indices. The main results are shown in Figure 9.
The strongest negative correlations were found for NAO, AO and NAM. It is acknowledged that NAO significantly influences drought conditions in Southeast Europe, particularly through the relationship between atmospheric pressure patterns and precipitation variability [53,54,55]. The positive phases of NAO are generally associated with drier conditions in South-East Europe (SEE), due to a northward shift in storm tracks. Conversely, negative phases tend to bring wetter conditions to the region. This finding shows the influence of NAO throughout the entire year, not only during winter. The influence of NAO and AO confirm the previous findings done over the period 1961–2013 by Prăvălie et al. [49], who concluded that the water deficit amplification across Romania is primarily linked to the positive phases of these aforementioned indices, as well as—to a lesser extent—to other teleconnection patterns that affect the European region.
Northern Annular Mode (NAM) and the Arctic Oscillation (AO) are often used interchangeably, since AO is the surface manifestation of NAM. Their influence is most significant during the winter months—like for NAO. Their positive phases are characterized by below-average pressure over the Arctic and higher pressure at mid-latitudes. This strengthens the jet stream, keeping cold air trapped in the north and shifting storm tracks toward Northern Europe. For SEE, this results in reduced precipitation and increased drought risk. During the negative phase, the polar vortex weakens, allowing cold, Arctic air to flow southward and Mediterranean cyclones to move into SEE. Usually, this brings wetter-than-average conditions, which help recharge soil moisture and mitigate drought [56,57,58].
The SCA pattern, which comprises a primary circulation centre over Scandinavia and weaker centres of opposite sign over Western Europe and Central Asia, presents positive correlations at many locations in the extra-Carpathian regions of Romania. These results are justified, as the positive phase of the SCA pattern is associated with a strong anticyclone (high-pressure system) over Scandinavia and Northeastern Europe, while in SEE it usually leads to drier-than-normal autumns and winters, contributing to the onset of meteorological drought [59]. The influence of the NAM, AO and SCA patterns on drought is largely driven by their control over the entry of moisture-rich air masses from the Atlantic and Mediterranean.
AMO shows statistically significant correlations with SPEI at 16 stations (10.3% of total), all of them located in the intra-Carpathian region of the country, while EAWR and POL do not have any influence on SPEI.

4. Conclusions

We presented a 123-year, country-wide trend analysis of drought, water balance and aridity over Romania using monthly data from 156 meteorological stations covering the period 1901–2023, analyzed with robust, nonparametric statistical methods. Our main findings are summarized below:
  • The annual precipitation amount is rather stable, presenting no major changes, this meteorological variable being driven mostly by long-term cycles;
  • There is a consistent, increasing air temperature trend over Romania since 1901 and, consequently, an increase in evapotranspiration;
  • Water balance shows decreasing trends in particular in July and August, when 40% and 85% of the stations present a statistically significant downward signal;
  • SPEI shows an intensification of drought during the growing season within the last 70, 60 and 50 years, respectively;
  • Analyzing long-term data series showed that the episodes of drought that occurred within the last 5–7 decades were not without precedent—as they seemed from studies performed over shorter time intervals;
  • We found strong correlations between the SPEI and, most notably, NAO, NAM, AO and SCA indices, suggesting that these teleconnection indices can be considered major drivers of regional patterns of annual droughts variability in the Southeastern Europe due to their importance in moisture advections and overall precipitation patterns.
The increasing air temperature and evapotranspiration trends, in the absence of significant changes in precipitation, indicates substantial and spatially heterogeneous impacts on agriculture, soils, ecosystems, water resources, and human health, overlapping with preexisting regional and socio-economic disparities. At the European level, such findings are predominantly interpreted through the lens of the agricultural sector.
In Romania, recent studies emphasize declining yields of major field crops such as maize and sunflower under drought conditions, particularly during the growing season when water demand is highest, with the most pronounced vulnerability in the southern and southeastern regions [60]. While field crops are highly sensitive during the growing season, viticulture is particularly affected by water deficits and heat stress during the ripening period, with consequences for both yield and grape quality [61].
In addition, a series of indirect socioeconomic consequences of considerable magnitude can be identified. The lowland regions of southern and eastern Romania are prominently represented in the maps resulting from the analyses, a sensitivity that derives not only from climatic conditions but also from the intensity of agricultural land use. The pre-dominance of small-scale farms and the high share of the population employed in agriculture, particularly in rural areas, provide a more comprehensive explanation for concerns regarding how climate variability contributes to income instability.
Although the direct effects on agriculture are typically the most frequently highlight-ed, the implications for public health are equally important. The aspects analyzed in this study, including rising temperatures and more frequent drought conditions, are associated with increased risk of heat-related stress and other adverse health problems.
All these aspects, when considered in relation to the study’s findings, highlight the need to adopt appropriate measures and to develop effective strategies, in terms of water resource management, modernization of irrigation infrastructure, or long-term agricultural planning, as well as in addressing related public health risks. The results also indicate that these adaptations must be addressed within a regional context, and they could be placed in relation to these aspects in future research, to better understand these processes.

Author Contributions

Conceptualization: M.-V.B.; methodology: M.-V.B.; software: M.-V.B., R.H. and I.-A.N.; validation: D.D., L.S. and P.I.; formal analysis: M.-V.B., D.D., R.H. and I.-A.N.; investigation: M.-V.B. and L.L.; resources: L.L.; data curation: M.-V.B. and D.D.; writing—original draft: M.-V.B., L.L., L.S., P.I. and I.-A.N.; writing—review and editing, M.-V.B.; visualization: M.-V.B. and L.L.; supervision: L.S. All authors have read and agreed to the published version of the manuscript.

Funding

This work was supported by a grant of the Ministry of Research, Innovation and Digitization, CNCS-UEFISCDI, within PNCDI IV; project name: “Changes in climate suitability of Romanian vineyards” (CARVE); project number: PN-IV-P1-PCE-2023-1875.

Data Availability Statement

The Romanian climatological data series used in this study are freely available at https://doi.org/10.5281/zenodo.14880417. Teleconnection indices were downloaded from https://climatedataguide.ucar.edu, https://www.cpc.ncep.noaa.gov and https://psl.noaa.gov. The results of this study are available from the corresponding author, upon reasonable request.

Acknowledgments

We acknowledge the National Center for Atmospheric Research (NCAR) for making available the teleconnection indices and the Climate Data Guide [62]. We also acknowledge Adam Phillips and the NCAR Staff (Eds). for making available the NAM index [39]. Finally, we thank the four anonymous referees for their comments and suggestions, which have considerably improved the original manuscript.

Conflicts of Interest

Author Ion-Andrei Nita was employed by the company VisualFlow. The remaining authors declare that the research was conducted in the absence of any commercial or financial relationships that could be construed as a potential conflict of interest.

References

  1. Zhu, Z.; Duan, W.; Zou, S.; Zeng, Z.; Chen, Y.; Feng, M.; Qin, J.; Liu, Y. Spatiotemporal characteristics of meteorological drought events in 34 major global river basins during 1901–2021. Sci. Total Environ. 2024, 921, 170913. [Google Scholar] [CrossRef] [Scilit]
  2. Mihai, G.; Alexandru, A.M.; Stoica, E.; Birsan, M.V. Intraspecific growth response to drought of Abies alba in the Southeastern Carpathians. Forests 2021, 12, 387. [Google Scholar] [CrossRef] [Scilit]
  3. Dascalu, S.I.; Gothard, M.; Bojariu, R.; Birsan, M.-V.; Cică, R.; Vintilă, R.; Adler, M.-J.; Chendeș, V.; Mic, R.-P. Drought-related variables over the Bârlad basin (Eastern Romania) under climate change scenarios. Catena 2016, 141, 92–99. [Google Scholar] [CrossRef] [Scilit]
  4. Bordi, I.; Sutera, A. Drought assessment in a changing climate. In Climate Variability—Some Aspects, Challenges and Prospects; Hannachi, A., Ed.; InTech: Hong Kong, China, 2012. [Google Scholar] [CrossRef] [Scilit]
  5. Łabędzki, L.; Bąk, B. Meteorological and agricultural drought indices used in drought monitoring in Poland: A review. Meteorol. Hydrol. Water Manag. 2015, 2, 3–14. [Google Scholar] [CrossRef] [Scilit]
  6. Bărbulescu, A.; Dumitriu, C.Ș. Assessing the Changes in Precipitation Patterns and Aridity in the Danube Delta (Romania). J. Mar. Sci. Eng. 2025, 13, 1529. [Google Scholar] [CrossRef] [Scilit]
  7. Wang, D.; Zhang, Q.; Singh, V.P.; Shen, Z.; Wang, G.; Wu, W.; Yuan, R. Amplifying meteorological droughts across middle- and low-latitude northern hemisphere. Front. Earth Sci. 2022, 10, 914232. [Google Scholar] [CrossRef] [Scilit]
  8. Kalbarczyk, R.; Kalbarczyk, E. Research into meteorological drought in Poland during the growing season from 1951 to 2020 using the Standardized Precipitation Index. Agronomy 2022, 12, 2035. [Google Scholar] [CrossRef] [Scilit]
  9. Ionita, M.; Nagavciuc, V. Changes in drought features at the European level over the last 120 years. Nat. Hazards Earth Syst. Sci. 2021, 21, 1685–1701. [Google Scholar] [CrossRef] [Scilit]
  10. Zhou, Z.; Ding, K.; Zhang, L.; She, D.; Chen, J.; Wang, G.; Xia, J. Three-dimensional meteorological drought characteristics and associated risk in China. Environ. Res. Lett. 2023, 18, 124046. [Google Scholar] [CrossRef] [Scilit]
  11. Jaagus, J.; Aasa, A.; Aniskevich, S.; Boincean, B.; Bojariu, R.; Briede, A.; Danilovich, I.; Castro, F.D.; Dumitrescu, A.; Labuda, M.; et al. Long-term changes in drought indices in eastern and central Europe. Int. J. Climatol. 2022, 42, 225–249. [Google Scholar] [CrossRef] [Scilit]
  12. Cheval, S.; Busuioc, A.; Dumitrescu, A.; Birsan, M. Spatiotemporal variability of meteorological drought in Romania using the Standardized Precipitation Index (SPI). Clim. Res. 2014, 60, 235–248. [Google Scholar] [CrossRef] [Scilit]
  13. Yin, Y.; Wang, X.; Zhang, Z.; Ma, X.; Liu, M.; Ullah, I. Characteristics and propagation of meteorological and hydrological droughts in eastern Gansu, a typical semi-arid region, China. Int. J. Climatol. 2023, 43, 5327–5347. [Google Scholar] [CrossRef] [Scilit]
  14. Wong, G.; Lanen, H.V.; Torfs, P. Probabilistic analysis of hydrological drought characteristics using meteorological drought. Hydrol. Sci. J. 2013, 58, 253–270. [Google Scholar] [CrossRef] [Scilit]
  15. Minea, I.; Albulescu, A.C. Drought Over Time: An Investigation of the Impact of Meteorological Drought on Groundwater and Surface Water in the East of Romania. Earth Syst. Environ. 2025, 9, 1959–1981. [Google Scholar] [CrossRef] [Scilit]
  16. Swain, S.; Mishra, S.; Pandey, A. A detailed assessment of meteorological drought characteristics using simplified rainfall index over Narmada river basin, India. Environ. Earth Sci. 2021, 80, 1–15. [Google Scholar] [CrossRef] [Scilit]
  17. Manea, A.; Birsan, M.-V.; Dima, V.; Havriș, L.-E. Comparative Analysis of Land and Air Temperature in Romania since A.D. 1961. Land 2024, 13, 596. [Google Scholar] [CrossRef] [Scilit]
  18. Micu, D.M.; Dumitrescu, A.; Cheval, S.; Nita, I.A.; Birsan, M.V. Temperature changes and elevation-warming relationships in the Carpathian Mountains. Int. J. Climatol. 2021, 41, 2154–2172. [Google Scholar] [CrossRef] [Scilit]
  19. Birsan, M.-V.; Sfîcă, L.; Amihăesei, V.-A.; Nita, I.-A.; Dogaru, D.; Lupu, L. Centennial Trends in Precipitation, Air Temperature, Evapotranspiration and Water Balance over Romania from Observational Data (1924–2023). Rom. J. Phys. 2025, 70, 805. [Google Scholar] [CrossRef] [Scilit]
  20. Birsan, M.V.; Micu, D.M.; Nita, A.I.; Mateescu, E.; Szép, R.; Keresztesi, Á. Spatio-temporal changes in annual temperature extremes over Romania (1961–2013). Rom. J. Phys. 2019, 64, 816. [Google Scholar]
  21. Amihăesei, V.A.; Micu, D.M.; Cheval, S.; Dumitrescu, A.; Sfîcă, L.; Bîrsan, M.V. Changes in snow cover climatology and its elevation dependency over Romania (1961–2020). J. Hydrol. Reg. Stud. 2024, 51, 101637. [Google Scholar] [CrossRef] [Scilit]
  22. Birsan, M.-V.; Nita, I.-A.; Amihăesei, V.-A. Influence of large-scale atmospheric circulation on Romanian snowpack duration. Rom. Rep. Phys. 2024, 76, 708. [Google Scholar] [CrossRef]
  23. Busuioc, A.; Birsan, M.-V.; Carbunaru, D.; Baciu, M.; Orzan, A. Changes in the large-scale thermodynamic instability and connection with rain shower frequency over Romania. Verification of the Clausius–Clapeyron scaling. Int. J. Climatol. 2016, 36, 2015–2034. [Google Scholar] [CrossRef] [Scilit]
  24. Manea, A.; Birsan, M.V.; Tudorache, G.; Cărbunaru, F. Changes in the type of precipitation and associated cloud types in Eastern Romania (1961–2008). Atmos. Res. 2016, 169, 357–365. [Google Scholar] [CrossRef] [Scilit]
  25. Jitariu, V.; Ursu, A.; Niacsu, L.; Ichim, P. Projected Shifts in the Growing Season for Plum Orchards in Romania Under Future Climate Change. Horticulturae 2025, 11, 1479. [Google Scholar] [CrossRef] [Scilit]
  26. Serban, C.; Maftei, C. Remote Sensing Evaluation of Drought Effects on Crop Yields Across Dobrogea, Romania, Using Vegetation Health Index (VHI). Agriculture 2025, 15, 668. [Google Scholar] [CrossRef] [Scilit]
  27. Serban, C.; Maftei, C. Spatiotemporal Drought Analysis Using the Composite Drought Index (CDI) over Dobrogea, Romania. Water 2025, 17, 481. [Google Scholar] [CrossRef] [Scilit]
  28. Mihai, G.; Teodosiu, M.; Birsan, M.V.; Alexandru, A.M.; Mirancea, I.; Apostol, E.N.; Garbacea, P.; Ionita, L. Impact of Climate Change and Adaptive Genetic Potential of Norway Spruce at the South–Eastern Range of Species Distribution. Agric. For. Meteorol. 2020, 291, 108040. [Google Scholar] [CrossRef] [Scilit]
  29. Mihai, G.; Alexandru, A.; Nita, I.-A.; Birsan, M.-V. Climate Change in the Provenance Regions of Romania over the Last 70 Years: Implications for Forest Management. Forests 2022, 13, 1203. [Google Scholar] [CrossRef] [Scilit]
  30. Birsan, M.V. Trends in Monthly Natural Streamflow in Romania and Linkages to Atmospheric Circulation in the North Atlantic. Water Resour. Manag. 2015, 29, 3305–3313. [Google Scholar] [CrossRef] [Scilit]
  31. Dobrinescu, A.; Busuioc, A.; Birsan, M.-V.; Dumitrescu, A.; Orzan, A. Changes in thermal discomfort indices in Romania and their connections with large-scale mechanisms. Clim. Res. 2015, 64, 213–226. [Google Scholar] [CrossRef] [Scilit]
  32. Micheu, M.M.; Birsan, M.-V.; Nita, I.-A.; Andrei, M.D.; Nebunu, D.; Acatrinei, C.; Sfica, L.; Szep, R.; Keresztesi, A.; De Arroyabe Hernaez, P.F.; et al. Influence of meteorological variables on people with cardiovascular diseases in Bucharest, Romania (2011–2012). Rom. Rep. Phys. 2021, 73, 707. [Google Scholar]
  33. Dumitrescu, A.; Micu, D.; Guijarro, J.; Manea, A.; Cheval, S. Long-term homogenized air temperature and precipitation datasets in Romania, 1901–2023. Sci. Data 2025, 12, 1116. [Google Scholar] [CrossRef] [Scilit] [PubMed]
  34. Dumitrescu, A. RoCliHom—Long-Term Homogenized Air Temperature and Precipitation Datasets in Romania, 1901–2023 (1.0.0) [Data Set]. 2025. Available online: https://zenodo.org/records/14880417 (accessed on 20 August 2025).
  35. Hargreaves, G.H.; Samani, Z.A. Estimating potential evapotranspiration. J. Irrig. Drain. Div. 1982, 108, 225–230. [Google Scholar] [CrossRef] [Scilit]
  36. McKee, T.B.; Doesken, N.J.; Kleist, J. The Relationship of Drought Frequency and Duration to Time Scales. In Proceedings of the 8th Conference on Applied Climatology, American Meteorological Society, Boston, MA, USA, 17–22 January 1993; pp. 179–184. [Google Scholar]
  37. Vicente-Serrano, S.M.; Beguería, S.; López-Moreno, J.I. A Multiscalar Drought Index Sensitive to Global Warming: The Standardized Precipitation Evapotranspiration Index. J. Clim. 2010, 23, 1696–1718. [Google Scholar] [CrossRef] [Scilit]
  38. Hurrell, J.W. Decadal trends in the North Atlantic Oscillation: Regional temperatures and precipitation. Science 1995, 269, 676–679. [Google Scholar] [CrossRef] [Scilit]
  39. Phillips, A.; National Center for Atmospheric Research Staff (Eds.) The Climate Data Guide: Hurrell Wintertime SLP-Based Northern Annular Mode (NAM) Index. 2017. Available online: https://climatedataguide.ucar.edu/climate-data/hurrell-wintertime-slp-based-northern-annular-mode-nam-index (accessed on 12 December 2025).
  40. Barnston, A.G.; Livezey, R.E. Classification, seasonality and persistence of low-frequency atmospheric circulation patterns. Mon. Weather Rev. 1987, 115, 1083–1126. [Google Scholar] [CrossRef] [Scilit]
  41. Higgins, R.W.; Leetmaa, A.; Kousky, V.E. Relationships between climate variability and winter temperature extremes in the United States. J. Clim. 2002, 15, 1555–1572. [Google Scholar] [CrossRef] [Scilit]
  42. Enfield, D.B.; Mestas-Nunez, A.M.; Trimble, P.J. The Atlantic Multidecadal Oscillation its relationship to rainfall river flows in the continental U.S. Geophys. Res. Lett. 2001, 28, 2077–2080. [Google Scholar] [CrossRef] [Scilit]
  43. Mann, H.B. Nonparametric tests against trend. Econometrica 1945, 13, 245–259. [Google Scholar] [CrossRef] [Scilit]
  44. Kendall, M.G. Rank Correlation Methods, 4th ed.; Charles Griffin: London, UK, 1975. [Google Scholar]
  45. Helsel, D.R.; Hirsch, R.M.; Ryberg, K.R.; Archfield, S.A.; Gilroy, E.J. Statistical Methods in Water Resources; Techniques and Methods, Book 4, Chapter A3; U.S. Geological Survey: Reston, VA, USA, 2020; 458p. [Google Scholar] [CrossRef] [Scilit]
  46. Birsan, M.V.; Marin, L.; Dumitrescu, A. Seasonal changes in wind speed in Romania. Rom. Rep. Phys. 2013, 65, 1479–1484. [Google Scholar]
  47. Birsan, M.V.; Nita, I.-A.; Craciun, A.; Sfica, L.; Keresztesi, Á.; Szep, R.; Micheu, M. Observed changes in mean and maximum monthly wind speed over Romania since AD 1961. Rom. Rep. Phys. 2020, 72, 702. [Google Scholar]
  48. Croitoru, A.-E.; Piticar, A.; Dragotă, C.S.; Burada, D.C. Recent changes in reference evapotranspiration in Romania. Glob. Planet. Change 2013, 111, 127–132. [Google Scholar] [CrossRef] [Scilit]
  49. Prăvălie, R.; Piticar, A.; Roșca, B.; Sfîcă, L.; Bandoc, G.; Tiscovschi, A.; Patriche, C. Spatio-temporal changes of the climatic water balance in Romania as a response to precipitation and reference evapotranspiration trends during 1961–2013. Catena 2019, 172, 295–312. [Google Scholar] [CrossRef] [Scilit]
  50. Ionita, M.; Antonescu, B.; Roibu, C.; Nagavciuc, V. Drought’s Grip on Romania: A Tale of Two Indices. Int. J. Climatol. 2025, 45, e8876. [Google Scholar] [CrossRef] [Scilit]
  51. Bădăluță, C.A.; Haliuc, A.; Bădăluță, G.; Scriban, R.E. Spatiotemporal variability of drought in Romania during 1901–2021 using the Standardized Precipitation Evapotranspiration Index (SPEI). Analele Univ. Din Oradea Ser. Geogr. 2024, 34, 33–44. [Google Scholar] [CrossRef] [Scilit]
  52. Ioniță, M.; Nagavciuc, V. Drought, Aridification and Precipitation in Romania. In State of Climate Romania 2025; Chapter 2; Cebotari, S., Roseti, A., Iosif, A., Zubașcu, F., Eds.; Available online: https://www.stareaclimei.ro/ (accessed on 16 April 2026). (In Romanian)
  53. Trigo, R.M.; Osborn, T.J.; Corte-Real, J.M. The North Atlantic Oscillation influence on Europe: Climate impacts and associated physical mechanisms. Clim. Res. 2002, 20, 9–17. [Google Scholar] [CrossRef] [Scilit]
  54. Vicente-Serrano, S.M.; López-Moreno, J.I. Nonstationary influence of the North Atlantic Oscillation on European precipitation. J. Geophys. Res. 2008, 113, D20120. [Google Scholar] [CrossRef] [Scilit]
  55. McKenna, C.M.; Maycock, A.C. The role of the North Atlantic Oscillation for projections of winter mean precipitation in Europe. Geophys. Res. Lett. 2022, 49, e2022GL099083. [Google Scholar] [CrossRef] [Scilit]
  56. Mihaila, D.; Briciu, A.E. Climatic teleconnections with influence on some rivers from south-eastern Europe. Bol. La Asoc. Esp. Geogr. 2015, 69, 37–62. [Google Scholar]
  57. Justino, F.; Bromwich, D.H.; Schumacher, V.; DaSilva, A.; Wang, S.H. Arctic Oscillation and Pacific-North American pattern dominated-modulation of fire danger and wildfire occurrence. npj Clim. Atmos. Sci. 2022, 5, 52. [Google Scholar] [CrossRef] [Scilit]
  58. Müller-Plath, G.; Lüdecke, H.J.; Lüning, S. Long-distance air pressure differences correlate with European rain. Sci. Rep. 2022, 12, 10191. [Google Scholar] [CrossRef] [Scilit]
  59. Gonzales, E.; Gonzales, K. Analysis of Climate Indices to Determine Global Climate Patterns: Techniques for Summarizing Complex Climate Data. In Sustainable Development; IntechOpen: London, UK, 2024. [Google Scholar] [CrossRef] [Scilit]
  60. Barna, F.M.; Manescu, A.C. The Impact of Drought Risk on Maize Crop in Romania. Sustainability 2025, 17, 8870. [Google Scholar] [CrossRef] [Scilit]
  61. van Leeuwen, C.; Destrac-Irvine, A.; Dubernet, M.; Duchêne, E.; Gowdy, M.; Marguerit, E.; Pieri, P.; Parker, A.; de Rességuier, L.; Ollat, N. An Update on the Impact of Climate Change in Viticulture and Potential Adaptations. Agronomy 2019, 9, 514. [Google Scholar] [CrossRef] [Scilit]
  62. Schneider, D.P.; Deser, C.; Fasullo, J.; Trenberth, K.E. Climate Data Guide Spurs Discovery and Understanding. Eos Trans. AGU 2013, 94, 121–122. [Google Scholar] [CrossRef] [Scilit]
Figure 1. Spatial distribution of the Romanian weather stations involved in the study.
Land 15 00978 g001
Figure 2. Annual trends in precipitation (a), air temperature (b), PET (c), and water balance (d). Red/blue triangles symbolize statistically significant increasing/decreasing trends. Black points denote stations with no trend. Trend magnitude is represented in six classes.
Land 15 00978 g002
Figure 3. Trends in monthly precipitation (1901–2023). Blue/red triangles symbolize statistically significant decreasing/increasing trends. Black points denote stations with no trend.
Land 15 00978 g003
Figure 4. Trends in mean air temperature. Red triangles symbolize statistically significant increasing trends. Black points denote stations with no trend.
Land 15 00978 g004
Figure 5. Trends in potential evapotranspiration. Red triangles symbolize statistically significant increasing trends. Black points denote stations with no trend.
Land 15 00978 g005
Figure 6. Trends in water balance. Blue (red) triangles symbolize statistically significant decreasing/increasing trends. Black points denote stations with no trend.
Land 15 00978 g006
Figure 7. Drought metric evolution during the growing season (Apr.–Sep.) since 1901 (averaged over the Romanian weather stations), according to SPI (a) and SPEI (b). Black lines denote the linear trends. Values above 1 are in green, and those below –1, in orange.
Land 15 00978 g007
Figure 8. Trends in 6-month SPI and SPEI (Apr–Sep) over 123-, 70-, 60- and 50-year intervals ending in 2023. Blue/red triangles symbolize statistically significant decreasing/increasing trends. Black points denote stations with no trend.
Land 15 00978 g008
Figure 9. Correlations (Spearman) between teleconnection indices and SPEI (Jan–Dec). Blue (red) circles denote statistically significant negative (positive) correlations at 0.05 (light) and 0.01 (dark) p-level, respectively. Non-significant correlations are symbolised with empty circles.
Land 15 00978 g009
Table 1. Trend results summary for precipitation, air temperature, potential evapotranspiration and water balance. The values denote the statistically significant trends as % of total. Upward trends are in red, and downward trends in blue. Values below 5 are greyed.
Climatic VariableTrendJanFebMarAprMayJunJulAugSepOctNovDecAnnual
PrecipitationUpward3.22.66.45.11.31.915.40.62.60.00.08.38.3
Down7.73.21.33.21.96.41.33.20.09.65.11.90.0
Mean air
temperature
Upward92.396.851.385.994.998.198.710053.823.155.823.7100
Down0.00.00.00.00.00.00.00.00.00.00.00.00.0
Potential evapotranspirationUpward9.675.049.485.994.998.198.710053.823.751.912.8100
Down0.00.00.00.00.00.00.00.00.00.00.00.00.0
Water balanceUpward3.22.61.30.00.00.00.00.00.00.00.06.40.0
Down9.011.54.50.64.59.639.784.61.30.013.52.629.5
Table 2. Summary statistics of annual trends magnitudes computed with the Theil–Sen slope estimator. Q1 and Q3 are the 1st and 3rd quartiles, respectively.
Theil–Sen Slope EstimatorMinQ1MedianQ3Max
Precipitation (mm/decade)−4.10.61.93.58.9
Mean air temperature (°C/decade)0.0870.1090.1160.1220.133
Potential evapotranspiration (mm/decade)2.85.96.46.88.1
Water balance (mm/decade)−11.0−6.3−4.4−3.03.6
Disclaimer/Publisher’s Note: The statements, opinions and data contained in all publications are solely those of the individual author(s) and contributor(s) and not of MDPI and/or the editor(s). MDPI and/or the editor(s) disclaim responsibility for any injury to people or property resulting from any ideas, methods, instructions or products referred to in the content.