Article

Evaluation of Tourism Development Potential and Its Influencing Mechanisms of Traditional Villages Based on Multi-Source Data and Interpretable Machine Learning: A Case Study of Shexian County, Huangshan City, China


College of Architecture & Art, Hefei University of Technology, Hefei 230601, China
*
Author to whom correspondence should be addressed.
Land 2026, 15(6), 977; https://doi.org/10.3390/land15060977
Submission received: 15 April 2026 / Revised: 27 May 2026 / Accepted: 31 May 2026 / Published: 3 June 2026
(This article belongs to the Section Land Innovations – Data and Machine Learning)

Abstract

Against the backdrop of China’s vigorous promotion of rural revitalization, traditional villages have become important carriers of rural tourism; however, their tourism development potential varies significantly. Using 182 traditional villages in Shexian County, Anhui Province, as the study area, this paper integrates multi-source data, including remote sensing, socio-economic, and online data. It constructs an evaluation index system from three dimensions: resource endowment, socio-economic conditions, and natural environment. Three machine learning models, namely, Random Forest (RF), XGBoost, and LightGBM, are employed to measure tourism development potential, and the optimal model is selected through comparative analysis. On this basis, the SHAP method is introduced to interpret the influencing factors and reveal the direction and mechanisms of their effects. The results show that (1) the LightGBM model performs best and is more suitable for evaluating tourism development potential of traditional villages; (2) service facilities, land resources, and transportation conditions are the most important influencing factors, while cultural resources and online attention also play significant roles; (3) the effects of different factors exhibit obvious nonlinear characteristics with interaction effects; and (4) the spatial pattern of tourism development potential presents a structure of “core agglomeration–transitional distribution–peripheral dispersion”. From the perspective of multi-source data and explainable machine learning, this study provides a systematic analysis of tourism development potential in traditional villages and offers a scientific reference for their differentiated development and conservation.

1. Introduction

Driven by China’s rural development policies, rural tourism has become a key pathway for promoting rural economic transformation and narrowing the urban–rural gap. Traditional villages, as important carriers of the rural revitalization strategy, embody historical memory, traditional knowledge of production and daily life, cultural and artistic achievements, and distinctive regional characteristics. They represent irreplaceable cultural and tourism resources [1]. To date, a total of 8155 traditional villages have been included in the Chinese Traditional Village Protection List and are under official protection.
However, in the process of tourism development, traditional villages in China generally face challenges such as insufficient development momentum [2], homogenization of tourism products [3], and degradation of heritage landscapes. Although some villages possess rich cultural resources, their advantages have not been effectively translated into development strengths due to a lack of scientific planning [4]. Therefore, conducting a scientific evaluation of tourism development potential and identifying resource endowments, development advantages, and constraint factors is of great significance for the conservation of traditional villages and the sustainable development of rural tourism.
Existing studies on traditional village tourism have mainly focused on four aspects: cultural heritage conservation [5], tourism spatial distribution [6], tourism development effects [7], and rural revitalization pathways [8]. Early studies primarily emphasized the protection value of traditional villages and the preservation of historical landscapes and cultural heritage. With the rapid development of rural tourism in China, increasing attention has been paid to the relationship between tourism development and rural transformation [9], including tourism commercialization, cultural landscape reconstruction, residents’ livelihoods, and sustainable development.
In recent years, scholars have gradually recognized that traditional village tourism is not merely a resource-dependent activity but a complex spatial system jointly shaped by resource endowment, infrastructure conditions, market accessibility, policy support, and environmental suitability. Consequently, tourism development potential evaluation has become an important research direction in traditional village studies.
With the development of traditional village tourism, academic research has increasingly focused on evaluating the potential of tourism development. Regarding the evaluation dimensions and indicator construction, there has been a transition from single-resource assessment to multi-dimensional comprehensive evaluation. Early studies mainly emphasized the value of village resources, such as cultural heritage [10] and architectural landscapes [11]. In recent years, it has been widely recognized that a scientific evaluation should consider the complex system composed of resource endowment, socio-economic conditions, and natural environment.
Existing studies have evaluated tourism development potential from different spatial perspectives, including regional tourism competitiveness [12], village cluster development [13], and village-level tourism suitability [14]. These studies have contributed substantially to understanding the spatial differentiation of tourism resources and tourism development conditions. However, macro-scale evaluations often lack sufficient precision for village-level planning and conservation decision-making, while micro-scale studies frequently rely on limited indicators and simplified analytical frameworks. Regarding evaluation methods, traditional approaches such as the Analytic Hierarchy Process, entropy method, and TOPSIS have been widely used. However, these methods have limitations in handling high-dimensional and nonlinear relationships [15]. On the one hand, weight assignment often relies on expert judgment, making it difficult to avoid subjectivity; on the other hand, linear assumptions and static weighting mechanisms are insufficient to capture complex interactions between and dynamic evolution of tourism system elements.
In recent years, machine learning has provided a data-driven paradigm for rural revitalization research [16]. Machine learning algorithms can automatically learn nonlinear mapping relationships between features and target variables from sample data, enabling objective and efficient prediction without predefining weights [17]. Different models exhibit varying advantages in capturing nonlinear relationships between variables [18]. Among machine learning methods, ensemble learning models such as Random Forest [19], XGBoost, and LightGBM have demonstrated strong performance in handling nonlinear relationships, heterogeneous datasets, and complex spatial prediction tasks in tourism and geographic studies. However, existing studies mostly rely on a single model and lack systematic comparisons within the same research context, making it difficult to determine which algorithm is most suitable for tourism evaluation problems.
Regarding the research content, most existing studies on the tourism development potential of traditional villages are limited to evaluating potential scores or classification levels, lacking in-depth interpretation of how specific indicators influence development potential [20]. Although traditional machine learning models can provide feature importance rankings, they are unable to reveal the direction of influence on individual samples or capture interaction effects between features [21]. The introduction of explainable machine learning aims to address this issue. The SHAP framework can quantify the contribution of each feature to model predictions, significantly enhancing model transparency and interpretability [22]. In recent years, SHAP has been widely applied in geography and environmental sciences, such as landslide susceptibility assessment [23] and spatial prediction of soil heavy metals [24]. In tourism studies, Zhang Huiling et al. have attempted to integrate XGBoost with SHAP to evaluate the competitiveness of rural ecotourism resources, confirming its effectiveness in mechanism analysis [25]. However, existing applications are still primarily focused on natural or urban systems [18]. The use of SHAP in tourism research remains limited to single-scenario prediction, lacking exploration of mechanism heterogeneity in traditional villages, which are “conservation-constrained” destinations. In summary, existing studies exhibit three major gaps:
(1)
At the evaluation scale, macrolevel studies cannot provide precise guidance at the village level;
(2)
Regarding the data dimensions, specific indicators such as cultural resources remain insufficiently quantified;
(3)
In methodological depth, it is difficult to simultaneously achieve high predictive accuracy and mechanism interpretability.
In this study, tourism development potential does not refer to the current level of tourism commercialization or tourism revenue. Instead, it is understood as the latent capacity and development readiness of traditional villages to transform resource advantages into sustainable tourism development under suitable infrastructural, institutional, and market conditions.
To address these gaps, this study integrates multi-source data to construct a characteristic indicator system for traditional villages and introduces the SHAP explainable framework to open the “black box” of machine learning models. To address these gaps, this study integrates multi-source data to construct a characteristic indicator system for traditional villages and introduces the SHAP explainable framework to open the “black box” of machine learning models. The aim is to reveal nonlinear characteristics, threshold effects, and the contextual heterogeneity of influencing mechanisms, thereby providing transparent, traceable scientific evidence for differentiated conservation and development policies.
Therefore, this study takes 182 traditional villages in Shexian County, Huangshan City, as the research object. By integrating social media data and geospatial remote sensing data, an evaluation index system is constructed from three dimensions: resource endowment, natural environment, and socio-economic conditions. Through comparative analysis of RF, XGBoost, and LightGBM models, the optimal model is identified. On this basis, the SHAP framework is employed to quantify each indicator’s contribution and to reveal the direction and heterogeneity of influencing mechanisms at the sample level. Finally, the spatial distribution pattern of tourism development potential is analyzed to identify the characteristics of high- and low-potential villages, providing scientific support for differentiated development and conservation strategies.

2. Materials and Methods

2.1. Study Area

This study designated Shexian County, Huangshan City, Anhui Province, China, as the research area. Shexian County is located in the western part of Huangshan City, with an area of 2122 km2 and governing 28 townships and 182 administrative villages (Figure 1). As the historical administrative center of ancient Huizhou, it has a history of more than 1400 years and was designated as a National Historical and Cultural City in 1986. As one of the core birthplaces of Huizhou culture, Shexian County possesses 167 traditional villages, the most of any county in China. The dense distribution of Huizhou-style architectural complexes and living folk culture forms a unique cultural landscape. In recent years, relying on its dual advantages of cultural and ecological resources, rural tourism in Shexian County has developed rapidly. The county contains multiple 5A-level scenic spots and over one hundred boutique homestays, with annual tourist arrivals exceeding 13 million in 2025. However, the level of tourism development among traditional villages within the county is highly uneven. Some villages face conflicts between over-commercialization and rigid conservation policies, while many others have not fully exploited their cultural resources. Given the significant internal heterogeneity and rich cultural heritage, Shexian County serves as a representative case for studying the potential of tourism development and its influencing mechanisms.

2.2. Data Sources

This study integrated multi-source datasets covering resource endowment, socio-economic conditions, and natural environmental factors. To ensure consistency, all spatial datasets were unified into the WGS 1984 UTM coordinate system and processed at the village scale using ArcGIS 10.2 and Python 3.9. Cultural heritage data, traditional village lists, and tourism-related policy documents were obtained from the Shexian County Bureau of Culture, Tourism and Sports. These datasets were mainly used to construct the cultural resource index and institutional support index. POI data related to transportation and tourism services were collected from the Amap Open Platform in 2025. Transportation-related POIs mainly included bus stations, parking areas, and transit nodes, while tourism service POIs included catering, accommodation, shopping, and tourism service facilities. After removing duplicate and invalid records, spatial join analysis was conducted to aggregate POIs within village administrative boundaries. Online attention data were derived from Weibo geotagged check-in records from 2014 to 2025. Tourism-related posts were identified through keyword filtering and geotag matching and then spatially assigned to village units. It should be noted that online attention indicators may be influenced by temporary tourism events, platform recommendation mechanisms, and differences in internet usage behavior, which may introduce a certain degree of observational bias. Road network and water system data were obtained from OpenStreetMap (OSM). Different road types were classified into expressways, national roads, provincial roads, and ordinary roads according to the OSM classification system. Raster datasets, including NDVI, GDP, annual average temperature, annual precipitation, PM2.5 concentration, and elevation, were obtained from the Resource and Environment Science Data Center of the Chinese Academy of Sciences, the National Tibetan Plateau Data Center, and the Geospatial Data Cloud platform. Raster zonal statistics were applied to extract village-level values. Among them, NDVI and DEM data had a spatial resolution of 30 m, while GDP raster data had a spatial resolution of 1 km. Administrative boundary data were obtained from the National Geomatics Center of China and used as the basic spatial unit for indicator extraction and statistical analysis.

2.3. Research Framework

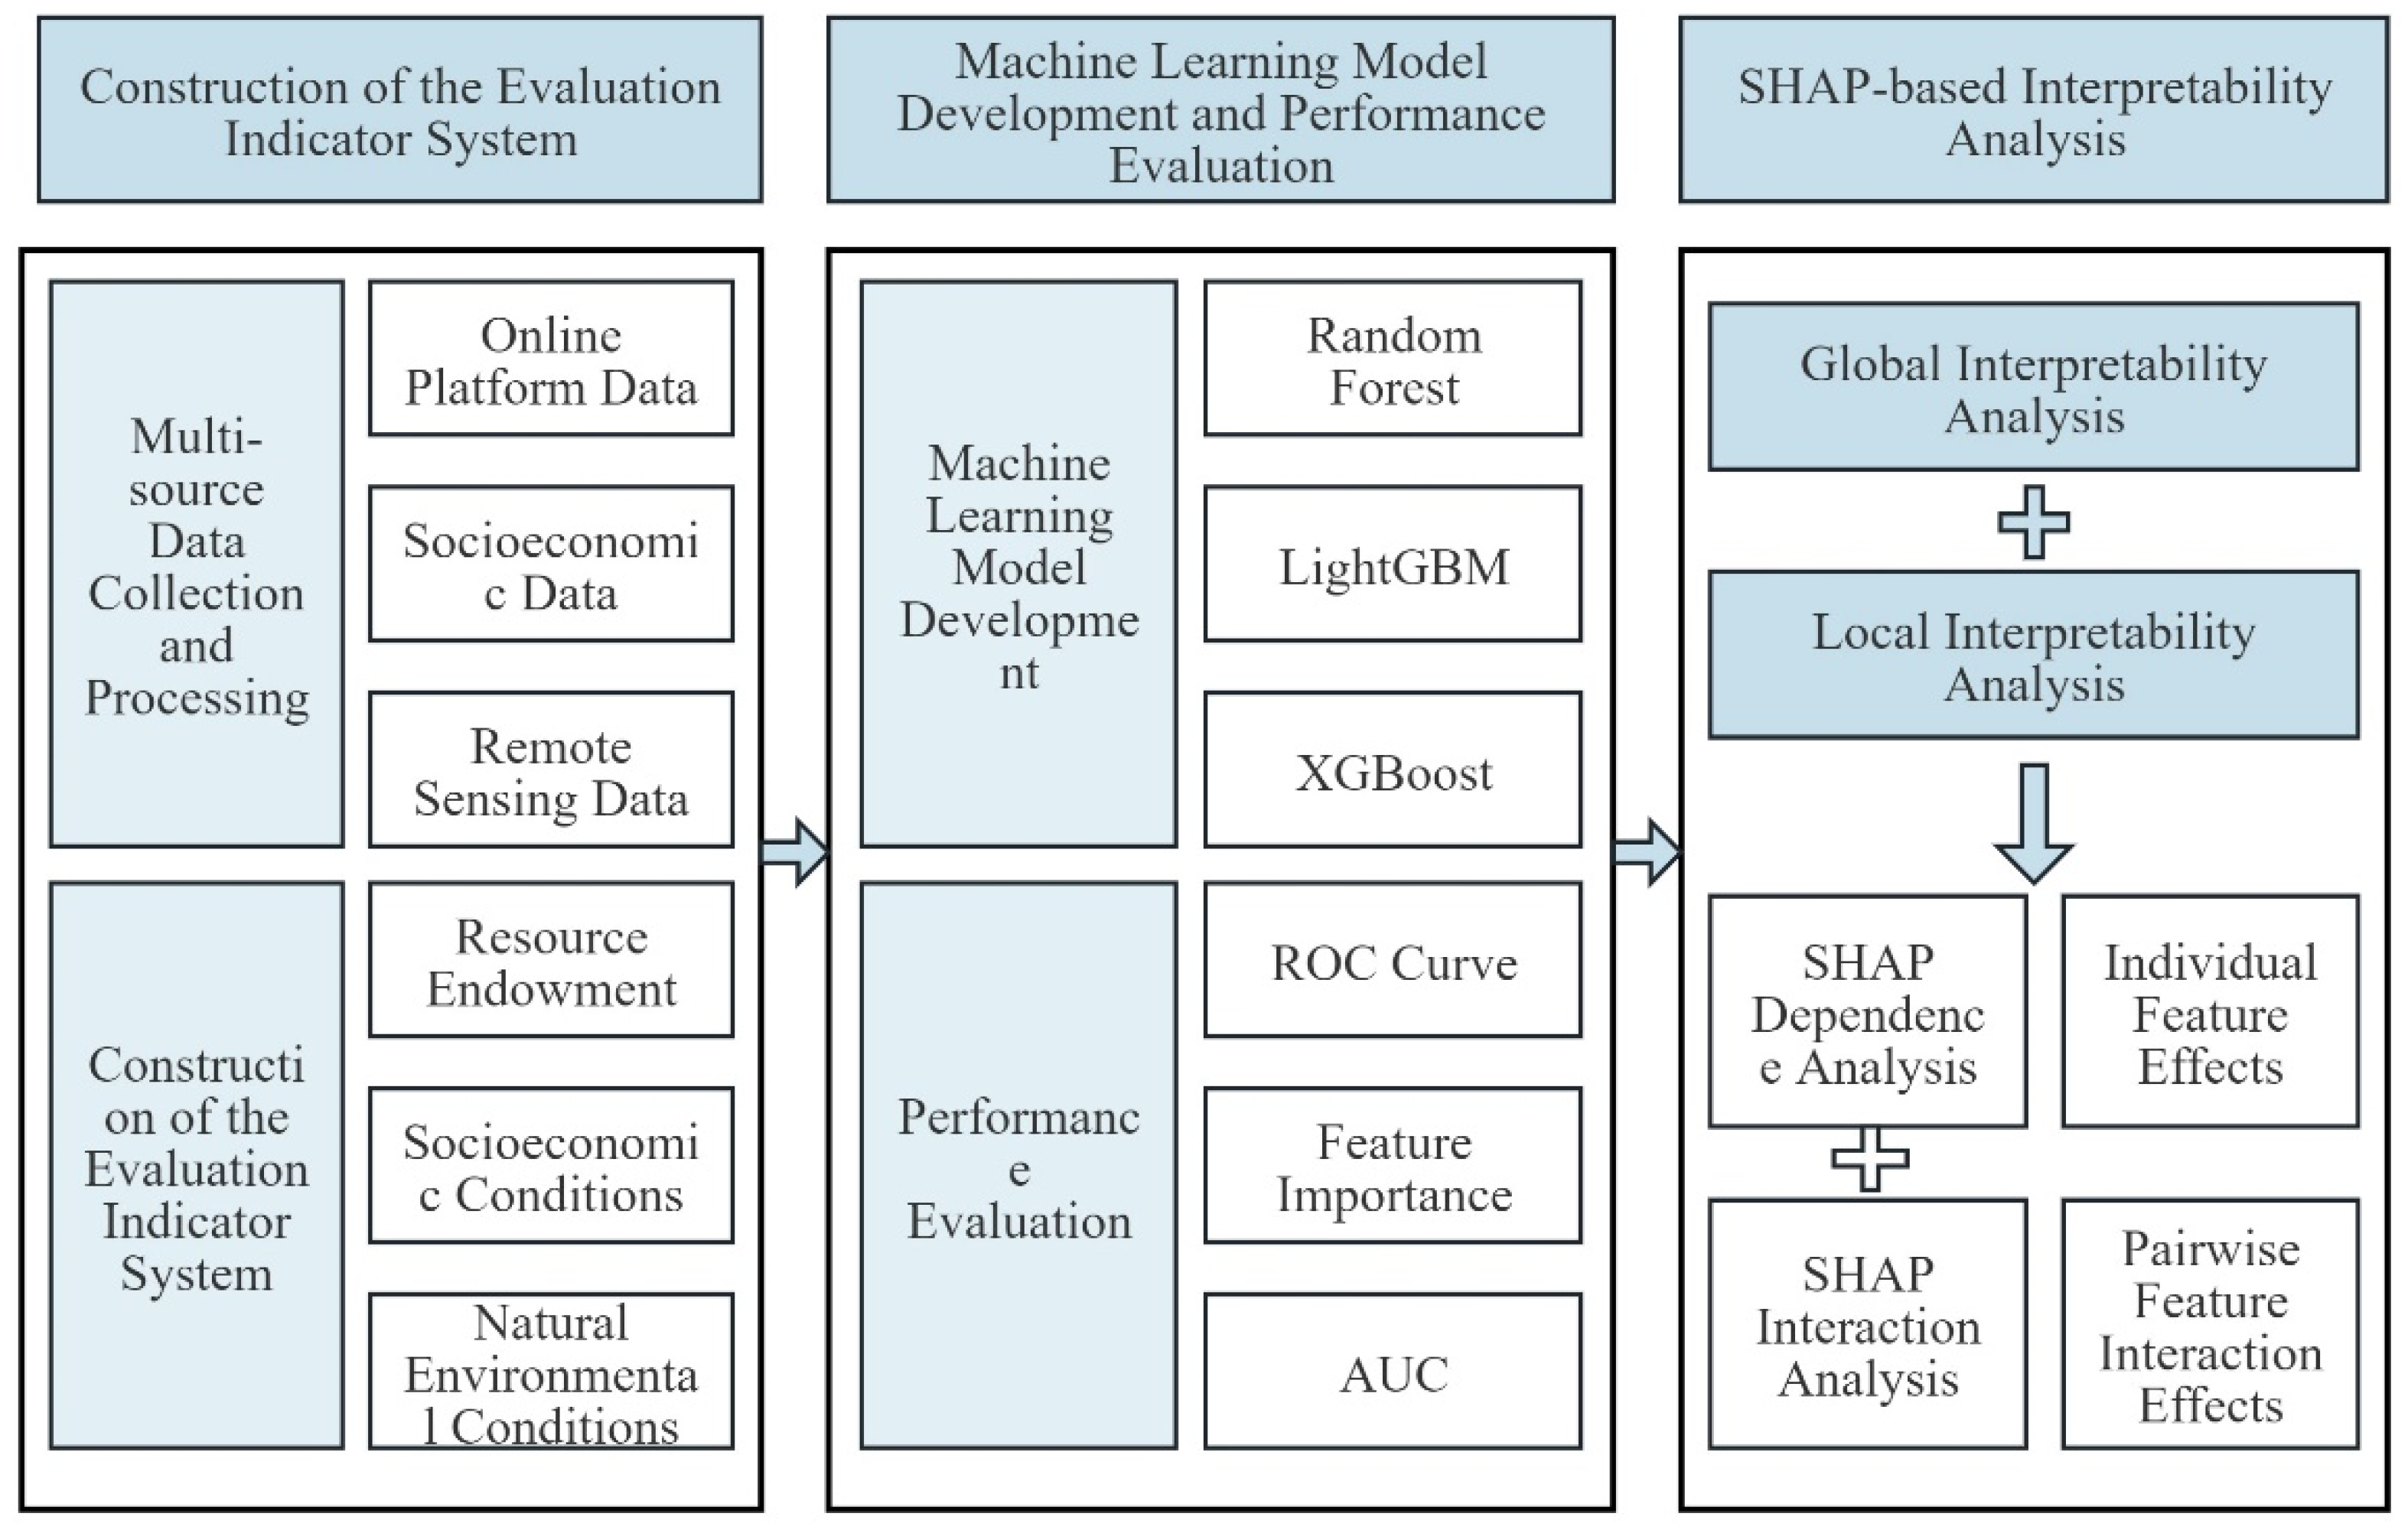
Based on the characteristics of traditional villages in Shexian County and the availability of multi-source data, this study constructs a comprehensive analytical framework for evaluating tourism development potential. The framework integrates indicator system construction, machine learning modeling, and explainable analysis (Figure 2). Specifically, the research consists of three main steps. First, multi-source data, including social media, socio-economic, and remote sensing data, were collected and processed to construct an evaluation index system from three dimensions: resource endowment, socio-economic conditions, and natural environment. Second, three machine learning models—Random Forest (RF), XGBoost, and LightGBM—were developed to evaluate tourism development potential, and their predictive performance was compared to identify the optimal model. Third, the SHAP explainable framework is introduced to interpret the model results, including global feature importance, local effects, and interaction effects, thereby revealing the underlying mechanisms influencing tourism development potential.

2.4. Construction of the Evaluation Index System

Based on tourism geography theory, previous rural tourism evaluation studies, and the characteristics of traditional villages in Shexian County, this study constructs a three-dimensional evaluation framework for tourism development potential. Existing studies generally suggest that tourism development potential is jointly shaped by tourism resource attractiveness, development support conditions, and environmental suitability. Therefore, this study organizes the indicator system into three dimensions: resource endowment, socio-economic conditions, and natural environment. Among them, resource endowment reflects the uniqueness and attractiveness of tourism resources and constitutes the core foundation of tourism development. Socio-economic conditions represent the accessibility, infrastructure support, and market transformation capacity of villages, which directly influence tourism reception ability and development efficiency. Natural environmental conditions determine ecological suitability and environmental constraints, thereby affecting the sustainability and spatial adaptability of tourism development. Based on this theoretical framework and the availability of multi-source data, 14 indicators were selected to construct the evaluation index system of tourism development potential (Table 1).
Resource endowment constitutes the fundamental basis for tourism development in traditional villages. Among these, cultural heritage serves as the core element in shaping unique tourism attractiveness [26], while land resources provide essential constraints and opportunities for the spatial configuration of tourism services [27].
Land suitability is an important basis for evaluating the potential of tourism development. Socio-economic conditions serve as an indispensable support system for rural tourism development. Improvements in regional economic conditions and policy support can promote sustained investment and infrastructure development in rural tourism [28]. Online attention reflects the intensity of word-of-mouth dissemination and potential market demand for tourist destinations on digital platforms [29], serving as an implicit driving force for tourism development.
Natural environmental conditions constitute the physical foundation and sustainability constraints of tourism activities [30]. These factors define the ecological boundaries and environmental context upon which tourism development depends. Vegetation coverage, water system patterns, air quality, and climatic factors jointly shape the natural landscape quality and tourists’ physiological comfort. At the same time, elevation influences development costs and landscape patterns through terrain conditions. Therefore, this study selects indicators such as ecological landscape attractiveness (NDVI), water system density, air quality level, annual precipitation, annual average temperature, and elevation to evaluate the natural environmental conditions of traditional villages in Shexian County.

2.5. Data Processing and Sample Construction

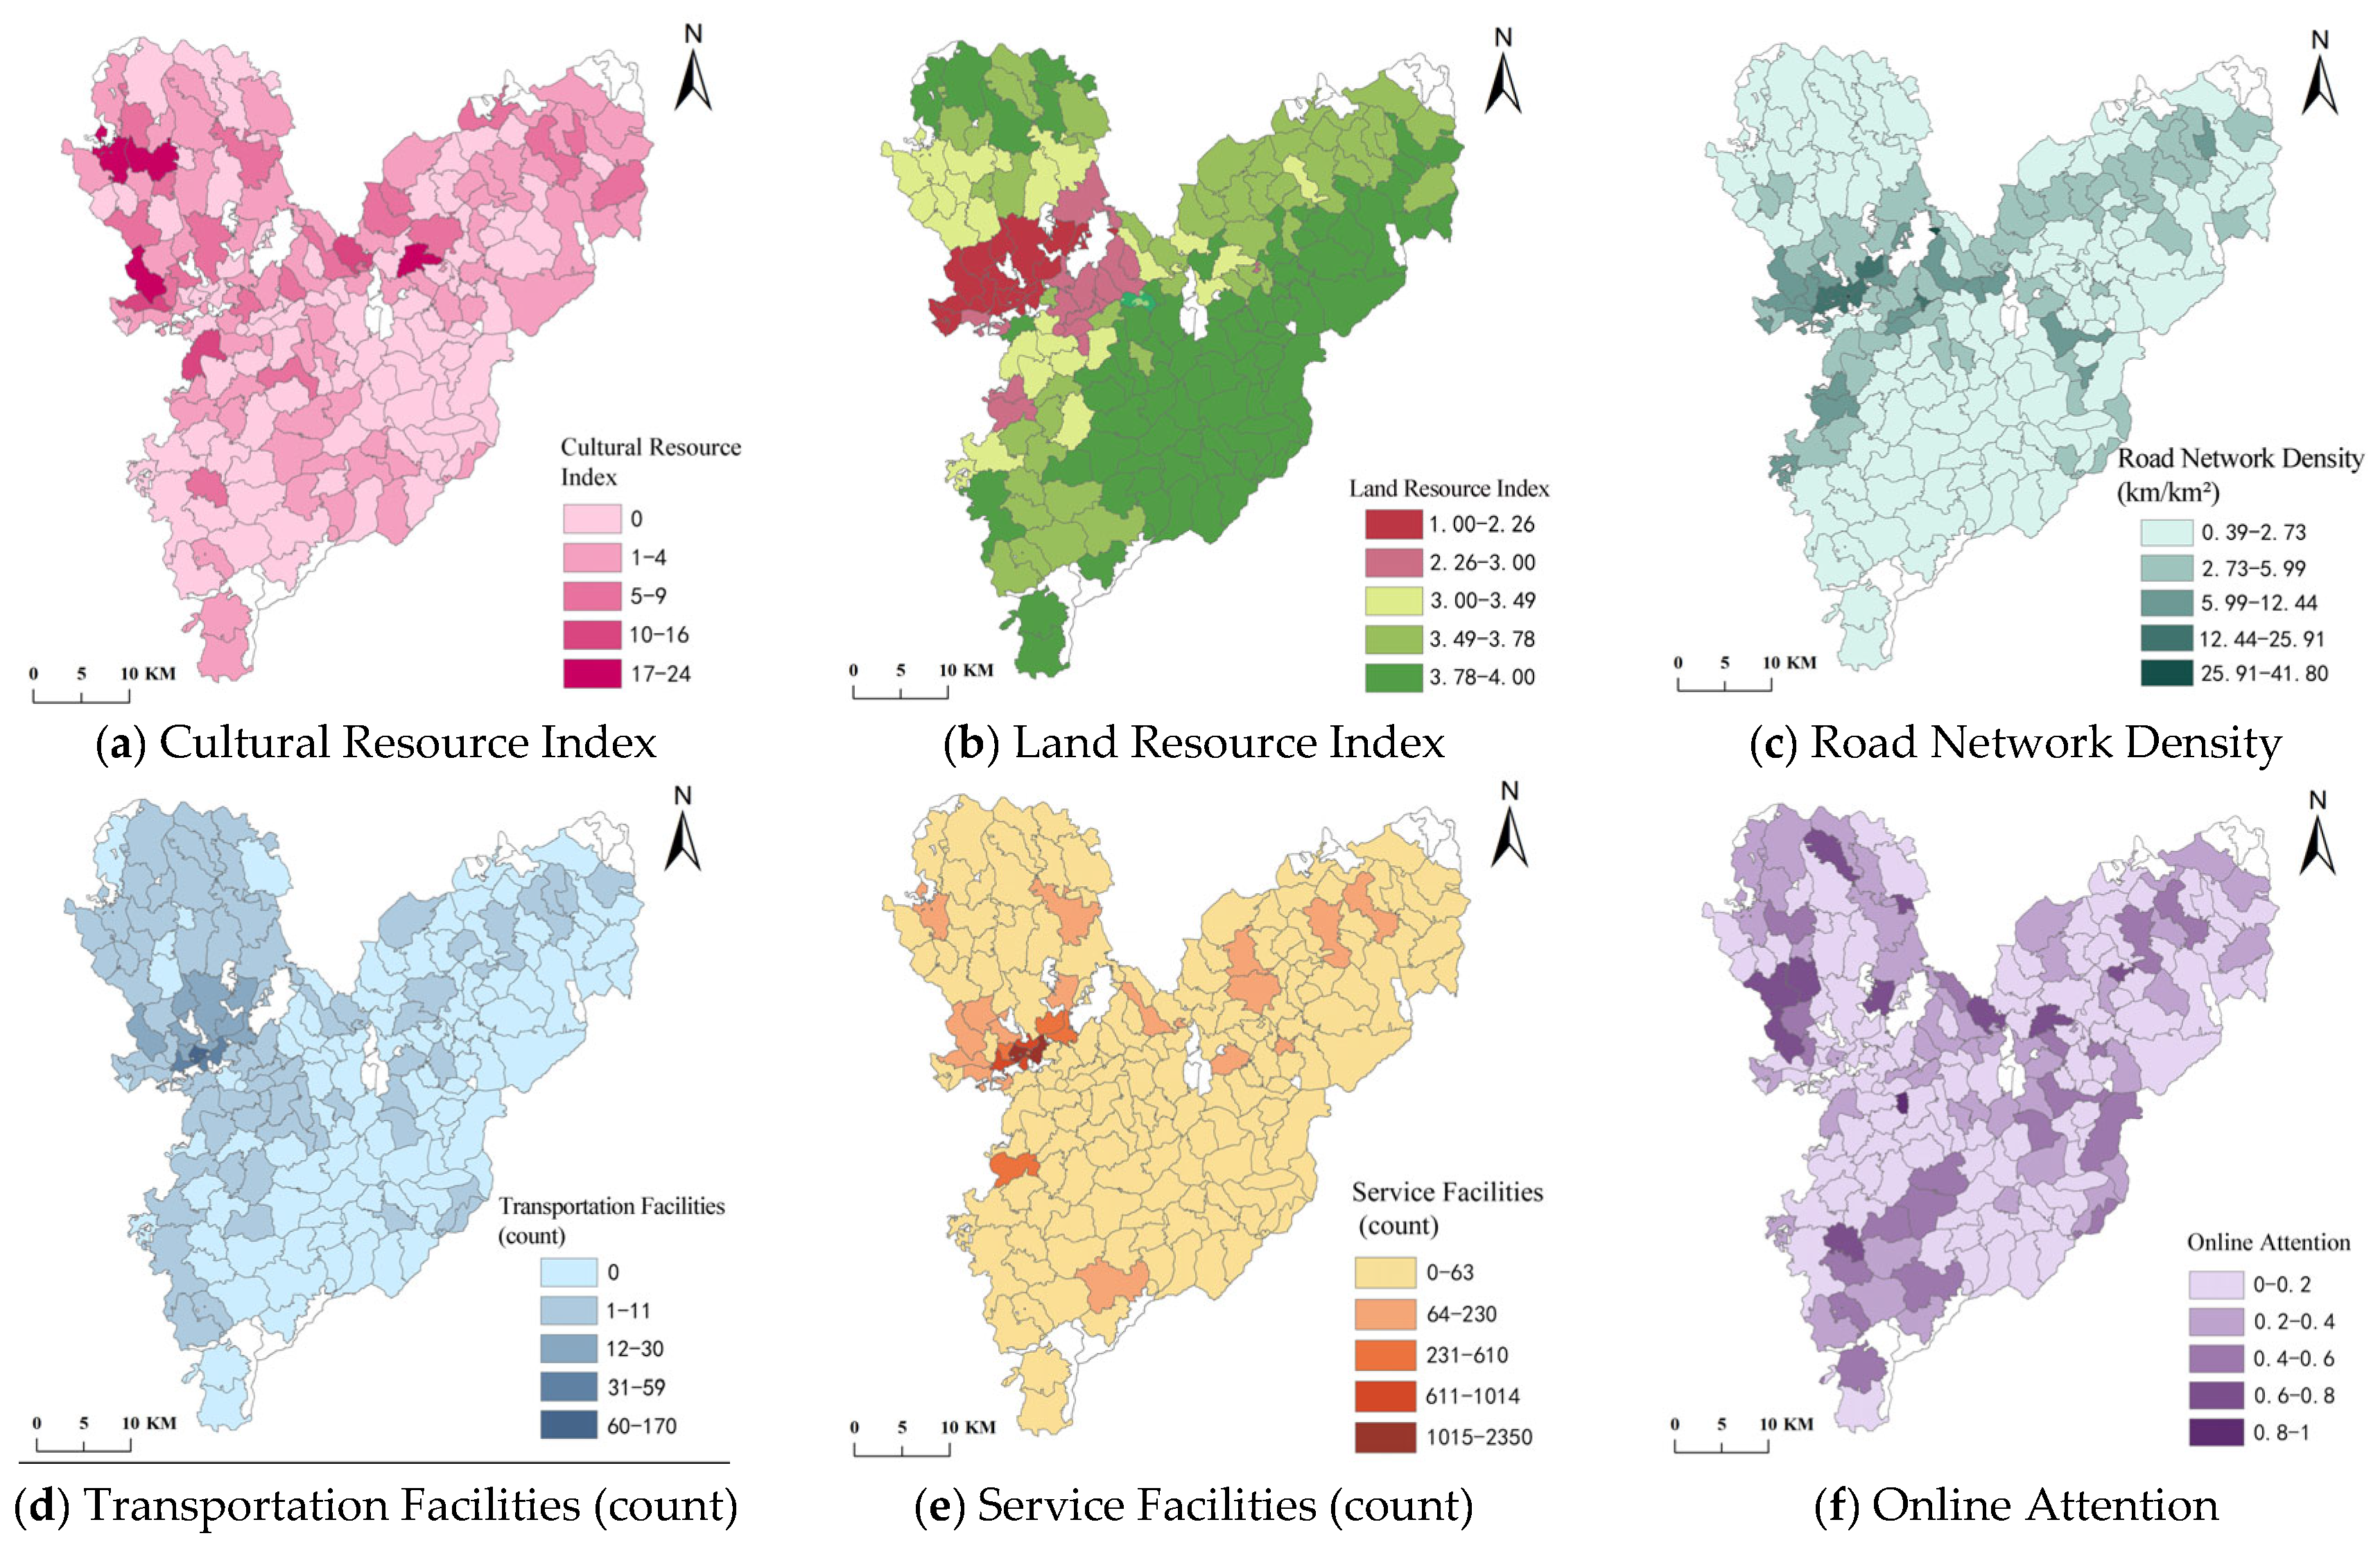
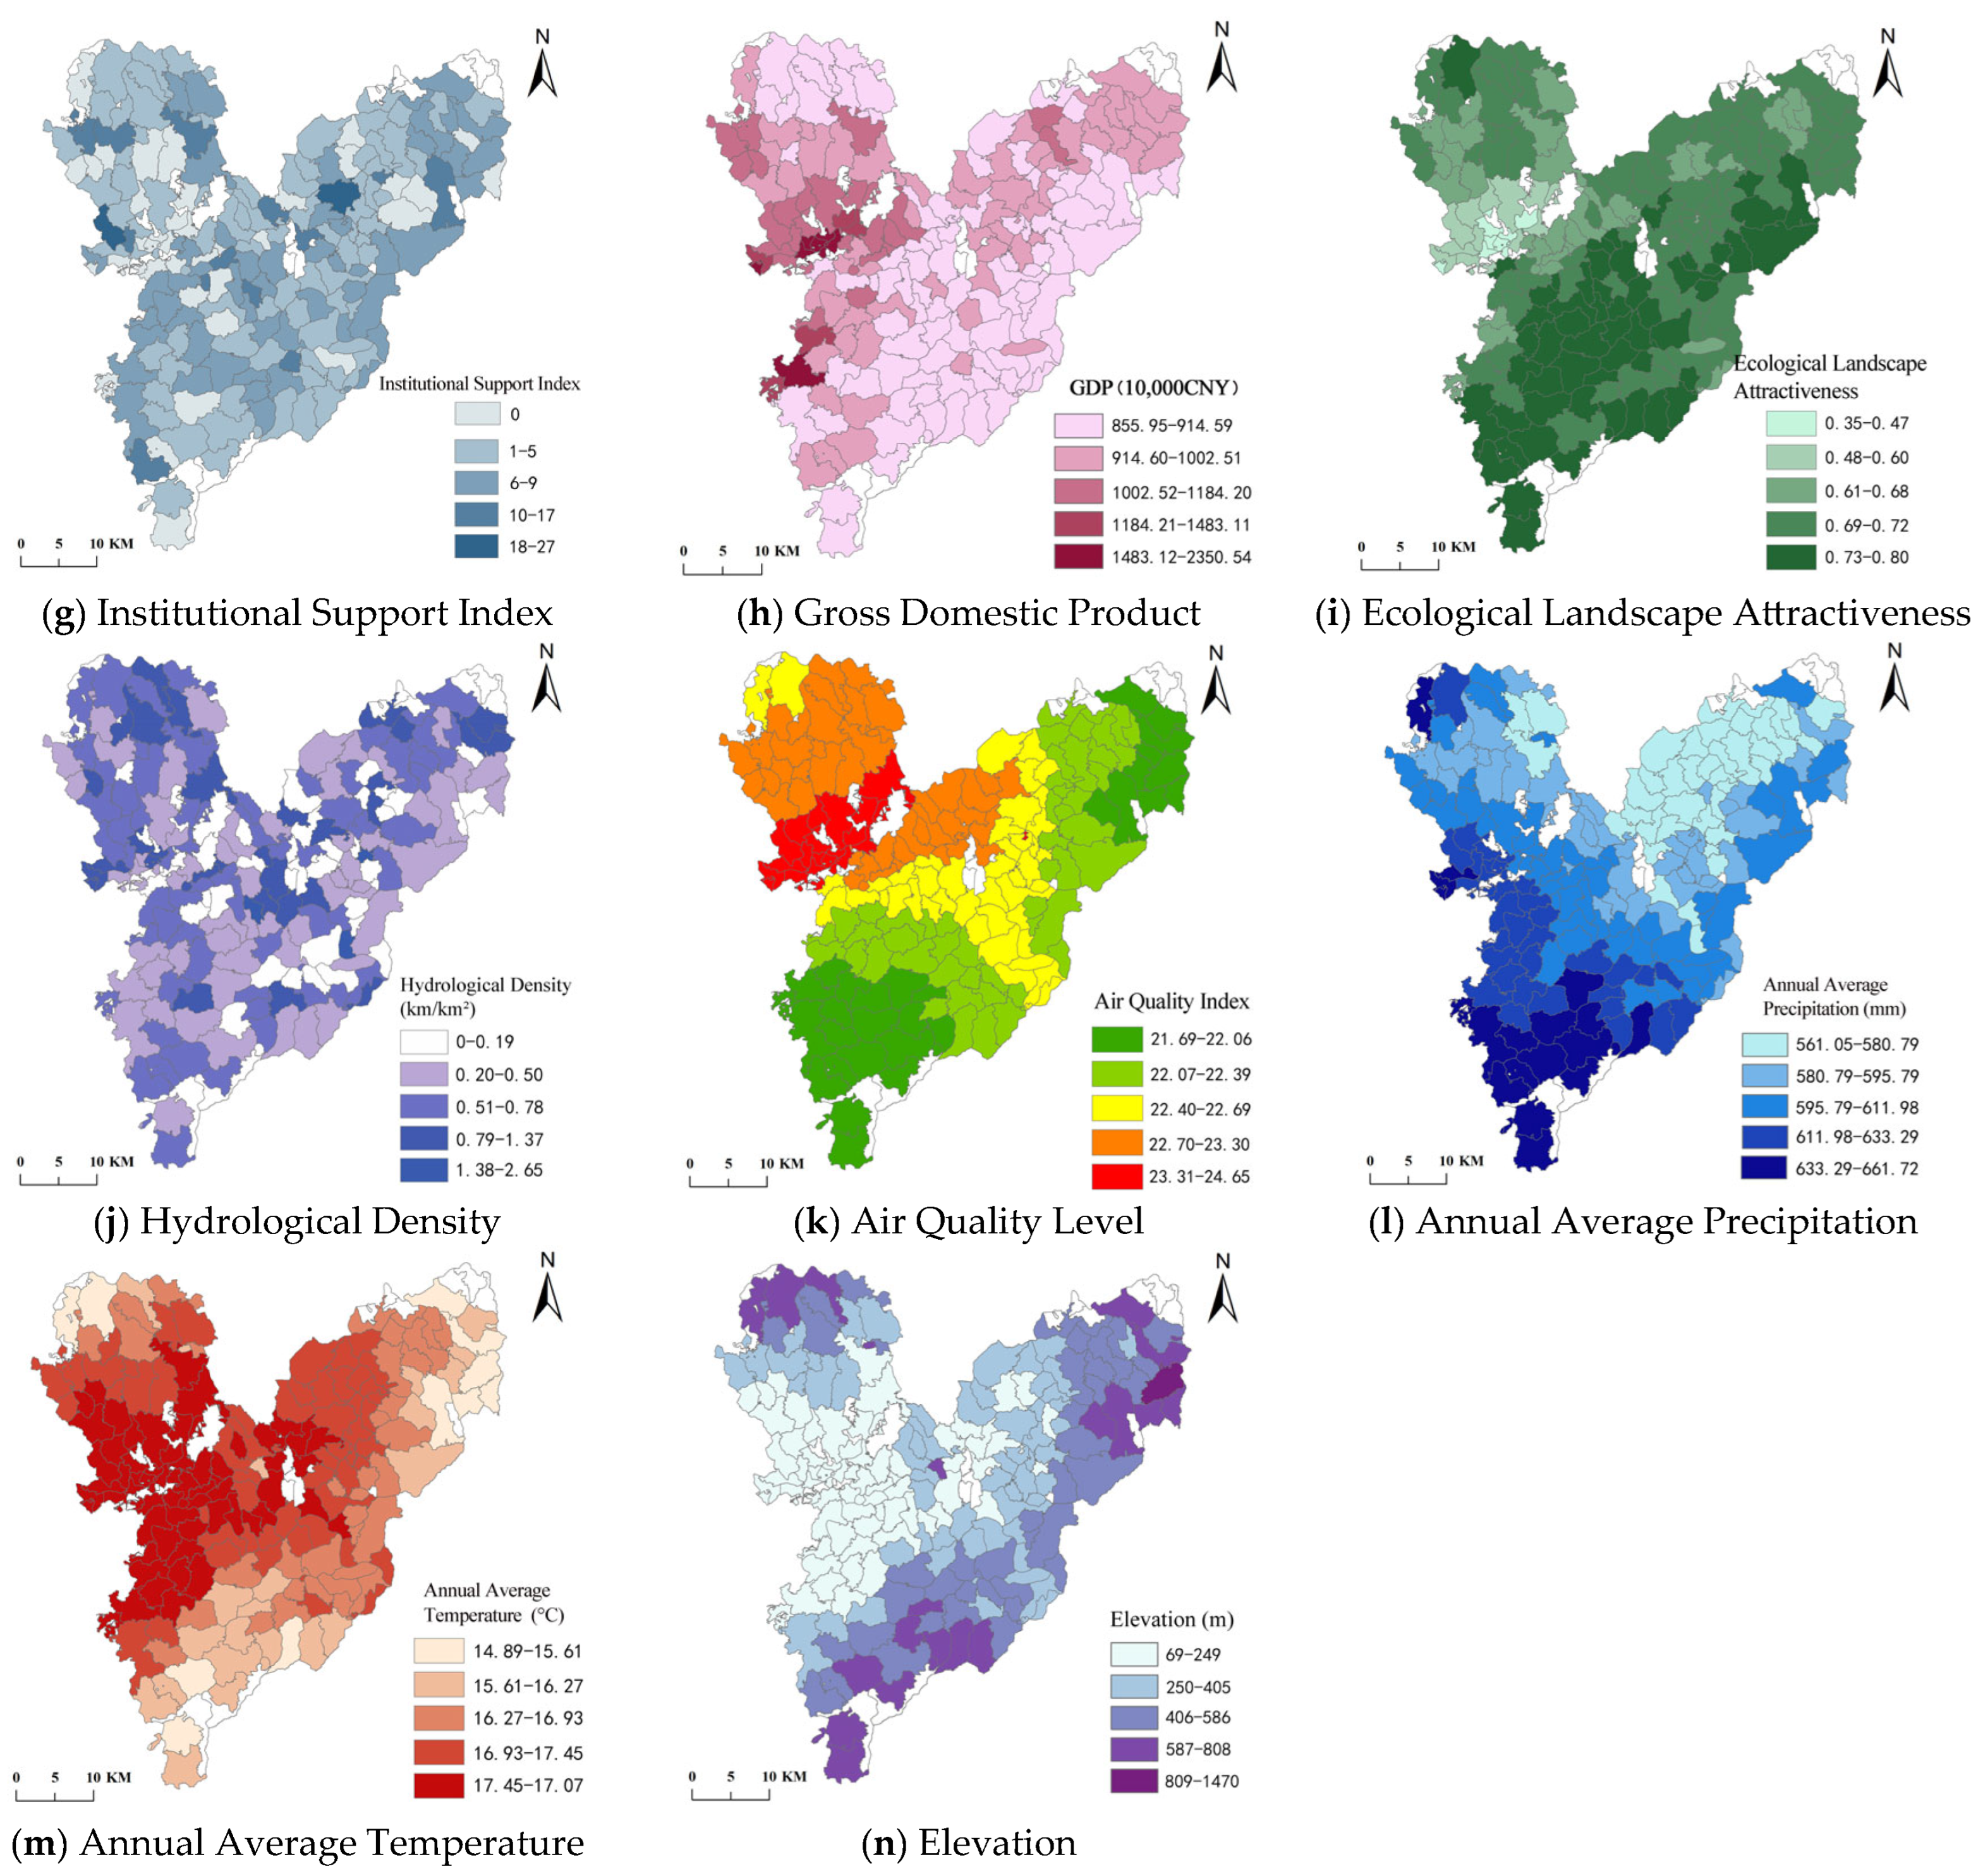
During the data processing stage, all spatial data were first unified into a consistent coordinate system using ArcGIS 10.2. Subsequently, village-level units within Shexian County were cleaned by removing non-research objects such as communities, residential committees, reservoirs, forest farms, and industrial areas. A total of 182 administrative villages were retained for analysis. Then, zonal statistics and spatial join methods were applied to extract indicator values for each village. All variables were standardized using the Z-score method in Python 3.9 to construct the feature dataset for model training (Figure 3). In addition, the sample labels in this study represent the relative tourism development readiness of traditional villages rather than their realized tourism performance. Considering the lack of standardized village-level tourism statistics, official recognitions and tourism-related designations were used as proxy indicators of latent tourism development capacity. These scores were constructed based on multiple official designations obtained by each village, including A-level tourist attractions, national/provincial traditional villages, historical and cultural villages, and beautiful countryside titles. Although some explanatory variables, such as cultural resources and institutional support, are conceptually related to parts of the label construction process, the dependent variable represents a composite evaluation of tourism development readiness rather than any single policy recognition outcome. Therefore, the modeling framework focuses on identifying broader developmental patterns and nonlinear associations instead of establishing strict causal relationships.

2.5.1. Cultural Resource Index

The cultural resource index reflects the core attractiveness of traditional villages. Higher-level cultural heritage has a stronger tourism appeal [31]. National-, provincial-, municipal-, and county-level heritage sites are assigned scores of 4, 3, 2, and 1, respectively.
C i = k = 1 4 ( N i k × W k )
where C i represents the cultural resource index of village i; N i k is the number of heritage sites of level k in village i; and W k denotes the assigned score for level k.

2.5.2. Land Resource Index

The land resource index measures the suitability of land use for tourism development [32]. Different land types are assigned scores as follows: forest land (5), grassland (4), water area (3), cultivated land (2), and construction land (1) [33].
L i = 100 × c = 1 5 ( S c × A i c A i )
where Aic represents the area of land type c in village i; A i is the total area of village i; and Sc is the score assigned to land type c.

2.5.3. Road Network Density

Road network density reflects the accessibility level of villages. Different road types are assigned weights: expressways (4), national roads (3), provincial roads (2), and ordinary roads (1).
D i = h = 1 m A h × L i h / C i
where L i h represents the length of road type h in village i; L i h is the weight of road type h; and Ci is the village area.

2.5.4. Water System Density

Water system density reflects the abundance of water resources within a village:
R i = L i / C i
where L i is the total length of water systems, and C i is the village area.

2.5.5. Policy Support Index

The policy support index quantifies the level of governmental support and official recognition [34].
G i = k = 1 4 ( w k × n i k )
where G i represents the policy support index of village i; w k is the number of titles at level k; and n i k is the assigned score.

2.5.6. Service Facilities

S F i = j = 1 n P O I i j
where S F i represents the service facilities index of village i, and P O I i j denotes the number of tourism-related service facility POIs within village i, including catering, accommodation, shopping, and tourism service facilities.

2.5.7. Transportation Facilities

T F i = j = 1 n T P O I i j
where T F i represents the transportation facilities index of village i, and T P O I i j denotes the number of transportation-related POIs within village i.

2.5.8. Online Attention

O A i = j = 1 n W B i j
where O A i represents the online attention index of village i, and W B i j denotes the number of tourism-related Weibo check-in records associated with village i.

2.5.9. Gross Domestic Product

G D P i = p = 1 m G D P p A i
where G D P i represents the GDP value of village i, G D P p denotes the GDP raster value of pixel p within village i, and A i represents the area of village i.

2.5.10. NDVI

N D V I i = p = 1 m N D V I p m
where N D V I i represents the mean NDVI value of village i, N D V I p denotes the NDVI raster value of pixel p, and m represents the total number of raster pixels within village i.

2.6. Machine Learning Models

Considering the nonlinear relationships, heterogeneous variables, and spatial heterogeneity characteristics of multi-source tourism data, tree-based ensemble learning models were selected because they can effectively capture complex interactions among variables without requiring strict statistical assumptions. To ensure methodological representativeness and comparability, this study selected three representative ensemble learning models—Random Forest (RF), XGBoost, and LightGBM—which correspond to different ensemble learning frameworks, including bagging-based learning and gradient boosting-based learning. By comparing these models under the same dataset and evaluation framework, this study aims to identify the most suitable algorithm for tourism development potential assessment in traditional villages. LightGBM is an efficient gradient boosting framework based on decision trees, featuring histogram-based optimization and a leaf-wise growth strategy [35]. It significantly improves training efficiency while maintaining high accuracy. Random Forest is an ensemble learning algorithm that constructs multiple decision trees and aggregates their predictions [36]. It is robust to noise and capable of estimating feature importance [37]. XGBoost is an optimized gradient boosting algorithm that incorporates regularization to control model complexity and improve generalization performance [38]. All models were implemented in Python 3.9. Hyperparameters were optimized using the Optuna framework based on Bayesian optimization, with the macro-averaged F1-score used as the objective function.

2.7. SHAP Explainable Method

SHAP (Shapley Additive Explanations) is an explainable machine learning method based on cooperative game theory [39]. It quantifies each feature’s contribution to model predictions by computing Shapley values. By analyzing global feature importance and local sample-level contributions, SHAP enables the interpretation of the direction and magnitude of each factor’s effect, thereby enhancing model transparency and reliability [40].

2.8. Model Evaluation

Model performance was evaluated using six metrics: confusion matrix, accuracy, precision, recall, F1-score, and the area under the ROC curve (AUC). To mitigate the influence of class imbalance, macro-averaging was adopted. The dataset was initially divided into training and testing sets at a ratio of 7:3. To further improve model robustness and reduce the uncertainty caused by random data partitioning, five-fold cross-validation was additionally conducted during model evaluation. The average values of accuracy, precision, recall, F1-score, and AUC across the validation folds were used to assess model stability and generalization performance. The optimal model was selected based on the comprehensive performance across precision, recall, F1-score, AUC, and classification balance.

3. Results

3.1. Correlation Analysis of Evaluation Indicators

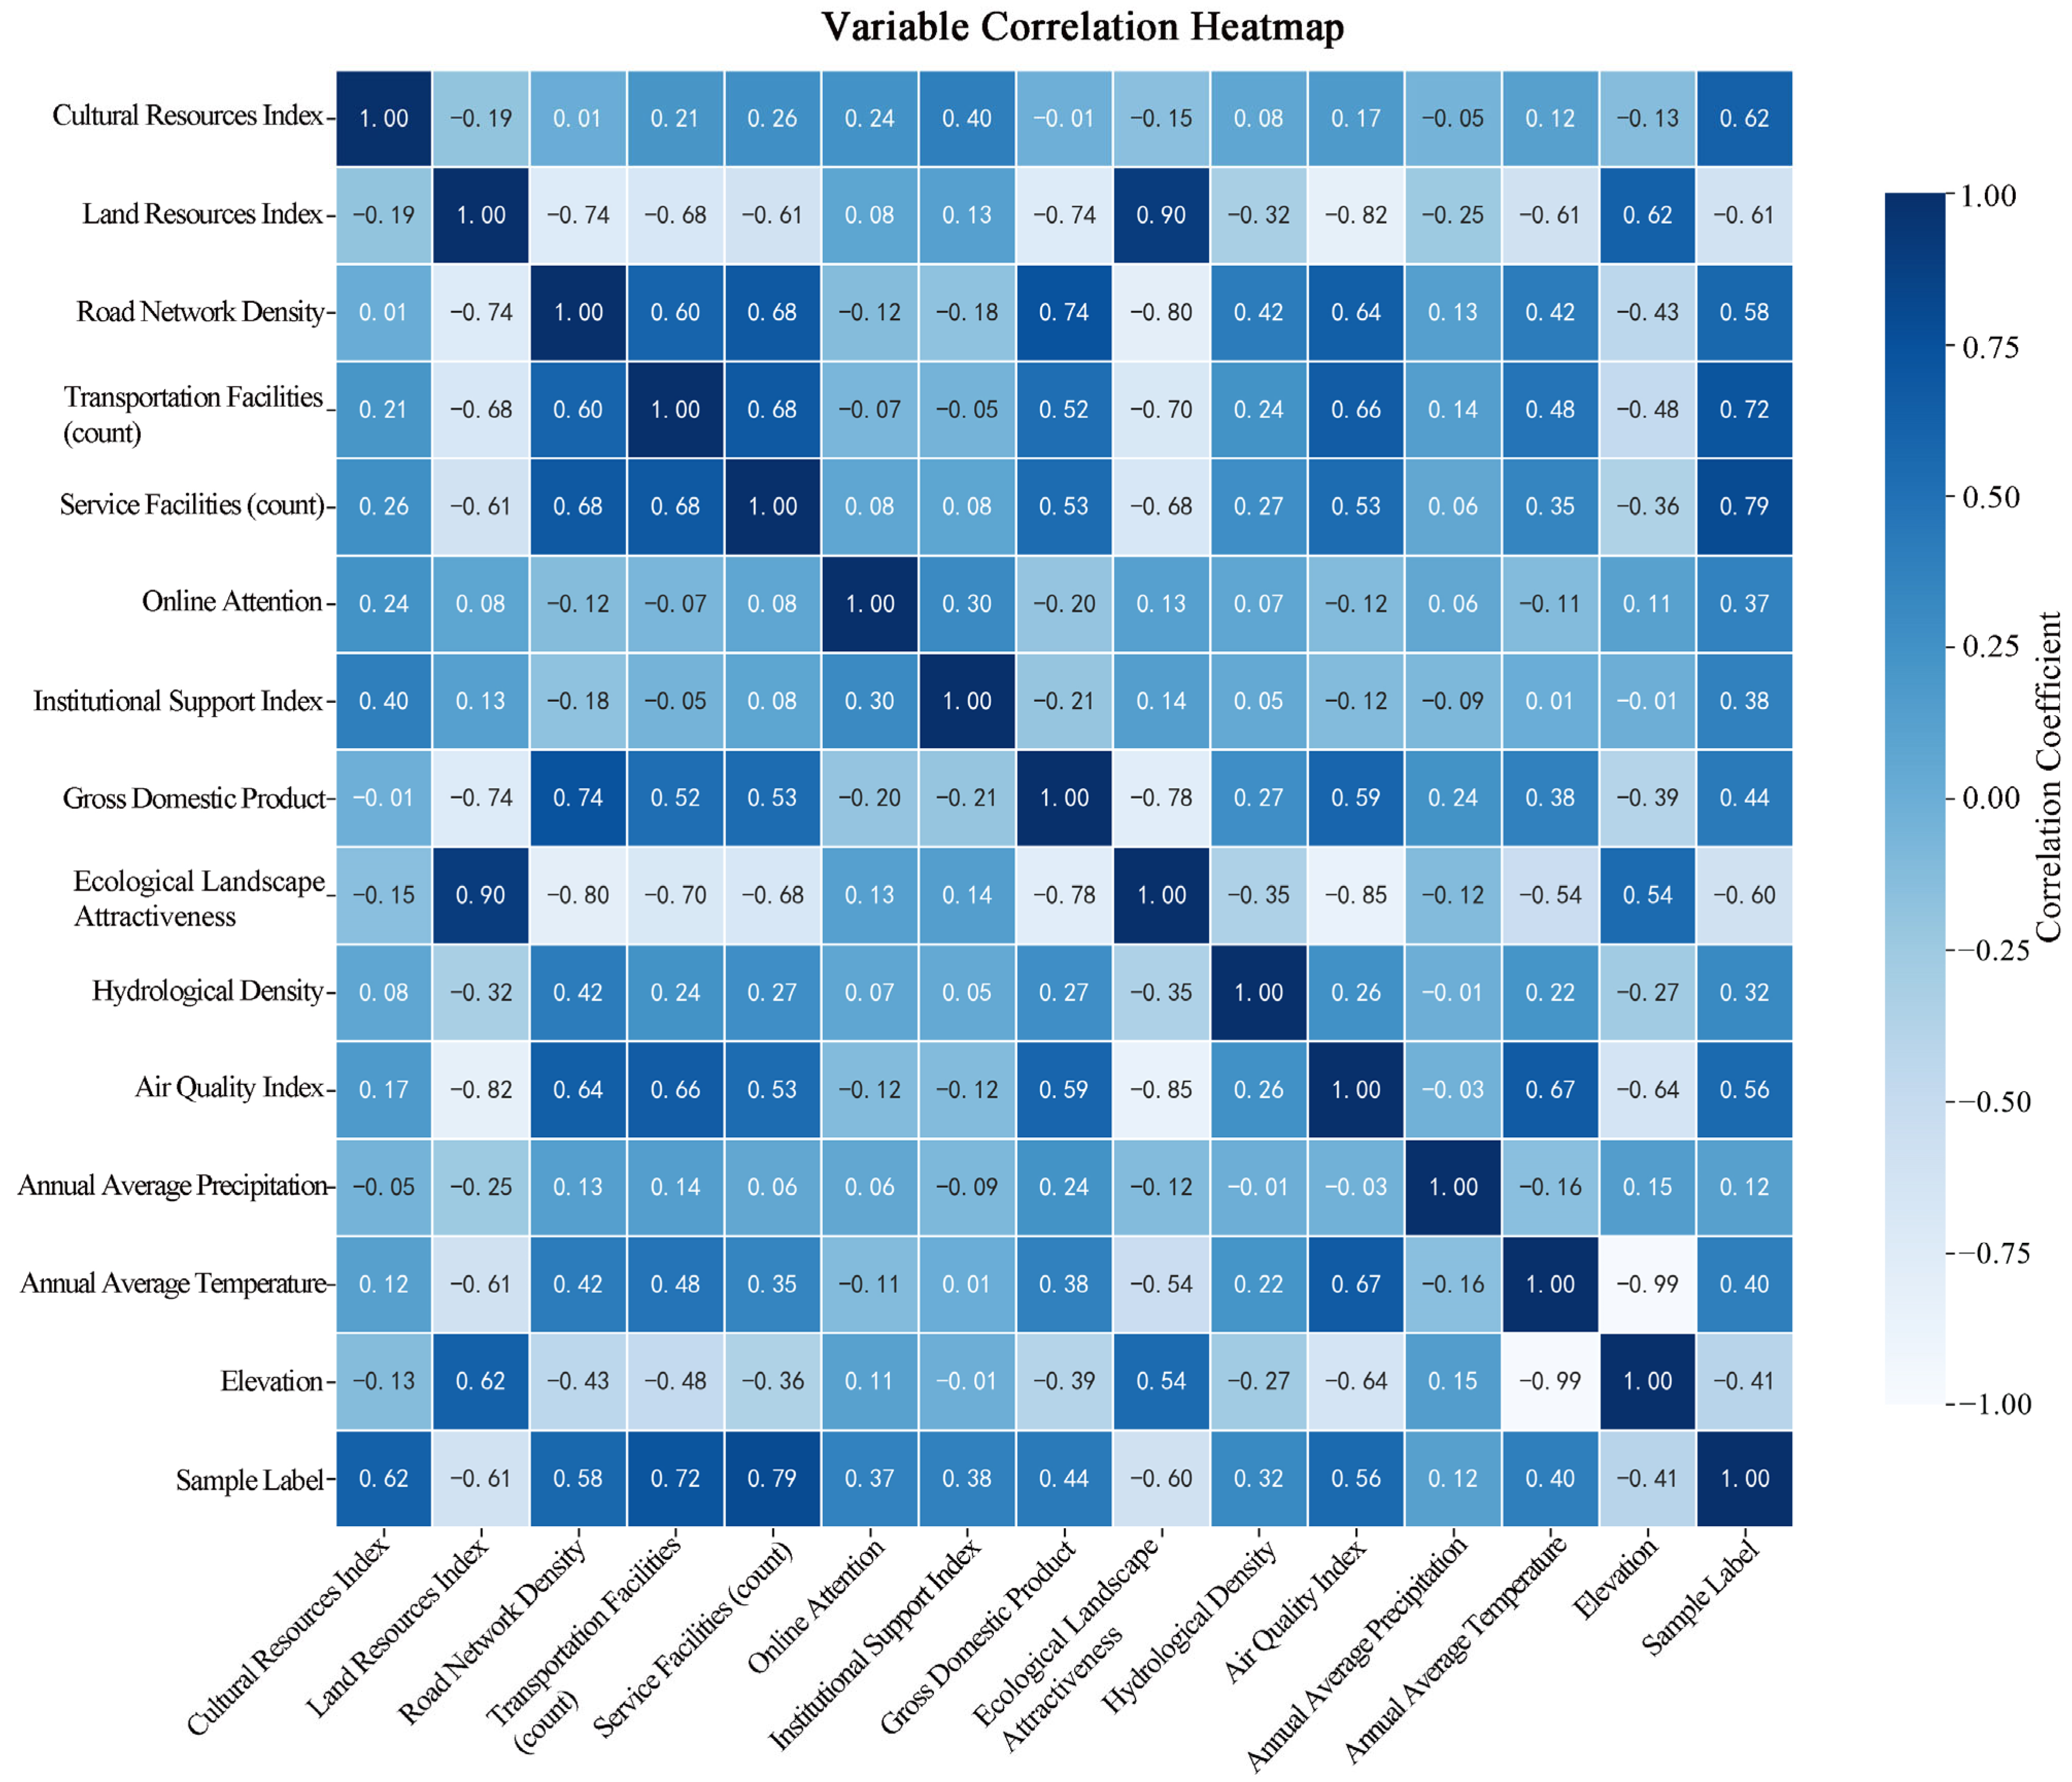
To examine the relationships between evaluation indicators and tourism development potential, Pearson correlation analysis was conducted (Figure 4). The results show that the absolute values of correlation coefficients between most indicators and the target variable range from 0.3 to 0.8. Among them, service facilities (r = 0.79), transportation facilities (r = 0.72), and the cultural resource index (r = 0.62) exhibit significant positive correlations with tourism development potential. In contrast, NDVI (r = −0.60) and elevation (r = −0.41) show significant negative correlations, indicating that the indicator system effectively captures the driving factors and the constraints on tourism development. Meanwhile, the absolute values of the correlation coefficients between most features are below 0.8, suggesting no severe multicollinearity between the variables. Overall, the indicator system demonstrates good discriminative capability and satisfies the independence assumption required for machine learning modeling.

3.2. Model Performance Comparison

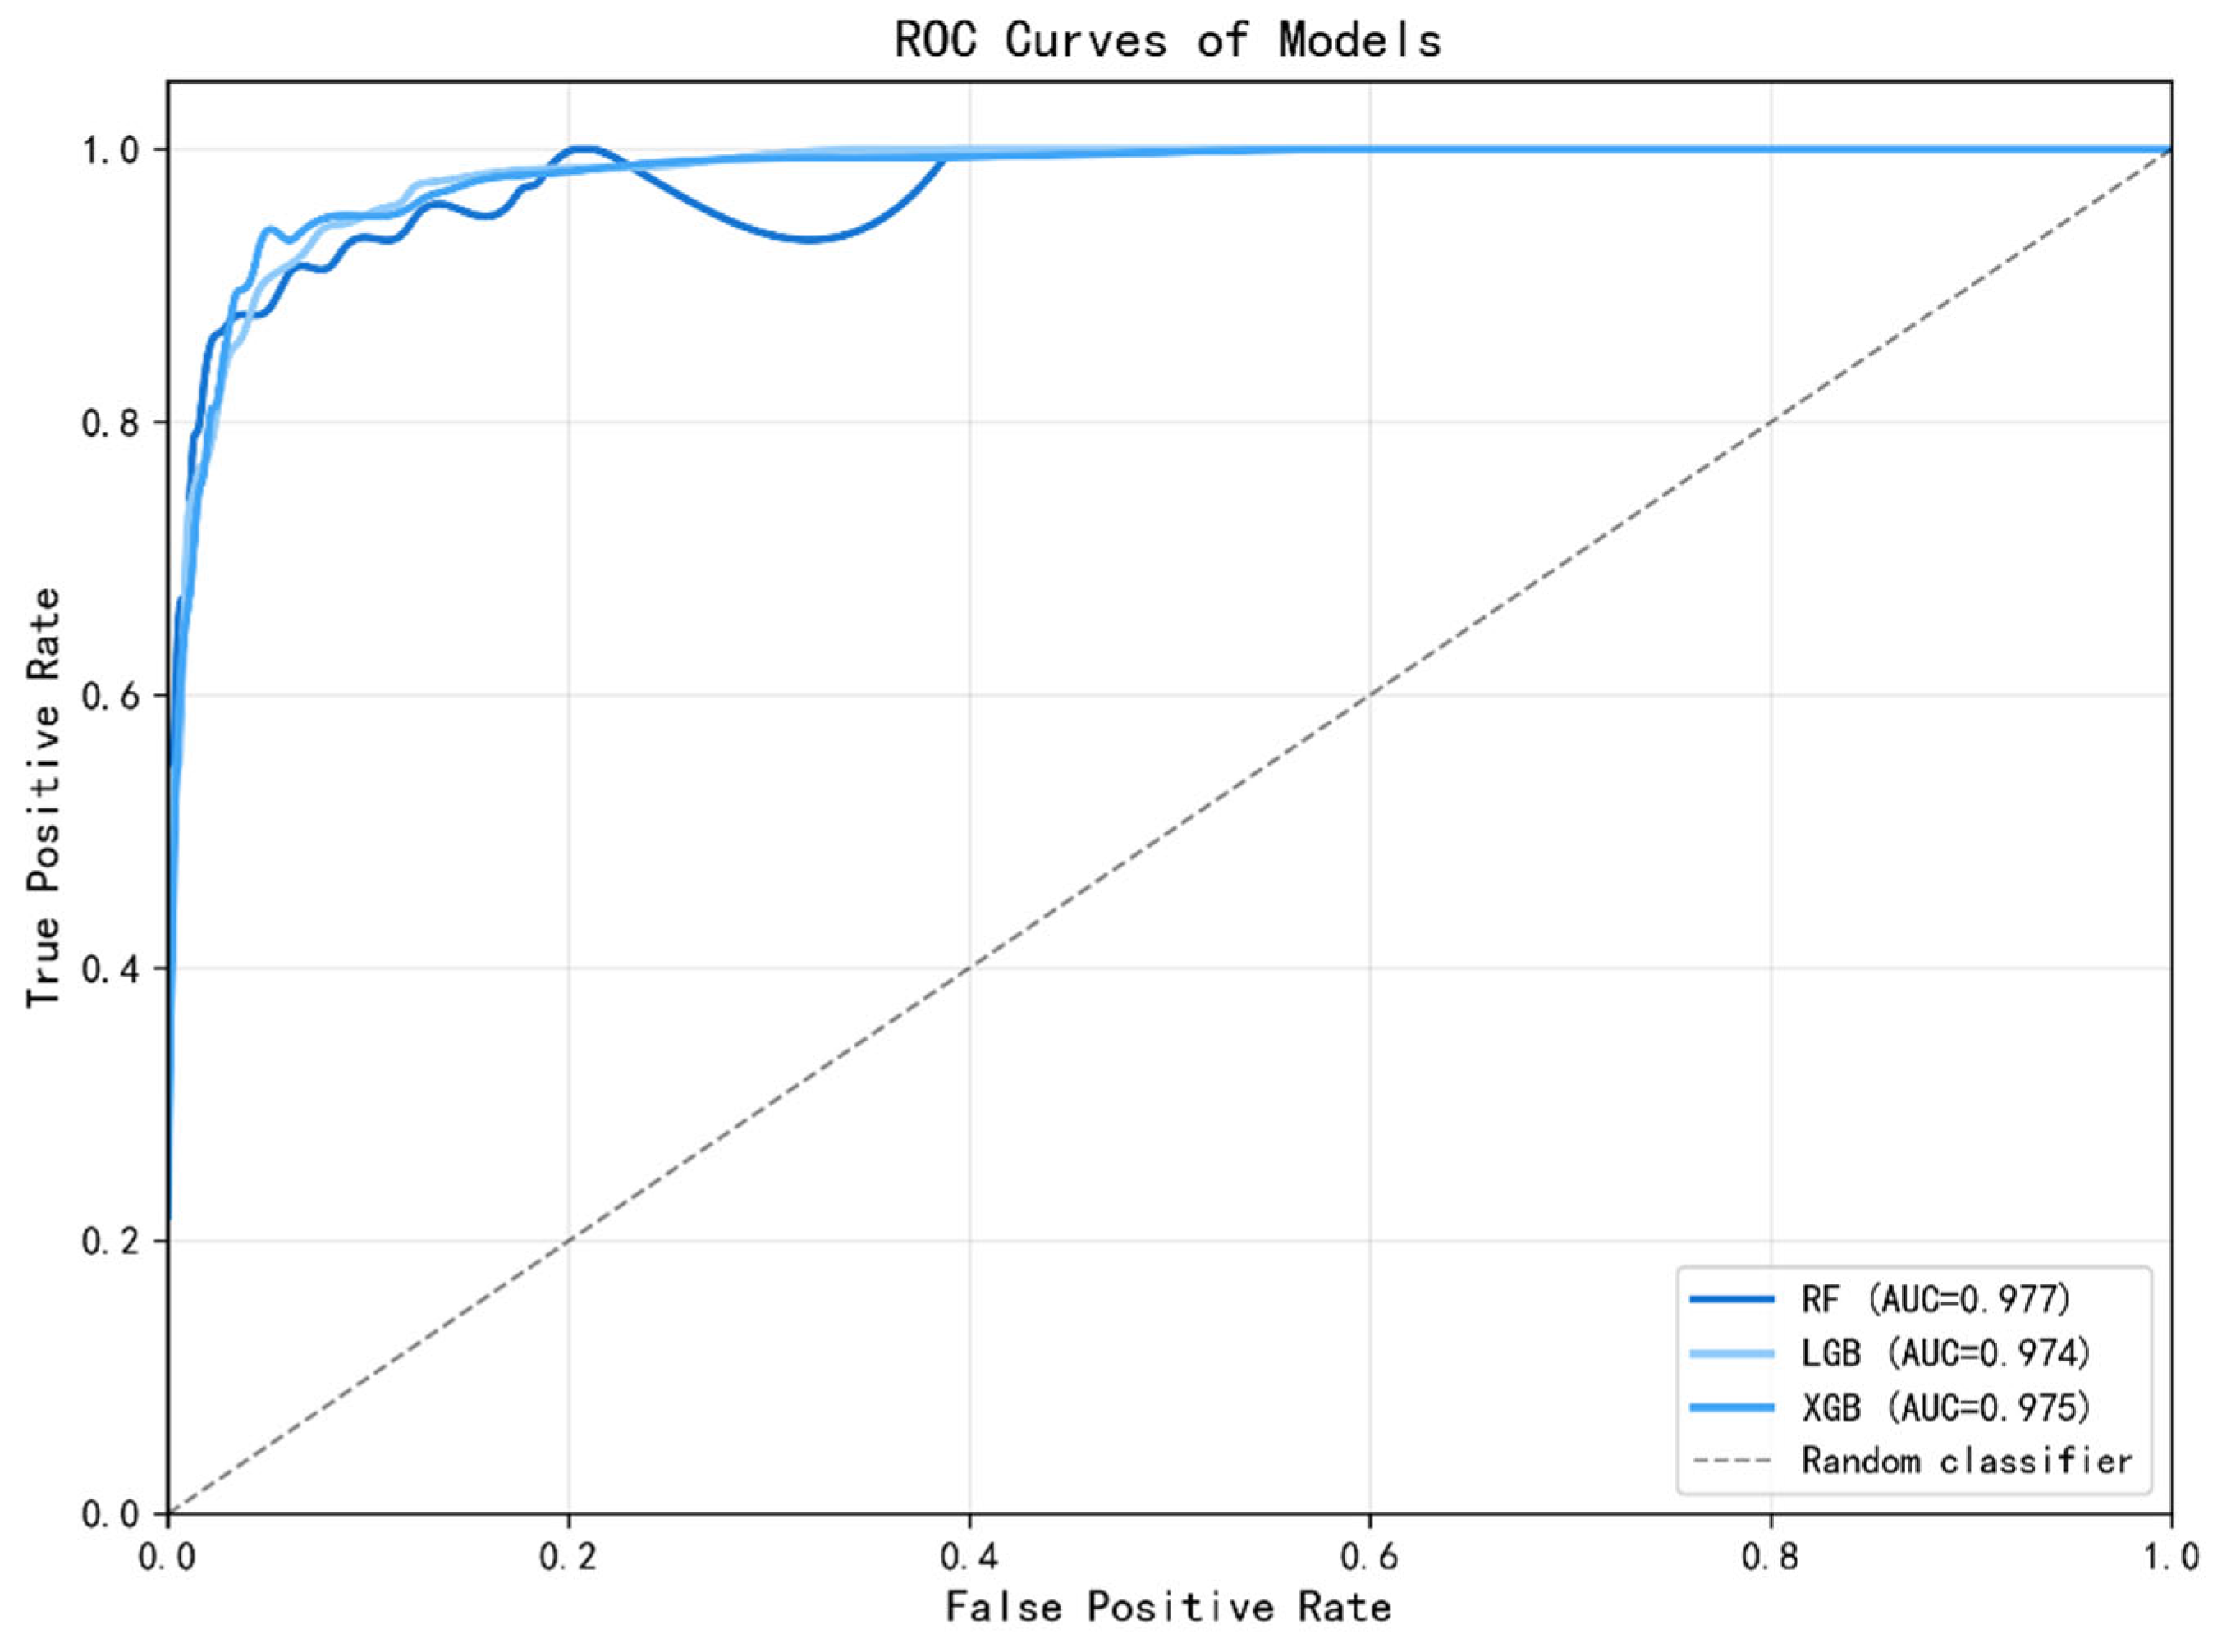
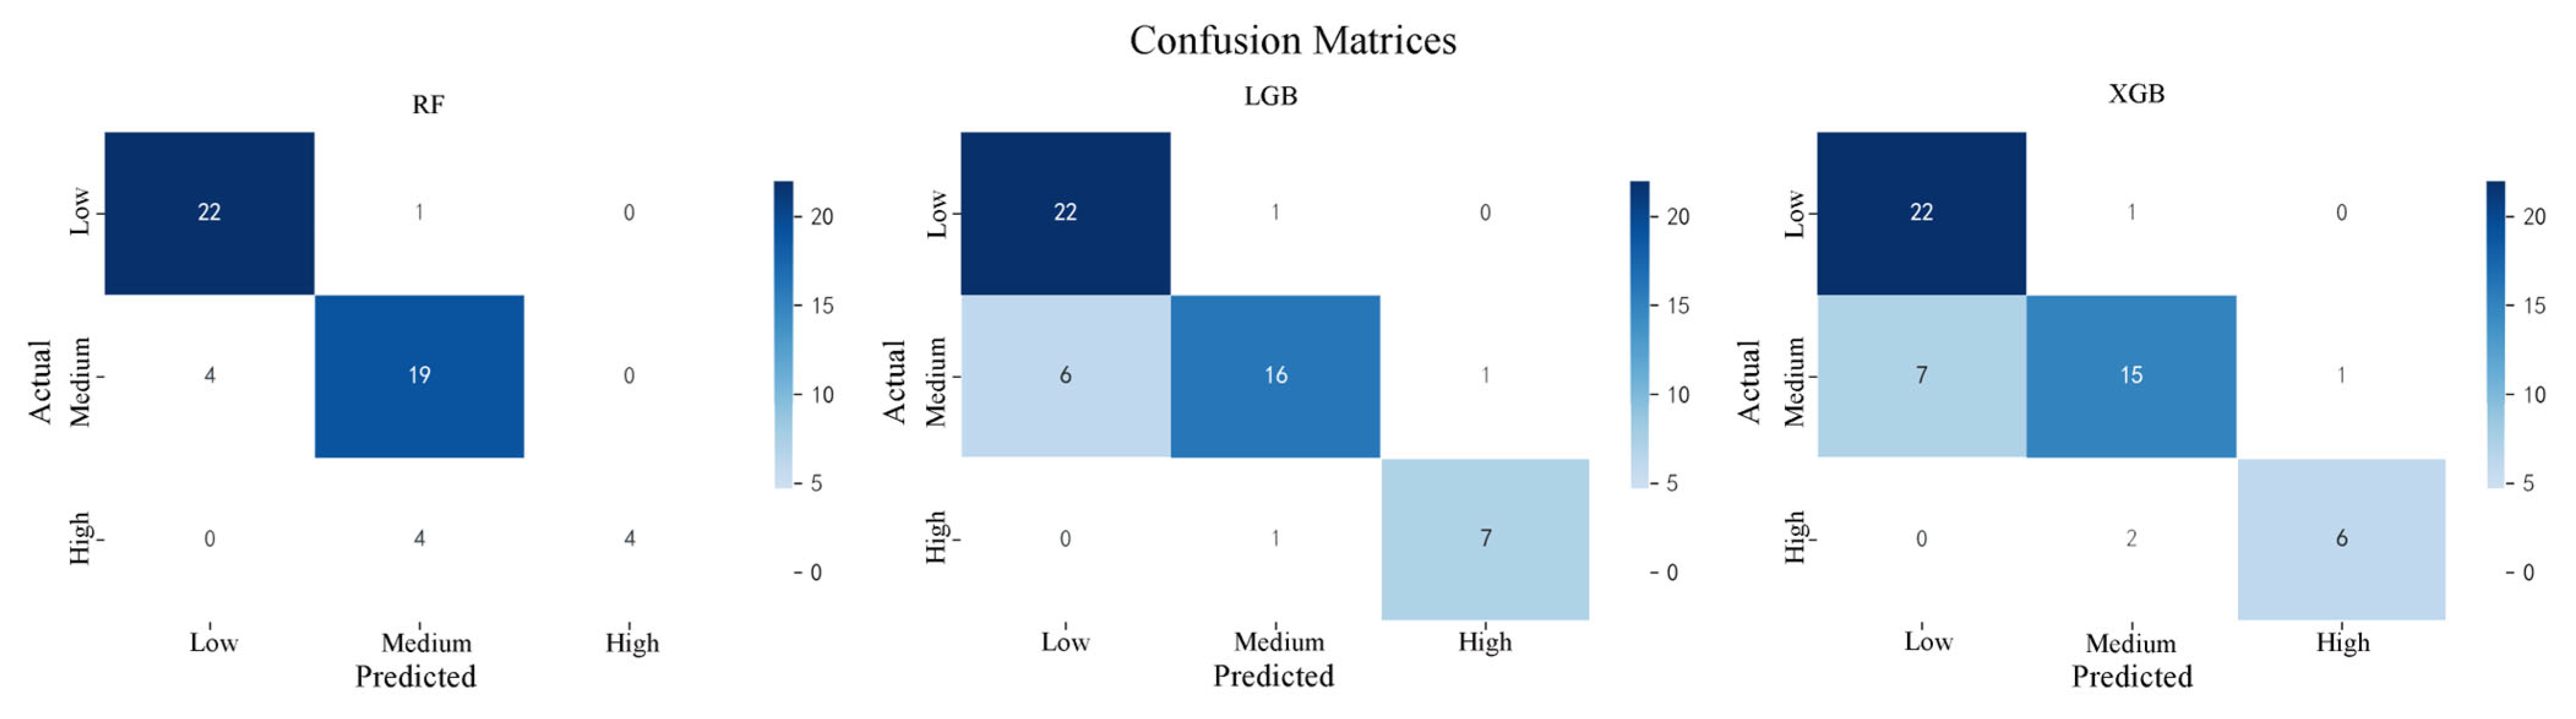
Model performance was evaluated using multiple metrics, including the confusion matrix, accuracy, precision, recall, F1-score, and AUC (Figure 5 and Figure 6 and Table 2). The dataset was split into training and testing sets at a ratio of 7:3, and the optimized hyperparameter settings obtained from the Optuna framework were applied to model training. From the ROC curves and AUC values, all three models demonstrate strong classification performance. The LightGBM model achieved the highest AUC value (0.975), slightly outperforming RF (0.953) and XGBoost (0.962), indicating superior overall classification capability. Further analysis of the confusion matrices reveals that all three models perform well at identifying low-potential villages, but differ in classifying medium- and high-potential villages. Specifically, the RF model shows relatively higher accuracy for medium-potential villages but tends to misclassify high-potential samples. In contrast, the LightGBM model exhibits more balanced performance across all categories, particularly showing better accuracy in identifying high-potential villages. The performance of XGBoost lies between the two. Although the RF model demonstrated relatively strong precision performance, the LightGBM model achieved better balance across recall, F1-score, and AUC metrics, particularly in identifying medium- and high-potential villages. Therefore, considering both predictive robustness and classification balance, LightGBM was selected as the optimal model for subsequent SHAP interpretation analysis.
The superior performance of LightGBM Is closely related to the characteristics of the evaluation indicators used in this study. The indicator system integrates multi-source heterogeneous variables, including POI data, social media data, policy information, and raster environmental datasets, which exhibit strong nonlinear relationships and spatial heterogeneity. Compared with RF, LightGBM adopts a gradient boosting framework with a leaf-wise tree growth strategy, enabling it to better capture threshold effects and interaction relationships among variables [41]. In addition, its histogram-based splitting algorithm improves the efficiency and stability of handling heterogeneous variables with different scales and distributions. Similar findings have been reported in previous studies, which demonstrated that LightGBM performs well in nonlinear geographic prediction and spatial analysis problems [42]. Therefore, considering both predictive performance and interpretability, the LightGBM model was selected for subsequent SHAP-based mechanism analysis. In addition, five-fold cross-validation results showed that the LightGBM model maintained relatively stable performance across different validation folds, with only minor fluctuations in F1-score and AUC values. This further demonstrates the robustness and generalization capability of the proposed framework under limited sample conditions.

3.3. Spatial Pattern of Tourism Development Potential

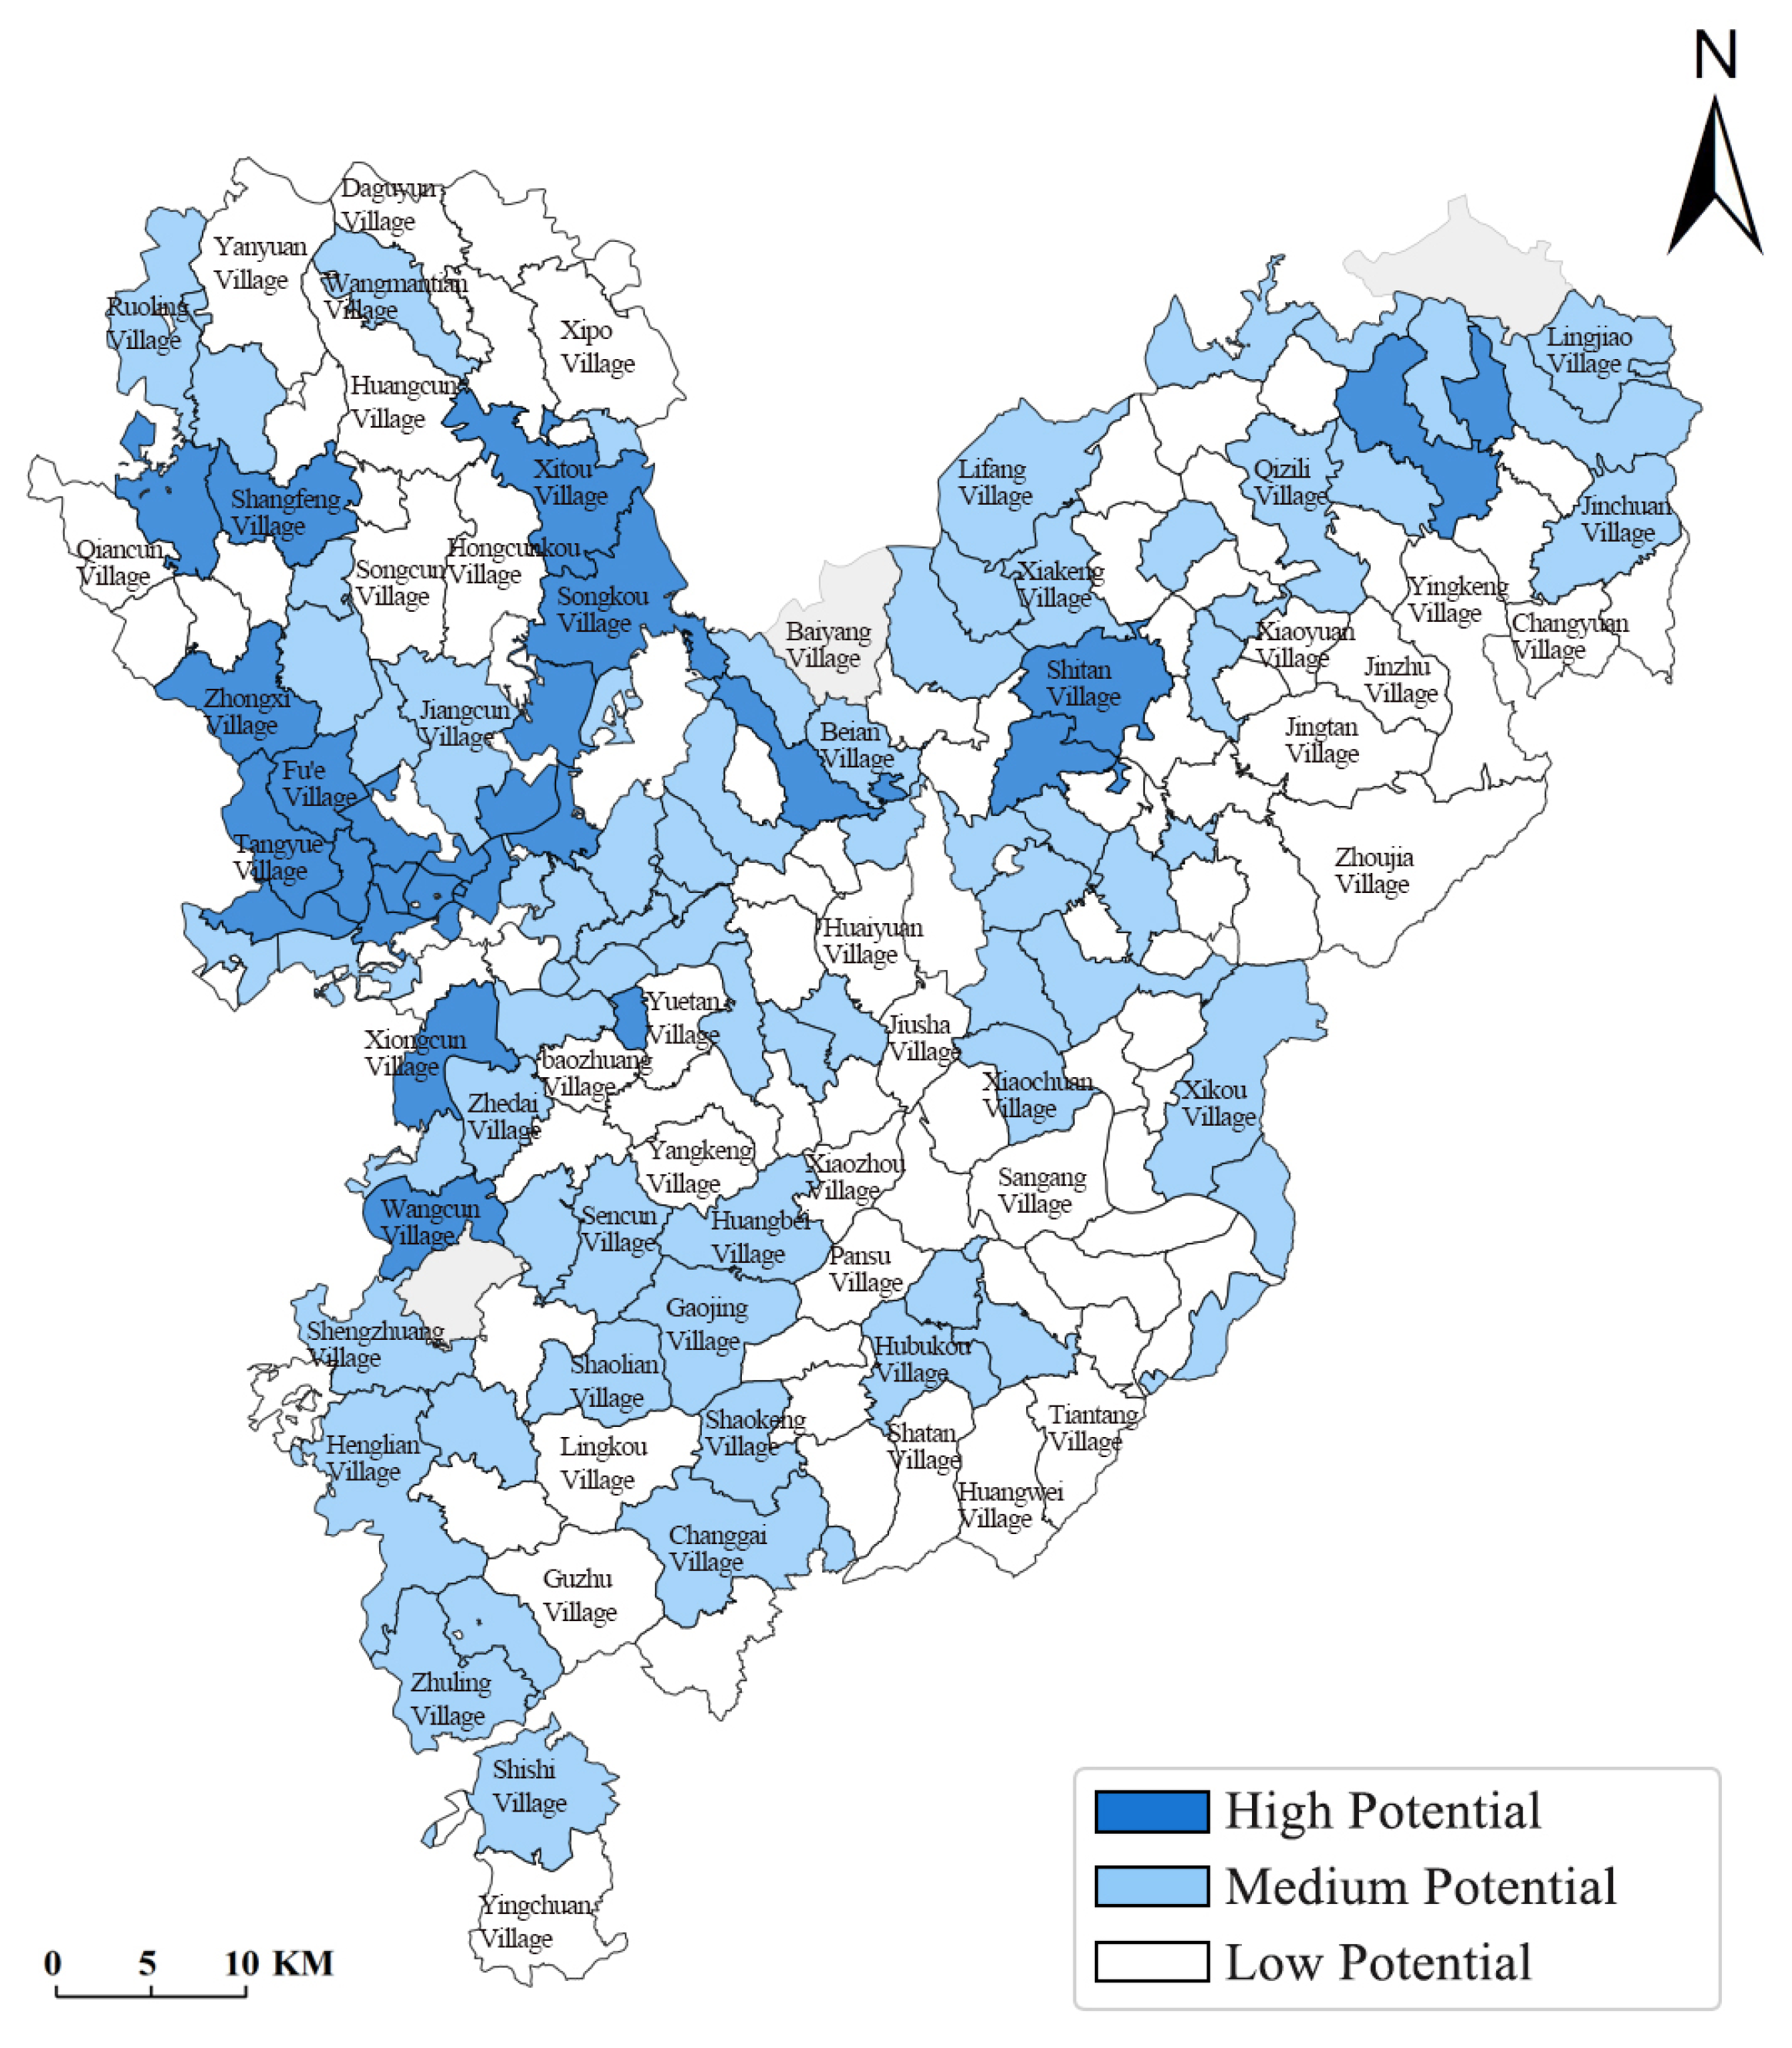
Based on the results of the LightGBM model, the spatial distribution of tourism development potential in traditional villages of Shexian County exhibits a clear pattern of “dual-core agglomeration–gradient transition–peripheral dispersion” (Figure 7).
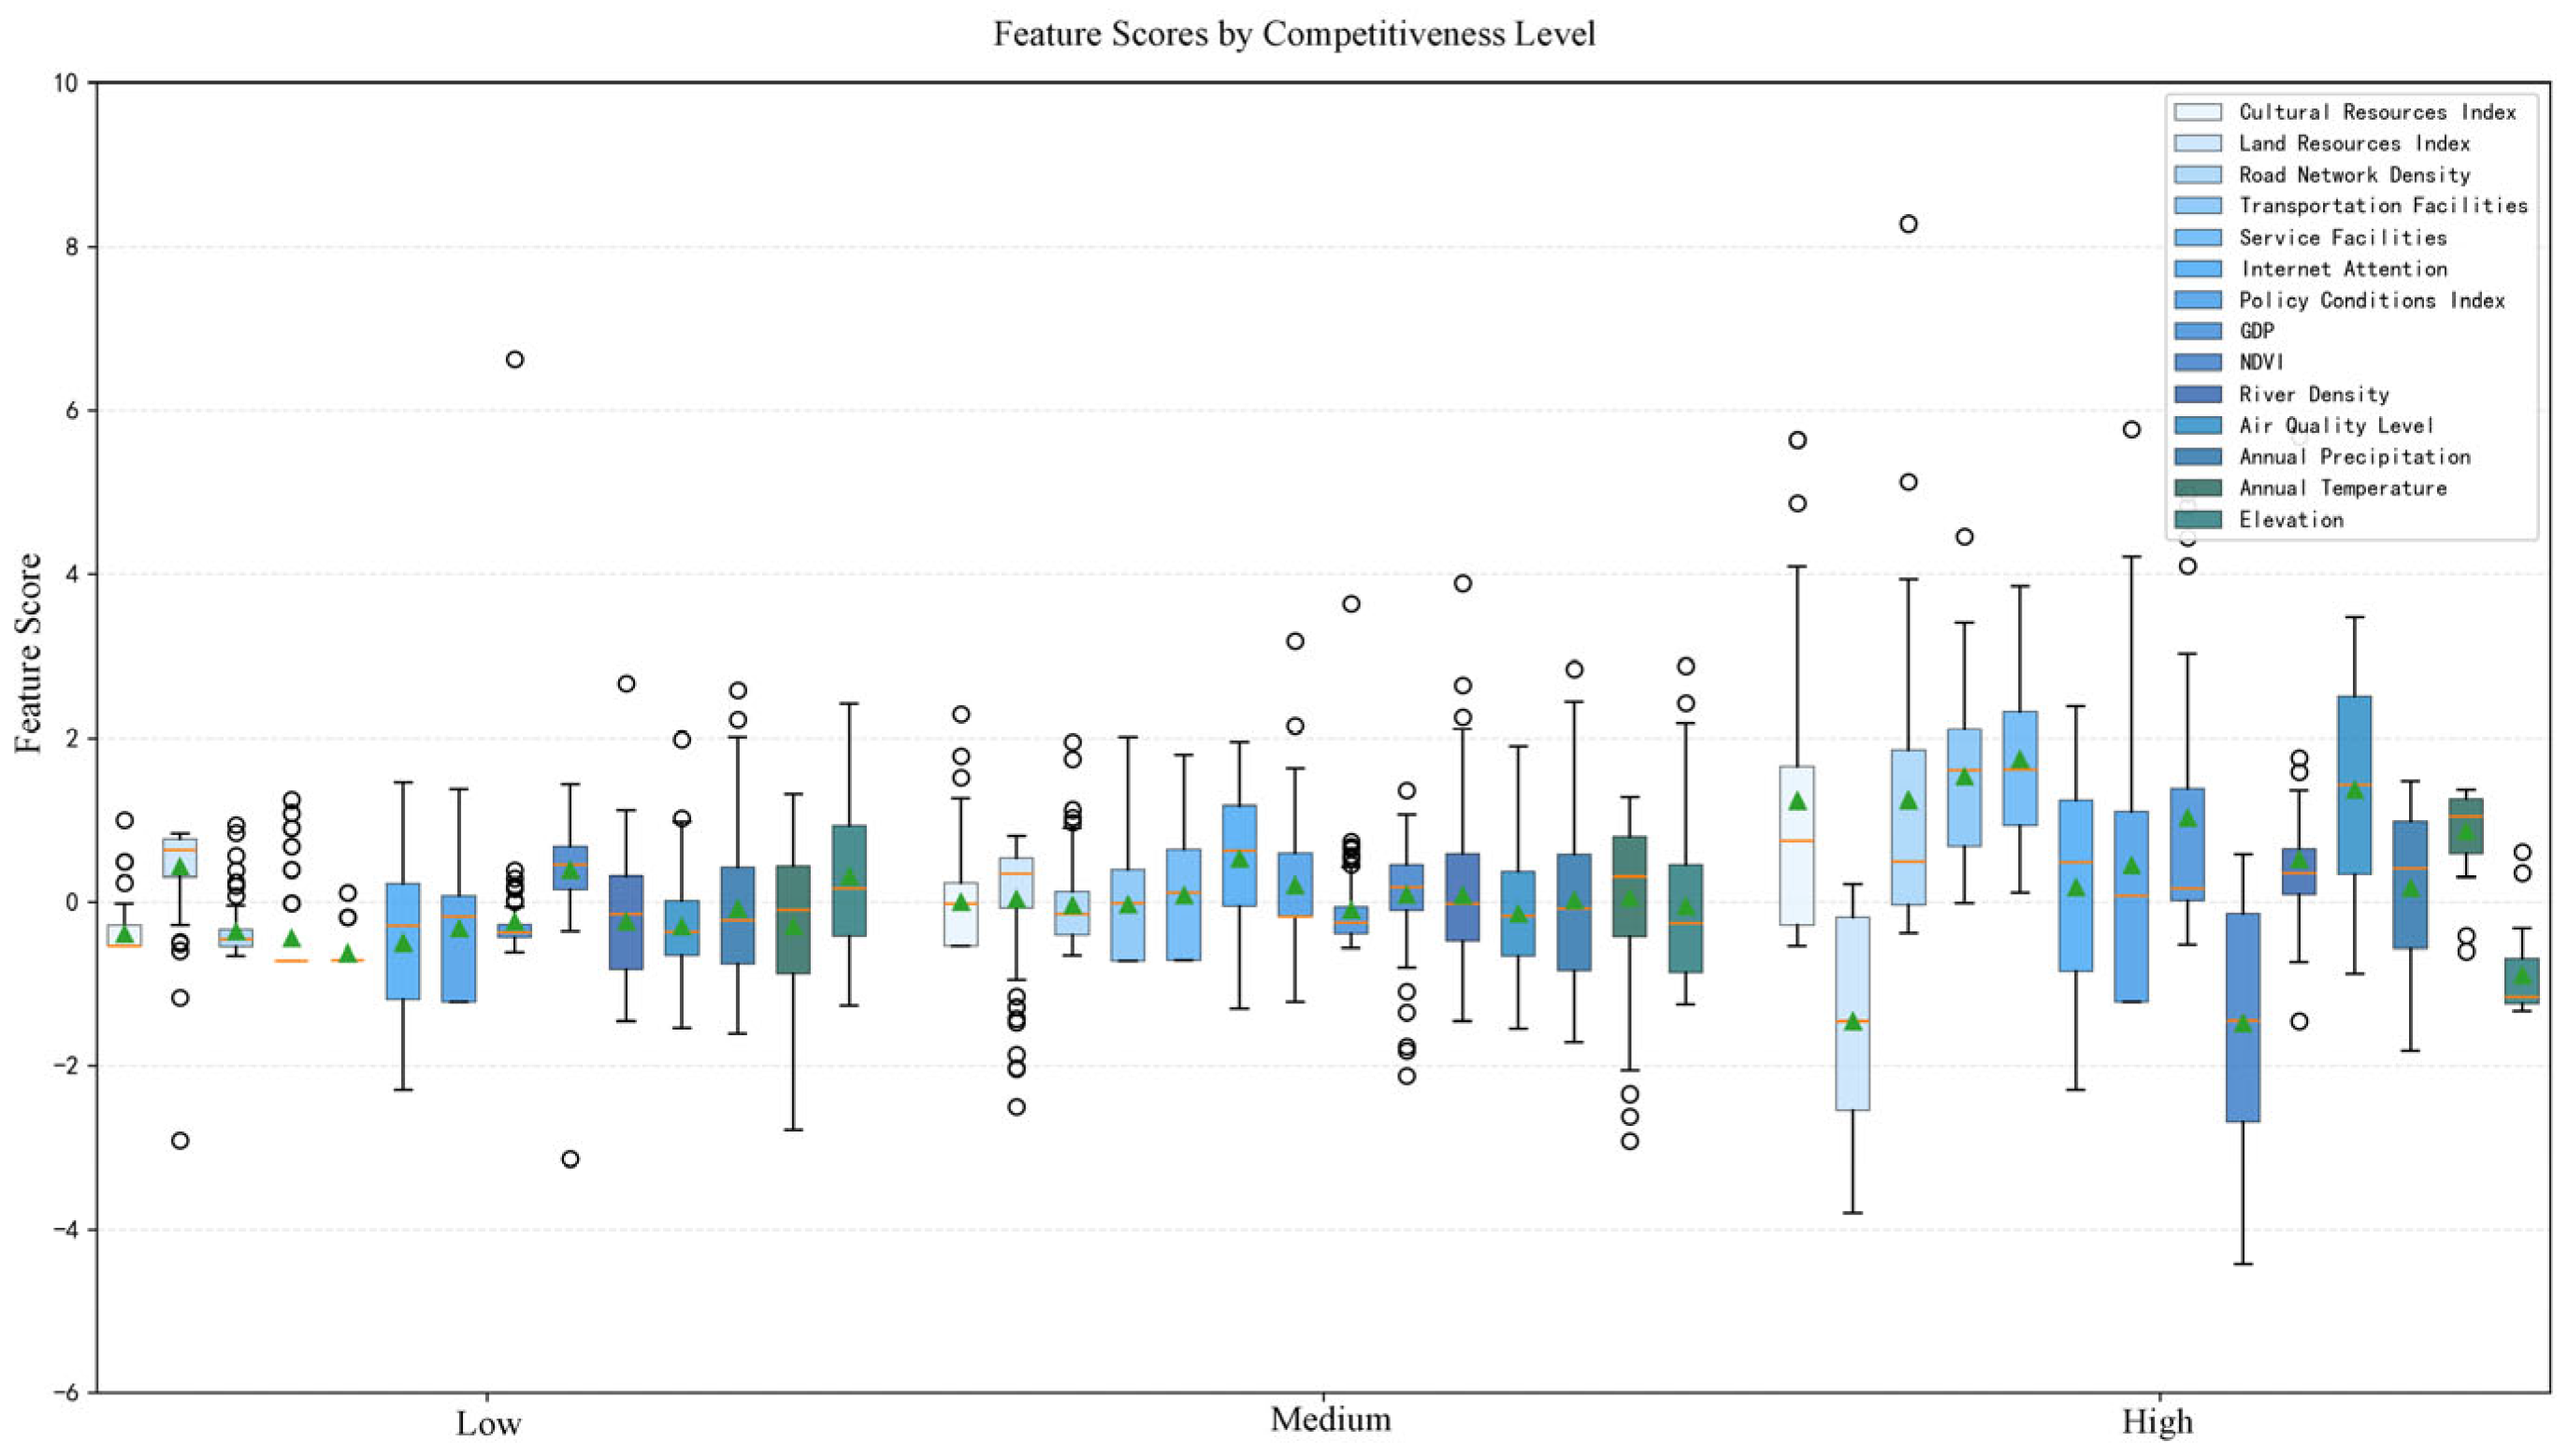
High-potential villages are mainly concentrated in the western valley areas and the Xin’an River basin in the east, forming two prominent core zones. As shown in Figure 7, the northwestern cluster demonstrates strong spatial continuity and accessibility conditions, making it suitable for integrated tourism corridor development. Based on the principle of spatial proximity and resource complementarity, this area could be further integrated into a thematic tourism circuit connecting multiple traditional villages and cultural heritage sites. The western core area, represented by villages such as Shangfeng and Songkou, benefits from favorable transportation links, abundant Huizhou architectural resources, and relatively well-developed tourism service facilities. These advantages enable the area to effectively accommodate tourist flows. The eastern core area is primarily distributed along the tributaries of the Xin’an River, with Zhuangchuan and Gaofeng villages representing it. This region combines cultural and ecological landscape advantages, offering strong potential for tourism development. Medium-potential villages are mainly located in transitional zones between the two core areas. These villages typically possess certain cultural resources or transportation advantages but are constrained by insufficient service facilities or land resources, resulting in moderate development potential. Low-potential villages are scattered in mountainous areas in the southern and southwestern parts of Shexian County. These areas are characterized by poor accessibility, limited cultural resources, and underdeveloped tourism infrastructure, resulting in relatively low development potential.To further examine the differences in indicator characteristics among villages with different tourism development potential levels, the distribution of indicator scores for low-, medium-, and high-potential villages is presented in Figure 8.

3.4. Feature Importance Analysis

3.4.1. Feature Importance Ranking

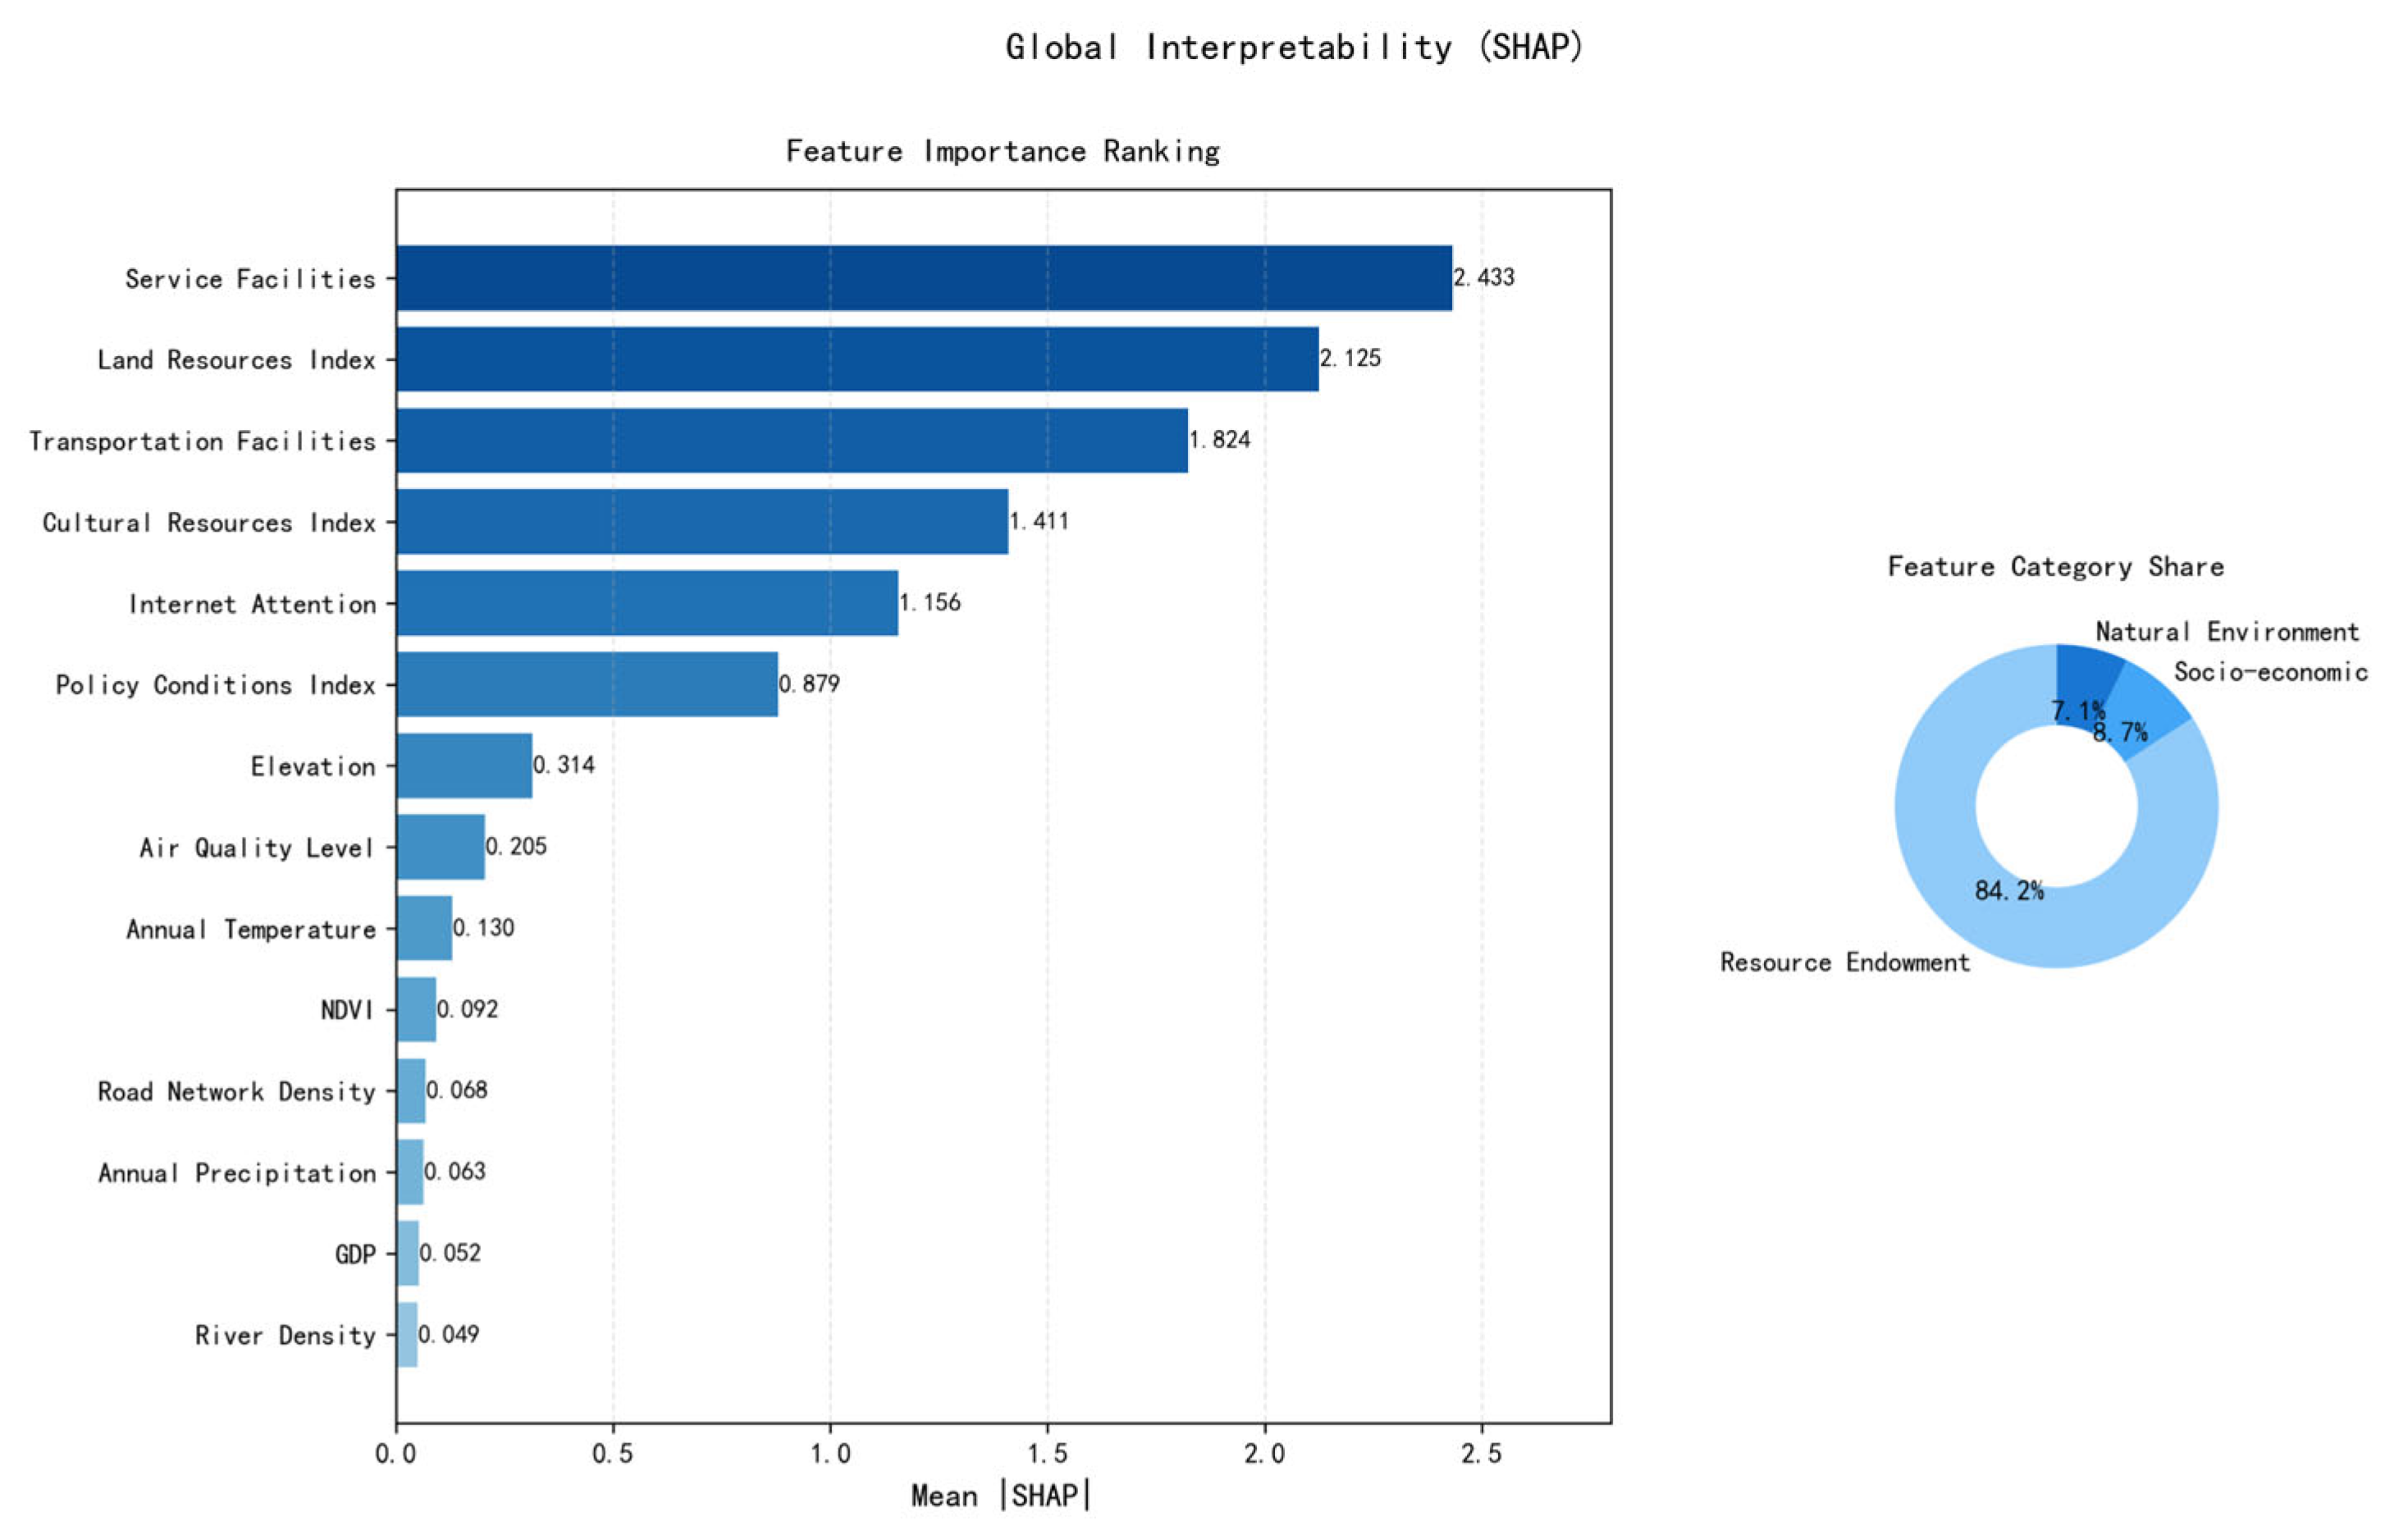
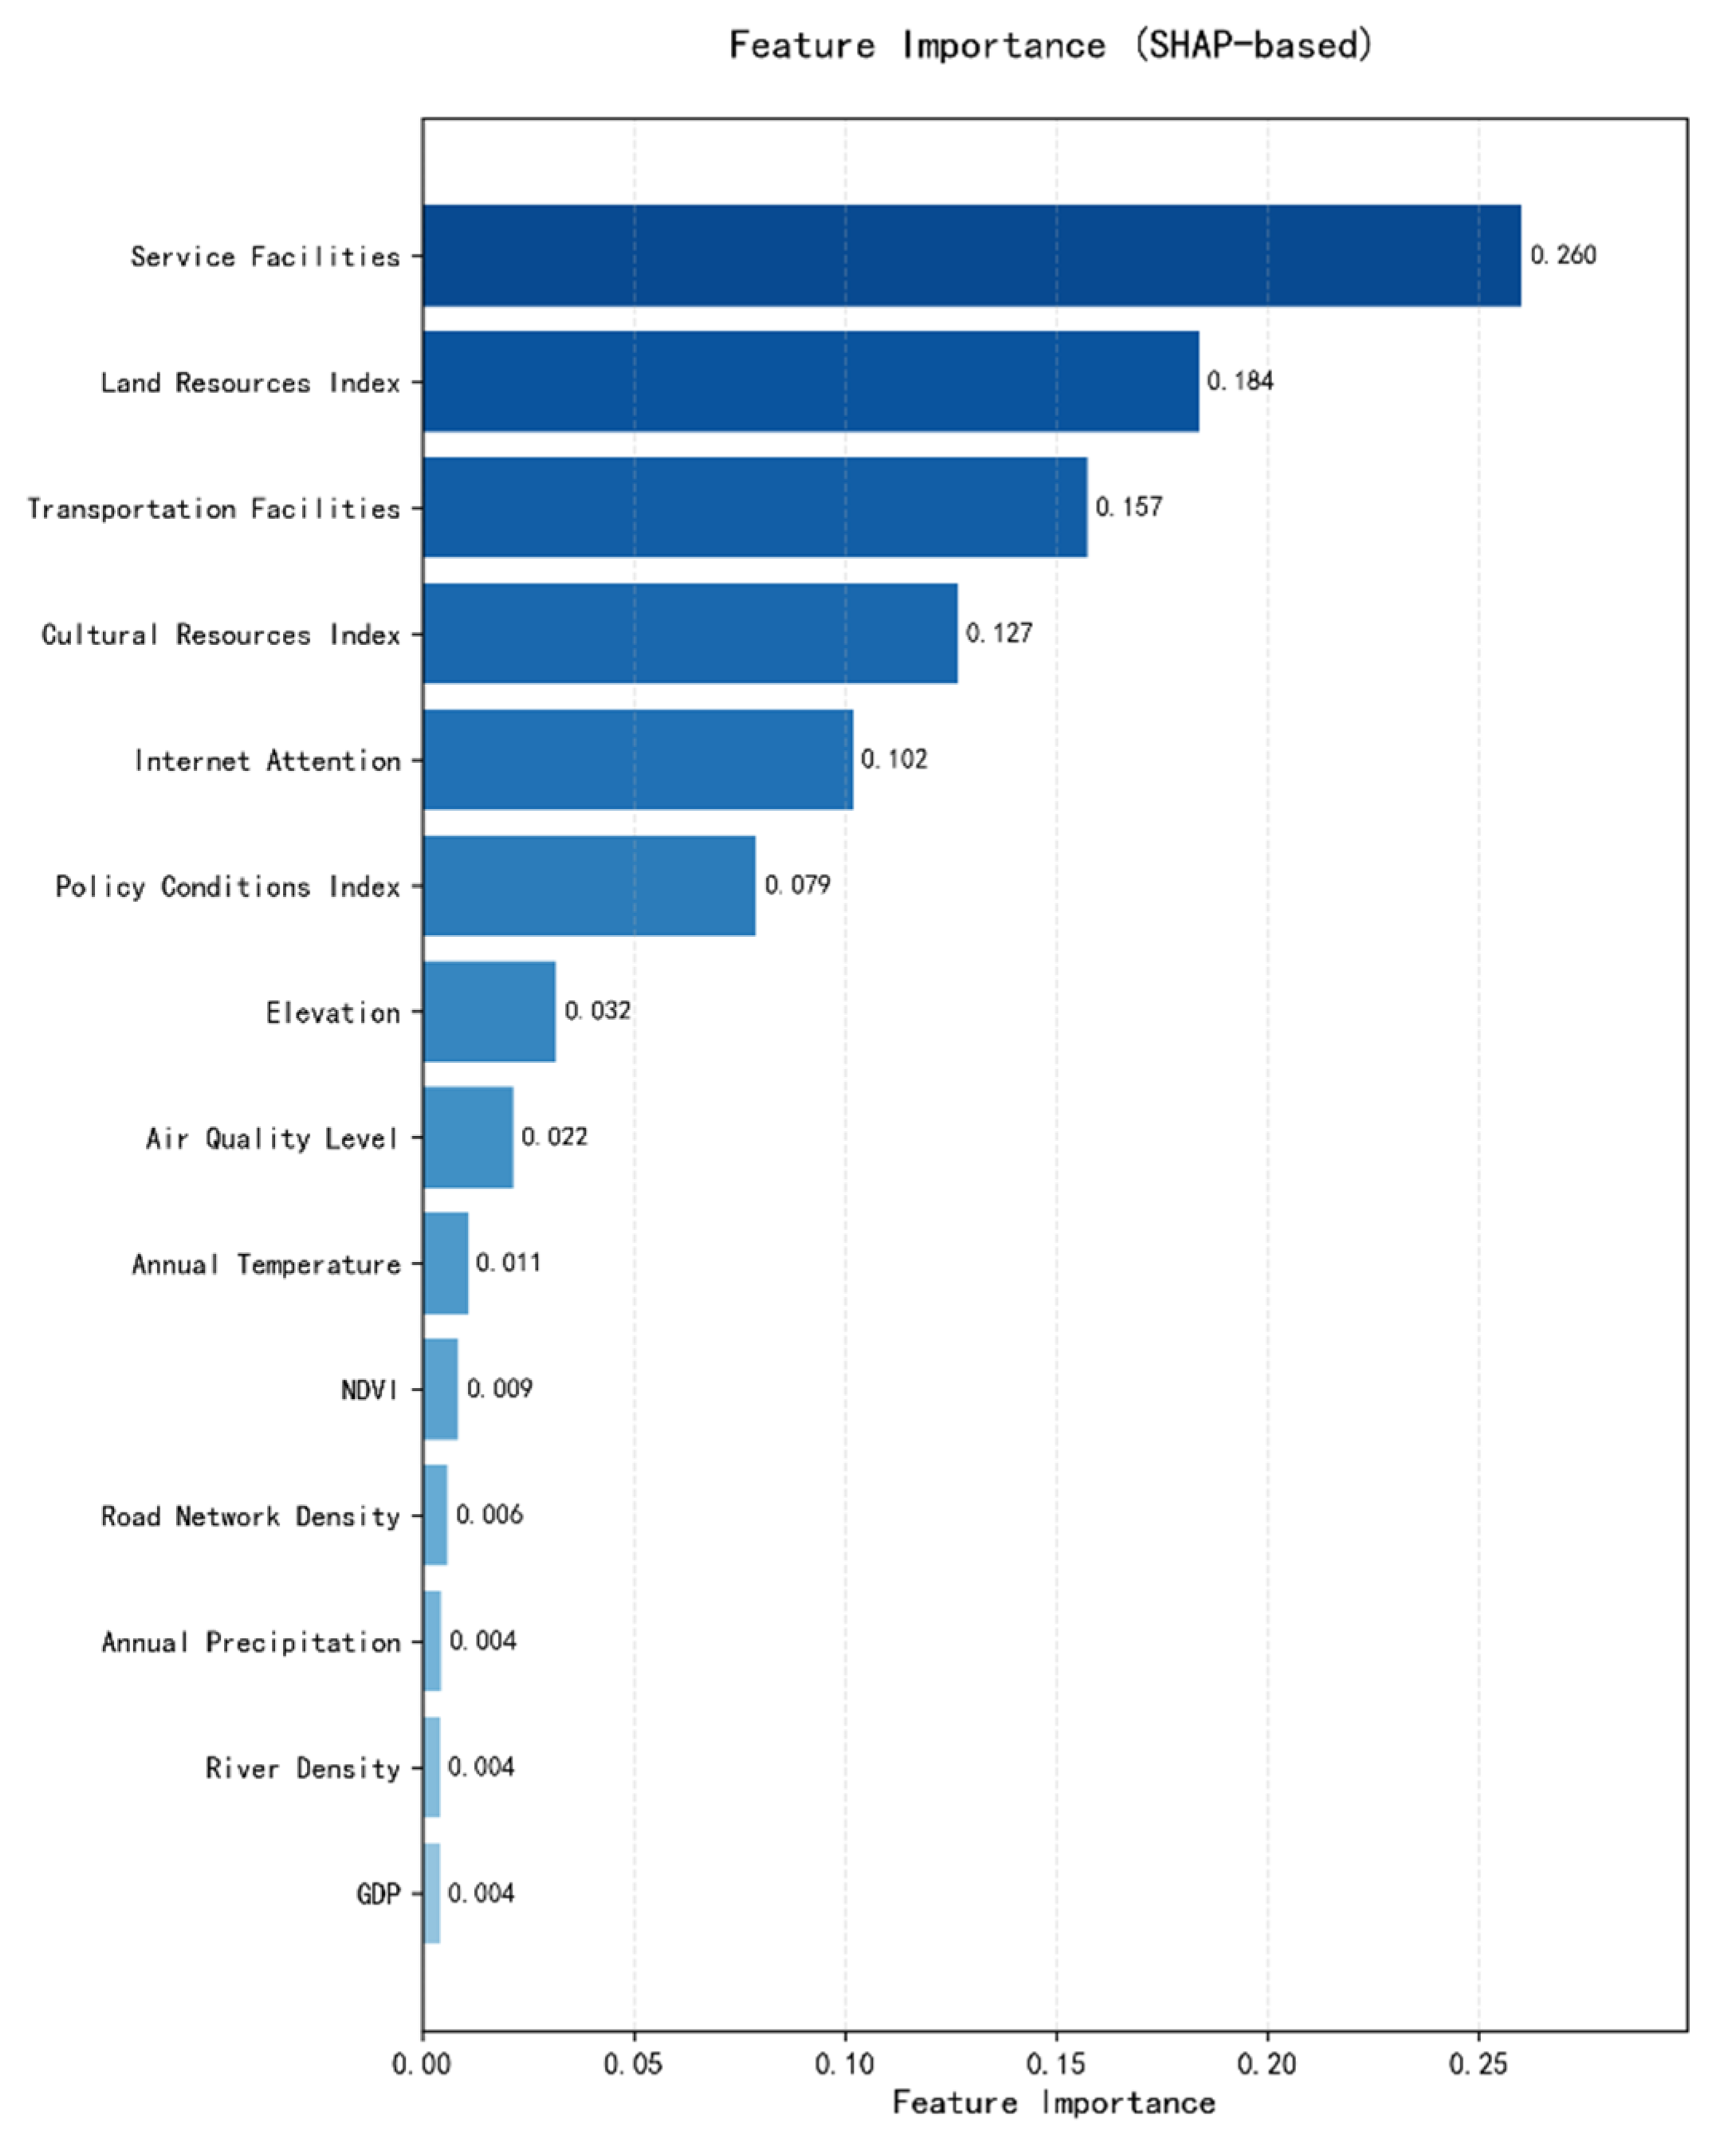
Feature importance analysis based on SHAP is presented in Figure 9. The results indicate significant differences in the contribution of various factors to model predictions. Among all variables, service facilities (0.260), land resource index (0.184), and transportation facilities (0.157) rank as the most important factors, highlighting the critical role of infrastructure and resource conditions in determining tourism development potential. The cultural resource index (0.127), online attention (0.102), and policy support index (0.079) also make notable contributions. In contrast, factors such as elevation, annual temperature, and air quality have relatively low importance values (below 0.05), while GDP, precipitation, and water system density contribute minimally (below 0.02). These results suggest that, once core infrastructure and resource conditions are established, the marginal effects of natural and economic variables become relatively limited.

3.4.2. Global SHAP Interpretation

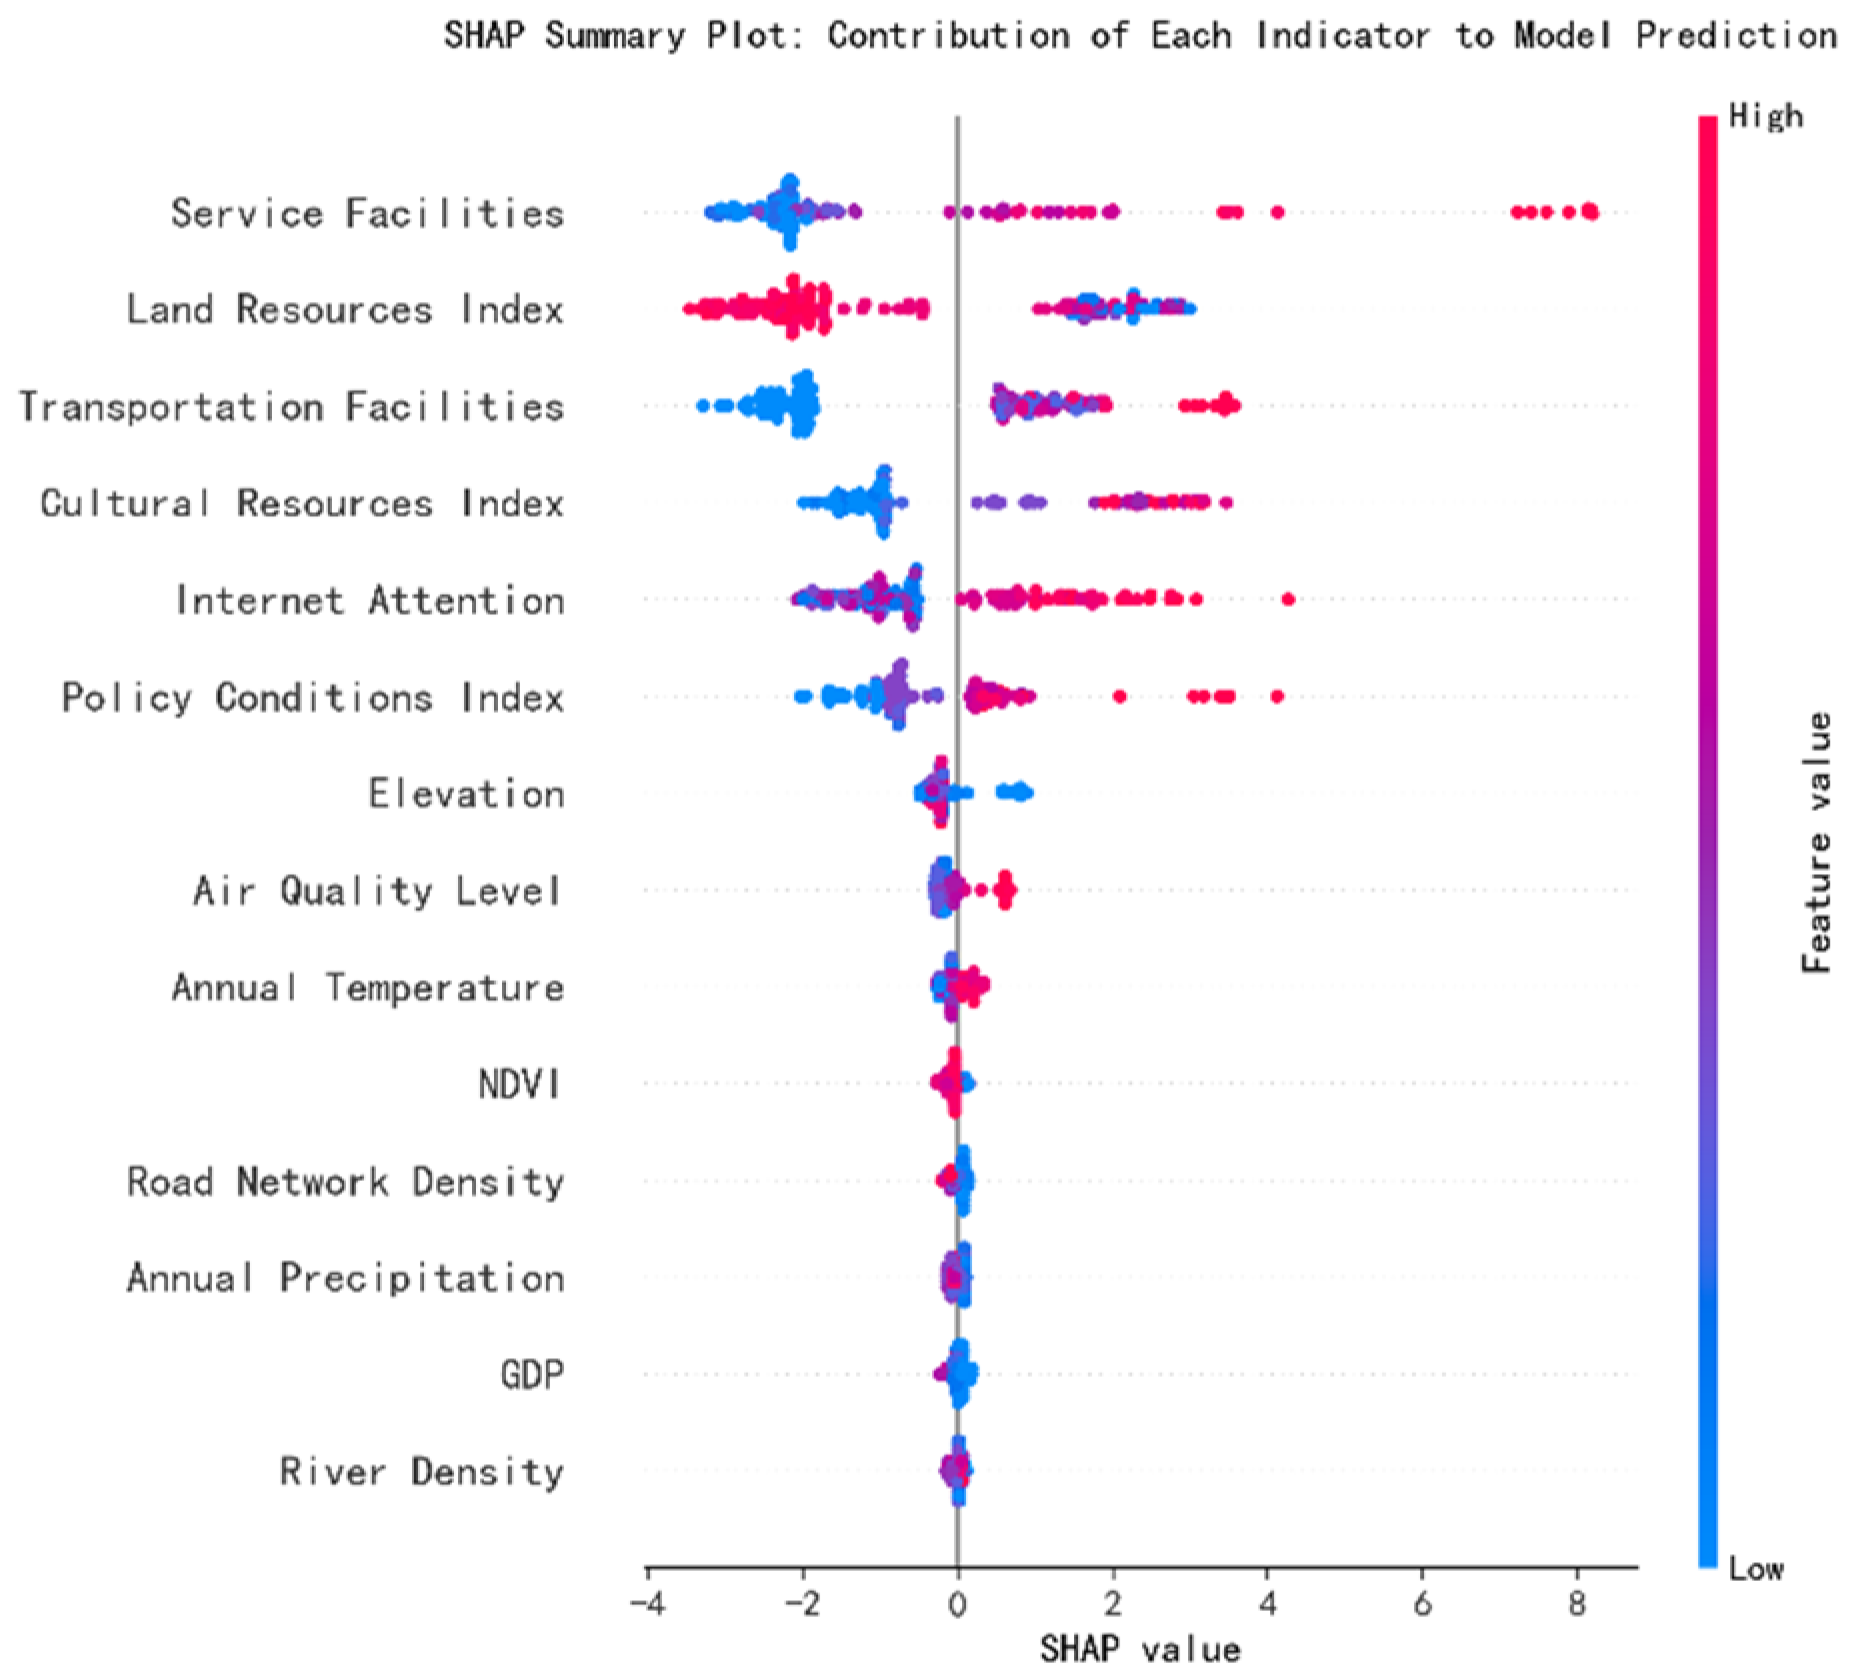
To further reveal the mechanisms by which various influencing factors affect the LightGBM model’s prediction results, this study applies the SHAP method to conduct a global explanation analysis. The SHAP method quantifies the marginal contribution of each feature variable across different samples, thereby enabling the measurement of the magnitude and direction of each feature’s impact on the model’s predictions.
In Figure 10, the vertical axis shows the influencing indicators, ranked in descending order according to their mean absolute SHAP values. Variables ranked higher indicate greater overall contributions to the model prediction results. The horizontal axis shows SHAP values, which reflect the direction and magnitude of each feature’s influence on the model’s predictions. The color of the scatter points indicates the magnitude of the feature values, with red indicating higher values and blue indicating lower values. By combining the color distribution with the position of SHAP values, the direction of the impact of changes in each indicator on the prediction results can be further identified.
For example, for the service facilities indicator, samples with higher values (red points) are mostly concentrated in the region with positive SHAP values. In comparison, samples with lower values (blue points) are more distributed in the negative region. This indicates that higher levels of service facilities have a stronger positive effect on the model’s predictive performance. Similarly, the land resource index and transportation facilities exhibit clear positive influence characteristics, meaning that higher values of these indicators contribute positively to the prediction results.
Based on the overall distribution characteristics, the top-ranked indicators not only show a wider range of SHAP values but also exhibit a more pronounced horizontal spread of scatter points, indicating greater variability in their contributions across different samples and stronger explanatory power for model predictions. In contrast, lower-ranked variables, such as GDP, river density, and annual precipitation, have SHAP values mostly concentrated around zero, suggesting that their marginal contributions to the model output are relatively small and their influence on the overall prediction results is limited.
To further analyze the comprehensive contributions of different types of indicators at the macro level, all indicators are categorized into three groups based on their attributes: resource endowment, socio-economic conditions, and natural environment. Based on SHAP values, the contribution proportions of each category are calculated. Figure 11 shows that resource endowment indicators account for 84.2% of the total contribution and play a dominant role among all influencing factors; socio-economic indicators account for 8.7%, and show a certain degree of influence; while natural environmental indicators account for 7.1%, which is relatively low. This indicates that the development of traditional villages in Shexian County is mainly driven by resource conditions and infrastructure levels. At the same time, the influence of natural environmental factors in the model predictions is relatively limited.

3.5. SHAP Association Patterns of Key Variables

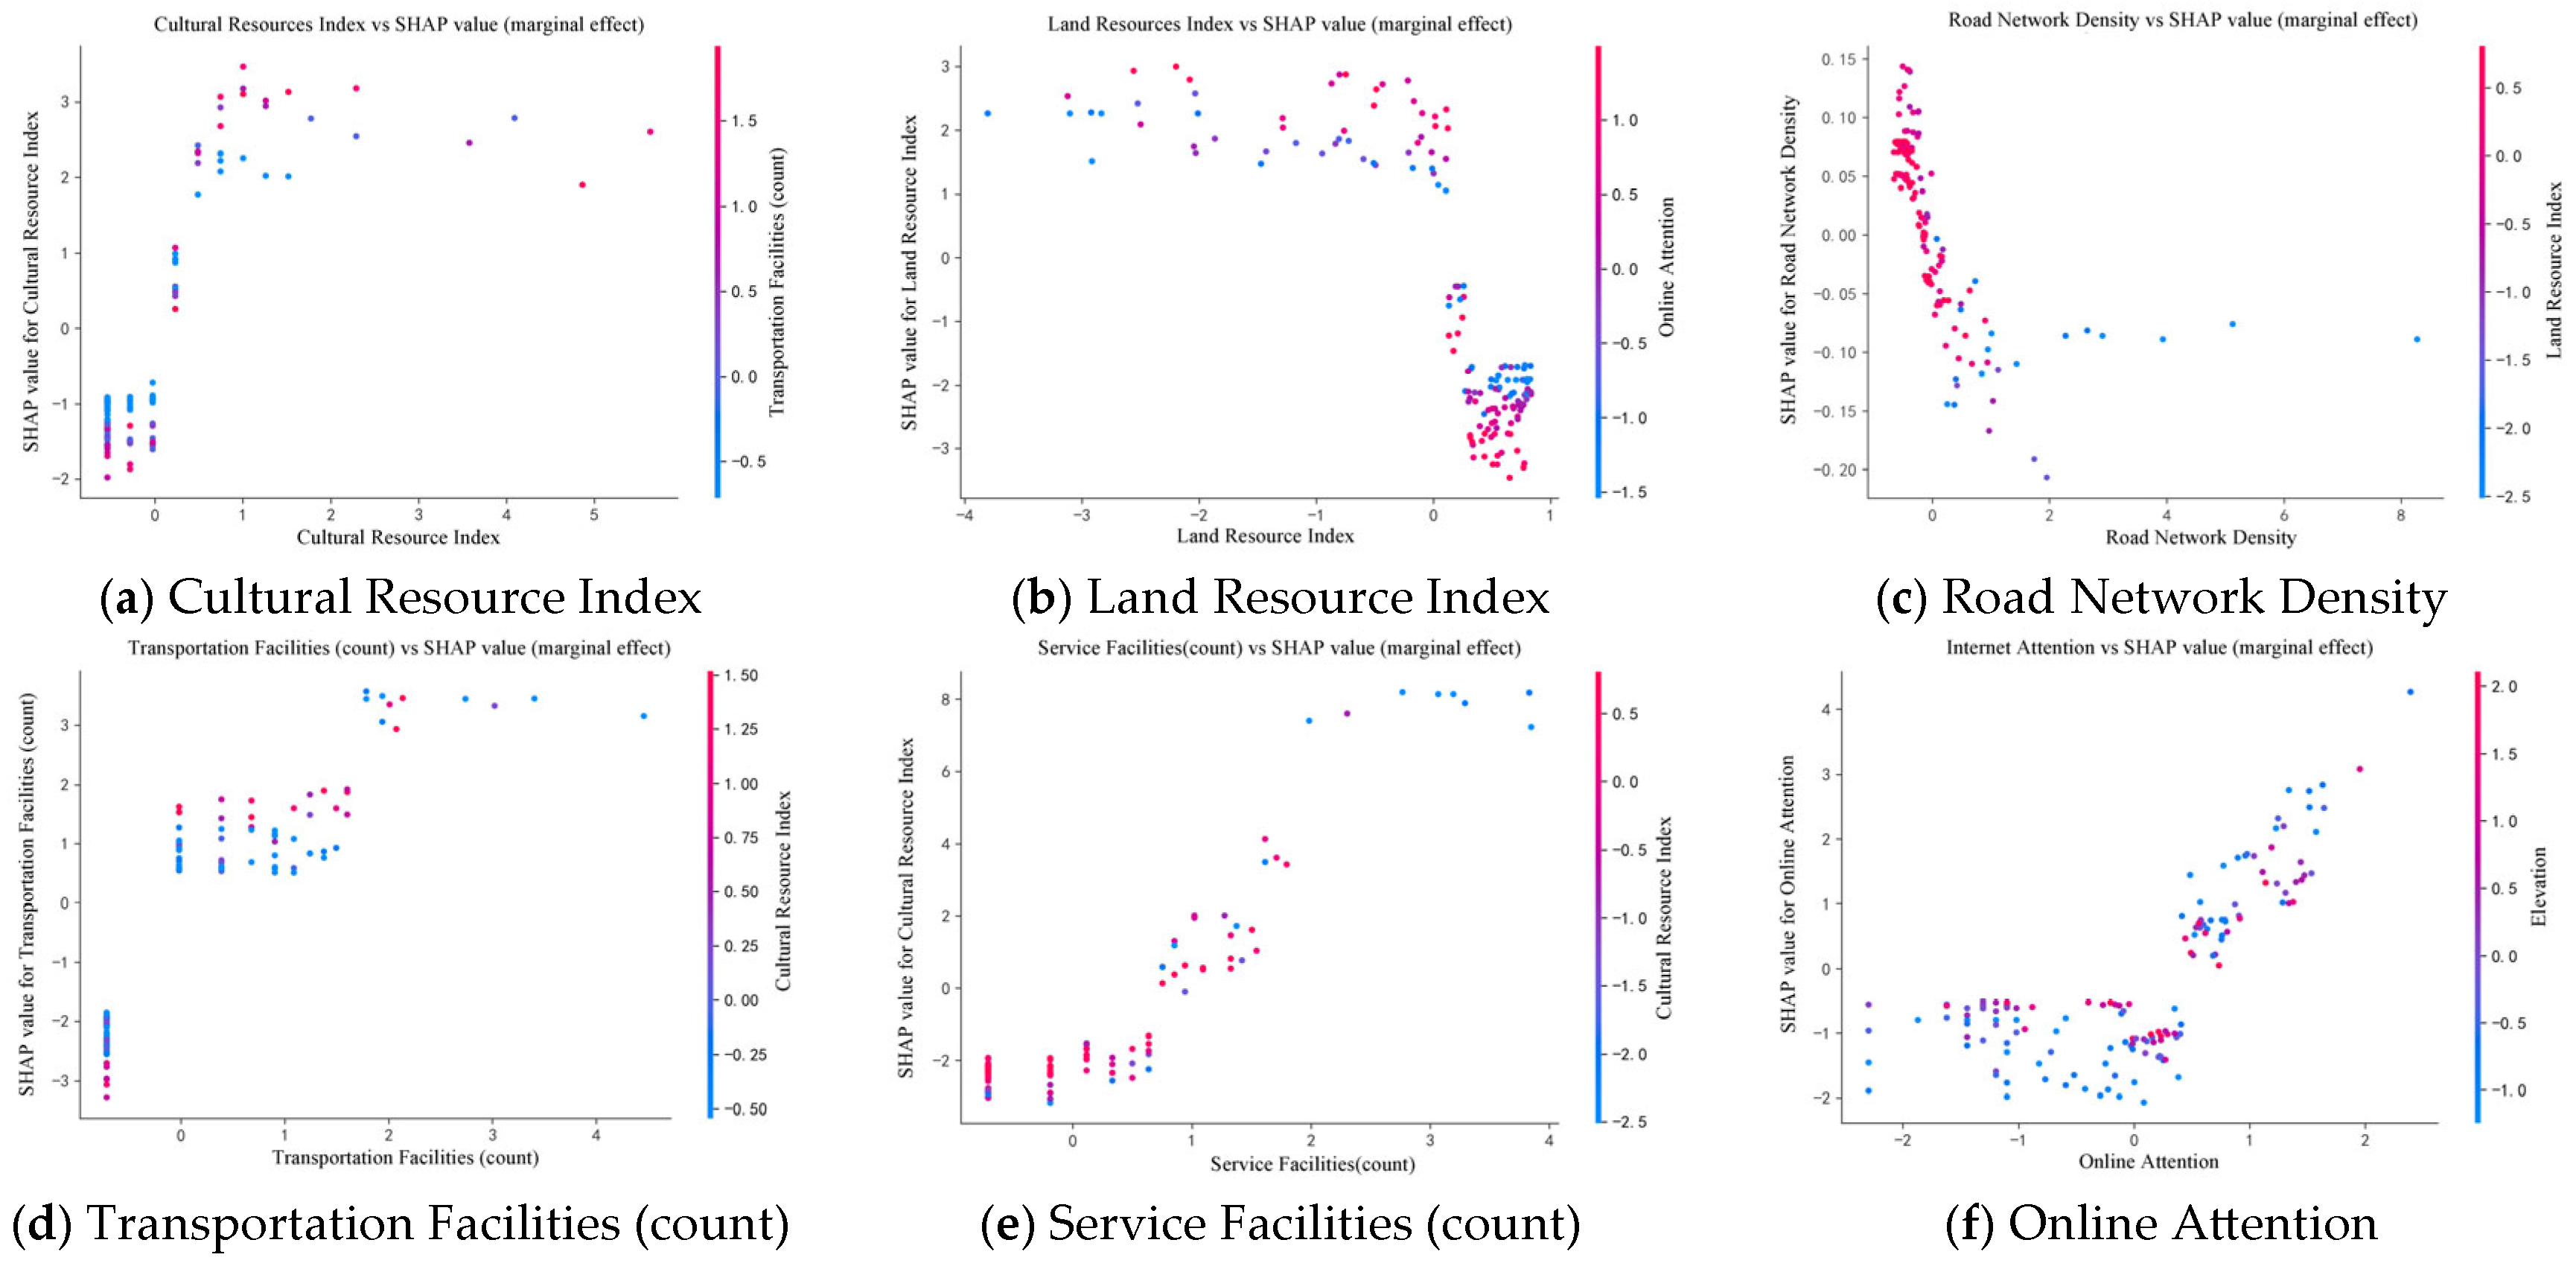
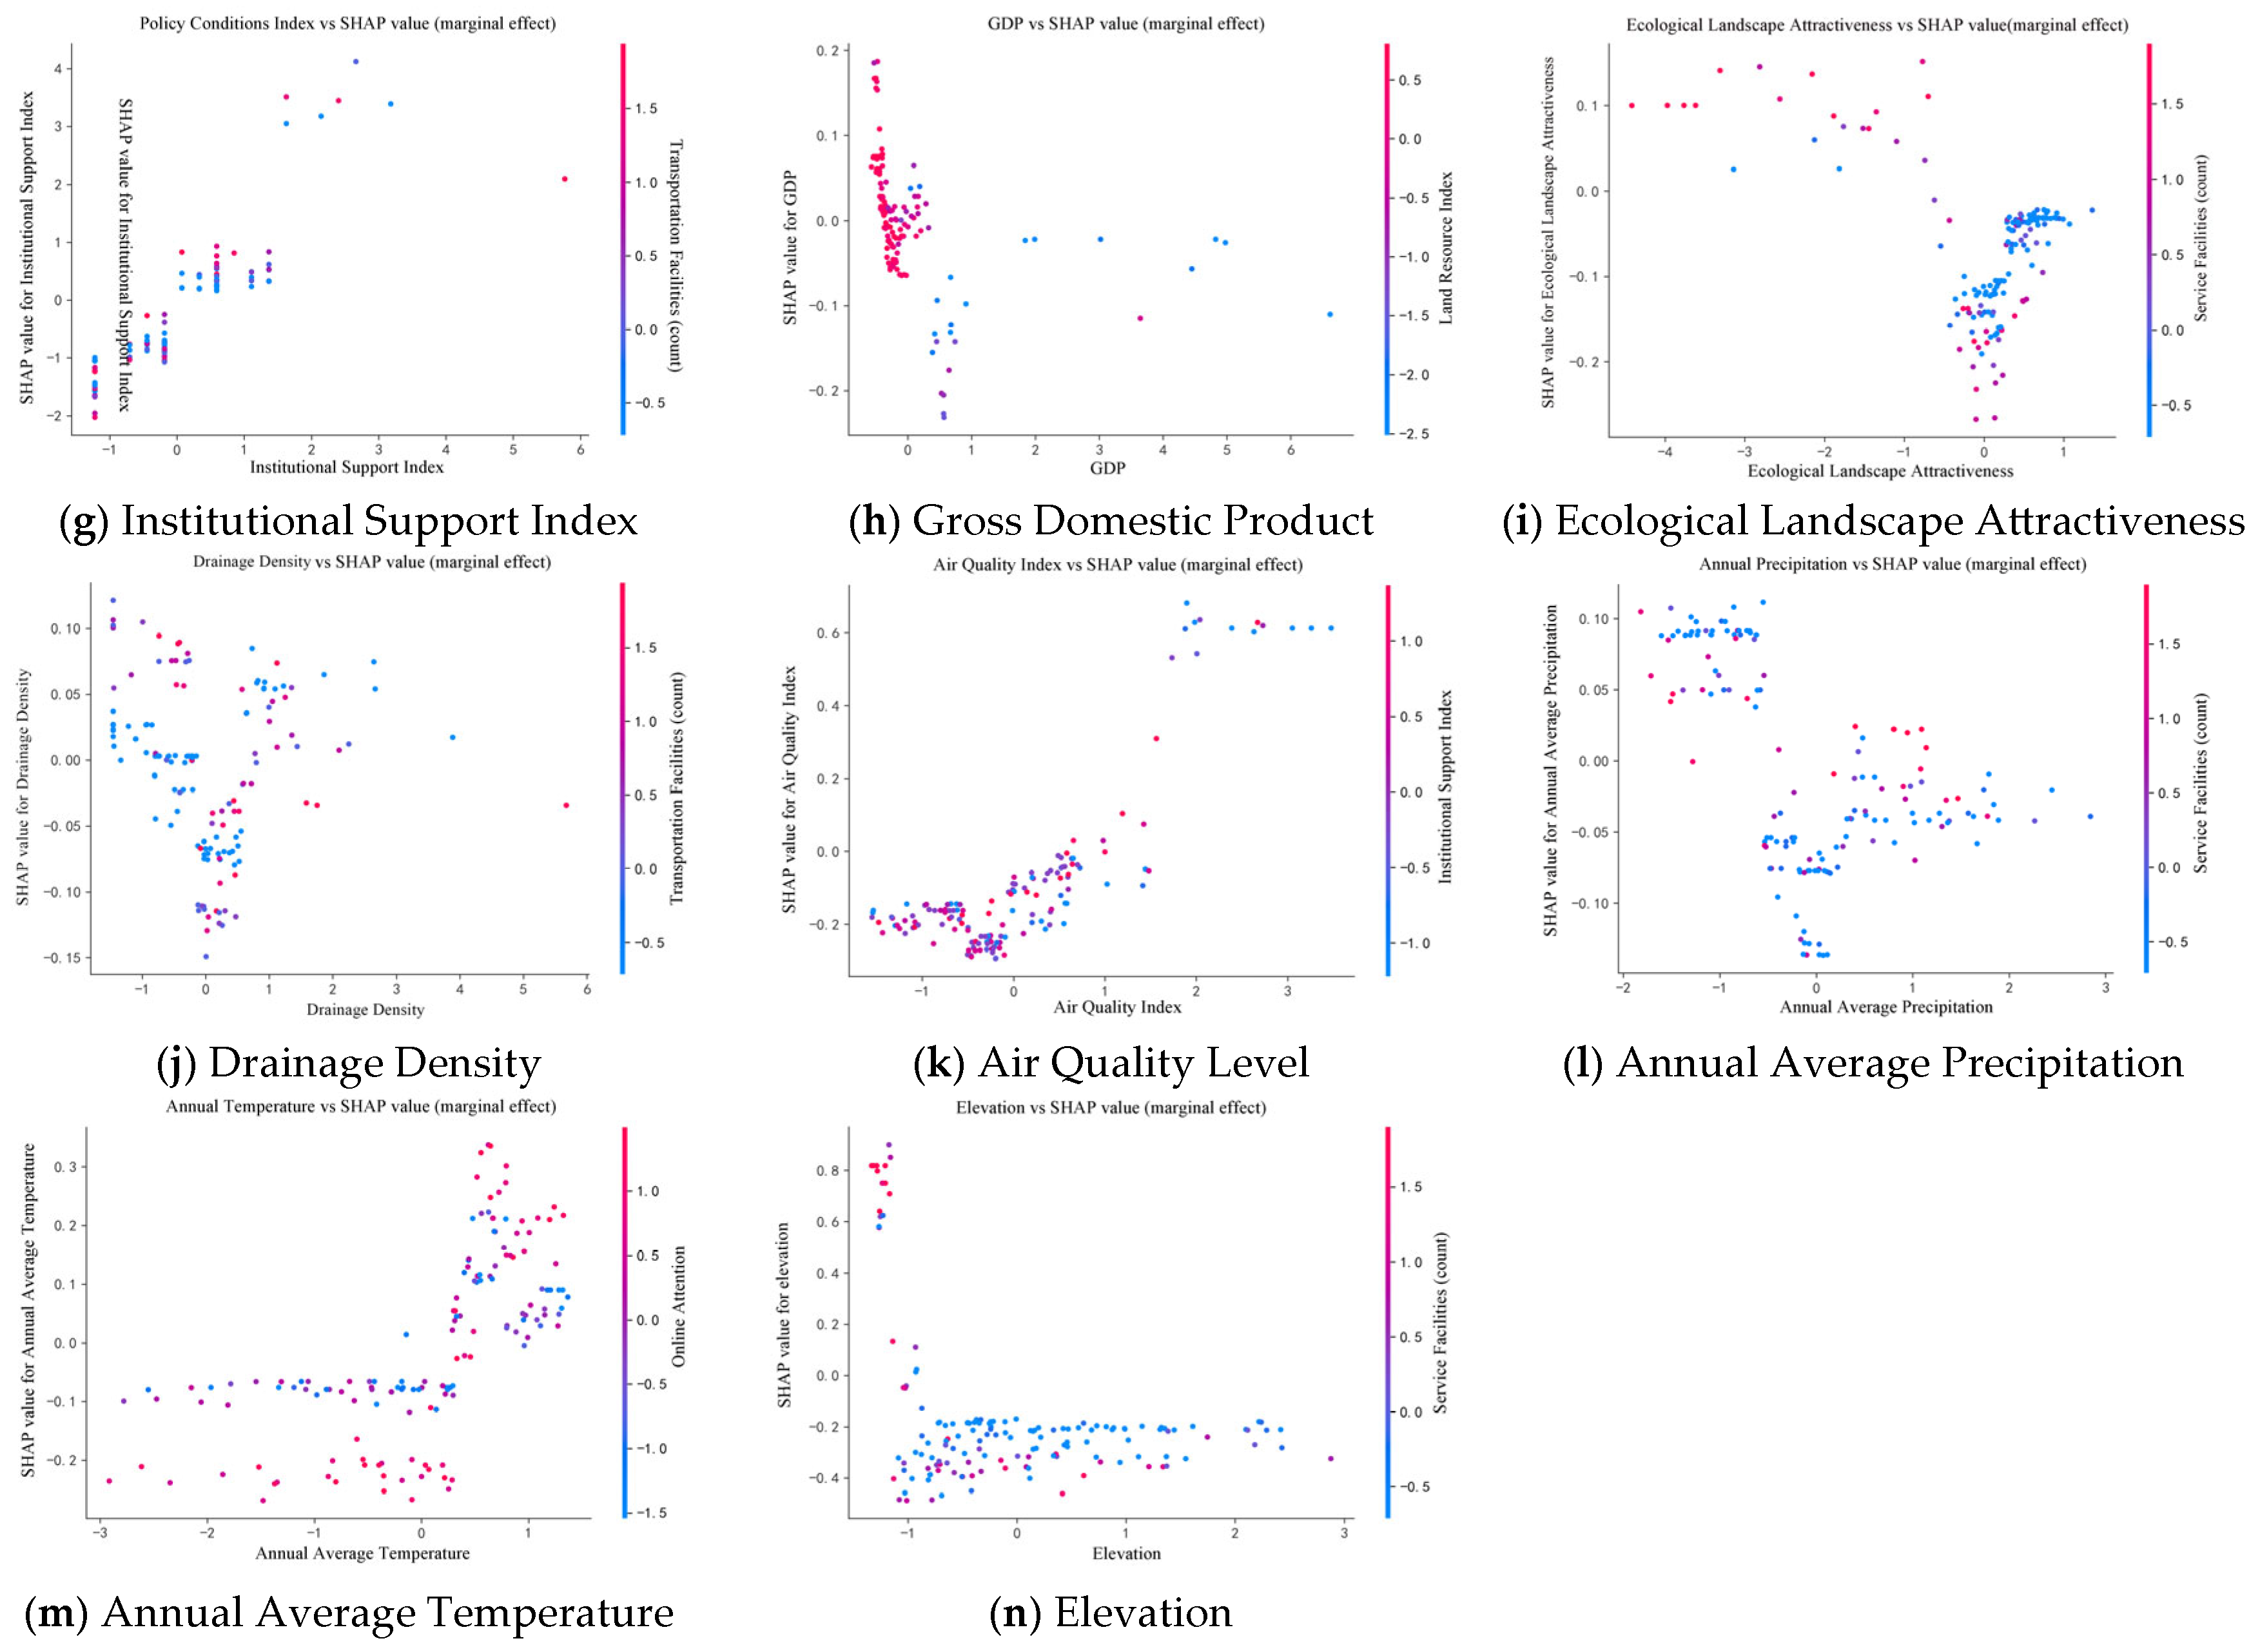
Based on SHAP dependence plots, the marginal effects, directions, and nonlinear characteristics of changes in evaluation indicator values on the predicted tourism development potential of traditional villages can be revealed. Figure 12 shows that the horizontal axis shows each indicator’s values, reflecting variation in indicator levels across villages. In contrast, the vertical axis shows SHAP values, indicating each variable’s contribution to the model’s predictions. The color of the scatter points represents the magnitude of indicator values, where positive SHAP values indicate a positive promoting effect of the indicator on tourism development potential, and negative values indicate an inhibitory effect [43].

3.5.1. Key Variables Associated with Tourism Development Readiness

From the SHAP dependence plots of variables such as the number of service facilities, the number of transportation facilities, and online attention, it can be observed that these indicators generally exhibit clear positive relationships. As the values of these variables increase, their corresponding SHAP values show an overall upward trend, indicating that better tourism service conditions and higher market attention are associated with greater tourism development potential of traditional villages.
Among these factors, well-developed tourism service facilities tend to correspond to higher predicted tourism development readiness. When the number of service facilities is low, SHAP values are generally close to zero or negative, indicating that insufficient tourism reception capacity constrains the improvement in tourism development potential. When the number of service facilities reaches a certain level, the SHAP values increase significantly, suggesting that well-developed tourism service facilities can substantially promote tourism development potential. The number of transportation facilities exhibits a similar positive relationship. As the number of transportation facilities increases, the accessibility of villages continues to improve. Online attention also shows a clear positive effect. When online attention is high, the corresponding SHAP values are generally higher, indicating that internet-based dissemination is associated with higher predicted tourism development readiness, particularly in villages with relatively mature tourism service systems. For example, Yuliang Village in Shexian County, with well-developed tourism reception facilities, catering and homestay services, and a relatively mature tourist service system, has gradually developed into an important node of Huizhou ancient village tourism in recent years. Through social media dissemination, it has gained high online exposure, which is consistent with its relatively high predicted tourism development readiness in the model results.

3.5.2. Resource Endowment Factors

Indicators such as the cultural resource index and land resource index mainly reflect the resource endowment conditions of traditional villages. From the SHAP dependence plots, the cultural resource index shows a positive overall relationship. When the level of cultural resources is higher, the corresponding SHAP values increase significantly, indicating that high-level cultural resources can enhance the tourism attractiveness of villages, and thus, improve tourism development potential.
The land resource index also shows a positive relationship, but its variation trend is relatively moderate, suggesting that land resource conditions influence tourism facility construction and spatial carrying capacity to a certain extent. For example, Yangchan Village in Shexian County, with its unique mountainous settlement landscape and terraced residential pattern, creates a visually striking traditional village landscape on relatively open mountain terraces, providing a solid spatial foundation for photography tourism and rural sightseeing. Tangyue Village, known for the Tangyue Archway Group and Huizhou clan cultural landscape, has high historical and cultural value and strong landscape identity, making it one of the important destinations for Huizhou cultural tourism. However, some dispersion remains in certain high-value ranges, indicating that the development and utilization of cultural resource advantages vary across different villages.

3.5.3. Natural Environmental Constraint Factors

In contrast, natural environmental factors such as elevation generally exhibit a negative relationship. As elevation increases, SHAP values show an overall downward trend, indicating that high-altitude areas, due to poor accessibility and higher development costs, impose certain constraints on tourism development potential.

3.6. SHAP-Based Interaction Association Analysis

Although single-variable SHAP dependence plots reveal the nonlinear association patterns of individual indicators, tourism development readiness in traditional villages is likely associated with the combined contributions of multiple variables. Therefore, this section further examines pairwise SHAP interaction patterns among key variables to identify potential nonlinear association characteristics under different factor combinations.

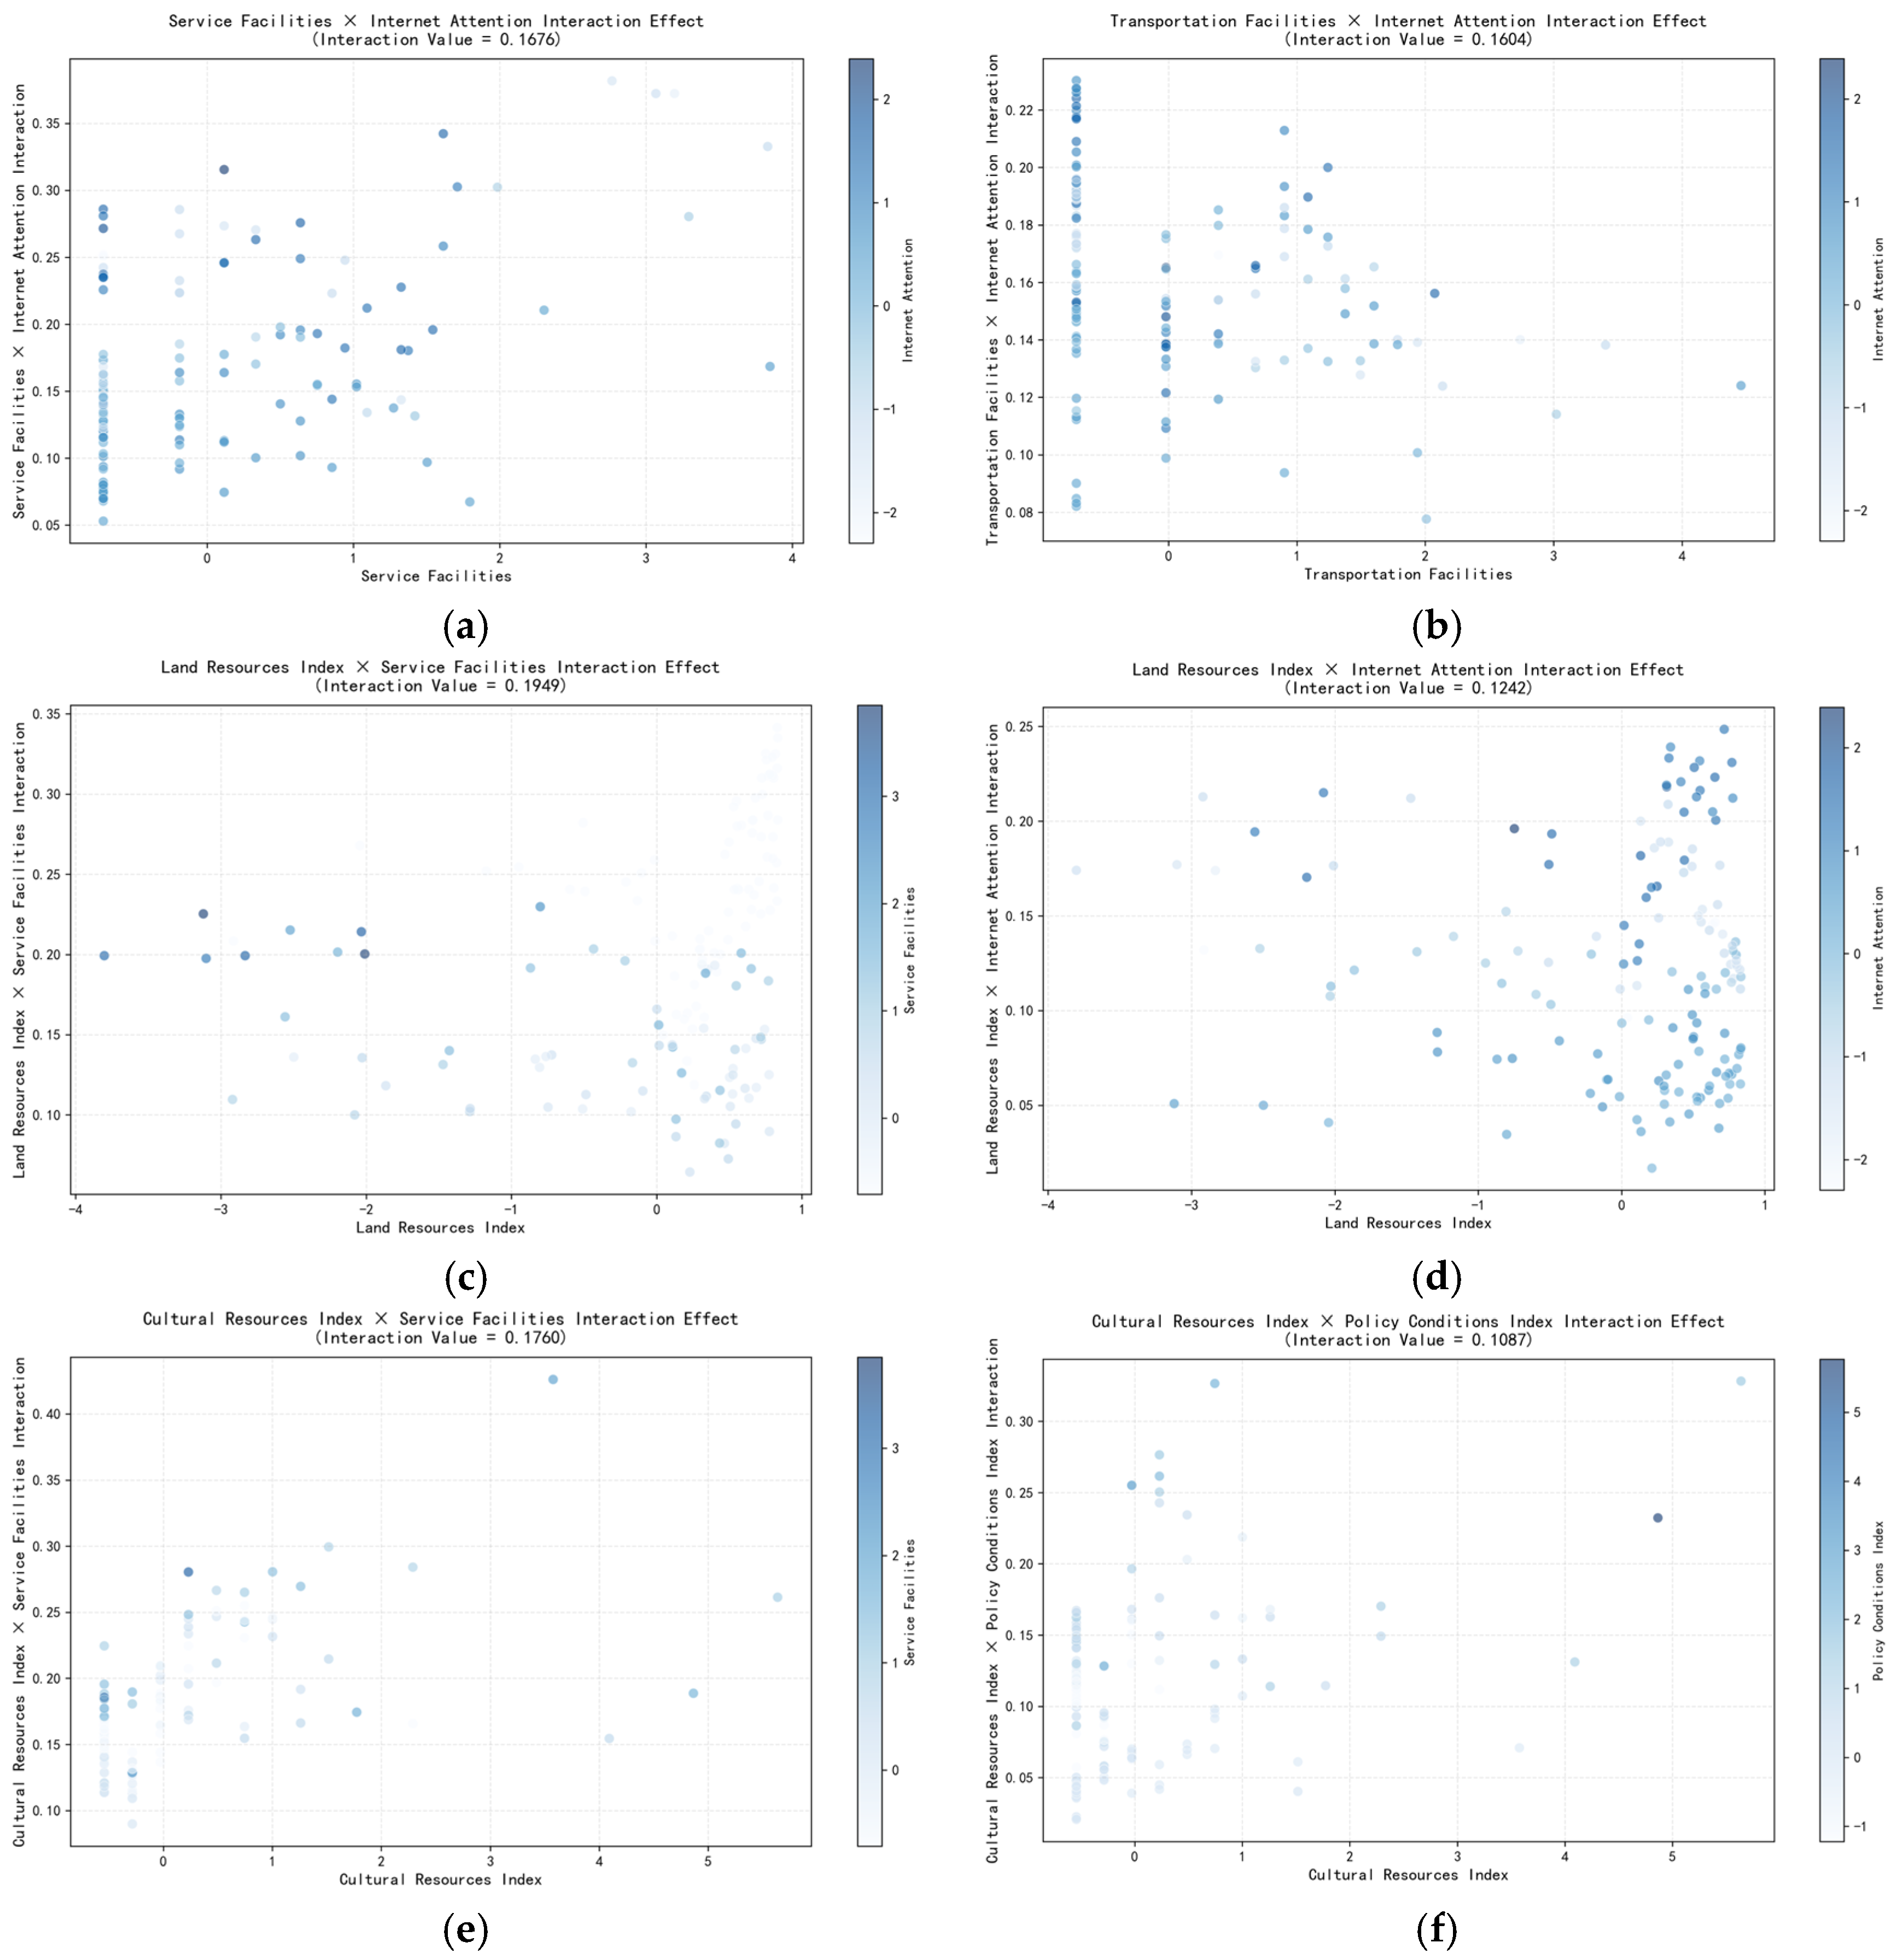
3.6.1. Interaction Association Between Service Facilities and Online Attention

From the SHAP interaction plot of service facilities and online attention (Figure 13a), a clear threshold-type synergistic relationship is evident between the two. When the level of service facilities is low, regardless of the level of online attention, the SHAP values of the samples are generally concentrated in negative or near-zero ranges, indicating that insufficient basic service conditions make it difficult for online dissemination to be effectively transformed into tourism development potential.
When service facilities exceed a medium level, the SHAP values of high online attention samples (red points) are significantly higher than those of low attention samples (blue points) and exhibit a rapid upward trend with increasing service facilities. This indicates that online traffic can significantly amplify the potential for tourism development under conditions of well-developed infrastructure. These results suggest that the promoting effect of online attention depends on a certain level of service facility support. For example, Huayu Village in Shexian County had already developed a certain scale of homestays and tourism reception facilities before gaining online popularity. It achieved rapid growth in tourist numbers driven by online dissemination. In contrast, some villages with high online popularity but insufficient service facilities find it difficult to sustain tourist inflows, and their online popularity cannot be effectively translated into tangible development momentum.

3.6.2. Limited Interaction Association Between Transportation Facilities and Online Attention

The interaction plot of transportation facilities and online attention (Figure 13b) shows a limited substitution effect between the two. When transportation facilities are low, SHAP values remain low regardless of online attention, indicating that extremely poor accessibility significantly constrains tourism development potential, and high online attention is not consistently associated with higher predicted tourism development readiness under extremely poor accessibility conditions.
When transportation facilities are at a medium level, the SHAP values of high online attention samples are slightly higher than those of low attention samples, but the difference is relatively small. This suggests that online dissemination can partially compensate for insufficient transportation conditions, but the substitution effect is limited. For example, Shitan Village in Shexian County has gained considerable attention on online platforms due to its photography culture. However, due to relatively average transportation conditions, its tourism development is still mainly limited to niche groups, such as photography enthusiasts, making it difficult to become a large-scale, comprehensive tourist destination. This indicates that accessibility remains a fundamental condition for tourism development in traditional villages.

3.6.3. Spatial Association Pattern Between Land Resources and Service Facilities

The interaction plot of the land resource index and service facilities (Figure 13c) reflects a clear spatial constraint effect. When the land resource index is low, even with a high number of service facilities, the SHAP values of high-service samples do not increase significantly, indicating that insufficient land resources constrain the expansion of tourism facilities.
When land resources are at a medium level, the promoting effect of service facilities on SHAP values is most evident, and the gap between high-service and low-service samples significantly increases, indicating that this stage represents the most efficient range for facility allocation. For example, Yangchan Village in Shexian County, under limited land resource conditions, has improved facility utilization efficiency by transforming traditional building spaces into homestays. In contrast, Tangyue Village, with abundant land resources and well-developed tourism facilities, has established a mature tourism development pattern.

3.6.4. Weak Interaction Between Land Resources and Online Attention

The interaction plot of the land resource index and online attention (Figure 13d) shows that the interaction is relatively weak. The scatter points for high- and low-attention samples exhibit a roughly parallel distribution, and SHAP values show a gradual upward trend with increasing land resources. However, online attention does not significantly alter this trend.
This result indicates that spatial resource conditions and online dissemination belong to different dimensions of development factors. Land resources determine the construction of tourism facilities and spatial carrying capacity, while online attention mainly influences market dissemination and tourist attraction. No obvious SHAP interaction enhancement pattern is observed between the two variables.

3.6.5. Differences in SHAP Contribution Patterns Between Cultural Resources and Service Facilities

Figure 13e shows that there are clear differences in transformation efficiency between cultural resources and service facilities. When the cultural resource index is low, the difference in SHAP values between high-service and low-service samples is small, indicating that under general cultural resource conditions, improvements in facilities have limited effects on enhancing tourism potential.
As the cultural resource index increases, the SHAP values of high-service samples increase rapidly, whereas those of low-service samples increase only slightly. This indicates that high-level cultural resources require well-developed tourism facilities to realize their value. For example, Ye Village possesses high-level cultural heritage resources, but due to insufficient tourism service facilities, its tourism development potential has not been fully realized. In contrast, Yuliang Village, with a strong cultural resource base and improved tourism service facilities, has demonstrated greater tourism development potential.

3.6.6. Interaction Association Between Cultural Resources and Policy Conditions of Cultural Resources and Policy Conditions

The interaction plot of the cultural resource index and the policy condition index (Figure 13f) indicates a certain institutional empowerment effect between the two. When the cultural resource index is at a medium level, the SHAP values of high-policy samples are significantly higher than those of low-policy samples, indicating that policy support can effectively promote the development and utilization of cultural resources.
However, as the cultural resource index approaches a very high level, the difference between the two types of samples gradually decreases, indicating that top-level cultural resources already possess strong market appeal, and the marginal effect of policy support becomes relatively weaker. For example, Tangyue Village possesses high-level cultural resources and multiple policy recognitions, and, under the combined effect of policy support and resource advantages, it has demonstrated strong tourism development potential. In contrast, for villages with relatively low cultural resource levels, even with policy support, the improvement in tourism potential remains limited.

4. Discussion

4.1. Mechanism Interpretation of Key Findings

Previous studies have largely relied on a “resource endowment–location condition” analytical framework, emphasizing the fundamental roles of cultural resources and transportation accessibility in the development of tourism in traditional villages [44]. However, the SHAP feature importance results (Figure 9) indicate that service facilities (0.260), land resource index (0.184), and transportation facilities (0.157) exert significantly stronger influences on tourism development potential than traditional natural environmental factors. Another noteworthy finding is the relatively limited contribution of natural environmental variables. This result does not necessarily indicate that ecological conditions are unimportant for tourism development. Instead, it may suggest that the ecological environment in Shexian County is generally favorable and exhibits relatively low spatial differentiation. Under such conditions, natural environmental factors function more as baseline supporting conditions rather than as the primary determinants of tourism competitiveness. This finding suggests that, with the continuous development of rural tourism, the traditional model relying primarily on resource attraction is gradually shifting toward a service-capacity-oriented development pattern. This finding differs from many earlier studies that emphasized natural landscape attractiveness and cultural resource abundance as the dominant determinants of rural tourism competitiveness (Su, 2011 [7]; Long et al., 2016 [8]). Previous research has generally argued that ecological quality and heritage value constitute the core driving forces of tourism development in traditional villages. However, the present study suggests that, in relatively mature tourism destinations such as Shexian County, tourism reception capacity and infrastructure conditions increasingly shape tourism development readiness. This finding may reflect the gradual transformation of rural tourism from a resource-oriented model toward a service-capacity-oriented development pattern under the digital tourism economy (Xu et al., 2025 [5]; Shang et al., 2026 [9]). This pattern may be associated with the ongoing transformation of rural tourism under the digital tourism economy [45]. The SHAP results suggest that villages with stronger tourism service capacity and accessibility tend to exhibit higher predicted tourism development readiness. One possible explanation is that tourists may increasingly value accessibility, accommodation quality, tourism services, and overall travel experience in addition to traditional cultural attractions. As one of the core areas of Huizhou culture and one of the regions with the largest concentration of traditional villages in China, Shexian County already possesses relatively abundant cultural tourism resources. Under such conditions, tourism resources themselves exhibit relatively limited differentiation, while differences in infrastructure quality, tourism services, and market operation capacity become increasingly important in shaping tourism competitiveness among villages. This difference suggests that, as rural tourism development progresses, the traditional model relying solely on resource attraction is gradually weakening, while tourism reception capacity and service systems are becoming key determinants of development levels. The SHAP dependence plots and interaction analysis (Figure 12 and Figure 13) further reveal pronounced threshold effects and nonlinear interaction mechanisms among key variables. For example, when service facilities remain below a certain level, increases in online attention produce limited improvements in tourism development potential. However, once tourism service capacity reaches a medium-to-high level, the SHAP values of villages with high online attention increase rapidly. The SHAP interaction results suggest that higher online attention is more strongly associated with tourism development readiness when villages possess relatively adequate tourism reception capacity and infrastructure conditions.
In addition, the effect of online attention demonstrates clear conditional dependence. When infrastructure is insufficient, high levels of online exposure do not significantly enhance tourism development potential. In contrast, in villages with relatively well-developed tourism facilities, online attention tends to be associated with stronger predicted tourism development readiness in villages with relatively mature tourism facilities. This finding suggests that the “traffic effect” in the digital media environment is not an independent driving force but depends on the real-world development foundation and influences tourism development through its coupling with service capacity. The results suggest that high levels of online visibility are not consistently associated with higher tourism development readiness in villages lacking adequate infrastructure conditions. Therefore, the influence of online attention should be understood as an amplification mechanism rather than an independent development driver. This also indicates that the relationship between digital tourism promotion and actual tourism development is highly context-dependent.
Overall, this study reveals that the formation of tourism development potential in traditional villages is characterized by a service-capacity-dominated, threshold-dependent, and multi-factor synergistic mechanism. The SHAP results suggest that tourism development readiness in traditional villages is more strongly associated with service capacity, threshold effects, and multi-factor interactions than with resource endowment alone. The spatial distribution results (Figure 7) further confirm the existence of regional agglomeration effects in tourism development potential. High-potential villages were mainly concentrated in the northwestern cluster and the Xin’an River basin, where transportation accessibility, tourism service systems, and cultural resources exhibit relatively strong spatial continuity. This pattern indicates that tourism competitiveness in traditional villages is influenced not only by individual resource endowment but also by regional infrastructure linkage and spatial spillover effects. Therefore, compared with isolated village-based tourism development, cluster-based tourism circuits may provide greater advantages for coordinated tourism development and resource integration.

4.2. Methodological and Practical Implications

The results of this study further demonstrate the applicability of explainable machine learning methods in tourism spatial evaluation research. This finding is also consistent with recent studies applying explainable machine learning methods in tourism geography and spatial prediction research, which have demonstrated that ensemble learning models are effective in identifying nonlinear relationships and heterogeneous spatial mechanisms (Qin et al., 2025 [42]). Compared with traditional linear approaches such as regression-based evaluation and AHP methods, explainable machine learning frameworks provide stronger flexibility in handling complex tourism systems characterized by multi-dimensional interactions and threshold effects. In contrast, the LightGBM–SHAP framework used in this study provides a more flexible and interpretable analytical approach for complex tourism systems characterized by heterogeneous data structures and nonlinear mechanisms.
From a practical perspective, the identified spatial clustering characteristics suggest that tourism planning in traditional villages should shift from isolated village-based development toward cluster-oriented regional coordination. The northwestern high-potential cluster identified in this study provides a suitable basis for integrated tourism corridor construction and differentiated tourism route planning. It should be noted that the SHAP framework explains the contribution of variables to model predictions rather than establishing direct causal relationships. Therefore, the findings of this study should be interpreted primarily as predictive associations and nonlinear contribution patterns instead of definitive causal mechanisms.

4.3. Planning Implications for Traditional Villages Based on Identified Association Patterns

The following development strategies are proposed based on the predictive association patterns identified by the LightGBM–SHAP framework and should not be interpreted as definitive causal prescriptions. The results indicate that the formation of tourism development potential in traditional villages is driven by multi-factor interactions, and that the strength of different factors varies significantly across development stages. These differentiated strategies are directly derived from the threshold effects and interaction mechanisms identified in this study. This implies that traditional village tourism development does not follow a uniform pathway but instead exhibits stage-specific and context-dependent characteristics. Therefore, it is necessary to construct a differentiated development strategy system based on these influencing mechanisms. From the perspective of development stages, traditional villages can be broadly categorized into three types: mature development type, transformation and upgrading type, and constraint-protection type, each with distinct development priorities.
(1) For mature development villages (high potential), tourism development has already surpassed the infrastructure threshold, with relatively well-established service systems and high market attention. The SHAP results suggest that villages with relatively mature infrastructure and service systems may benefit more from quality-oriented tourism optimization than from simple scale expansion. Therefore, the development focus should shift toward quality optimization and structural upgrading. On the one hand, it is necessary to strengthen the in-depth transformation of cultural resources by enhancing cultural experiences and intangible cultural heritage displays, thereby increasing the added value of tourism products. On the other hand, development intensity should be controlled to avoid excessive commercialization that may damage traditional features and cultural authenticity, which may help maintain the balance between tourism utilization and heritage conservation.
(2) For transformation and upgrading villages (medium potential), these villages typically possess a certain resource base but face constraints in transportation conditions or infrastructure, placing them in a “critical state” of development. The SHAP dependence patterns suggest that villages with improved accessibility and tourism facilities tend to exhibit substantially higher predicted tourism development readiness after certain infrastructure conditions are reached. Therefore, the focus should be on enhancing the efficiency of factor transformation. Priority should be given to improving accessibility and tourism facilities to increase visitor accessibility and retention capacity. At the same time, efforts should be made to promote the effective transformation of resources into tourism products, avoiding situations where resources exist. Still, they cannot be effectively utilized, which may improve the conversion efficiency between tourism resources and tourism-related development opportunities.
(3) For constraint-protection villages (low potential), development is mainly restricted by terrain conditions and locational disadvantages, characterized by low accessibility and high development costs. The model results suggest that villages with severe terrain and accessibility constraints tend to exhibit relatively lower predicted tourism development readiness under conventional large-scale tourism development models. Therefore, the development path should prioritize protection while exploring low-intensity utilization modes, such as ecological experiences, cultural heritage preservation, and educational tourism. These approaches rely less on infrastructure and are more conducive to achieving moderate development while preserving traditional characteristics, thereby avoiding homogeneous competition.
From a key-factors perspective, service quality and spatial configuration optimization are critical in shaping development pathways. Transportation conditions appear to be strongly associated with the spatial differentiation of tourism development readiness. At the same time, online attention tends to show stronger positive SHAP contributions in villages with relatively mature infrastructure conditions. Furthermore, significant interaction effects among the factors indicate that optimizing a single factor is insufficient to substantially improve overall development levels. The results suggest that coordinated matching among resources, transportation conditions, and service systems may be beneficial for improving tourism development readiness in traditional villages.

4.4. Methodological Limitations and Future Research

Despite these contributions, several limitations should be acknowledged. First, this study is based on cross-sectional data from a single point in time and does not capture the dynamic evolution of tourism development potential in traditional villages. Future research could incorporate time-series data to analyze spatiotemporal evolution patterns. Second, some indicators, such as online attention, are sensitive to short-term events and can be volatile. Future studies could use multi-period data to smooth such fluctuations. Finally, the construction of the indicator system inevitably involves a certain degree of subjectivity, and different indicator selections may influence model results. Although several variables exhibited relatively low SHAP importance values, they were retained because tourism development potential is influenced by complex interactions among cultural, infrastructural, socio-economic, and environmental factors. Variables with low global importance may still contribute to local prediction performance and interaction effects within specific spatial contexts. In addition, potential endogeneity and conceptual overlap may exist between certain explanatory variables and the dependent variable. For example, indicators such as cultural resources and institutional support are partially associated with the official recognition system used in label construction. Although the dependent variable represents a composite proxy of tourism development readiness rather than a single policy designation, this overlap may still introduce a certain degree of performance inflation. Therefore, the results of this study should be interpreted primarily from the perspective of predictive association and mechanism exploration rather than strict causal inference. Future research could further explore feature selection methods and lightweight modeling frameworks to improve model transferability and applicability in data-scarce environments.

5. Conclusions

This study constructed a multi-dimensional evaluation framework for tourism development potential in traditional villages of Shexian County by integrating multi-source datasets and applying the LightGBM model combined with SHAP interpretability analysis. The results demonstrate that LightGBM achieved the best overall predictive performance among the three machine learning models, showing stronger robustness and better capability in identifying nonlinear relationships and spatial heterogeneity.
The spatial distribution of tourism development potential exhibited obvious clustering characteristics, forming a pattern of “core agglomeration–transitional distribution–peripheral dispersion.” High-potential villages were mainly concentrated along the Xin’an River and in the northwestern valley regions, where transportation accessibility, cultural resources, and tourism service systems showed relatively strong spatial continuity. These areas provide favorable conditions for integrated tourism corridor construction and cluster-based tourism development. Compared with isolated village-oriented development, regional tourism circuits may contribute more effectively to coordinated infrastructure construction and tourism resource integration.
Methodologically, this study further demonstrates the applicability of explainable machine learning methods in tourism spatial evaluation and development mechanism analysis. Compared with traditional linear evaluation approaches, the LightGBM–SHAP framework can more effectively identify nonlinear relationships, threshold effects, and interaction mechanisms among tourism development factors. Nevertheless, several limitations remain, including the use of cross-sectional data and potential uncertainty in indicator selection. Future studies could incorporate multi-period datasets and explore feature selection methods and lightweight modeling frameworks to improve model transferability and applicability in data-scarce environments.

Author Contributions

Conceptualization, Q.Z. and Y.Z.; methodology, Q.Z. and Y.Z.; software, Y.Z.; validation, Q.Z. and Y.Z.; formal analysis, Y.Z.; investigation, Q.Z. and Y.Z.; resources, Q.Z. and Y.Z.; data curation, Q.Z. and Y.Z.; writing—original draft preparation, Q.Z. and Y.Z.; writing—review and editing, Q.Z. and Y.Z.; visualization, Y.Z.; supervision, Q.Z.; project administration, Q.Z.; funding acquisition, Q.Z. All authors have read and agreed to the published version of the manuscript.

Funding

This research was funded by the National Social Science Foundation of China (grant number: 22BSH085).

Data Availability Statement

The original contributions presented in the study are included in the article; further inquiries can be directed to the corresponding author.

Conflicts of Interest

The authors declare no conflicts of interest.

References

  1. Cheng, Y.; Hu, S.; Yang, R.; Tao, W.; Li, H.; Li, B.; Liu, P.; Wei, F.; Guo, W.; Tang, C.; et al. Protection and Utilization of Traditional Villages in China Oriented toward Rural Revitalization: Challenges and Prospects. J. Nat. Resour. 2024, 39, 1735–1759. [Google Scholar]
  2. Fan, L.; Liu, Y.; Zhang, D. Spatial Pattern of Tourism Development of Chinese Traditional Villages and Its Influencing Factors. Econ. Geogr. 2023, 43, 203–214. [Google Scholar]
  3. Wang, L.; Zhuang, J.; Wang, M. Integrating AHP-SBE for Evaluating Visitor Satisfaction in Traditional Village Tourism Landscapes. Sustainability 2025, 17, 3119. [Google Scholar] [CrossRef] [Scilit]
  4. Liu, X.; Wu, T.; Xie, Z.; Yuan, W.; Yang, H. Creating the Spatial Utilization Pattern of Traditional Villages in the Yellow River by Connecting the Heritage Corridors System with the Assessment of Tourism Potential. Land 2025, 14, 1402. [Google Scholar] [CrossRef] [Scilit]
  5. Xu, Z.; Chai, L.; Wang, Y.; Chen, W.; Gu, D. Spatial Distribution and Tourism Potential of Intangible Cultural Heritage and Historic and Cultural Cities—A Case Study of Anhui Province, China. Land 2025, 14, 2360. [Google Scholar] [CrossRef] [Scilit]
  6. Yu, E.; Wang, Q.; Zheng, H.; Pan, Y.; Liu, Y.; Cao, Q.; Gao, Y.; Zhao, X. Analysis of Spatio-Temporal Evolution and Driving Mechanism of Landscape Pattern in Huangshan City Based on Moving Window Method and Geodetector. Land 2026, 15, 503. [Google Scholar] [CrossRef] [Scilit]
  7. Su, B. Rural tourism in China. J. Rural Stud. 2011, 27, 1438–1441. [Google Scholar] [CrossRef] [Scilit]
  8. Long, H.L.; Tu, S.S.; Ge, D.Z.; Li, T.T.; Liu, Y.S. The Allocation and Management of Critical Resources in Rural China Under Restructuring: Problems and Prospects. J. Rural Stud. 2016, 47, 392–412. [Google Scholar] [CrossRef] [Scilit]
  9. Shang, Y.; Zhang, Z.; Fang, J.; Liu, M. A Study on the Evaluation of Symbiotic Levels and Development Strategies for Clustered Traditional Villages in Tourism, Based on Symbiosis Theory: A Case Study of Jia County, Shaanxi Province. Sustainability 2026, 18, 4215. [Google Scholar] [CrossRef] [Scilit]
  10. Ren, K.; Xu, J. Formation Process and Spatial Representation of Tourist Destination Personality from the Perspective of Cultural Heritage: Application in Traditional Villages in Ancient Huizhou, China. Land 2024, 13, 423. [Google Scholar] [CrossRef] [Scilit]
  11. Zeng, C.; Liu, P.; Cao, Y.; Huang, L. Zourism Response and Revitalization Strategy of Traditional Villages in the Ridge Belt of Beautiful China. Areal Res. Dev. 2023, 42, 86–92. [Google Scholar]
  12. Zhao, W.; Li, Z.; Li, R. Research on County Rural Tourism Competitive Ability in Fujian Province. Chin. J. Agric. Resour. Reg. Plan. 2017, 38, 183–190. [Google Scholar]
  13. Zhang, Q.; Wang, A.; Chu, J.; Huang, C. Visualization Simulation and Analysis of Tourism Competitiveness of Traditional Villages: A Case Study of Ancient Huizhou. Chin. J. Agric. Resour. Reg. Plan. 2022, 43, 239–250. [Google Scholar]
  14. Xian, W.; Shang, G.; Liu, Q.; Liu, Y. Evaluation of Rural Tourism Land Competitiveness Based on Neural Network and Weighted Model: A Case Study of Miyun District, Beijing. Acta Agric. Zhejiangensis 2021, 33, 1519–1528. [Google Scholar]
  15. Cheng, B.; Jia, G. Improved AHP-BP Neural Network Algorithm: A Case Study of Circular Economy Evaluation in Construction Enterprises. Manag. Rev. 2015, 27, 36–47. [Google Scholar]
  16. He, J.; Wang, X.; Qi, Y.; Jiang, J.; Zhou, D.; Ma, D.; Ying, J. AI-Driven Multi-Model Classification of Rural Settlements for Targeted Rural Revitalization: A Case Study of Gaoqing County, Shandong Province, China. Land 2025, 14, 2298. [Google Scholar] [CrossRef] [Scilit]
  17. Maxwell, A.E.; Warner, T.A.; Fang, F. Implementation of machine-learning classification in remote sensing: An applied review. Int. J. Remote Sens. 2018, 39, 2784–2817. [Google Scholar] [CrossRef] [Scilit]
  18. Li, C.; Zhou, Y.; Wu, M.; Xu, J.; Fu, X. Exploring Nonlinear Threshold Effects and Interactions Between Built Environment and Urban Vitality at the Block Level Using Machine Learning. Land 2025, 14, 1232. [Google Scholar] [CrossRef] [Scilit]
  19. Yang, B.; Huang, Q.; Zheng, Q.; Gong, X.; Liang, L.; Wang, M.; Chen, Y.; Yuan, H. Evaluation of Ecotourism Suitability in Zhangjiajie Based on Random Forest Algorithm. J. Nat. Sci. Hunan Norm. Univ. 2021, 44, 17–25. [Google Scholar]
  20. Yan, L.; Gao, B.W.; Zhang, M. A mathematical model for tourism potential assessment. Tour. Manag. 2017, 63, 355–365. [Google Scholar] [CrossRef] [Scilit]
  21. Lundberg, S.M.; Lee, S.I. A unified approach to interpreting model prediction. Adv. Neural Inf. Process. Syst. 2017, 30, 4765–4774. [Google Scholar]
  22. Doan, Q.C.; Ma, J.; Chen, S.; Zhang, X. Nonlinear and threshold effects of the built environment, road vehicles and air pollution on urban vitality. Landsc. Urban Plan. 2025, 253, 105204. [Google Scholar] [CrossRef] [Scilit]
  23. Zhou, X.; Wen, H.; Li, Z.; Zhang, H.; Zhang, W. An interpretable model for the susceptibility of rainfall-induced shallow landslides based on SHAP and XGBoost. Geocarto Int. 2022, 37, 13419–13450. [Google Scholar] [CrossRef] [Scilit]
  24. Jin, Z.; Lv, J. Comparative Study on Spatial Prediction Accuracy of Regional Soil Heavy Metals Based on Machine Learning Models. Geogr. Res. 2022, 41, 1731–1747. [Google Scholar]
  25. Zhang, H.; Zhang, H.; Sun, D. Measurement of Rural Ecotourism Resource Competitiveness in Chongqing Based on XGBoost-SHAP. Resour. Environ. Yangtze Basin 2025, 34, 585–599. [Google Scholar]
  26. Wang, X.; Zhu, W. Evaluation and Obstacle Factor Analysis of Rural Tourism Competitiveness in Shandong Province. Sci. Geogr. Sin. 2019, 39, 147–155. [Google Scholar]
  27. Zhang, D.; Cai, J.; Li, H.; Wu, Y. Spatial Configuration Mechanism of Rural Tourism Resources Under the Perspective of Multi-Constraint Synergy: A Case Study of the Nujiang Dry-Hot Valley. Sustainability 2025, 17, 10962. [Google Scholar] [CrossRef] [Scilit]
  28. Zhang, P.; Li, J.; Wang, J.; Li, R.; Zhao, T. Distribution of the Land Value Increment in the Context of Rural Tourism. Sustainability 2025, 17, 11024. [Google Scholar] [CrossRef] [Scilit]
  29. Feng, X.; Jiang, L.; Li, Q.; Nian, B. Characteristics and influencing factors of internet word-of-mouth of tourist attractions: Evidence from Jiangxi, China. Humanit. Soc. Sci. Commun. 2025, 12, 1496. [Google Scholar] [CrossRef] [Scilit]
  30. Tian, L.; Wu, Z.; Wang, J.; Lu, J.; Yan, Z. The Spatial Mismatch and Influencing Factors Between Ecological Resilience and Tourism Economy in China’s Land Border Areas. Sustainability 2026, 18, 895. [Google Scholar] [CrossRef] [Scilit]
  31. Li, Q.; Lv, S.; Chen, Z.; Cui, J.; Li, W.; Liu, Y. Traditional Villages’ Cultural Tourism Spatial Quality Evaluation. Sustainability 2024, 16, 7752. [Google Scholar] [CrossRef] [Scilit]
  32. Boavida-Portugal, I.; Rocha, J.; Ferreira, C.C. Exploring the impacts of future tourism development on land use/cover changes. Appl. Geogr. 2016, 77, 82–91. [Google Scholar] [CrossRef] [Scilit]
  33. Zhao, Q.; Jin, P.; Wang, B.; Xu, P. Evaluation of Rural Tourism Competitiveness Based on Multi-Source Data and Machine Learning: A Case Study of Lin’an District, Hangzhou. Prog. Geogr. 2023, 42, 1541–1555. [Google Scholar] [CrossRef] [Scilit]
  34. Baloch, Q.B.; Shah, S.N.; Iqbal, N.; Sheeraz, M.; Asadullah, M.; Mahar, S.; Khan, A.U. Impact of tourism development upon environmental sustainability: A suggested framework for sustainable ecotourism. Environ. Sci. Pollut. Res. 2023, 30, 5917–5930. [Google Scholar] [CrossRef] [Scilit]
  35. Ke, G.; Meng, Q.; Finley, T.; Wang, T.; Chen, W.; Ma, W.; Ye, Q.; Liu, T.-Y. LightGBM: A Highly Efficient Gradient Boosting Decision Tree. In Advances in Neural Information Processing Systems 30 (NeurIPS 2017); Curran Associates, Inc.: Red Hook, NY, USA, 2017; pp. 3146–3154. [Google Scholar]
  36. Ren, F.; He, J.; Zhang, Y.; Kong, F. Estimating and Projecting Forest Biomass Energy Potential in China: A Panel and Random Forest Analysis. Land 2026, 15, 152. [Google Scholar] [CrossRef] [Scilit]
  37. Tan, C.; Huang, Q.; Yang, B.; Li, T.; Lei, J. Application of Random Forest Algorithm in Regional Ecotourism Suitability Evaluation. J. Geo-Inf. Sci. 2024, 26, 318–331. [Google Scholar]
  38. Ma, M.; Zhao, G.; He, B.; Li, Q.; Dong, H.; Wang, S.; Wang, Z. XGBoost-based method for flash flood risk assessment. J. Hydrol. 2021, 598, 126382. [Google Scholar] [CrossRef] [Scilit]
  39. Nguyen, H.H.; Viviani, J.L.; Ben Jabeur, S. Bankruptcy prediction using machine learning and shapley additive explanations. Rev. Quant. Financ. Account. 2025, 65, 107–148. [Google Scholar] [CrossRef] [Scilit]
  40. Zhang, G.; Huang, Z. LightGBM–SHAP-Based Study of the Threshold and Synergistic Effects of Physical and Perceptual Scene Elements on Spatial Vitality in Historic Cultural Districts. Sustainability 2026, 18, 2778. [Google Scholar] [CrossRef] [Scilit]
  41. Dai, Z.; Huang, W. Improving energy management practices through accurate building energy consumption prediction: Analyzing the performance of LightGBM, RF, and XGBoost models with advanced optimization strategies. Electr. Eng. 2025, 107, 12583–12605. [Google Scholar] [CrossRef] [Scilit]
  42. Qin, Y.; Yu, Y.; Liu, J.; Liu, R. Machine learning-based identification of key factors and spatial heterogeneity analysis of urban flooding: A case study of the central urban area of Ordos. Sci. Rep. 2025, 15, 24749. [Google Scholar] [CrossRef] [Scilit]
  43. Yang, D.; Wang, X.; Han, R. Nonlinear and Synergistic Effects of the Built environment on Street Vitality: The Case of Shenyang. Urban Plan. Forum 2023, 5, 93–102. [Google Scholar]
  44. Shen, W.; Chen, Y.; Cao, W.; Yu, R.; Cheng, J. Coupling and interaction mechanism between green urbanization and tourism competitiveness based an empirical study in the Yellow River Basin of China. Sci. Rep. 2024, 14, 13167. [Google Scholar] [CrossRef] [Scilit]
  45. Yang, S.; Guo, W.; Xu, T.; Liu, T. Analysis on the Evolution Characteristics of Rural Tourism Public Service System from the Perspective of Digitalization—Empirical Evidence from the Silk Road Economic Belt. Sustainability 2024, 16, 8810. [Google Scholar] [CrossRef] [Scilit]
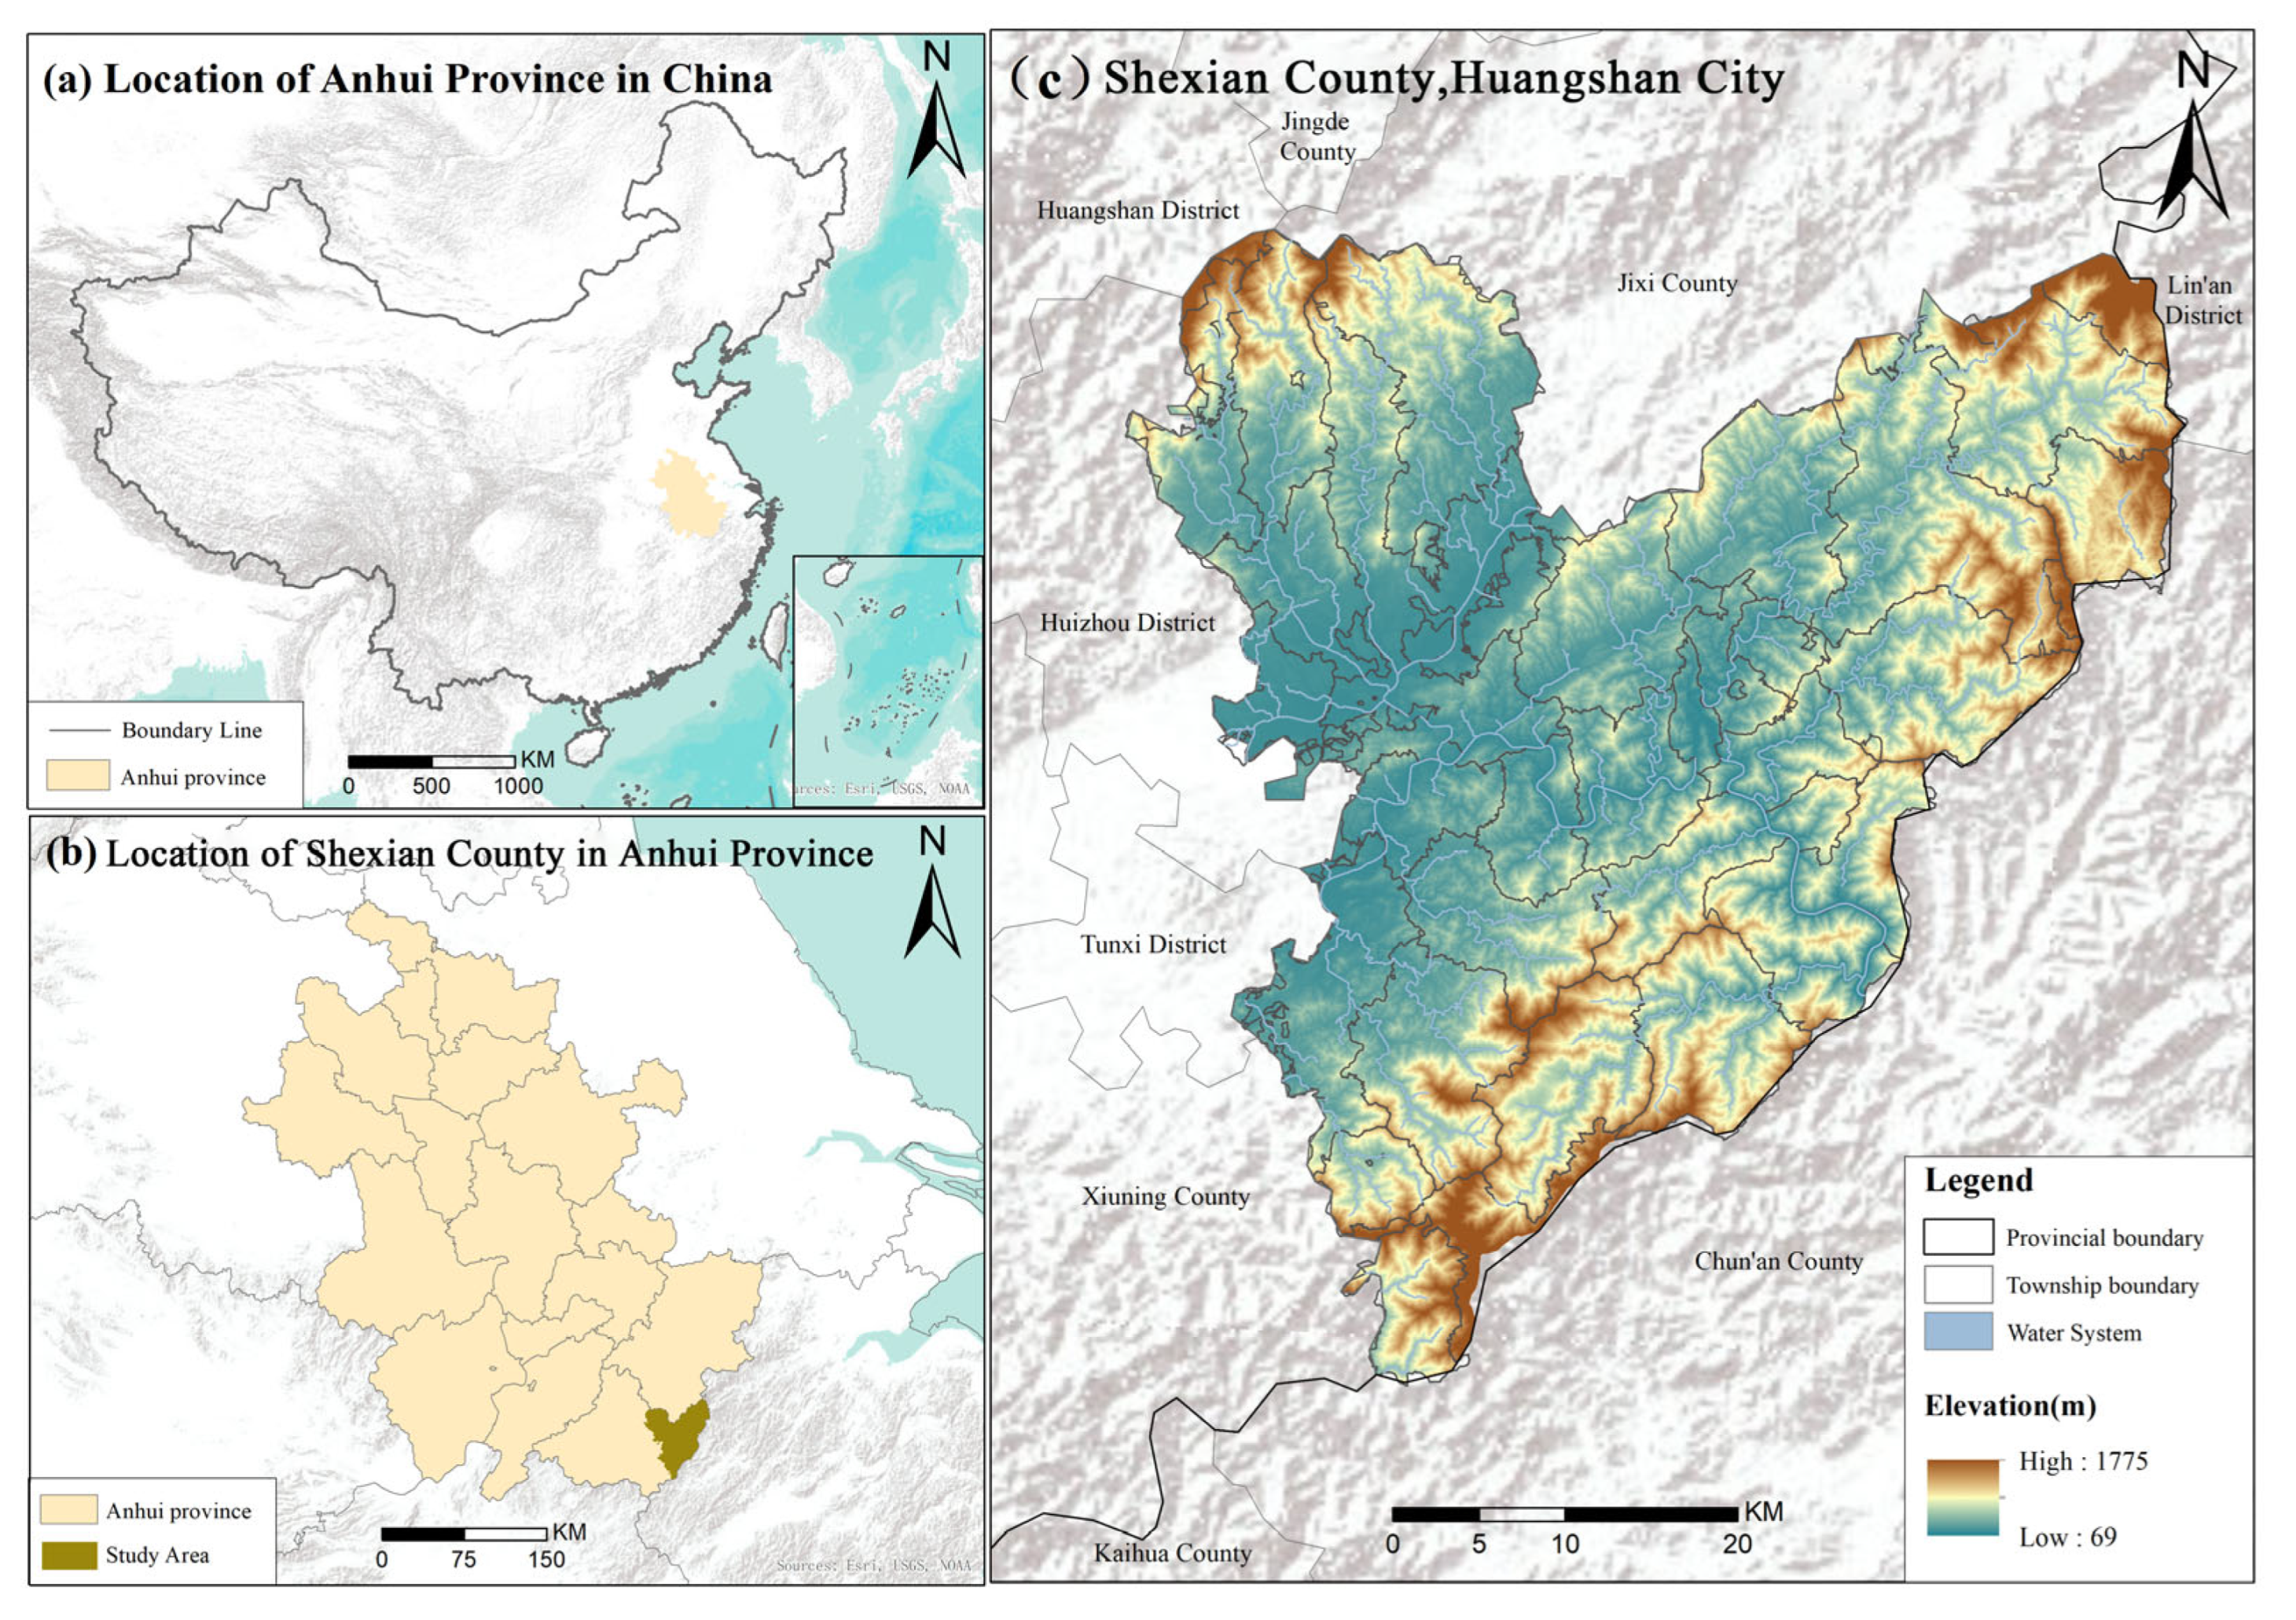
Figure 1. Regional map of Anhui Province, China.
Land 15 00977 g001
Figure 2. Workflow of tourism development potential assessment, including multi-source data integration, machine-learning-based evaluation, and SHAP interpretability analysis.
Land 15 00977 g002
Figure 3. Spatial distribution of indicators for tourism development potential in traditional villages.
Land 15 00977 g003aLand 15 00977 g003b
Figure 4. Correlation analysis of variables.
Land 15 00977 g004
Figure 5. Confusion matrices of model predictions.
Land 15 00977 g005
Figure 6. ROC curves of model predictions.
Land 15 00977 g006
Figure 7. Identification of rural tourism competitiveness based on the LightGBM model and SHAP values (only the names of larger villages are marked for better comprehension).
Land 15 00977 g007
Figure 8. Boxplots of indicator scores for villages with different levels of development potential.
Land 15 00977 g008
Figure 9. Ranking of indicator importance derived from SHAP value calculation.
Land 15 00977 g009
Figure 10. SHAP summary plot.
Land 15 00977 g010
Figure 11. Global SHAP interpretability analysis.
Land 15 00977 g011
Figure 12. SHAP dependence plots for the evaluation factors.
Land 15 00977 g012aLand 15 00977 g012b
Figure 13. SHAP-based interaction effects among the main influencing factors. (a) Interaction effect between service facilities and internet attention. (b) Interaction effect between transportation facilities and internet attention. (c) Interaction effect between land resources index and service facilities. (d) Interaction effect between land resources index and internet attention. (e) Interaction effect between cultural resources index and service facilities. (f) Interaction effect between cultural resources index and policy conditions index.
Land 15 00977 g013
Table 1. Evaluation index system for tourism development potential of traditional villages.
DimensionIndicatorData SourceVariable Construction MethodUnit
Resource EndowmentCultural Resource IndexShexian County Bureau of Culture and TourismNational-, provincial-, municipal-, and county-level cultural heritage resources were assigned weights of 4, 3, 2, and 1, respectively. The weighted sum within each village was calculated.score
Land Resource IndexCAS Land Use DatasetDifferent land-use categories were assigned suitability scores: forest land (5), grassland (4), water area (3), cultivated land (2), and construction land (1). Area-weighted averages were calculated at village level.score
Socio-economic ConditionsRoad Network DensityOpenStreetMap (OSM)The weighted length of different road types within each village boundary was divided by village area. Expressways, national roads, provincial roads, and ordinary roads were weighted as 4, 3, 2, and 1, respectively.km/km2
Transportation Facilities (count)Amap POI DataTransportation-related POIs (e.g., bus stations, parking areas, transit nodes) were extracted using Python 3.9 web scraping and counted within each village boundary through spatial join analysis.count
Service Facilities (count)Amap POI DataTourism-related POIs, including catering, accommodation, shopping, and tourism service facilities, were extracted and aggregated at village level.count
Online AttentionWeibo Check-in DataThe number of Weibo check-in records and tourism-related posts associated with each village was collected and spatially matched to village units.count
Institutional Support IndexGovernment Policy DocumentsNational-, provincial-, municipal-, and county-level tourism and heritage policy recognitions were weighted as 4, 3, 2, and 1, respectively.score
Gross Domestic ProductTsinghua University Geodata PlatformGDP raster data were spatially aggregated to village administrative boundaries using zonal statistics.yuan/km2
Natural Environment Ecological Landscape Attractiveness (NDVI) NDVI dataset from the Resource and Environment Science Data Center, Chinese Academy of SciencesAnnual mean NDVI values were extracted using raster zonal statistics at the village level to represent vegetation coverage and ecological landscape quality.NDVI
Hydrological DensityOpenStreetMap (OSM)Total river and stream length within each village was divided by village area.km/km2
Air Quality LevelChinaHighAirPollutants DatasetAnnual average PM2.5 concentration values were extracted using raster statistics at village level.μg/m3
Annual Average PrecipitationClimate raster dataset from the National Tibetan Plateau Data CenterAnnual precipitation raster values were spatially aggregated to village boundaries using zonal statistics.mm
Annual Average TemperatureClimate raster dataset from the National Tibetan Plateau Data CenterAnnual mean temperature values were extracted at village level using raster zonal statistics.°C
ElevationGeospatial Data Cloud DEMMean elevation values were extracted from DEM raster data using zonal statistics.m
Table 2. Model performance comparison.
ModelAccuracyPrecisionRecallF1-ScoreAUC
RF0.8330.8790.7610.791 0.953
LGB0.833 0.850 0.8420.8390.975
XGB0.769 0.816 0.786 0.793 0.962
Disclaimer/Publisher’s Note: The statements, opinions and data contained in all publications are solely those of the individual author(s) and contributor(s) and not of MDPI and/or the editor(s). MDPI and/or the editor(s) disclaim responsibility for any injury to people or property resulting from any ideas, methods, instructions or products referred to in the content.