Article

Urban Green Network Design as an Adaptation Strategy of Mediterranean Cities to Rising Temperatures

1
School of Applied Arts and Sustainable Design, Hellenic Open University, Parodos Aristotelous 18, 26335 Patra, Greece
2
Department of Civil Engineering, School of Engineering, University of West Attica, 250 Thivon & P. Ralli Str., 12241 Athens, Greece
3
Laboratory of Urban Planning and Architecture, Department of Civil Engineering, School of Engineering, University of West Attica, 250 Thivon & P. Ralli Str., 12241 Athens, Greece
*
Author to whom correspondence should be addressed.
Land 2026, 15(6), 908; https://doi.org/10.3390/land15060908
Submission received: 17 March 2026 / Revised: 15 May 2026 / Accepted: 19 May 2026 / Published: 25 May 2026
(This article belongs to the Special Issue Emerging Technologies Towards Sustainable Urban Transitions)

Abstract

Rising temperatures within the urban context, as a result of climate change and the Urban Heat Island effect, have deteriorated thermal comfort conditions in outdoor urban spaces, especially during hot, Mediterranean summer days. This study investigates the potential cooling effects of integrating individual urban green spaces into a connected network, with the aim of improving thermal conditions in public areas. Thermal conditions of an 800 m2 urban area in the city of Athens, Greece, were evaluated for a typical summer day using the environmental model ENVI-met. Based on an assessment of the current microclimatic conditions, a potential thermal adaptation strategy was developed, aiming to redesign the study area as a network of green-blue infrastructure. This includes a 1.5 km walking route connecting various spaces, such as squares, parks, and schools. Air temperature (Tair) and the bioclimatic index PET (Physiologically Equivalent Temperature) were used to evaluate the thermal conditions of the study area. In addition, a new function of the ENVI-met model, Dynamic Comfort, has been implemented to calculate the dynamic Physiological Equivalent Temperature (dPET) index for the selected route. The results revealed significant Tair and PET reductions compared to the current layout, indicating that the integration of open spaces into a network of green-blue infrastructure can improve thermal conditions and reduce the hazardous effects of thermal stress on people. Some notable results include the spatial and temporal decrease of the Tair of up to 6 °C, mainly in the proximity of buildings and fountains. Similarly, PET values decreased mainly by 3 to 5 °C. The Dynamic PET showed a slight reduction during the hours of maximum temperature and a higher decrease during the evening, ranging from 1 to 2 °C.

1. Introduction

Due to population growth, cities are constantly expanding, and the replacement of natural land by infrastructure and residential development has led to an insufficient presence of green and water elements [1], which intensifies the negative effects of climate change. Particularly in urban centers, air temperature is often significantly increased compared to semi-urban or rural areas [2], especially during intense thermal conditions [3], a phenomenon known as “Urban Heat Island” (UHI). Urban areas, consisting of heat-retaining elements and limited vegetation, affect human thermal comfort and amplify thermal stress [4]. For elderly people, the situation is even more unfavorable, making thermal conditions unbearable and even dangerous for their health [5,6]. In light of climate change, the adaptation of urban areas to heat waves and high temperatures is essential to reduce UHI and ensure the well-being of people living in urban environments [7].
The contribution of public spaces to the improvement of the urban microclimate is well recognized, and several studies, especially in recent decades, have focused on the investigation of the microclimatic conditions in outdoor urban areas and the development of adaptation and mitigation strategies that favor thermal comfort conditions [e.g., [2,8]]. This kind of research includes either the use of portable weather stations for the microclimatic monitoring of the study areas (e.g., [9]) and/or the microclimatic simulation of the examined areas using computational fluid dynamics (CFD) models. Using this concept, several studies employ microclimatic simulation scenarios using CFD-based software, such as ENVI-met, to examine how different configurations of vegetation, water bodies, and other urban elements (e.g., paving materials) contribute to the amelioration of the thermal conditions in the examined urban areas [1,8].
These microclimatic simulations aim to assist researchers in identifying optimal solutions for mitigating the urban heat island (UHI) effect [10] or to assess their overall impact on the thermal environment [11]. The thermal comfort conditions are then evaluated using a number of widely acknowledged bioclimatic indices, such as the Physiologically Equivalent Temperature (PET). For example, ref. [12] applied PET to evaluate how nature-based solutions influence thermal comfort through cooling effects in two urban street canyons. In addition, different design scenarios are evaluated, and mitigation and adaptation strategies are developed to ameliorate the environmental conditions of the examined areas. For example, ref. [13] studied the potential impact of different elements of green infrastructure compared to the grey infrastructure and found that, although green surfaces in general improve the thermal comfort conditions, only a minor contribution is derived from the tree arrangement. Due to the complexity of this kind of research design, however, the vast majority of these studies focus on design proposals for specific urban outdoor spaces, such as squares and parks [14], playgrounds [15], etc., leading to small-scale local improvements in the urban microclimate.
In Greece, several previous studies have investigated the microclimatic conditions and thermal comfort in public spaces, conducting microclimatic monitoring, including urban streets [16], parks and squares [17], or courtyards [18]. Nevertheless, most of the previous research did not examine the amelioration of thermal conditions due to the integration of urban outdoor spaces, e.g., [19]. Only in recent years have some studies examined the outdoor thermal conditions and developed adaptation strategies in public spaces, such as squares [20], urban streets [21], urban neighborhoods [22], primary schools [15,23] or pocket parks [24]. In addition, most of the work to date has focused on evaluations using ‘static’ PET bioclimatic indices. To the best of our knowledge, to date, adaptation and mitigation strategies have been developed and evaluated only at the local level, i.e., in urban squares or streets.
The integration of urban green spaces into a single urban green infrastructure network has been suggested recently as a valuable tool in climate change mitigation strategies [25] and in improving urban thermal conditions [26,27]. Beyond their environmental and microclimatic role, urban green and blue networks can also be understood as spatial mechanisms that enhance the quality of public space in everyday urban life. Connectivity between individual open spaces supports not only thermal regulation, but also continuity of movement, opportunities for physical activity, and social interaction, particularly in dense urban environments [28,29,30]. From this perspective, green networks function not only as climate adaptation infrastructure but also as urban planning tools that shape how public space is experienced and integrated into daily routines [31,32]. Guidelines have been developed to design efficient green walking networks in cities [33,34], and some researchers have indicated that dense street trees have the greatest potential for cooling compared to other vegetation [35,36].
Due to the complexity of implementing such approaches, only a few studies have evaluated the amelioration of the urban microclimate through the integration of outdoor spaces in a united network. For instance, ref. [10] focused on the construction of networks and the treatment of connectivity barriers during heat and cold interactions, which is an innovative approach, but difficult to apply in practice. Other recent studies have shown that pedestrians’ thermal comfort exhibits significant spatial variability as they move through interconnected outdoor open areas, reinforcing the need for route-based and network-based approaches [37,38]. The study of ref. [38] developed an interdisciplinary methodology for thermal comfort evaluation utilizing a meteorological device for mobile monitoring of basic meteorological parameters used to calculate the Universal Thermal Climate Index (UTCI). The authors of the study prioritized the most degraded areas based on the highest 5% of UTCI values [38]. The approach of the current study is consistent with recent research developments suggesting urban space as a continuous network of spatial and mobility flows, where the thermal perspective alters dynamically along routes rather than at isolated points [39]. Despite significant advances in research on the urban microclimate and thermal comfort, the majority of previous studies have focused primarily on evaluating individual outdoor urban spaces, such as squares, streets, or parks, examining thermal conditions in static and local spatial contexts. In contrast, research into the thermal experience of pedestrians at the route and network level of interconnected public spaces remains limited, particularly through dynamic bioclimatic indicators that account for user movement within the urban fabric. To the best of our knowledge, the role of integrated green-blue networks as a comprehensive urban adaptation strategy to climate change in high-density Mediterranean cities, such as Athens, has not been examined. This study aims to fill this research gap by evaluating thermal comfort along interconnected public space routes through ENVI-met simulations and the application of both the static PET index and the dynamic dPET index, with a particular emphasis on the experience of vulnerable groups, such as the elderly.
More specifically, considering the integration of open spaces as an urban planning strategy that can shield cities from the challenges of climate change, this study focuses on the connectivity of open spaces by enhancing urban greenery and other essential green-blue infrastructure to improve thermal comfort and encourage active mobility in a densely urban area with typical climatic conditions of a Mediterranean city. In addition, taking into consideration previous findings revealing that the elderly population is particularly vulnerable to high ambient air temperature [21,22,40], this study investigates the thermal conditions both in a typical adult male and an elderly individual. The research was applied in Athens, a city for which the urban heat island effect is well examined [41,42,43,44]. Microclimatic conditions of the study area were simulated during a typical summer day for Athens’ climate employing the environmental model ENVI-met 5.9.0. Thermal conditions were estimated with the bioclimatic index PET, as well as ENVI-met’s newest function, Dynamic Comfort, which calculates the Dynamic PET index, an innovative approach that has so far been applied in very few studies in Greece [22]. Dynamic Physiologically Equivalent Temperature (dPET) refers to the use of the PET index, within transient thermal environments (e.g., from indoor to outdoor areas, or unshaded to shaded areas), to evaluate realistic human thermal conditions, going beyond static PET, by modeling how the body’s heat balance adapts to changing thermal conditions. Therefore, dPET adds movement and time, simulating a pedestrian walking through an urban space, capturing fluctuating thermal environments along their path, providing a more realistic comfort assessment (https://ENVI-met.com/, accessed on 10 May 2025).

2. Methodology—Data Sources

2.1. The Study Area

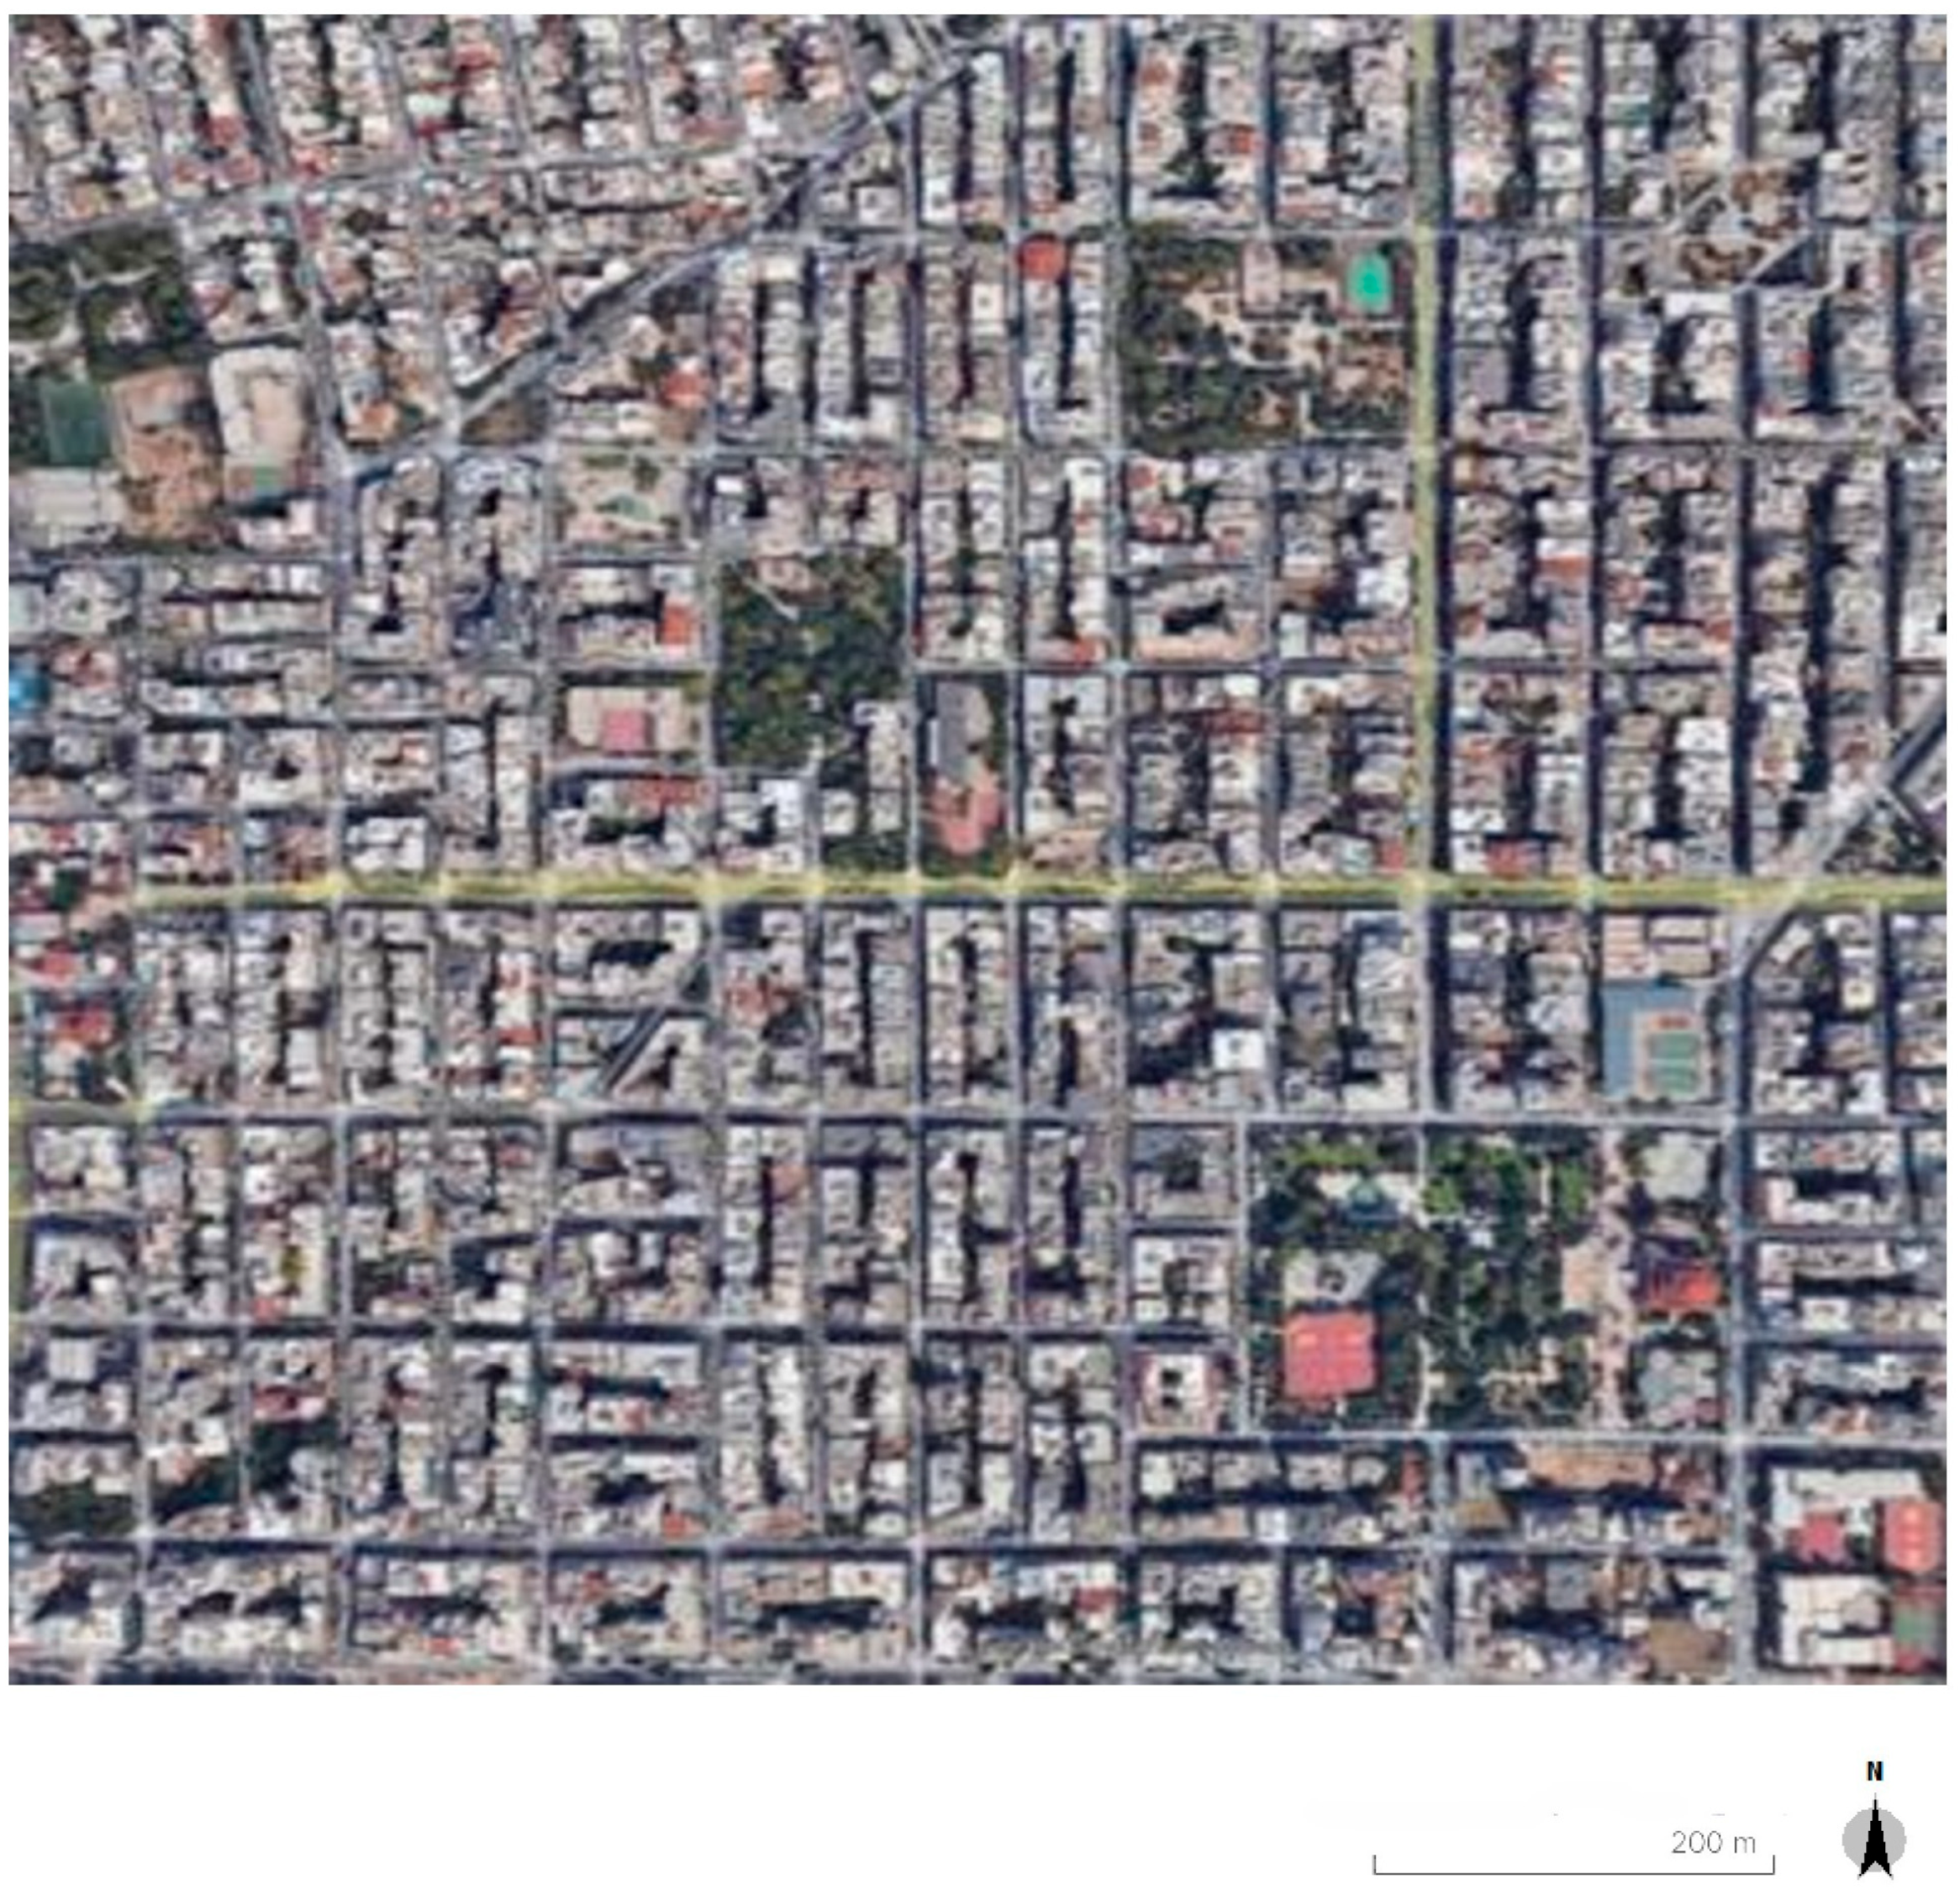
The study area is situated in the Ano Patisia (38°1.453′ N, 23°44.753′ E) neighborhood, a downtown residential area in Athens, Greece. It has been selected as the study area because it is characterized by dense residential fabric with several multi-storey apartment buildings and little vacant space in the city blocks, based on data collected by satellite images (Figure 1) and the building terms imposed by Greek Urban Planning (epoleodomia.gov.gr), which determine, among other things, coverage rates, maximum height and number of floors. It includes most categories of urban outdoor spaces, such as streets and parking lots, courtyards, as well as recreation parks and squares [45]. With a trajectory that started in early antiquity and its role as the capital of Greece since 1832, Athens presents a unique urban landscape shaped by layers of cultural heritage and accelerated modern development [46]. Over the past century, the city of Athens has shifted from a compact mono-centric city to a more dispersed Mediterranean metropolis, largely shaped by rapid and often unregulated expansion [47]. Patisia is one of the oldest sections of the Athenian urban fabric, predating many of the capital’s later suburban developments [48].
Until 1910, all state interventions in urban planning consisted of extensions of the city plan and also of ad hoc modifications such as the opening of streets, the design of squares, and the arrangement of small districts. Although the earlier plans of Stamatis Kleanthis and Eduard Schaubert (1832–1834), as well as Leo von Klenze’s revised plan of 1834, had introduced an ambitious neoclassical framework for the newly established capital, these remained only partially implemented in practice. During this period, the area covered by the legally approved city plan of Athens had increased tenfold; yet no attempt had been made to conceive of the city’s development as a unified and coherent undertaking. It is important to note that the area along Patision Avenue had been a peri-urban suburb during the mid and late 19th century, hosting upper middle-class holiday mansions. In 1908, Ludvig Hoffman’s plan included the expansion of the city to the Patisia neighborhood (ibid) [49].
The fast post-war reconstruction was driven primarily by the antiparochi (flats-for-land) system, affecting the neighborhood of Patisia [50]. In addition, widespread informal constructions, later legalized by the state, enabled the city to expand in growth, despite limited capital. Significant challenges, such as air pollution, traffic congestion, and infrastructural strain, have been at the forefront since the late 1980s.
Regardless of successive master plans, several factors, such as weak implementation, poor coordination across policy sectors, environmental pressures, and limited public participation, slowed a meaningful reform of the area. Current strategies, including the Athens Resilience Strategy for 2030, now aim to correct these patterns by promoting sustainable land-use management, improving environmental quality, and strengthening citizen involvement in planning [51].
Focusing on planned green urban spaces, the evolution of Athens’ squares reflects the city’s broader historical shifts—from symbolic nation-building to functional public areas and later modernist redesigns shaped by emerging environmental concerns. Today, amid fragmented design approaches and frequent ad-hoc interventions, these squares highlight persistent urban planning challenges as vulnerable groups increasingly reshape public space [52].

2.2. Climatic and Microclimatic Conditions of the Study Area

According to the Köppen climate classification [53], Athens has a Mediterranean climate characterized as mildly humid, with dry, warm to hot summers (Csa). During the summer season (June to September), the average daily temperature in Athens is 26.1 °C, while the mean daily maximum and minimum temperatures are 31.6 °C and 21.6 °C, respectively [18]. The meteorological data were obtained from the closest meteorological station to the study area, that of Ano Patisia meteorological station (elevated at 87 m, 38°1.317′ N, 23°43.748′ E). The examined date was selected to represent the typical monthly air temperature of July 2024. Thus, the average monthly temperature of July 2024 was recorded at 32.3 °C, and 8 July 2024 was selected to be examined, as the average daily air temperature was recorded at 32.4 °C. Table 1 presents the historical climatic characteristics of July, the monthly climatic conditions in July 2024, and the meteorological characteristics of the examined day (8 July 2024), which were used as input data in ENVI-met 5.9.0 for the microclimatic simulations.

2.3. Microclimatic Simulations and Thermal Conditions in the Study Area

The ENVI-met computational model [54] was used to simulate the area. ENVI-met is a three-dimensional microclimate modeling system designed to simulate surface–plant–air interactions in an urban environment with a typical resolution of up to 0.5 m in space and 1 to 5 s in time (www.ENVI-met.info, accessed on 10 May 2025). The model is based on the fundamental laws of fluid dynamics and thermodynamics and is able to simulate the urban microclimate as an interactive system consisting of dozens of dynamic subsystems: from atmospheric dynamics, soil physics, vegetation effects and response, pollutant dispersion to the indoor climate of buildings (www.ENVI-met.info, accessed on 10 May 2025). Typical application areas of the ENVI-met model are Architecture, Landscape Architecture, Building Design, and Environmental Design.
ENVI-met provides the ability to simulate all the elements that make up the complex composition of an urban area [2,27] and, more specifically, all the characteristics of the soil, buildings, green and water elements, traffic on the streets, etc. The simulation for each of these can be performed in as much detail as required, depending on the purposes of the study and the type of results that are desired. The necessary data include a file that describes the three-dimensional geometry of the study area, a file with meteorological data for a selected time period and, finally, a database regarding air pollution sources, trees, soil, and surface materials, etc. [55]. ENVI-met is a powerful tool for modeling both microclimate conditions and thermal comfort at the scale of open public spaces [55], as it overcomes many of the limitations of other corresponding models. Moreover, it offers a particular advantage in plant-related simulations, because it allows a detailed definition of plant morphology and can simulate the heat and mass exchange between plants, the atmosphere [11] and free surfaces in urban areas [55].
To verify the accuracy of model simulation results, many previous studies have combined in-situ microclimatic monitoring alongside ENVI-met microclimatic simulations for validation purposes [11,27]. This approach typically involves a direct comparison between measured data and model outputs and discrepancies between simulated and observed conditions are frequently reported [56,57]. According to ref. [56], these discrepancies may stem from inherent limitations of the model—such as the use of fixed values for cloud cover and wind speed—as well as from assumptions made by users, including simplifying vegetation to a single tree type, potentially overestimating surface reflectance (SR), or relying on meteorological data from nearby stations rather than measurements collected on site. In particular, the model tends to underestimate cooling in shaded locations while overestimating cooling in sun-exposed areas, largely because vegetation–radiation interactions are not fully represented. Considering, however, the software’s relative reliability and its widespread use in the literature, many recent studies have employed ENVI-met without performing explicit validation [40,56,58]. Although the present study did not perform in-situ measurements for the validation of ENVI-met 5.9.0, ENVI-met validation has been carried out in previous studies conducted within the present study area [9], where the following metrics were evaluated: the Root Mean Square Error (RMSE), the Mean Absolute Error (MAE), and the index of agreement (d). The results of the statistical metrics gave adequate validation scores for Tair (d = 0.8; MAE = 1.6 °C; RMSE 2.0 °C), PET (d = 0.7; MAE = 5.3 °C; RMSE 6.9 °C) and UTCI (d = 0.8; MAE = 3.3 °C; RMSE 4.3 °C), indicating reliability of the model for the area under consideration.
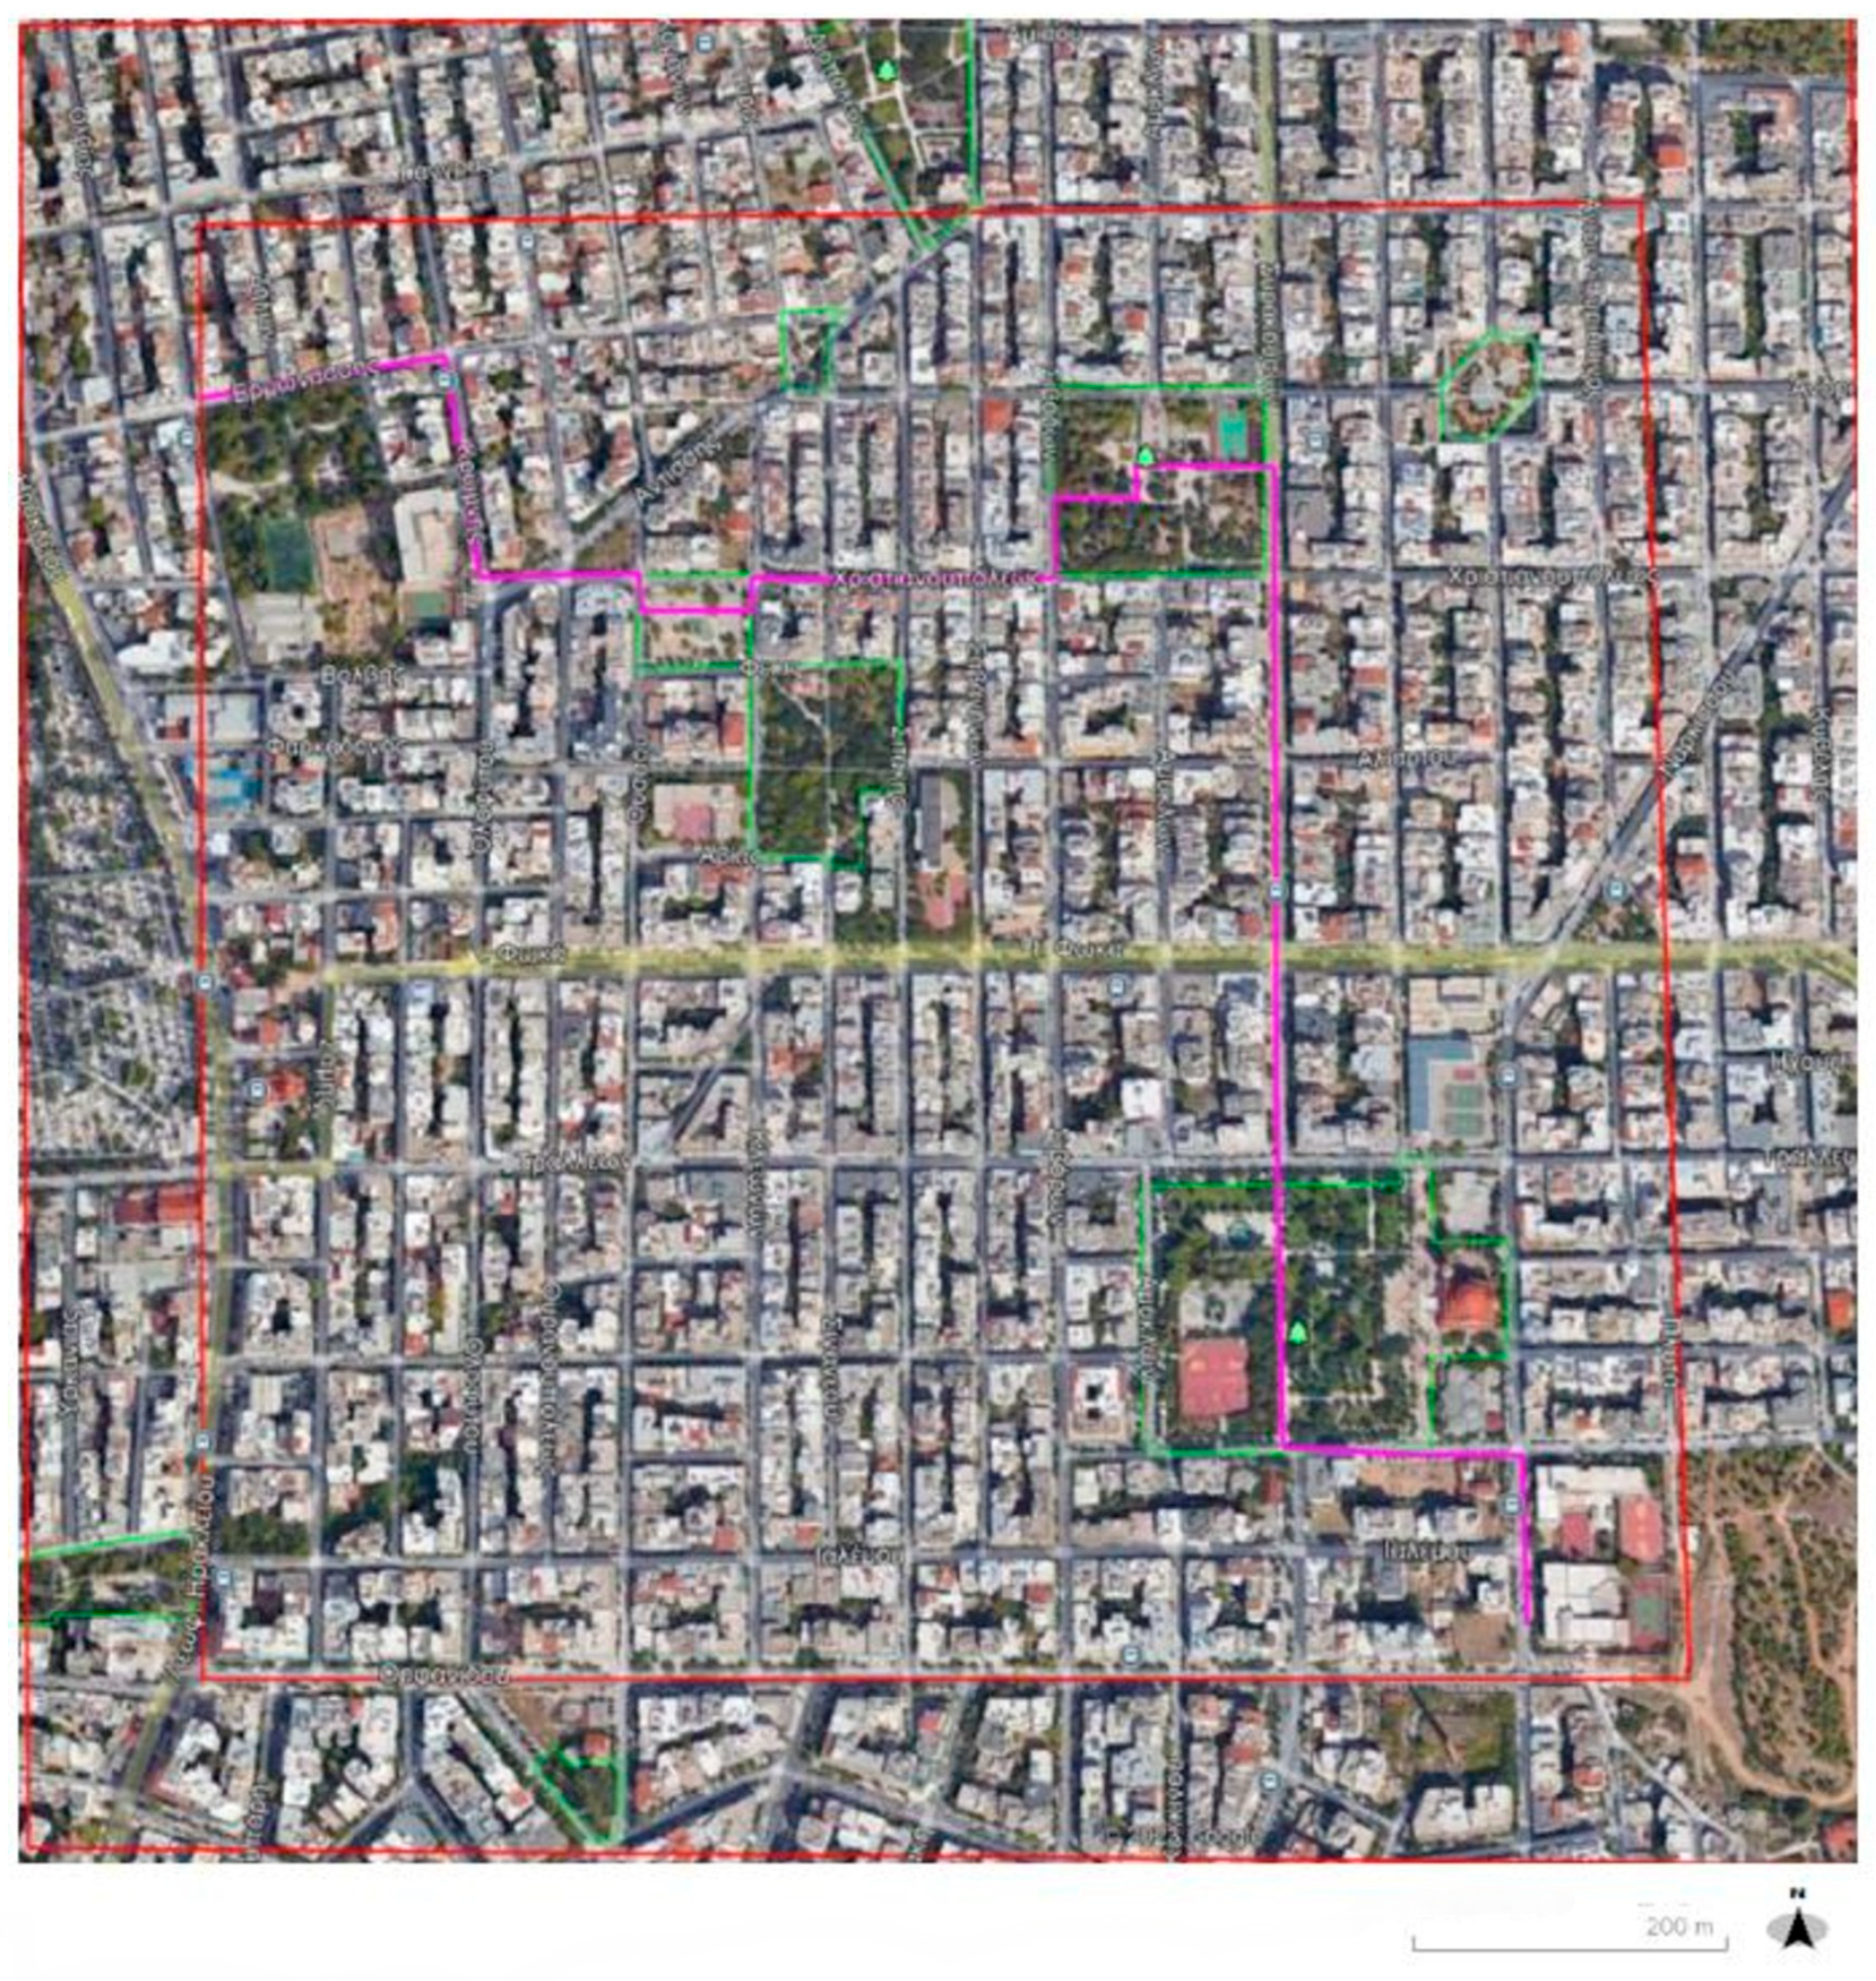
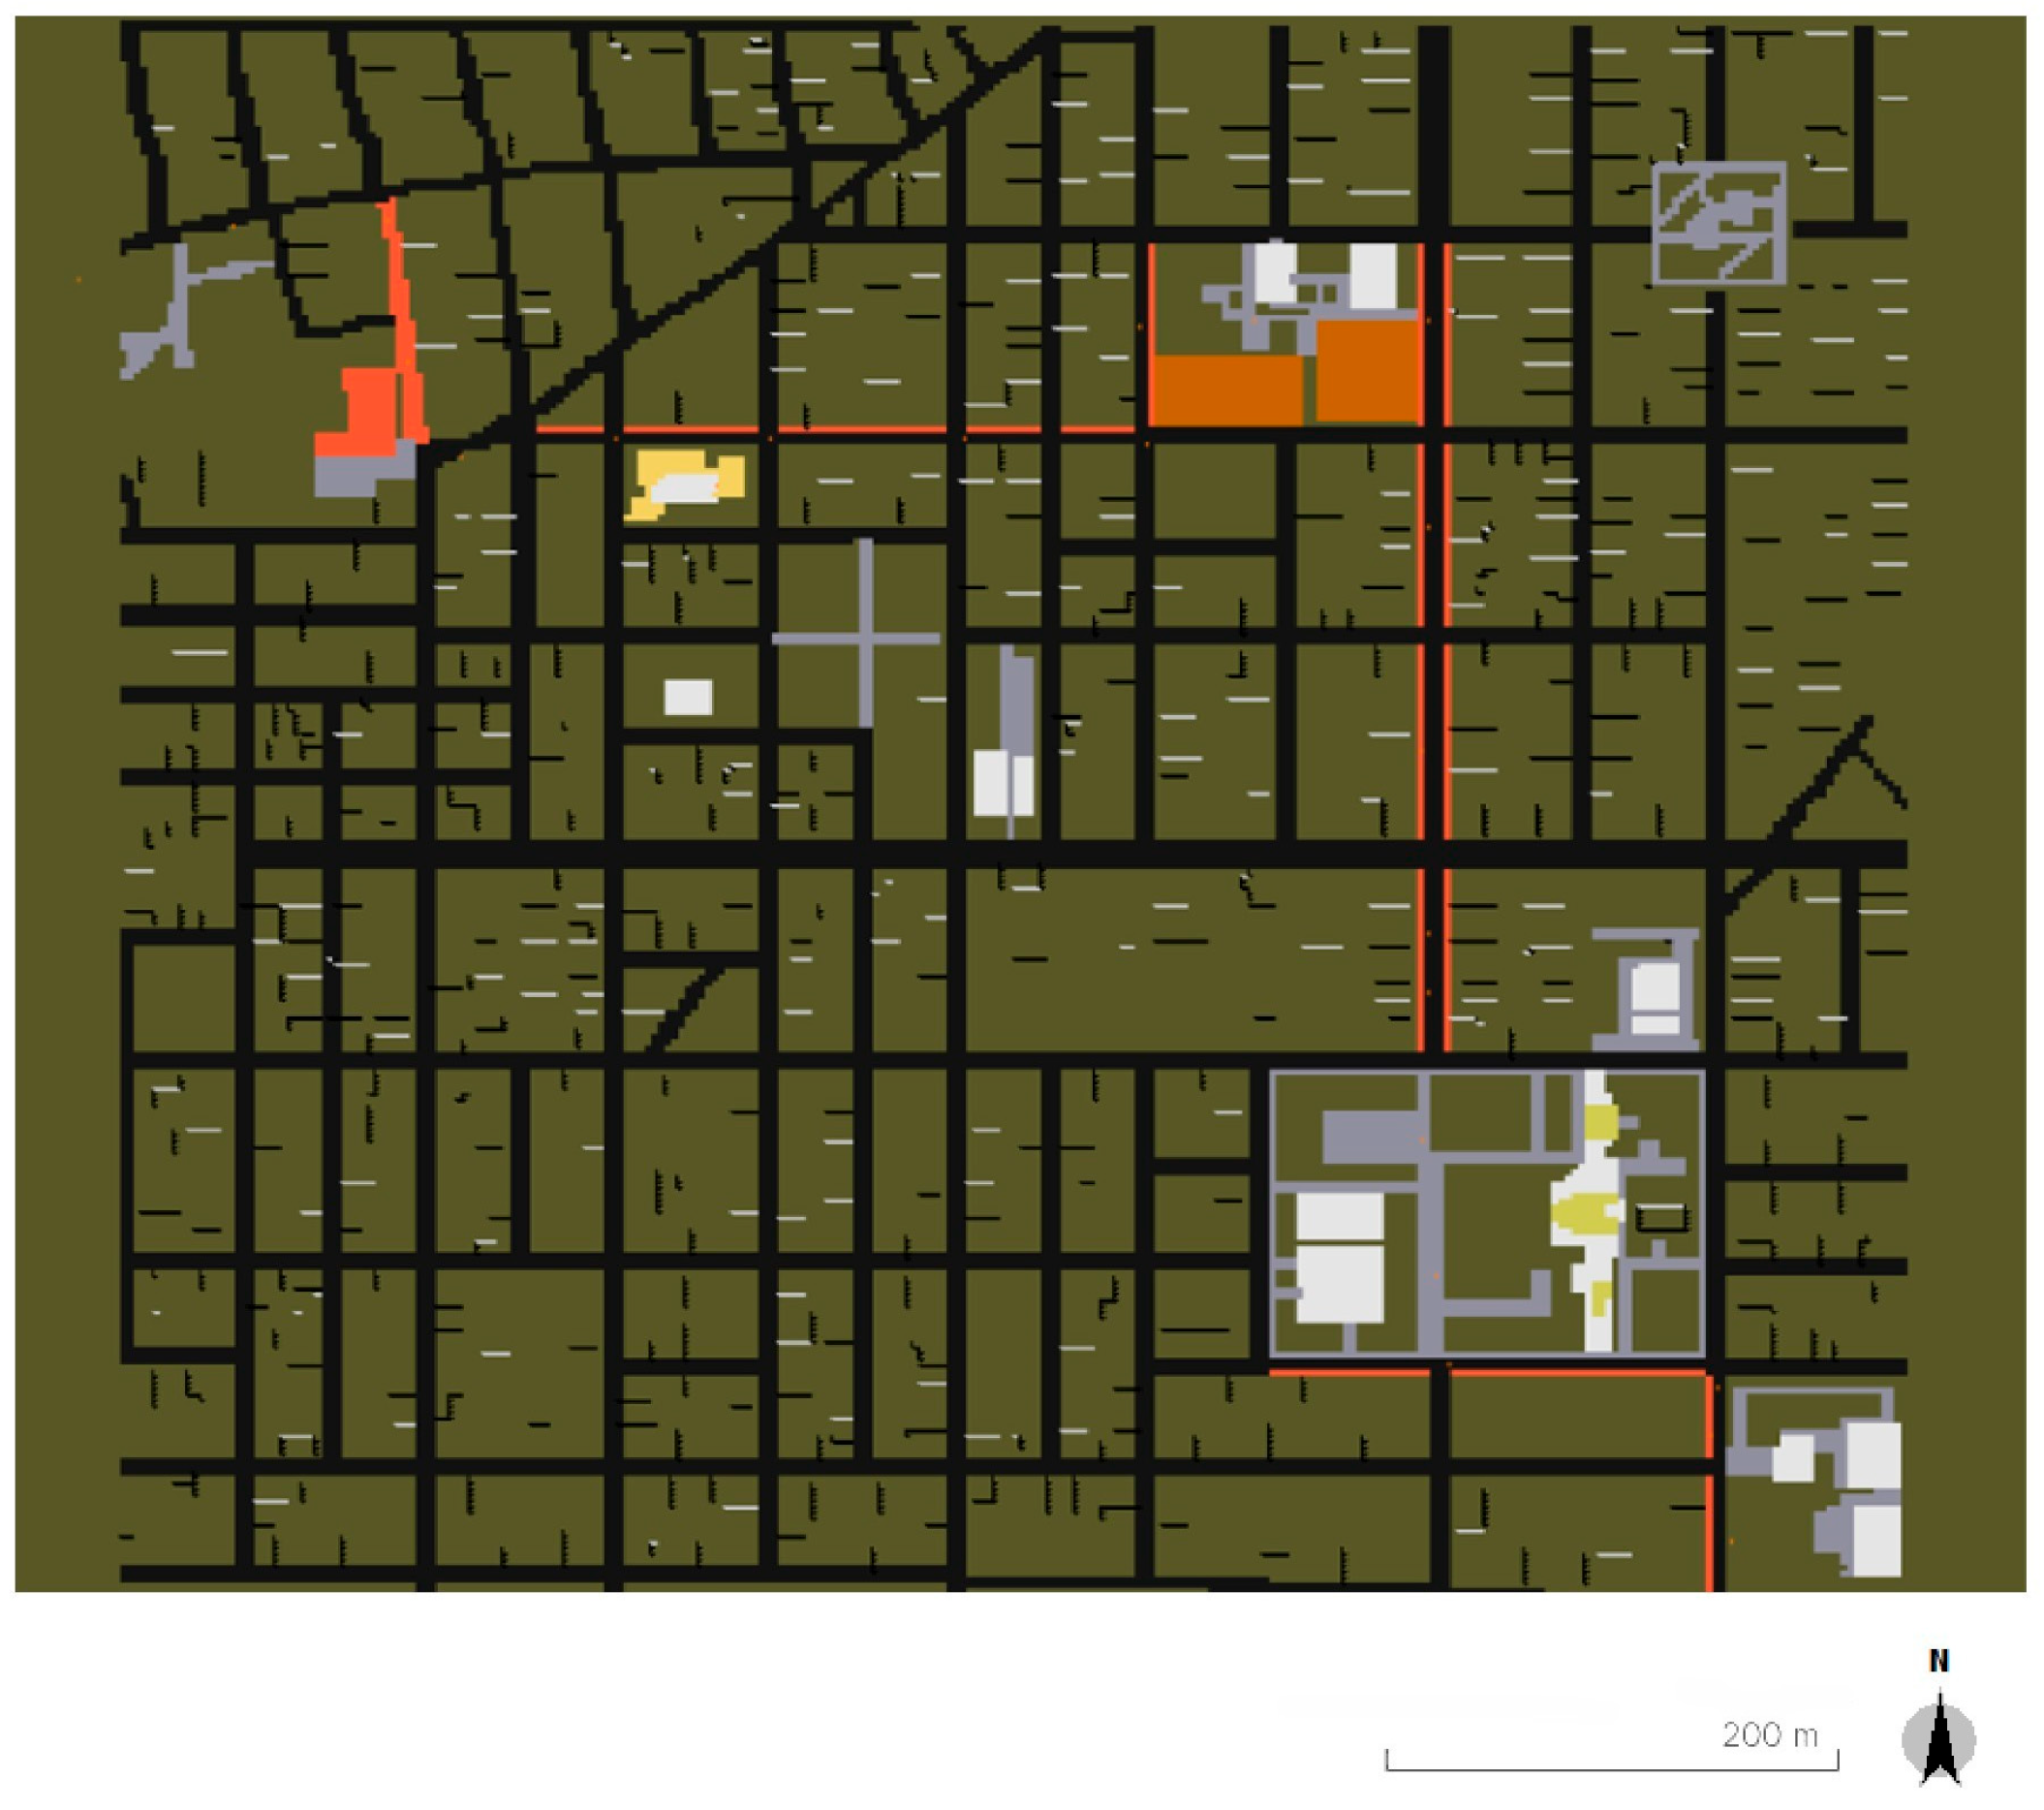
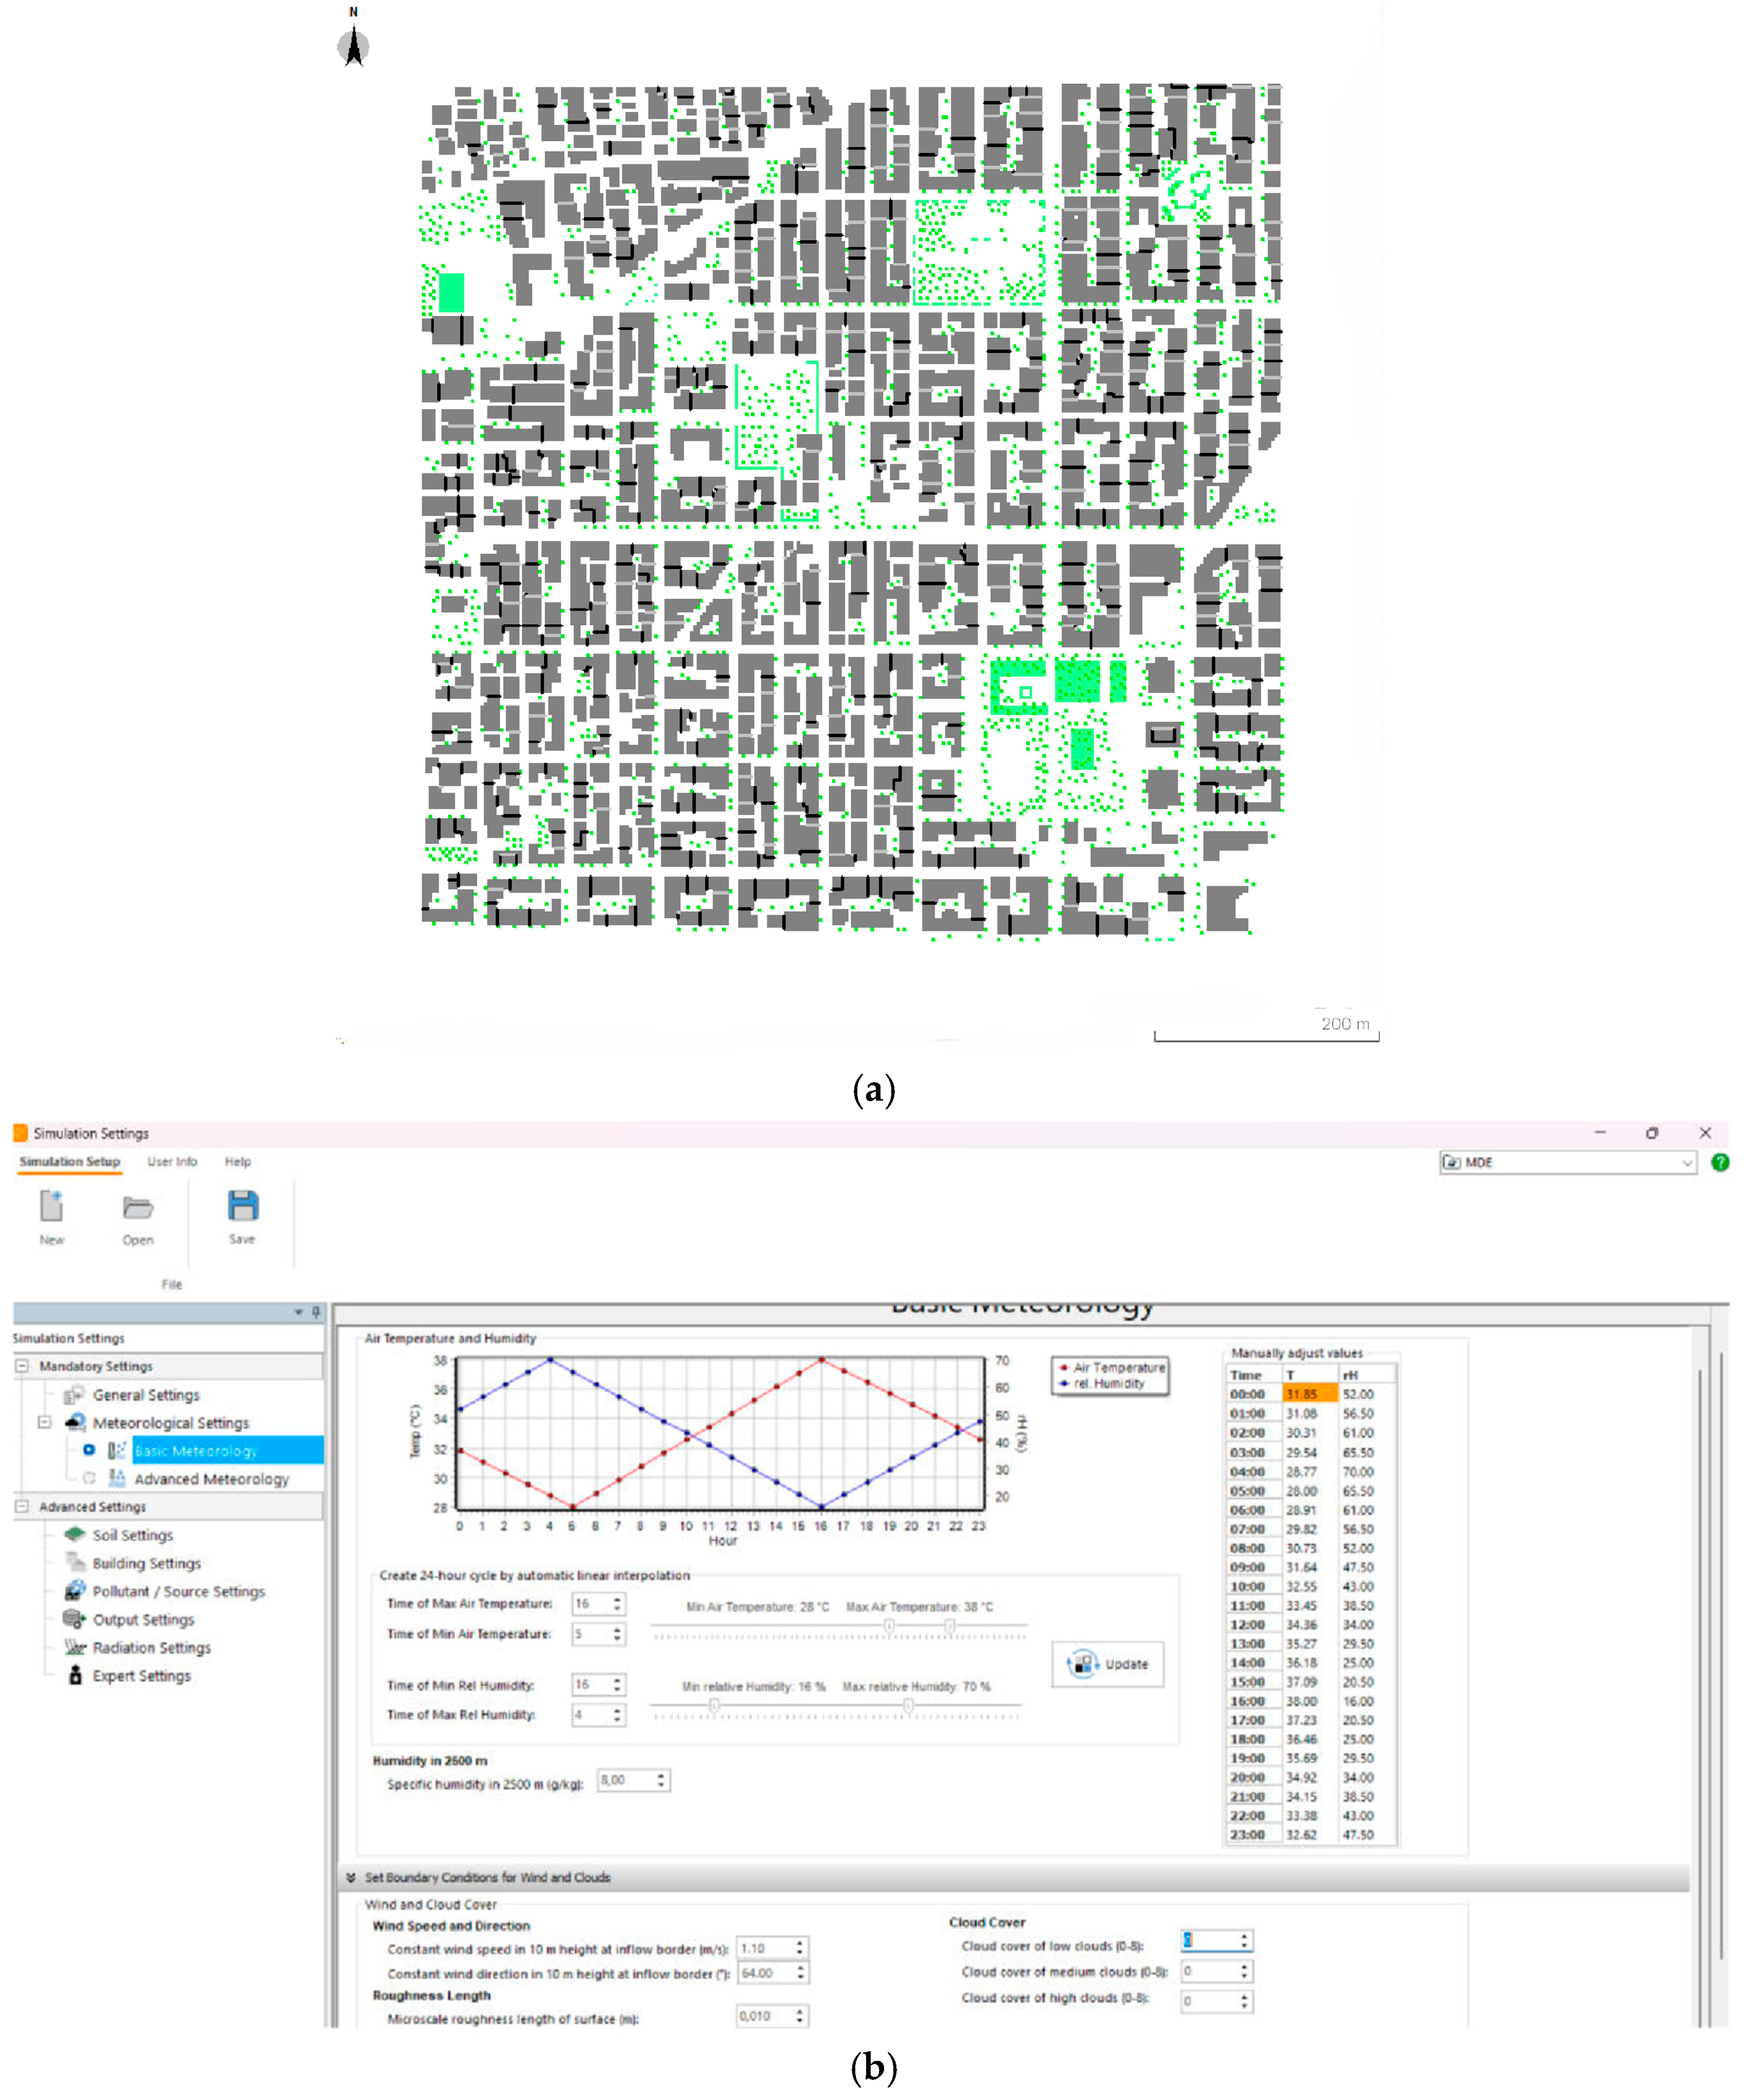
The study area (Figure 2 and Figure 3a) was defined as an 800 m × 800 m square. A grid resolution of 3 m × 3 m was applied, corresponding to 266 × 266 cells in the ENVI-met 5.9.0 model.
By introducing the general information about our study object, the modeling process continues in the ENVI-met 5.9.0 tools in the order presented below.
Initially, in the Spaces tool of ENVI-met 5.9.0 software, all the elements that constitute the natural and built environment of the selected area were introduced, starting with the materials that cover the surfaces.
The materials used for the study area are:
  • Asphalt—asphalt;
  • Yellow bricks—yellow bricks;
  • Red bricks—red bricks;
  • Pavement slab—pavement, light/used.
For the rest, the default program selection of Default Sandy loam was maintained.
Then, the vegetation was introduced, which includes:
  • Grass;
  • Olive trees (Olea Europea);
  • Orange trees (Citrus Aurantium);
  • Pines (Pine-like trees) and
  • Mulberries, which, as they are not included in the existing ENVI-met 5.9.0 catalog, were simulated in the program as deciduous trees, with dense foliage, an average trunk and a height of 5 m.
Next, the buildings were modeled throughout the area. The buildings vary significantly in height, ranging from 3 m (single-storey ground-floor houses) to 24 m (8-storey apartment building). After studying the area, the heights were chosen to represent the real ones as closely as possible.
The sources in the study area include traffic on the streets (typical traffic was selected from the program) and a fountain in a square.
The meteorological data of 8 July 2024 (Table 1) were then added to simulate the microclimatic conditions for the examined day, using the ENVI-guide tool. In addition, the start time and duration of the simulation were selected at this stage. The current simulation started at 01:00 and lasted 23 h until the end of 8 July 2024, with the hours of interest being between 12:00 and 21:00 (Figure 3b).
The ENVI-core module performs numerical simulations, with computation time varying according to the size of the study area and the selected simulation period. The resulting output files are subsequently imported into the BIO-met tool to extract quantifiable parameters for thermal comfort assessment, including bioclimatic indices such as PET, dPET, and UTCI. The BioMet ENVI-met 5.9.0 add-on tool (ENVI-met/BioMet, 2020) was applied to calculate the Physiologically Equivalent Temperature (PET, °C) [59,60]. PET links the skin and body temperature due to external conditions with the air temperature that causes the same thermal response in the individual indoors, through the calculation of the energy balance, with the same sweating rate and skin temperature [59,60].
BioMET calculates the bioclimatic indices by summarizing basic ENVI-met 5.9.0 microclimatic outputs, i.e., the simulated values of the hourly Tair (°C), humidity (RH%), mean radiant temperature (Tmrt, °C) and wind speed (WS, m.s−1) on human thermal sensation. PET was applied to assess the impact of the examined design scenarios on thermal comfort. In addition, thermal conditions were also evaluated using air temperature (Tair, C), the simplest measure of thermal sensation.
In this study, PET was calculated for a typical adult in summer clothes (Default setting: Male; age: 35-year-old male; Height: 175 cm; Weight: 75 kg; Body position: 1.34 m/s; Clothing: 0.5 clo; Preferred speed: 0.9 m/s) and a typical elderly person (Default setting: Male; age: 80-year-old male; Height: 165 cm; Weight: 65 kg; Clothing: 0.5 clo; Preferred speed: 0.9 m/s), with characteristics that are available as a default from the ENVI-met 5.9.0 software. The assessment is made based on the index’s thermal stress scale (Table 2).
For this work, as one of the main purposes was to apply the new dPET index, the use of the PET bioclimatic index was chosen over another, such as the UTCI. To evaluate the results of the PET bioclimatic index, Table 2 will be used, and more specifically, among the two options, the scale of thermal stress levels.

2.4. Scenarios

Scenario 1 (initial conditions—Ic) evaluates thermal conditions in the current design layout of the study area, simulated as described.
Scenario 2 (redevelopment) evaluates the changes in thermal conditions after the redevelopment proposed below.
Redevelopment of the area included a 1.5 km route, connecting individual outdoor spaces to create a distinct “green path”. Selection criteria for this route were the initial simulated thermal conditions, as well as the connection of points of interest (schools, public transit stops) and outdoor spaces where pedestrians spend short or longer periods of time, such as parks and yards. The main objectives were improving thermal comfort for pedestrians as well as promoting active mobility in the summer months.
The route, starting from the bottom right as shown in Figure 4, connects two schools and the large ‘St. Andreas’ Square, which includes a church, kindergarten, fields, and a playground. Crossing the square, the route continues on ‘Syracuse Street’, which is in the middle of tall buildings (apartment buildings) to Fida Square. Crossing the square and proceeding along ‘Christianoupoleos Street’, the route reaches a playground, and from there, continues to a school and Thermida Park, where it ends. It should be noted that there are several public transport stops on the streets of the selected route.
After analyzing the characteristics of the study area, the objectives of the interventions were defined, and a corresponding proposal plan was developed that is largely applicable to the existing site conditions. Interventions at the street level are particularly challenging, as fixed elements such as roads and buildings cannot be modified or removed.
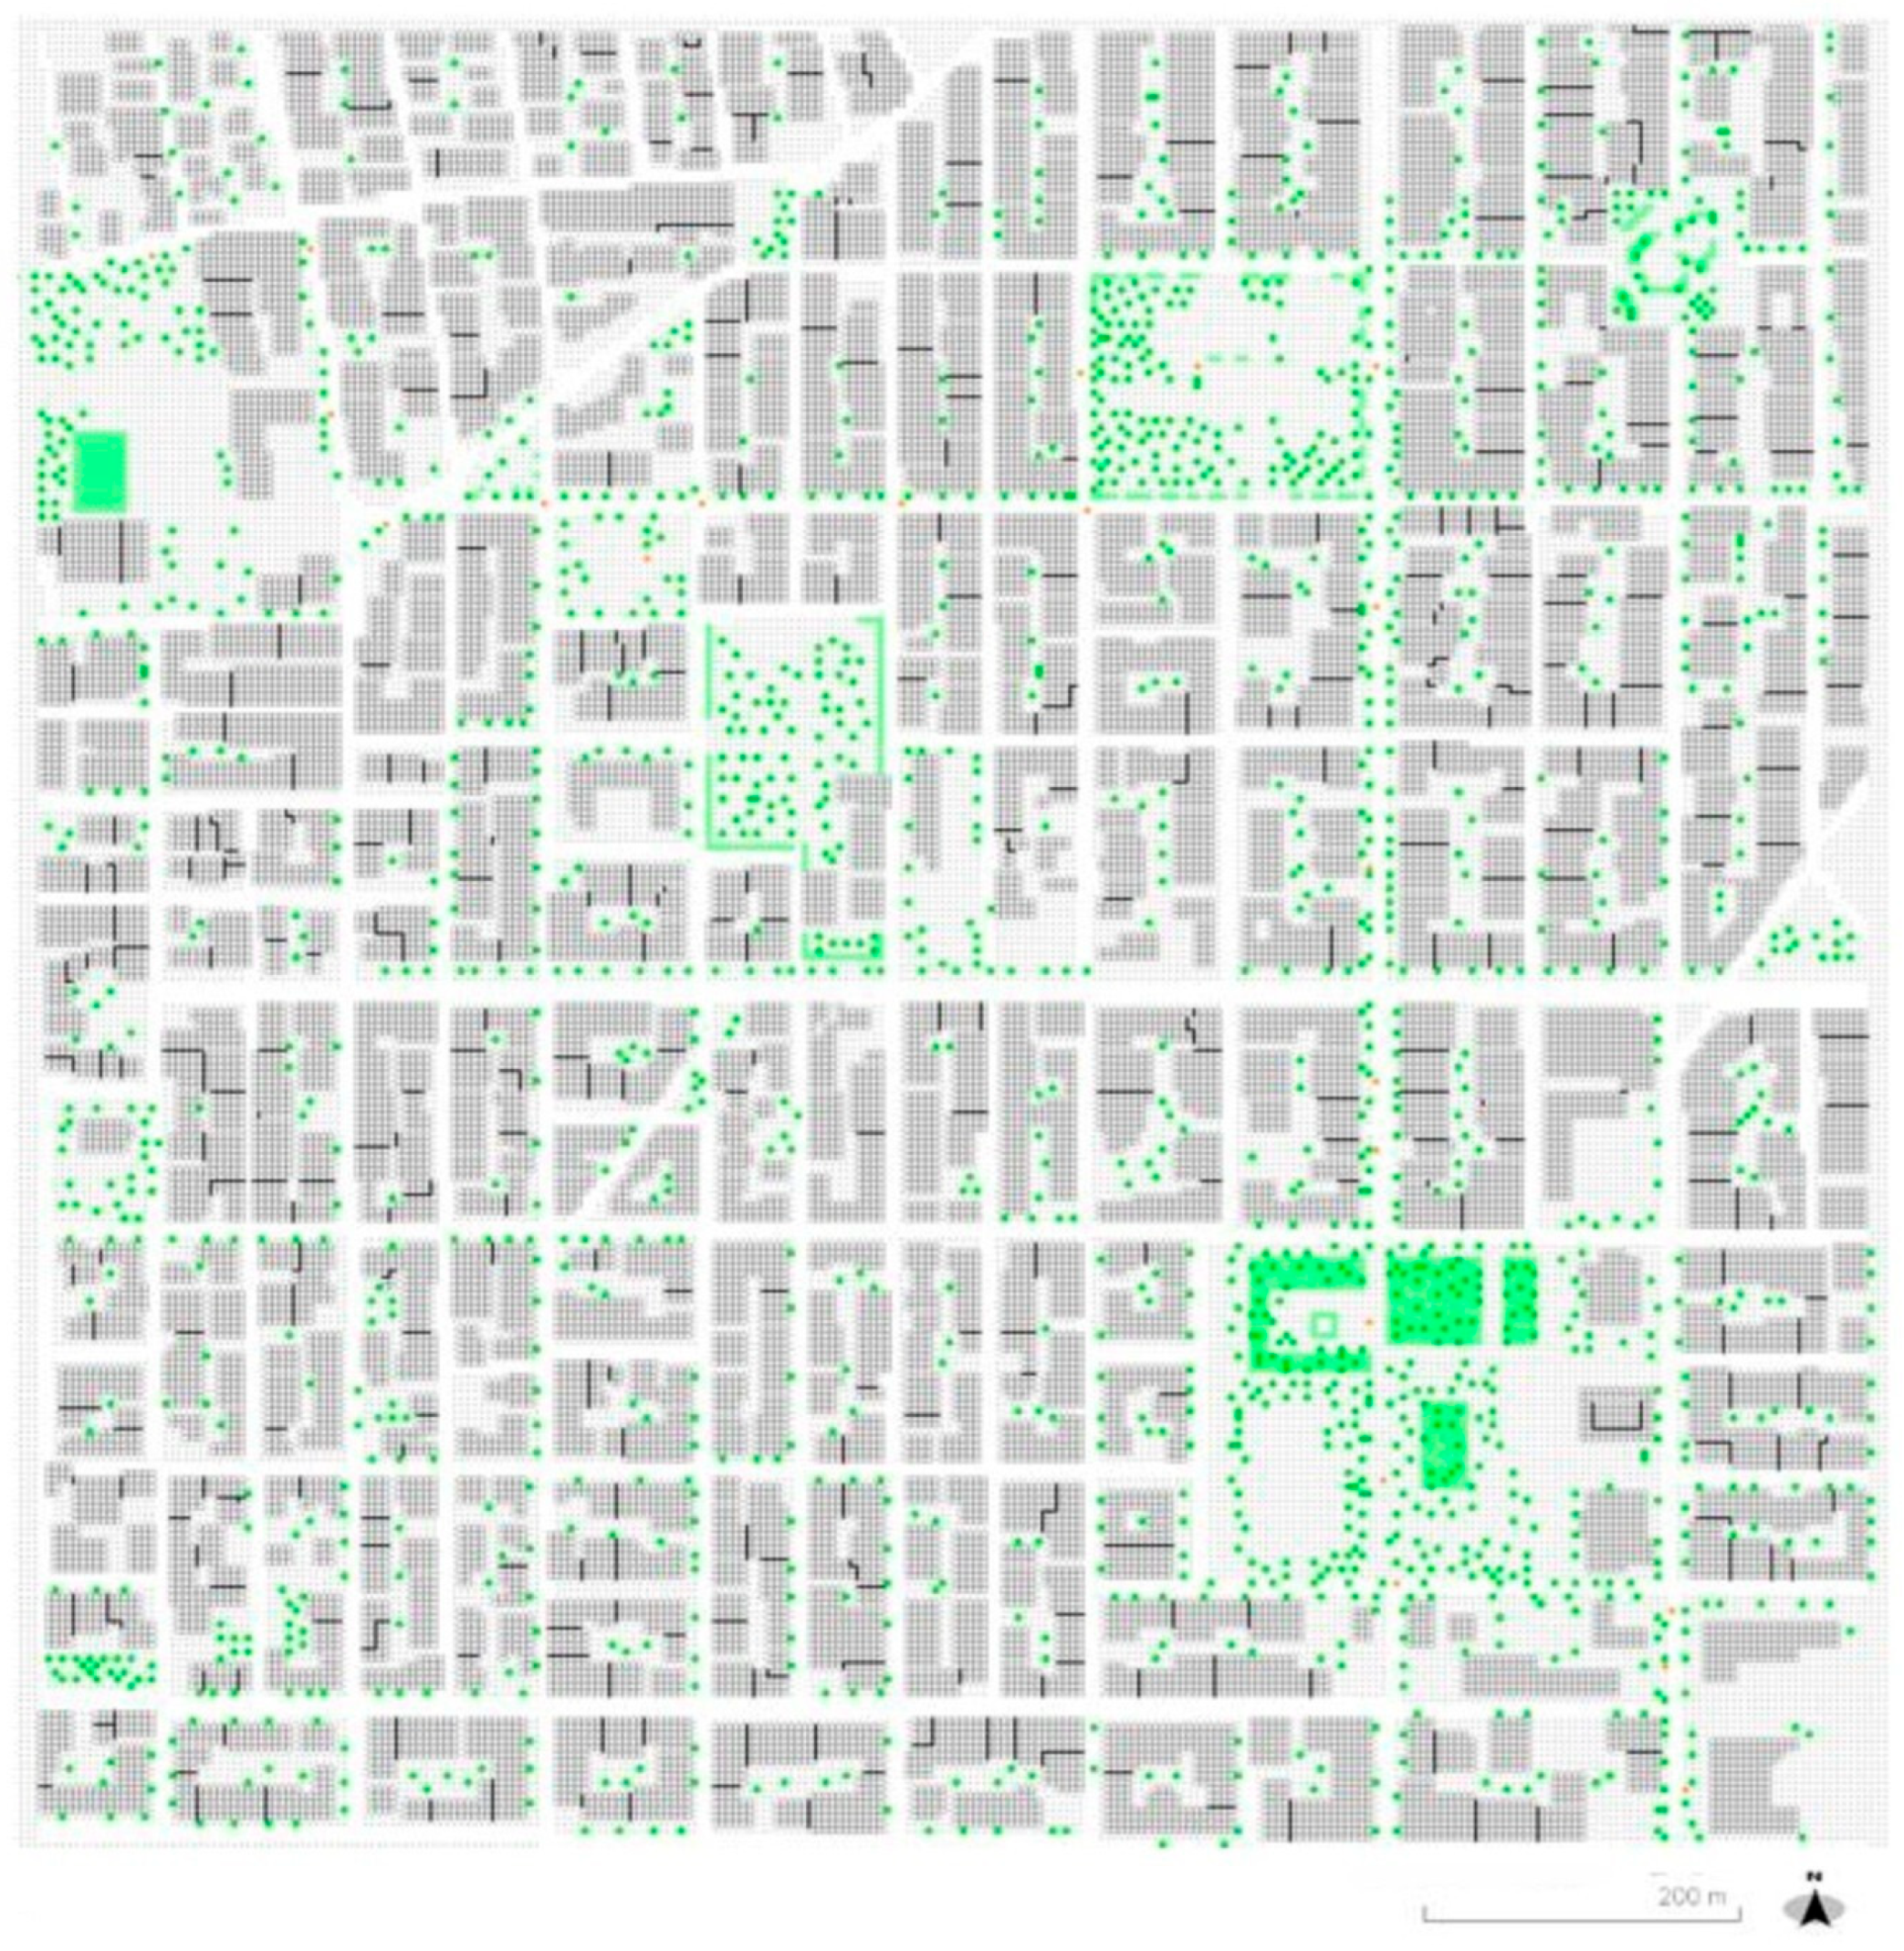
In the redevelopment proposal, trees with large canopies and dense foliage (such as mulberries) were selected and placed in addition to the existing ones, with short distances between them, in order to achieve better results (Figure 5). Between plantings, small fountains with water jets, with close distances between them (a few meters), were chosen, so that they can function as a blue infrastructure network with maximum efficiency.
To achieve the connection of individual outdoor spaces, while maintaining the main functions of the streets (traffic, parking), the solution of creating zones for the location of the interventions was chosen. More specifically, 3 m wide strips of red cobblestone were placed on one side of the street or on either side of it where the width was sufficient (Figure 6). Between the plantings and water features that will be mentioned below, provision was made for the maintenance of some parking spaces, mainly for the residents of the area. Lastly, a smaller street was chosen to be converted into a low-traffic street. Asphalt is removed and paved with red cobblestones like the zones on the other streets. Due to its small width, this street is mainly used for roadside parking with non-existent or narrow sidewalks.

3. Results

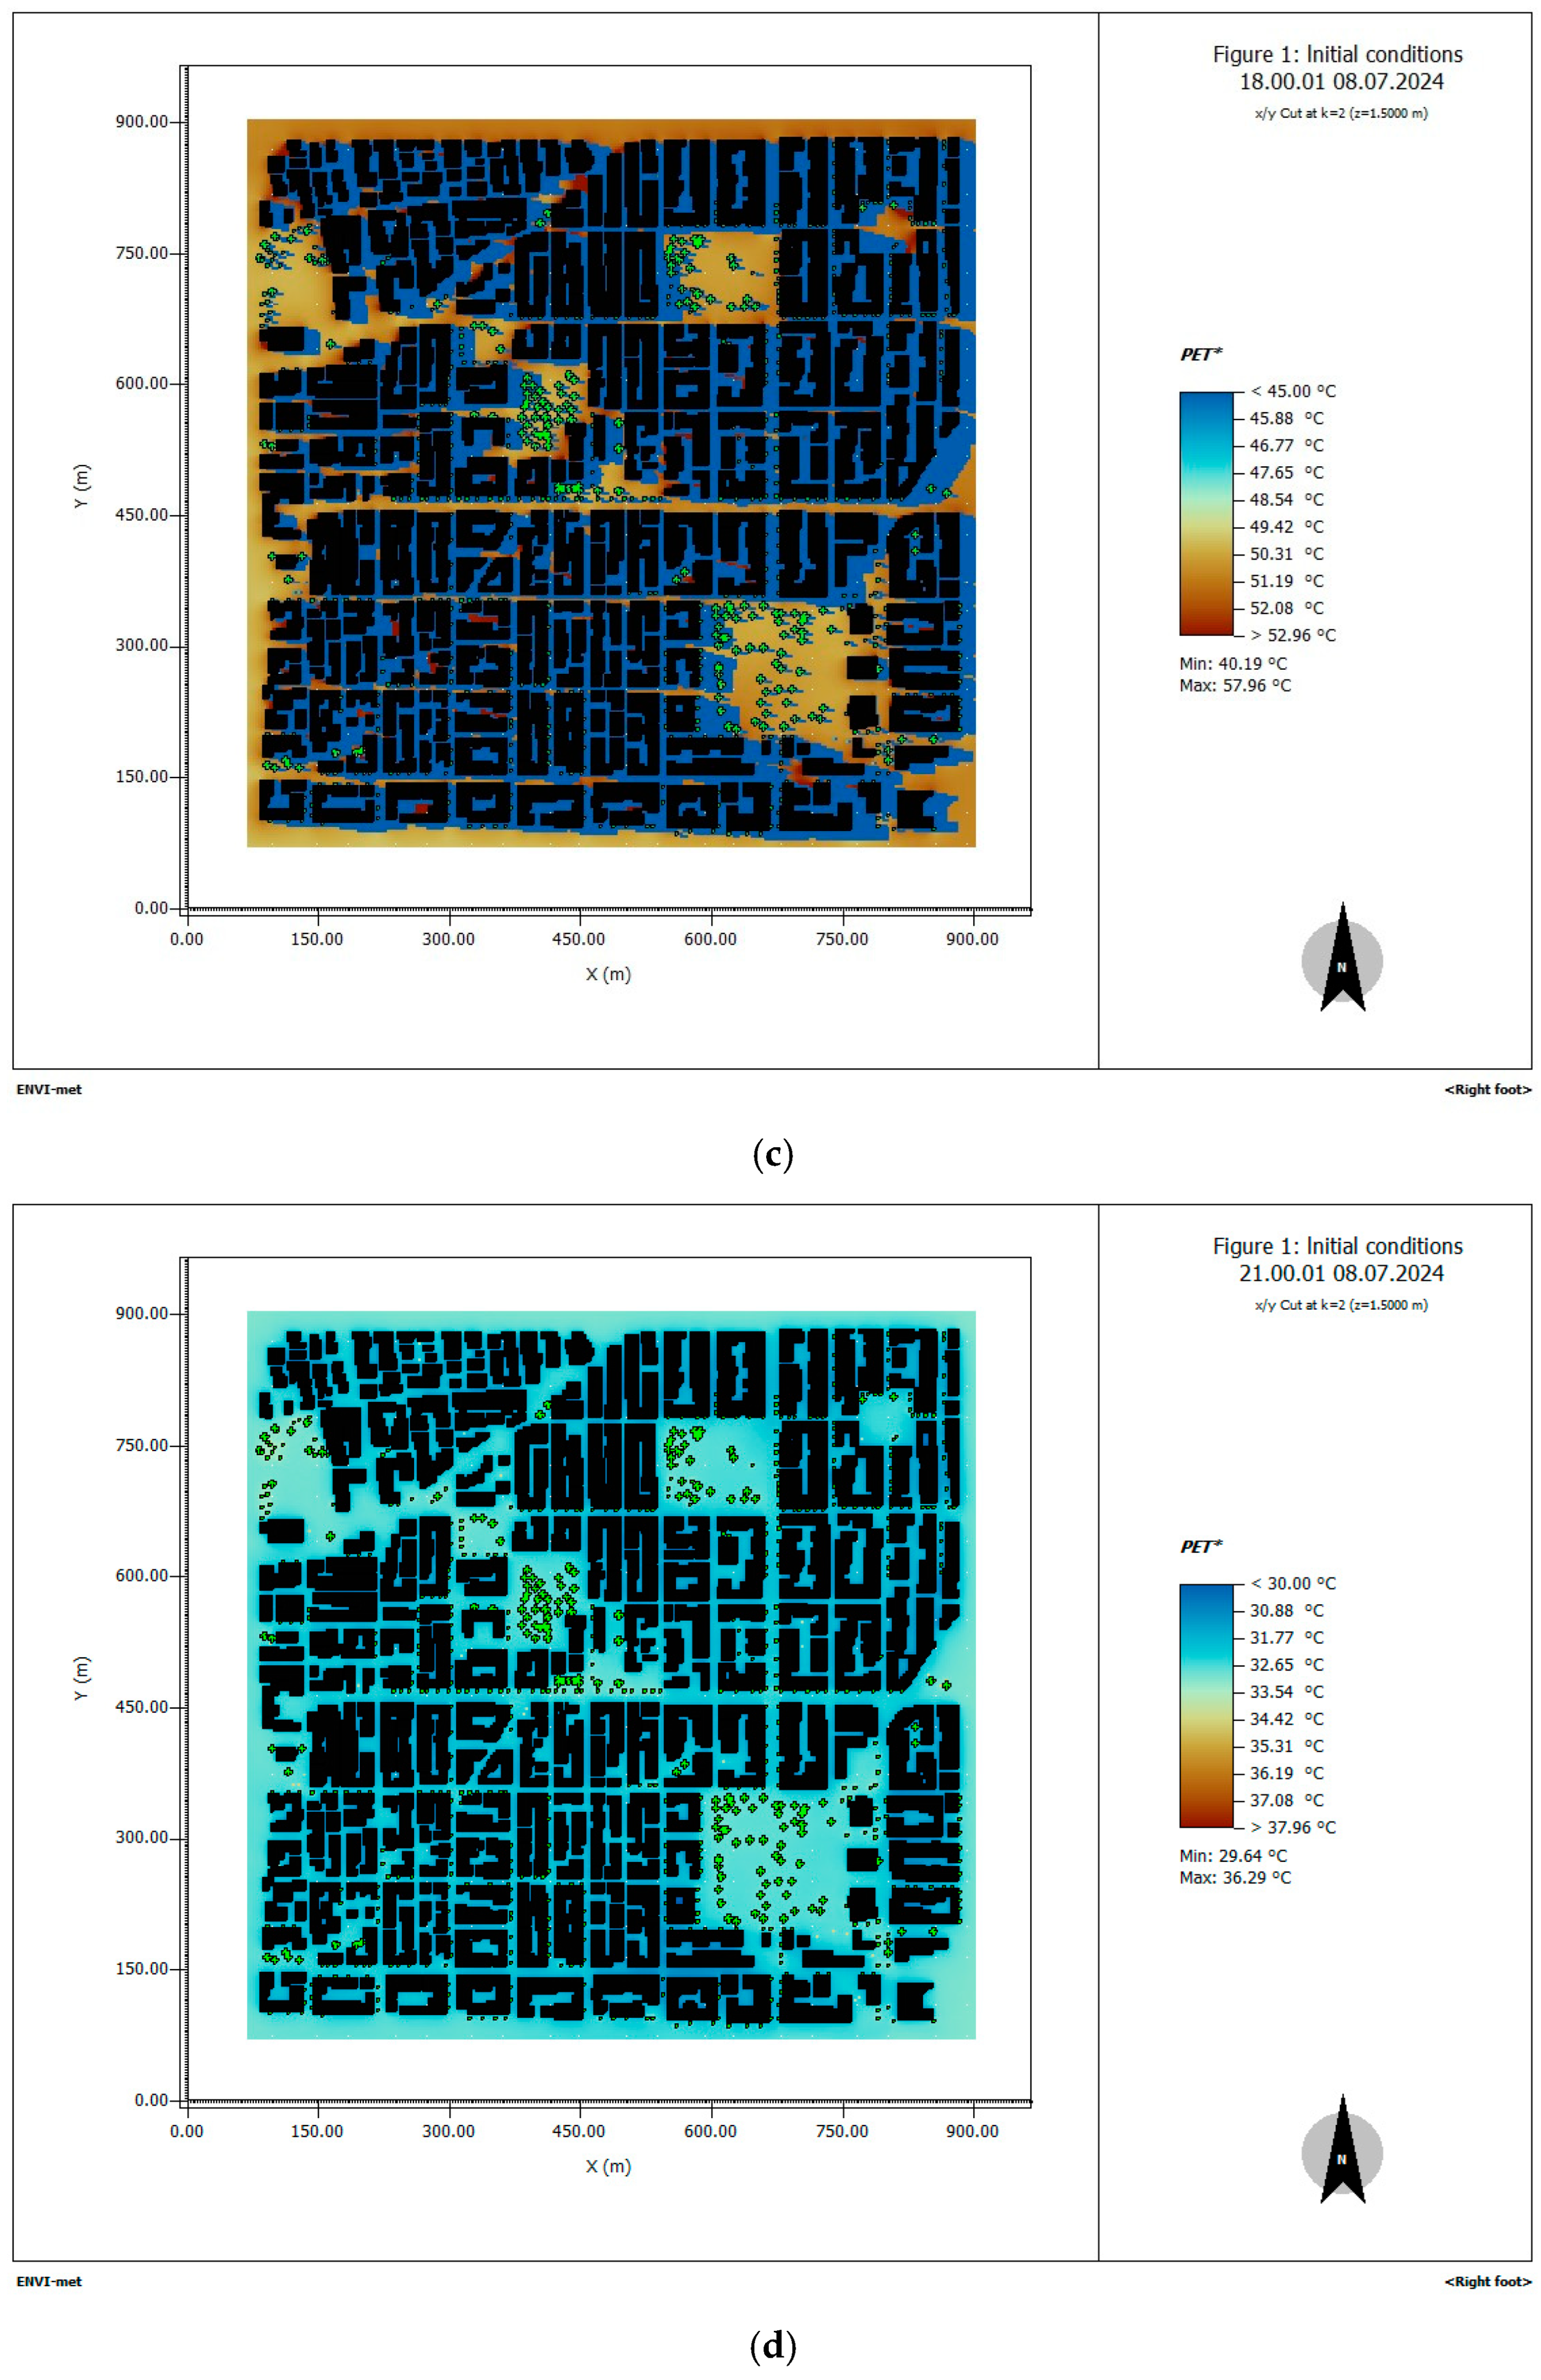
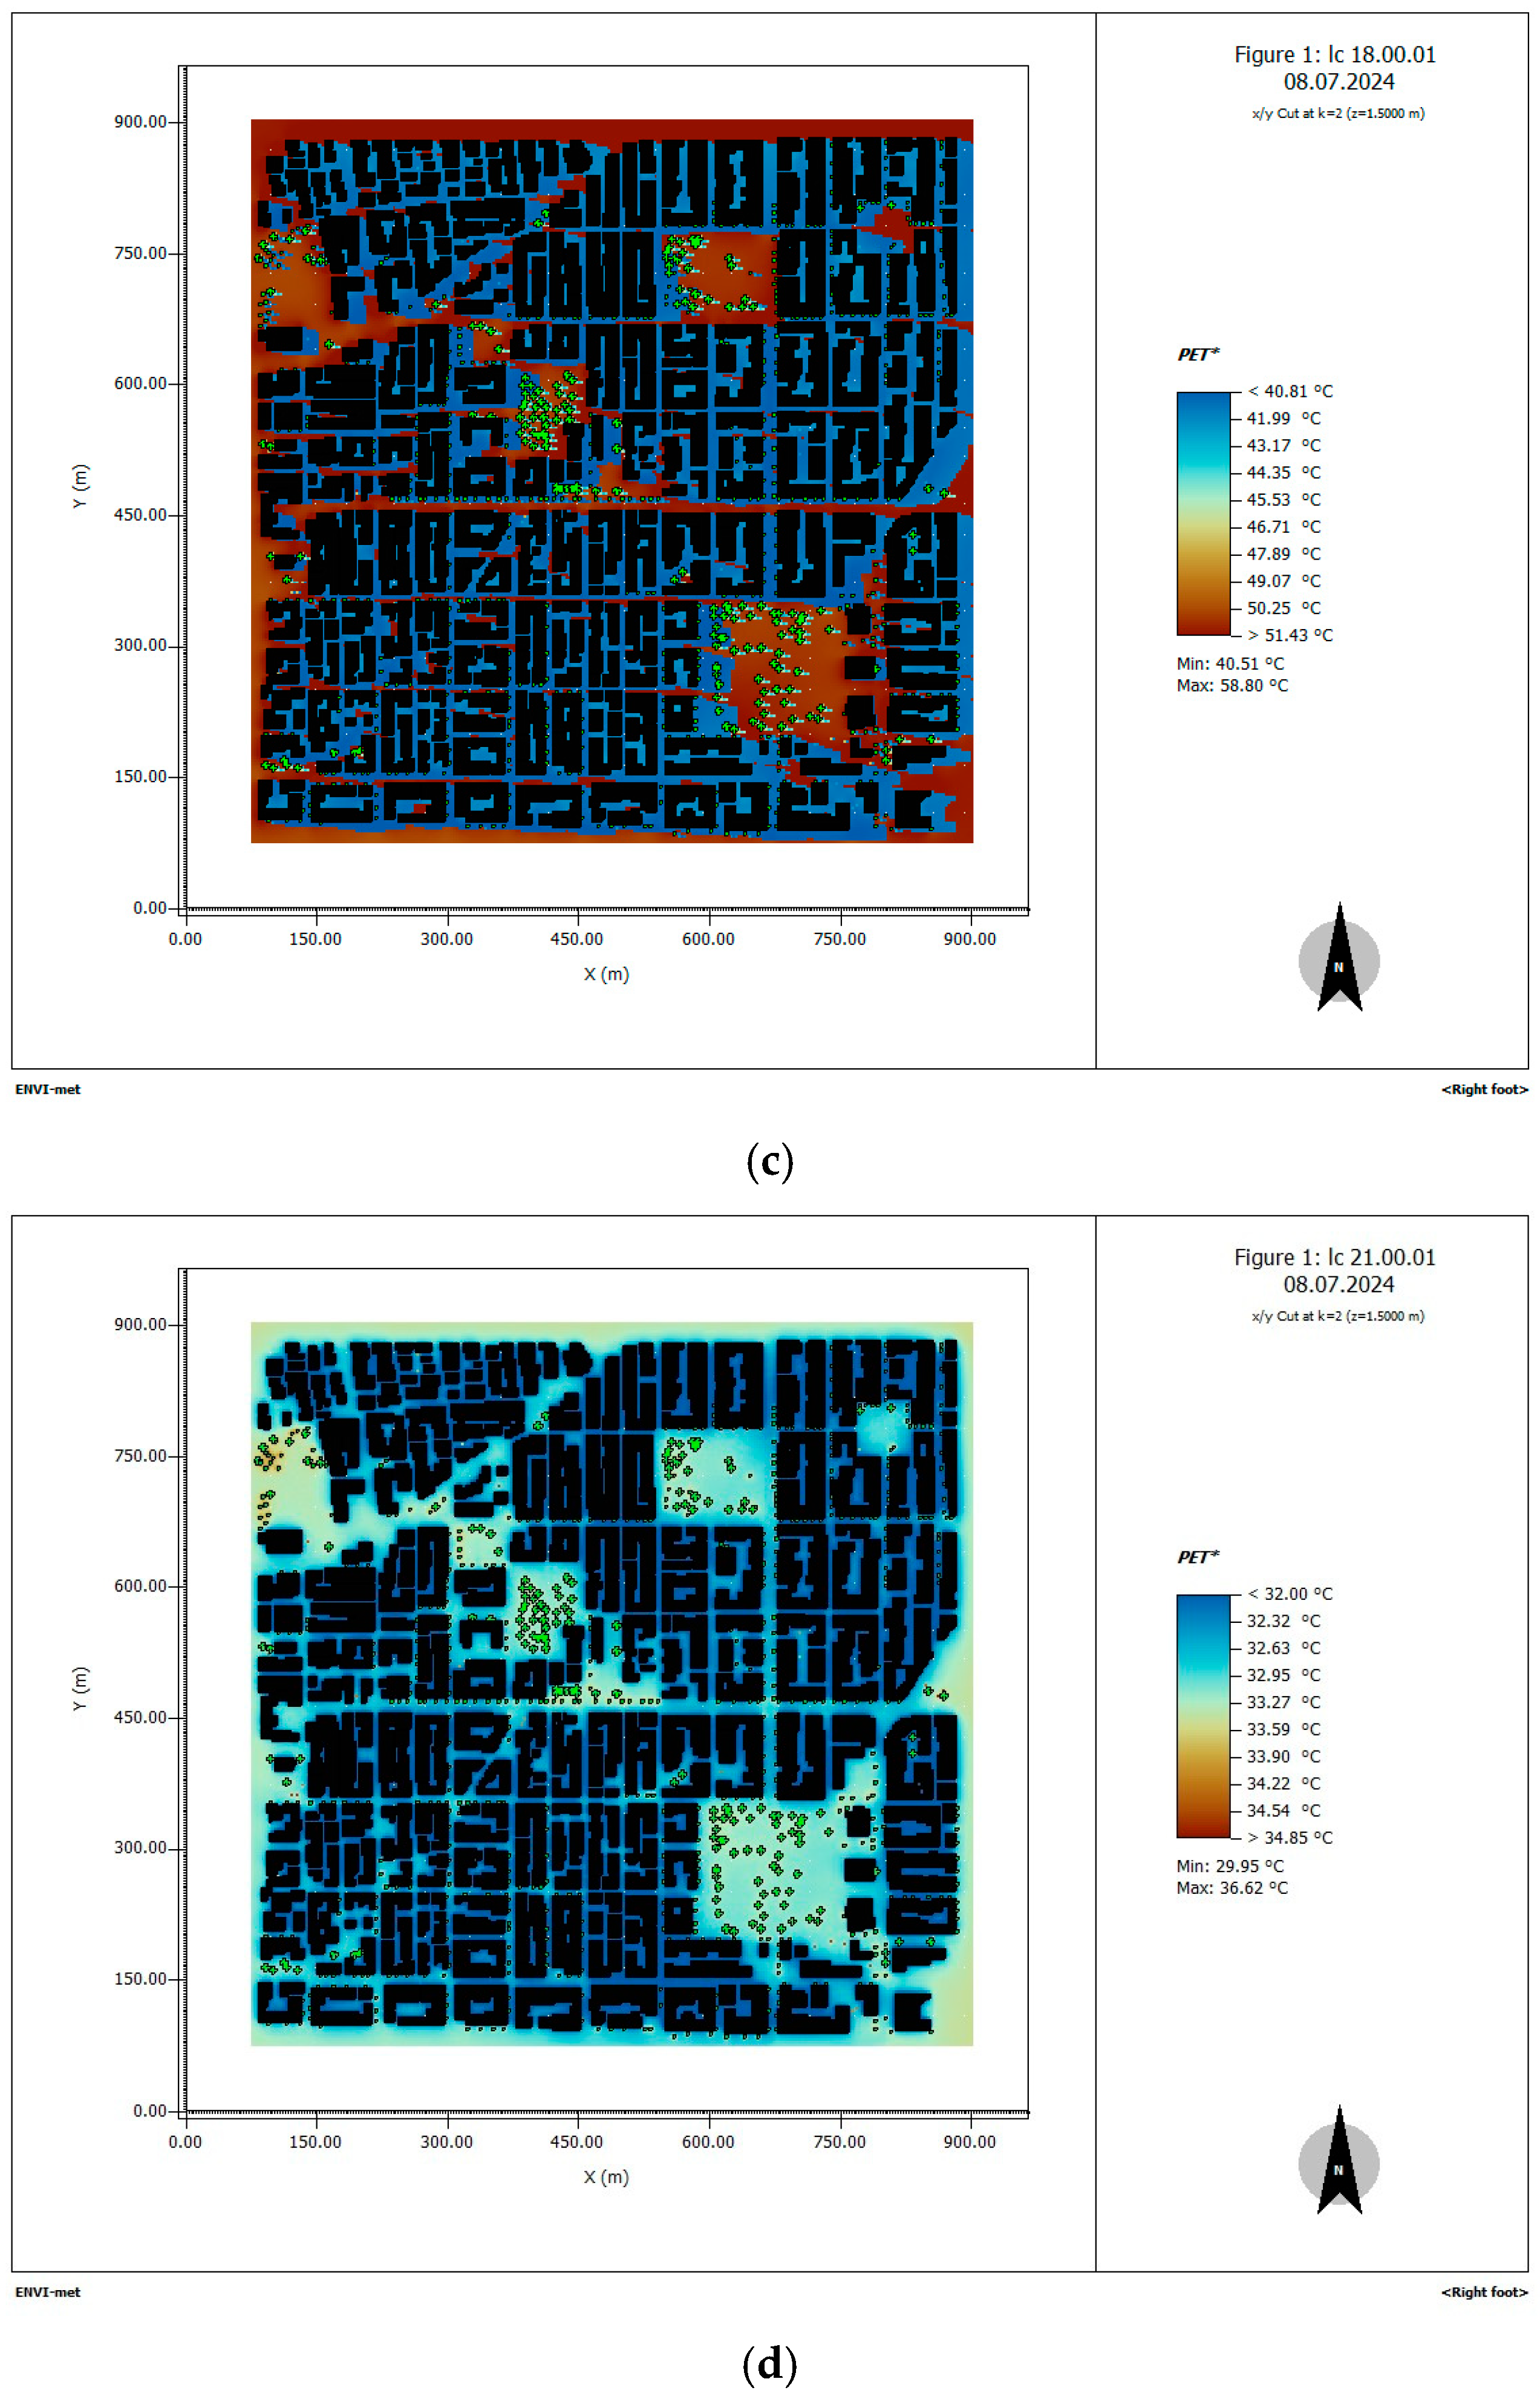
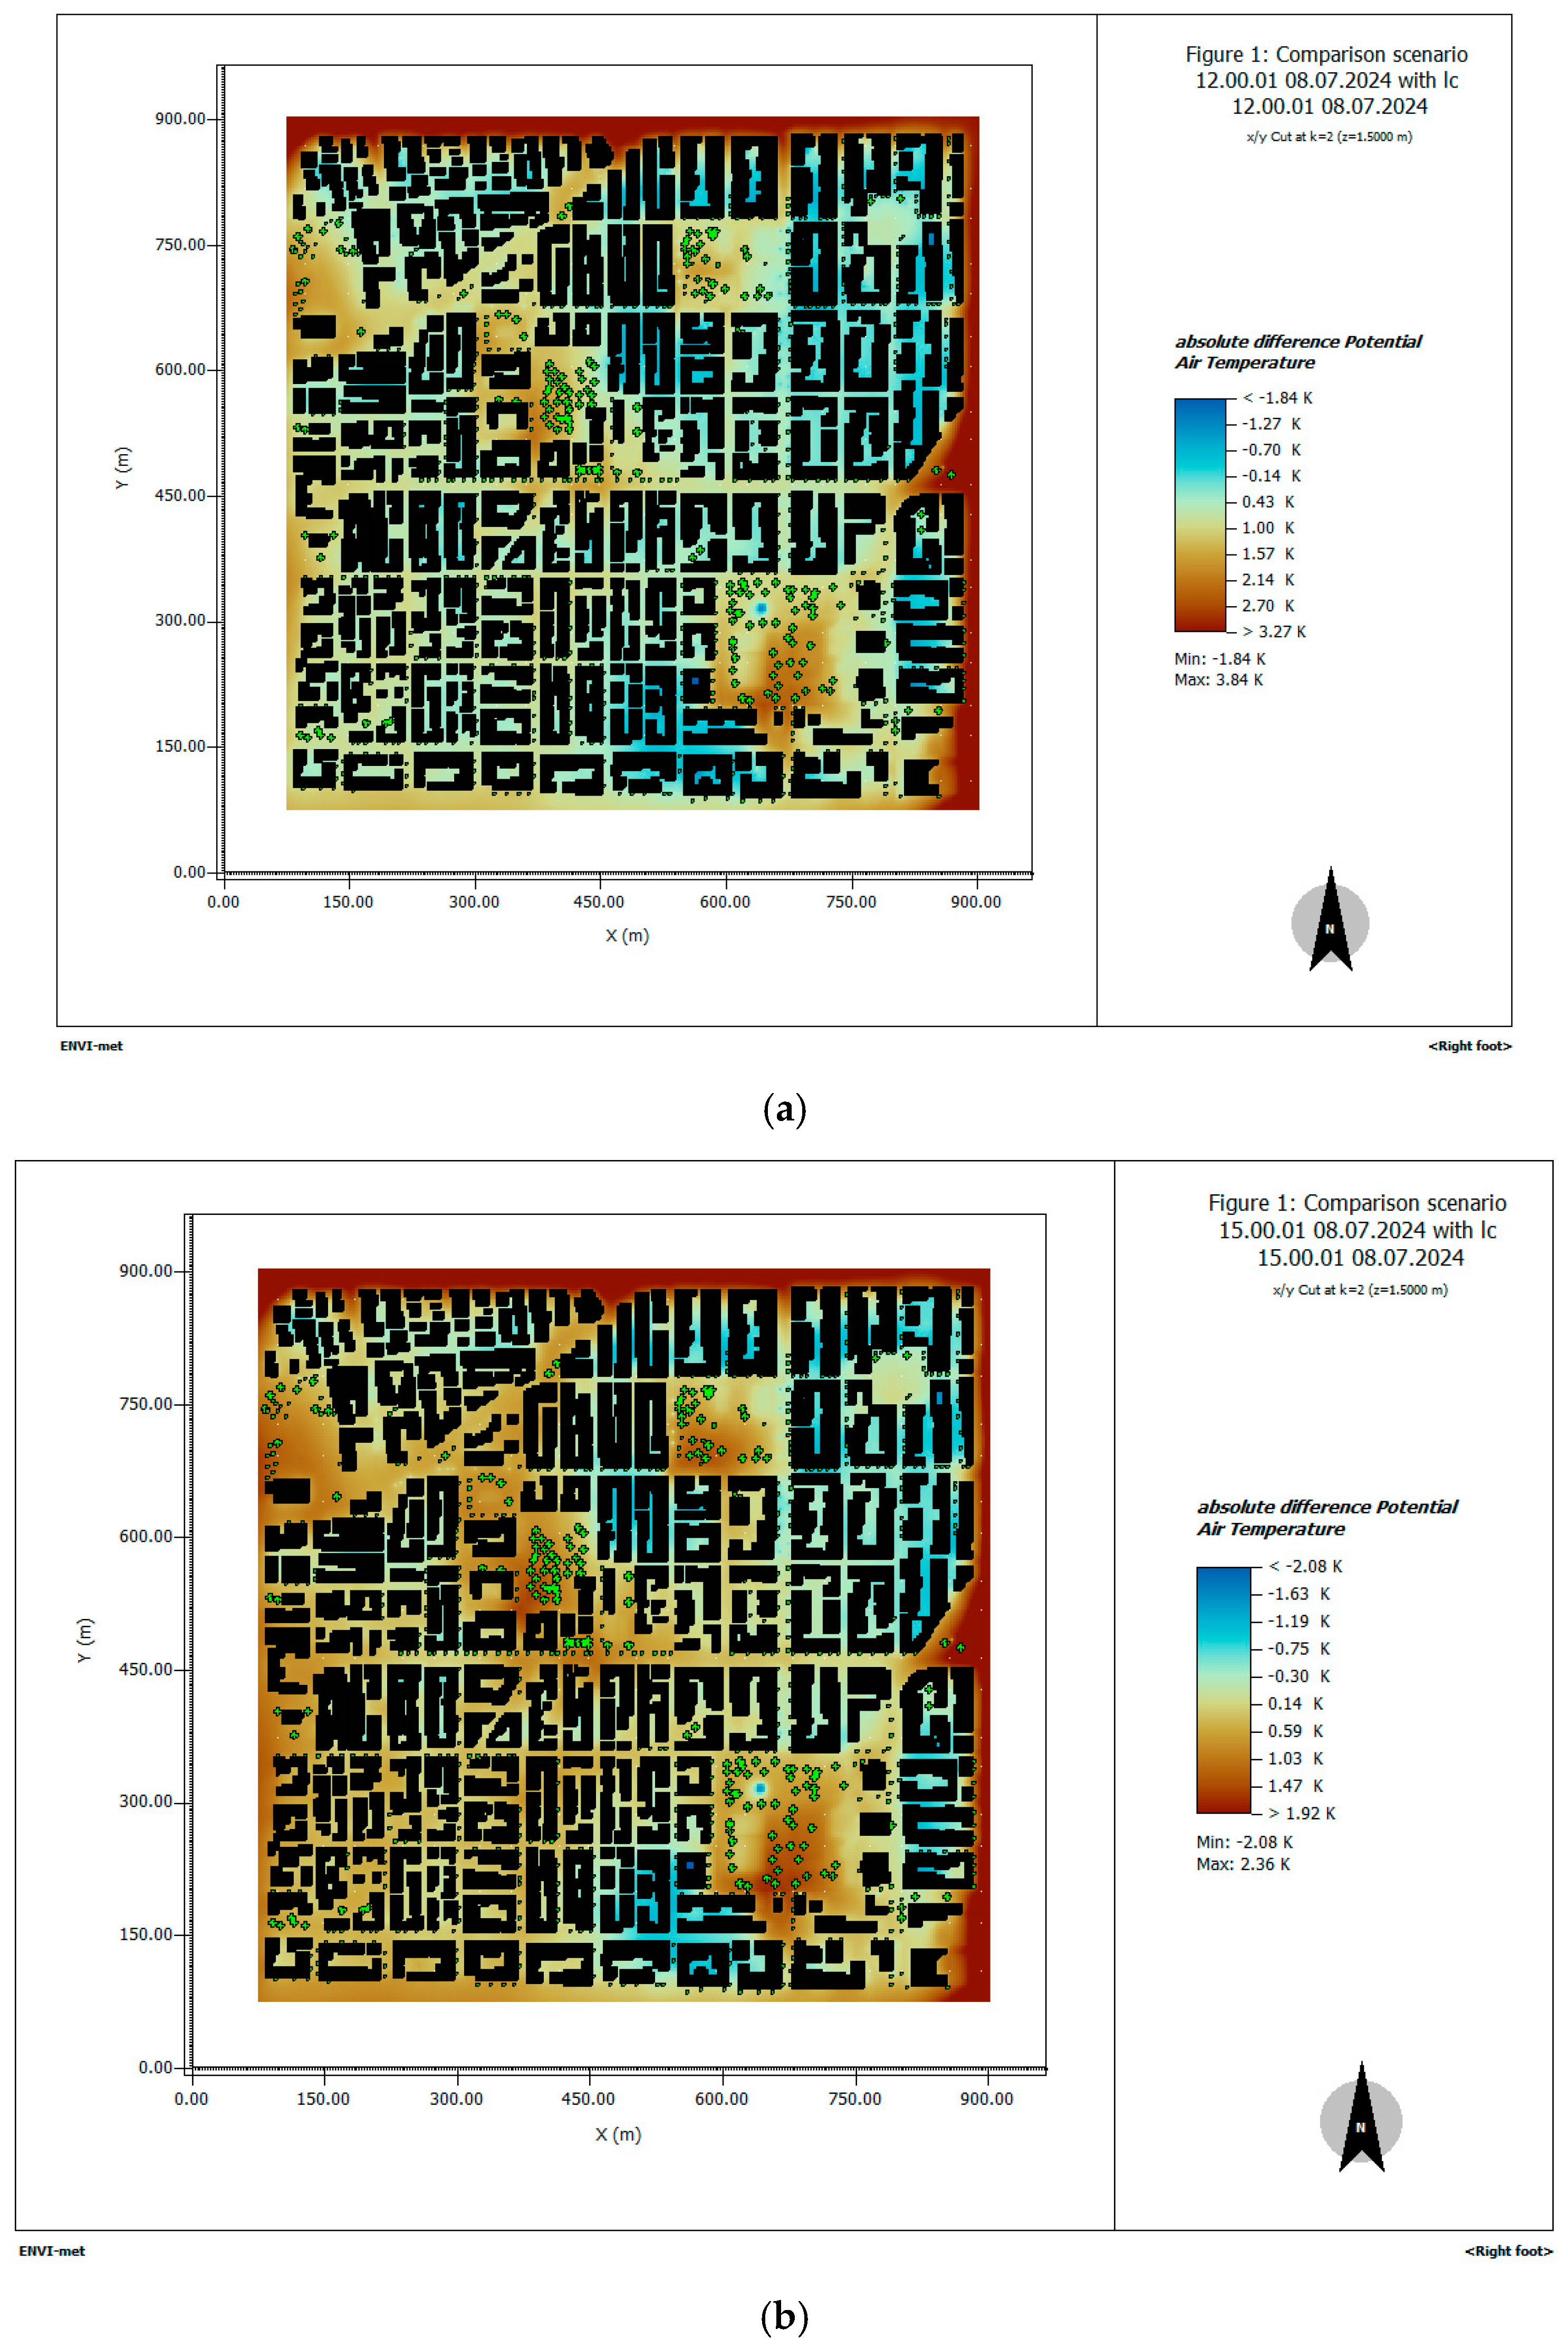
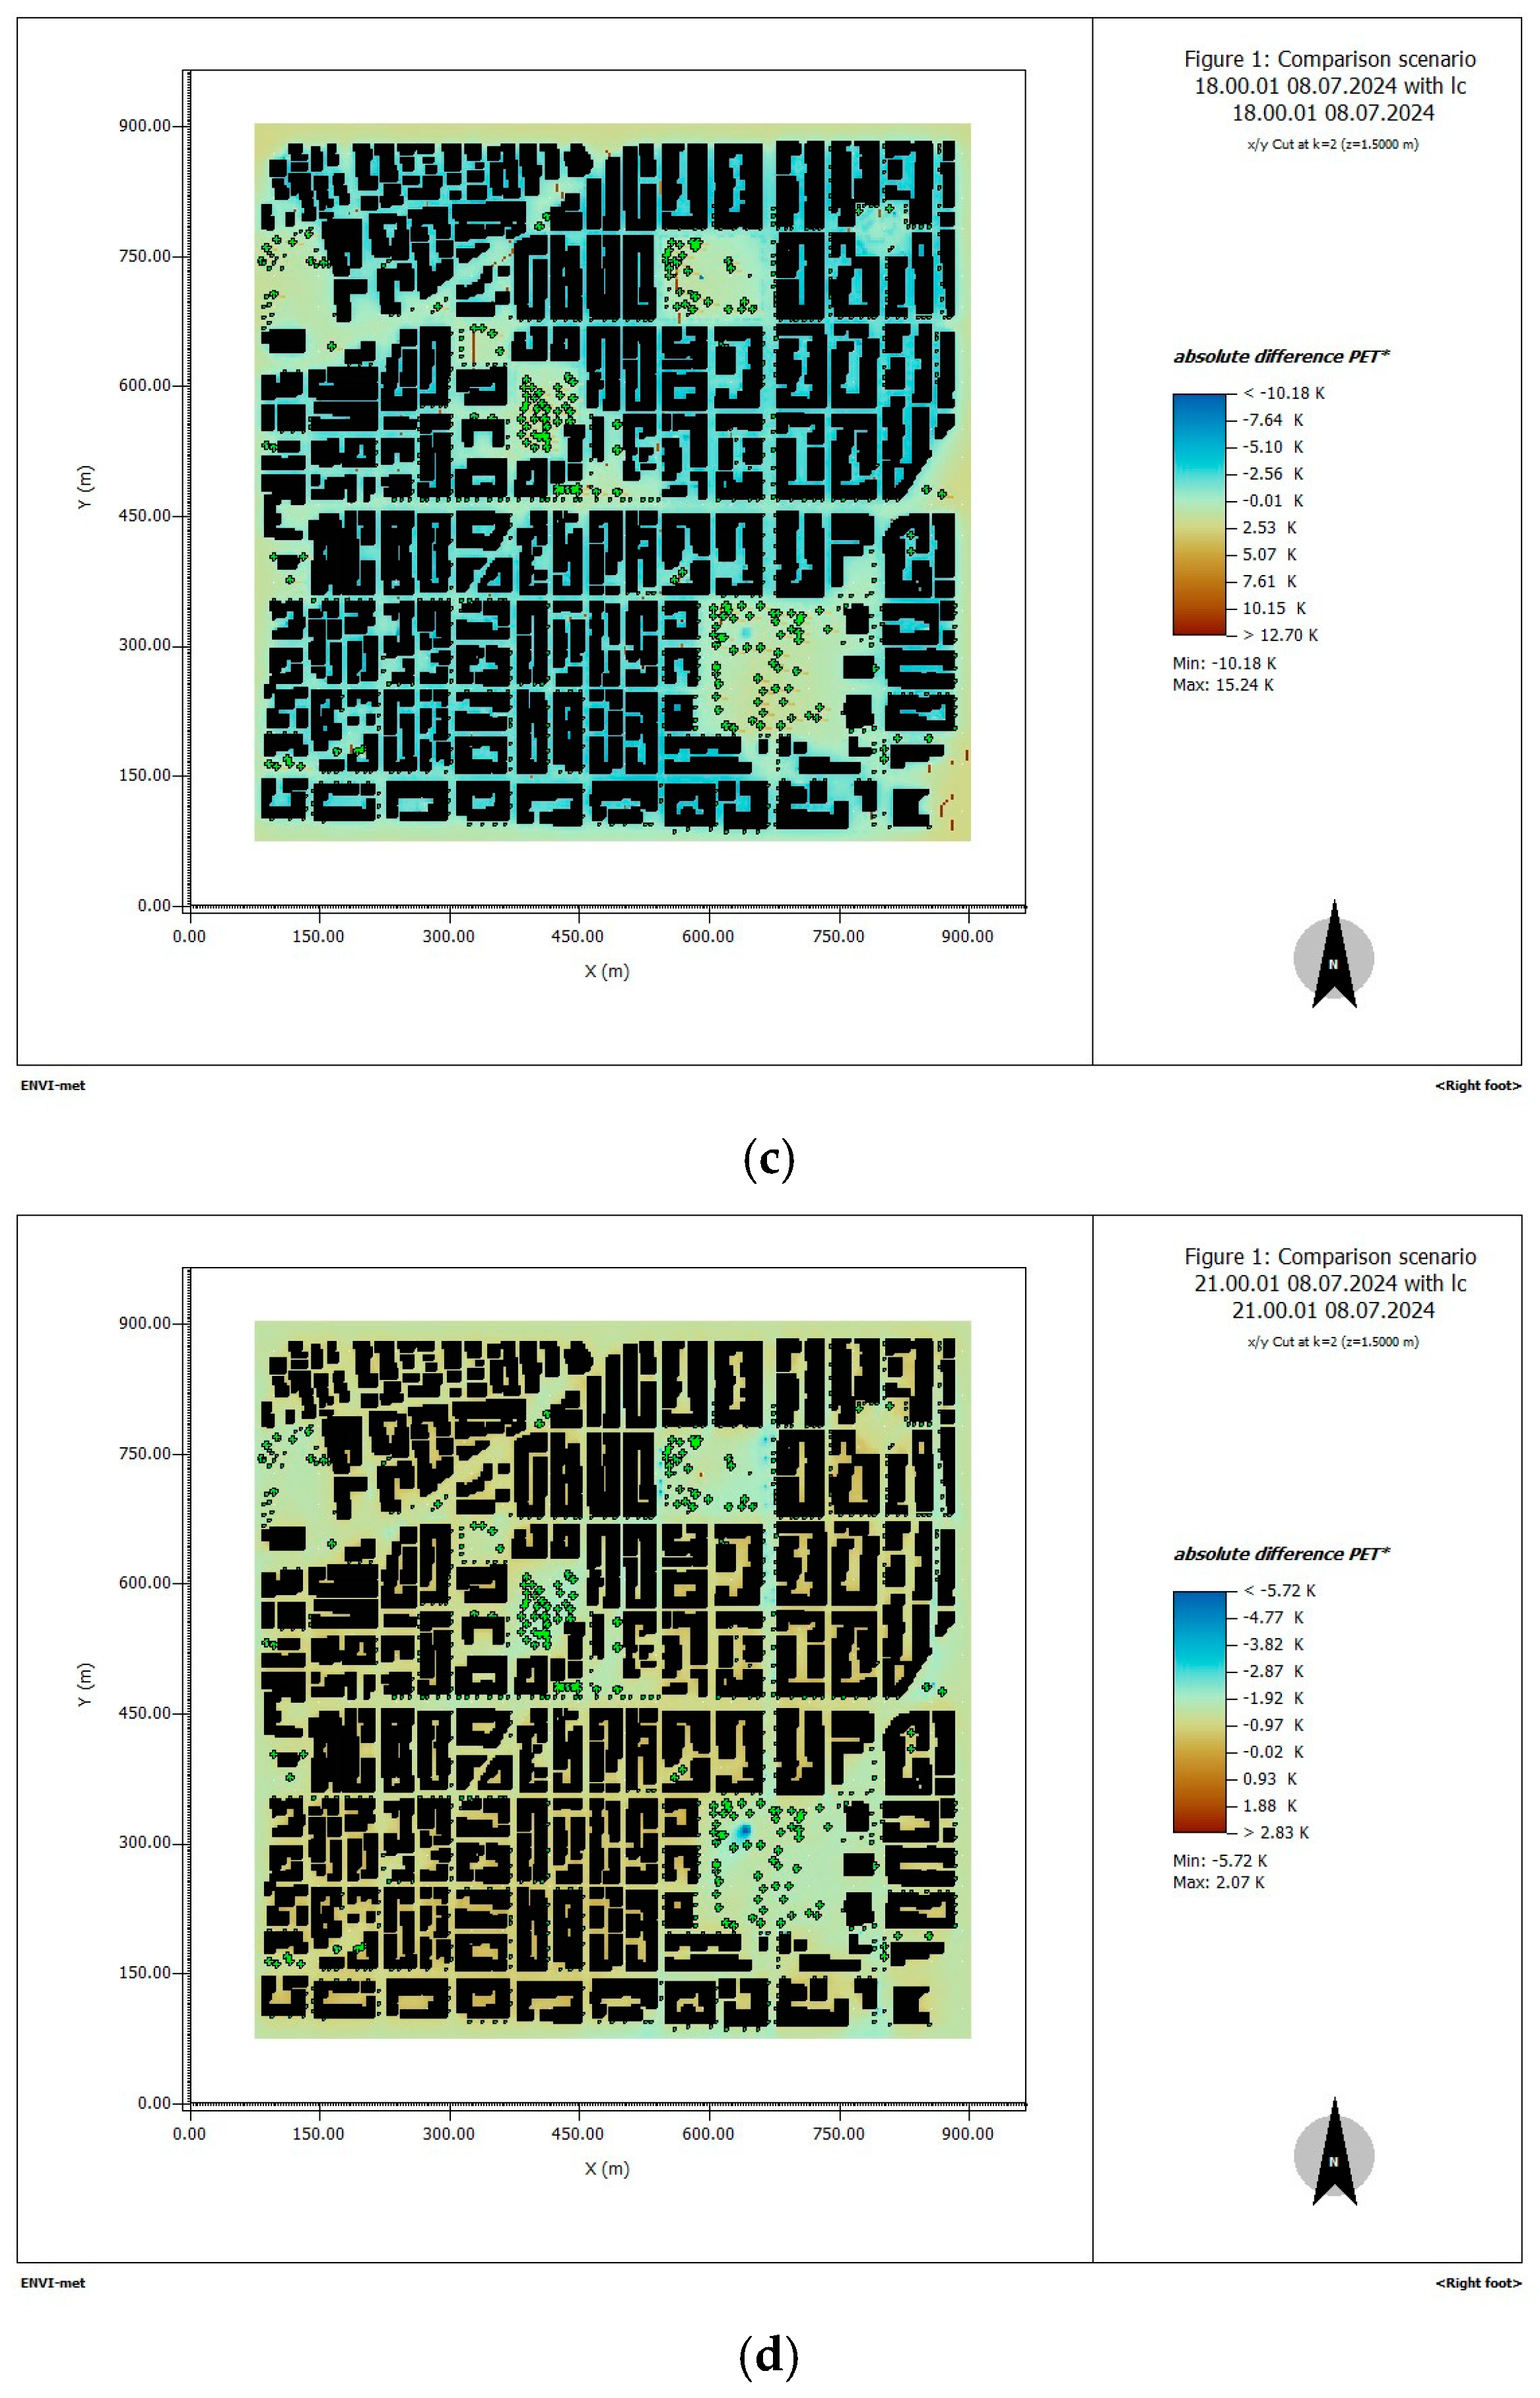
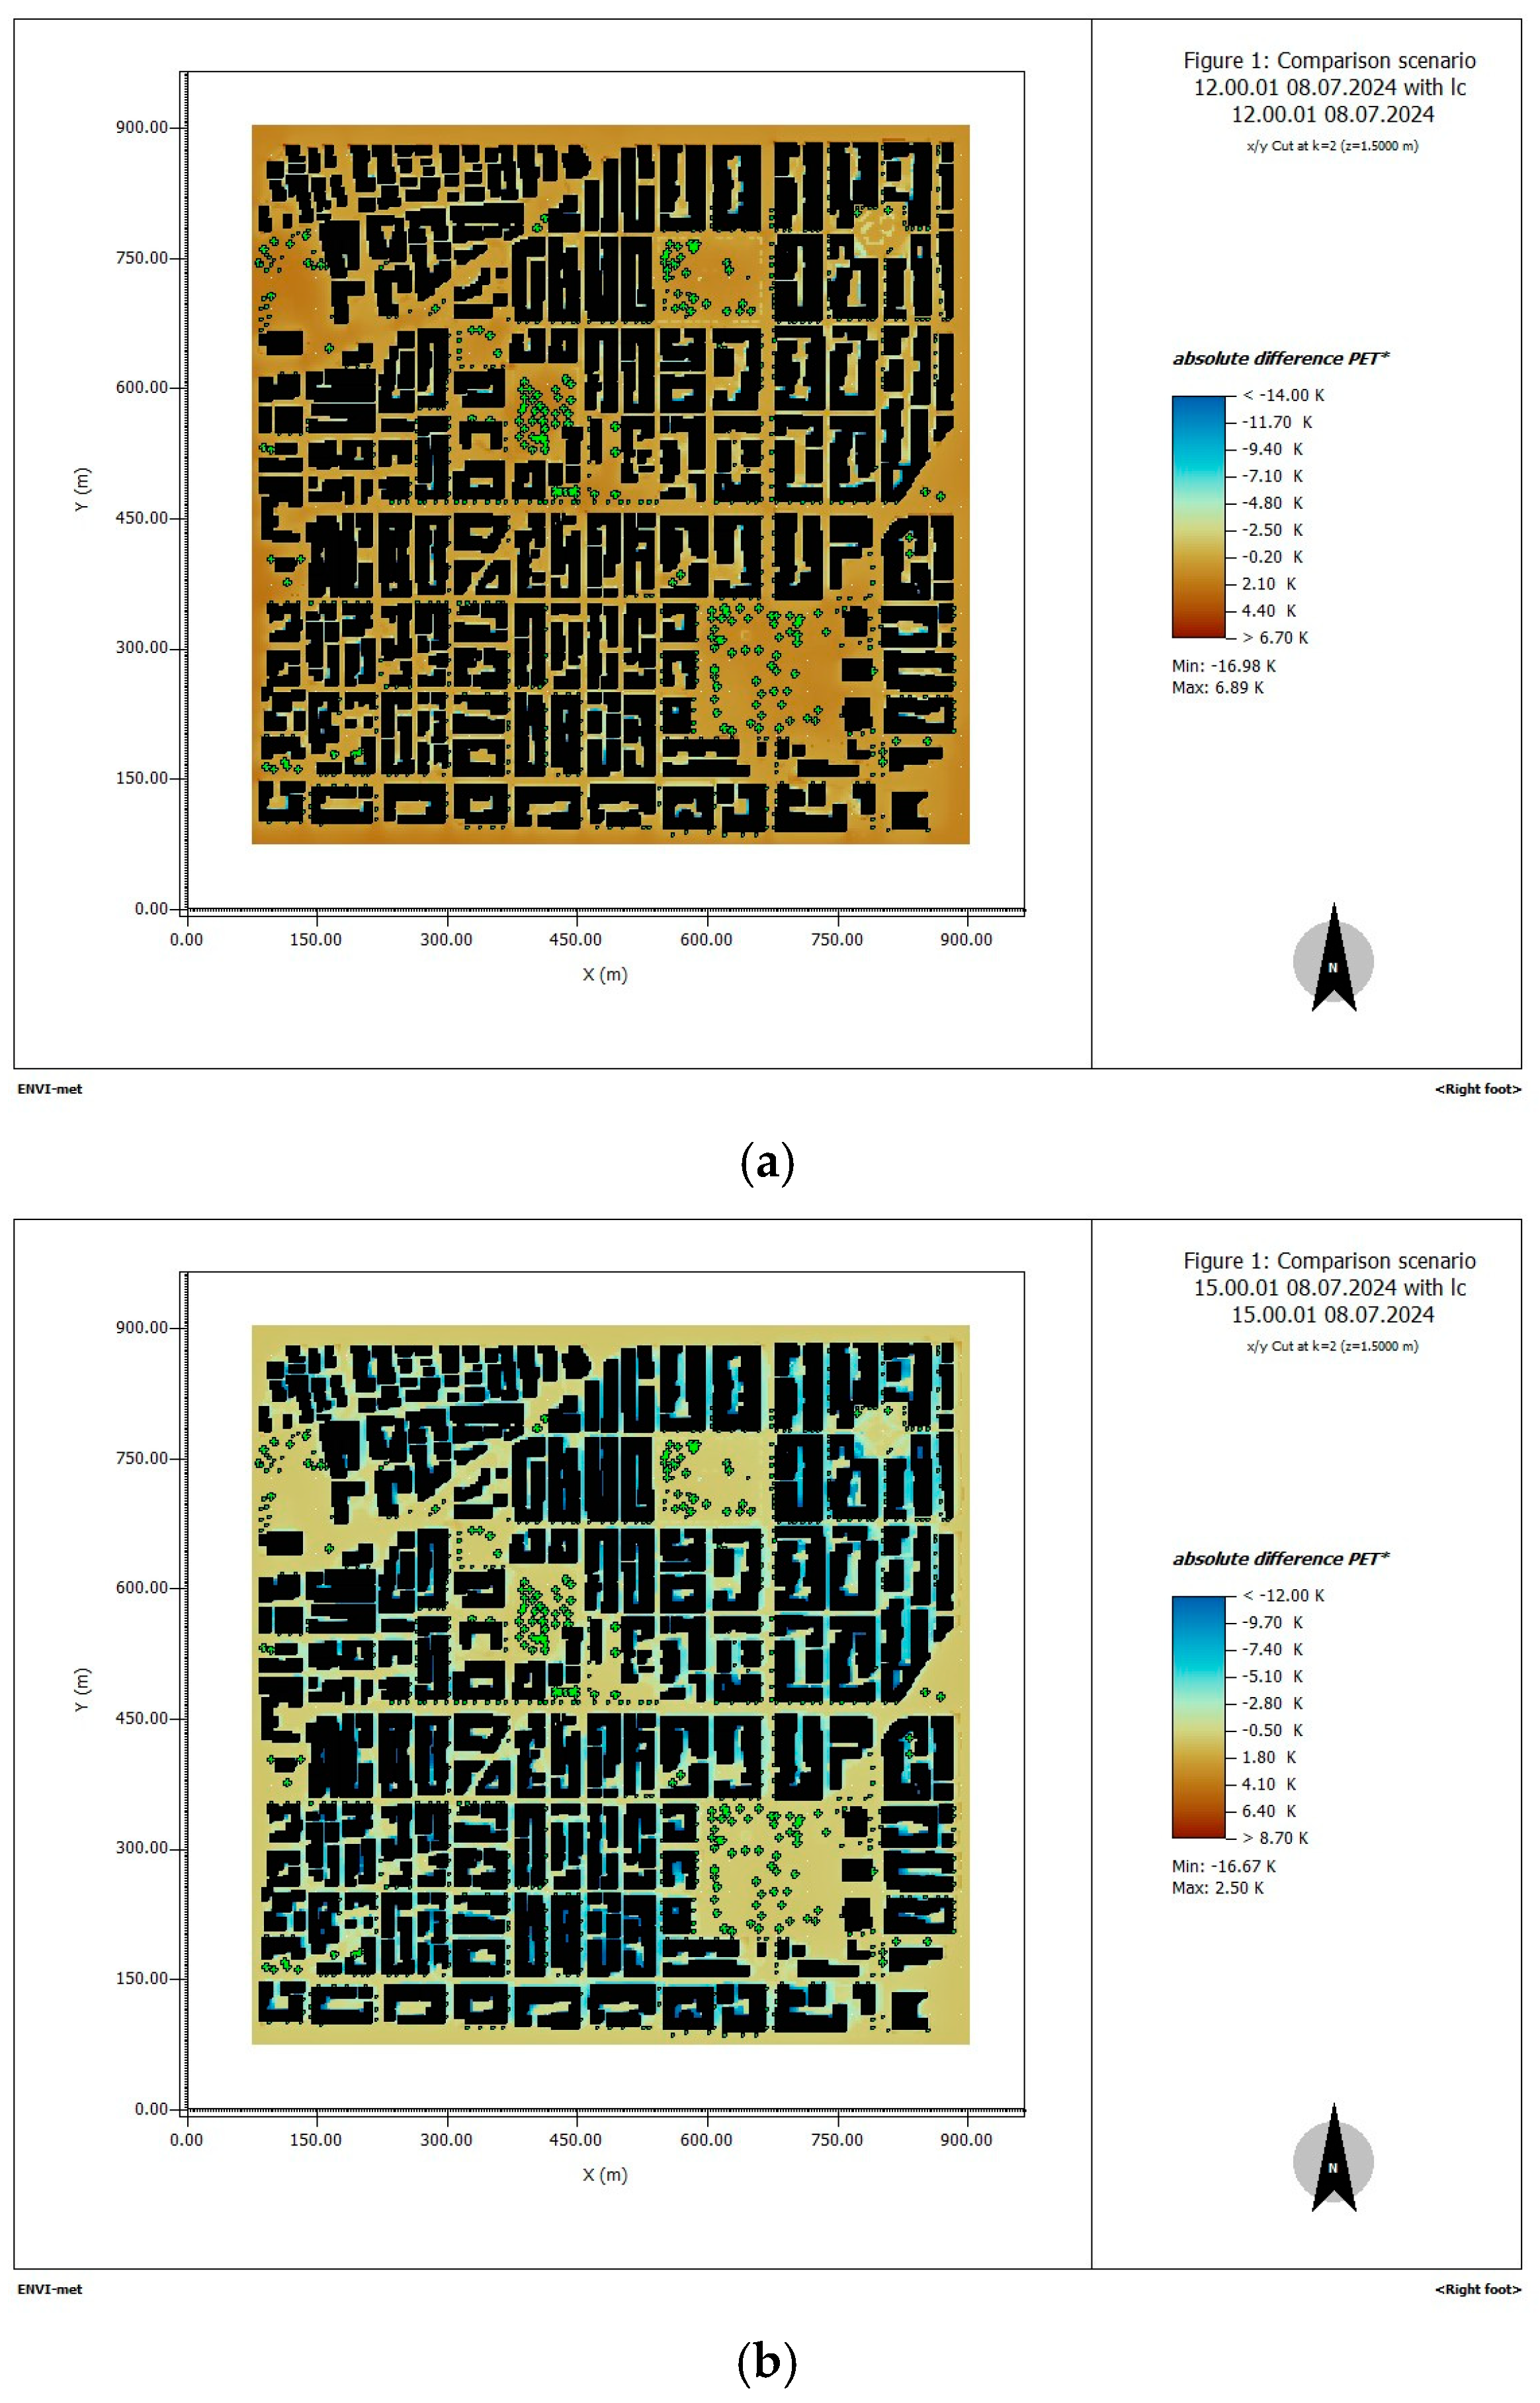
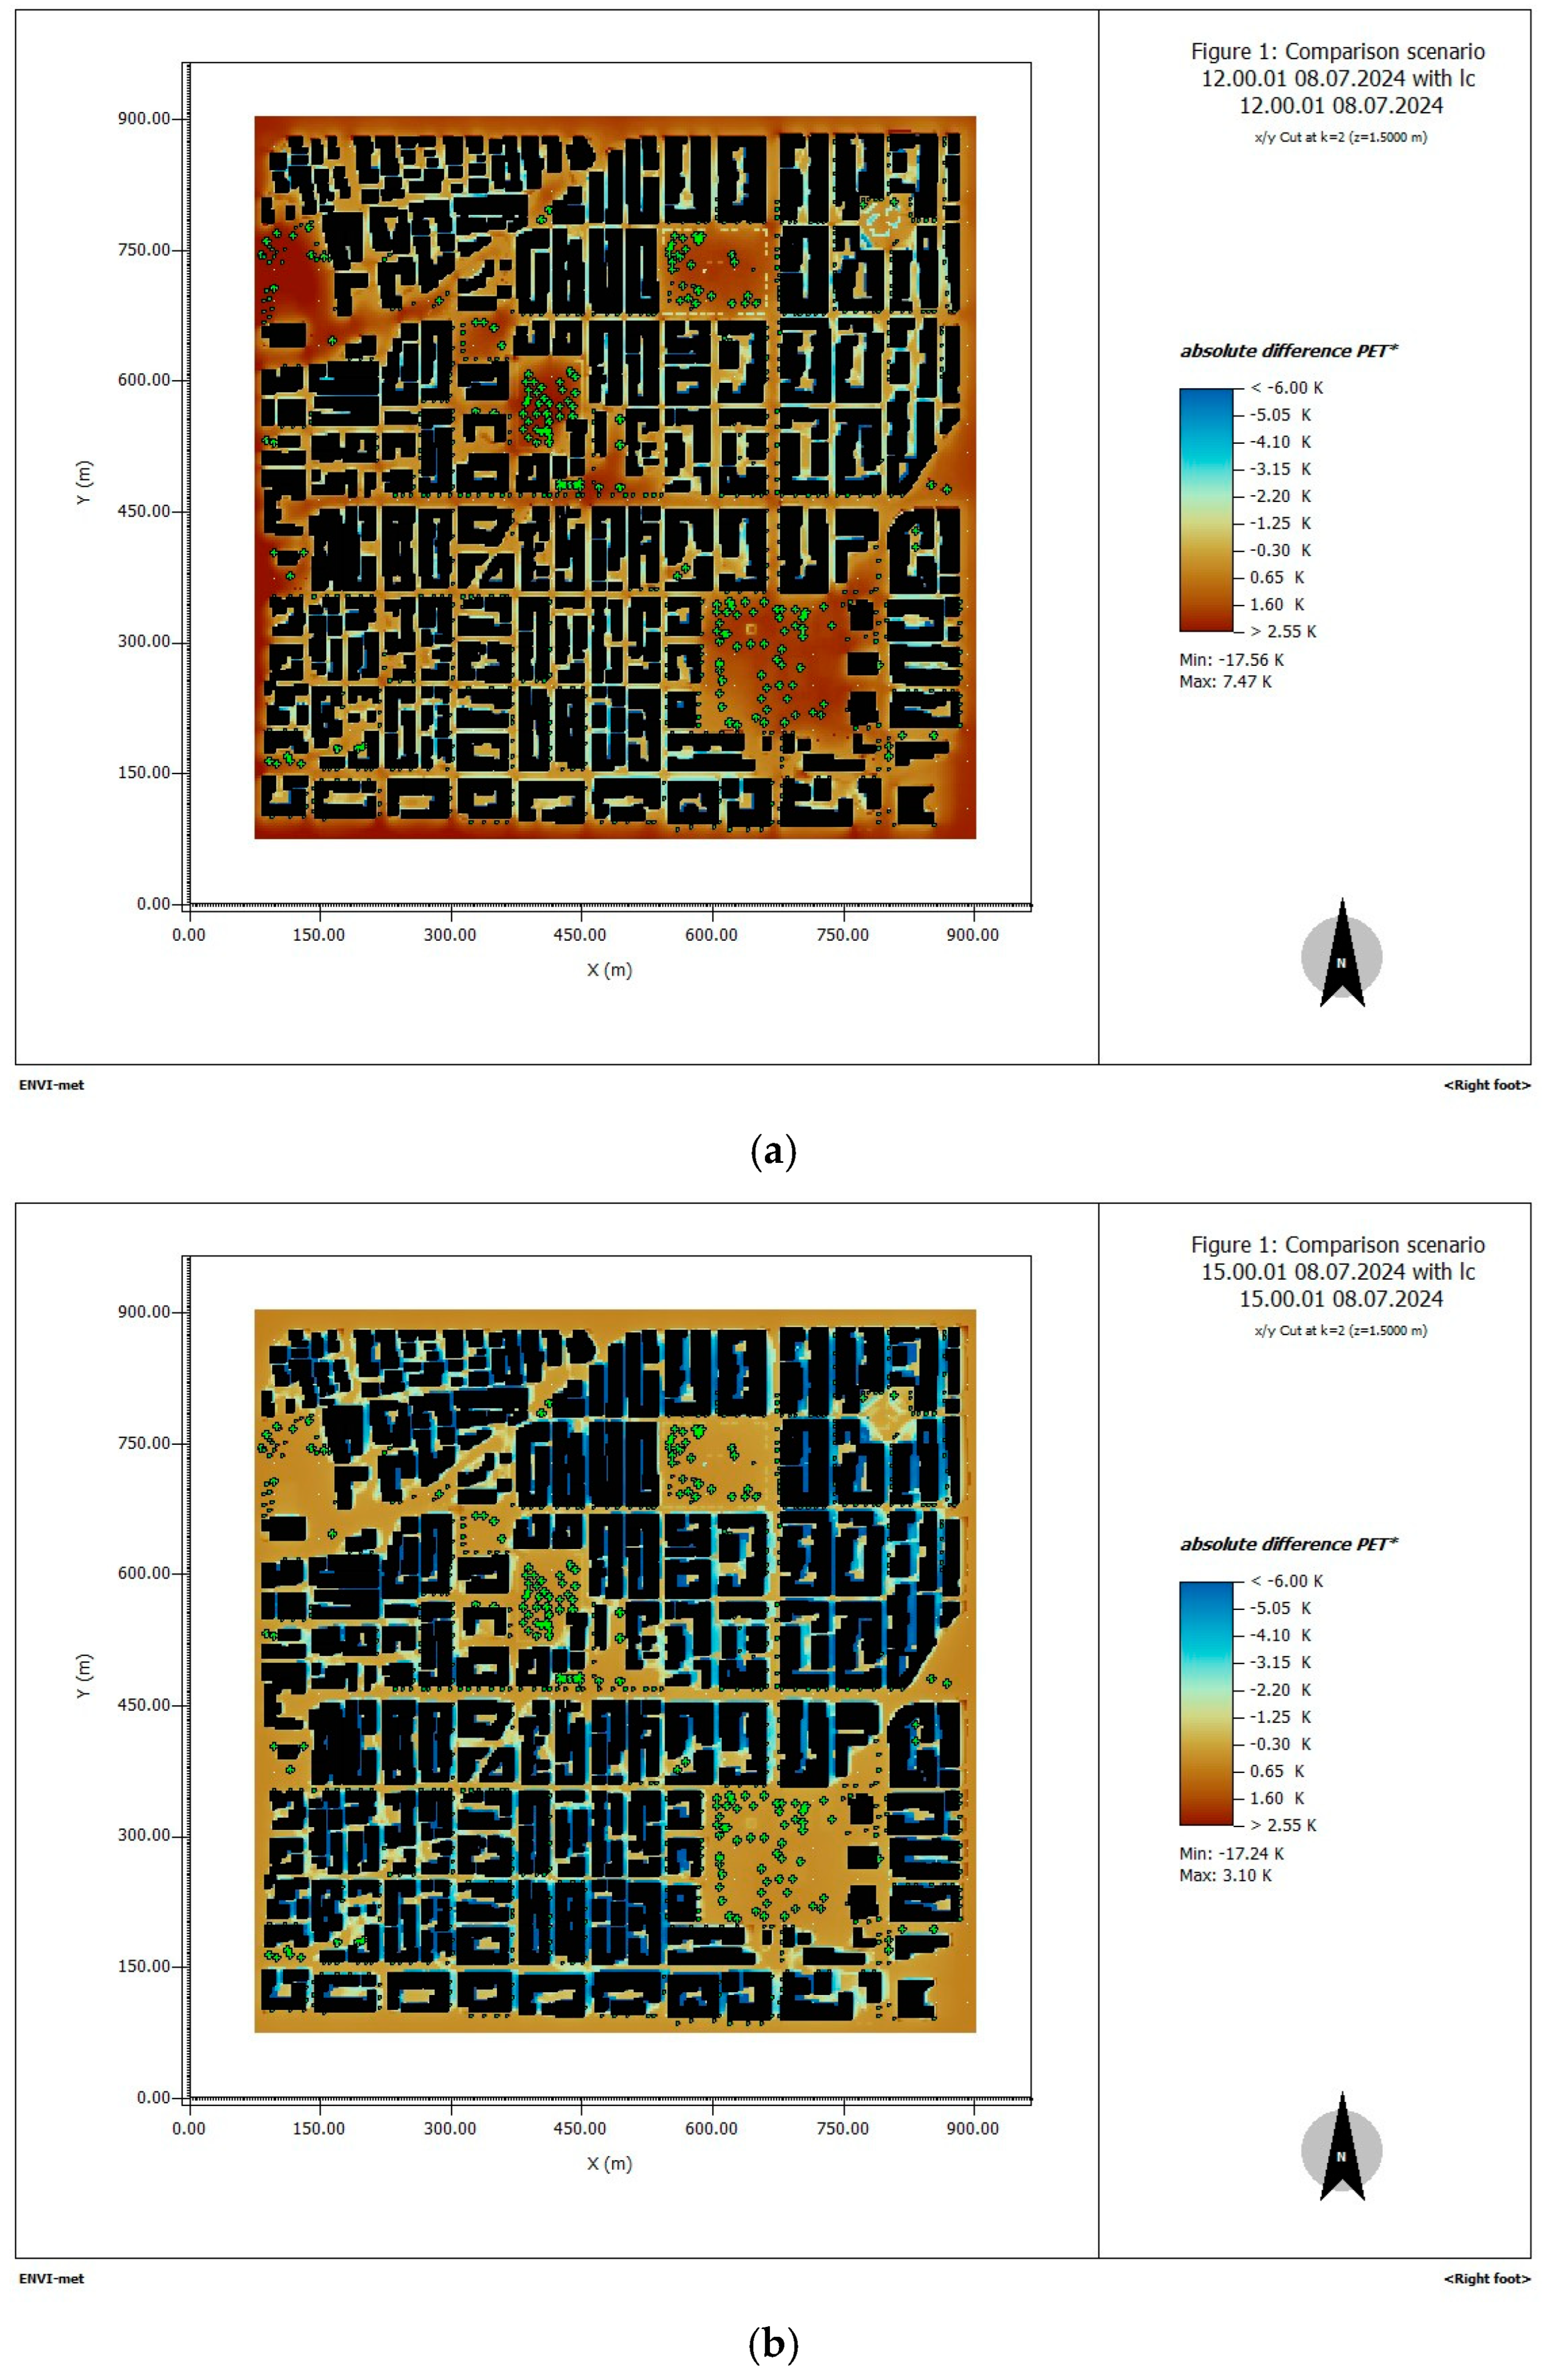
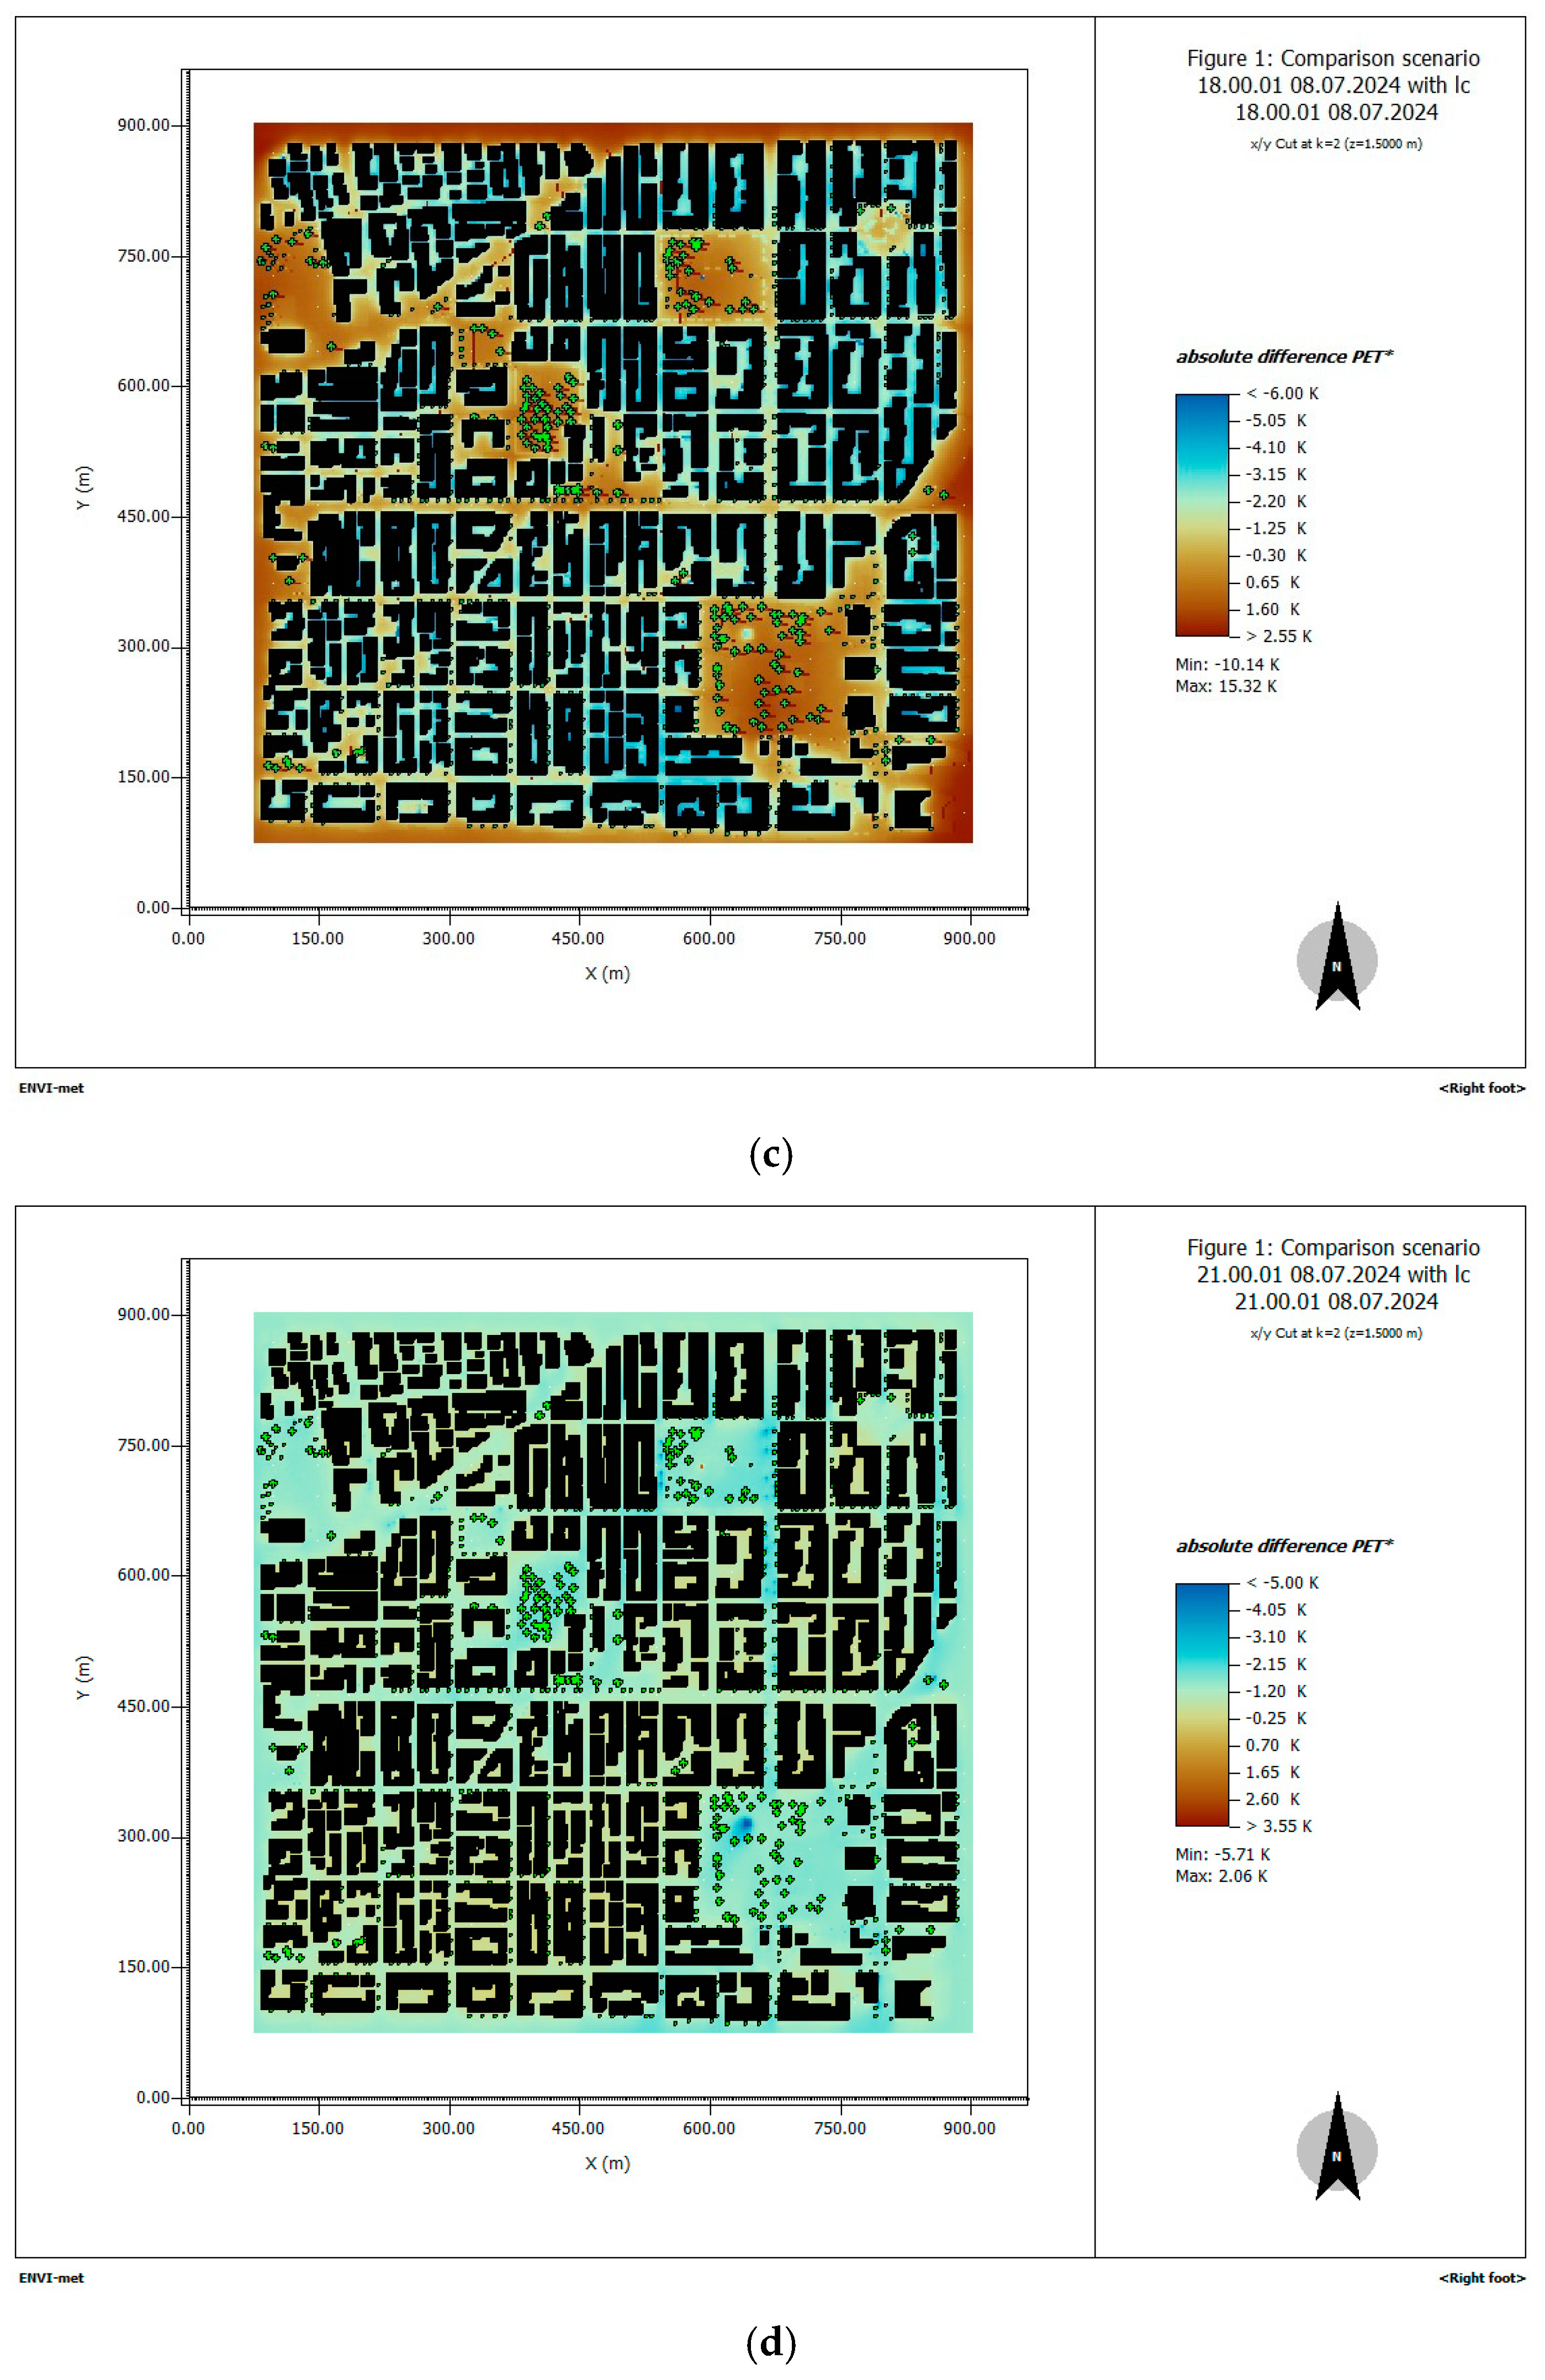
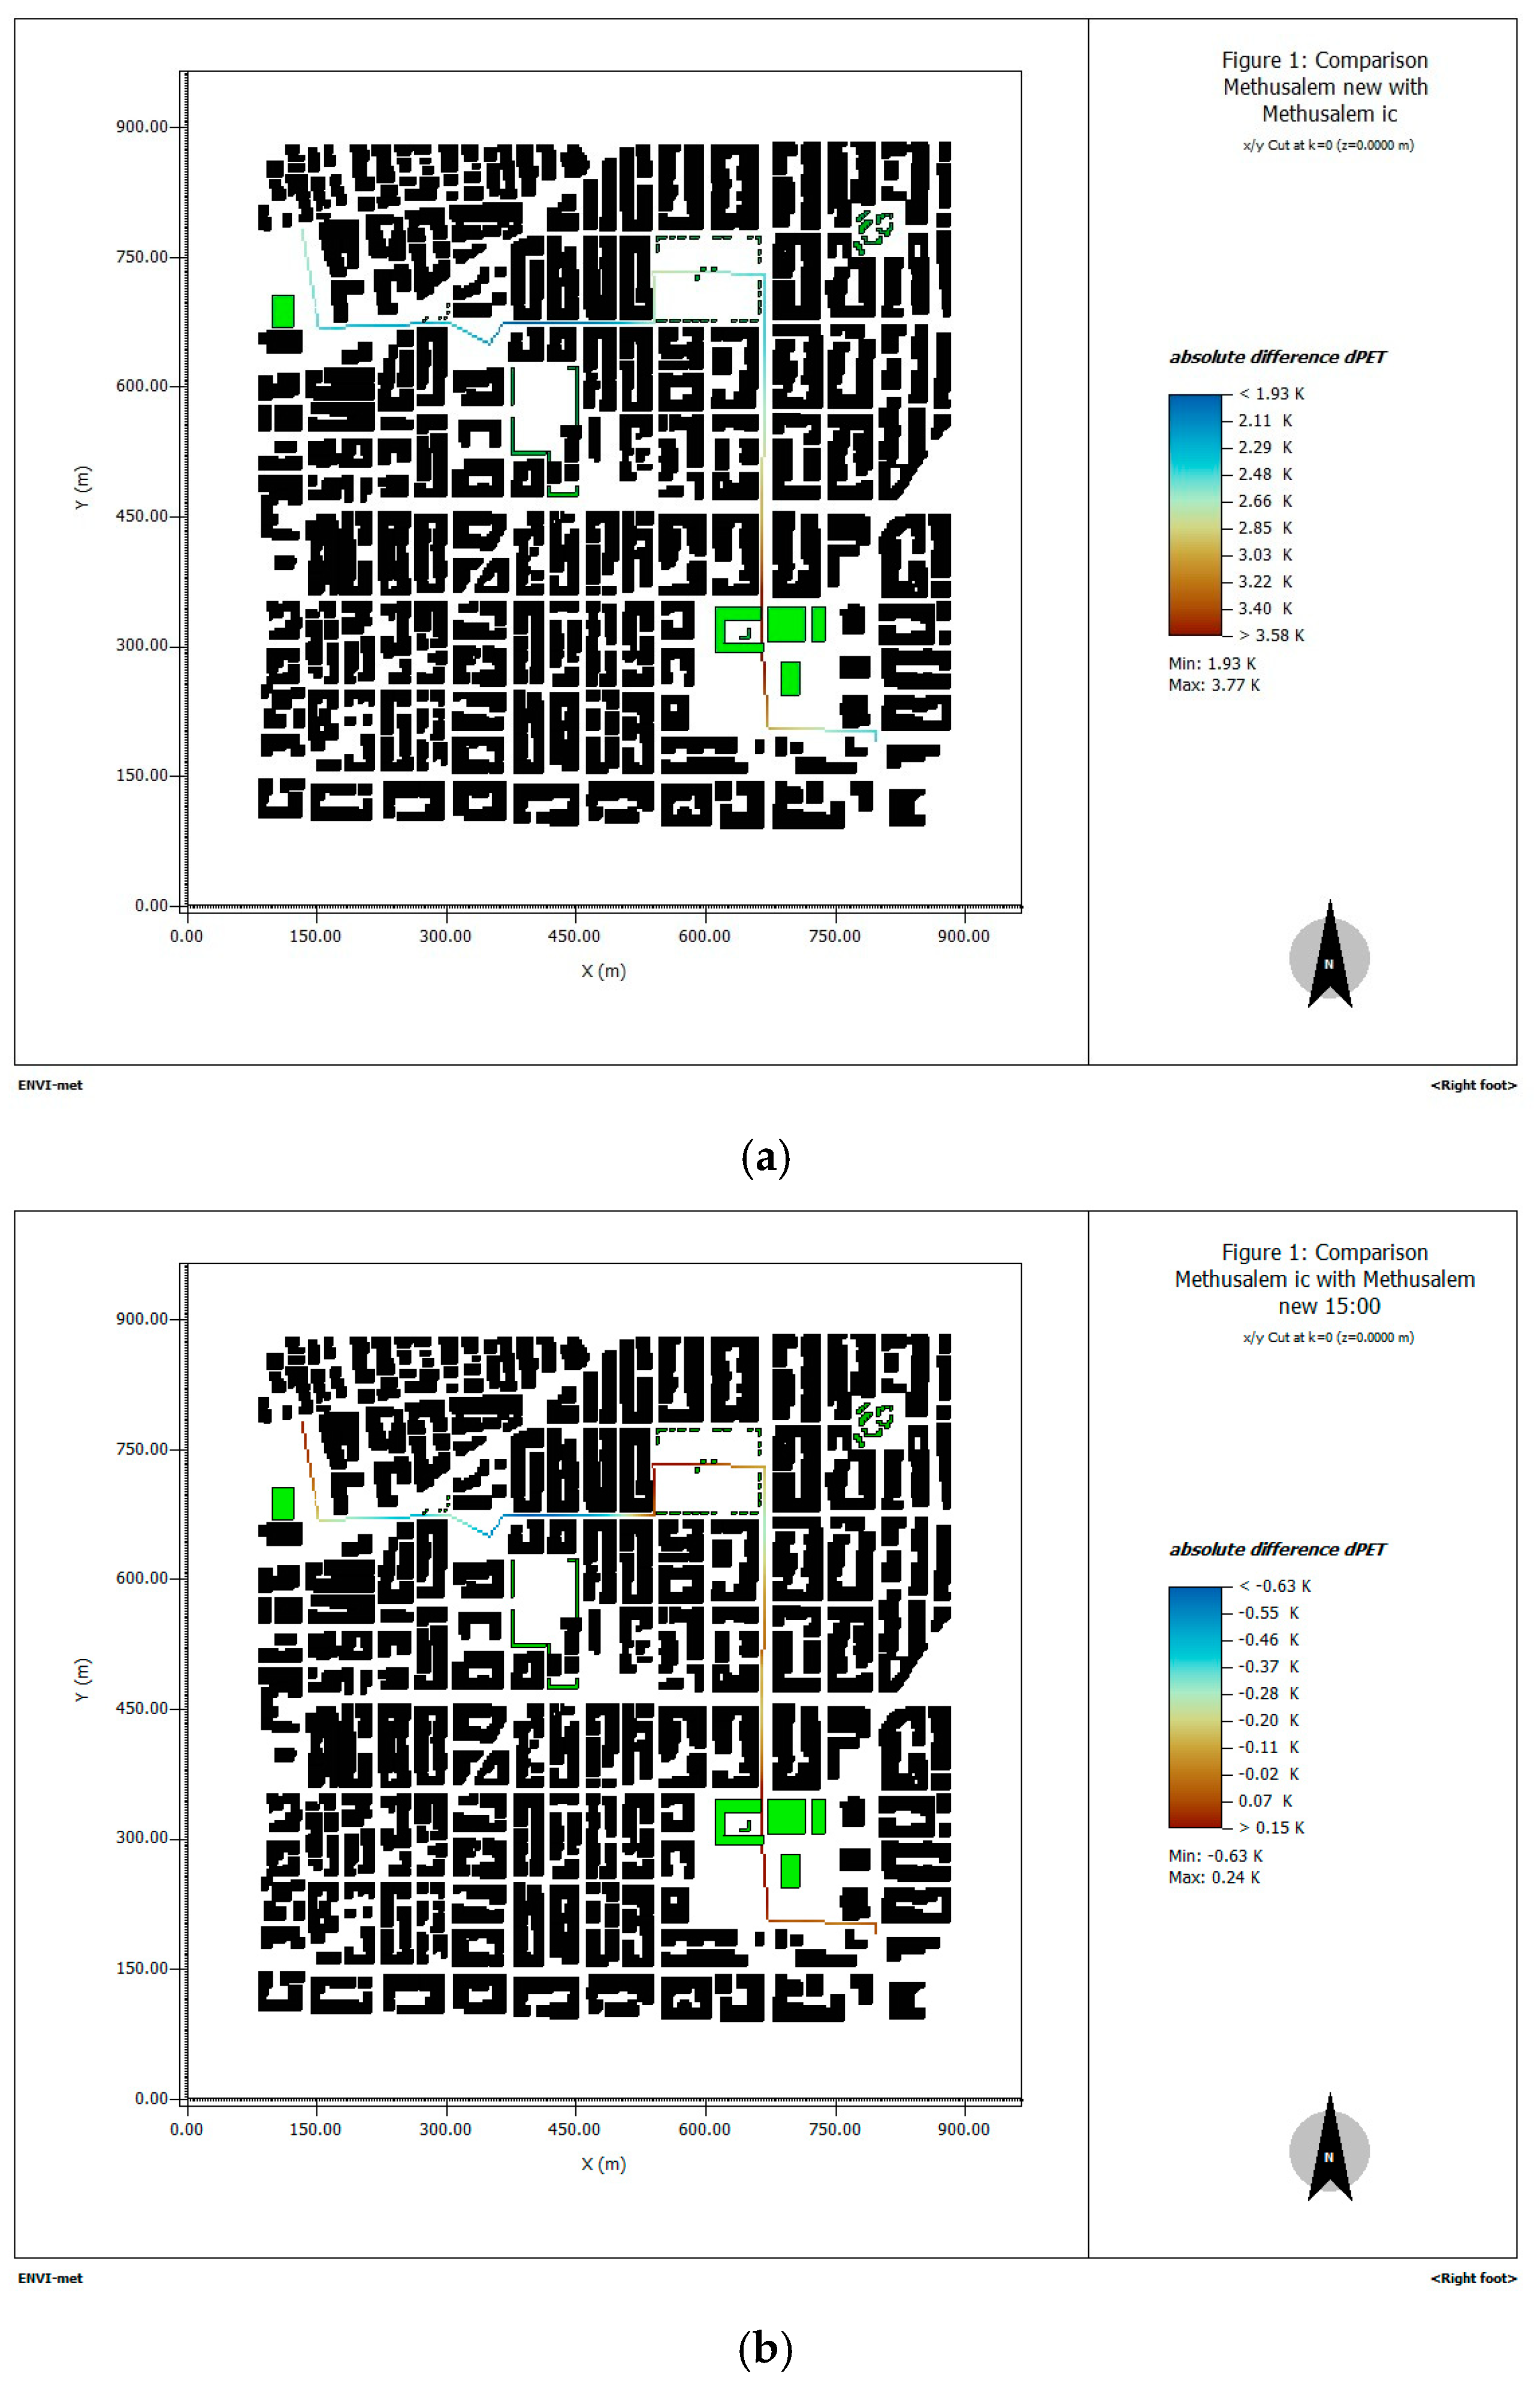
Analysis of the simulated microclimatic data indicates that peak thermal stress was observed at 15:00 and 16:00. Therefore, the evaluation focuses on the time intervals with sunshine, or intense human activity in outdoor spaces, and the hours 12:00, 15:00, 18:00 and 21:00 were selected to be presented. The examined hours are representative of the different times that people perform activities and move between destinations in the area. Figure 7, Figure 8, Figure 9, Figure 10, Figure 11, Figure 12 and Figure 13 present the visualization of the ENVI-met 5.9.0 microclimatic simulations for the examined hours. It should be noted that these figures are directly generated from the computational model and represent raw outputs, without any post-processing manipulation or artificial rescaling, in order to preserve their physical consistency and authenticity. As a result, variations in the color scale (color mapping range) may occur among the compared figures.
To extract the results through the BIO-met tool, both in the initial state and in the case of regeneration, the view plane position k = 2 was chosen, which corresponds to a height z = 1.50 m. This corresponds to the results of the simulation at the height of a pedestrian/observer who perceives thermal conditions in the studied area for the respective time of the analysis (www.ENVI-met.info, accessed on 10 May 2025). Particularly for the dPET index, ENVI-met 5.9.0 calculates it exclusively at the observation height of 0.00 m, during the period of preparation of this work (www.ENVI-met.info, accessed on 10 May 2025).

3.1. Thermal Environment Under the Initial Conditions

3.1.1. Air Temperature (Tair, °C)

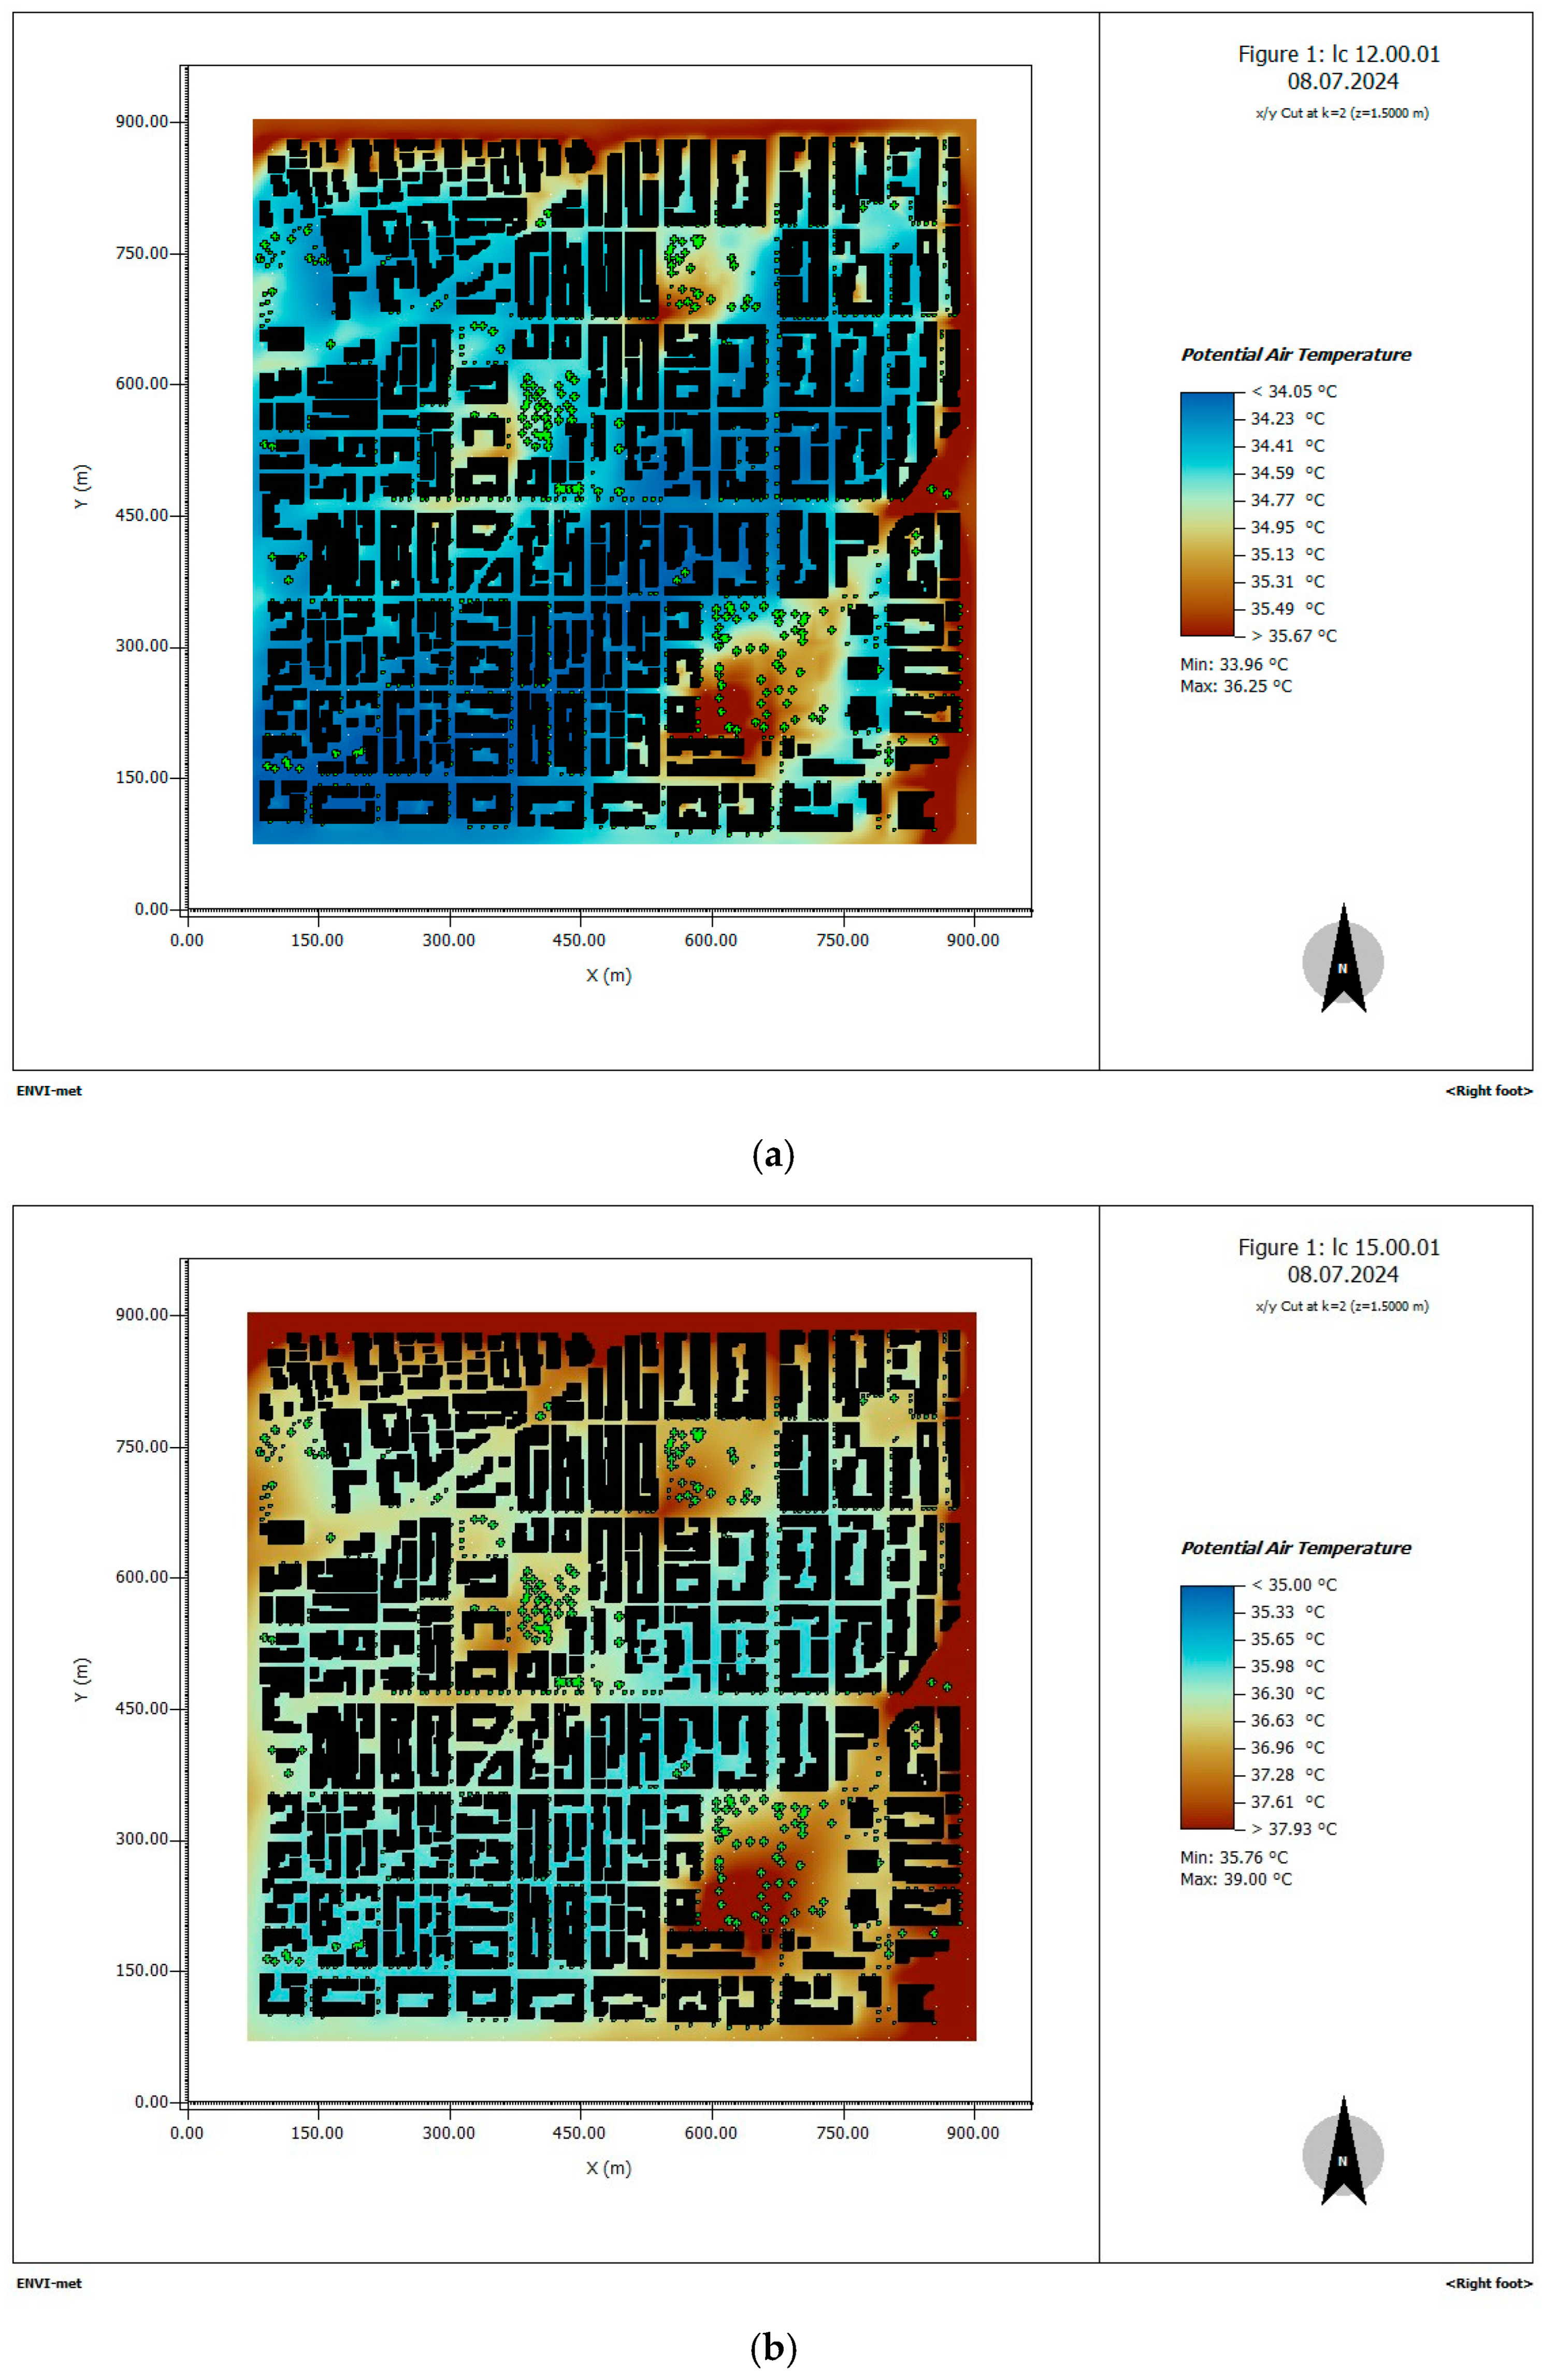
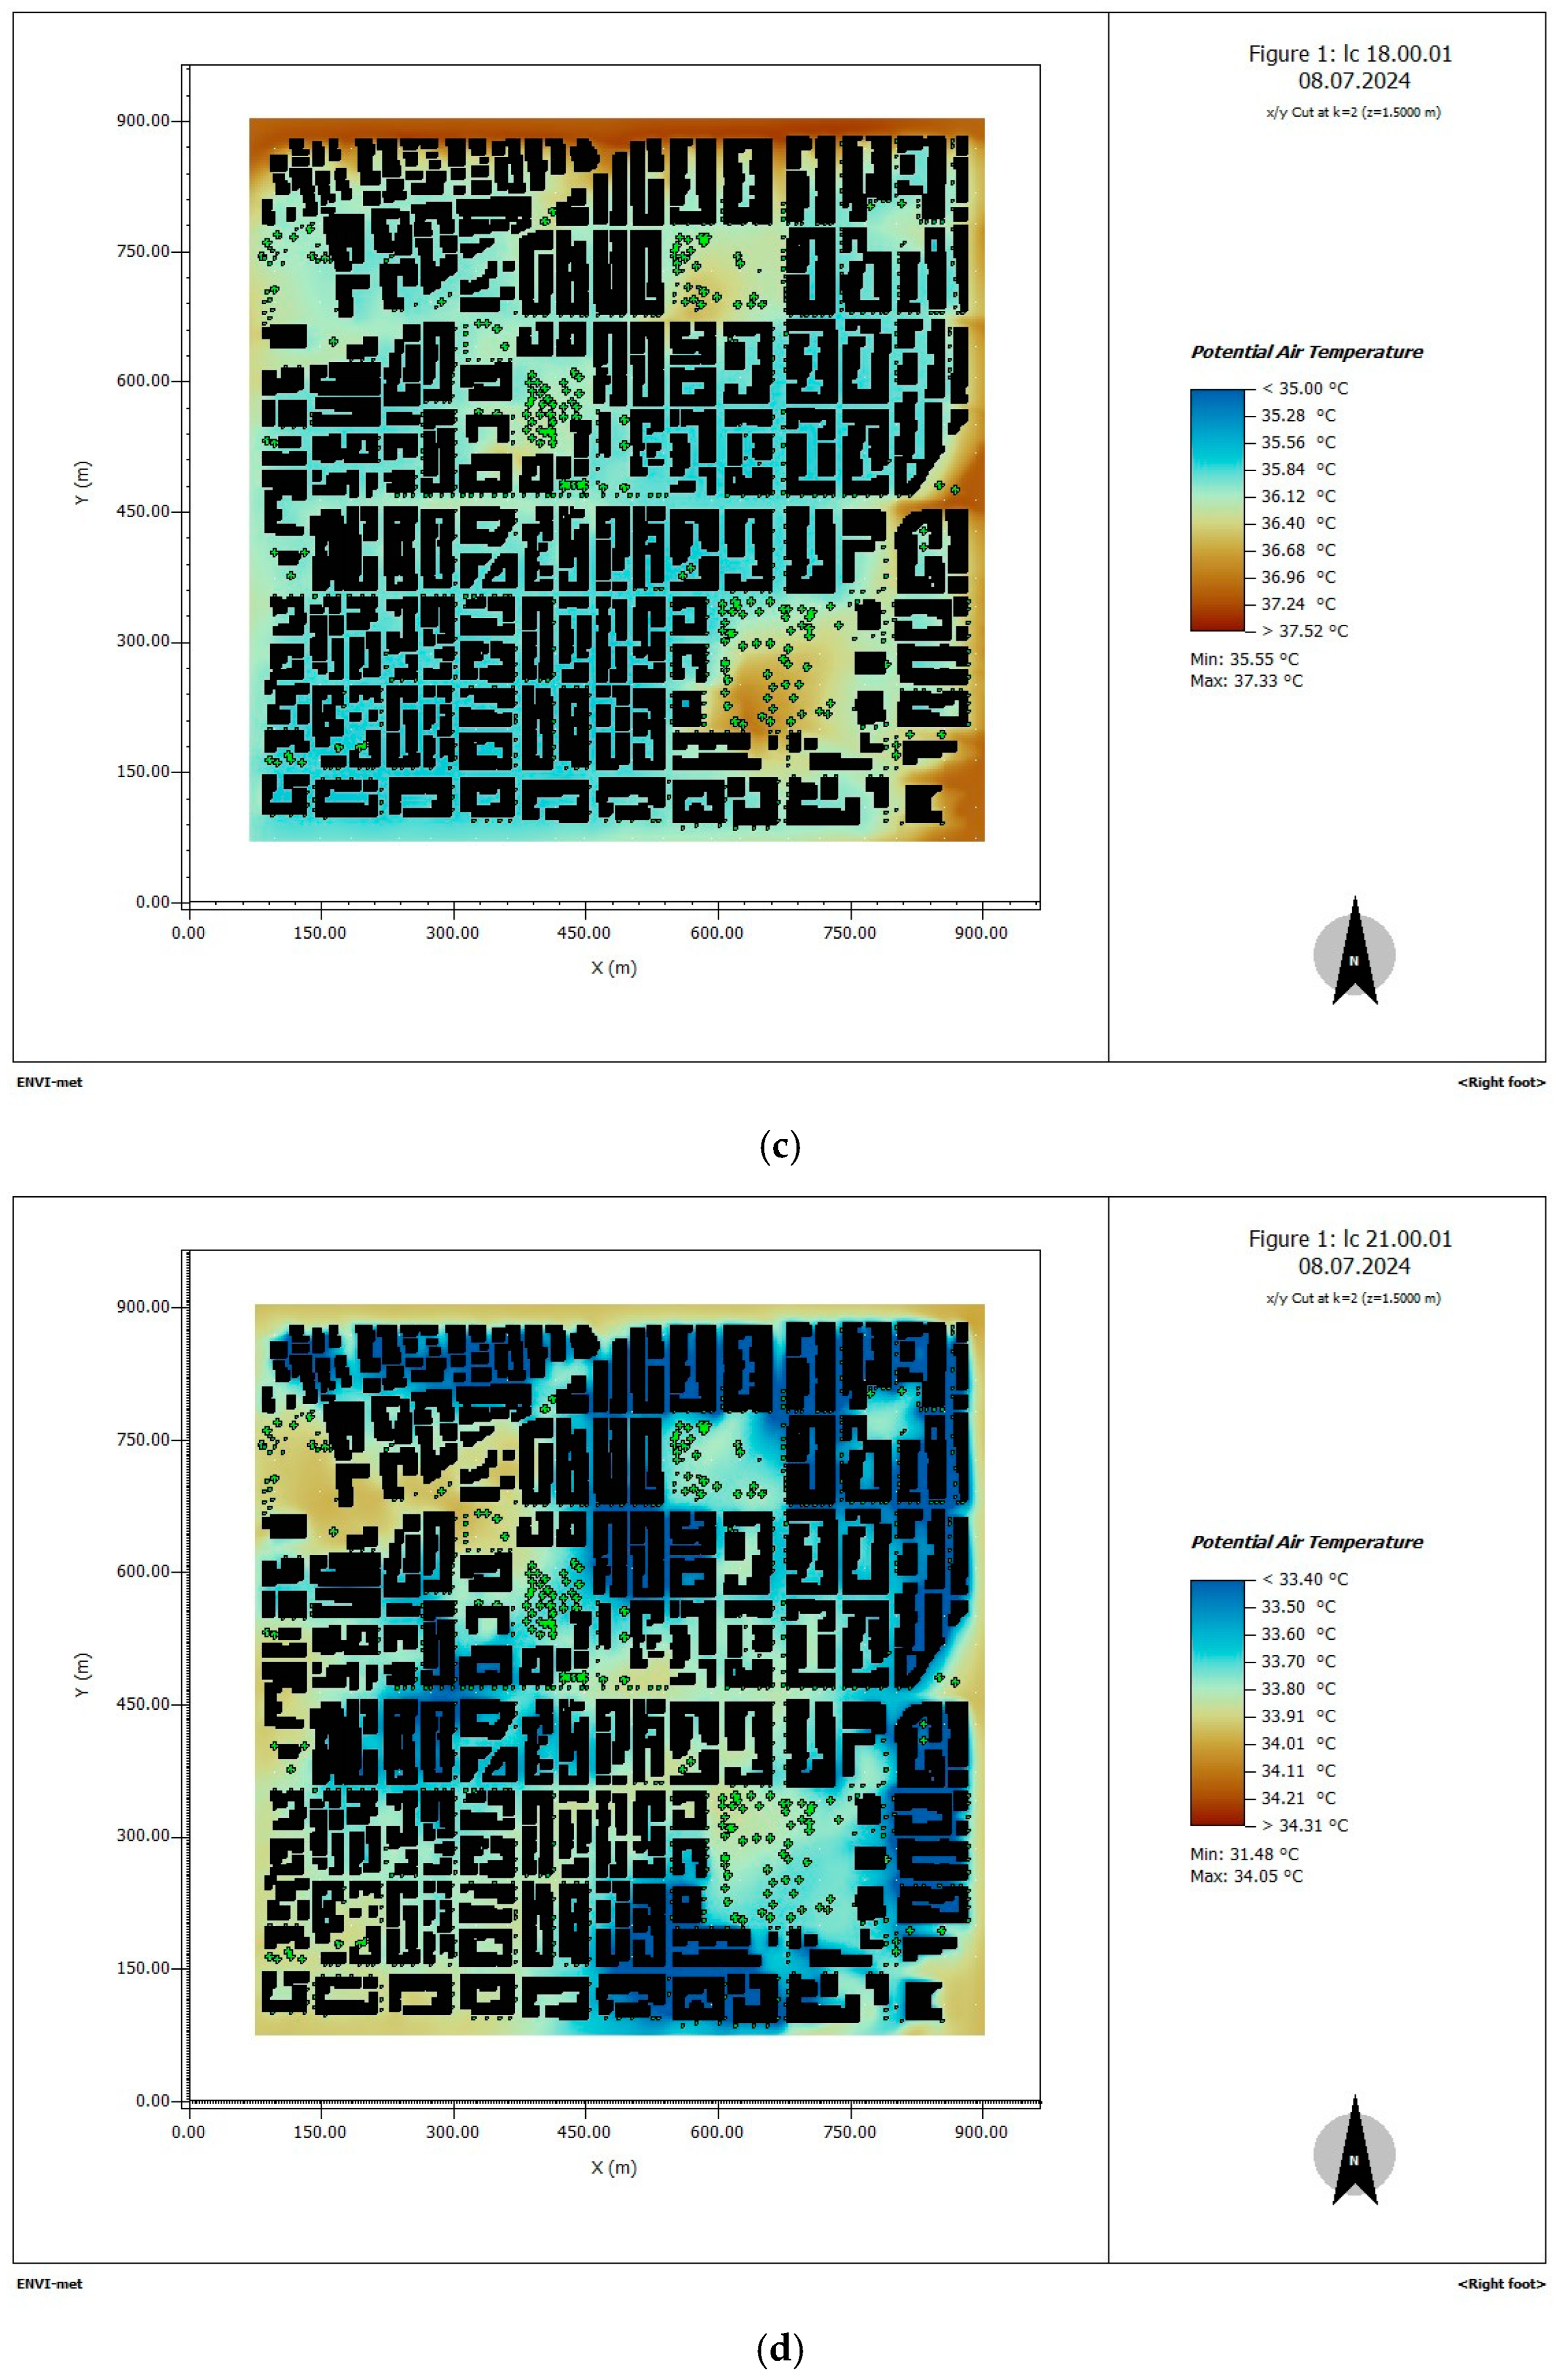
The air temperature (Tair, °C) remained high throughout the day, even after sunset, and varied between 31.48 °C (at 21:00) and 38.9 °C (at 15:00) (Figure 7a–d). The most thermally degraded area is located at the eastern end of the main horizontal road, in the middle of the study area, likely due to the absence of green infrastructure or any kind of shade for a long distance, whereas lower air temperature, between 34 and 35 °C, prevailed over most of the study area. These results revealed that the most adverse thermal conditions induced in outdoor open spaces occurred particularly during sunny hours due to the lack of shade, whereas tall buildings provided protection from the heat.

3.1.2. Physiologically Equivalent Temperature (PET, °C) Under Initial Conditions

As mentioned above, this study estimated PET for both a typical male adult and an elderly individual. Therefore, Figure 8 presents the PET estimations for a typical adult male, and Figure 9 presents the PET estimations for an elderly individual.
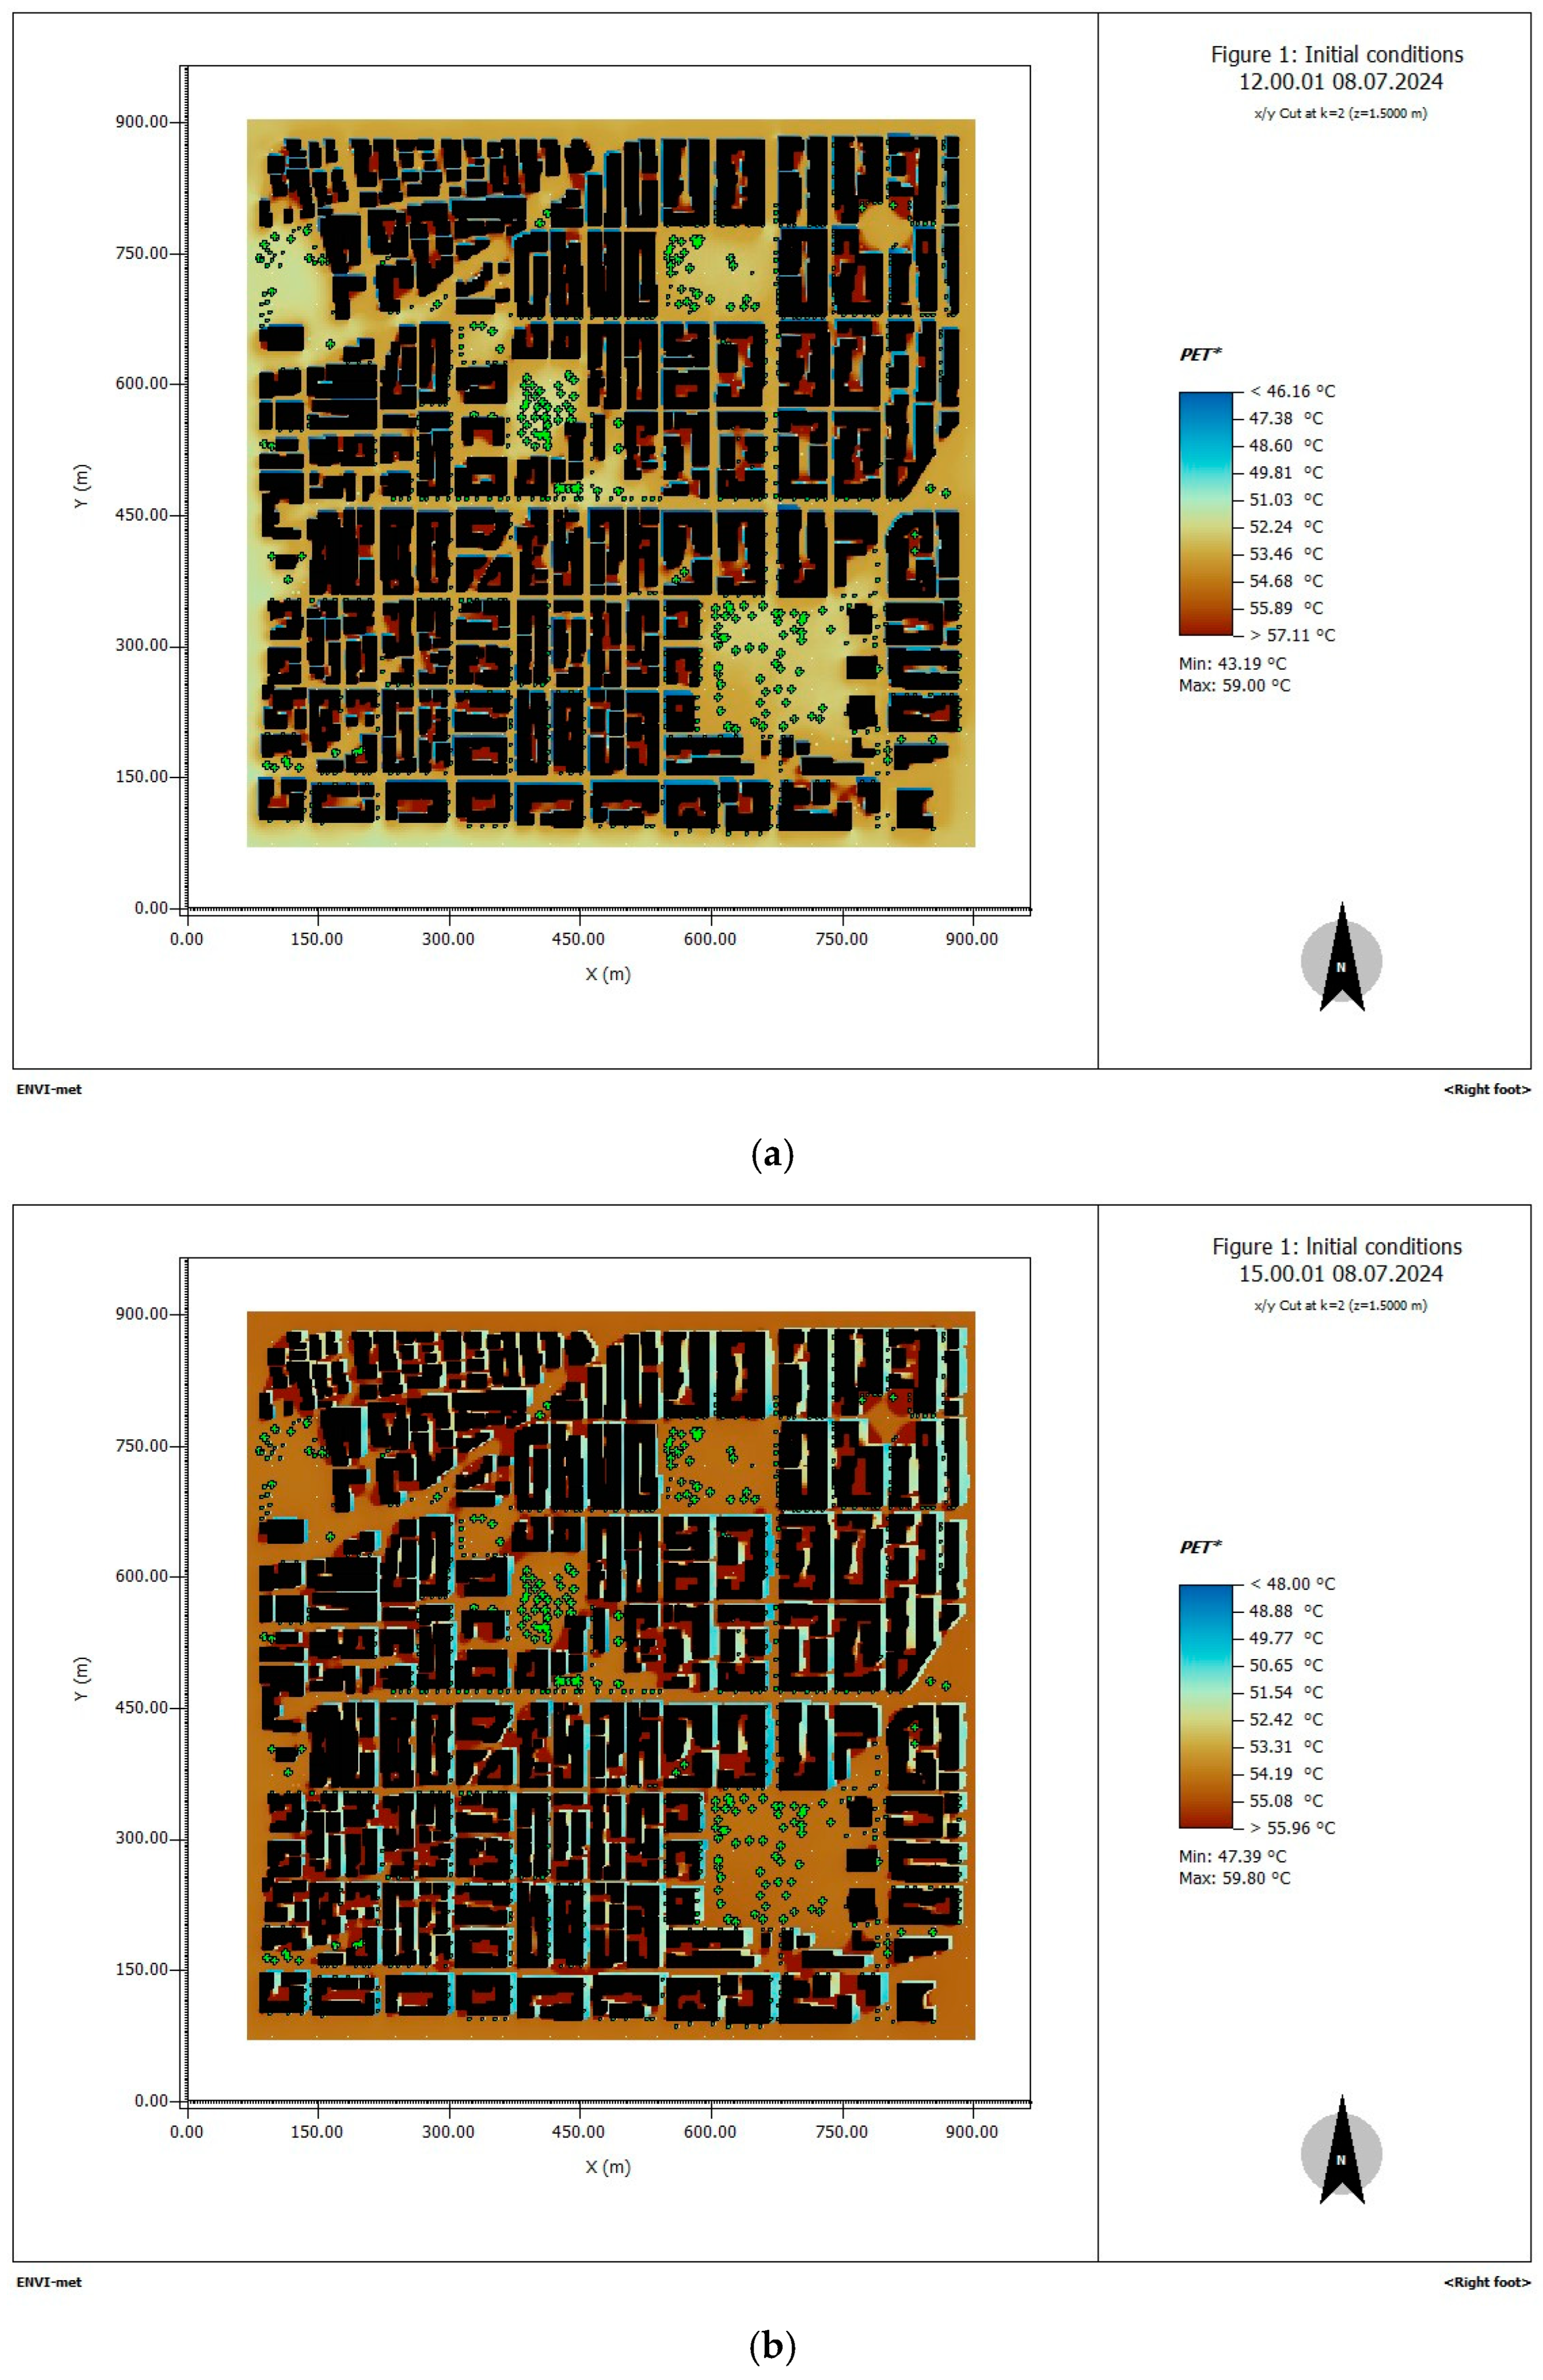
Overall, PET remains particularly elevated during the day, exceeding the threshold of 41 °C, which corresponds to “Extreme heat stress”, based on the index heat stress scale (Table 2). More specifically, for a typical male adult, the maximum value of PET, 59.00 °C (Extreme heat stress), was produced at 12:00, mainly within the courtyards of buildings where the air flow is also prevented. The minimum value, 43.19 °C (Extreme heat stress), was produced around the perimeter of multi-storey buildings due to the shade they provide (Figure 8a). At 15:00, the maximum value of PET, 59.80 °C (Extreme heat stress), was produced within the courtyards of buildings where the air flow is blocked. The minimum value of 47.39 °C (Extreme heat stress) was observed along the sides of multi-storey buildings that allow unobstructed air flow in the north–south direction (Figure 8b).
At 18:00, the PET values decreased gradually. Although the higher PET values still fall within the ’Extreme heat stress’ category, they are mainly estimated in unshaded areas, whereas the majority of the study area falls within the ‘Strong heat stress’ category, primarily due to the shade provided by surrounding buildings and tall trees. More specifically, the maximum PET value reaches 57.96 °C (Extreme heat stress) in unshaded outdoor areas, whereas the minimum value of 40.19 °C (Strong heat stress) is estimated across most of the study area (Figure 8c). Finally, at 21:00, the maximum PET value of 36.29 °C (Strong heat stress) is estimated locally in some unshaded areas, whereas the minimum value of 29.64 °C (Moderate heat stress) was estimated around multi-storey buildings (Figure 8d). Overall, the maximum PET value of 59.80 °C was estimated at 15:00. Notably, however, thermal conditions remain unfavorable for pedestrians even during nighttime hours.
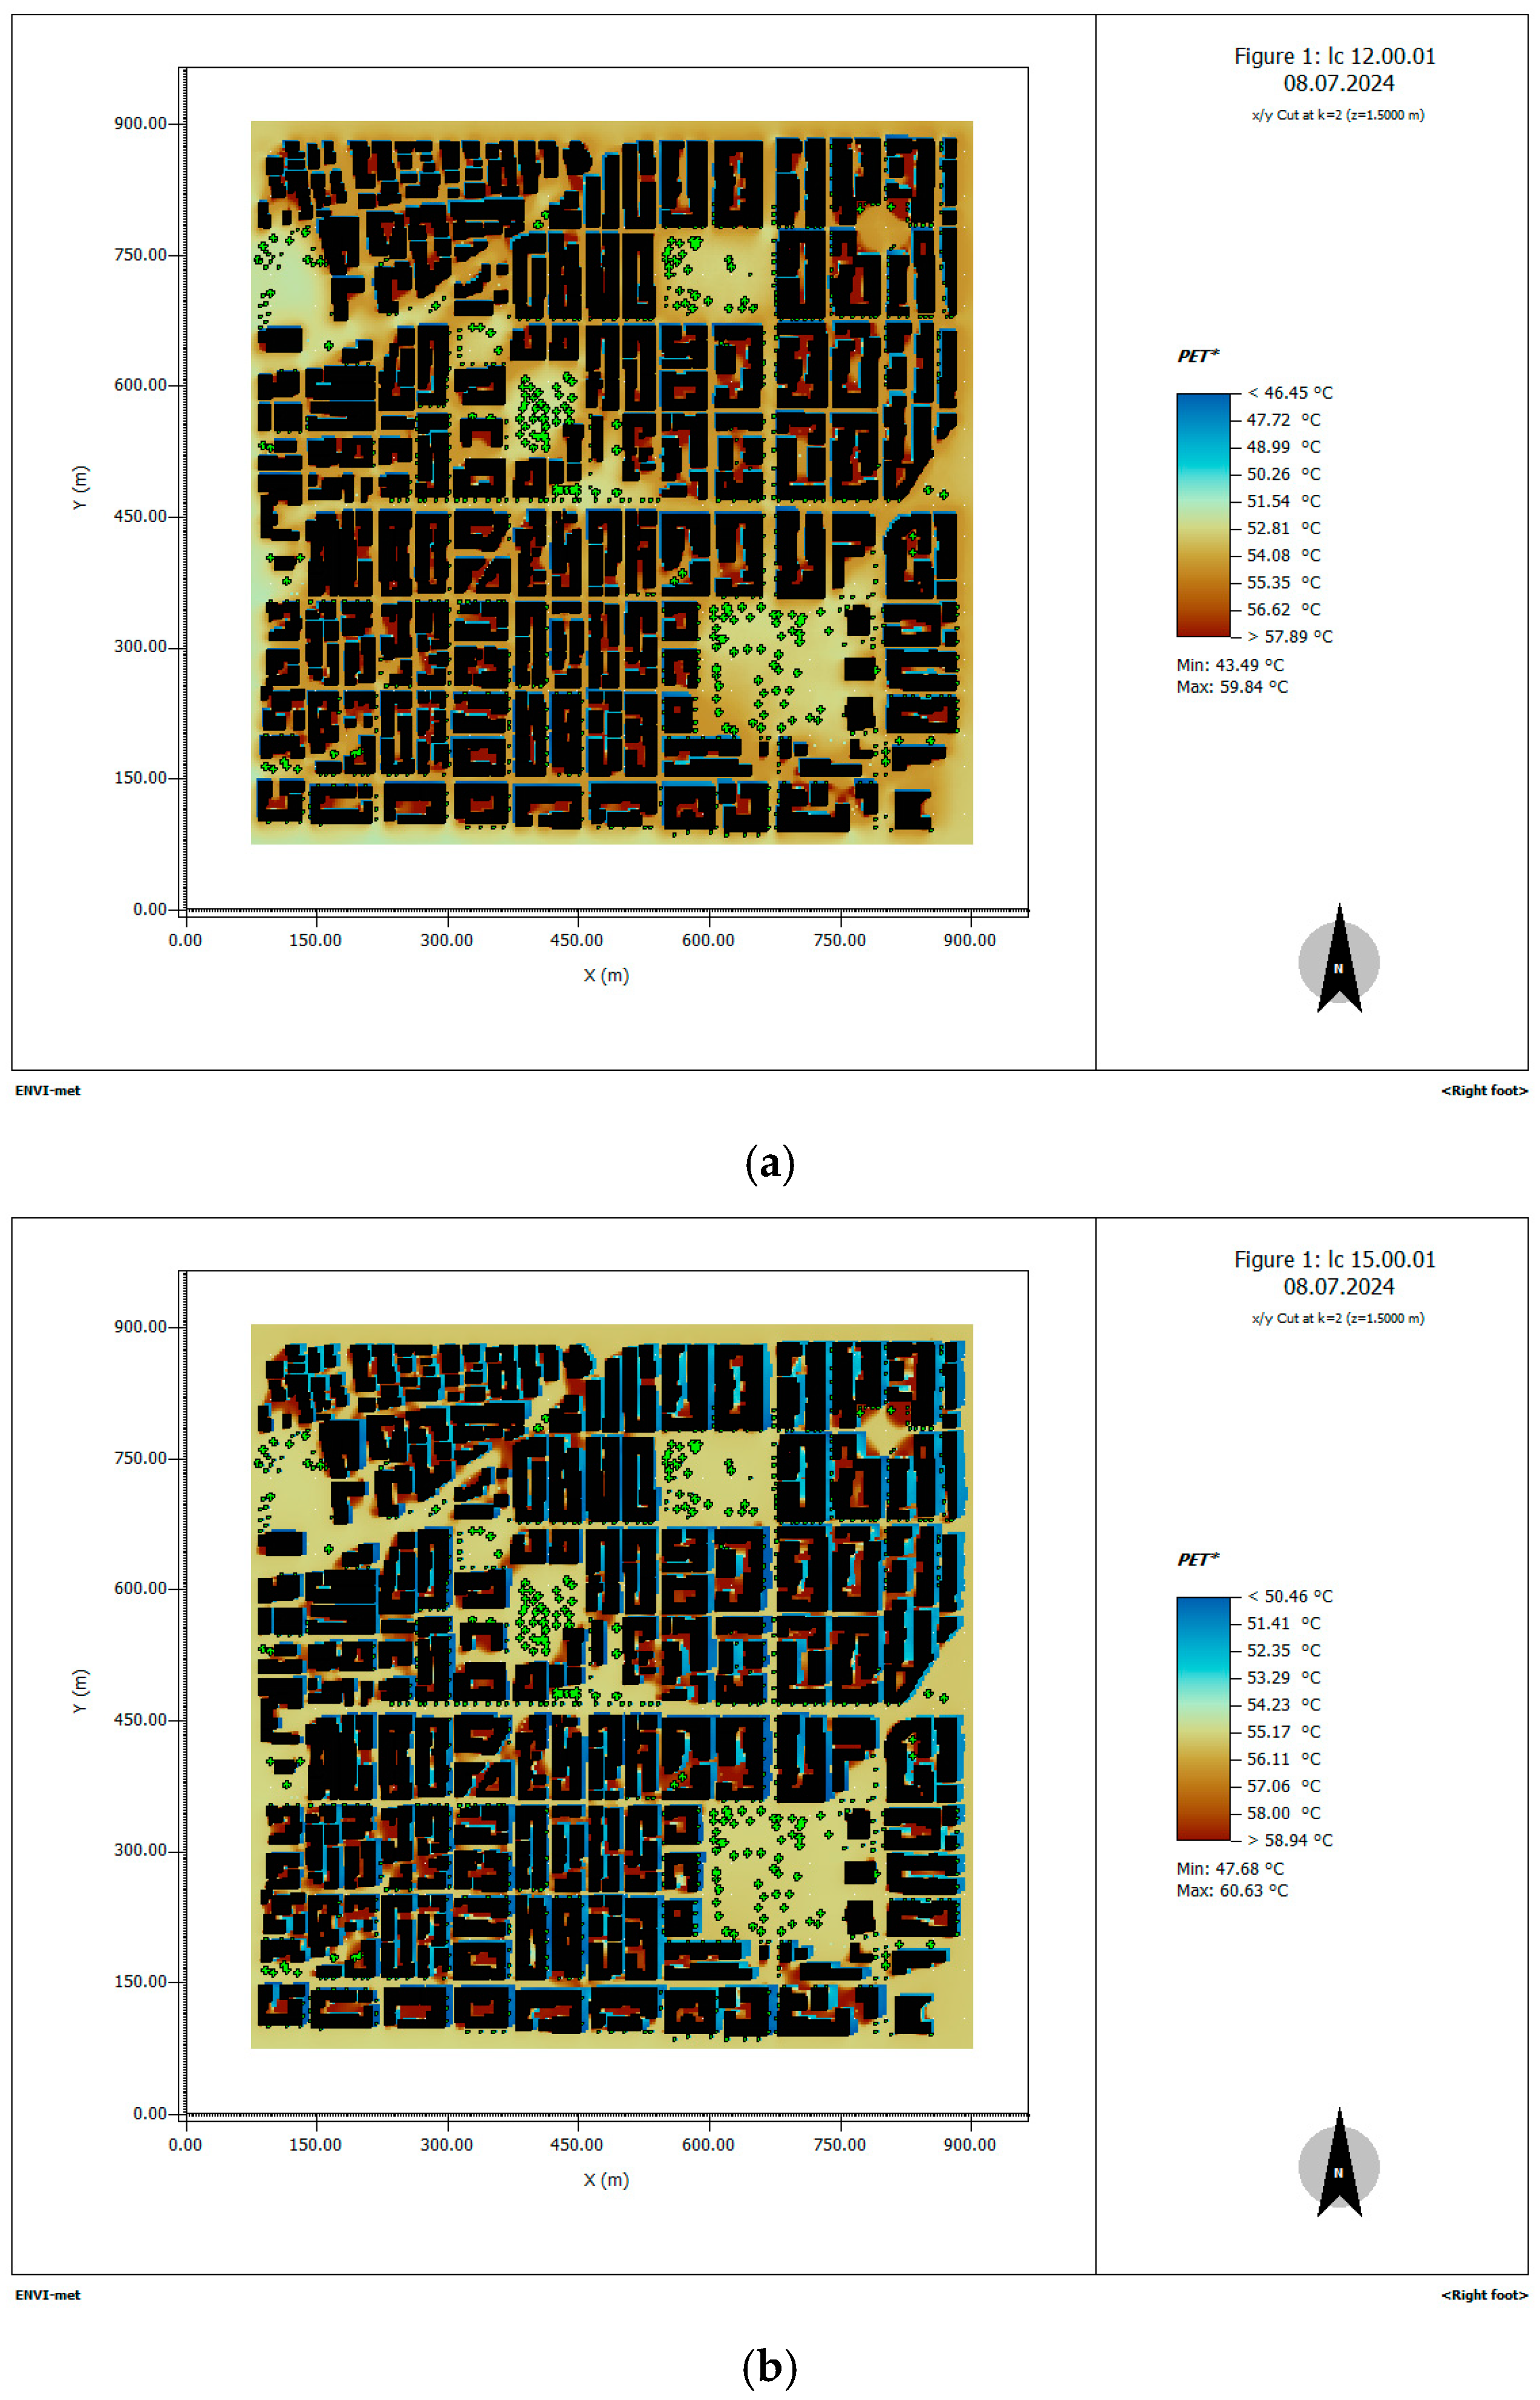
For an elderly individual, the situation is even more unfavorable. At 12:00, the maximum value of the PET, 59.84 °C (Extreme heat stress), was estimated in the courtyards of buildings, where the air flow is obstructed. The minimum value of 43.49 °C (Extreme heat stress) was estimated at the shaded sides of the surrounding buildings. (Figure 9a). At 15:00, at locations corresponding to those examined at 12:00, a maximum PET value of 60.63 °C is observed, exceeding the threshold for the ‘Extreme heat stress’ category by nearly 20 °C. The minimum PET value, 47.68 °C, remains exceptionally high and also falls within the ‘Extreme heat stress’ category; this minimum occurs primarily around building perimeters (Figure 9b).
At 18:00, the maximum PET decreases slightly to 58.80 °C, still classified as ‘Extreme heat stress’, whereas the minimum PET value decreased to 40.51 °C, corresponding to ‘Strong heat stress’ (Figure 9c). By 21:00, PET values showed a more pronounced decline. The maximum PET reached 36.62 °C (Strong heat stress), occurring locally within squares or open spaces, whereas the minimum PET decreased to 29.95 °C (Moderate heat stress) along streets flanked by tall buildings on both sides (Figure 9d). Overall, the PET index attained its daily maximum at 15:00, with a notably high value of 60.63 °C (Extreme Heat Stress).

3.2. Thermal Environment Under the Regeneration Scenario

3.2.1. Air Temperature (Tair, °C)

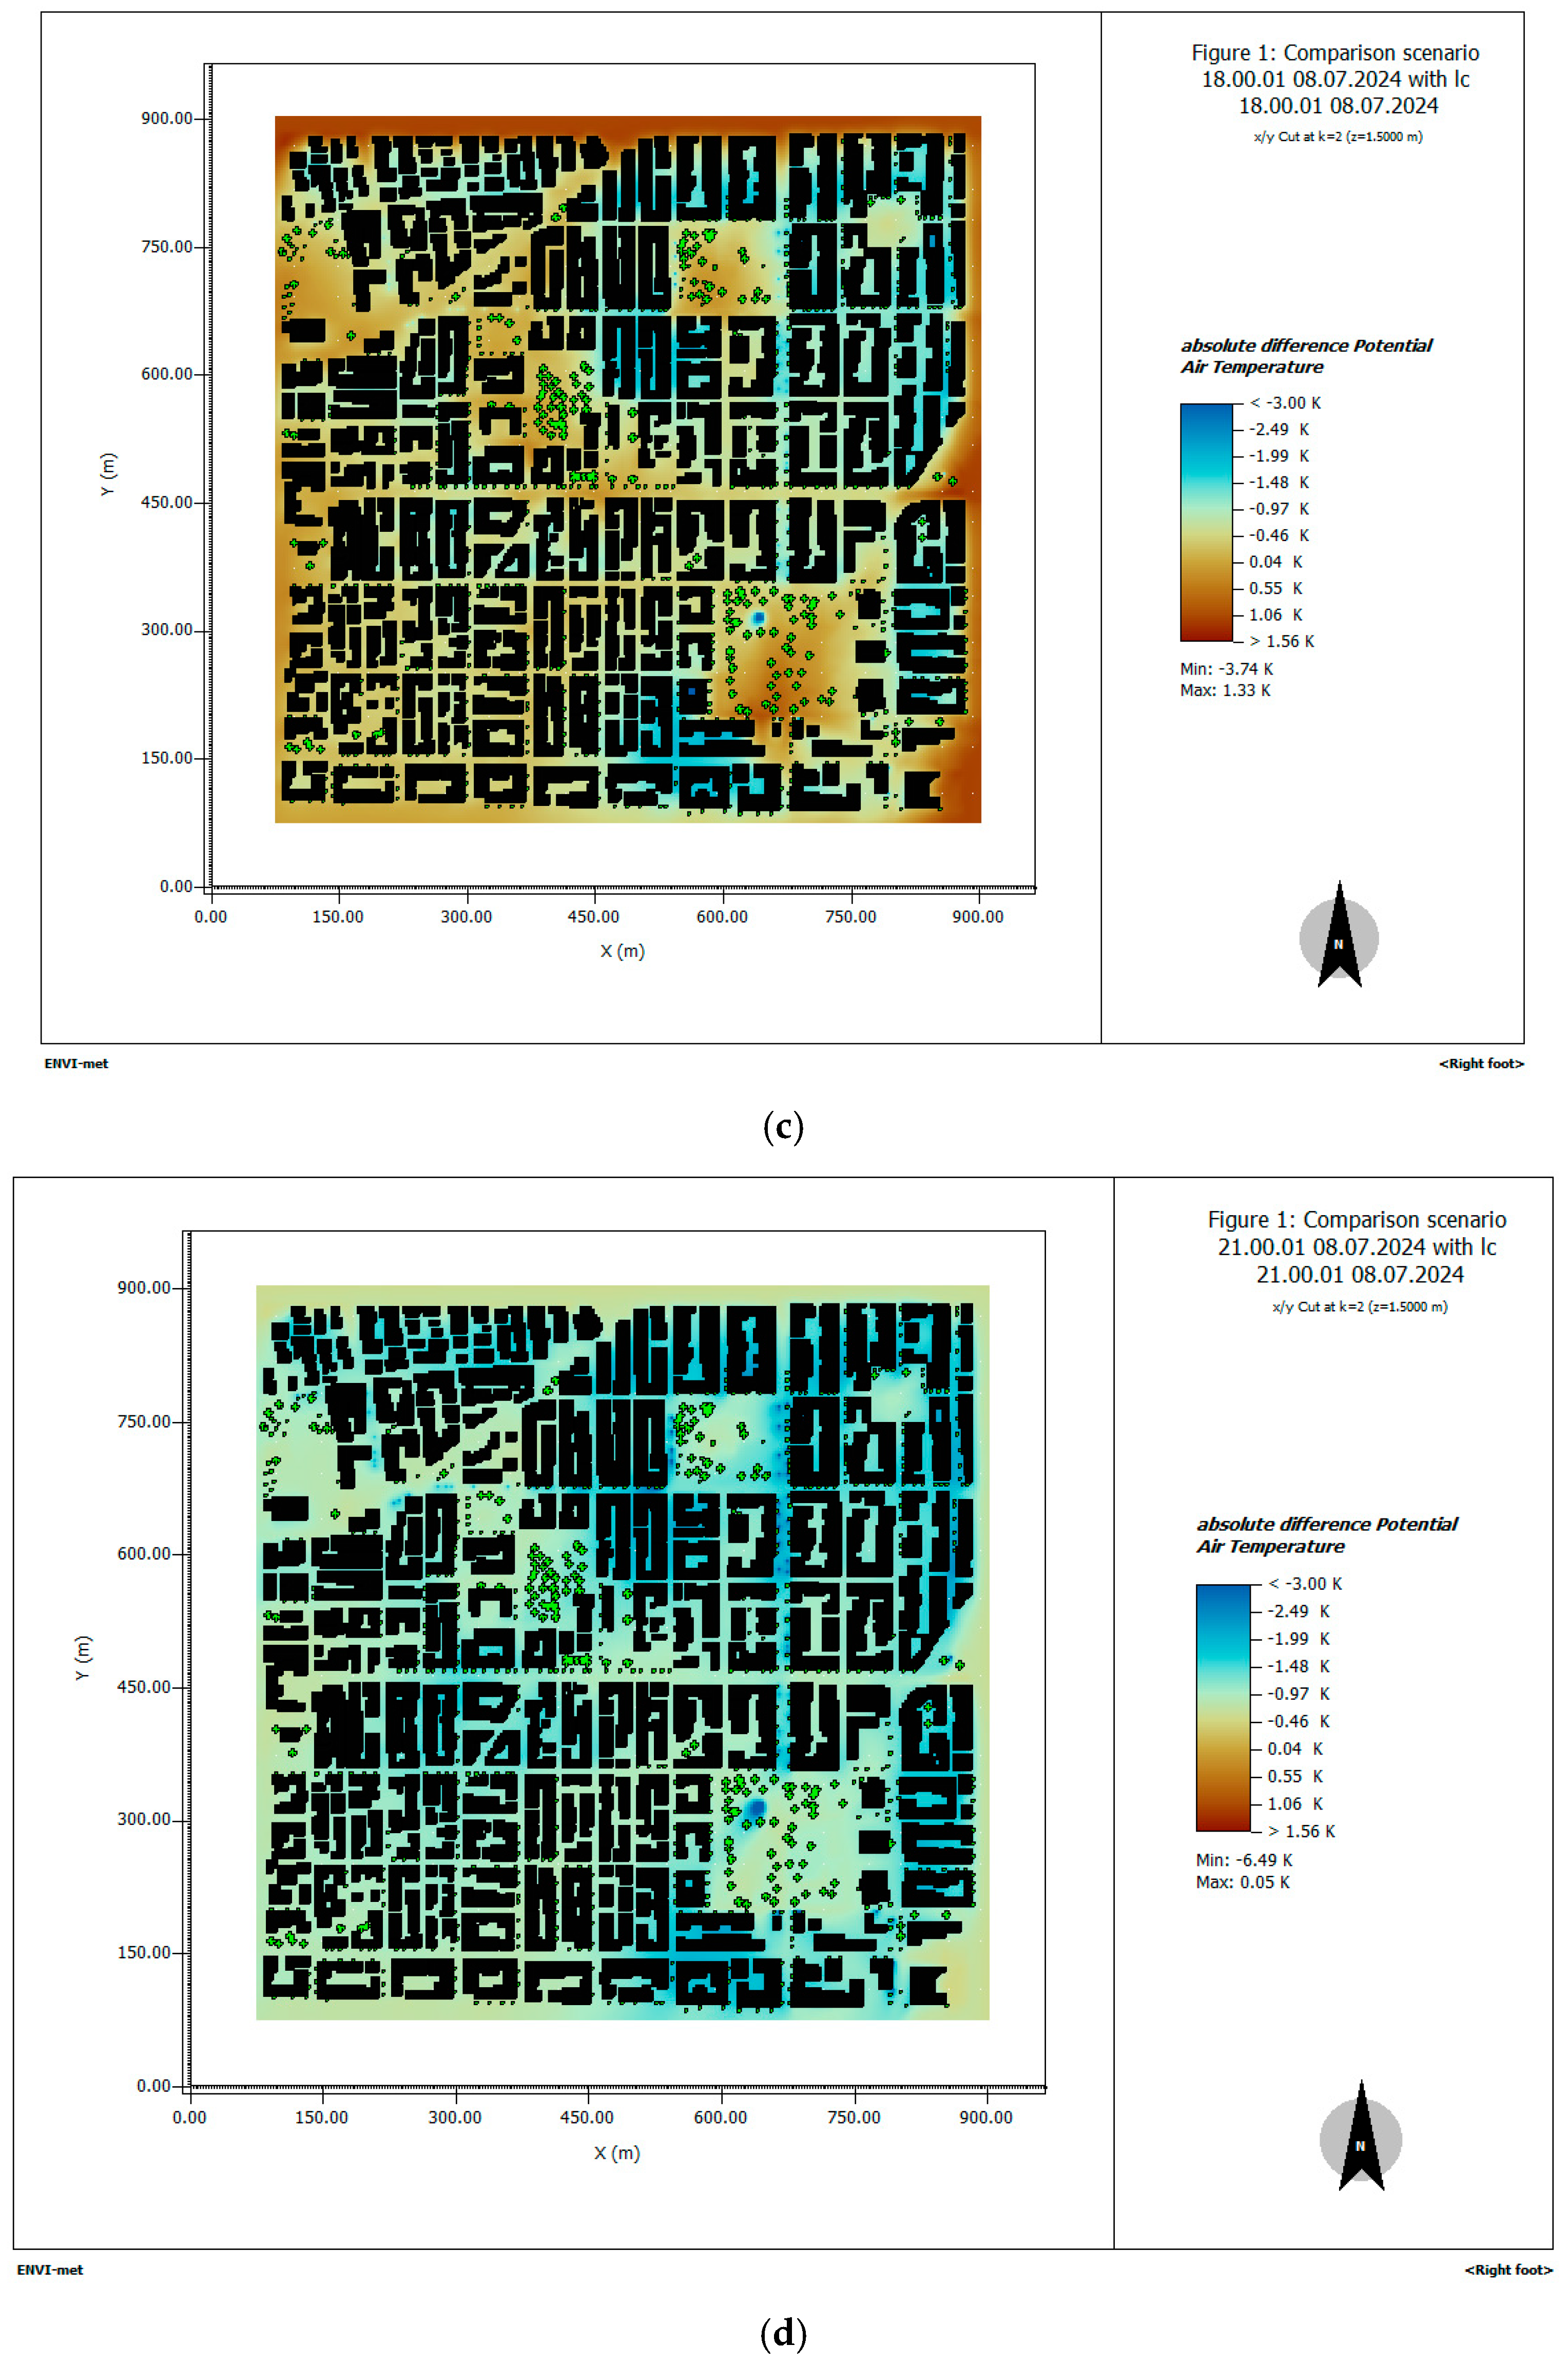
Figure 10 presents the cooling effect achieved under the regeneration scenario. At 12:00, the maximum decrease of Tair was 1.84 °C, observed in the atrium of a multi-storey building. The next largest decrease (approximately 1.60 °C) was produced at the large fountain in the square located southeast of the study area (Figure 10a).
At 15:00 and 18:00 (Figure 10b,c, respectively), the greater Tair decrease ranged between 2 and 3 °C, and was observed primarily in the shaded sides of the multi-storey buildings and around small fountains that were placed along the route. At 21:00 (Figure 10d), a Tair decrease was observed in the entire study area, and a maximum decrease of 6.49 °C was produced in the large fountain within the square. In addition, a significant Tair decrease of approximately 3 to 5 °C was produced throughout the route, particularly in the proximity of the new small fountains.
Streets where interventions were implemented on both sides show the most favorable results compared to streets where measures were applied to only one lane. In contrast, the smallest difference—almost negligible—was observed on narrow roads, where significant interventions were not feasible. Furthermore, the increase in air temperature observed mainly in squares is consistent with the findings of [20]. Under conditions of high thermal load, plants tend to close their stomata to limit moisture loss through evaporation. This physiological response, combined with reduced air circulation, can locally lead to increased air temperature in areas with dense vegetation [20].

3.2.2. Physiologically Equivalent Temperature (PET, °C) Under the Regeneration Scenario

As mentioned above, this study estimated PET for both a typical male adult and an elderly individual. Therefore, Figure 11 presents the PET estimations for a typical adult male, and Figure 12 presents the PET estimations for an elderly individual. Finally, Table 3 summarizes the thermal sensation improvement according to PET reductions in the study area, for both the adult male and the elderly individual.
At 12:00, PET provided a small-scale decrease to the greatest part of the study area, varying between 0.3 and 2.5 °C, primarily at the points of green and blue interventions (Figure 11a). The greatest temperature reduction, reaching up to 14.0 °C, was produced near the buildings as a result of shading. During the afternoon hours (15:00), PET decreased mainly between 2 and 5 °C, particularly in the areas with extensive interventions. Across the entire study area, PET remained either stable or exhibited a small decrease of up to 2.5 °C, with the greatest reductions to be estimated in areas shaded by buildings (Figure 11b). At 18:00, an overall decrease in PET was estimated across the entire area that varied mainly between 1 and 5 °C (Figure 11c). At 21:00, the fountain installation produced the largest local reduction in PET values (approximately 3–5 °C) due to evaporating cooling, while a slighter overall decrease in PET was observed across the entire intervention area (approximately 1–3 °C) (Figure 11d).

3.3. Dynamic Physiologically Equivalent Temperature (dPET)

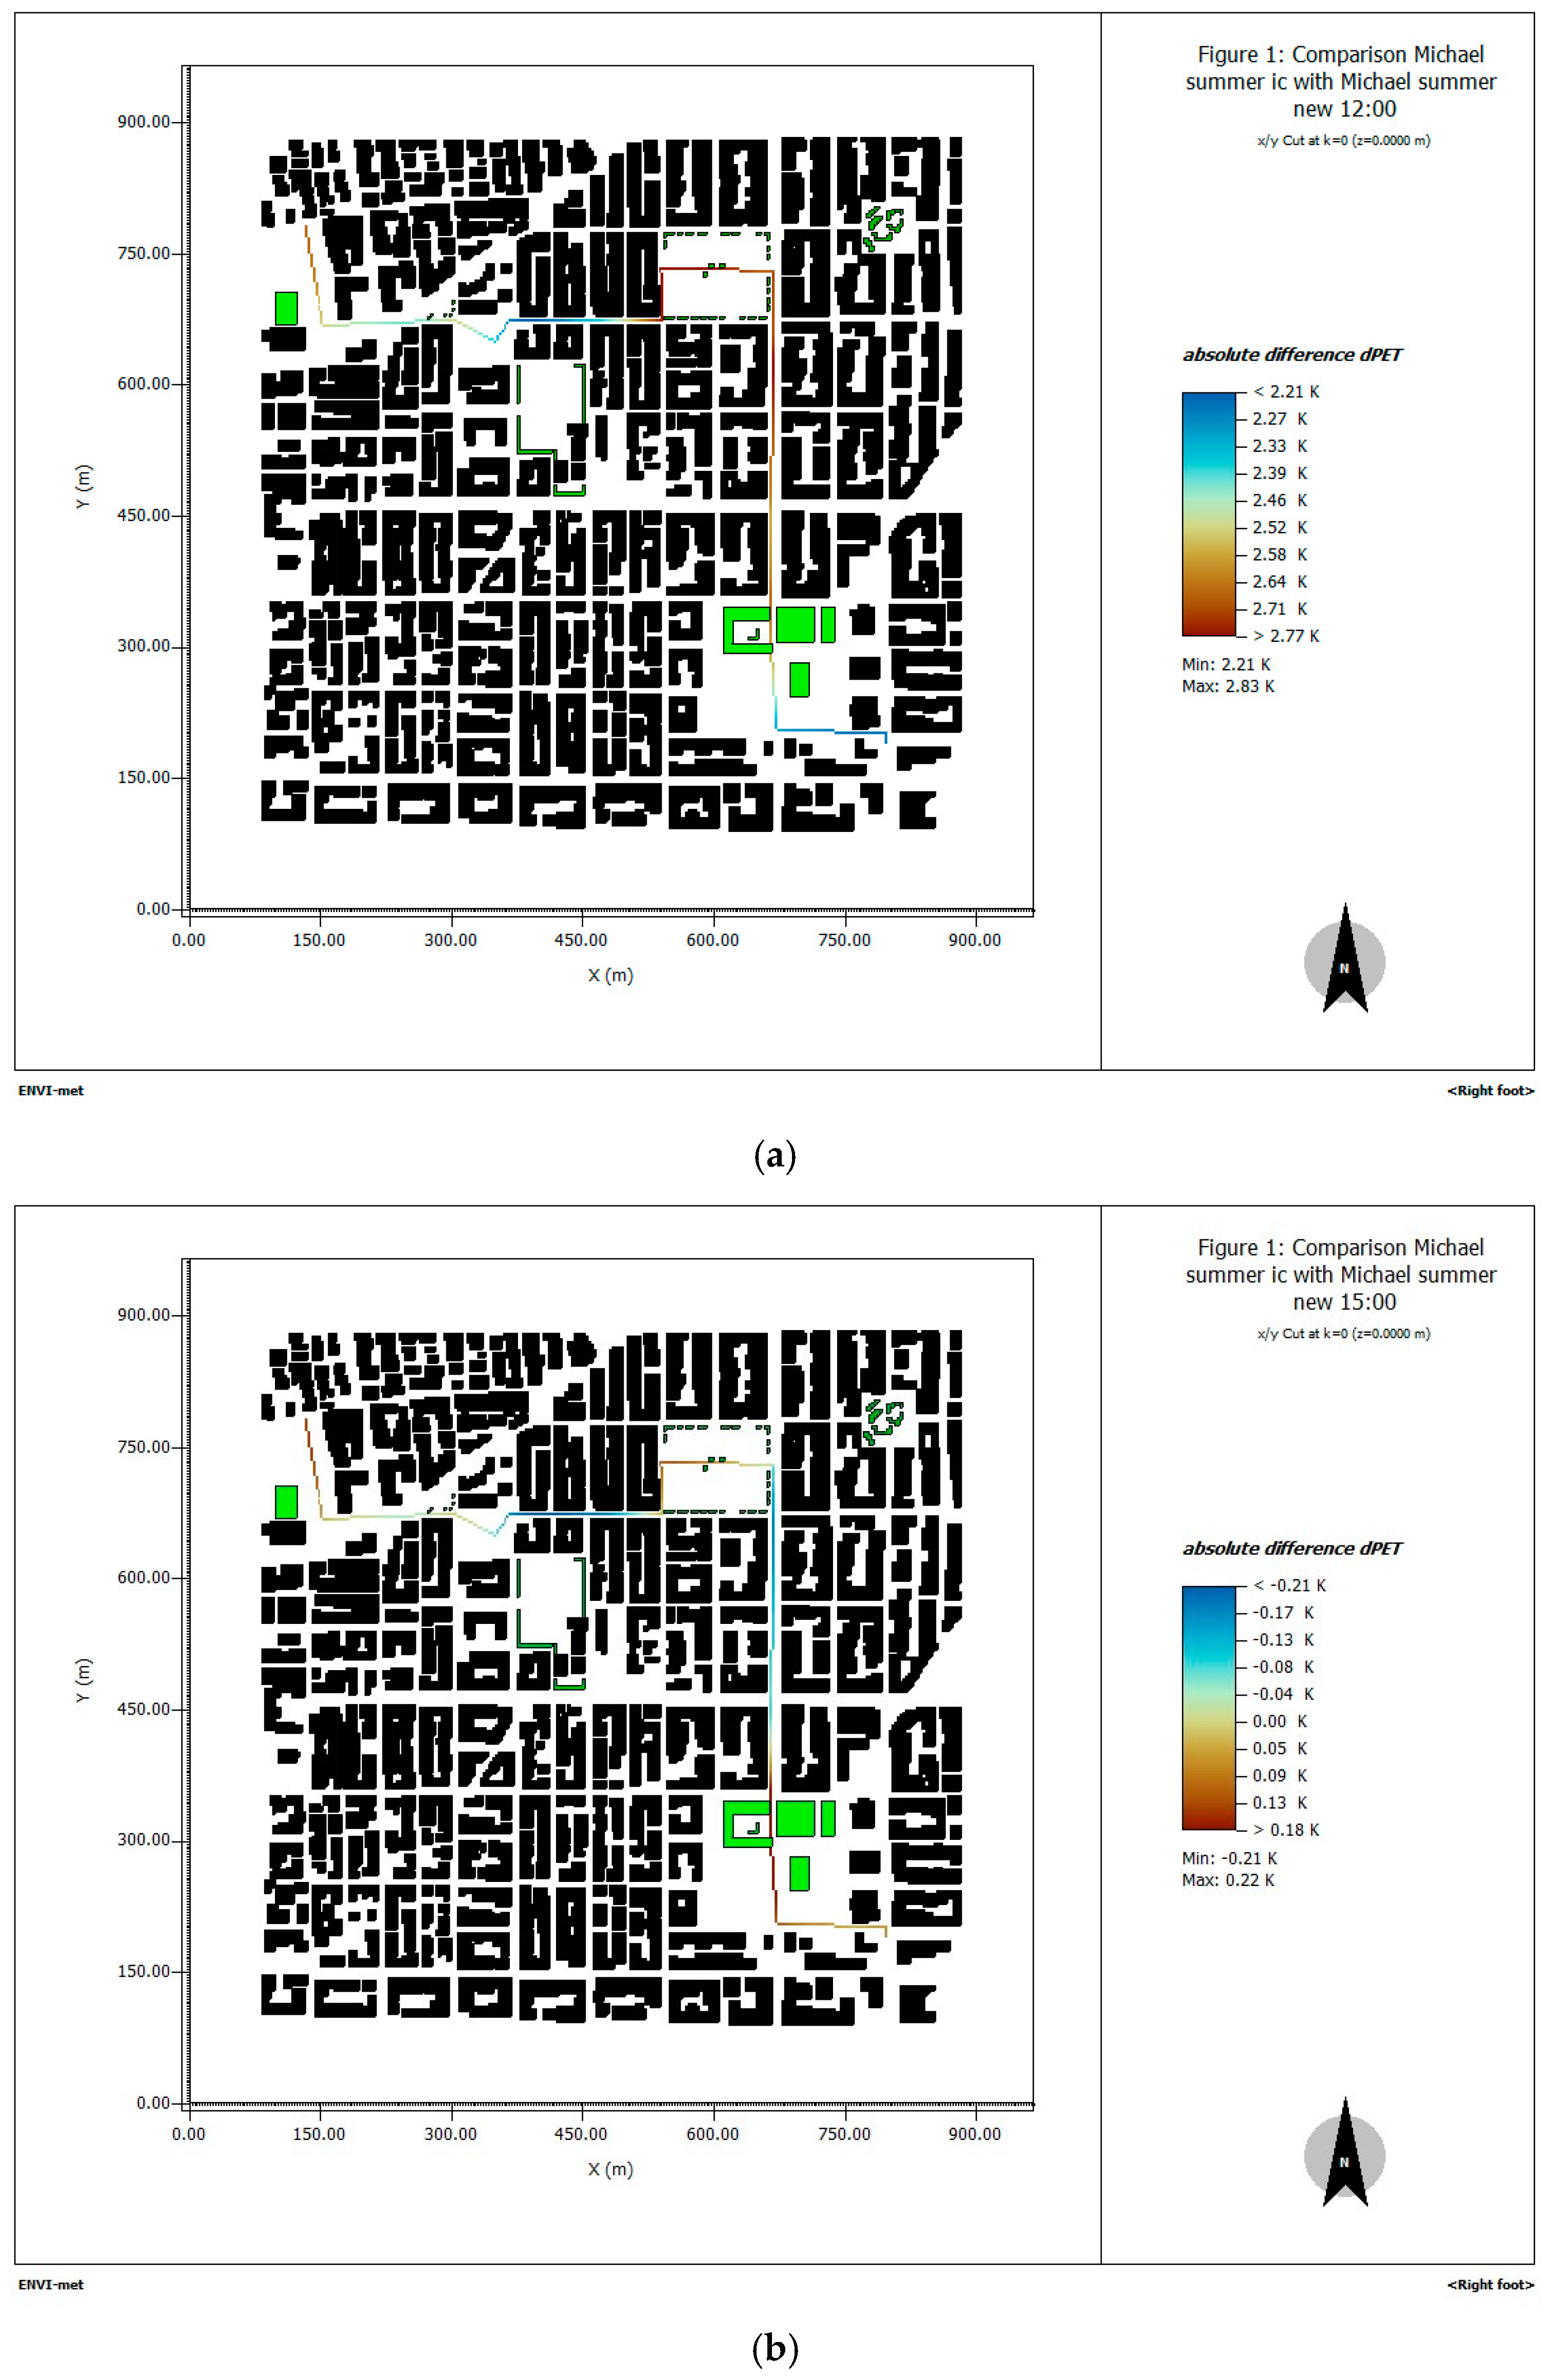
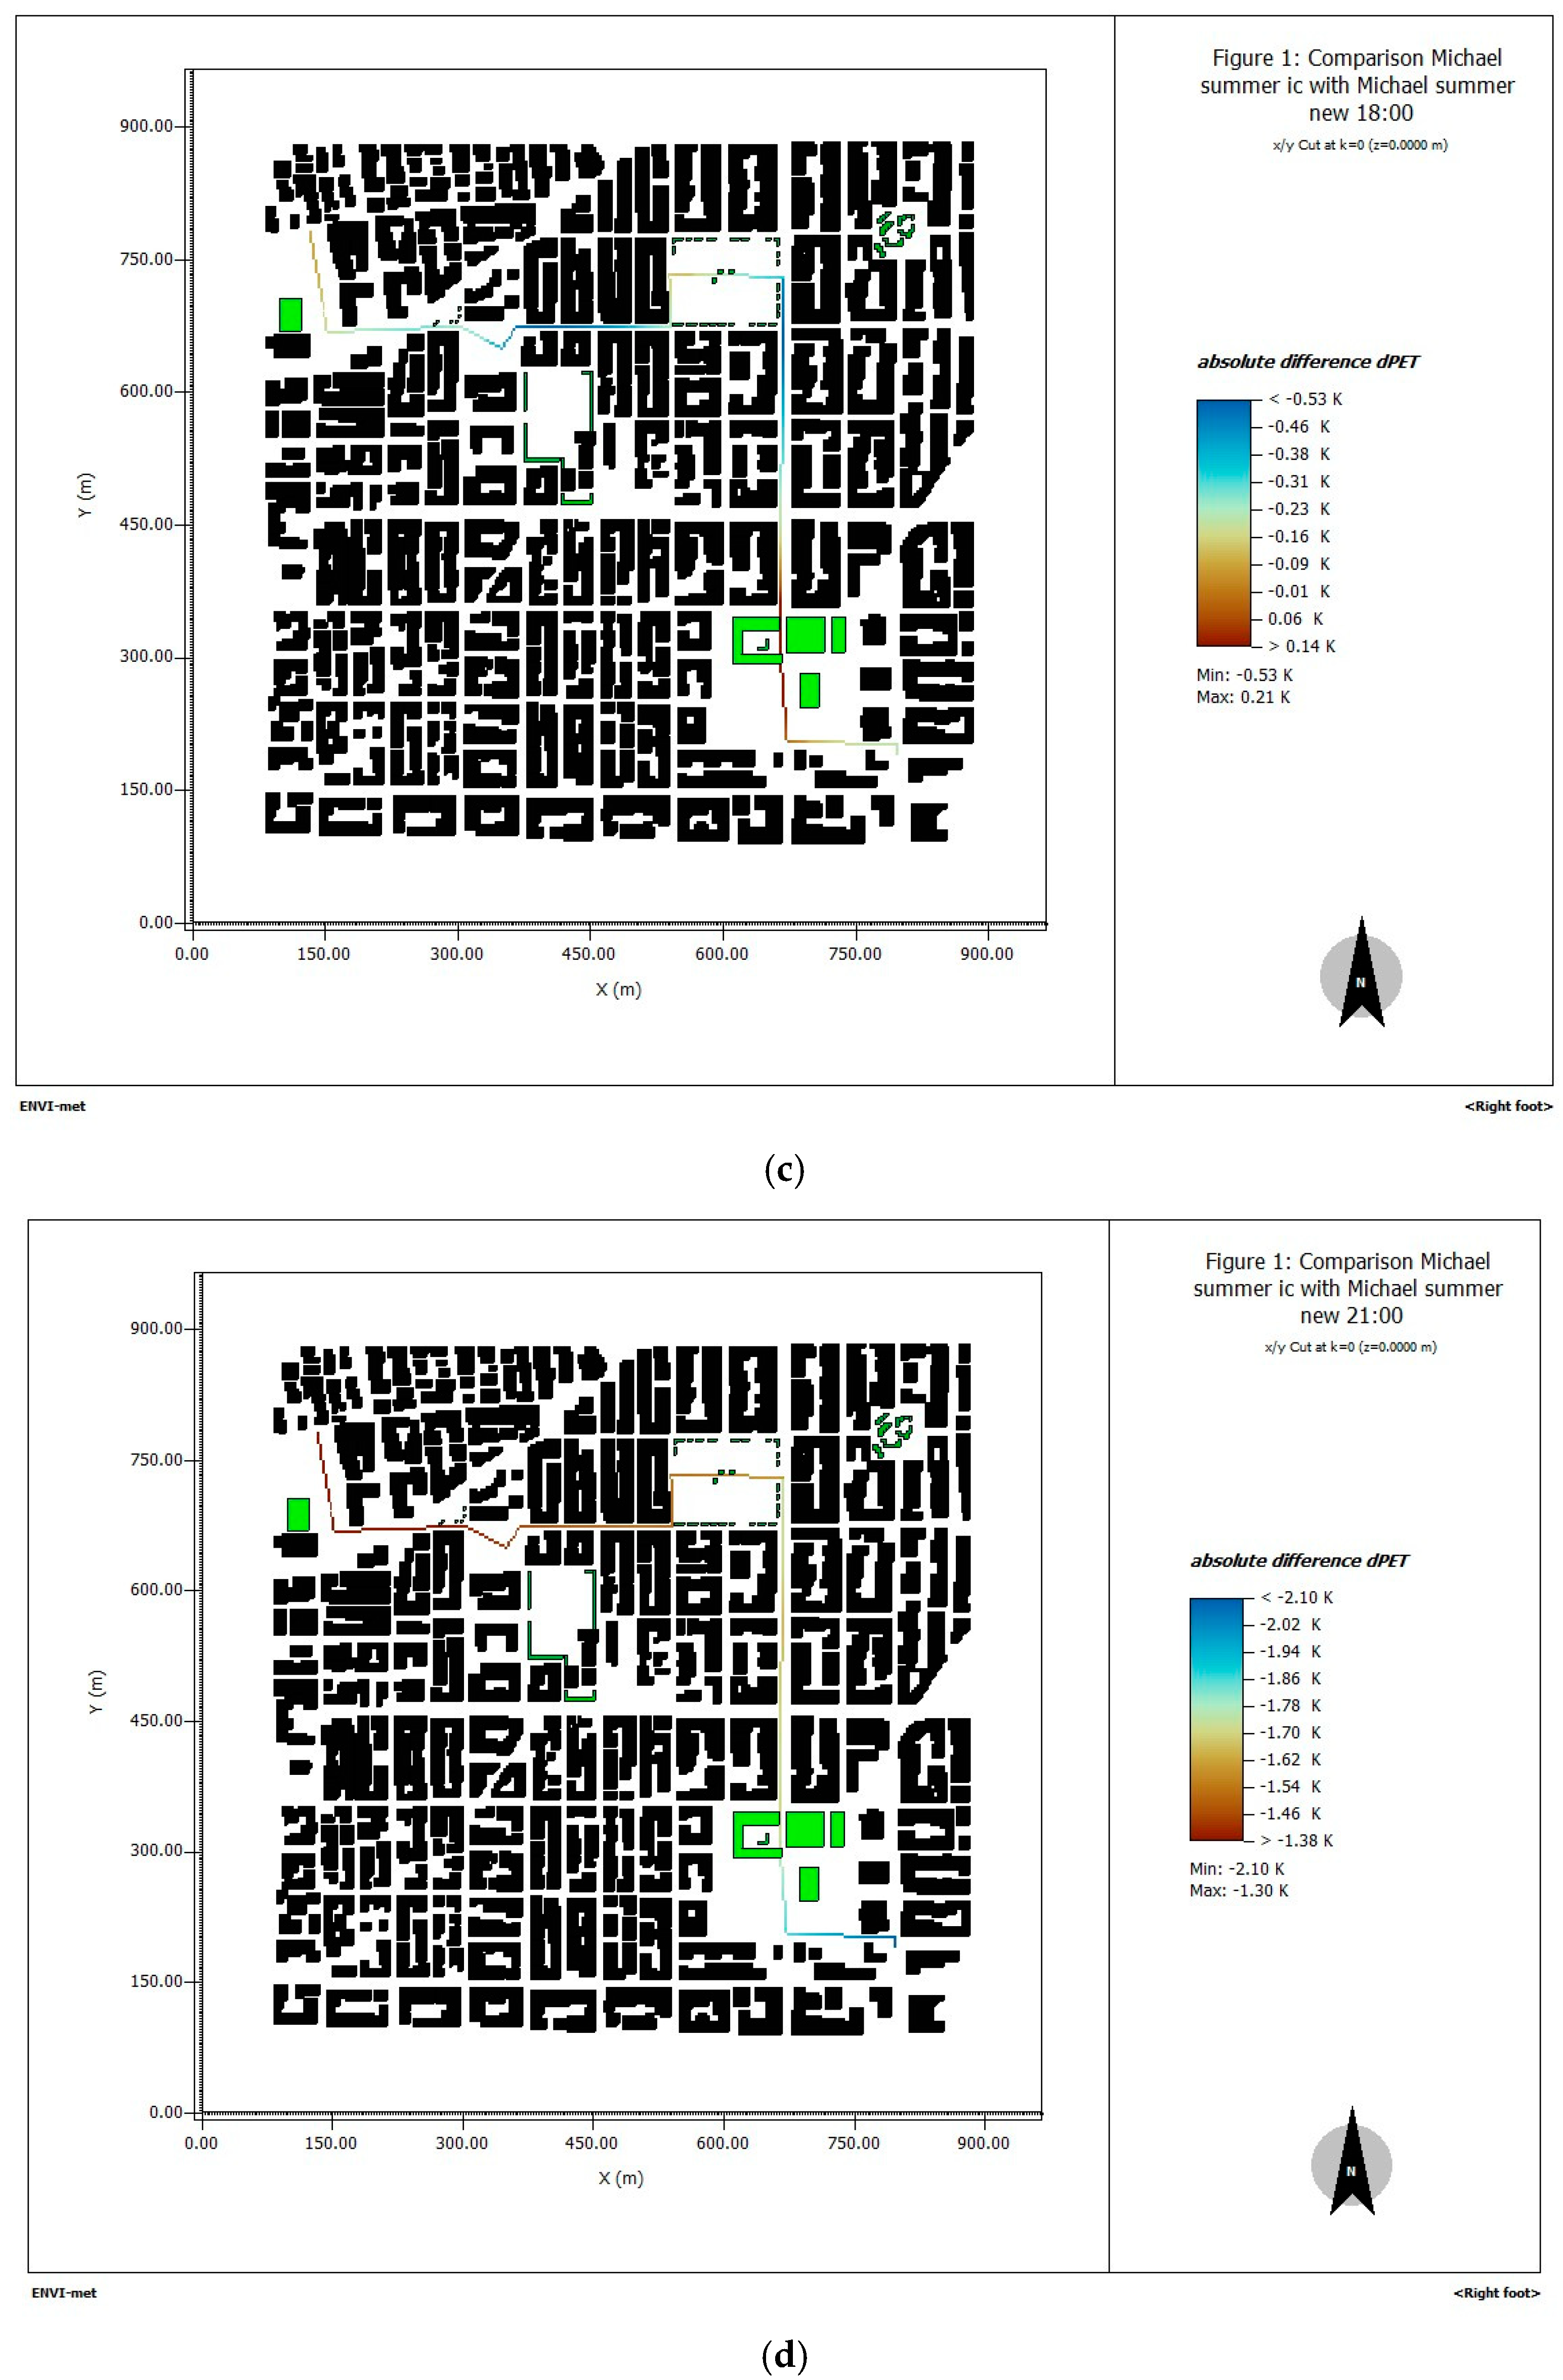
Thermal indices obtained in static thermal environments are not always sufficient to adequately explain the transient thermal sensation of pedestrians, who are exposed to continuously changing environmental conditions due to complex urban geometries. The dPET index was calculated for a typical adult male and an elderly individual with light (summer) clothing. Figure 13 and Figure 14 present the changes in thermal comfort experienced along the regeneration route by an adult male and an elderly individual, respectively. Finally, Table 4 summarizes the thermal sensation changes according to dPET reductions in the study area for both the adult male and the elderly individual.
For the adult male, the dPET index at 12:00 (Figure 13a) estimated an increase of approximately 2 °C compared to pre-intervention conditions. As mentioned above, this increase, which was also produced in the cases of Tair and the static PET, has been investigated in previous research, indicating that it might be the result of the extremely high air temperature that leads to the stomata of the plants closing in order to reserve moisture within their tissue [20]. At 15:00 and 18:00, a slight increase in dPET is produced, particularly in squares, while an approximately equivalent decrease is recorded along streets where interventions were implemented (up to 0.22 °C at 15:00 and 0.53 °C at 18:00) (Figure 13b,c). In the evening, dPET decreases along the entire route by 1–2 °C, with a maximum reduction of 2.1 °C. Overall, the dPET index varied dynamically as pedestrians moved along the selected route, reflecting the influence of localized microclimatic conditions (Figure 13d).
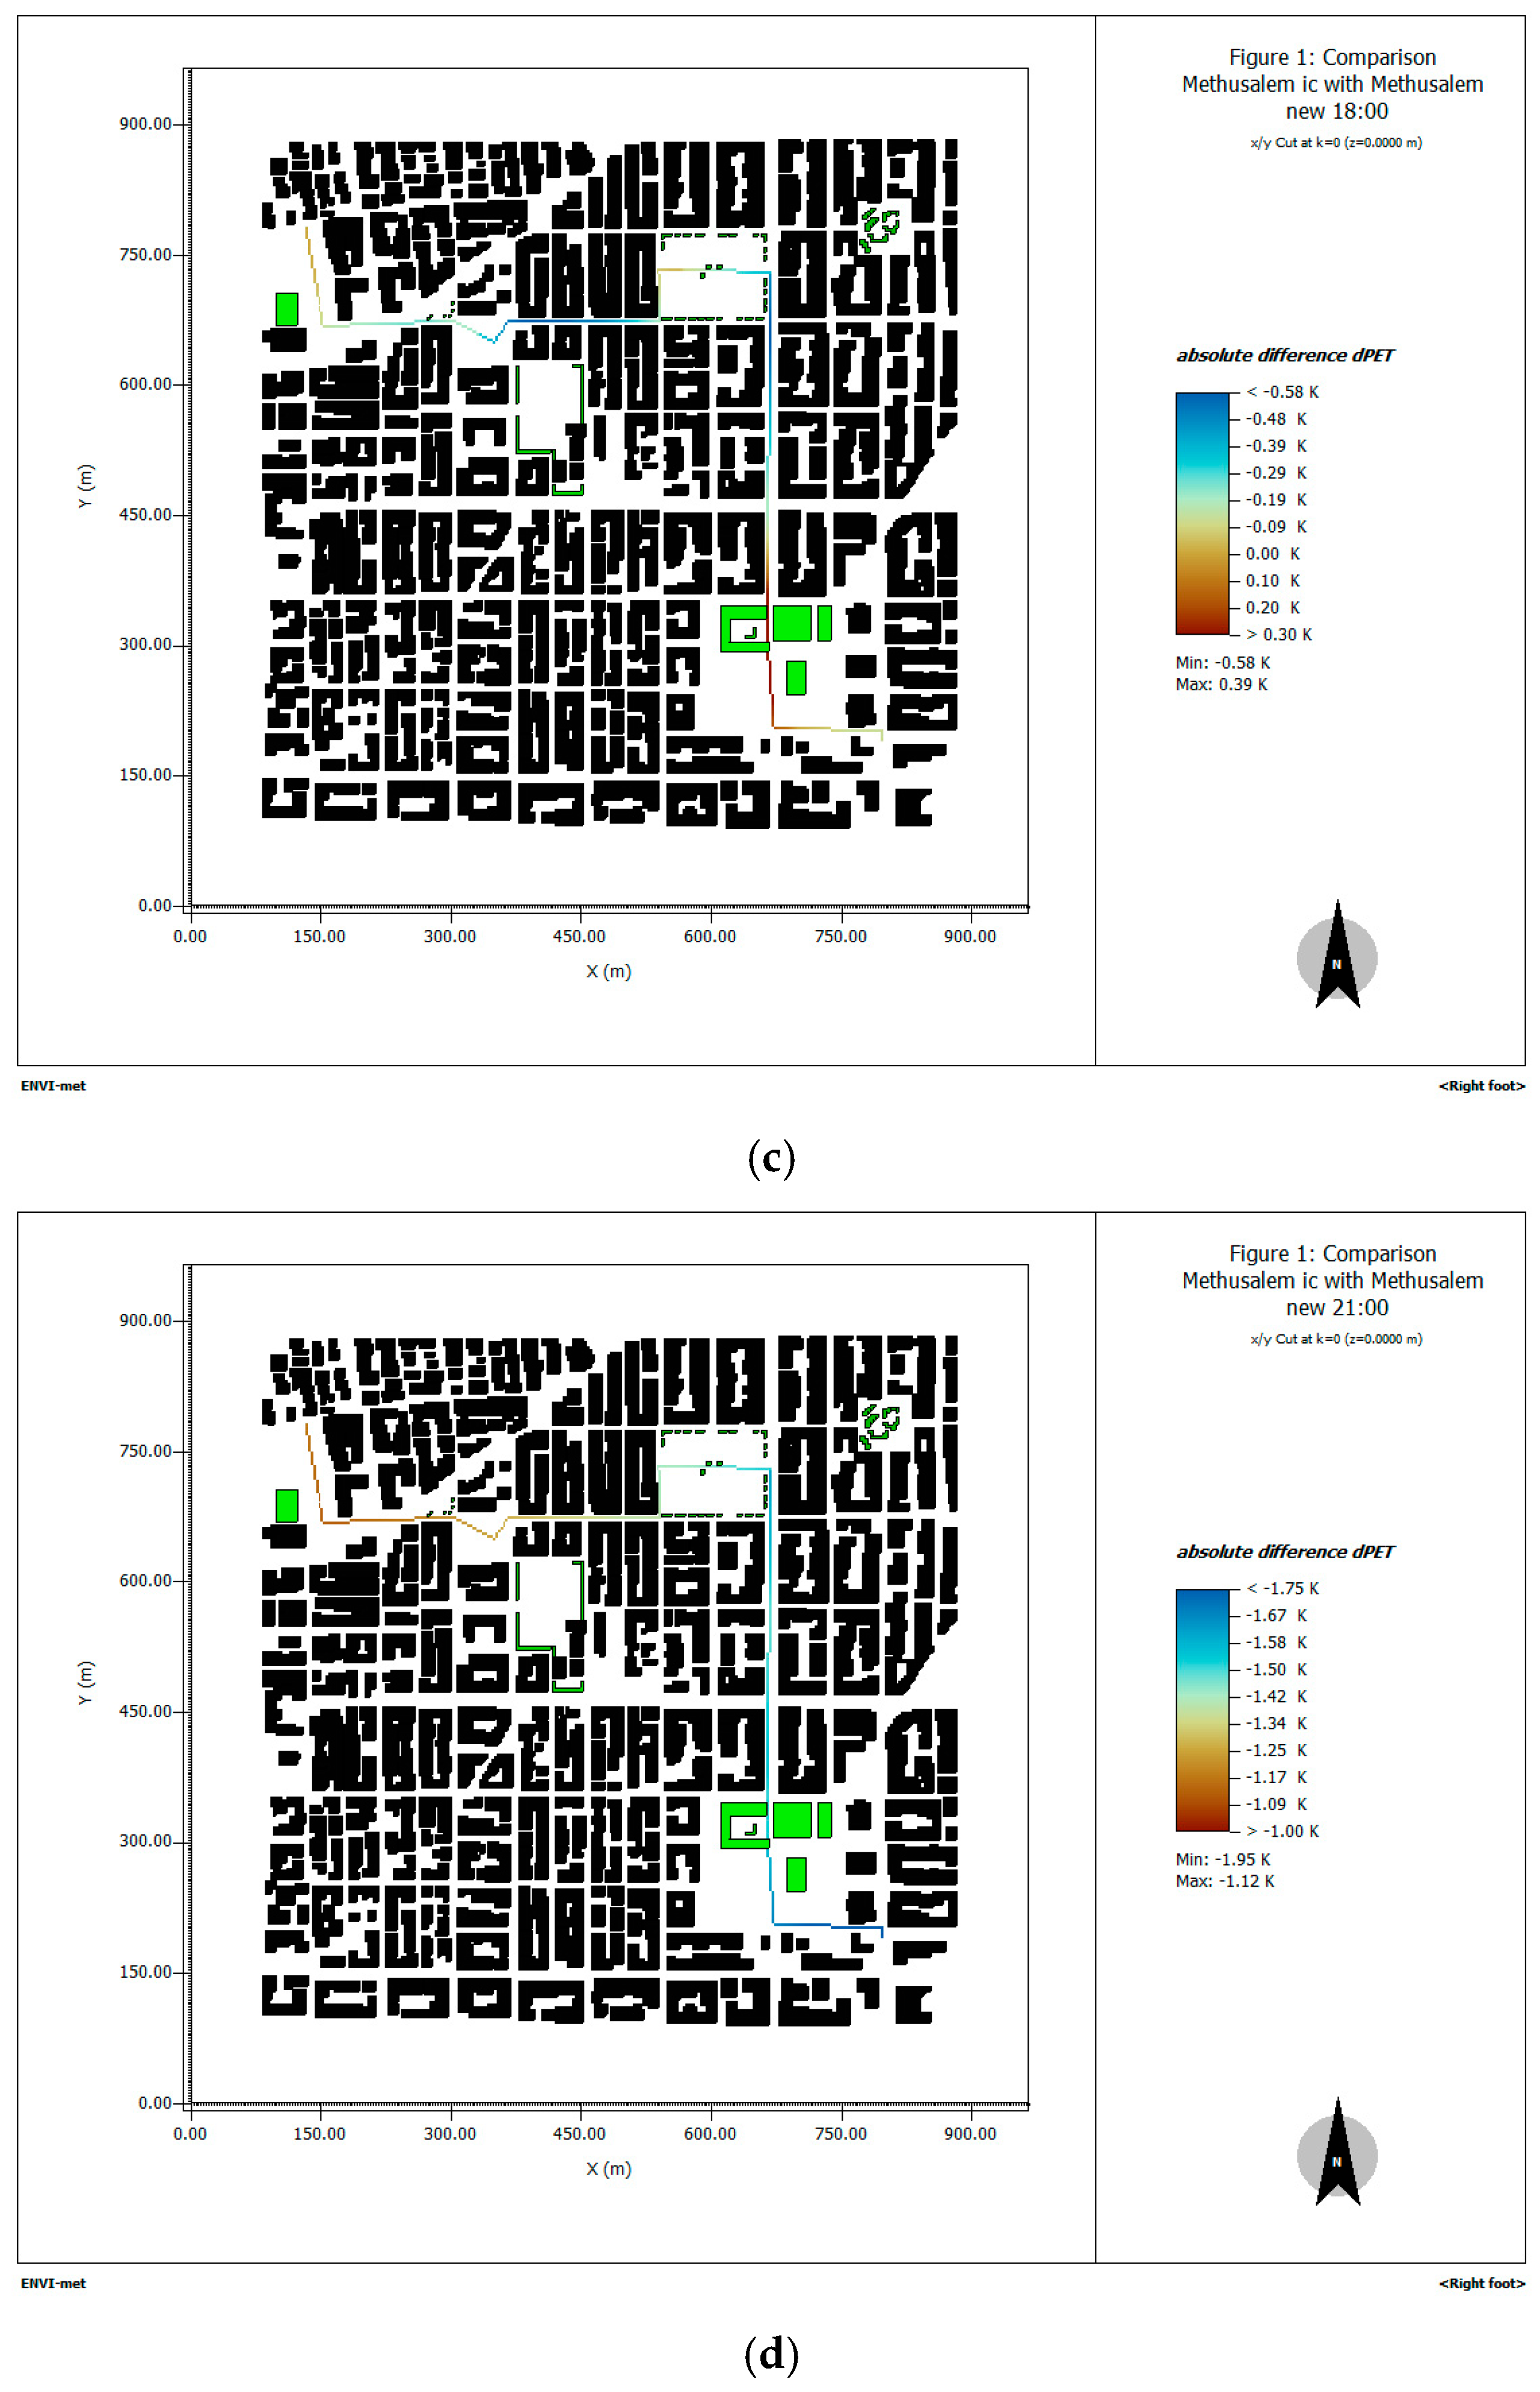
For the elderly individual, dPET increased at 12:00 (Figure 14a), with a more pronounced effect: over 3 °C in squares and approximately 2 °C along the route with interventions. In the afternoon (between 15:00 and 18:00), although the PET reduction was modest (approximately 1 °C), it was mainly observed on primary roads where vegetation and water features were introduced, while slight increases persisted in squares (Figure 14b,c). During the evening hours, dPET decreased along the entire route, ranging from 1.12 to 1.95 °C, with a gradual convergence of values as the pedestrian progresses along the path (Figure 14d).
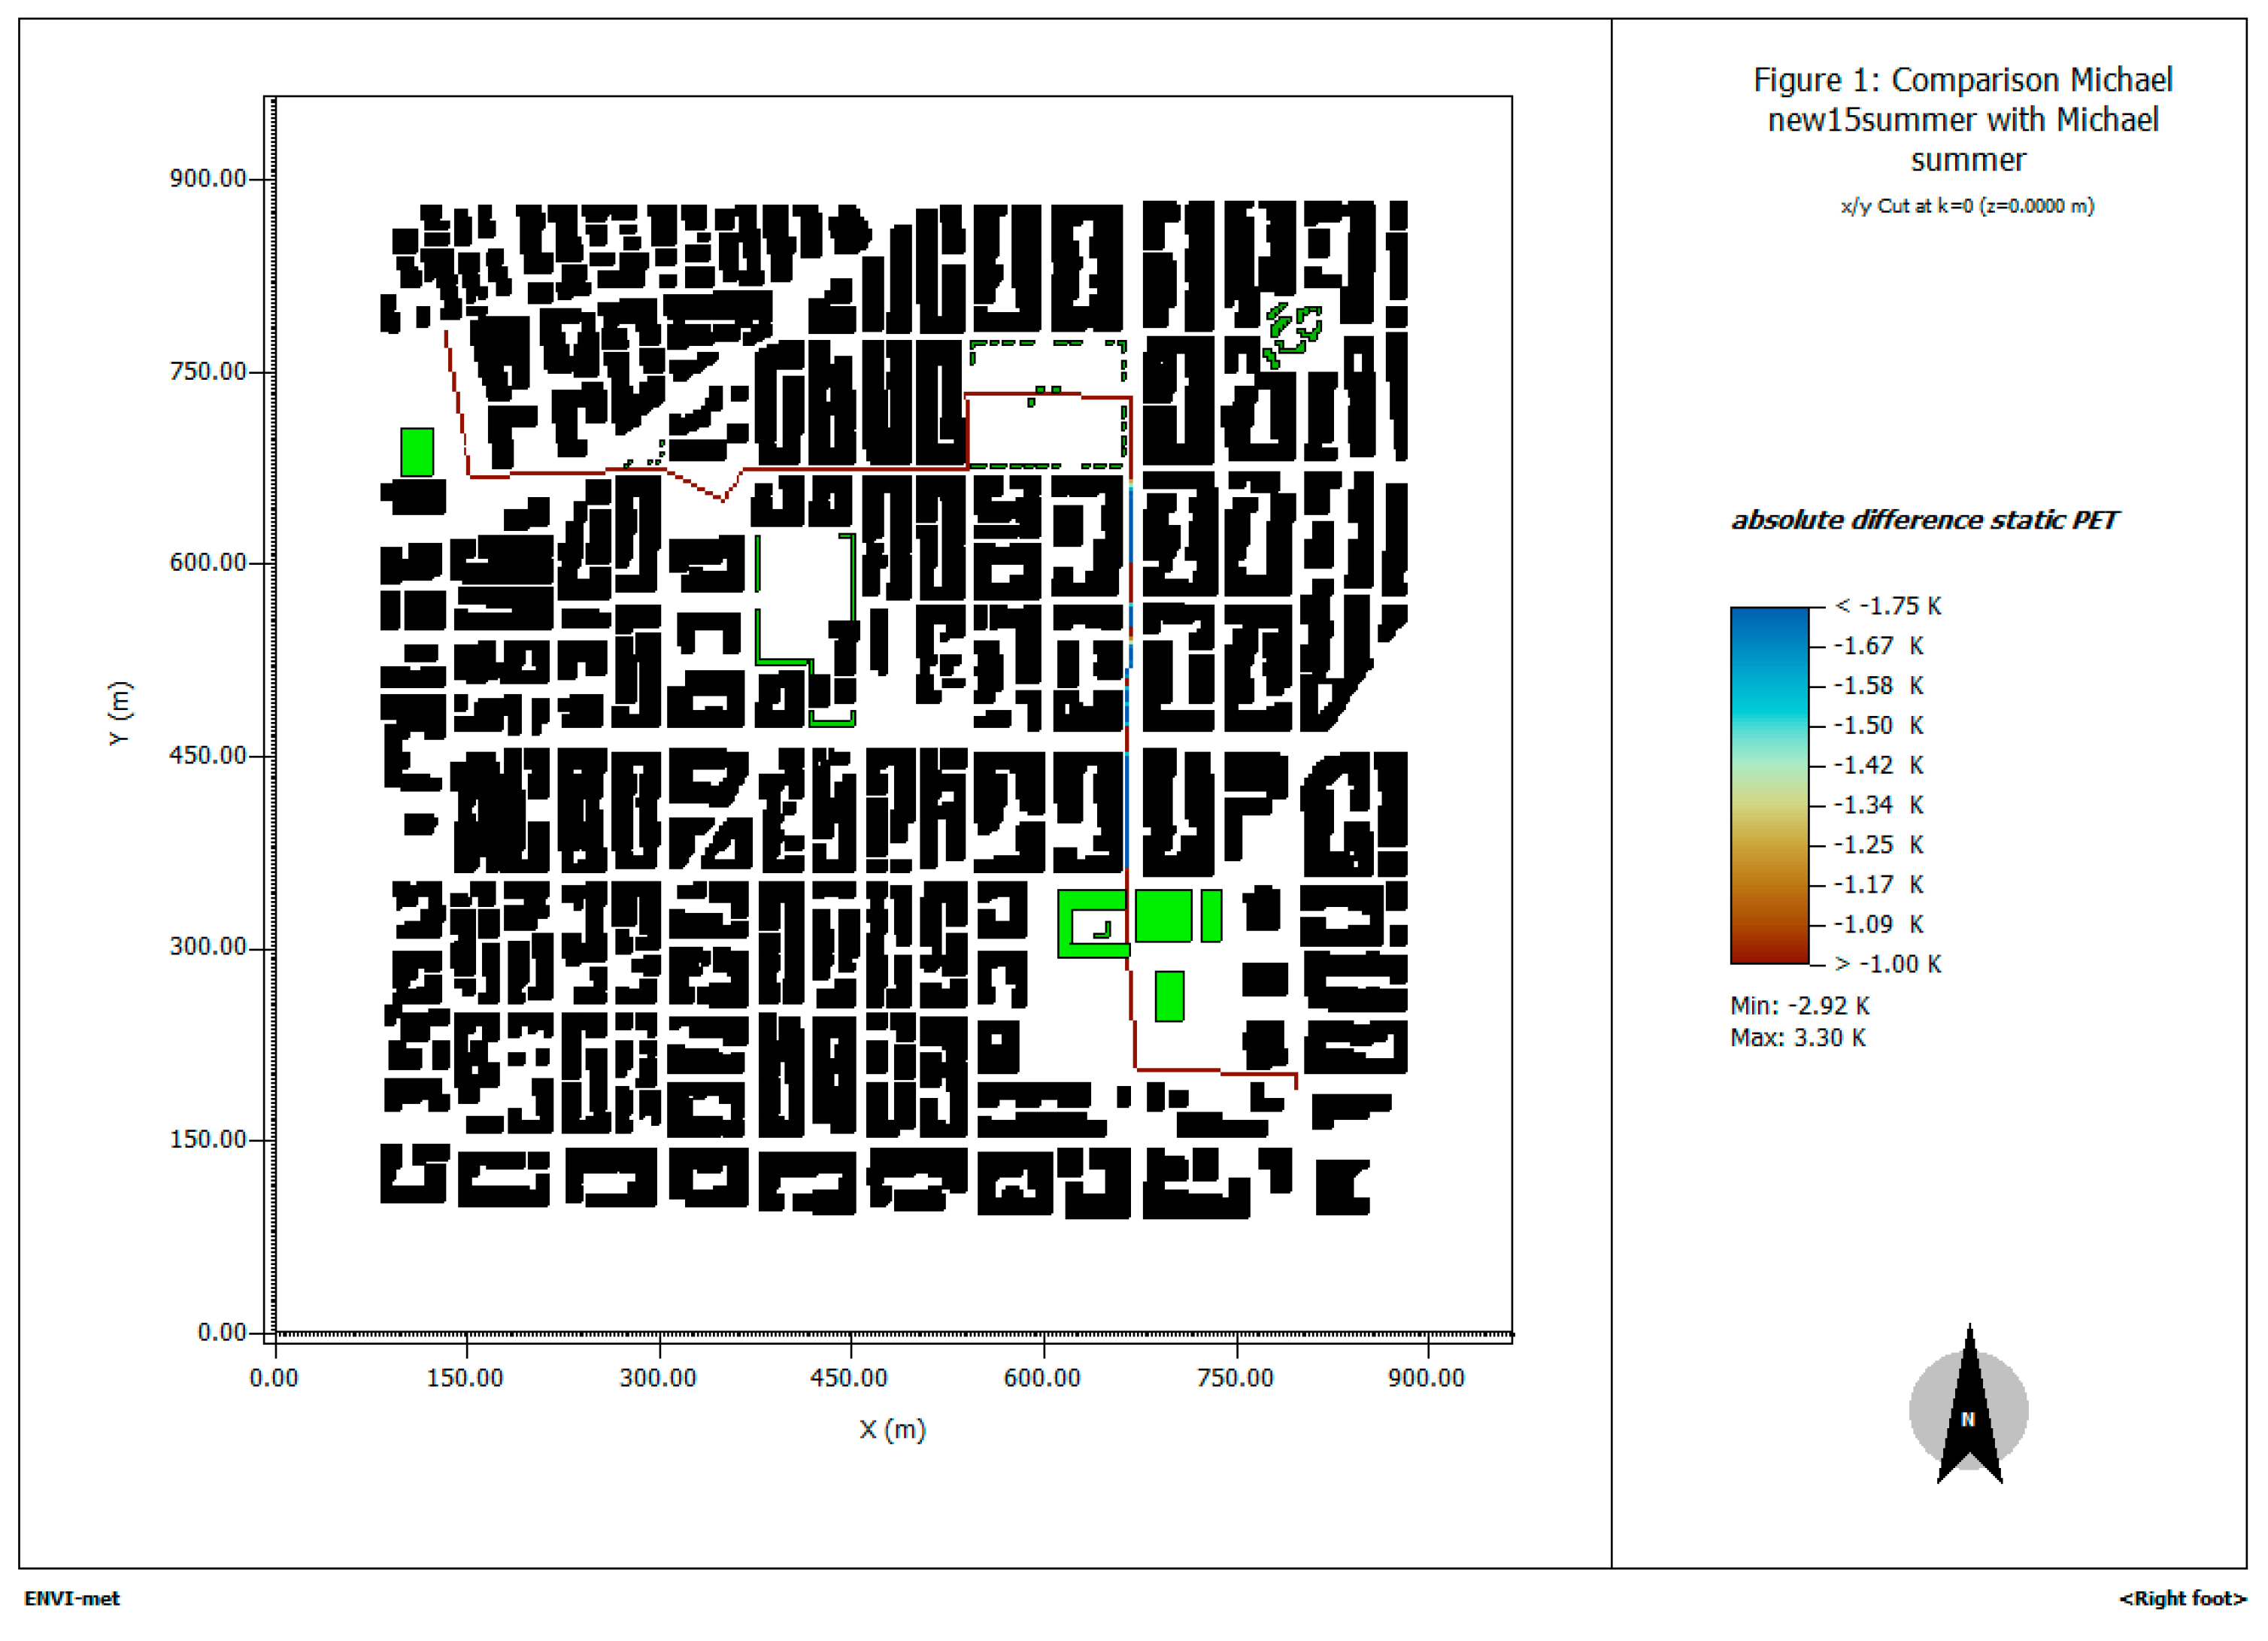
On streets where interventions were applied on both sides, pronounced spatial differentiation in static PET values was observed at locations where the route intersects with untreated streets, unimproved squares, or areas lacking tall buildings, compared to segments where interventions were implemented (Figure 15).
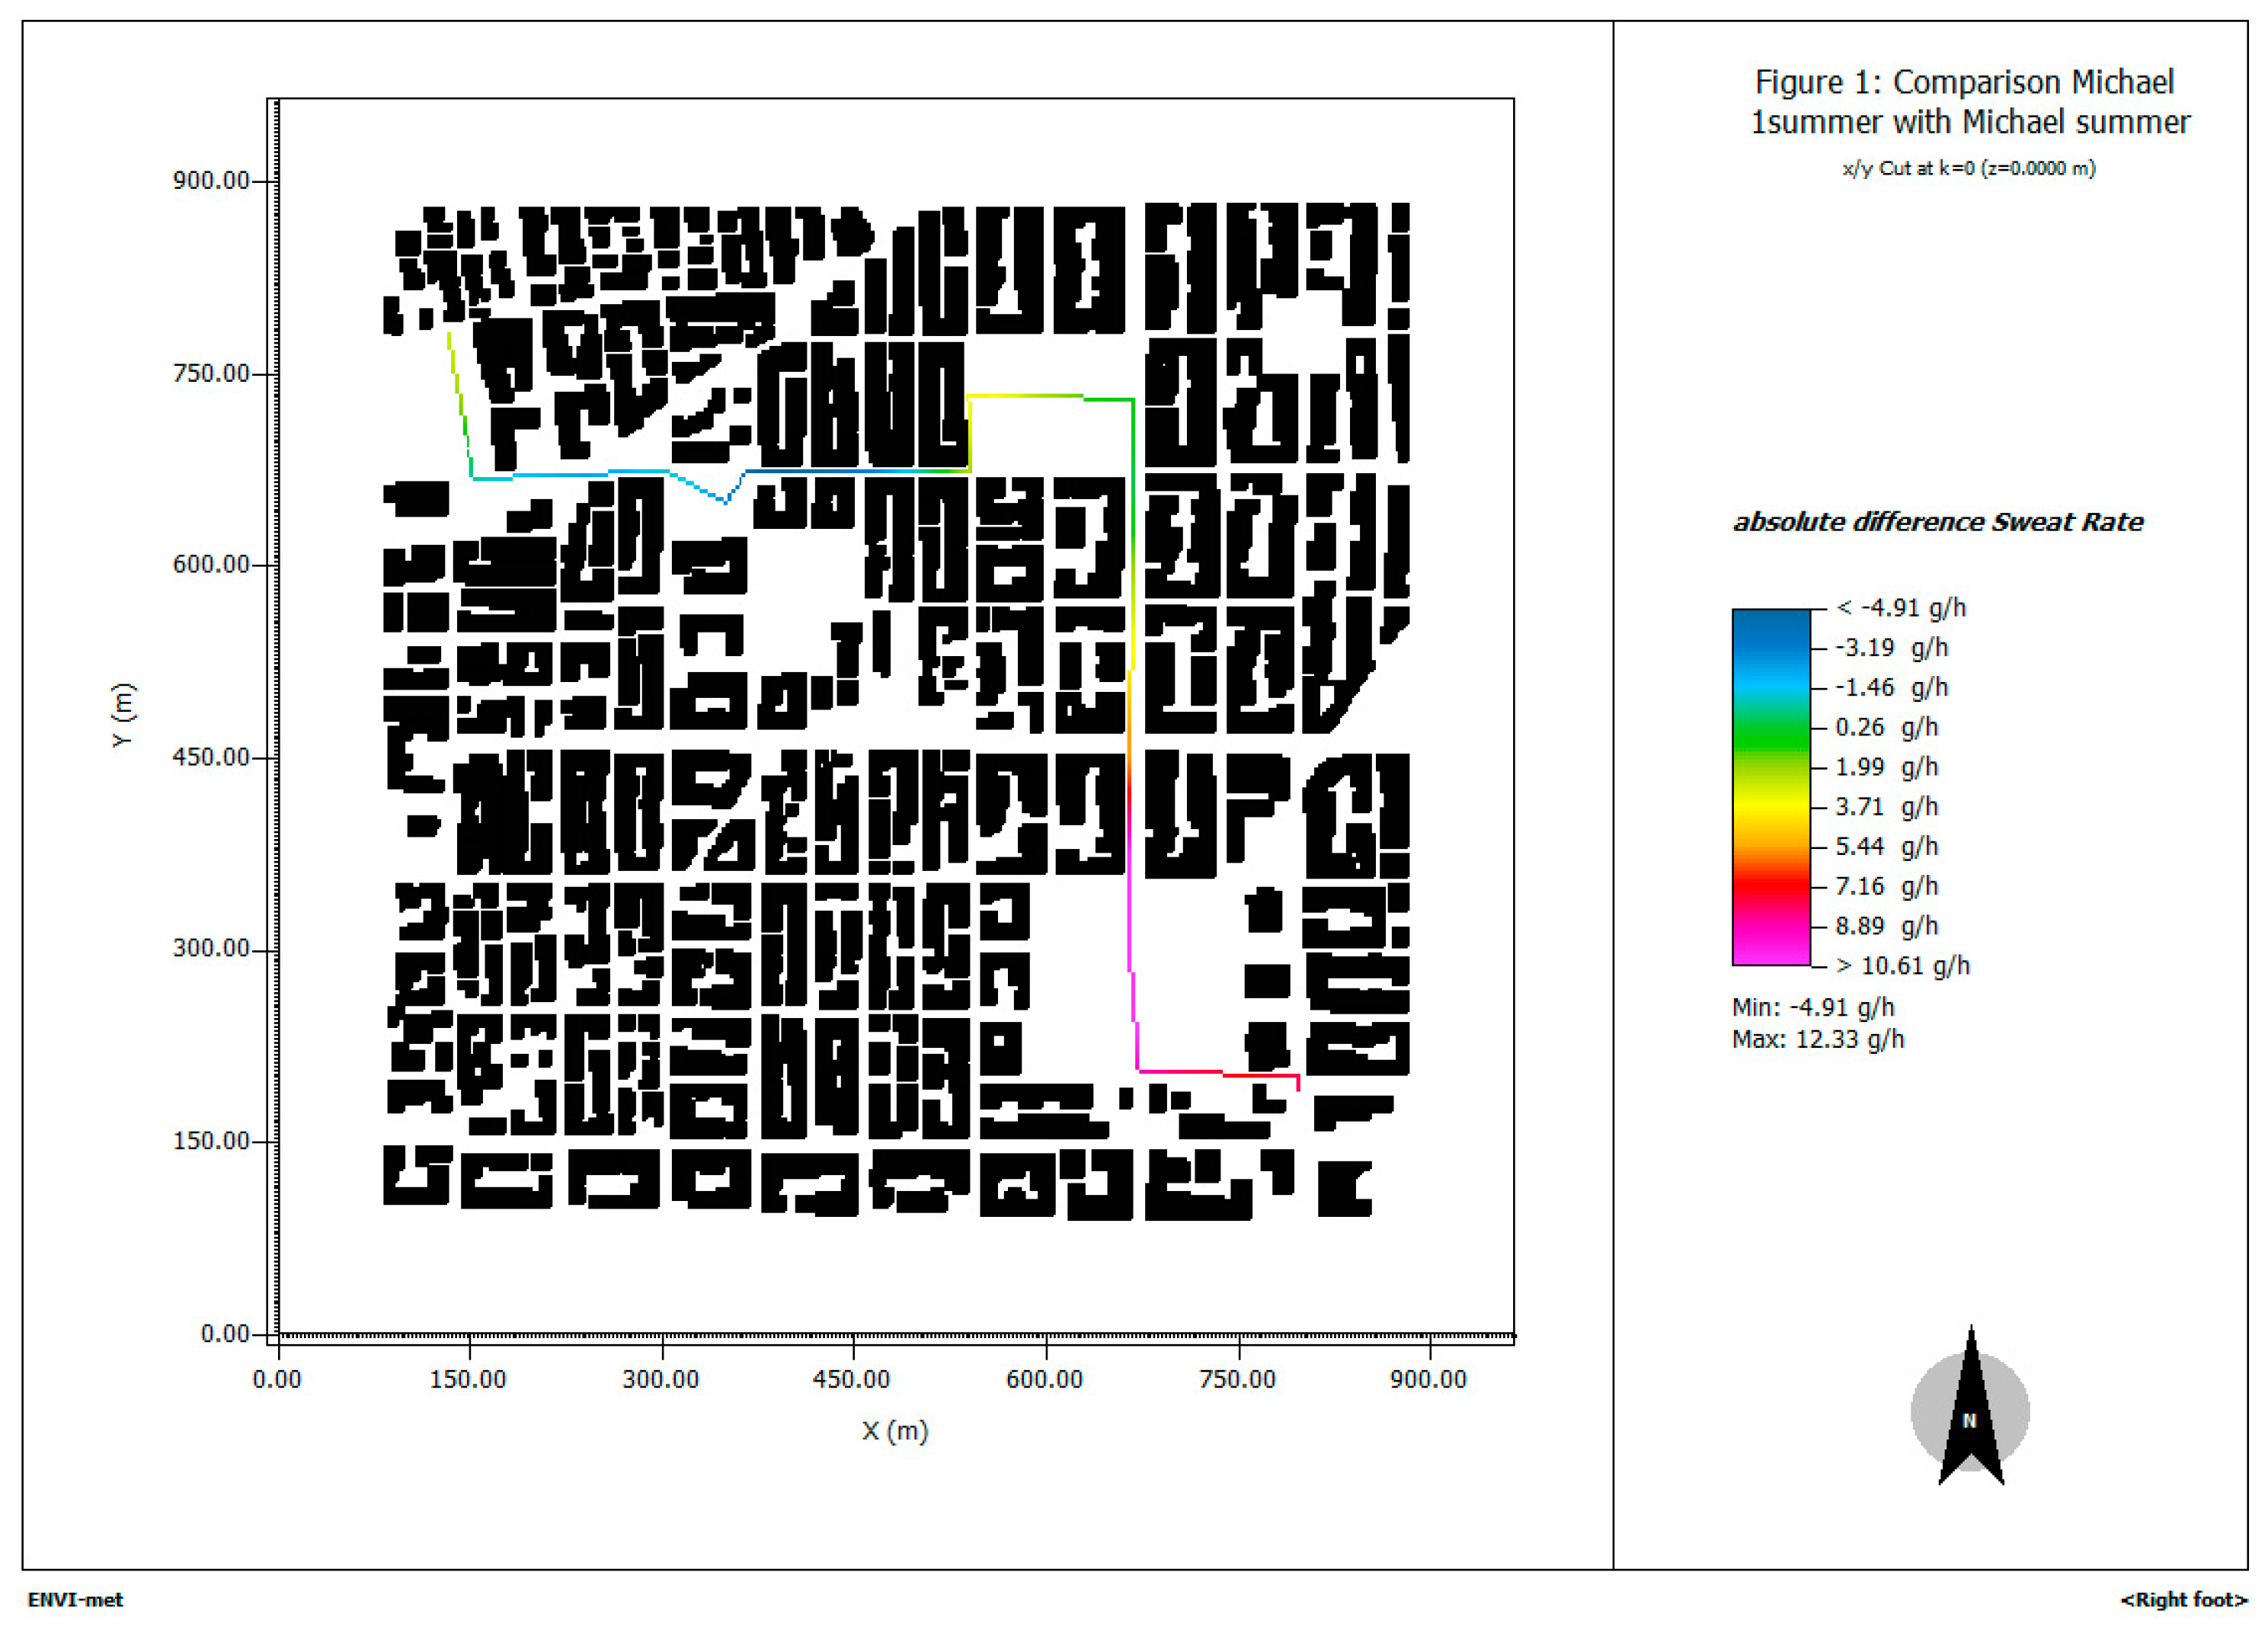
Additionally, sweat rate decreases approximately halfway along the route, indicating a gradual improvement in thermal comfort conditions as pedestrians move through areas characterized by dense tree cover and the presence of water features (Figure 16).
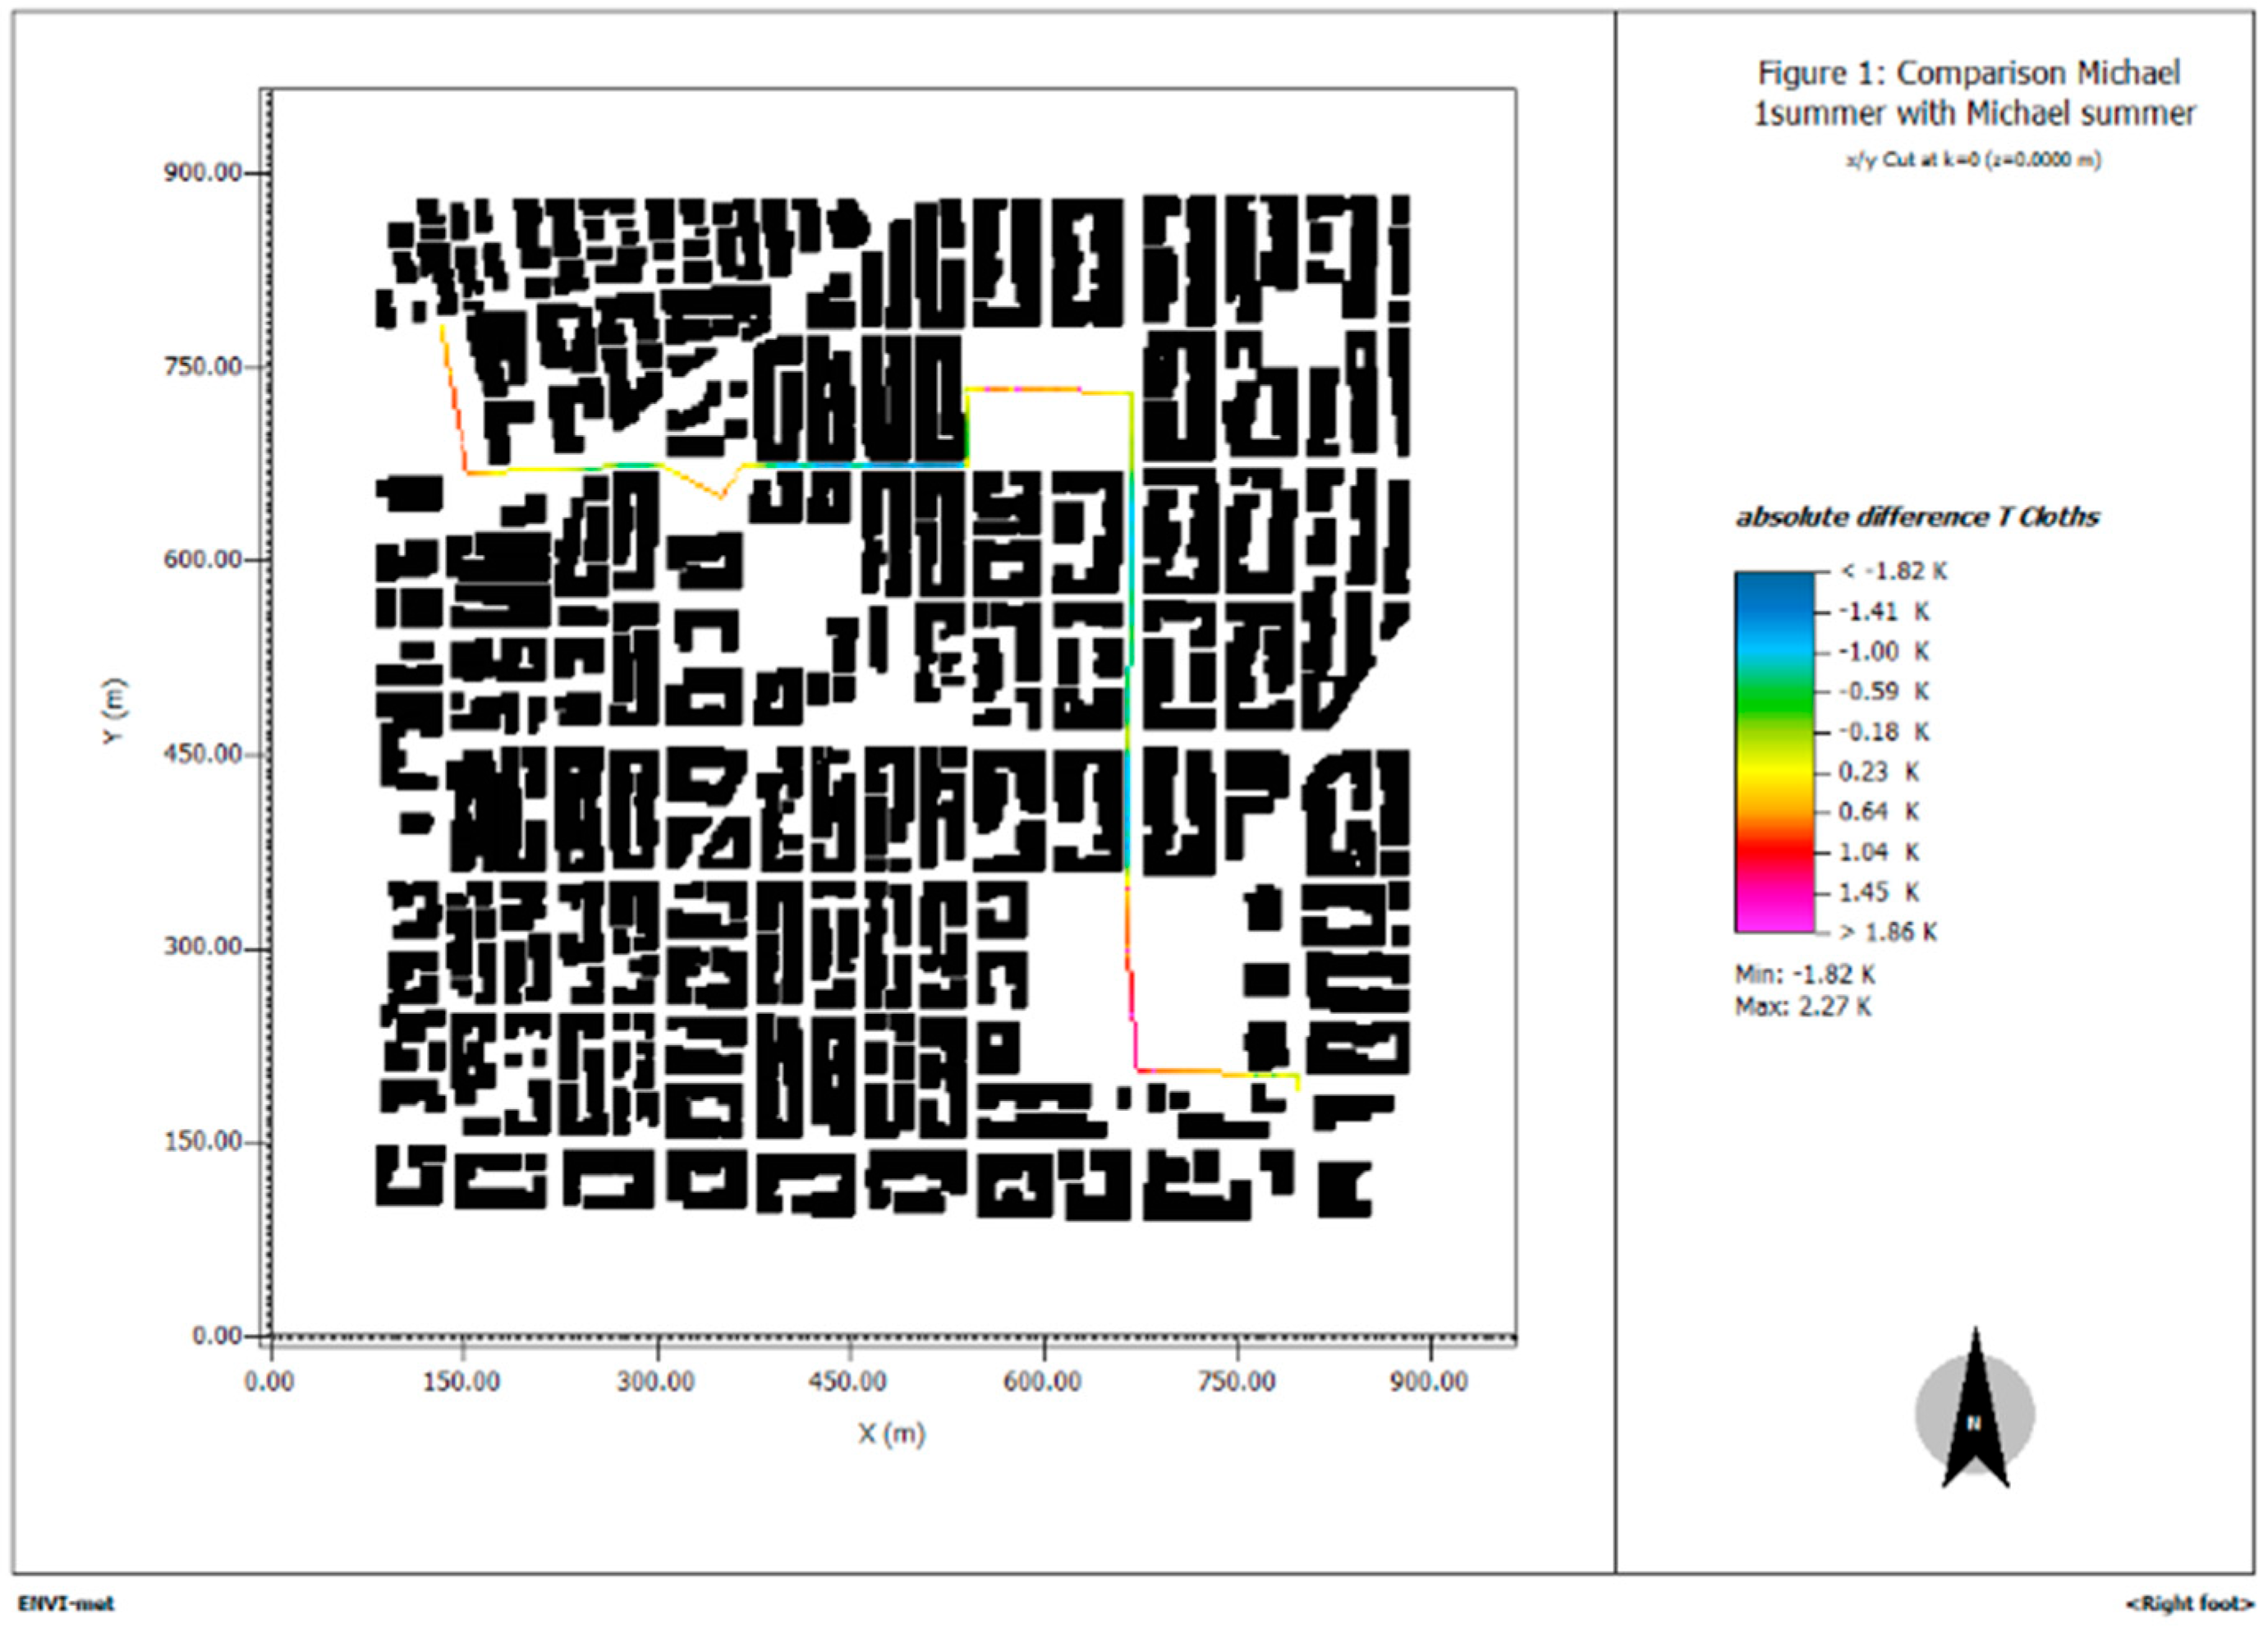
Lastly, the temperature of clothing as calculated by ENVI-met 5.9.0 for the entire duration of the route is equally indicative. In the unchanged parts of the route, the temperature increased, while in the areas where interventions were made, the temperature decreased (Figure 17).

4. Discussion

This study examined the cooling effect potential of integrating individual urban green spaces into a connected network, aiming at improving thermal conditions in public areas. Thermal conditions of an 800 m2 urban area in the city of Athens, Greece, were evaluated for a typical summer day using the environmental model ENVI-met 5.9.0. Under initial conditions, Tair varied between 31.48 °C (at 21:00) and 38.9 °C (at 15:00) throughout the study area, whereas interventions achieved a spatial and temporal decrease of air temperature of up to 6 °C.
For the evaluation of thermal comfort conditions, this study used the PET bioclimatic index. In addition, the newer function of ENVI-met 5.9.0 software, Dynamic Comfort, was utilized for a more accurate assessment of the results. Dynamic Comfort evaluates the Dynamic PET (dPET) index, i.e., the sensation of thermal conditions as perceived by a pedestrian. The design scenario, with the addition of green and blue infrastructure, achieved reductions in the static PET values, varying from 0.3 °C to 5 °C, for the greatest part of the examined area, whereas greater levels of cooling effect (more than 5 °C) were produced mainly in the proximity of buildings and fountains. Although PET values remained high, a significant amelioration of approximately 5 °C was achieved in the pedestrian thermal sensation when walking on the study area’s streets after the redevelopment. Despite the PET reduction, PET values still fall in the range of “strong stress” and “extreme heat stress”. The findings of this study are in line with previous studies, implying that urban areas, characterized by high thermal mass materials, contribute to heat accumulation, intensifying the urban heat island effect [19]. Indeed, ref. [20] evaluated the effectiveness of the proposed design scenarios based on the goal of 15% amelioration of thermal conditions on a warm summer day, a goal suggested by the Greek Ministry of Environment in collaboration with the Centre of Renewable Energy Sources to improve the urban environment in Greek cities (https://cres.gr/, accessed on 20 May 2026). Achieving the targeted 15% improvement in thermal comfort, they pointed out that the areas affected by the fountain and the trees produced lower PET values throughout the day, yet they were above the comfortable levels for most of the hours. In their study, ref. [60] examined the cooling effect efficiency of four scenarios with varying proportions of grass and tree types. The simulation results indicated that scenarios with a higher percentage of trees achieved the greatest reduction in PET, with an average reduction of 7.5 °C; however, PET values remained within the “Extreme Heat Stress” category. The findings of the current study indicate that nature-based solutions, such as increasing urban vegetation, can make a significant contribution to improving thermal conditions in outdoor urban spaces, particularly at the local scale and in the areas where they are implemented. However, the results of this study demonstrate that, despite the recorded reductions in PET values, thermal conditions often remain at uncomfortable levels. This fact highlights the gap between the relative improvement of the microclimate and the achievement of acceptable thermal comfort limits, particularly during extreme heat events. Consequently, creating thermal conditions of actual thermal comfort is a complex and demanding undertaking, which underscores the need for further, more targeted and integrated interventions, as well as future research aimed at achieving greater and more substantial improvements in the urban thermal environment.
Results for the Dynamic PET (dPET) index showed that the proposed redevelopment slightly improved thermal comfort conditions for pedestrians walking on the “green route”. Along the route, the greatest cooling effect was recorded at points where the interventions were combined with shading from buildings. Specifically, during the day, the east–west-oriented streets showed the most significant improvement in thermal comfort (i.e., the greatest reduction in dPET values), due to the synergy between the interventions and the shading provided by the built environment. This finding agrees with the study of ref. [60] who indicated significant reductions of PET values in deep canyons. Similarly, the study of ref. [19] revealed the greatest improvements under the synergetic scenario, which included the combined cooling effect of blue and green infrastructure. In contrast, areas exposed to solar radiation, such as the squares in the study area, showed the smallest improvements (smaller reduction in dPET values). Although the thermal comfort improvements were more pronounced during midday, an increase in PET values was observed mainly in squares, which is consistent with the findings of refs. [19,61]. This finding implies that under conditions of high thermal load, plants tend to close their stomata to limit moisture loss through evaporation, which, in turn, leads to heating the surrounding environment. In particular, ENVI-met 5.9.0 microclimatic simulations involve physiological plant processes, such as stomatal conductance and transpiration, which are influenced by thermal conditions. Under conditions of high heat load and increased vapor pressure deficit, plants limit transpiration by closing their stomata, thereby reducing evaporative cooling. This process may lead to an increase in leaf temperature and a shift in heat flux from latent to sensible, contributing to a local increase in air temperature [20]. This physiological response, combined with reduced air circulation, can locally lead to increased air temperature in areas with dense vegetation. As a result, several studies have recorded neutral or even increased air temperature and PET values following greening interventions, particularly under conditions of high temperatures and low ventilation (e.g., [20,61,62]). Notably, this finding should be taken into consideration when developing intervention strategies. Overall, the results suggest that interventions should prioritize open urban spaces, such as squares, parking lots, and schoolyards, where the lack of shade makes thermal comfort conditions more challenging. Conversely, in areas where shading from buildings is already significant, the contribution of additional interventions may be less decisive.
The analysis of dPET revealed a similar pattern of thermal sensation improvement along the route for both the typical adult male and the elderly population. However, the cooling effect of the interventions is considered overall limited for both age groups. Between the two examined individuals, interventions achieved better results in thermal comfort amelioration for a typical adult male. This finding suggests that the effectiveness of urban design interventions varies depending on population characteristics and, therefore, requires careful and targeted planning. These results agree with the findings of ref. [32] where the elder person experienced higher thermal discomfort compared to children, male and female, as revealed by the PET and dPET values. A key gap in the existing knowledge is the limited focus on assessing thermal perception specifically for the elderly population. Although the reduction in PET values has been extensively studied, few studies have thoroughly investigated how seniors respond to adaptive strategies. Elderly individuals experience reduced sweating efficiency and impaired thermoregulatory capacity, a fact that makes direct shading interventions more effective compared to those based on evaporative cooling [63]. At the same time, the perception of thermal comfort varies, as older adults experience thermal stress at lower PET levels compared to the younger population, making even small improvements in shading particularly critical [64,65]. These findings highlight the critical importance of evaluating the differential influence of elevated air temperatures across different population groups and demonstrate that mitigation and adaptation strategies should be developed to address these variations.
In addition to static PET analysis, this study examined dynamic thermal comfort parameters, including dPET. Compared to static PET, dPET revealed a lighter decrease, ranging from 0.21 °C to 2.10 °C for the adult man and from 0.63 °C to 1.95 °C for the elderly person, with the minimum decrease referring to 15:00 and the maximum to 21:00, in both cases. This finding is contrary to the findings of other studies that have revealed greater dPET reductions. For instance, in the study by [66], scenarios of extensive tree planting in a post-industrial area of Tehran, Iran led to a significant decrease (about 15°C) of the dPET index. On the contrary, Ta (air temperature) reduction was similar to the findings of this study. The study of [22] focused on senior citizens and examined whether nature-based solutions (NbS) could improve thermal conditions during heatwaves in a Mediterranean urban environment. It is worth noting that the NbS used were extensive planting and water features, the main redevelopment tools implemented in the present study. PET results showed improvements of 2 °C to 14 °C for the most critical hours (15:00), and an overall improvement in thermal conditions was noted in the area for all hours. Similarly, favorable results were calculated from Dynamic Comfort analysis (dPET, static PET and energy balance) regarding the improvement of thermal comfort after enhancing urban greening and water features. Ref. [67] studied five diverse areas in Cairo with extreme heat stress conditions. Similar to the present study, they emphasized the benefits of using dynamic thermal comfort indices such as dPET, compared to static PET, among others. In their study, the dPET index was affected greatly by shading and urban trees, while grass or changing materials did not affect pedestrian thermal comfort significantly. The dPET index had a notable decrease of 6 °C as a result of increased tree coverage, or even up to 10 °C in some of the examined cases.
It is important to highlight, however, that contrary to the above-mentioned studies that examined the thermal conditions in small-scale individual open urban spaces (i.e., squares), this study evaluated the amelioration of thermal conditions in an entire urban area (800 m2). Given the fact that interventions lead to greater thermal condition improvement locally, i.e., under the tree canopy [20], significant thermal condition amelioration is quite challenging to achieve in a large area, such as the study area. In addition, the examined urban area of the current study consists of a large portion of open, unshaded areas along the regenerative route, which is likely to affect the dPET values. In contrast, the study area of [22] is located mainly within the built environment, and thus, is affected by the building shading. In line with the findings of our study, the study of ref. [68], which investigated residential neighborhoods in Tehran, Iran, revealed similar dPET reductions to the current study. According to the authors of the article, the tree coverage of the study area accounts for only 5% of the site, leaving a large portion of unshaded areas. More specifically, focusing on children and the elderly, dPET was reduced by up to 2 °C at noon. The limited reductions observed in the dPET index indicate that pedestrian thermal comfort in dense urban areas is shaped by cumulative spatial exposure rather than isolated local interventions, reinforcing the importance of continuity along movement routes [67,69]. Thus, the sheer volume of extreme ambient thermal radiation likely overwhelmed the localized cooling effects of the mild 3 m intervention strips. Since the dPET index is a relatively new tool in ENVI-met 5.9.0, further research is required for its systematic application and evaluation. Expanding its use across different urban environments will allow for the derivation of more reliable and comparable conclusions regarding changes in its values, thereby contributing to the development of more targeted and effective urban planning interventions.

5. Conclusions

5.1. Effects on Thermal Conditions After the Regeneration of the Study Area

Interventions selected for the “green route” in the studied area appear to achieve a promising reduction in thermal stress of pedestrians based on the PET and dPET index, with corresponding improvement in thermal comfort. In both cases, despite the PET and dPET reduction, PET values still fall in the range of strong to extreme heat stress. More specifically, the addition of green and blue infrastructure leads to a reduction in the static PET values. Although PET values remained in the extreme heat stress category (PET > 41 °C) after the redevelopment, a significant amelioration of up to 5 °C reduction in the pedestrian thermal sensation when walking on the study area’s streets was achieved. Results for the Dynamic PET index showed that the proposed redevelopment improved thermal comfort conditions for pedestrians walking on the “green route”. The greater levels of cooling effect were produced mainly in the proximity of buildings and fountains. The thermal comfort improvements were more pronounced during midday, although during the same time period, the physiological response of plants to protect their tissues against extreme heat locally produced increased air temperature in areas with dense vegetation. Notably, this finding should be taken into consideration when developing intervention strategies. Between the two examined individuals, interventions achieved better results in thermal comfort amelioration for a typical adult male. The elderly population revealed a more burdened thermal conditions profile under the current layout of the study area, and a lighter decrease in the PET values was achieved compared to the typical male adult.

5.2. Planning Implications

The findings suggest that connecting open spaces into green networks can operate as a strategic planning principle rather than as a set of isolated microclimatic interventions. In dense Mediterranean cities, where large-scale transformations are constrained, connectivity-based approaches allow for gradual improvements in public space quality and resilience [29,69]. Based on the results of this study, it appears that in Mediterranean cities with hot summers, shading plays a decisive role in improving thermal conditions. In open areas not affected by the shade of neighboring buildings, it is recommended to increase planting with dense vegetation along pathways to limit exposed, unshaded areas. At the same time, the cooling effect of water features, such as fountains, through evaporation can complement the vegetation, further enhancing the thermal conditions. The proposed interventions aim to comprehensively improve the quality of life in the urban environment. However, their implementation depends to a significant extent on the financial capabilities of the respective municipalities and, therefore, they must be accompanied by a cost–benefit analysis to ensure their sustainability and effectiveness.

5.3. Limitations of the Work

A major limitation of this study is the absence of in-situ weather measurements to directly verify the results of the ENVI-met 5.9.0 simulation. Although the model has been widely used and evaluated in the literature [56,57], the lack of local measurements in this specific study area limits the ability to fully confirm the accuracy of the results. Therefore, the study’s findings should be interpreted with this limitation in mind.
Dynamic Comfort is a relatively new function of the ENVI-met software, for which there is not yet enough literature. As a result, it is difficult to assess the accuracy of the results and the reasons that led to them. In the future, it would be extremely useful to further study why the dPET index may not show a significant decrease and whether this is due either to the way Dynamic Comfort works (calculation at z = 0 among other assumptions) or to the types of interventions that were chosen and the initial conditions of the study area. Conducting such research will provide usable data for both the improvement of the software and the way it is used, giving better and more representative results. The present work aims to strengthen the bibliography on this specific topic, among other things. It is important to investigate why the interventions increased the PET and dPET indices in the morning hours. The results of the interventions were favorable in the afternoon and in the evening hours. Another possibility, which will enhance the reliability of the results of the dPET index, is the connection with an on-site experiment [49] in which people with different physiological characteristics will walk these routes and record how they felt through description or measurements, in accordance with the experiments that have been carried out so far for the functions of the ENVI-met 5.9.0 software.
Furthermore, the research could be extended to cover longer time periods and multiple seasons, as well as to include a more in-depth examination of pedestrians’ experiences across diverse urban microclimates. This could involve different urban contexts, such as coastal pedestrian promenades, large-scale walkways, and pedestrian routes within expansive parking areas [67].
Finally, the research needs to include not only adults with typical characteristics, but also the elderly, children, and other vulnerable groups, as they may respond differently to thermal conditions.

Author Contributions

Conceptualization, A.T.; methodology, A.T.; software, A.M. (Antonia Marketaki), A.M. (Athina Mela), and E.T.; validation, A.T. and A.M. (Antonia Marketaki); formal analysis, A.M. (Antonia Marketaki); investigation, A.M. (Antonia Marketaki); resources, A.M. (Antonia Marketaki), A.M. (Athina Mela) and E.T.; data curation, A.M. (Antonia Marketaki); writing—original draft preparation, A.M. (Antonia Marketaki) and A.T.; writing—review and editing, A.M. (Antonia Marketaki), A.T., E.T., A.M. (Athina Mela) and E.Z.; visualization, A.M. (Antonia Marketaki); supervision, A.T. and E.Z. All authors have read and agreed to the published version of the manuscript.

Funding

This research received no external funding.

Data Availability Statement

The datasets generated and analyzed during this study are not readily available because of the large size of the environmental model output datasets. Requests to access the datasets should be directed to the corresponding author.

Acknowledgments

The authors would like to sincerely thank the University of West Attica for the kind provision of the environmental model used in this study. The support and collaboration of the institution were invaluable to the completion of this research.

Conflicts of Interest

The authors declare no conflicts of interest.

Abbreviations

The following abbreviations are used in this manuscript:
CFDComputational Fluid Dynamic
dPETDynamic Physiological Equivalent Temperature
IcInitial conditions
NbSNature-based Solution
PETPhysiological Equivalent Temperature
UHIUrban Heat Island
UTCIUniversal Thermal Climate Index

References

  1. Zhang, L.; Wang, S.; Zhai, W.; He, Z.; Shi, W.; Li, Y.; Zhao, C. How does Blue-Green Infrastructure affect the urban thermal environment across various functional zones? Urban For. Urban Green. 2025, 105, 128698. [Google Scholar] [CrossRef]
  2. Makropoulou, M. Environmental Urban Planning and Bioclimatic Regeneration of Greek Cities; Urban Planning and Regional Development, Department of Spatial Planning, School of Engineering, University of Thessaly: Volos, Greece, 2016. [Google Scholar] [CrossRef]
  3. Pereira, C.; Flores-Colen, I.; Mendes, M.P. Guidelines to reduce the effects of urban heat in a changing climate: Green infrastructures and design measures. Sustain. Dev. 2024, 32, 57–83. [Google Scholar] [CrossRef]
  4. Joshi, K.; Khan, A.; Anand, P.; Sen, J. Understanding the synergy between heat waves and the built environment: A three-decade systematic review informing policies for mitigating urban heat island in cities. Sustain. Earth Rev. 2024, 7, 25. [Google Scholar] [CrossRef]
  5. Tseliou, A.; Zervas, E. Review of the effect of air temperature on human mortality. In E3S Web of Conferences; EDP Sciences: Les Ulis, France, 2024; Volume 585, p. 06001. [Google Scholar]
  6. Chen, Y.; Qin, X. The Impact of Extreme Temperature Shocks on the Health Status of the Elderly in China. Int. J. Environ. Res. Public Health 2022, 19, 15729. [Google Scholar] [CrossRef]
  7. Villaverde, A.; Álvarez, I.; Rojí, E.; Garmendia, L. Categorisation of urban open spaces for heat adaptation: A cluster based approach. Build. Environ. 2024, 263, 111861. [Google Scholar] [CrossRef]
  8. Salata, F.; Golasi, I.; Petitti, D.; de Lieto Vollaro, E.; Coppi, M.; de Lieto Vollaro, A. Relating microclimate, human thermal comfort and health during heat waves: An analysis of heat island mitigation strategies through a case study in an urban outdoor environment. Sustain. Cities Soc. 2017, 30, 79–96. [Google Scholar] [CrossRef]
  9. Koletsis, I.; Tseliou, A.; Lykoudis, S.; Tsiros, I.; Lagouvardos, K.; Psiloglou, B.; Founda, D.; Pantavou, K. Validation of ENVI-met microscale model with in-situ measurements in warm thermal conditions across Athens area. In Proceedings of the CEST2021 Conference, Athens, Greece, 4–6 September 2021. [Google Scholar] [CrossRef]
  10. Liu, F.; Liu, J.; Zhang, Y.; Hong, S.; Fu, W.; Wang, M.; Dong, J. Construction of a cold island network for the urban heat island effect mitigation. Sci. Total Environ. 2024, 915, 169950. [Google Scholar] [CrossRef]
  11. Chu, Z.; Li, S.; Li, T.; Qian, H.; Liu, C.; Yan, Z. Numerical simulation of layout and landscape elements on the thermal environment of urban squares. Ecol. Inform. 2024, 82, 102770. [Google Scholar] [CrossRef]
  12. Abdallah, A.S.H.; Mahmoud, R.M.A. Urban morphology as an adaptation strategy to improve outdoor thermal comfort in urban residential community of new assiut city, Egypt. Sustain. Cities Soc. 2022, 78, 103648. [Google Scholar] [CrossRef]
  13. Gaspari, J.; Fabbri, K.; Lucchi, M. The use of outdoor microclimate analysis to support decision making process: Case study of Bufalini Square in Cesena Italy. Sustain. Cities Soc. 2018, 42, 206–215. [Google Scholar] [CrossRef]
  14. Kotsiris, G.; Kavga, A.; Charalampopoulos, I.; Androutsopoulos, A. The greening of a square in comparison to high albedo tiles replacement—The case of Georgios I square, Patras, Greece. Int. J. Adv. Res. Eng. Technol. 2020, 7, 15105–15116. [Google Scholar]
  15. Gkaidatzi, L.D.; Tseliou, A.; Katsavounidou, G.; Zervas, E. Investigation of the thermal environment in schoolyards under Mediterranean conditions. Contribution to bioclimatic conditions improvement with the application of mild interventions—The case study of a school within the urban environment. In IOP Conference Series: Earth and Environmental Science; IOP Publishing: Bristol, UK, 2022; Volume 1123, p. 012031. [Google Scholar]
  16. Shashua-Bar, L.; Pearlmutter, D.; Erell, E. The cooling efficiency of urban landscape strategies in a hot dry climate. Landsc. Urban Plan. 2009, 92, 179–186. [Google Scholar] [CrossRef]
  17. Nikolopoulou, M.; Lykoudis, S. Thermal comfort in outdoor urban spaces: Analysis across different European countries. Build. Environ. 2006, 41, 1455–1470. [Google Scholar] [CrossRef]
  18. Tsiros, I.X.; Hoffman, M.E. Thermal and comfort conditions in a semi-closed rear wooded garden and its adjacent semi-open spaces in a Mediterranean climate (Athens) during summer. Archit. Sci. Rev. 2014, 57, 63–82. [Google Scholar] [CrossRef]
  19. Chatzidimitriou, A.; Yannas, S. Microclimate design for open spaces: Ranking urban design effects on pedestrian thermal comfort in summer. Sustain. Cities Soc. 2016, 26, 27–47. [Google Scholar] [CrossRef]
  20. Tseliou, A.; Koletsis, I.; Pantavou, K.; Thoma, E.; Lykoudis, S.; Tsiros, I.X. Evaluating the effects of different mitigation strategies on the warm thermal environment of an urban square in Athens, Greece. Urban Clim. 2022, 44, 101217. [Google Scholar] [CrossRef]
  21. Tsoka, S.; Tsikaloudaki, K.; Theodosiou, T.; Bikas, D. Urban Warming and Cities’ Microclimates: Investigation Methods and Mitigation Strategies—A Review. Energies 2020, 13, 1414. [Google Scholar] [CrossRef]
  22. Tousi, E.; Mela, A.; Tseliou, A. Nature-Based Urbanism for Enhancing Senior Citizens’ Outdoor Thermal Comfort in High-Density Mediterranean Cities: ENVI-met 5.9.0 Findings. Urban Sci. 2025, 9, 152. [Google Scholar] [CrossRef]
  23. Karaiskaki, R.; Tseliou, A.; Tousi, E.; Mela, A.; Zervas, E. Evaluating the microclimate impact of extensive green roofs on school buildings in Mediterranean environments: A case study in Athens, Greece. In E3S Web of Conferences; EDP Sciences: Les Ulis, France, 2025; Volume 669, p. 03005. [Google Scholar]
  24. Gkentsidis, A.; Chatzidimitriou, A.; Tellios, A. The Influence of Pocket Parks on Microclimate Conditions and Pedestrian Comfort in Urban Neighborhoods. Mod. Environ. Sci. Eng. 2021, 7, 554–561. [Google Scholar]
  25. Ibric, A.; Bostenaru Dan, M.; Crăciun, C. Adapting Street Profile Design by Using Nature-Based Solutions in New Neighbourhoods and the Retrofit of Buildings. Buildings 2024, 14, 1920. [Google Scholar] [CrossRef]
  26. Inturri, G.; Ignaccolo, M. The Role of Transport in Mitigation and Adaptation to Climate Change Impacts in Urban Areas. In Resilient Cities; Springer: Berlin/Heidelberg, Germany, 2011. [Google Scholar]
  27. De Quadros, B.M.; Mizgier, M.G.O. Urban green infrastructures to improve pedestrian thermal comfort: A systematic review. Urban For. Urban Green. 2023, 88, 128091. [Google Scholar] [CrossRef]
  28. Kim, Y.; Yeo, H.; Lim, L. Sustainable, walkable cities for the elderly: Identification of the built environment for walkability by activity purpose. Sustain. Cities Soc. 2024, 100, 105004. [Google Scholar] [CrossRef]
  29. Carmona, M. Place Value: Place Quality and Its Impact on Health, Social, Economic and Environmental Outcomes. J. Urban Des. 2019, 24, 1–48. [Google Scholar] [CrossRef]
  30. Gehl, J. Life Between Buildings: Using Public Space, 6th ed.; Island Press: Washington, DC, USA, 2011. [Google Scholar]
  31. Mela, A.; Tousi, E.; Varelidis, G. Assessing Urban Public Space Quality: A Short Questionnaire Approach. Urban Sci. 2025, 9, 56. [Google Scholar] [CrossRef]
  32. Tousi, E.; Mela, A. Supralocal Role of Medium to Large Scale Urban Parks, in Greater Athens Region in Greece. Issues of Meso Car Dependence During the COVID-19 Pandemic. J. Sustain. Archit. Civ. Eng. 2024, 35, 201–215. [Google Scholar] [CrossRef]
  33. Martincigh, L. Urban quality and design for pedestrians. In A City for Pedestrians: Policy Making and Implementation; Fleury, D., Ed.; Final Report COST Action C6; Office for Official Publications of the European Communities: Luxembourg, 2002. [Google Scholar]
  34. Martincigh, L. A green-network. The integration of the green structure and the non motorized transport modes network. In COST Action C11—Greenstructure and Urban Planning; EU Publications Office: Luxembourg, 2005. [Google Scholar]
  35. Ali-Toudert, F.; Djenane, M.; Bensalem, R.; Mayer, H. Outdoor thermal comfort in the old desert city of Beni-Isguen, Algeria. Clim. Res. 2005, 28, 243–256. [Google Scholar] [CrossRef]
  36. Ali-Toudert, F.; Mayer, H. Thermal comfort in an east–west oriented street canyon in Freiburg (Germany) under hot summer conditions. Theor. Appl. Climatol. 2007, 87, 223–237. [Google Scholar] [CrossRef]
  37. Vasilikou, C.; Nikolopoulou, M. Outdoor thermal comfort for pedestrians in movement: Thermal walks in complex urban morphology. Int. J. Biometeorol. 2024, 64, 277–291. [Google Scholar] [CrossRef]
  38. Gallacher, C.; Boehnke, D. Pedestrian thermal comfort mapping for evidence-based urban planning; an interdisciplinary and user-friendly mobile approach for the case study of Dresden, Germany. Int. J. Biometeorol. 2025, 69, 2895–2912. [Google Scholar] [CrossRef]
  39. Caprì, S.; Ignaccolo, M.; Inturri, G.; Le Pira, M. Green walking networks for climate change adaptation. Transp. Res. Part D Transp. Environ. 2016, 45, 84–95. [Google Scholar] [CrossRef]
  40. Tousi, E.; Mela, A.; Tseliou, A. Thermal Stress in Outdoor Spaces During Mediterranean Heatwaves: A PET and UTCI Analysis of Different Demographics. Urban Sci. 2024, 8, 193. [Google Scholar] [CrossRef]
  41. Zacharaki, K.; Tseliou, A.; Rapsomanikis, N.; Zervas, E. Use of new indices for the quantification of climate change based on air temperature variability. In IOP Conference Series: Earth and Environmental Science; IOP Publishing: Bristol, UK, 2022; Volume 1123, p. 012017. [Google Scholar]
  42. Zacharaki, K.; Tseliou, A.; Rapsomanikis, N.; Zervas, E. New temperature indices for the estimation of temperature variability. Application in Athens’s greater area. In IOP Conference Series: Earth and Environmental Science; IOP Publishing: Bristol, UK, 2022; Volume 1123, p. 012018. [Google Scholar]
  43. Lototzis, M.; Papadopoulos, G.K.; Droulia, F.; Tseliou, A.; Tsiros, I.X. A note on the correlation between circular and linear variables with an application to wind direction and air temperature data in a Mediterranean climate. Meteorol. Atmos. Phys. 2018, 130, 259–264. [Google Scholar] [CrossRef]
  44. Dimitriou-Kommata, K.; Rapsomanikis, N.; Kalyvas, T.; Zervas, E. Quantification of atmospheric humidity variability using Fourier transform. In E3S Web of Conferences; EDP Sciences: Les Ulis, France, 2024; Volume 585, p. 02007. [Google Scholar]
  45. Chatzidimitriou, A.E. Evaluation of the Impact of Design Parameters on the Microclimate of Urban Outdoor Spaces and on Comfort Conditions, During the Summer Period in a Mediterranean Climate. Ph.D. Thesis, Aristotle University of Thessaloniki, Thessaloniki, Greece, 2012. [Google Scholar] [CrossRef]
  46. Fessa-Emmanouil, E. 20th Century Athens: Urban Transformation and Architectural Creation After World War II; Melissa Publishing House: Athens, Greece, 2009. [Google Scholar]
  47. Nickayin, S.S.; Tomao, A.; Quaranta, G.; Salvati, L.; Giménez-Morera, A. Going toward resilience? Town planning, peri-urban landscapes, and the expansion of Athens, Greece. Sustainability 2020, 12, 10471. [Google Scholar] [CrossRef]
  48. Kiousopoulos, G.; Tousi, E. Urban Sprawl: The case of Athens. In URBANITY, Theories and Project Designs: New Strategies for Sustainable Developments of Ukrainian Cities, Chapter: From Soil Sailing to Compactness; Aracne Editrice: Rome, Italy, 2017. [Google Scholar]
  49. Sarigiannis, G. Athens 1830–2000: Evolution, Urban Planning, Transport; Symmetria Publications: Athens, Greece, 2000. (In Greek) [Google Scholar]
  50. Maloutas, T.; Spyrellis, S. Vertical social segregation in Athenian apartment buildings. In Athens Social Atlas. Digital Compendium of Texts and Visual Material; Maloutas, T., Spyrellis, S., Eds.; Harokopio University: Kallithea, Greece, 2015. [Google Scholar] [CrossRef]
  51. Chorianopoulos, I.; Tsilimigkas, G.; Koukoulas, S.; Balatsos, T. The shift to competitiveness and a new phase of sprawl in the Mediterranean city: Enterprises guiding growth in Messoghia—Athens. Cities 2014, 39, 133–143. [Google Scholar] [CrossRef]
  52. Skayannis, P.; Kanarelis, T. The squares of Athens: The past and the new planning challenges. In Proceedings of the AESOP 2012 Conference: Planning to Achieve/Planning to Avoid: The Need for New Discourses and Practices in Spatial Development and Planning, Ankara, Turkey, 11–15 July 2012. [Google Scholar]
  53. Beck, H.E.; Zimmermann, N.E.; McVicar, T.R.; Vergopolan, N.; Berg, A.; Wood, E.F. Present and future Köppen-Geiger climate classification maps at 1-km resolution. Sci. Data. 2018, 5, 180214. [Google Scholar] [CrossRef]
  54. Bruse, M.; Fleer, H. Simulating surface–plant–air interactions inside urban environments with a three dimensional numerical model. Environ. Model. Softw. 1998, 13, 373–384. [Google Scholar] [CrossRef]
  55. Yang, L.; Zhang, L.; Stettler, M.E.J.; Sukitpaneenit, M.; Xiao, D.; Van Dam, K.H. Supporting an integrated transportation infrastructure and public space design: A coupled simulation method for evaluating traffic pollution and microclimate. Sustain. Cities Soc. 2020, 52, 101796. [Google Scholar] [CrossRef]
  56. Tsoka, S.; Tsikaloudaki, A.; Theodosiou, T. Analyzing the ENVI-met microclimate model’s performance and assessing cool materials and urban vegetation applications–A review. Sustain. Cities Soc. 2018, 43, 55–76. [Google Scholar] [CrossRef]
  57. Tseliou, A.; Tsiros, I.X. Modeling urban microclimate to ameliorate thermal sensation conditions in outdoor areas in Athens (Greece). Build. Simul. 2016, 9, 251–267. [Google Scholar] [CrossRef]
  58. Saaroni, H.; Bitan, A.; Ben Dor, E.; Feller, N. The mix results concerning the ‘oasis effect’ in a rural settlement in the Negev Desert, Israel. J. Arid Environ. 2004, 58, 234–247. [Google Scholar] [CrossRef]
  59. Gomaa, M.M.; El Menshawy, A.; Nabil, J.; Ragab, A. Investigating the Impact of Various Vegetation Scenarios on Outdoor Thermal Comfort in Low-Density Residential Areas of Hot Arid Regions. Sustainability 2024, 16, 3995. [Google Scholar] [CrossRef]
  60. Matzarakis, A.; Mayer, H.; Iziomon, M.G. Applications of a universal thermal index: Physiological equivalent temperature. Int. J. Biometeorol. 1999, 43, 76–84. [Google Scholar] [CrossRef] [PubMed]
  61. Qin, H.; Zhou, B. Optimizing Vegetation Configurations for Seasonal Thermal Comfort in Campus Courtyards: An ENVI-met Study in Hot Summer and Cold Winter Climates. Plants 2025, 14, 1670. [Google Scholar] [CrossRef] [PubMed]
  62. Shirazi, M.R. Mapping neighbourhood outdoor activities: Space, time, gender and age. J. Urban Des. 2019, 24, 715–737. [Google Scholar] [CrossRef]
  63. Sylliris, N.; Papagiannakis, A.; Vartholomaios, A. Improving the Climate Resilience of Urban Road Networks: A Simulation of Microclimate and Air Quality Interventions in a Typology of Streets in Thessaloniki Historic Centre. Land 2023, 12, 414. [Google Scholar] [CrossRef]
  64. McKenna, Z.J.; Foster, J.; Atkins, W.C.; Belval, L.N.; Watso, J.C.; Jarrard, C.P.; Orth, B.D.; Crandall, C.G. Age alters the thermoregulatory responses to extreme heat exposure with accompanying activities of daily living. J. Appl. Physiol. 2023, 135, 445–455. [Google Scholar] [CrossRef]
  65. Vatani, M.; Kiani, K.; Bemanian, M.; Georgescu, M. Investigating the role of residential configurations in shaping outdoor thermal comfort in hot, arid climates. Int. J. Biometeorol. 2025, 69, 2795–2813. [Google Scholar] [CrossRef]
  66. Abdelmejeed, A.Y.; Gruehn, D. Pedestrian Dynamic Thermal Comfort Analysis to Optimize Using Trees in Various Urban Morphologies: A Case Study of Cairo City. Land 2024, 13, 1489. [Google Scholar] [CrossRef]
  67. Vatani, M.; Kiani, K.; Mahdavinejad, M.; Georgescu, M. Evaluating the effects of different tree species on enhancing outdoor thermal comfort in a post-industrial landscape. Environ. Res. Lett. 2024, 19, 064051. [Google Scholar] [CrossRef]
  68. Nikolopoulou, M.; Steemers, K. Thermal comfort and psychological adaptation as a guide for designing urban spaces. Energy Build. 2003, 35, 95–101. [Google Scholar] [CrossRef]
  69. Aleixo, C.; Branquinho, C.; Laanisto, L.; Tryjanowski, P.; Niinemets, Ü.; Moretti, M.; Samson, R.; Pinho, P. Urban Green Connectivity Assessment: A Comparative Study of Datasets in European Cities. Remote Sens. 2024, 16, 771. [Google Scholar] [CrossRef]
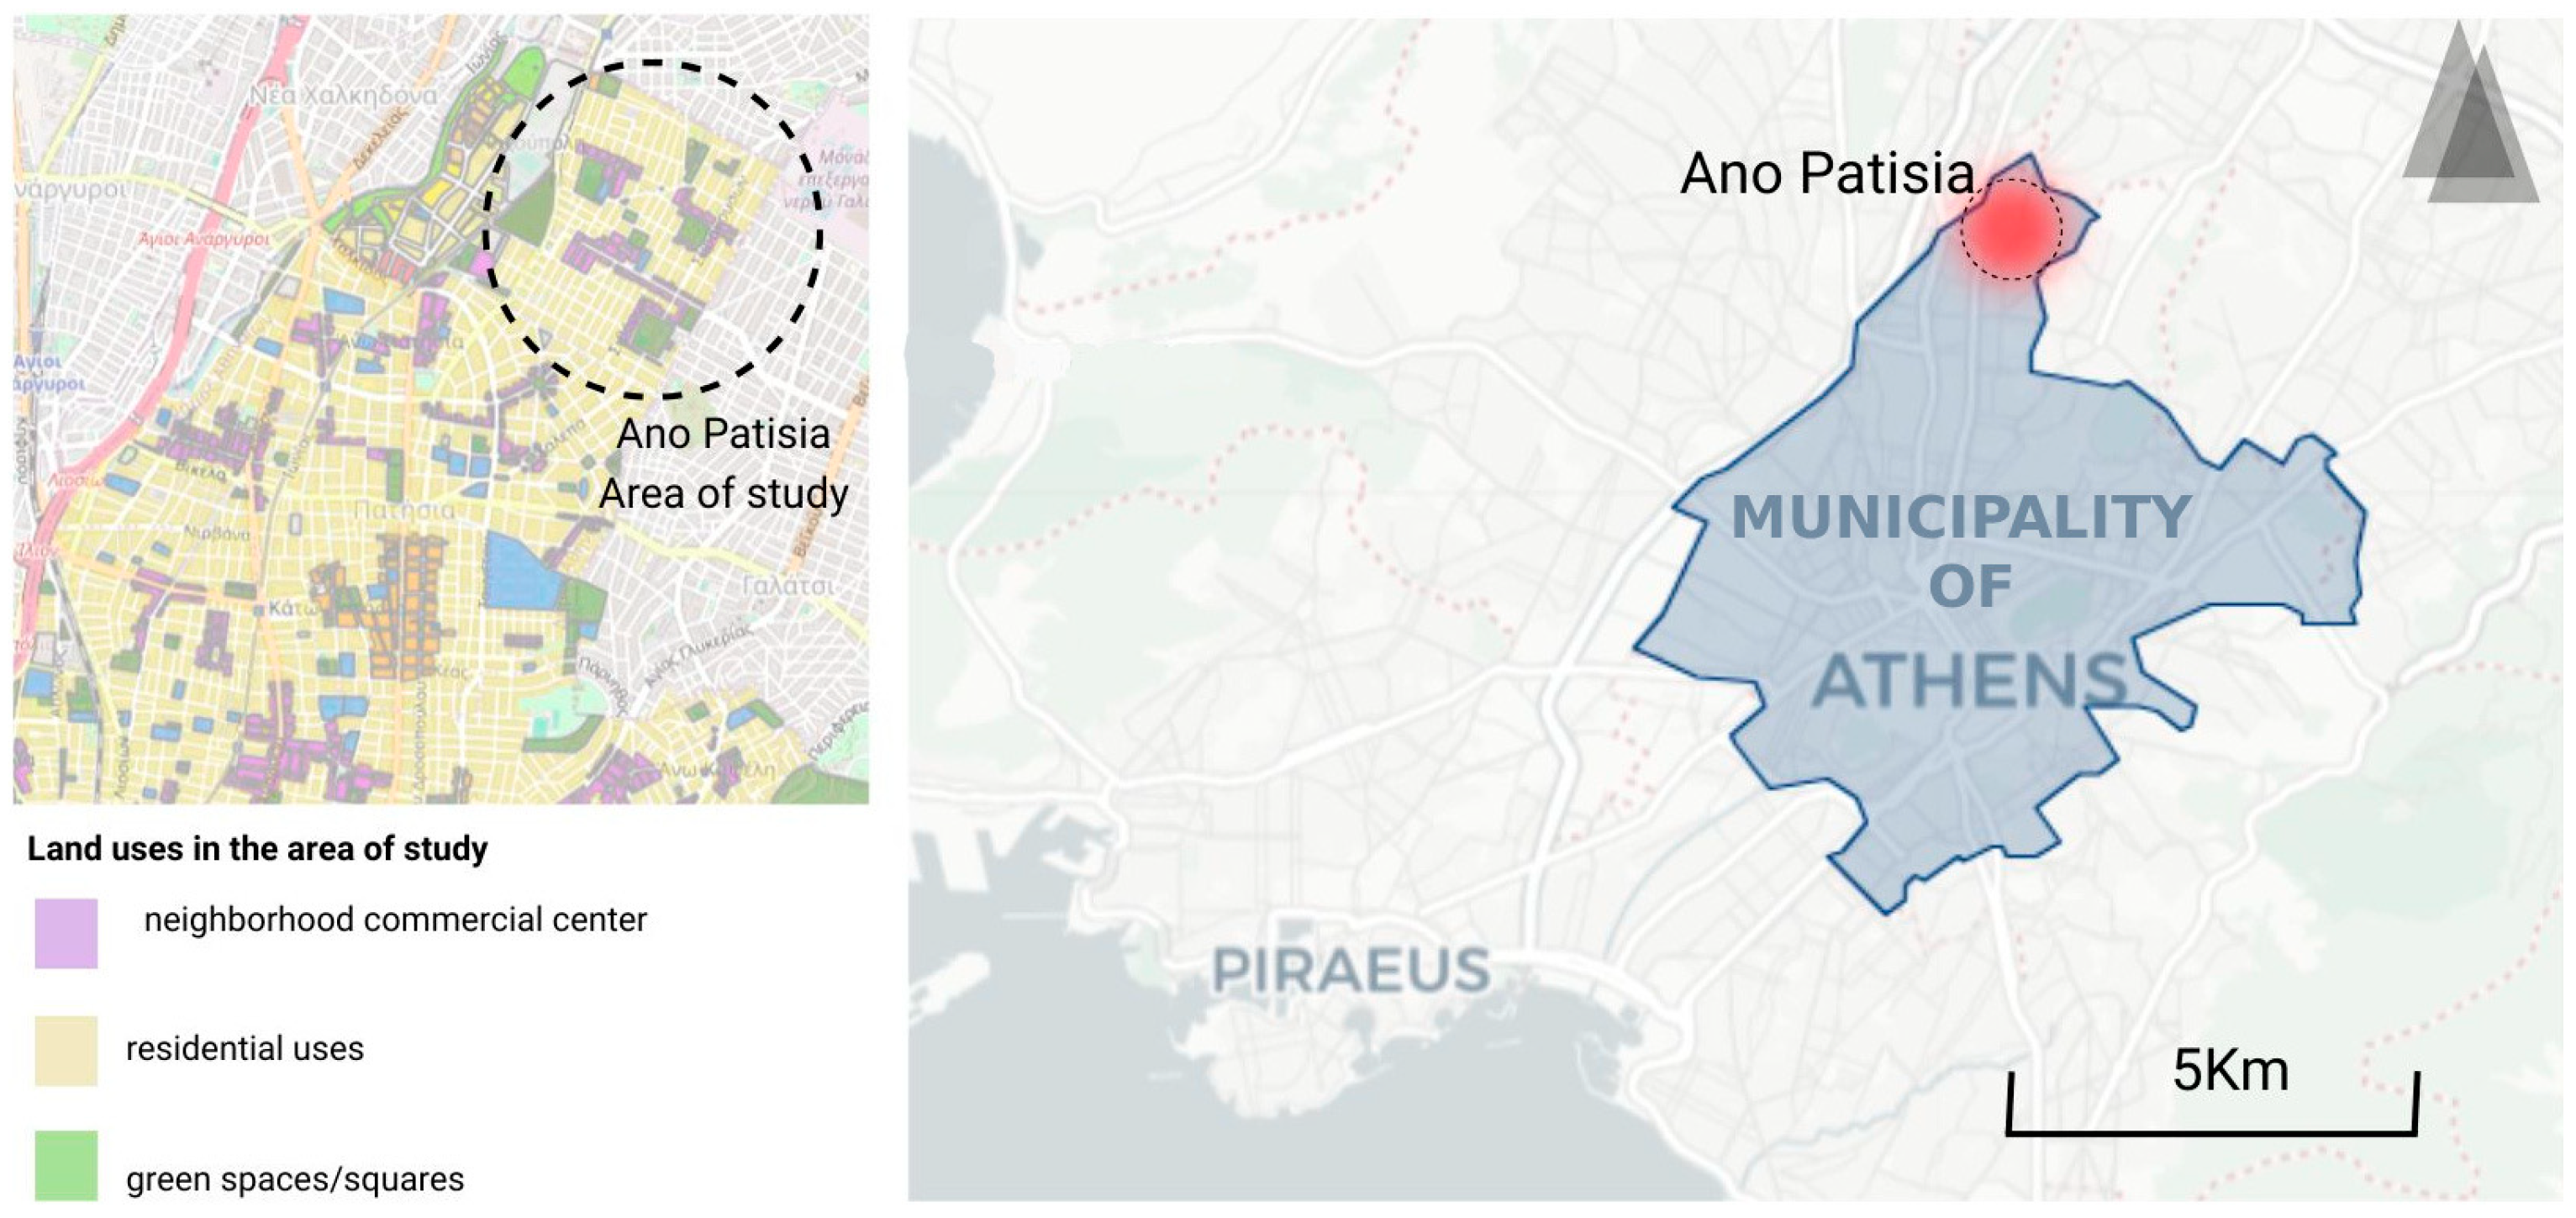
Figure 1. General area of study (Ano patisia) (right) and land uses (left).
Land 15 00908 g001
Figure 2. Simulated area in ENVI-met 5.9.0; Ano Patisia, Athens, Greece [Google Earth].
Land 15 00908 g002
Figure 3. (a) Digitized overview of buildings and vegetation in the study area (author’s own work), (b) Meteorological input data in ENVI-met 5.9.0 guide tool.
Land 15 00908 g003
Figure 4. “Green” redevelopment route, in purple (author’s own work).
Land 15 00908 g004
Figure 5. Digitized overview of the additional vegetation on the selected route (author’s own work).
Land 15 00908 g005
Figure 6. Digitized overview of the redevelopment zones highlighted in red (author’s own work).
Land 15 00908 g006
Figure 7. Air temperature under initial conditions (IC), (a) 12:00, (b) 15:00, (c) 18:00, (d) 21:00. (The figures are directly generated from the ENVI-met 5.9.0 simulation model and represent raw outputs without post-processing or artificial rescaling, in order to preserve their physical consistency. Variations in the color scale may occur among the subfigures).
Land 15 00908 g007aLand 15 00908 g007b
Figure 8. PET index under initial conditions (IC), (a) 12:00, (b) 15:00, (c) 18:00, (d) 21:00—typical male adult in summer clothing. (The figures are directly generated from the ENVI-met 5.9.0 simulation model and represent raw outputs without post-processing or artificial rescaling, in order to preserve their physical consistency. Variations in the color scale may occur among the subfigures).
Land 15 00908 g008aLand 15 00908 g008b
Figure 9. PET index under initial conditions (IC), (a) 12:00, (b) 15:00, (c) 18:00, (d) 21:00—typical elderly male in summer clothing. (The figures are directly generated from the ENVI-met 5.9.0 simulation model and represent raw outputs without post-processing or artificial rescaling, in order to preserve their physical consistency. Variations in the color scale may occur among the subfigures). From all the above, it becomes evident that the study area is particularly thermally burdened under the initial conditions. The suggested adaptation strategies are described in the next section.
Land 15 00908 g009aLand 15 00908 g009b
Figure 10. Comparison of air temperature between initial conditions and regeneration scenario, (a) 12:00, (b) 15:00, (c) 18:00, (d) 21:00. (The figures are directly generated from the ENVI-met 5.9.0 simulation model and represent raw outputs without post-processing or artificial rescaling, in order to preserve their physical consistency. Variations in the color scale may occur among the subfigures).
Land 15 00908 g010aLand 15 00908 g010b
Figure 11. Comparison of PET index between initial conditions and regeneration scenario, (a) 12:00, (b) 15:00, (c) 18:00, (d) 21:00—male adult in summer clothing. (The figures are directly generated from the ENVI-met 5.9.0 simulation model and represent raw outputs without post-processing or artificial rescaling, in order to preserve their physical consistency. Variations in the color scale may occur among the subfigures). For the elderly individual, the interventions lead to slighter-scale reductions in PET, compared to the typical adult male. This finding is of particular interest, as it highlights differences in perceived thermal conditions among various age groups and indicates the need for individualized investigation when planning adaptation and mitigation strategies. More specifically, at 12:00, a slight PET decrease varying between 0.3 and 1.25 °C was estimated in the main part of the study area, whereas some increases in PET values of up to 1.6 °C were also produced, mainly in the unshaded areas (Figure 12a). At 15:00, a small decrease in PET varying from 0.2 to 2.2 °C was estimated across most of the study area, whereas greater reductions were estimated in areas with vegetation and water features, with PET reductions ranging from 2.2 to 3.15 °C (Figure 12b). At 18:00, a slight reduction in PET was produced throughout the study area, ranging from 0.3 to 2.2 °C. However, localized hot spot areas emerged, leading to slight PET increases of up to 1 °C, mainly in unshaded areas. At 21:00, the overall PET reduction varies between 1.2 and 3.0 °C throughout the study area.
Land 15 00908 g011aLand 15 00908 g011b
Figure 12. Comparison of PET index between initial conditions and regeneration scenario, (a) 12:00, (b) 15:00, (c) 18:00, (d) 21:00—elderly person. (The figures are directly generated from the ENVI-met 5.9.0 simulation model and represent raw outputs without post-processing or artificial rescaling, in order to preserve their physical consistency. Variations in the color scale may occur among the subfigures).
Land 15 00908 g012aLand 15 00908 g012b
Figure 13. Comparison of dPET index between initial conditions and regeneration scenario for an adult male at (a) 12:00, (b) 15:00, (c) 18:00, (d) 21:00. (The figures are directly generated from the ENVI-met 5.9.0 simulation model and represent raw outputs without post-processing or artificial rescaling, in order to preserve their physical consistency. Variations in the color scale may occur among the subfigures).
Land 15 00908 g013aLand 15 00908 g013b
Figure 14. Comparison of dPET index between initial conditions and regeneration scenario for an elderly individual at (a) 12:00, (b) 15:00, (c) 18:00, (d) 21:00. (The figures are directly generated from the ENVI-met 5.9.0 simulation model and represent raw outputs without post-processing or artificial rescaling, in order to preserve their physical consistency. Variations in the color scale may occur among the subfigures).
Land 15 00908 g014aLand 15 00908 g014b
Figure 15. Static PET for adult man in summer clothing at 15:00.
Land 15 00908 g015
Figure 16. Sweat rate for an adult male in summer clothing at 15:00.
Land 15 00908 g016
Figure 17. Temperature of clothing for an adult male in summer clothing at 15:00.
Land 15 00908 g017
Table 1. Climatic characteristics of July and the climatic characteristics of July 2024, and the meteorological characteristics of the examined day (8 July 2024).
Climatic Characteristics of July 1Monthly Climatic Characteristics of July 2024 2Meteorological Characteristics of the Examined Day (8 July 2024) 2—(Input Meteorological Data in ENVI-met 5.9.0)
Mean Air Temperature (°C)29.032.332.4
Max Air Temperature (°C)32.036.837.8
Min Air Temperature (°C)23.028.228.0
Average Wind Speed (km/h)1.13.84.8
Dominant Wind Speed direction ENE (East, North-East)ENE (East, North-East)
Average Relative Humidity (%)474545
Source: 1 Hellenic National Meteorological Service, 2 National Observatory of Athens automatic meteorological station data.
Table 2. PET index values for thermal sensation and heat stress levels [60].
PET (°C)Thermal SensationPhysiological Stress Level
<4.0Very coldExtreme cold stress
4.1–8.0ColdStrong cold stress
8.1–13.0CoolModerate cold stress
13.1–18.0Slightly coolSlight cold stress
18.1–23.0ComfortableNo thermal stress
23.1–29.0Slightly warmSlight heat stress
29.1–35.0WarmModerate heat stress
35.1–41.0HotStrong heat stress
>41.1Very hotExtreme heat stress
Table 3. Comparison of the PET assessment for the regeneration scenario and the current conditions on 8 July 2024—typical adult male and elderly individual.
TimeInitialRegeneration Improvement (Reduction in PET Values)Important Notes
Typical Adult MaleElderly IndividualTypical Adult MaleElderly Individual
12:0059.00 °C
(Extreme heat stress)
59.84 °C
(Extreme heat stress)
2.5 to 0.3 °C
(Extreme heat stress)
1.25 to 0.3 °C
(Extreme heat stress)
A greater level of thermal sensation improvement is produced for a typical adult male compared to an elderly individual.
The largest PET decrease (>5.0 °C) produced near buildings due to shading and the fountains due to evaporating cooling.
15:0059.80 °C
(Extreme heat stress)
60.63 °C
(Extreme heat stress)
5.0 to 2.0 °C
(Extreme heat stress)
2.2 to 0.2 °C
(Extreme heat stress)
PET reduction is more intense compared to that of 12:00 for both individuals; however, there a greater level of thermal sensation improvement is produced for a typical adult male compared to an elderly individual.
The largest PET decrease (>5.0 °C) produced near buildings due to shading and the fountains due to evaporating cooling.
18:0057.96 °C
(Extreme heat stress)
58.80 °C
(Extreme heat stress)
5.0 to 1.0 °C
(Extreme heat stress)
2.2 to 0 °C
(Extreme heat stress)
Same level of thermal sensation improvement for both the typical adult male and the elderly individual. Hot spots in unshaded areas lead to light PET increase in elderly individuals.
21:0036.29 °C
(Strong heat stress)
36.62 °C
(Strong heat stress)
3 to 1 °C
(Moderate heat stress)
3 to 1.2 °C
(Strong heat stress)
Same level of thermal sensation improvement for both the typical adult male and the elderly individual. For the typical adult male, there is a change in thermal stress category after changes were implemented.
Table 4. Comparison of dPET values between the regeneration scenario and the initial conditions on 8 July 2024 for an adult male and an elderly individual.
TimeInitial LayoutRegeneration ScenarioImportant Notes
Typical Adult MaleElderly IndividualTypical Adult MaleElderly Individual
12:0051.55 °C
(Extreme heat stress)
52.38 °C
(Extreme heat stress)
2 to 2.8 °C (increase)
(Extreme heat stress)
2 to 2.8 °C
(increase)
(Extreme heat stress)
Local increases were produced in both cases.
15:0054.31 °C
(Extreme heat stress)
55.24 °C
(Extreme heat stress)
−0.2 to +0.2 °C
(Extreme heat stress)
−0.2 to +0.2 °C
(Extreme heat stress)
No significant changes after regeneration.
18:0049.89 °C
(Extreme heat stress)
50.47 °C
(Extreme heat stress)
1–2 °C
(Extreme heat stress)
1–2 °C
(Extreme heat stress)
There is a slight decrease after regeneration
21:0034.68 °C
(Moderate heat stress)
33.28 °C
(Moderate heat stress)
1–1.3 °C
(Moderate heat stress)
1–1.5 °C
(Moderate heat stress)
There is a slight decrease after regeneration
Disclaimer/Publisher’s Note: The statements, opinions and data contained in all publications are solely those of the individual author(s) and contributor(s) and not of MDPI and/or the editor(s). MDPI and/or the editor(s) disclaim responsibility for any injury to people or property resulting from any ideas, methods, instructions or products referred to in the content.