Article

Exploring Aesthetic Preference for Agricultural Landscapes in Hangzhou Plain: A Visual Choice Experiment from Two Perspectives

1
College of Environmental and Resource Sciences, Zhejiang University, Hangzhou 310058, China
2
East China Academy of Inventory and Planning of NFGA, Hangzhou 310019, China
3
The Rural Development Academy, Zhejiang University, Hangzhou 310058, China
*
Author to whom correspondence should be addressed.
Land 2026, 15(6), 1103; https://doi.org/10.3390/land15061103
Submission received: 19 May 2026 / Revised: 13 June 2026 / Accepted: 18 June 2026 / Published: 22 June 2026

Abstract

The aesthetic value of agricultural landscapes is gaining importance as rural tourism burgeons during urbanization. To ascertain key elements influencing the visual appeal of agricultural landscapes, this research employed a visual choice experiment in Hangzhou Plain during the spring flowering period to assess public preferences for four landscape attributes in ground and aerial perspectives. The mixed logit model was utilized to evaluate the respondents’ average preference, while the latent class logit model helped in identifying distinct preference groups. The research revealed that participants exhibited different preferences between the two perspectives. The diversity within public preferences was highlighted, with respondents favoring oilseed rape-dominated landscapes with a single agricultural land cover proportion in ground perspective while favoring diverse landscapes in aerial perspective. Gender, education level, landscape familiarity, connection to agriculture, and membership in relevant organizations significantly shape individual preferences. These results can help refine multi-objective policy targeting by incorporating aesthetic value perspective in agricultural landscapes.

1. Introduction

Agriculture has expanded from a pure food supply to environmental protection, aesthetics, and education [1,2,3,4]. Agricultural multifunctionality, the ability of agriculture to simultaneously provide a range of ecosystem services, has increasingly become a key element in transforming and modernizing traditional agriculture [5]. The cultural ecosystem services of agricultural landscapes have received increasing attention in recent years [6,7,8,9]. Among these services, the aesthetic service is considered critical [10]. Consequently, enhancing the visual quality of agricultural landscapes is increasingly becoming a primary driver for their development [11]. However, the assessment of aesthetic services is particularly challenging, as human perception is often highly subjective [12]. While landscape aesthetic values can be partially related to biophysical and ecological characteristics of landscapes, such as landscape pattern [13,14,15,16] and biodiversity [17,18], human preferences are crucial for their valuation. Therefore, evaluating human preferences is of significant importance [9,19,20,21,22,23].
While the majority of studies on agricultural landscape preferences have been carried out in European countries [24], studies in the context of China are also of great significance. China, developing based on agriculture, has enacted policies to secure grain supply, such as carrying out rural land consolidation [25] and large-scale construction of high-standard farmland. Despite considerable advancements in high-standard farmland development and land consolidation, these projects often focus on capacity enhancement of food supply, neglecting the aesthetic and ecological aspects of agricultural landscapes [26]. This excessive pursuit of production efficiency has led to the homogenization of agricultural landscapes [27], yet its aesthetic impact remains far from clear. Existing literature focusing on Europe has already yielded contradictory conclusions regarding the visual appeal of such landscapes: some studies indicate that people prefer landscapes with diverse agricultural land cover [9,28] and smaller field sizes [29], while others suggest that the public sometimes favors large-scale, continuous, and striking landscapes, such as expansive rice paddies and the sea of flowers and forests [7,30,31,32]. This disparity highlights the regional diversity in landscape preferences. Therefore, what preferences people hold for farmland landscapes in the context of China is also a question worthy of exploration.
Meanwhile, with the rapid urbanization since China’s reform and opening up policy, the rural population has been flocking to the cities. To adapt to the economic transformation and meet the consumption demands of urban residents, at the end of the twentieth century, villages in the developed coastal regions of China began to develop tertiary industries represented by agricultural picking and sightseeing tours, meeting the leisure and recreational needs of urban residents [33]. In 2017, China put forward the “Rural Revitalization” strategy to harmonize the contradiction between the imbalance of urban and rural development. Leisure agriculture and rural tourism have developed rapidly under the dual role of government and market [34,35]. The aesthetic value of agricultural landscapes has been increasingly emphasized due to its close relationship with the tourism industry [11,19]. Importantly, such value is not inherent in the landscape itself, but emerges from people’s perceptions of and interactions with landscape attributes [36,37]. Public preferences therefore play a central role in the evaluation of agricultural landscape aesthetics.
Methods for assessing landscape preferences can be divided into revealed preference and stated preference. The revealed preference method is typically determined indirectly by observing behavior or analyzing documents, while the stated preference method directly asks participants to evaluate specific landscape scenes or attributes through questionnaires or experiments, revealing their underlying preferences and values [12,23]. In the stated preference method, participants are often shown a series of landscape images. Different images are often rated using a Likert scale or by selecting preferred or rejected options from a set of images in methods of using such images for preference assessment. These stated preferences are then used to infer which landscape attributes are relevant for assessing landscape aesthetic values [38]. However, these methods typically do not adequately take the influence of the interactions of multiple landscape attributes on visual landscape preference into account [39,40]. In contrast, choice experiments (CE), which aim to estimate attribute utility based on individual responses to multiple combinations of decision attributes [41], are more conducive to understanding the benefits of each attribute combination, and are increasingly applied to agricultural landscape planning and management, as well as to the public’s visual preferences for different landscape scenarios under different political administrations [8,9,28,40,42,43,44].
Notably, the visual attributes of agricultural landscapes exhibit dynamic changes with shifts in observation perspectives. It is worth noting that the ground and aerial perspectives differ not only in observation height but also represent two fundamentally distinct modes of landscape perception [45]. Ground-based observers are typically situated within or at the edge of farmland, where their aesthetic experience is multisensory—beyond vision, it integrates wind sounds, bird songs, crop odors, soil moisture, and other environmental inputs. From the perspective of cognitive psychology, this immersive experience emphasizes the observer’s on-site interaction with the landscape [46]. In contrast, the aerial perspective offers a highly visual, detached mode of observation. A physical and psychological distance exists between the observer and the landscape, making aesthetic judgments more dependent on holistic visual composition, texture contrast, and spatial pattern.
While existing studies have primarily focused on ground perspectives [8,9,13,40,43], there is a noticeable oversight in understanding preferences for agricultural landscapes from aerial perspectives. In the meantime, low-altitude tourism as a form of tourism utilizing air transportation and aircraft in low-altitude airspace, is gaining increasing favor among consumers due to its striking visual appeal [47,48]. The growth of rural tourism and leisure agriculture has promoted the rapid development of low-altitude tourism, which provides a new perspective for landscape observation and highlights the research gap. Therefore, comparing the similarities and differences in public preferences in the two perspectives helps elucidate the trade-off mechanism between “multi-sensory experiences” and “pure visual experiences” in landscape aesthetics, thereby providing a theoretical foundation for multi-perspective tourism and landscape planning.
It is important to acknowledge that agricultural landscapes are highly dynamic across seasons [49]. This study focused on the spring flowering period (April), when wheat and oilseed rape created a colorful mosaic of green and yellow. During the rest of the year, the landscape exhibited highly homogeneous features such as bare soil after harvest and uniformly green rice fields. Therefore, the findings are specific to this narrow temporal window. Tourist perceptions and preferences may differ substantially in other seasons, and generalization to the full year requires further seasonal comparisons.
Therefore, this study takes the Hangzhou Plain agricultural landscape in spring flowering period as an example, and empirically analyzes the aesthetic value of the landscape from two perspectives, ground and aerial, through CEs. It aims to address three questions: (1) What are the differences in the public’s aesthetic preferences for landscape attributes under different perspectives? (2) To what extent do preferences vary across individuals within each perspective? (3) How do participants’ socio-cultural characteristics influence these preferences?

2. Materials and Methods

2.1. Study Area

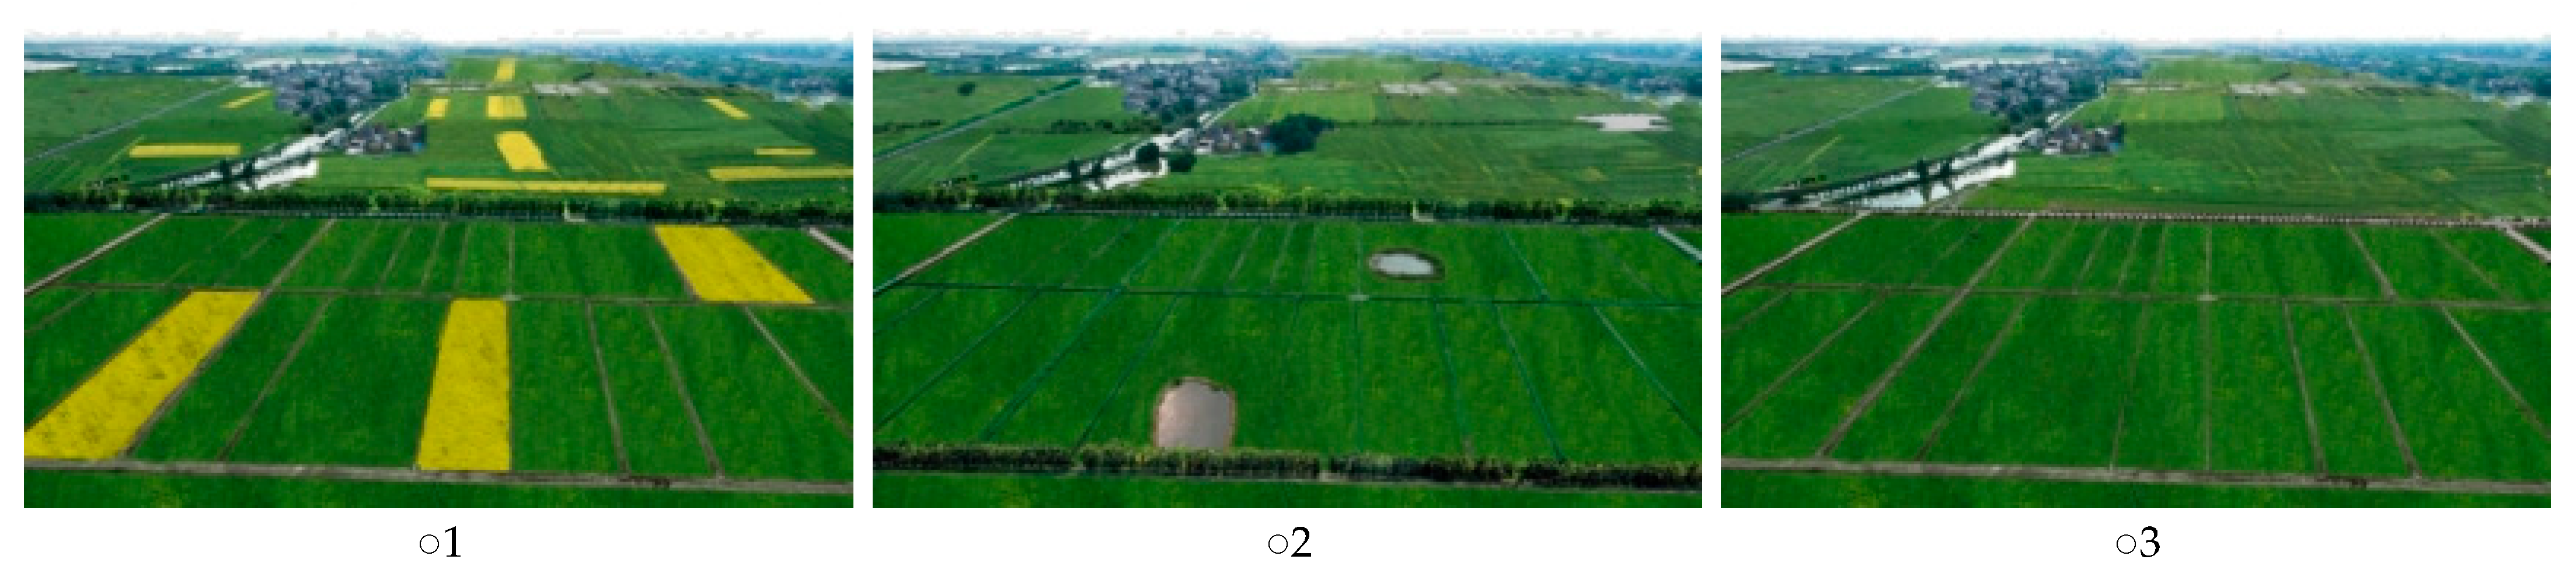
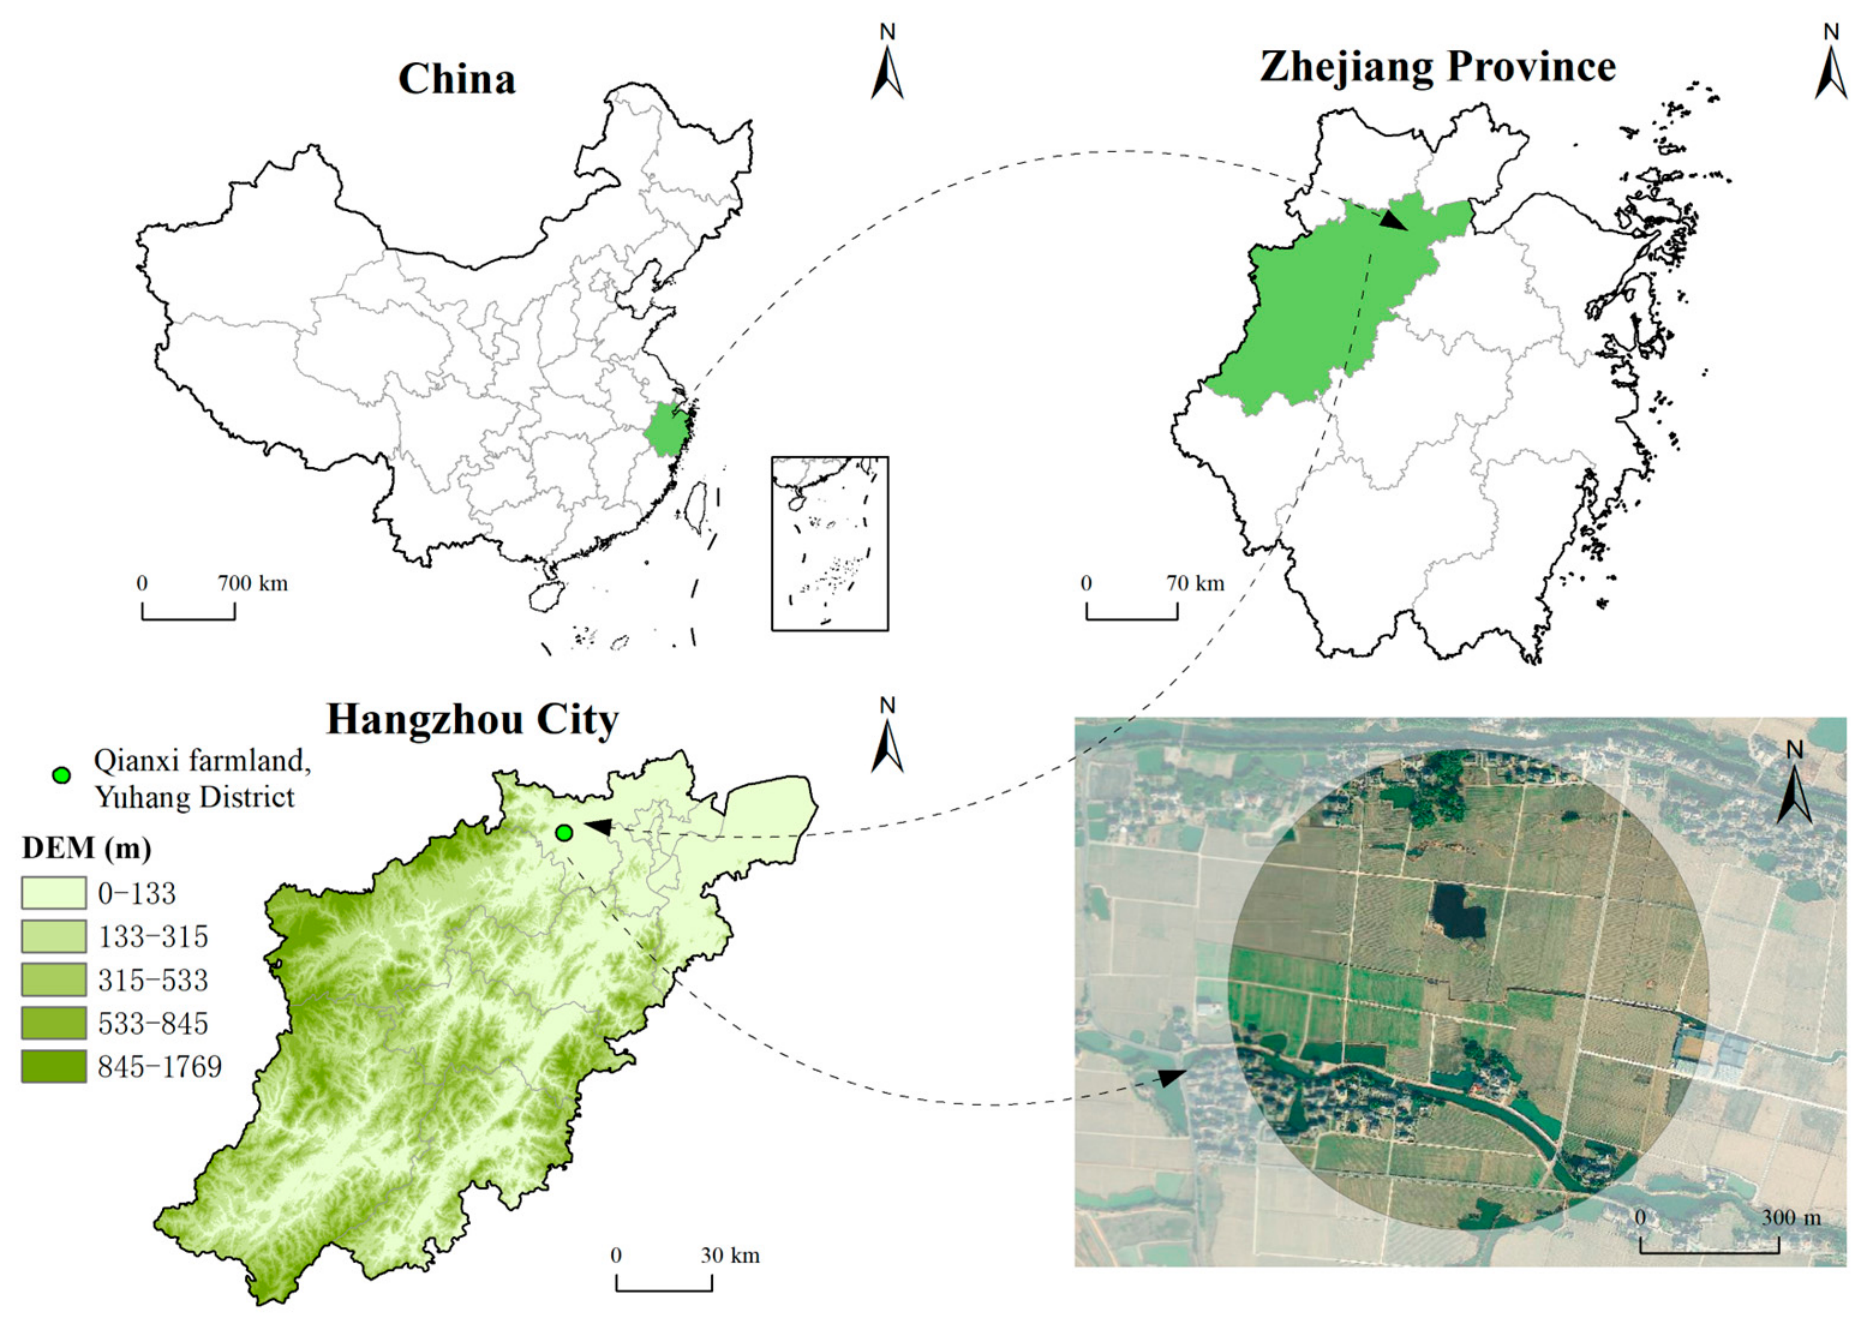
The study was conducted in the plain area in the northeastern part of Hangzhou City (29°11′–30°33′ N, 118°21′–120°30′ E), the capital of Zhejiang Province, China. The specific sampling area is located in farmland in Qianxi Village, Jingshan Town, Yuhang District, featuring over 1.33 km2 of contiguous fertile land. Hangzhou encompasses ten districts, two counties, and one county-level city, covering an area of 16,852 km2. Hangzhou’s farmland covers 2356 km2, accounting for 14% of the city’s total area. The lowland farmland of Hangzhou is characterized by a flat terrain and dense river network, interspersed with villages, rivers, and countless lakes and ponds (Figure 1). Hangzhou’s renowned natural and cultural landscapes attracted approximately 192.80 million domestic tourists and 114.02 million international overnight visitors in 2024 [50]. Notably, Hangzhou’s rural tourism sector has already welcomed over 74.40 million visitors in 2024 [51]. As a central component of the rural landscape, the agricultural landscape plays an essential role in rural tourism.

2.2. Choice Experiment Design

2.2.1. Choice Experiments

The fundamental principle of choice experiments is that rational individuals select the option with the greatest utility from a set of alternatives, each defined by a unique combination of attributes. By varying these attribute combinations and observing responses, it is possible to evaluate the relative strength of preference for different attributes [52].
The choice experiment model has three advantages over multivariate model-based studies. First, it forces participants to make trade-offs by selecting their preferred landscape from a set of images. Second, this model offers a robust quantitative analytical framework for analyzing the factors that influence participants’ choices. Third, it accommodates the variability in individual preferences when evaluating landscape aesthetics [8]. Consequently, within the field of landscape preference research, choice experiments are an effective tool for investigating how landscape attributes contribute to aesthetic value.

2.2.2. Landscape Attribute Table Construction

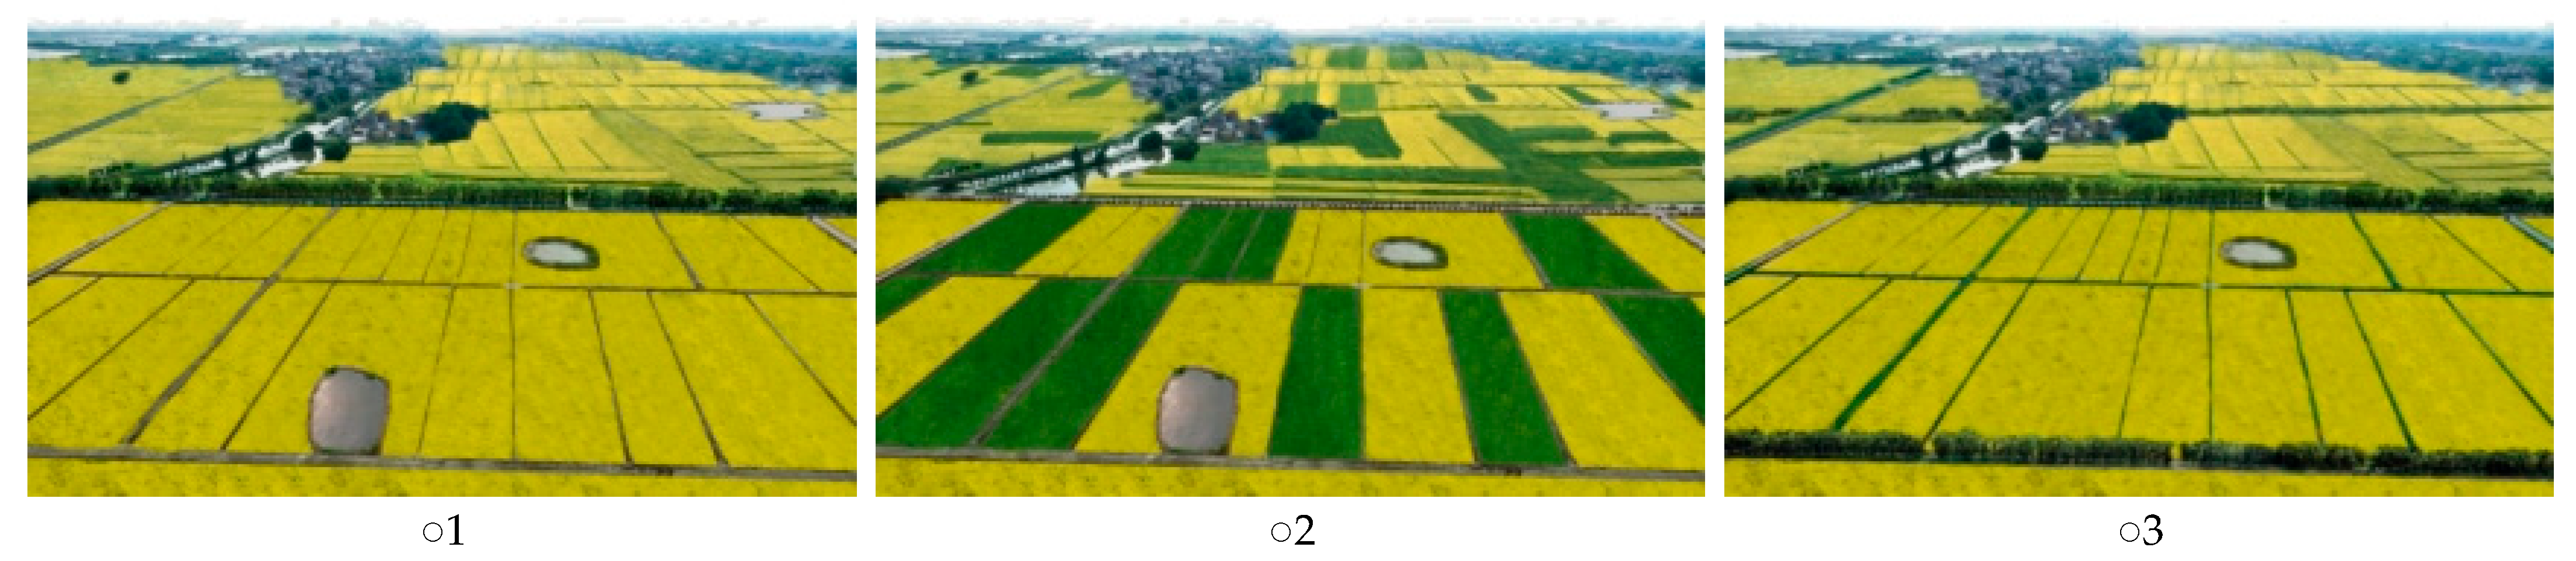
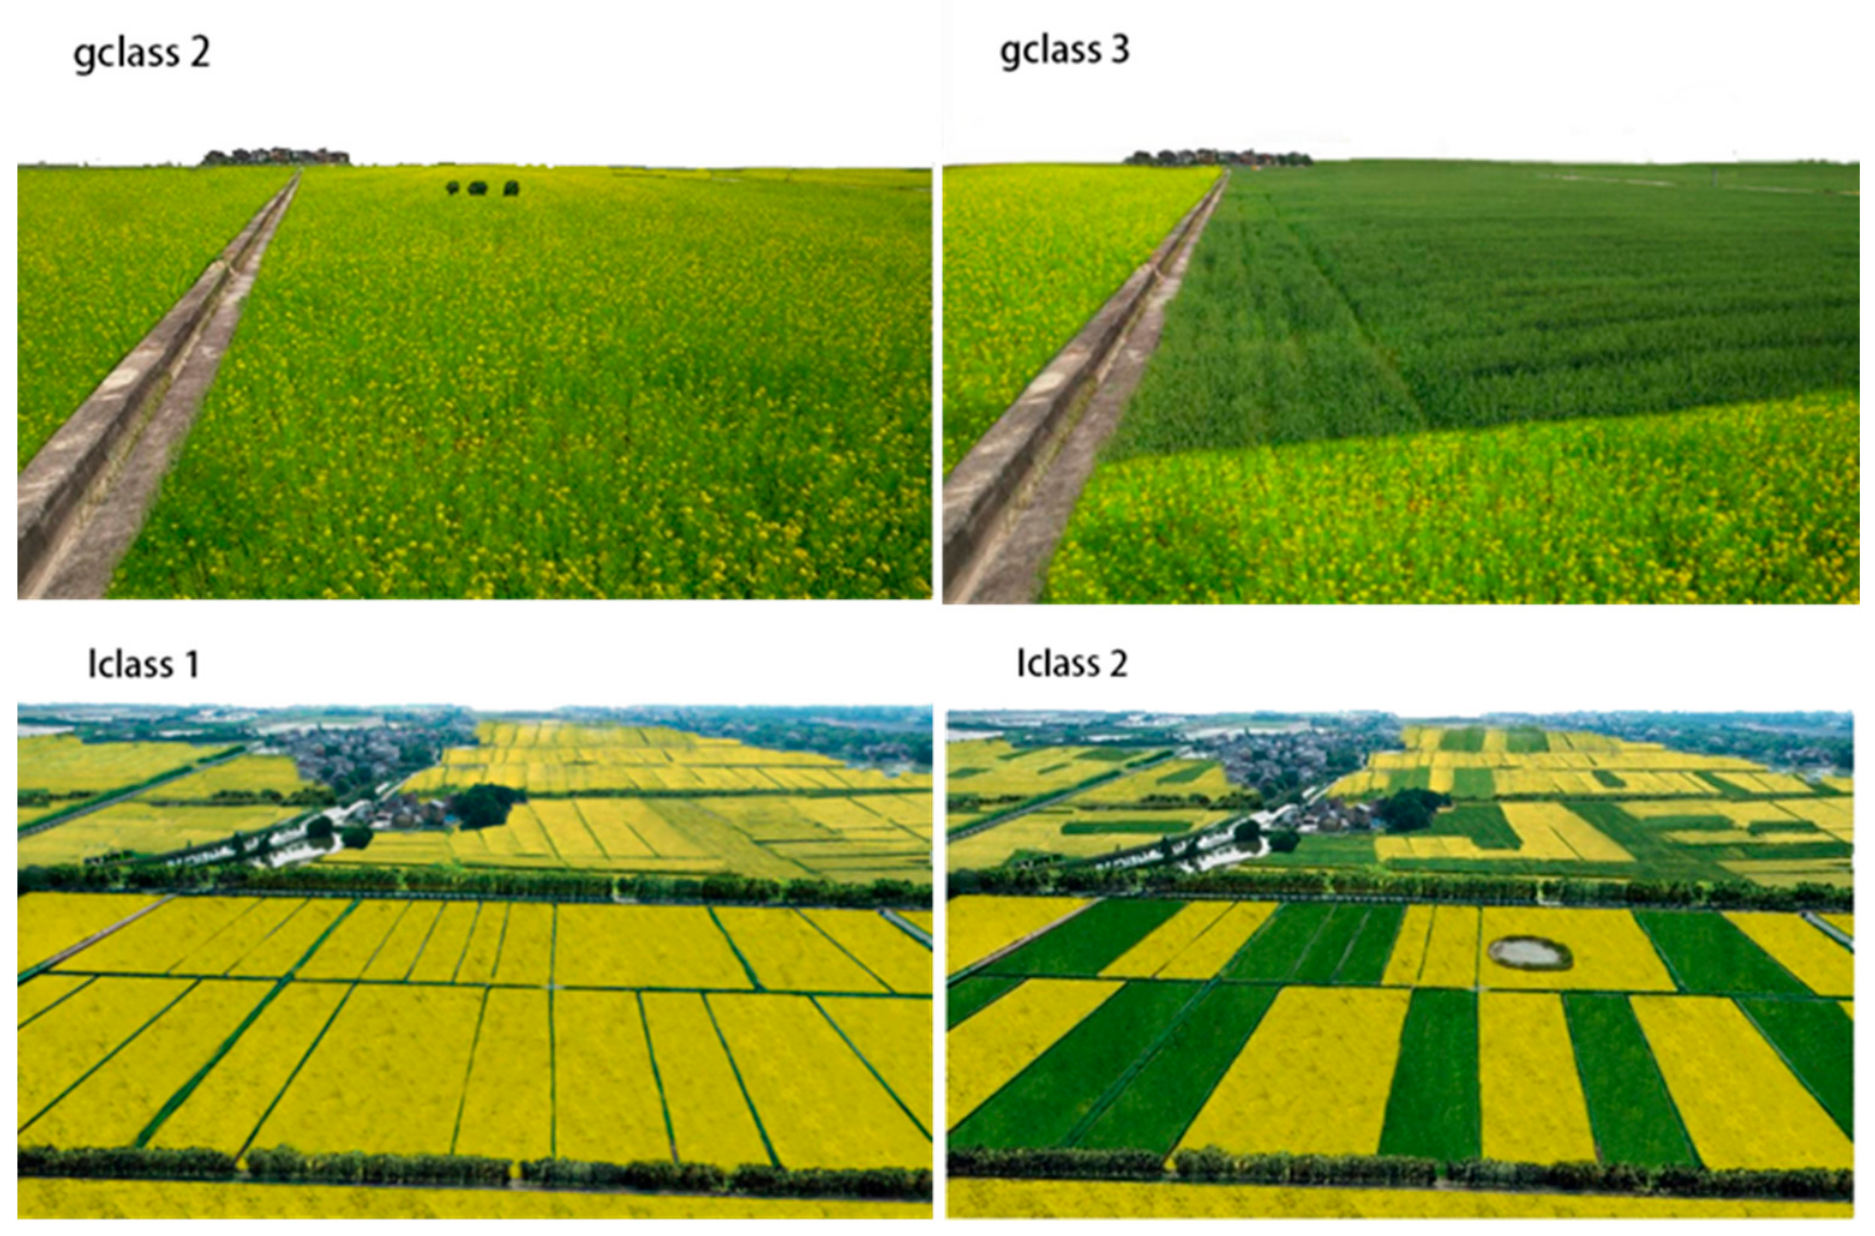
Landscape attributes refer to the physical characteristics of a specific landscape [53,54]. This study focuses on agricultural landscape attributes that are influenced by agricultural policies, thus attributes relevant to agricultural management were selected for CE. The selection of four agricultural landscape attributes was finalized through multiple consultations with local experts in landscape architecture, environmental science, ecology, and agronomy, as well as validation and confirmation by other stakeholders (Table 1). With the emergence of leisure agriculture and aerial tourism, this study examines these agricultural landscape attributes from both ground and aerial perspectives. Due to the shift in perspective, these attributes exhibit different visual representations.
(1)
Proportion of agricultural land cover. This study took the Hangzhou-Jiaxing-Huzhou Plain as the main research area. The Hangjiahu Plain is aesthetically valued for its spring cultivation of both wheat and oilseed rape. During spring, wheat and oilseed rape are cultivated in varying proportions across the same farmland, their contrasting colors and patchy spatial arrangement create a visually diverse mosaic. The more balanced the proportion of the two crops, the higher the chromatic heterogeneity. Thus, the proportion of agricultural land cover is determined by the extent of two different crops cultivation in the farmland. This visual landscape attribute is categorized into three levels: single cover, medium proportion, and high proportion.
(2)
Major types of crops. The Outline of the 14th Five-Year Plan (2021–2025) for National Economic and Social Development, along with the Long-Range Objectives through 2035, advocates improving the arable land fallow system and implementing crop rotation, to strengthen the production of main food crops, while expanding winter oilseed rape cultivation in winter farmlands, and enhancing oilseed supply security. Recognizing the actual planting situation of two crops in the Hangjiahu Plain and the duration of the research, the study primarily selected wheat (Triticum aestivum L.) and oilseed rape (Brassica napus L.) as the main crops, defining large areas planted mainly with oilseed rape (with little or no wheat) as ‘oilseed rape’, and those planted mainly with wheat (with little or no oilseed rape) as ‘wheat’.
(3)
Prevalence of linear elements. The prevalence of linear elements in agricultural landscapes is marked by elements such as ridges, ditches, hedgerows, and field margins [54]. These elements serve as vital habitats and offer ecosystem services, functioning as ecological infrastructure for various species [55]. The presence or absence of vegetation cover along each field margin characterizes this attribute. It is categorized into three levels of prevalence: low, medium, and high.
(4)
Prevalence of point elements. This attribute represents the visual landscape characterized by patches of non-agricultural habitat within farmland, including individual trees or clusters of trees, shrubs, grasses, and ponds. The levels of this visual landscape attribute are categorized as low, medium, and high levels of point elements.

2.2.3. Landscape Images Selection

In 2019, the Zhejiang Provincial Department of Agriculture and Rural Affairs, in cooperation with the Zhejiang Provincial Department of Culture and Tourism, selected 100 “most beautiful countryside” in Zhejiang Province. These farmlands, usually larger than 33.33 ha, have moderate size, density, well-maintained roads and ditches, orderly and pristine crop layouts, and an aesthetically appealing environment.
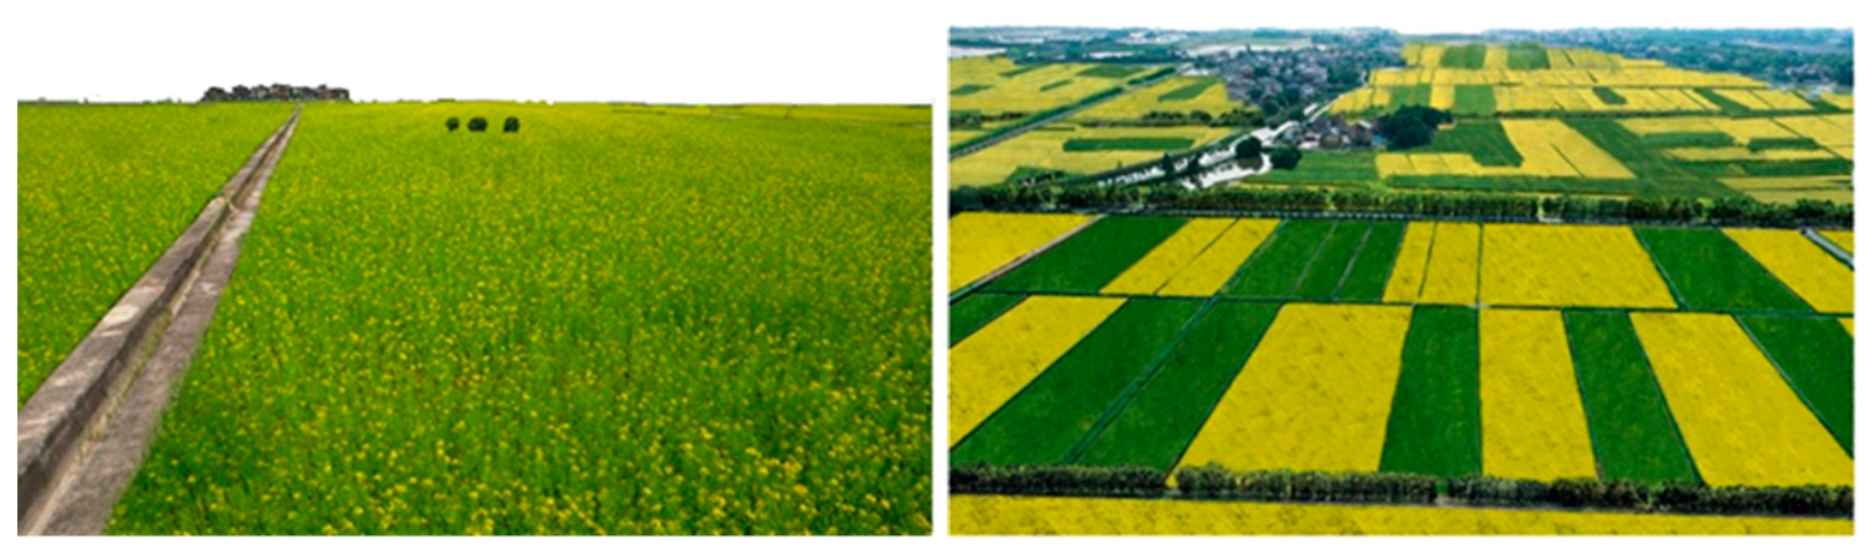
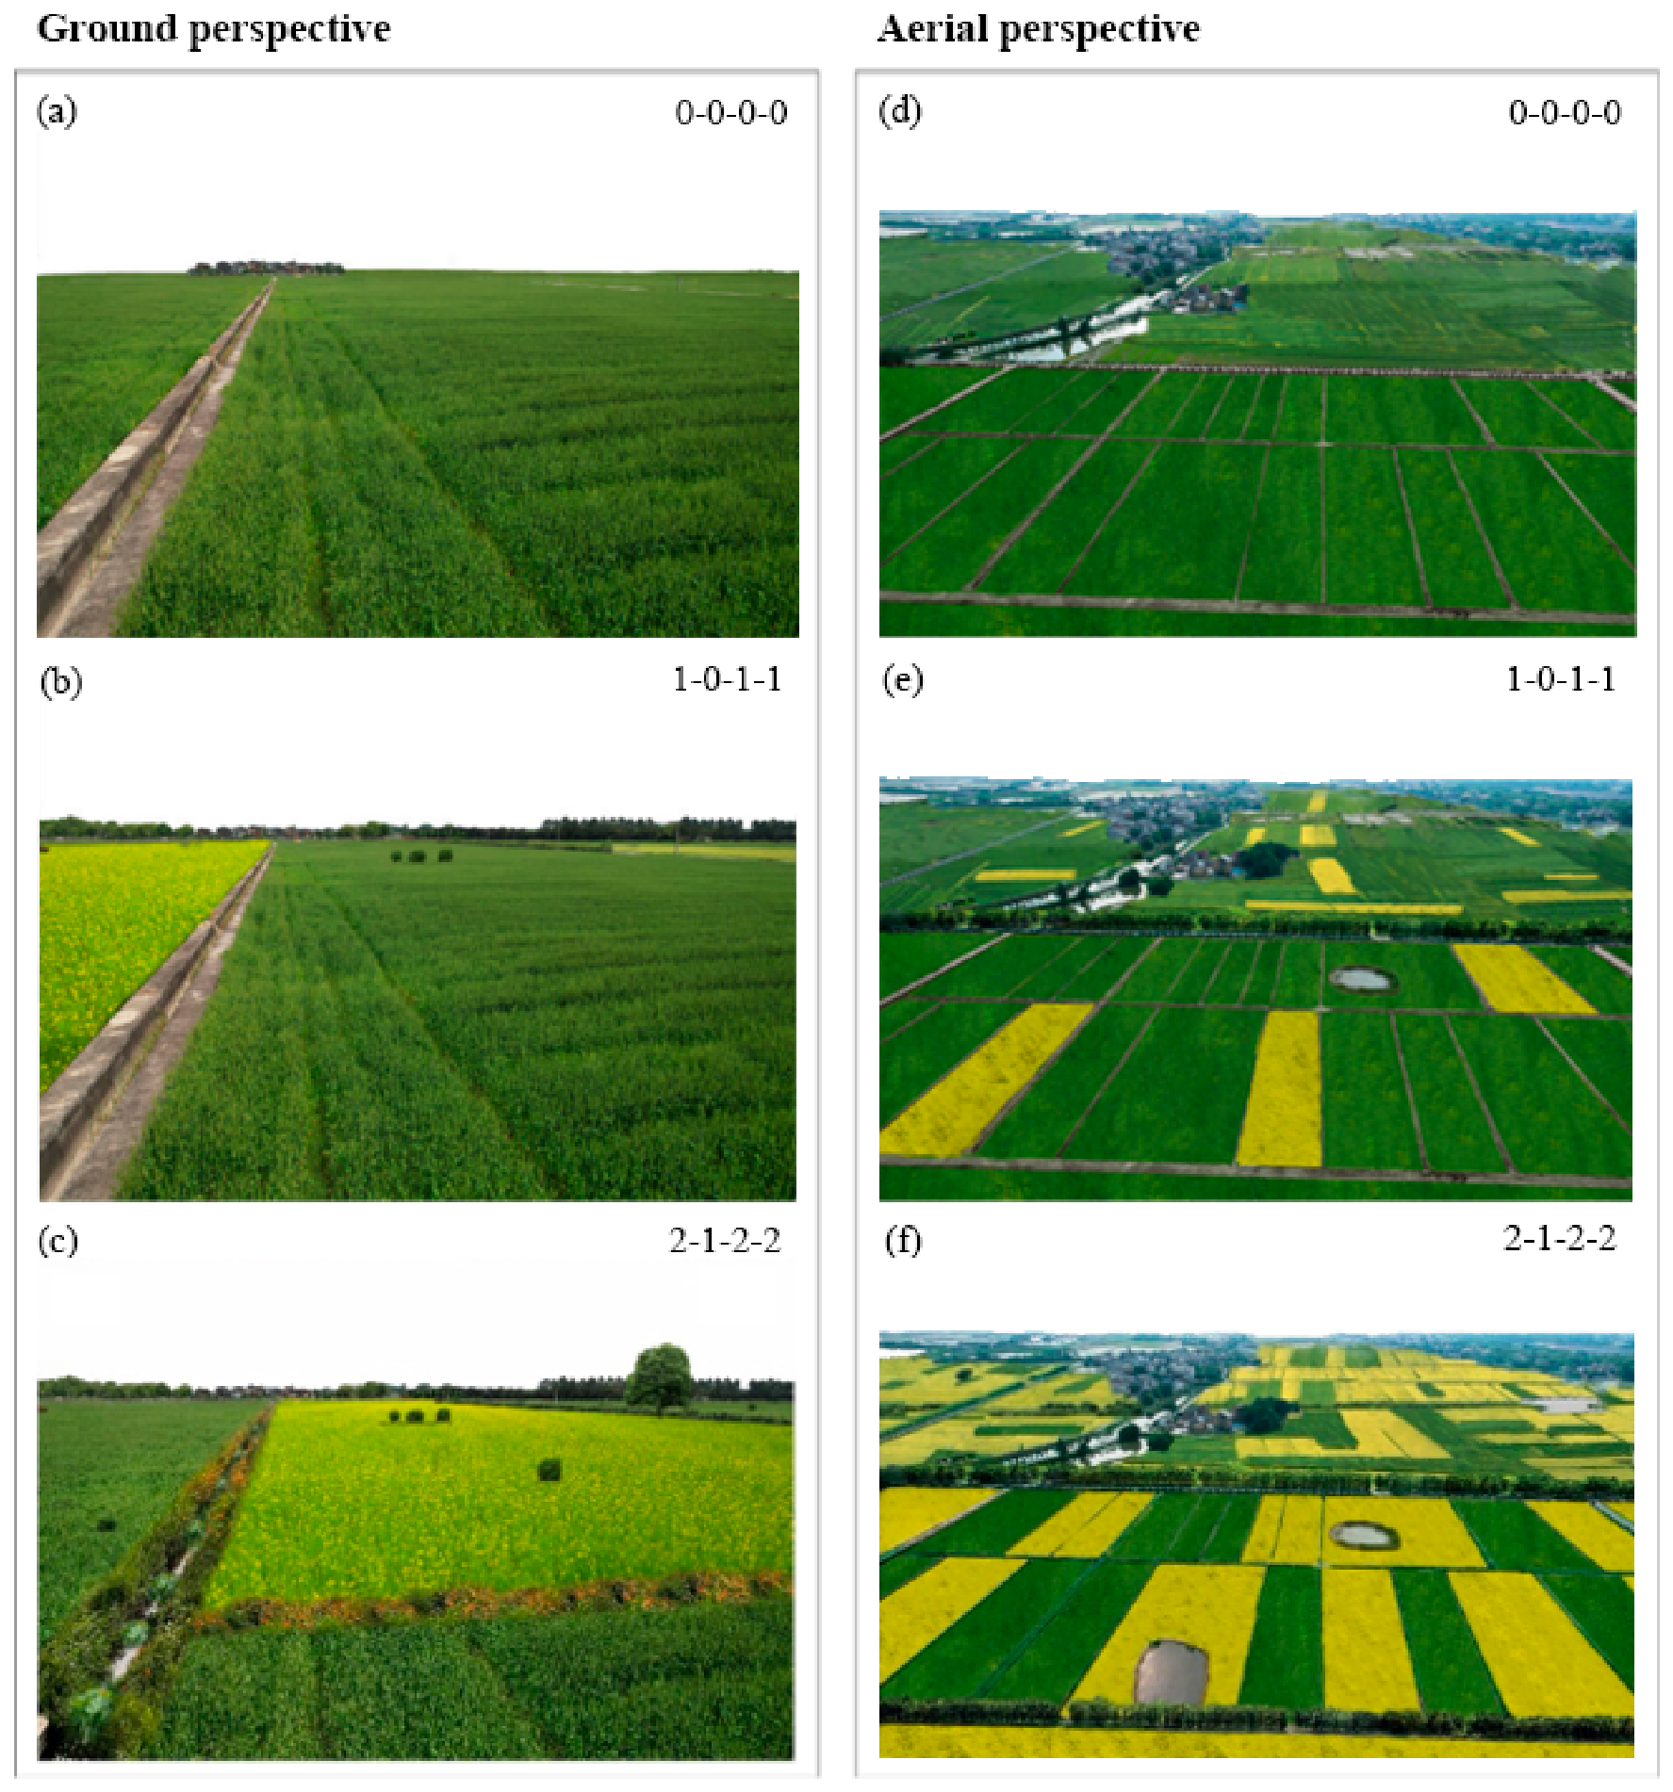
In this study, base images were all taken on 21 April 2023, when wheat and oilseed rape were in the flowering period, on farmland in Qianxi Village, Jingshan Town, Yuhang District, which was selected as one of Hangzhou’s most beautiful countryside, using Canon 5D4 camera (Canon Inc., Tokyo, Japan) and DJI AIR3S drone (DJI, Shenzhen, China). The base images include both ground and aerial perspectives, and were taken from exactly the same location and angle. Two images from them were ultimately selected for further study. The ground perspective includes villages, flat farmland, and roads, while the aerial perspective shows a dense river network interspersed with farmland and villages, as well as villages, flat farmland, rivers, and roads in the middle and background.

2.2.4. Choice Sets Design

The Ngene software package (version 1.4) was used to create an orthogonal design with 18 choice sets, each with three alternatives. Since studies have shown that longer surveys reduce response rates and may affect the quality of the data collected due to participant fatigue, to maintain the validity of the questionnaire and to avoid participant fatigue, the split questionnaire design (SQD) was employed in this study, dividing the sets into two groups of nine and randomly distributing among the participants [56,57].
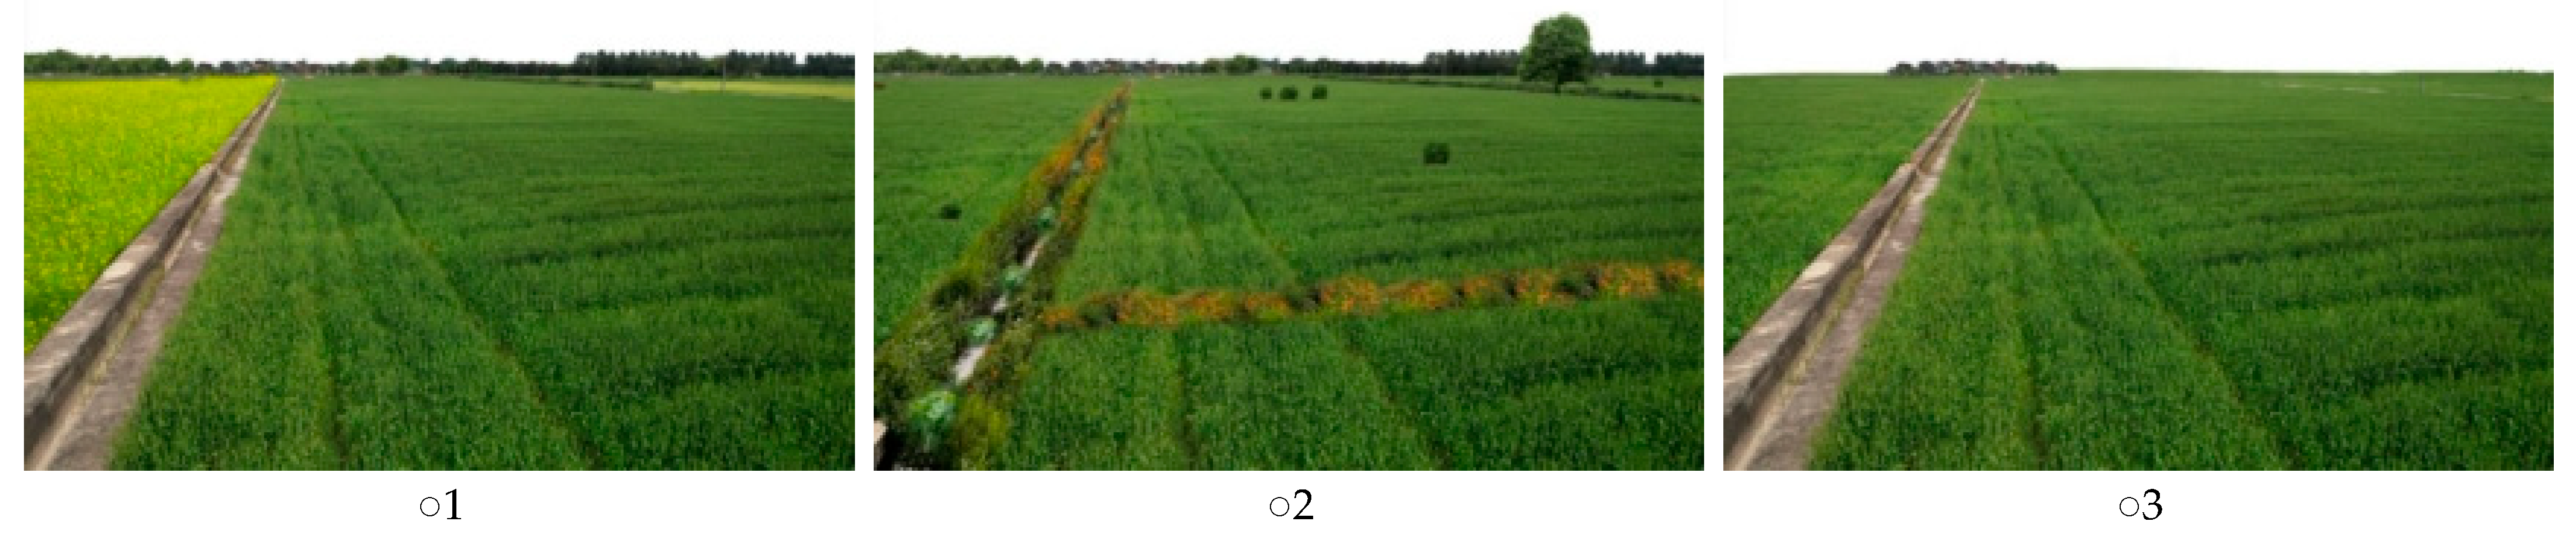
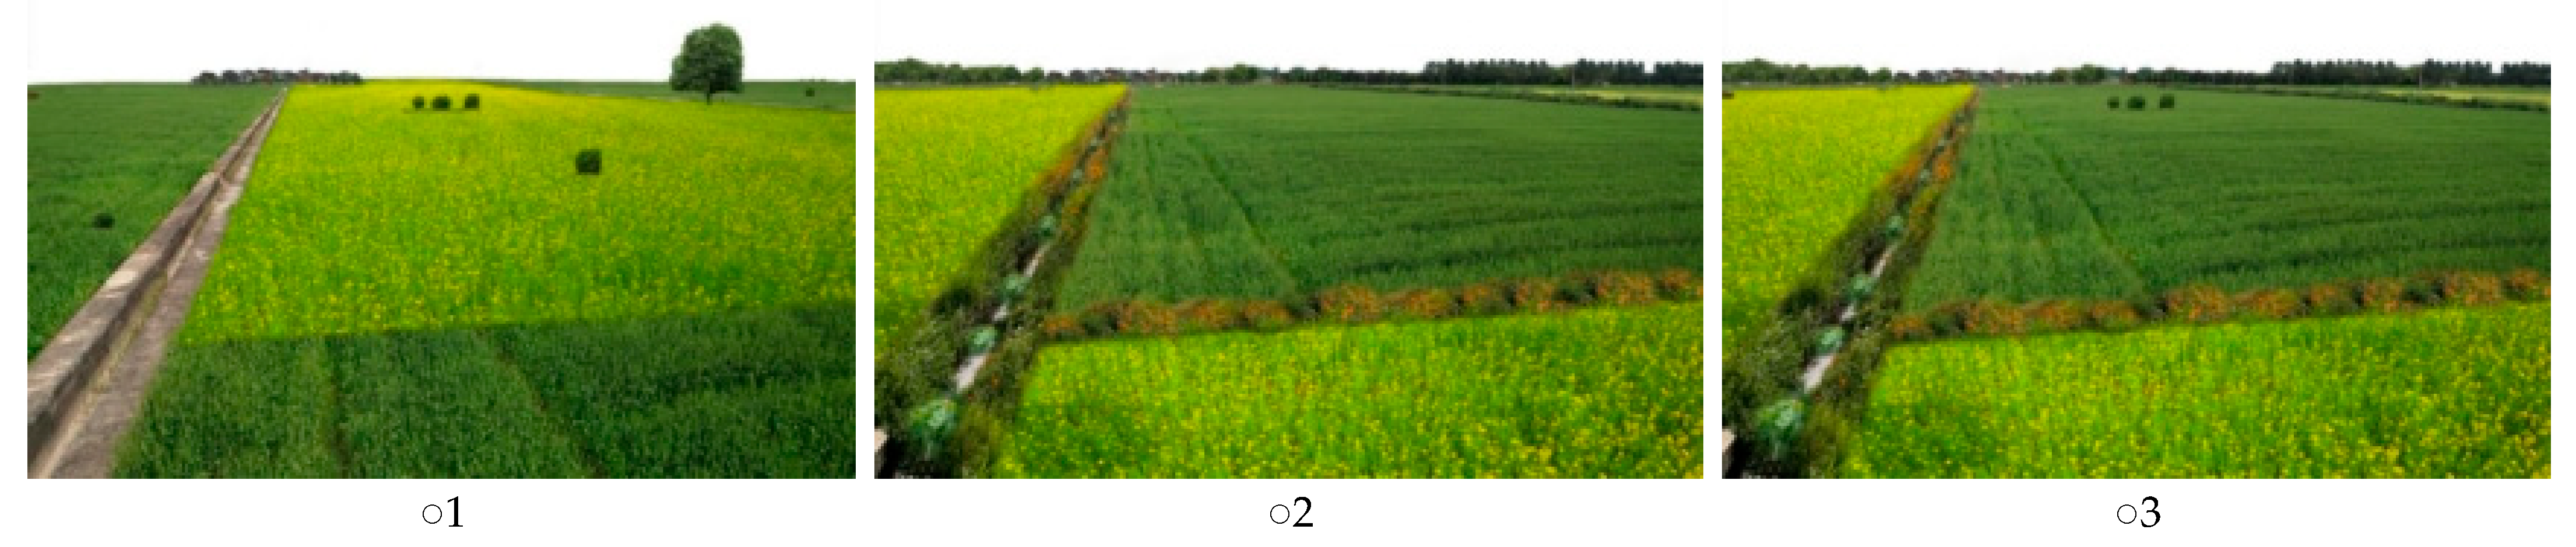
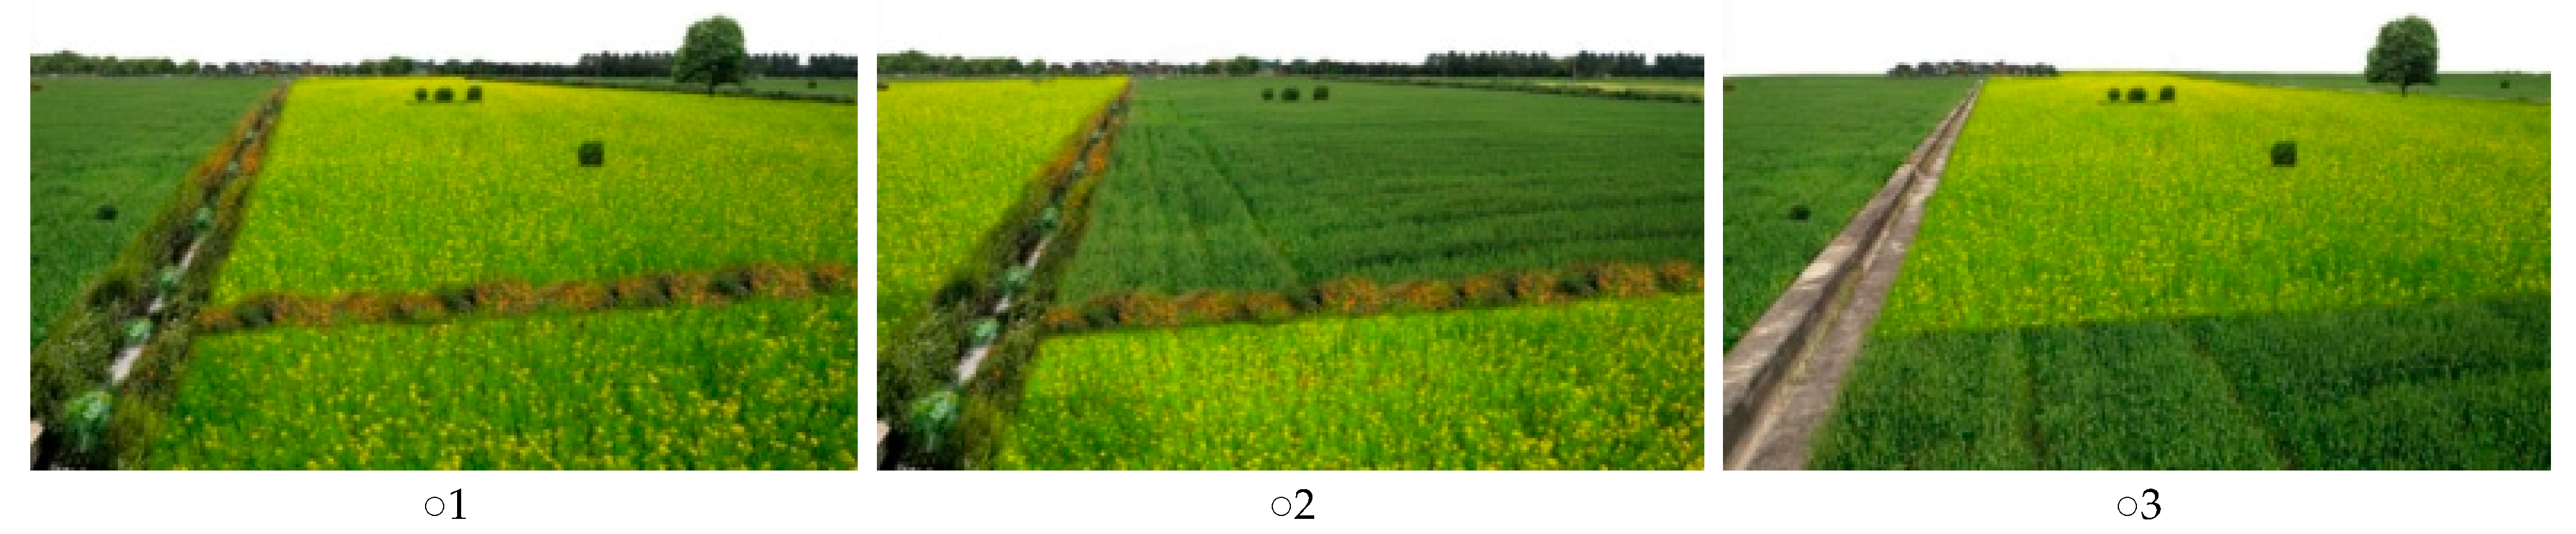
Based on the selected sets, a visualization approach was employed to depict the four landscape attributes and their respective levels against a representative background image (Figure 2). Unlike many studies that rely on generic photographs [13,58,59], this study used a typical view of the landscape as a constant base image for all landscapes in the study area. Adobe Photoshop 2026 was used to modify the levels of various landscape attributes on this base image, thereby creating multiple scenarios. This method has the advantage of controlling for other factors that may influence visual preferences, such as weather conditions, photographic perspective, and composition.

2.2.5. Socio-Cultural Explanatory Variables

Previous research has shown that demographic and cultural characteristics significantly influence landscape preferences, with considerable variation among individuals [60]. Common demographic characteristics considered in landscape preference studies include gender, income, age, place of residence, and education level. In particular, participants’ places of residence, their connections to agriculture, and familiarity with agricultural landscapes are important considerations in these studies [53]. Living environment, whether urban or rural, significantly influences landscape preferences [61]. Individuals develop a sense of place and identity through environmental interactions and experiences [62], which influences their agricultural landscape preferences. Education level also strongly influences landscape preferences, with individuals with higher education tending to prefer cultural landscapes [63,64]. In addition, landscape familiarity [44,65] and agricultural connections influence preferences, with those associated with agriculture often favoring less natural and more intensively managed agricultural landscapes [19,65]. Based on the literature reviewed, a standardized set of explanatory variables was established (Table 2).

2.2.6. Questionnaire Design and Survey

Based on the above considerations, the questionnaire was designed (Appendix A). The questionnaire comprised three sections. Section 1 briefly introduced the research background and explained the task. Section 2 assessed landscape preferences in ground perspective and aerial perspective, respectively. Each question was followed by three images displaying different combinations of landscape attributes, totaling nine questions per section. Participants were not provided with explanations of landscape attributes, ensuring their decisions were based solely on visual perception. Section 3 collected personal information (Table 2). A pre-test was conducted to ensure the comprehensibility, readability and authenticity of the visualization after the questionnaire was designed. Authenticity assessment of the images yielded an average score of 4.27/5 from respondents, indicating that these processed images are deemed capable of accurately reproducing authentic agricultural landscapes.
Data collection was conducted in January 2025 using the online sampling service “SoJump” [66]. As rural tourism in Hangzhou primarily attracts visitors from nearby areas and Zhejiang residents constitute a key source market, the demographic characteristics of the study sample are considered consistent with those of Zhejiang Province residents. To ensure representativeness, the sample demographics were matched with data from the “Zhejiang Provincial Statistical Yearbook” [67]. Of the 233 questionnaires received, 223 were considered valid after excluding incomplete responses or questionnaires from outside Zhejiang Province. To assess the adequacy of sample size, we conducted a statistical power analysis. With sample of 223 respondents, the study demonstrated an 80% power at the α = 0.05 level to detect moderate to significant preference differences (z ≥ 2.8), and over 60% power for smaller but statistically significant effects (z ≥ 2.0) [68]. This indicated that the sample size possessed sufficient statistical power so that genuine significant preference patterns across different landscape attributes and viewing perspectives could be identified.
Given the primarily online format of the survey, there was a slight overrepresentation of participants aged 35–59 and those with higher education levels compared to the general demographics of Zhejiang Province. Also, our sample may underrepresent non-internet users and thus carry self-selection bias. Nonetheless, post-quota adjustments ensured that the sample’s gender, age, education level, and place of residence demographics closely mirrored those of Zhejiang Province (Appendix B).

2.3. Model Specification and Statistical Analysis

To evaluate participants’ preferences for agricultural landscape attributes, this study adopted a mixed logit model (MLM). MLM, as opposed to the more basic multinomial logit (MNL) model, more realistically assumes that utility parameters vary among individual participants [69]. In our MLM, each attribute level was analyzed using dummy coding, with the lowest level of all attributes serving as the reference category in the model.
Given the large number of attribute levels involved in the study, setting all attribute coefficients to random distributions would lead to convergence difficulties and parameter instability during model estimation. To address this, the study adopts a two-stage approach: only assign coefficients of key attribute levels to normally distributed random parameters while ensuring model convergence, and retaining fixed parameters for other attributes. This approach achieves robust model performance while effectively capturing participants’ preference differences for key attributes.
The degree of consensus among participants and the variability in their preferences were analyzed using a latent class logit model (LCM) approach. This model is based on the principle that observed responses can be classified into distinct homogenous preference groups, called classes. It posits that heterogeneity among participants can be effectively represented within a finite number of these classes [70]. The LCM is an extension of the MNL model that focuses primarily on incorporating latent classes. The LCM efficiently classifies individuals into a limited number of groups characterized by strikingly similar β-vectors. Within this model, the probability that a given individual n, who was a member of class q, chose alternative i from a given choice set t was specified by:
P n i | c l a s s = q = exp x n i t β q j = 1 j exp x n i t β q
It is important to note that this probability depends on the individual’s membership in class q. The assignment of individuals to a specific class was probabilistic and was determined in the model based on their choice of behavior. Parameters for both the class selection model and the choice probability model were estimated using a standard maximum likelihood procedure [71].
The probability of class membership of an individual n was modeled based on its specific characteristics, denoted as Z n , and the relevant class conditional parameter vector γ q .
H n q = exp Z n γ q q = 1 Q exp Z n γ q
Combining the class membership probabilities with the probabilities from the choice model yielded the aggregate log-likelihood function for an individual n.
S n = n = 1 N ln q = 1 Q H n q t = 1 T j = 1 J exp x n j t β q j = 1 J exp x n j t β q γ n j t
where Q represents the number of classes, T denotes the number of choice sets presented to an individual, and J signifies the number of choices within each choice set. The variable γ n j t was set to 1 if individual n selected the j-th alternative in the t-th choice set, and it was 0 in all other cases. To determine the number of classes for the latent class model, the Bayesian Information Criterion (BIC) is employed because of its widespread use in latent class modeling.
In our final analysis, the relationship between socio-cultural explanatory variables and landscape attributes was examined by interacting dummy-coded socio-cultural variables with landscape attributes, which were then estimated using the MNL model. All model estimations for this study were performed using Stata software (version 18.0).

3. Results

3.1. Preference for Landscape Attributes

The estimation results of MLM showed that the participants exhibited higher preferences for most landscape attributes, with the notable exceptions being the medium and high proportions of agricultural land cover and linear elements in the ground perspective, as well as the medium proportion of agricultural land cover and the high level of point elements in the aerial perspective, which received lower evaluations (Table 3). Other estimated coefficients were statistically significant, except for the medium level of linear elements and point elements in the ground perspective, as well as the proportion of agricultural land cover, linear elements and medium level of point elements in the aerial perspective, which did not meet the critical significance level of 0.1.
Participants exhibited similar partial preferences in both perspectives, as depicted in Figure 3. The highest preference was for oilseed rape as the major crop, with more positive attitudes towards medium level of point elements, and more negative attitudes towards the proportion of agricultural land cover. The preferences also revealed heterogeneity between the perspectives: a lower preference for linear elements in the ground perspective and a higher, albeit non-significant, preference for high level of linear elements in the aerial perspective. Additionally, participants in the ground perspective showed the lowest preference for a high level of linear elements, while those in the aerial perspective displayed the lowest preference for a high level of point elements. In general, the utility coefficients for the landscape attributes were relatively small, with the exception of the value of −0.303 for the high level of point elements in the aerial perspective.
To assess the robustness of the mixed logit estimates, we also estimated a conditional logit model using the same data. The results reported the same direction for all attribute levels as the mixed logit model (Appendix C.1). Both models had BIC values of 6884.518 in ground perspective and 6885.853 in aerial perspective, indicating comparable model fit quality. This consistency supported the robustness of our main findings.

3.2. Analysis of the Extent of Agreement Among Participants

This study utilized the LCM to assess the level of agreement among participants. The BIC was used to determine the model class. According to the results shown in Appendix C.2 and Appendix C.3, though the LCM for the ground perspective did not have the lowest BIC value with three model classes, some categories exhibited extremely low participation rates with more model classes, indicating weak representativeness and structural instability. To prevent over-segmentation as well as enhancing interpretability of the model, the number of classes for the ground perspective was determined to be three, and the number for the aerial perspective was determined four.
Participants were divided into three potential categories in the ground perspective, with which in the two largest classes (Classes 2 and 3) exhibiting contrasting preferences (Table 4), as visually depicted in Figure 4. Class 3, comprising 59.4% of the participants, showed a statistically significant aversion to landscapes dominated by oilseed rape, point elements and high level of linear elements in the ground perspective. Utility coefficients for landscape attributes lacking statistical significance suggested an indifference towards the landscape attributes. Conversely, Class 2, representing 29.7% of the participants, showed a more positive inclination towards landscapes dominated by oilseed rape and point elements. The remaining class, Class 1, representing 10.9% of the participants, also showed stronger preference for rapeseed-dominated landscape and high level of point elements.
In the aerial perspective, the two largest groups (Classes 3 and 4) of participants demonstrated contrasting preferences for proportion of agricultural land cover, linear elements and point elements. However, the insignificant utility coefficients of the landscape attributes meant that their preferences for the four landscape attributes were not obvious. The two smaller categories (Classes 1 and 2) showed more distinct preferences contrarily, as depicted in Figure 4. Class 2, with 9.8% of participants, showed preferences for point elements and high level of linear elements, while showing lower preferences for medium level of linear elements. Conversely, Class 1, comprising 10.2% of the participants in the aerial perspective, showed no clear preference for proportion of agricultural land cover, while exhibiting strong fondness for positively evaluated landscapes dominated by oilseed rape. High level of linear elements also received higher evaluations, while high level of point elements received lower.

3.3. Effects of Socio-Cultural Explanatory Variables on Preferences

A forward stepwise MNL with interactions was used to derive the model results (Table 5), with nonsignificant interactions removed. The table indicated that socio-cultural explanatory variables had different effects on landscape attribute preference.
In contrast to women, men showed a lower preference for high proportion of agricultural land cover and landscapes dominated by oilseed rape in the ground perspective. In the aerial perspective, they demonstrated lower preference for medium level of linear elements and higher preference for medium level of point elements.
Educational level also predominantly influences landscape attribute preference in both perspectives. Participants with higher education showed preference for the landscapes dominated by oilseed rape in both perspectives. Contrarily, they showed opposite preferences for high level of linear elements in the ground perspective and high level of point elements in aerial perspectives.
Compared to participants with less connection to agriculture, those with closer connection showed a stronger preference for oilseed rape as the major crop. In the ground perspective, participants familiar with agricultural landscapes showed a greater preference for medium level of point elements, and in the aerial perspective, they preferred medium level of linear elements. Similarly, the group of participants with non-agricultural backgrounds who visited agricultural landscapes more frequently showed stronger preference for high level of linear elements in ground perspective and oilseed rape as the major crop in aerial perspective.
Participants who were affiliated with agricultural and environmental organizations showed a stronger preference for high level of linear elements in both the ground and aerial perspectives, while showing less preferences for medium levels of linear and point elements in aerial perspective (Table 5). Additionally, these members showed stronger preference for a high proportion of agricultural land cover in the ground perspective.

4. Discussion

4.1. Landscape Attribute Preferences

The results of the MLM revealed that participants demonstrated modest negative preferences toward the proportion of agricultural land use in ground perspective. Previous studies have also demonstrated markedly divergent outcomes across different regions. This appeared to align with the conclusions of those studies indicating that people prefer large-scale, continuous, and striking landscapes [7,30,31,32]. Since those studies reached opposite conclusions [9,28,29], it also highlighted the geographical variability of landscape preferences.
An important finding of this study is that participants exhibited markedly different preferences in aerial perspective compared to ground perspective, showing a stronger preference for diverse landscapes with high proportion of agricultural land cover. Such difference may stem from variations in public emotional experiences from different perspectives. As previously mentioned, the ground perspective offers an immersive experience that places visitors right at the edge of a farmland, experiencing a range of sensations including auditory, olfactory, and thermal perceptions. In such settings, the sense of order, security, and familiarity in the landscape becomes particularly crucial—hence the public generally favors views with expansive, clearly visible landscapes [72,73]. In contrast, aerial perspective presents a top-down panoramic view, where the participants observe the farmland from a detached vantage point, with sensory input highly simplified to color, texture, shape, and spatial distribution. In such settings, complex and diverse topographical features and colors seem to evoke greater visual pleasure [74]. However, results in this study derived from static photographs cannot directly provide multisensory inputs of real-world agricultural landscapes, and thus may differ from those obtained in actual environmental settings.
In both the ground and aerial perspectives, participants showed strong preferences for agricultural landscapes where oilseed rape is the primary crop, suggesting that bright colors are more appealing. This finding is consistent with previous research [7,8,75,76,77].
Meanwhile, our results provide no statistically significant evidence that point elements positively influence aesthetic preferences in ground perspective. In aerial perspective, high level of point elements received a significantly negative coefficient, while the medium level was not significant. This suggests that excessive point elements may be perceived as clutter from above, rather than being visually attractive. Similarly, studies have suggested that in terms of agricultural production, point elements in landscapes could impede mechanized operations, thereby affecting productivity. From a visual perspective, elements such as trees or ponds could also disrupt the uniformity of farmland [32]. However, other studies have indicated that point elements significantly improve the visual quality of agricultural landscapes [28]. Whether point elements are viewed positively [9,28,40] or negatively [32], they have a significant impact on agricultural landscapes. Nevertheless, there is currently a research gap on point elements in agricultural landscapes [53], which highlights the need for further research in this area.
Furthermore, participants exhibited negative reactions to linear elements in ground perspective, indicating a preference for concrete ditches over ecological ditches. Considering agricultural production, ecological ditches and ridges tend to increase maintenance costs for farmers compared to their concrete counterparts. In terms of visual landscape aesthetics, concrete ditches and ridges without vegetation present a more orderly appearance. These factors may underlie the prevalent negative preference for linear elements of high-level field margin. In line with this, multiple studies have emphasized that windbreak forests can enhance the visual diversity and attractiveness of agricultural landscapes [27,78,79,80,81,82,83].
Existing research indicates that seasonality influences factors such as color and shape in agricultural landscape features [8,84]. This study focused primarily on landscapes with spring oilseed rape and wheat rotations. Future research should examine seasonal variation in agricultural landscapes to more accurately assess preferences for agricultural landscape features in landscape image-based survey studies.

4.2. Homogeneity and Heterogeneity of Landscape Preferences

Since MLM’s reliance on average utility coefficients, which tend to marginalize the preferences of specific demographic segments, LCM approaches categorize preferences in a way that recognizes the diversity among different groups, thereby providing more detailed insights for policy formulation. Our study delineated primary representative categories under both methodologies, focusing on distinct category characteristics. Interestingly, these populations exhibited contrasting preferences.
The preferences of class 2 in ground perspective which comprised 29.7% of participants and class 1 in aerial perspective comprising 10.2% of participants indicated a preference for large and intensive agricultural landscapes, as they demonstrated negative preferences for most landscape attributes. More specifically, they prefer uniformity, scale, and openness in agricultural landscapes, aligning with the aesthetic factor of “vastness” highlighted in landscape preference studies [85,86].
Meanwhile, different preferences for landscape attributes were observed between class 3 (59.4%) in ground perspective and class 2 (9.8%) in aerial perspective. The utility coefficient analysis of class 3 in ground perspective showed a preference for open yet colorful landscapes. Conversely, class 2 in aerial perspective demonstrated a positive preference for the combination of high agricultural land cover, medium levels of point elements, and medium to high levels of linear elements. This aligns with the findings of several previous studies on agricultural landscape preferences that certain combination can enhance landscape attractiveness [9,28,40,44,59]. Notably, preferences of these participants for high-level linear elements were significantly higher than those for medium-level elements, indicating a stronger inclination toward landscape features such as windbreak forests and ecological ditches with unified foreground and background.
The LCM results indicated no significant preference among the classes 3 and 4 participants in the aerial perspective. One possible explanation is that the plethora of alternatives in the experimental design may have resulted in reduced participant attention during the survey. Future studies should consider adopting an efficient design to rationalize the number of alternatives [52]. The inclusion of low-quality questionnaires, possibly due to insufficiently rigorous screening criteria, may have contributed to this phenomenon.
Landscape perceptions exhibit considerable variation between individuals and social groups, which has been confirmed by previous LCM research in agricultural landscapes [8,28,40,42]. These findings highlight the importance of considering the diverse needs of different populations in landscape management, particularly in the context of cultural ecosystem services (CES) in agricultural settings.

4.3. Influence of Socio-Cultural Characteristics

Respondents possessing higher education levels exhibited a marked disfavor towards several landscape attributes except for the type of major crop. One possible explanation related to a bias in higher education favoring agricultural scale and modernization, leading to a preference for large-scale farmland and neatly constructed concrete ditches and roads [87]. Research indicated that exposure to natural landscapes can reduce stress, enhance mood [88], and improve long-term health and well-being relative to urban environments [89]. Our study revealed that urban residents enjoying visiting agricultural landscapes had increased preferences for certain landscape attributes. This trend may be due to urbanites’ limited daily exposure to natural environments, leading to an increased desire for more natural agricultural landscapes [8,90].
Those with ties to agriculture displayed more preference for medium levels of linear and point elements in both perspectives. One possible explanation is that familiarity with specific landscapes during childhood shapes landscape preferences [62]. Additionally, individuals associated with agriculture showed a preference for landscapes dominated by oilseed rape in both perspectives, possibly due to its visually appealing bright colors [8] and higher economic value as an oilseed crop [91,92].
Similarly, individuals associated with agricultural and environmental organizations displayed specific preferences. With reference to results that were not statistically significant, it was speculated that they have a positive preference for higher levels of these attributes despite the aversion to the medium levels of these elements. In stark contrast, previous studies have found that people closely connected to agriculture prefer fewer natural landscapes [65], more intensively managed landscapes [63], or high-intensity land uses [19], regarding excessive linear and point elements as hindrances to mechanized operations. Participants in this study exhibited a significant preference for diverse landscapes, probably indicating that they place greater emphasis on the positive effects derived from elements such as crop rotation management, ecological ditches, and windbreak forests.

4.4. Relevance for Planning and Policy Making

To enhance the efficiency of agricultural land use and increase agricultural intensification and mechanization, the Chinese government has implemented land consolidation and high-standard farmland construction. Concurrently, to ensure oilseed supply, there has been a government push for oilseed and main food crop rotation. The MLM results suggest public satisfaction with landscapes shaped by these policies. First, public preference for landscapes with oilseed rape, observed in both perspectives, indicates that oil-main food crop rotation may be further promoted. Meanwhile, agricultural tourism planning may prioritize oilseed rape landscapes as the main competitive feature. Second, in the aerial perspective, there is a marked preference for linear elements with a medium-level of field margins, suggesting that the construction of windbreaks could be promoted to increase coverage. Third, given the public’s slight preference for unified, large-scale, and open agricultural landscapes in the ground perspective, agritourism planning could prioritize the preservation of visual openness along ground tourist routes. However, the small utility coefficients indicated that the formulation of policy recommendations requires further careful consideration. Future research with larger sample sizes and field validation is needed before such measures are implemented.
However, it is not sufficient to consider policy solely in terms of aesthetics. In recent decades, intensified agriculture, marked by escalated pesticide use and large-scale mechanization, has led to increased food production and global environmental degradation affecting climate, land, water, and biodiversity [93,94]. To mitigate the negative environmental impacts of agriculture, many countries have implemented policies, most notably the Agricultural Environmental Scheme (AES) in Europe, which has shown significant effectiveness and is relevant to China. Research shows that field margins contribute to natural pest control [95], pollination [96], water purification [97], soil and water conservation [83], and carbon sequestration [98]. However, there is a dearth of studies on cultural services [99,100]. Results in this study indicated that high levels of linear elements may fail to effectively attract public interest in ground perspective, but may have high aesthetic value in aerial perspective. Consequently, China can consider adopting elements of the European AES, especially in field margin management, to enhance the aesthetic value of linear elements and the multiple ecosystem services of farmland. Similarly, research has demonstrated that agricultural diversification enhances a variety of ecosystem services without affecting yields [101]. In this study, class 3 (ground perspective) and class 2 (aerial perspective) exhibited a preference for a medium to high proportion of agricultural land cover. Consequently, it may be beneficial to increase agricultural land cover in selected areas during crop rotation to promote landscape heterogeneity and amplify multiple ecosystem services.
It is noteworthy that the implementation of landscape aesthetic management ultimately rests on farmers’ decisions. Crop diversification, preservation of linear or point-like landscape features, and adjustment of rotation schemes may conflict with farmers’ economic interests and agricultural priorities. Without adequate incentives, farmers may be reluctant to alter their existing farming practices. Therefore, future research may examine farmers’ willingness to adapt and develop compensation mechanisms that balance landscape aesthetic objectives with agricultural livelihood needs.

5. Conclusions

This study employed a stated choice experiment with digitally calibrated images in Hangzhou Plain during the spring flowering period to assess public preferences for landscape attributes associated with farmland management. The MLM results, which reflect average public preferences, revealed that participants favored oilseed rape-dominated landscapes with a single agricultural land cover proportion in ground perspective, whereas in aerial perspective, they preferred diverse landscapes featuring a high proportion of agricultural land cover and abundant linear and point elements. The LCM results identified different public groups with varying preferences. The two groups with the most significant preferences in the two perspectives had contrasting preferences. Socio-cultural factors such as gender, education level, landscape familiarity, connection to agriculture, and membership in relevant organizations significantly influenced these preferences. The results suggested that the landscape shaped by current policies may align with the average preferences of the public. Promoting oilseed main food crop rotation and increasing the coverage of windbreaks on farmland can be prioritized in landscape planning, and priority can be given to landscapes dominated by oilseed rape and those with open vistas for ground agricultural tourism routes. Also, China could propose strategies for maintaining buffer zones around field margins to balance ecological and aesthetic values amidst agricultural intensification.

Author Contributions

Conceptualization, K.Z., Y.K. and K.W.; methodology, K.Z., J.L. and Y.K.; validation, K.Z. and J.L.; formal analysis, K.Z.; investigation, K.Z.; resources, K.Z.; data curation, K.Z.; writing—original draft preparation, K.Z. and Y.K.; writing—review and editing, K.Z., J.L. and K.W.; visualization, K.Z.; supervision, J.L. and K.W.; project administration, K.W. All authors have read and agreed to the published version of the manuscript.

Funding

This research received no external funding.

Data Availability Statement

Data are available from the authors upon request.

Conflicts of Interest

The authors declare no conflicts of interest.

Abbreviations

The following abbreviations are used in this manuscript:
SQDSplit questionnaire design
MLMMixed logit model
MNLMultinomial logit
LCMLatent class logit model
CESCultural ecosystem services
AESAgricultural Environmental Scheme
BICBayesian Information Criterion

Appendix A. A Survey on the Preference of Agricultural Landscapes in Hangzhou

This questionnaire was initiated to explore the public’s landscape preferences for farmland in Hangzhou.
It will take approximately 5–7 min of your time. The research findings will be of significant importance for enhancing agricultural landscapes, building the most beautiful pastoral areas, and constructing an ecological civilization. Thank you for your time and efforts dedicated to scientific research!
This questionnaire comprises three sections: (1) Agricultural landscape preference selection in ground perspective; (2) Agricultural landscape preference selection in aerial perspective; (3) Participant information. It is intended solely for scientific research purposes and has no commercial applications. All responses are anonymous, and no one will know which one corresponds to your personal answer. We encourage you to complete it thoughtfully according to your own preferences.
[Part 1] Agricultural Landscape Preference Selection in ground perspective (This section contains 9 questions, taking approximately 2–3 min. Feel free to answer based on intuition without overthinking).
The images below are composed of a background image and various landscape elements. For each set, choose your favorite from three agricultural landscapes from an aesthetic perspective.
  • [Single-choice question] *
Land 15 01103 i001
2.
[Single-choice question] *
Land 15 01103 i002
3.
[Single-choice question] *
Land 15 01103 i003
4.
[Single-choice question] *
Land 15 01103 i004
5.
[Single-choice question] *
Land 15 01103 i005
6.
[Single-choice question] *
Land 15 01103 i006
7.
[Single-choice question] *
Land 15 01103 i007
8.
[Single-choice question] *
Land 15 01103 i008
9.
[Single-choice question] *
Land 15 01103 i009
10.
[Single-choice question] *
Land 15 01103 i010
11.
[Single-choice question] *
Land 15 01103 i011
12.
[Single-choice question] *
Land 15 01103 i012
13.
[Single-choice question] *
Land 15 01103 i013
14.
[Single-choice question] *
Land 15 01103 i014
15.
[Single-choice question] *
Land 15 01103 i015
16.
[Single-choice question] *
Land 15 01103 i016
17.
[Single-choice question] *
Land 15 01103 i017
18.
[Single-choice question] *
Land 15 01103 i018
[Part 2] Farmland Landscape Preference Selection from aerial perspective (This section contains 9 questions, taking approximately 2–3 min. Feel free to answer based on intuition without overthinking.) For each set, choose your favorite from three farmland landscapes from an aesthetic perspective.
  • [Single-choice question] *
Land 15 01103 i019
2.
[Single-choice question] *
Land 15 01103 i020
3.
[Single-choice question] *
Land 15 01103 i021
4.
[Single-choice question] *
Land 15 01103 i022
5.
[Single-choice question] *
Land 15 01103 i023
6.
[Single-choice question] *
Land 15 01103 i024
7.
[Single-choice question] *
Land 15 01103 i025
8.
[Single-choice question] *
Land 15 01103 i026
9.
[Single-choice question] *
Land 15 01103 i027
10.
[Single-choice question] *
Land 15 01103 i028
11.
[Single-choice question] *
Land 15 01103 i029
12.
[Single-choice question] *
Land 15 01103 i030
13.
[Single-choice question] *
Land 15 01103 i031
14.
[Single-choice question] *
Land 15 01103 i032
15.
[Single-choice question] *
Land 15 01103 i033
16.
[Single-choice question] *
Land 15 01103 i034
17.
[Single-choice question] *
Land 15 01103 i035
18.
[Single-choice question] *
Land 15 01103 i036
[Part 3] Participant Information (This section contains 10 questions and will take approximately 1 min).
1.
Your gender: [Single-choice question] *
○ Male.○ Female.
2.
Your age: [Single-choice question] *
○ 14 years old and below.○ 15~24.
○ 25~34.○ 35~44.
○ 45~54.○ 55~64.
○ 65 years old and above.
3.
Your education level: [Single-choice question] *
○ Junior high school degree or below.
○ Senior high school degree.
○ Junior college degree.
○ University degree.
○ Master’s degree or above.
4.
Your current place of residence: [Single-choice question] *
○ Urban.○ Rural.
Your frequency of field visits: [Single-choice question] *
○ Almost none.
○ 1–3 times per year.
○ 1–3 times per quarter.
○ 1–3 times per month.
○ 1–3 times per week.
Depends on Option 1 of Question 4.
Engaged in agricultural production or not: [Single-choice question] *
○ Yes.○ No.
Depends on Option 2 of Question 4.
5.
Your connection to agriculture: [Single-choice question] *
○ Farmer.
○ Growing up in the countryside.
○ Family or friends living in the countryside.
○ No connection.
6.
Your current location: [Single-choice question] *
○ Hangzhou City.
○ Zhejiang Province (excluding Hangzhou).
○ Other regions in the country.
7.
Agriculture, environment related knowledge or not: [Single-choice question] *
○ Has undergone professional training.
○ Learned a little.
○ Never learned it.
8.
Agriculture, environment related organizations (environmental agencies, research institutes, public institutions, and environmental organizations) or not: [Single-choice question] *
○ Yes.○ No.

Appendix B

Table A1. Descriptive characteristics of participants.
CharacteristicsNumber of ParticipantsPercentageData from Yearbook
GenderFemale10647.75%47.8%
Male11652.25%52.2%
Education levelJunior high school degree or below198.52%/
Senior high school degree4118.39%
Junior college or university degree16071.75%
Master’s degree or above31.35%
Place of residenceUrban15971.30%75.5%
Rural6428.70%24.5%
Age24 years old and below146.28%33.90%
25–34 years old6930.94%
35–44 years old6529.15%38.80%
45–59 years old3616.14%
60 years old and above3917.49%27.29%
Connection to agricultureFarmer4319.28%/
Growing up in the countryside11350.67%
Family or friends living in the countryside4419.73%
No connection2310.31%
Frequency of farmland visitsAlmost none96.04%
1–3 times per year4127.52%
1–3 times per quarter7046.98%
1–3 times per month2416.11%
1–3 times per week42.68%
Agriculture, environment related knowledgeYes3716.59%
No18683.41%
Agriculture, environment related organizationsYes7533.63%
No14866.37%

Appendix C

Appendix C.1

Table A2. Conditional logit estimations for ground perspective and aerial perspective.
AttributesLevelGround PerspectiveAerial Perspective
Coeff. (p-Value)Coeff. Std. (p-Value)Coeff. (p-Value)Coeff. Std. (p-Value)
Proportion of agricultural land covermedium−0.1080.0660−0.07460.0664
high−0.125 *0.06650.02910.0664
Major types of cropsoilseed rape0.165 ***0.05440.146 ***0.0543
Linear elementsmedium−0.05600.06560.00400.0668
high−0.227 ***0.06700.141 **0.0665
Point elementsmedium0.08580.06640.05060.0657
high0.03030.0867−0.205 ***0.666
*** p-value < 0.01; ** p-value < 0.05; * p-value < 0.1.

Appendix C.2

Table A3. AIC-BIC values for latent class logit models across different classes.
Number of Categories in Ground Perspective2345
BIC4368.94330.64317.24283.9
Number of categories in aerial perspective2345
BIC4353.04328.74319.44301.4

Appendix C.3

Table A4. Comparison of latent class probabilities across different numbers of classes.
Ground PerspectiveClass1Class2Class3Class4-
2 classes0.4420.558---
3 classes0.1090.2970.594--
4 classes0.8110.0990.0440.046-
Arial perspectiveClass1Class2Class3Class4Class5
3 classes0.2270.3880.385--
4 classes0.1020.0980.5850.215-
5 classes0.2510.0130.3200.3160.099

References

  1. Garcia-Martin, M.; Huntsinger, L.; Ibarrola-Rivas, M.J.; Penker, M.; D’Ambrosio, U.; Dimopoulos, T.; Fernandez-Gimenez, M.E.; Kizos, T.; Munoz-Rojas, J.; Saito, O.; et al. Landscape products for sustainable agricultural landscapes. Nat. Food 2022, 3, 814–821. [Google Scholar] [CrossRef] [PubMed]
  2. MacLaren, C.; Mead, A.; van Balen, D.; Claessens, L.; Etana, A.; de Haan, J.; Haagsma, W.; Jaeck, O.; Keller, T.; Labuschagne, J.; et al. Long-term evidence for ecological intensification as a pathway to sustainable agriculture. Nat. Sustain. 2022, 5, 770–779. [Google Scholar] [CrossRef]
  3. Renting, H.; Rossing, W.A.; Groot, J.C.; Van der Ploeg, J.D.; Laurent, C.; Perraud, D.; Stobbelaar, D.J.; Van Ittersum, M.K. Exploring multifunctional agriculture. A review of conceptual approaches and prospects for an integrative transitional framework. J. Environ. Manag. 2009, 90, 112–123. [Google Scholar] [CrossRef] [PubMed]
  4. Wittwer, R.A.; Bender, S.F.; Hartman, K.; Hydbom, S.; Lima, R.A.A.; Loaiza, V.; Nemecek, T.; Oehl, F.; Olsson, P.A.; Petchey, O.; et al. Organic and conservation agriculture promote ecosystem multifunctionality. Sci. Adv. 2021, 7, eabg6995. [Google Scholar] [CrossRef] [PubMed]
  5. Werling, B.P.; Dickson, T.L.; Isaacs, R.; Gaines, H.; Gratton, C.; Gross, K.L.; Liere, H.; Malmstrom, C.M.; Meehan, T.D.; Ruan, L. Perennial grasslands enhance biodiversity and multiple ecosystem services in bioenergy landscapes. Proc. Natl. Acad. Sci. USA 2014, 111, 1652–1657. [Google Scholar] [CrossRef] [PubMed]
  6. He, S.; Hu, C.X.; Li, J.F.; Wu, J.Y.; Xu, Q.; Lin, L.; Zhu, C.M.; Li, Y.J.; Zhou, M.M.; Zhu, L.Y. Revealing Spatial Patterns of Cultural Ecosystem Services in Four Agricultural Landscapes: A Case Study from Hangzhou, China. Int. J. Environ. Res. Public Health 2022, 19, 9269. [Google Scholar] [CrossRef] [PubMed]
  7. He, S.; Su, Y.; Shahtahmassebi, A.R.; Huang, L.; Zhou, M.; Gan, M.; Deng, J.; Zhao, G.; Wang, K. Assessing and mapping cultural ecosystem services supply, demand and flow of farmlands in the Hangzhou metropolitan area, China. Sci. Total Environ. 2019, 692, 756–768. [Google Scholar] [CrossRef] [PubMed]
  8. Schupbach, B.; Weiss, S.B.; Jeanneret, P.; Zalai, M.; Szalai, M.; Fror, O. What determines preferences for semi-natural habitats in agrarian landscapes? A choice-modelling approach across two countries using attributes characterising vegetation. Landsc. Urban Plan. 2021, 206, 12. [Google Scholar] [CrossRef]
  9. van Zanten, B.T.; Zasada, I.; Koetse, M.J.; Ungaro, F.; Hafner, K.; Verburg, P.H. A comparative approach to assess the contribution of landscape features to aesthetic and recreational values in agricultural landscapes. Ecosyst. Serv. 2016, 17, 87–98. [Google Scholar] [CrossRef]
  10. Erickson, D.L.; Ryan, R.L.; De Young, R. Woodlots in the rural landscape: Landowner motivations and management attitudes in a Michigan (USA) case study. Landsc. Urban Plan. 2002, 58, 101–112. [Google Scholar] [CrossRef]
  11. Piorr, H.P. Environmental policy, agri-environmental indicators and landscape indicators. Agric. Ecosyst. Environ. 2003, 98, 17–33. [Google Scholar] [CrossRef]
  12. Cheng, X.; Van Damme, S.; Li, L.Y.; Uyttenhove, P. Evaluation of cultural ecosystem services: A review of methods. Ecosyst. Serv. 2019, 37, 10. [Google Scholar] [CrossRef]
  13. Dramstad, W.E.; Tveit, M.S.; Fjellstad, W.J.; Fry, G.L.A. Relationships between visual landscape preferences and map-based indicators of landscape structure. Landsc. Urban Plan. 2006, 78, 465–474. [Google Scholar] [CrossRef]
  14. Frank, S.; Fürst, C.; Koschke, L.; Witt, A.; Makeschin, F. Assessment of landscape aesthetics—Validation of a landscape metrics-based assessment by visual estimation of the scenic beauty. Ecol. Indic. 2013, 32, 222–231. [Google Scholar] [CrossRef]
  15. Schirpke, U.; Timmermann, F.; Tappeiner, U.; Tasser, E. Cultural ecosystem services of mountain regions: Modelling the aesthetic value. Ecol. Indic. 2016, 69, 78–90. [Google Scholar] [CrossRef] [PubMed]
  16. Tveit, M.S. Indicators of visual scale as predictors of landscape preference; a comparison between groups. J. Environ. Manag. 2009, 90, 2882–2888. [Google Scholar] [CrossRef] [PubMed]
  17. Lindemann-Matthies, P.; Briegel, R.; Schüpbach, B.; Junge, X. Aesthetic preference for a Swiss alpine landscape: The impact of different agricultural land-use with different biodiversity. Landsc. Urban Plan. 2010, 98, 99–109. [Google Scholar] [CrossRef]
  18. Nowak-Olejnik, A.; Mocior, E.; Hibner, J.; Tokarczyk, N. Human perceptions of cultural ecosystem services of semi-natural grasslands: The influence of plant communities. Ecosyst. Serv. 2020, 46, 101208. [Google Scholar] [CrossRef]
  19. Howley, P.; Donoghue, C.O.; Hynes, S. Exploring public preferences for traditional farming landscapes. Landsc. Urban Plan. 2012, 104, 66–74. [Google Scholar] [CrossRef]
  20. Qi, J.; Zhou, Y.M.; Zeng, L.; Tang, X.Q. Aesthetic heterogeneity on rural landscape: Pathway discrepancy between perception and cognition. J. Rural Stud. 2022, 92, 383–394. [Google Scholar] [CrossRef]
  21. Tempesta, T. The perception of agrarian historical landscapes: A study of the Veneto plain in Italy. Landsc. Urban Plan. 2010, 97, 258–272. [Google Scholar] [CrossRef]
  22. Ungaro, F.; Hafner, K.; Zasada, I.; Piorr, A. Mapping cultural ecosystem services: Connecting visual landscape quality to cost estimations for enhanced services provision. Land Use Policy 2016, 54, 399–412. [Google Scholar] [CrossRef]
  23. van Zanten, B.T.; Verburg, P.H.; Scholte, S.S.K.; Tieskens, K.F. Using choice modeling to map aesthetic values at a landscape scale: Lessons from a Dutch case study. Ecol. Econ. 2016, 130, 221–231. [Google Scholar] [CrossRef]
  24. Yang, G.Y.; Yu, Z.W.; Zhang, J.G.; Kristensen, L.S. From preference to landscape sustainability: A bibliometric review of landscape preference research from 1968 to 2019. Ecosyst. Health Sustain. 2021, 7, 18. [Google Scholar] [CrossRef]
  25. Zhou, Y.; Li, Y.; Xu, C. Land consolidation and rural revitalization in China: Mechanisms and paths. Land Use Policy 2020, 91, 104379. [Google Scholar] [CrossRef]
  26. Huang, L.; Wang, Y.H.; Zhang, F.; Fang, L.; Wu, J.G. Policy research on agriculture, rural areas, and farmers (“Sannong”) based on landscape sustainability science: Scientific foundations and core research directions. Chin. J. Appl. Ecol. 2026, 37, 647–656. [Google Scholar] [CrossRef] [PubMed]
  27. Zhang, Q.; Xiao, H.; Yu, Z.; Zhang, X.; Zheng, B.; Liu, M. Agricultural landscape and its elements assessment in plain areas of Beijing City. Chin. J. Eco.-Agric. 2014, 22, 325–332. [Google Scholar] [CrossRef]
  28. José, A.; Albaladejo-García, J.A.; Zabala, J.A.; Alcon, F.; Dallimer, M.; Martínez-Paz, J.M. Integrating socio-spatial preference heterogeneity into the assessment of the aesthetic quality of a Mediterranean agricultural landscape. Landsc. Urban Plan. 2023, 239, 104846. [Google Scholar] [CrossRef]
  29. Molnarova, K.J.; Bohnet, I.C.; Svobodova, K.; Pixova, K.C.; Daniels, M.; Skalos, J.; Drhlikova, K.; Azadi, H.; Zamecnik, R.; Sklenicka, P. Does Increasing Farm Plot Size Influence the Visual Quality of Everyday Agricultural Landscapes? Int. J. Environ. Res. Public Health 2023, 20, 687. [Google Scholar] [CrossRef]
  30. Kaplan, R.; Herbert, E.J. Cultural and sub-cultural comparisons in preferences for natural settings. Landsc. Urban Plan. 1987, 14, 281–293. [Google Scholar] [CrossRef]
  31. Li, Y.; Xie, L.; Zhang, L.; Huang, L.; Lin, Y.; Su, Y.; AmirReza, S.; He, S.; Zhu, C.; Li, S.; et al. Understanding different cultural ecosystem services: An exploration of rural landscape preferences based on geographic and social media data. J. Environ. Manag. 2022, 317, 115487. [Google Scholar] [CrossRef] [PubMed]
  32. Tang, Q.; Feng, S.; Liang, G.F.; Ding, S.Y. Landscape preference of different stakeholders in highly intensive farming agricultural landscape. Chin. J. Appl. Ecol. 2018, 29, 2633–2640. [Google Scholar] [CrossRef]
  33. Sun, Y.H.; Yang, C.D.; Chen, T.; Guo, H.C. A Study on the Actual and Future Development of China’s Agritourism. Econ. Geogr. 2007, 27, 835–839. [Google Scholar]
  34. Tan, M.H. The Transition of Farmland Production Functions in Metropolitan Areas in China. Sustainability 2014, 6, 4028–4041. [Google Scholar] [CrossRef]
  35. Huang, L.; Qiu, J.; Wu, J. Promoting urban-rural landscape sustainability through geodesign. Landsc. Ecol. 2024, 39, 179. [Google Scholar] [CrossRef]
  36. Daniel, T.C.; Muhar, A.; Arnberger, A.; Aznar, O.; Boyd, J.W.; Chan, K.M.A.; Costanza, R.; Elmqvist, T.; Flint, C.G.; Gobster, P.H.; et al. Contributions of cultural services to the ecosystem services agenda. Proc. Natl. Acad. Sci. USA 2012, 109, 8812–8819. [Google Scholar] [CrossRef] [PubMed]
  37. Lin, J.Y.; Chen, C.Z.; Feng, T.; Huo, S.G.; Zhang, K.X.; Dong, B.Y.; Xiang, S.S.; Wang, K.; Huang, L. Exploring the potential of generative AI to complement multi-stakeholder landscape preference assessment. Landsc. Urban Plan. 2026, 270, 105602. [Google Scholar] [CrossRef]
  38. Hermes, J.; Albert, C.; von Haaren, C. Assessing the aesthetic quality of landscapes in Germany. Ecosyst. Serv. 2018, 31, 296–307. [Google Scholar] [CrossRef]
  39. Ebenberger, M.; Arnberger, A. Exploring visual preferences for structural attributes of urban forest stands for restoration and heat relief. Urban For. Urban Green. 2019, 41, 272–282. [Google Scholar] [CrossRef]
  40. Schaak, H.; Musshoff, O. Public preferences for pasture landscapes in Germany-A latent class analysis of a nationwide discrete choice experiment. Land Use Policy 2020, 91, 10. [Google Scholar] [CrossRef]
  41. Louviere, J.J.; Hensher, D.A.; Swait, J.D.; Adamowicz, W. Stated Choice Methods: Analysis and Applications; Cambridge University Press: Cambridge, UK, 2000; pp. 20–33. [Google Scholar] [CrossRef]
  42. Arnberger, A.; Eder, R. Exploring the heterogeneity of rural landscape preferences: An image-based latent class approach. Landsc. Res. 2011, 36, 19–40. [Google Scholar] [CrossRef]
  43. Hafner, K.; Zasada, I.; van Zanten, B.T.; Ungaro, F.; Koetse, M.; Piorr, A. Assessing landscape preferences: A visual choice experiment in the agricultural region of Markische Schweiz, Germany. Landsc. Res. 2018, 43, 846–861. [Google Scholar] [CrossRef]
  44. Rambonilaza, M.; Dachary-Bernard, J. Land-use planning and public preferences: What can we learn from choice experiment method? Landsc. Urban Plan. 2007, 83, 318–326. [Google Scholar] [CrossRef]
  45. Yang, C.; Li, M.-Y.; Li, T.; Ren, F.; Li, D.-P.; Chen, L.-A. Scenic Beauty Evaluation of Forests with Autumn-Colored Leaves from Aerial and Ground Perspectives: A Case Study in Qixia Mountain in Nanjing, China. Forests 2023, 14, 542. [Google Scholar] [CrossRef]
  46. Török, Á.; Nguyen, T.P.; Kolozsvári, O.; Buchanan, R.J.; Nadasdy, Z. Reference Frames in Virtual Spatial Navigation are Viewpoint Dependent. Front. Hum. Neurosci. 2014, 8, 646. [Google Scholar] [CrossRef] [PubMed]
  47. The Central People’s Government of the People’s Republic of China. Action Plan for Integrated Development of Culture and Tourism with Civil Aviation Industry. Available online: https://www.gov.cn/zhengce/zhengceku/202512/content_7050156.htm (accessed on 26 March 2026).
  48. Chinese Society of Aeronautics and Astronautics. 2024 Low-Altitude Economy Scenario White Paper. Available online: https://csaa.org.cn/c/2025-07-10/616914.shtml (accessed on 26 March 2026).
  49. Jeanneret, P.; Aviron, S.; Alignier, A.; Lavigne, C.; Helfenstein, J.; Herzog, F.; Kay, S.; Petit, S. Agroecology landscapes. Landsc. Ecol. 2021, 36, 2235–2257. [Google Scholar] [CrossRef] [PubMed]
  50. Bureau of Hangzhou Statistics. Hangzhou Statistical Yearbook 2025. Available online: https://tjj.hangzhou.gov.cn/col/col1229453592/index.html (accessed on 23 January 2026).
  51. Hangzhou Municipal People’s Government. Public Information on Rural Revitalization. Available online: https://www.hangzhou.gov.cn/col/col1228974520/index.html (accessed on 23 January 2026).
  52. Hensher, D.A.; Rose, J.M.; Greene, W.H. Applied Choice Analysis, 2nd ed.; Cambridge University Press: Cambridge, UK, 2015; pp. 189–319. [Google Scholar] [CrossRef]
  53. van Zanten, B.T.; Verburg, P.H.; Koetse, M.J.; van Beukering, P.J.H. Preferences for European agrarian landscapes: A meta-analysis of case studies. Landsc. Urban Plan. 2014, 132, 89–101. [Google Scholar] [CrossRef]
  54. Marshall, E.J.R.; Moonen, A.C. Field margins in northern Europe: Their functions and interactions with agriculture. Agric. Ecosyst. Environ. 2002, 89, 5–21. [Google Scholar] [CrossRef]
  55. van der Zanden, E.H.; Verburg, P.H.; Mücher, C.A. Modelling the spatial distribution of linear landscape elements in Europe. Ecol. Indic. 2013, 27, 125–136. [Google Scholar] [CrossRef]
  56. Riggs, J.F.; Hale, D.; Widmier, S.; Tidwell-Riggs, S. Randomized, Multicenter, Parallel-Arm (RMPA) research trial design: A potential solution to survey length, response rate and data quality in social science research. J. Mark. Anal. 2023, 11, 577–586. [Google Scholar] [CrossRef]
  57. Lin, C.; Peng, J.; Qin, Y.; Li, Y.; Yang, Y. Optimal Integrating Learning for Split Questionnaire Design Type Data. J. Comput. Graph. Stat. 2023, 32, 1009–1023. [Google Scholar] [CrossRef]
  58. Rust, N.A.; Rehackova, L.; Naab, F.; Abrams, A.; Hughes, C.; Merkle, B.G.; Clark, B.; Tindale, S. What does the UK public want farmland to look like? Land Use Policy 2021, 106, 105445. [Google Scholar] [CrossRef]
  59. van Berkel, D.B.; Verburg, P.H. Spatial quantification and valuation of cultural ecosystem services in an agricultural landscape. Ecol. Indic. 2014, 37, 163–174. [Google Scholar] [CrossRef]
  60. Lin, J.; Huang, L.; Zheng, Y.H.; Chen, C.Z.; Li, W.; Wang, K.; Qiu, J.X. Integrating ecosystem services, stakeholders’ perspective, and land-use scenarios to safeguard sustainability of the Mulberry-Dyke and Fish-Pond System. Landsc. Ecol. 2024, 39, 127. [Google Scholar] [CrossRef]
  61. Yu, K. Cultural variations in landscape preference: Comparisons among Chinese sub-groups and Western design experts. Landsc. Urban Plan. 1995, 32, 107–126. [Google Scholar] [CrossRef]
  62. Adevi, A.A.; Grahn, P. Preferences for Landscapes: A Matter of Cultural Determinants or Innate Reflexes that Point to Our Evolutionary Background? Landsc. Res. 2012, 37, 27–49. [Google Scholar] [CrossRef]
  63. van den Berg, A.E.; Vlek, C.A.J.; Coeterier, J.F. Group Differences in the Aesthetic Evaluation of Nature Development Plans: A Multilevel Approach. J. Environ. Psychol. 1998, 18, 141–157. [Google Scholar] [CrossRef]
  64. Kaltenborn, B.P.; Bjerke, T. Associations between environmental value orientations and landscape preferences. Landsc. Urban Plan. 2002, 59, 1–11. [Google Scholar] [CrossRef]
  65. Soini, K.; Vaarala, H.; Pouta, E. Residents’ sense of place and landscape perceptions at the rural–urban interface. Landsc. Urban Plan. 2012, 104, 124–134. [Google Scholar] [CrossRef]
  66. SoJump. Available online: https://www.wjx.cn/ (accessed on 23 January 2026).
  67. Bureau of Zhejiang Statistics. Zhejiang Statistical Yearbook 2025. Available online: https://tjj.zj.gov.cn/col/col1525563/index.html (accessed on 23 January 2026).
  68. Cohen, J. Statistical Power Analysis for the Behavioral Sciences, 2nd ed.; Lawrence Erlbaum Associates: Hillsdale, NJ, USA, 1988; p. 567. [Google Scholar]
  69. Train, K.E. Discrete Choice Methods with Simulation; Cambridge University Press: Cambridge, UK, 2009. [Google Scholar]
  70. Kamakura, W.A.; Russell, G.J. A probabilistic choice model for market segmentation and elasticity structure. J. Mark. Res. 1989, 26, 379–390. [Google Scholar] [CrossRef]
  71. Sarrias, M.; Daziano, R.A. Individual-specific point and interval conditional estimates of latent class logit parameters. J. Choice Model. 2018, 27, 50–61. [Google Scholar] [CrossRef]
  72. Franěk, M. Landscape Preference: The Role of Attractiveness and Spatial Openness of the Environment. Behav. Sci. 2023, 13, 666. [Google Scholar] [CrossRef] [PubMed]
  73. Sun, Y.N.; Zhao, X.; Wang, Y.H.; Li, F.Z.; Li, X. Study on the visual evaluation preference of rural landscape based on VR panorama. J. Beijing For. Univ. 2016, 38, 104–112. [Google Scholar]
  74. Kuper, R. Evaluations of landscape preference, complexity, and coherence for designed digital landscape models. Landsc. Urban Plan. 2017, 157, 407–421. [Google Scholar] [CrossRef]
  75. Graves, R.A.; Pearson, S.M.; Turner, M.G. Species richness alone does not predict cultural ecosystem service value. Proc. Natl. Acad. Sci. USA 2017, 114, 3774–3779. [Google Scholar] [CrossRef] [PubMed]
  76. Junge, X.; Jacot, K.A.; Bosshard, A.; Lindemann-Matthies, P. Swiss people’s attitudes towards field margins for biodiversity conservation. J. Nat. Conserv. 2009, 17, 150–159. [Google Scholar] [CrossRef]
  77. Wang, H.; Zhan, J.; Wang, C.; Blinov, O.A.; Asiedu Kumi, M.; Liu, W.; Chu, X.; Teng, Y.; Liu, H.; Yang, Z.; et al. Integrating Agricultural and Ecotourism Development: A Crop Cultivation Suitability Framework Considering Tourists’ Landscape Preferences in Qinghai Province, China. Remote Sens. 2023, 15, 4685. [Google Scholar] [CrossRef]
  78. Borin, M.; Passoni, M.; Thiene, M.; Tempesta, T. Multiple functions of buffer strips in farming areas. Eur. J. Agron. 2010, 32, 103–111. [Google Scholar] [CrossRef]
  79. Grala, R.K.; Tyndall, J.C.; Mize, C.W. Impact of field windbreaks on visual appearance of agricultural lands. Agrofor. Syst. 2010, 80, 411–422. [Google Scholar] [CrossRef]
  80. Grala, R.K.; Tyndall, J.C.; Mize, C.W. Willingness to pay for aesthetics associated with field windbreaks in Iowa, United States. Landsc. Urban Plan. 2012, 108, 71–78. [Google Scholar] [CrossRef]
  81. Montgomery, I.; Caruso, T.; Reid, N. Hedgerows as Ecosystems: Service Delivery, Managemen. Annu. Rev. Ecol. Evol. Syst. 2020, 51, 81–102. [Google Scholar] [CrossRef]
  82. Smith, M.M.; Bentrup, G.; Kellerman, T.; MacFarland, K.; Straight, R.; Ameyaw, L. Windbreaks in the United States: A systematic review of producer-reported benefits, challenges, management activities and drivers of adoption. Agric. Syst. 2021, 187, 14. [Google Scholar] [CrossRef]
  83. Weninger, T.; Scheper, S.; Lackoova, L.; Kitzler, B.; Gartner, K.; King, N.W.; Cornelis, W.; Strauss, P.; Michel, K. Ecosystem services of tree windbreaks in rural landscapes-a systematic review. Environ. Res. Lett. 2021, 16, 103002. [Google Scholar] [CrossRef]
  84. Junge, X.; Schuepbach, B.; Walter, T.; Schmid, B.; Lindemann-Matthies, P. Aesthetic quality of agricultural landscape elements in different seasonal stages in Switzerland. Landsc. Urban Plan. 2015, 133, 67–77. [Google Scholar] [CrossRef]
  85. Vouligny, É.; Domon, G.; Ruiz, J. An assessment of ordinary landscapes by an expert and by its residents: Landscape values in areas of intensive agricultural use. Land Use Policy 2009, 26, 890–900. [Google Scholar] [CrossRef]
  86. Zhou, R.; Huang, L.; Wang, K.; Hu, W. From Productive Landscape to Agritouristic Landscape? The Evidence of an Agricultural Heritage System—Zhejiang Huzhou Mulberry-Dyke and Fish-Pond System. Land 2023, 12, 1066. [Google Scholar] [CrossRef]
  87. Stilma, E.S.C.; Smit, A.B.; Geerling-Eiff, F.A.; Struik, P.C.; Vosman, B.; Korevaar, H. Perception of biodiversity in arable production systems in the Netherlands. NJAS-Wagening. J. Life Sci. 2009, 56, 391–404. [Google Scholar] [CrossRef]
  88. Bratman, G.N.; Hamilton, J.P.; Daily, G.C. The impacts of nature experience on human cognitive function and mental health. Ann. N. Y. Acad. Sci. 2012, 1249, 118–136. [Google Scholar] [CrossRef] [PubMed]
  89. Velarde, M.D.; Fry, G.; Tveit, M. Health effects of viewing landscapes–Landscape types in environmental psychology. Urban For. Urban Green. 2007, 6, 199–212. [Google Scholar] [CrossRef]
  90. Ode, A.; Fry, G.; Tveit, M.S.; Messager, P.; Miller, D. Indicators of perceived naturalness as drivers of landscape preference. J. Environ. Manag. 2009, 90, 375–383. [Google Scholar] [CrossRef] [PubMed]
  91. Junge, X.; Lindemann-Matthies, P.; Hunziker, M.; Schüpbach, B. Aesthetic preferences of non-farmers and farmers for different land-use types and proportions of ecological compensation areas in the Swiss lowlands. Biol. Conserv. 2011, 144, 1430–1440. [Google Scholar] [CrossRef]
  92. Tahvanainen, L.; Ihalainen, M.; Hietala-Koivu, R.; Kolehmainen, O.; Tyrväinen, L.; Nousiainen, I.; Helenius, J. Measures of the EU Agri-Environmental Protection Scheme (GAEPS) and their impacts on the visual acceptability of Finnish agricultural landscapes. J. Environ. Manag. 2002, 66, 213–227. [Google Scholar] [CrossRef]
  93. Foley, J.A.; Defries, R.; Asner, G.P.; Barford, C.; Bonan, G.; Carpenter, S.R.; Chapin, F.S.; Coe, M.T.; Daily, G.C.; Gibbs, H.K.; et al. Global consequences of land use. Science 2005, 309, 570–574. [Google Scholar] [CrossRef] [PubMed]
  94. Foley, J.A.; Ramankutty, N.; Brauman, K.A.; Cassidy, E.S.; Gerber, J.S.; Johnston, M.; Mueller, N.D.; O’Connell, C.; Ray, D.K.; West, P.C.; et al. Solutions for a cultivated planet. Nature 2011, 478, 337–342. [Google Scholar] [CrossRef] [PubMed]
  95. Bischoff, A.; Pollier, A.; Tricault, Y.; Plantegenest, M.; Chauvel, B.; Franck, P.; Gardarin, A. A multi-site experiment to test biocontrol effects of wildflower strips in different French climate zones. Basic Appl. Ecol. 2022, 62, 33–44. [Google Scholar] [CrossRef]
  96. Lowe, E.B.; Groves, R.; Gratton, C. Field edge flower plantings have variable effects on wild bee abundance, richness, nesting success, and crop pollination, independent of the surrounding landscape. Agr. Ecosyst. Environ. 2024, 362, 108811. [Google Scholar] [CrossRef]
  97. Sheppard, S.C.; Sheppard, M.I.; Long, J.; Sanipelli, B.; Tait, J. Runoff phosphorus retention in vegetated field margins on flat landscapes. Can. J. Soil Sci. 2006, 86, 871–884. [Google Scholar] [CrossRef]
  98. Biffi, S.; Chapman, P.J.; Grayson, R.P.; Ziv, G. Soil carbon sequestration potential of planting hedgerows in agricultural landscapes. J. Environ. Manag. 2022, 307, 114484. [Google Scholar] [CrossRef] [PubMed]
  99. Bullock, J.M.; McCracken, M.E.; Bowes, M.J.; Chapman, R.E.; Graves, A.R.; Hinsley, S.A.; Hutchins, M.G.; Nowakowski, M.; Nicholls, D.J.E.; Oakley, S.; et al. Does agri-environmental management enhance biodiversity and multiple ecosystem services?: A farm-scale experiment. Agr. Ecosyst. Environ. 2021, 320, 13. [Google Scholar] [CrossRef]
  100. Mkenda, P.A.; Ndakidemi, P.A.; Mbega, E.; Stevenson, P.C.; Arnold, S.E.J.; Gurr, G.M.; Belmain, S.R. Multiple ecosystem services from field margin vegetation for ecological sustainability in agriculture: Scientific evidence and knowledge gaps. PeerJ 2019, 7, e8091. [Google Scholar] [CrossRef] [PubMed]
  101. Tamburini, G.; Bommarco, R.; Wanger, T.C.; Kremen, C.; van der Heijden, M.G.A.; Liebman, M.; Hallin, S. Agricultural diversification promotes multiple ecosystem services without compromising yield. Sci. Adv. 2020, 6, eaba1715. [Google Scholar] [CrossRef] [PubMed]
Figure 1. Location of the study area.
Land 15 01103 g001
Figure 2. (ac): Ground perspective; (df): aerial perspective. The code on each alternative indicates the combination of attribute levels set in Table 1. 0-0-0-0: single cover of the proportion of agricultural land cover, wheat as the major type of crops, low level of linear elements, and low level of point elements.
Land 15 01103 g002
Figure 3. The overall preference for agricultural landscapes in the Hangzhou Plain from ground (left) and aerial (right) perspectives.
Land 15 01103 g003
Figure 4. Gclasses 2 and 3 represented the visualized images of the ground perspective of classes 2 and 3, respectively. Lclasses 1 and 2 denoted the visualized images from the aerial perspective of classes 1 and 2, respectively.
Land 15 01103 g004
Table 1. Description of the landscape attribute.
AttributesLevelDescriptionRepresentation of Ground PerspectiveRepresentation of Aerial PerspectiveHypothesized Effect on Aesthetic PreferenceSource
Proportion of agricultural land cover0single coverOnly one cropOnly one crop/ 1[8,9,28,53]
1mediumProportion of minor crops less than 30%Proportion of minor crops less than 30%+
2highProportion of minor crops greater than 30% less than 50%Proportion of minor crops greater than 30% less than 50%+
Major types of crops0wheatMajor crop grown is wheatMajor crop grown is wheat/Outline of the 14th Five-Year Plan (2021–2025) for National Economic and Social Development and Vision 2035 of the People’s Republic of China.
1oilseed rapeMajor crop grown is oilseed rapeMajor crop grown is oilseed rape+
Linear elements0lowNo visible linear elementsNo visible linear elements/The National Plan for the Construction of High-standard Farmland (2021–2030); Standard for planning and design of ecological engineering for land consolidation and rehabilitation;
[8,9,27,28,40,53,55]
1mediumLinear vegetation, including windbreaks and vegetative cover roadside in the backgroundLinear vegetation in the middle ground+
2highLinear vegetation, including windbreaks and vegetative cover roadside both in background and foregroundLinear vegetation in the fore-, middle and background+
Point elements0lowNo visible point elementNo visible point element/[8,9,27,28,40,53]
1medium4 shrubs3 bushes and 1 pond+
2high6 shrubs, 1 tree4 bushes and 3 ponds+
1 /: Using level 0 as the baseline to hypothesize the impact of levels 1 and 2; +: Lead to higher preference compared with level 0.
Table 2. Classification of participants’ socio-cultural explanatory variables.
VariableValues
Gender0: male1: female
Education level0: low education (senior high school degree or below)1: high education (junior college/university degree or above)
Rural/urban place of residence0: rural1: urban
Landscape familiarity0: not familiar1: familiar
Connection to agriculture0: not related to farming1: related to farming
Related organizations0: no1: yes
Table 3. Mixed logit estimations for ground perspective and aerial perspective; higher coefficients correspond to higher preference.
AttributesLevelGround PerspectiveAerial Perspective
Coeff. (p-Value)Coeff. Std. (p-Value)Coeff. (p-Value)Coeff. Std. (p-Value)
Proportion of agricultural land covermedium−0.120 *0.0696−0.04130.0765
high−0.178 *0.09120.07310.0977
Major types of cropsoilseed rape0.136 **0.06120.172 **0.0691
Linear elementsmedium−0.02930.07490.02050.0850
high−0.236 ***0.07680.07700.0936
Point elementsmedium0.07340.07400.05900.0783
high0.03170.0703−0.303 *0.155
*** p-value < 0.01; ** p-value < 0.05; * p-value < 0.1.
Table 4. Coefficients of the latent class models for ground view and aerial view.
Ground PerspectiveClass1Class2Class3-
Latent class probability0.109 ***0.297 ***0.594 ***-
AttributeslevelCoefficientStandard errorCoefficientStandard errorCoefficientStandard error--
Proportion of agricultural land covermedium−0.4190.577−0.1330.08410.1650.321--
high−0.8050.646−0.203 **0.09280.2140.369--
Major types of cropsoilseed rape2.100 ***0.7020.230 ***0.0837−1.080 ***0.346--
Linear elementsmedium−0.1370.531−0.04280.0947−0.1650.433--
high−27.561124.728−0.08460.0936−0.950 ***0.364--
Point elementsmedium0.3100.7250.193 **0.0866−1.071 **0.478--
high1.164 *0.6290.147 *0.0765−1.256 *0.704--
Aerial perspectiveClass1Class2Class3Class4
Latent class probability0.102 ***0.098 ***0.585 ***0.215 ***
AttributeslevelCoefficientStandard errorCoefficientStandard errorCoefficientStandard errorCoefficientStandard error
Proportion of agricultural land covermedium−0.1540.2301.654 *0.910−13.87094.4230.3010.269
high−0.2500.3722.409 **1.1920.8110.8310.6060.395
Major types of cropsoilseed rape0.315 **0.125−0.5510.400−1.0320.929−0.1040.405
Linear elementsmedium0.2400.188−2.181 ***0.8100.3951.000−0.3090.723
high0.271 *0.1570.959 **0.38014.94094.420−0.6360.827
Point elementsmedium−0.02240.1521.829 **0.799−13.11894.4200.1880.254
high−0.208 *0.1101.284 **0.6081.0351.063−0.2390.268
*** p-value < 0.01; ** p-value < 0.05; * p-value < 0.1.
Table 5. The effects of individual socio-cultural explanatory variables on preferences for landscape attributes.
Socio-Cultural Explanatory VariablesAttributeLevelModel Coefficient (Ground Perspective)Model Coefficient (Aerial Perspective)
GenderProportion of agricultural land covermediumn.s. 1n.s.
high−0.126 *n.s.
Major types of cropsoilseed rape−0.152 **n.s.
Linear elementsmediumn.s.−0.217 **
highn.s.n.s.
Point elementsmediumn.s.0.144 *
highn.s.n.s.
Education levelProportion of agricultural land covermediumn.s.n.s.
highn.s.n.s.
Major types of cropsoilseed rape0.173 **0.160 **
Linear elementsmediumn.s.n.s.
high−0.271 *n.s.
Point elementsmediumn.s.n.s.
highn.s.−0.407 ***
Frequency of visitsProportion of agricultural land covermediumn.s.n.s.
highn.s.n.s.
Major types of cropsoilseed rapen.s.0.208 *
Linear elementsmedium−0.128 *−0.175 **
high0.203 **n.s.
Point elementsmediumn.s.n.s.
highn.s.n.s.
Connection to agricultureProportion of agricultural land covermediumn.s.n.s.
highn.s.n.s.
Major types of cropsoilseed rape0.120 *0.0974 *
Linear elementsmediumn.s.0.208 *
highn.s.n.s.
Point elementsmedium0.176 **n.s.
highn.s.n.s.
Related organizationsProportion of agricultural land covermediumn.s.−0.184 **
high0.175 **n.s.
Major types of cropsoilseed rapen.s.n.s.
Linear elementsmediumn.s.−0.165 *
high0.173 *0.256 ***
Point elementsmediumn.s.−0.186 **
highn.s.n.s.
1 n.s. = non-significant interaction that was excluded from the model. *** p-value < 0.01; ** p-value < 0.05; * p-value < 0.1.
Disclaimer/Publisher’s Note: The statements, opinions and data contained in all publications are solely those of the individual author(s) and contributor(s) and not of MDPI and/or the editor(s). MDPI and/or the editor(s) disclaim responsibility for any injury to people or property resulting from any ideas, methods, instructions or products referred to in the content.