Article

The Effect of Simulated Precipitation Changes on the Recovery of Soil Water Infiltration Characteristics in Grasslands in the Loess Hilly Region


1
College of Animal Science and Technology, Tarim University, Alar 843300, China
2
College of Grassland Agriculture, Northwest A&F University, Xianyang 712100, China
3
College of Soil and Water Conservation Science and Engineering, Northwest A&F University, Xianyang 712100, China
*
Author to whom correspondence should be addressed.
Land 2026, 15(6), 1104; https://doi.org/10.3390/land15061104
Submission received: 20 May 2026 / Revised: 12 June 2026 / Accepted: 17 June 2026 / Published: 22 June 2026

Abstract

Current climate change has led to significant changes in precipitation patterns in the Loess Hilly Region, resulting in frequent extreme rainfall events, which have a significant impact on restoring the soil hydrological function of grasslands in this area. This study focuses on the restoration of grasslands through the conversion of farmland in the Loess Hilly Region. Using natural rainfall as the control, seven precipitation gradient treatments were established with rainout shelters: +20%, +40%, and +60% rainfall increases, and −20%, −40%, and −60% rainfall decreases. The changes in infiltration characteristics were then analyzed. Long-term increased rainfall promoted vegetation restoration and improved soil physicochemical properties. Compared with the natural rainfall control, the +20%, +40%, and +60% rainfall increase treatments enhanced the total porosity of the 0–5 cm soil layer by 0.29%, 4.64%, and 3.18%, respectively, and increased the soil organic carbon content by 28.42%, 62.46%, and 63.16%, respectively. Soil infiltration rate was also enhanced accordingly. Relative to the steady-state infiltration rate of the control (4.76 mm/min), the +20%, +40%, and +60% treatments increased the rate by 1.13%, 16.67%, and 22.54%, respectively, with the +60% treatment achieving the highest steady-state infiltration rate of 5.83 mm/min. The macroaggregate content in the +40% treatment was 47.70%, which was significantly higher than that in the other treatments. The increase in infiltration was related to the increase in total porosity, organic carbon, and the content and stability of large aggregates. Moderate rainfall increases can promote organic carbon accumulation and the formation of large aggregates, enhancing soil infiltration capacity; however, rainfall intensities exceeding 60% can damage the soil structure, and infiltration no longer significantly increases.

1. Introduction

Global warming is expected to cause significant changes in the spatiotemporal patterns of precipitation, including changes in precipitation amounts, intervals between precipitation events, and seasonal distribution [1]. Previous studies have indicated that annual precipitation will increase significantly in most parts of China [2], and extreme precipitation events are also on the rise [3]. In 2021, the IPCC’s Sixth Assessment Report stated that “Human activities have unequivocally contributed to global warming, with the global average temperature increasing by approximately 1.09 °C from pre-industrial levels between 2011 and 2020, and are making extreme climate events, including heavy precipitation and droughts, more frequent and severe.” The Loess Plateau, located in China, has a harsh climate with little rainfall, concentrated summer precipitation and frequent heavy rainstorms. It is one of the regions with the most severe soil erosion in the world [4,5]. Existing research has shown that the intensity of rainstorms in the Loess Plateau region is on an increasing trend [6], which implies that the precipitation patterns in the region will undergo significant changes, directly affecting the dynamic balance of soil moisture there. Soil moisture is a key limiting factor for vegetation recovery and regrowth; in particular, vegetation recovery in arid regions is constrained by local precipitation conditions. The dynamic changes in soil moisture not only determine the growth and recovery of vegetation, but also inevitably pose ecological security issues in the watershed, potentially leading to increased soil erosion and deterioration of the ecological environment [7].
Soil infiltration influences the distribution and movement of water within the soil and, to a certain extent, determines the degree to which the soil is susceptible to erosion by precipitation [8]. Therefore, it is extremely important to enhance soil infiltration capacity as much as possible [9]. Numerous studies have confirmed that vegetation restoration can enhance soil infiltration capacity [10,11,12]. As ground vegetation cover increases, the improvement in soil quality becomes more pronounced; under the same rainfall conditions, soil erosion has been significantly reduced compared to previous levels [13]. Changes in surface vegetation cover directly affect the physical and chemical properties of the soil, thereby influencing its infiltration capacity [14]. However, changes in precipitation patterns will inevitably alter soil moisture conditions in the Loess Plateau, which in turn will change the surface vegetation cover and inevitably have a significant impact on soil infiltration capacity [15,16]. In recent decades, changes in climate and precipitation patterns have affected vegetation restoration [17,18], and population dynamics may undergo dramatic fluctuations in response to changing climatic conditions [19,20].
Currently, most related studies focus on spatiotemporal changes in vegetation communities and microbial diversity along natural precipitation gradients, with only a few addressing soil infiltration rate [6]. Infiltration process studies also largely rely on indoor artificial rainfall simulation experiments, which are small in scale and detached from natural vegetation cover and natural rainfall backgrounds. Existing research lacks long-term, in situ, multi-gradient precipitation manipulation experiments, particularly systematic assessments of soil infiltration capacity in naturally restored grasslands. Therefore, against the backdrop of changing precipitation patterns, it is essential to investigate the response of soil infiltration capacity to precipitation gradient changes in the hilly region of the Loess Plateau. This study takes abandoned farmland restored to grassland in the Yanhe River watershed of the hilly Loess Plateau as the research object, uses a rainout shelter system to simulate different precipitation gradients, and examines the mechanisms by which different precipitation gradients affect soil infiltration, with a view to providing a reference for vegetation restoration and reconstruction in the hilly region of the Loess Plateau under future global climate change.

2. Materials and Methods

2.1. Study Sites

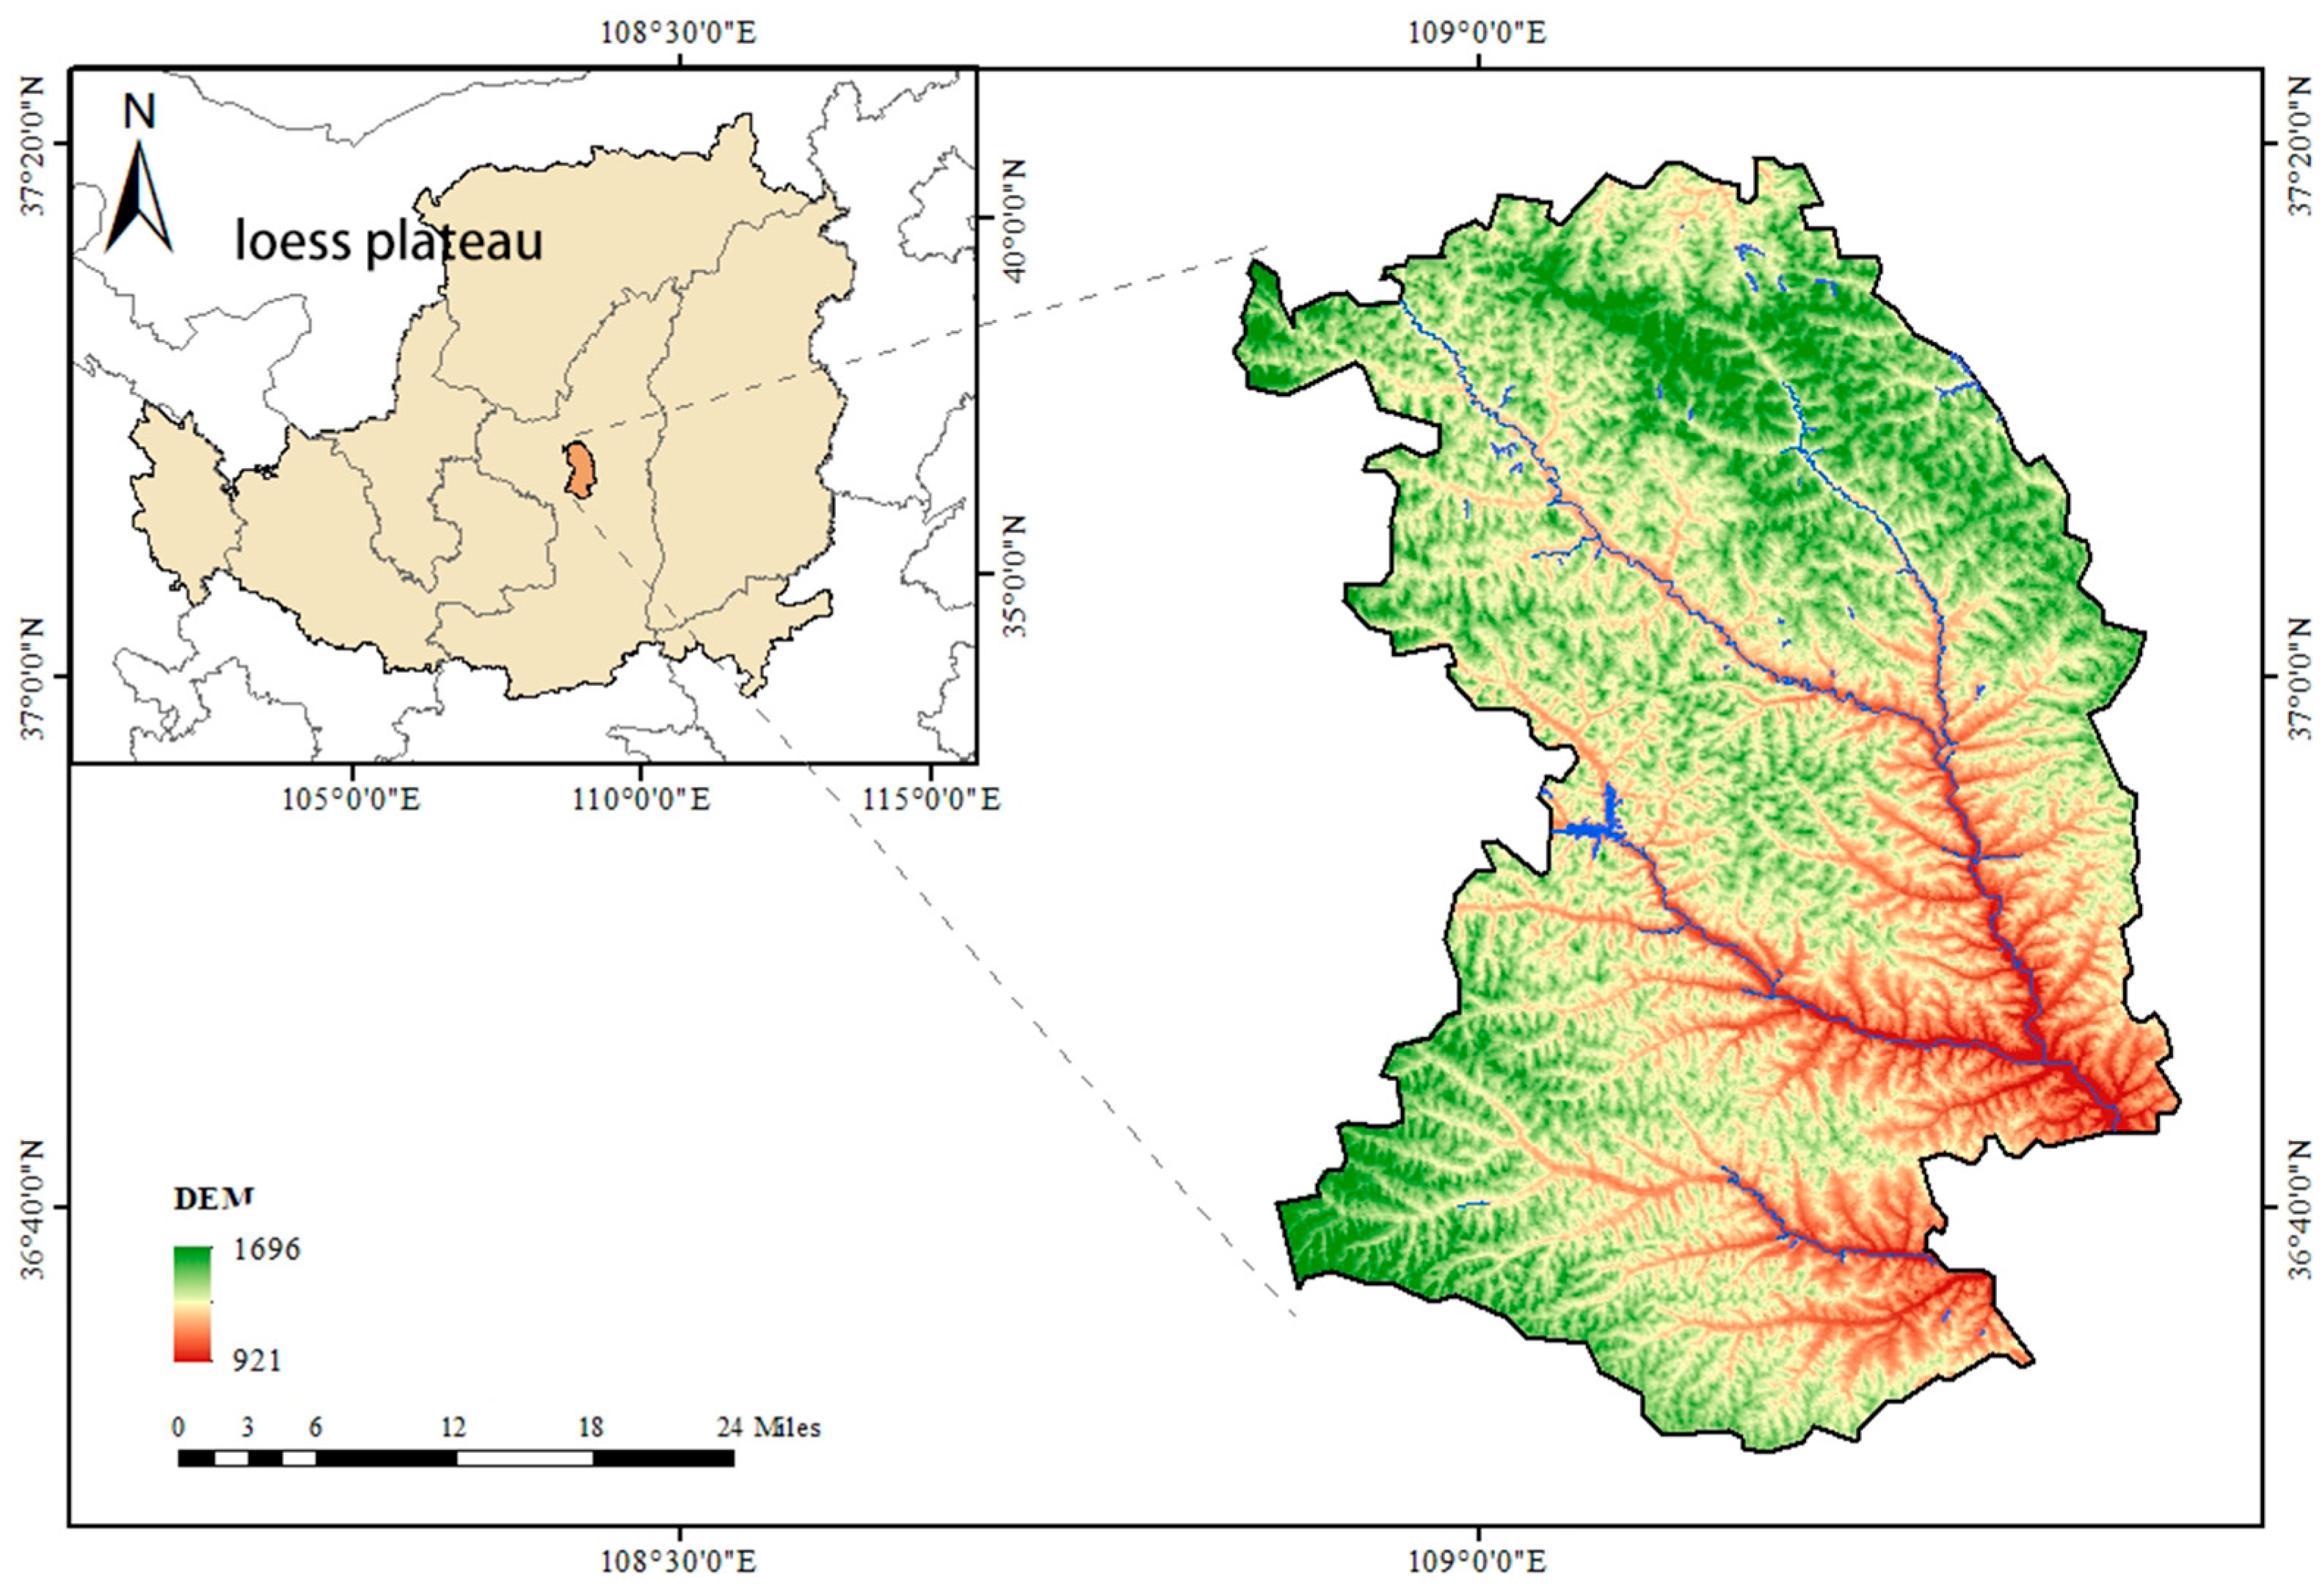
The study area is located at the Yan’an Ansai Comprehensive Soil and Water Conservation Experimental Station (108°51′44″–109°26′18″ E, 36°30′45″–37°19′3″ N), which lies in the transition zone between the warm-temperate semi-humid and semi-arid climates of the central Loess Plateau (Figure 1). The annual average temperature is 8.8 °C. The long-term mean annual precipitation in the study area is approximately 500 mm, and the annual precipitation in 2024 was 502 mm. Precipitation is unevenly distributed both interannually and intra-annually, with most rainfall concentrated in July through September. According to the FAO classification system, the soil types include Calcaric Regosol; it is loose and has poor erosion resistance, resulting in severe soil erosion. The vegetation is found in a forest-steppe zone where warm-temperate deciduous broadleaf forests transition into grasslands; the herbaceous plants are primarily from the Asteraceae, Fabaceae, and Poaceae families. Artemisia capillaris, Ixeris denticulata, Youngia japonica, Sphaerophysa salsula, Vicia sepium, Astragalus adsurgens, Lespedeza davurica, Astragalus melilotoides, Setaria viridis, Poa annua, Bothriochloa ischaemum, etc., are the main species.

2.2. Sample Plot Setup

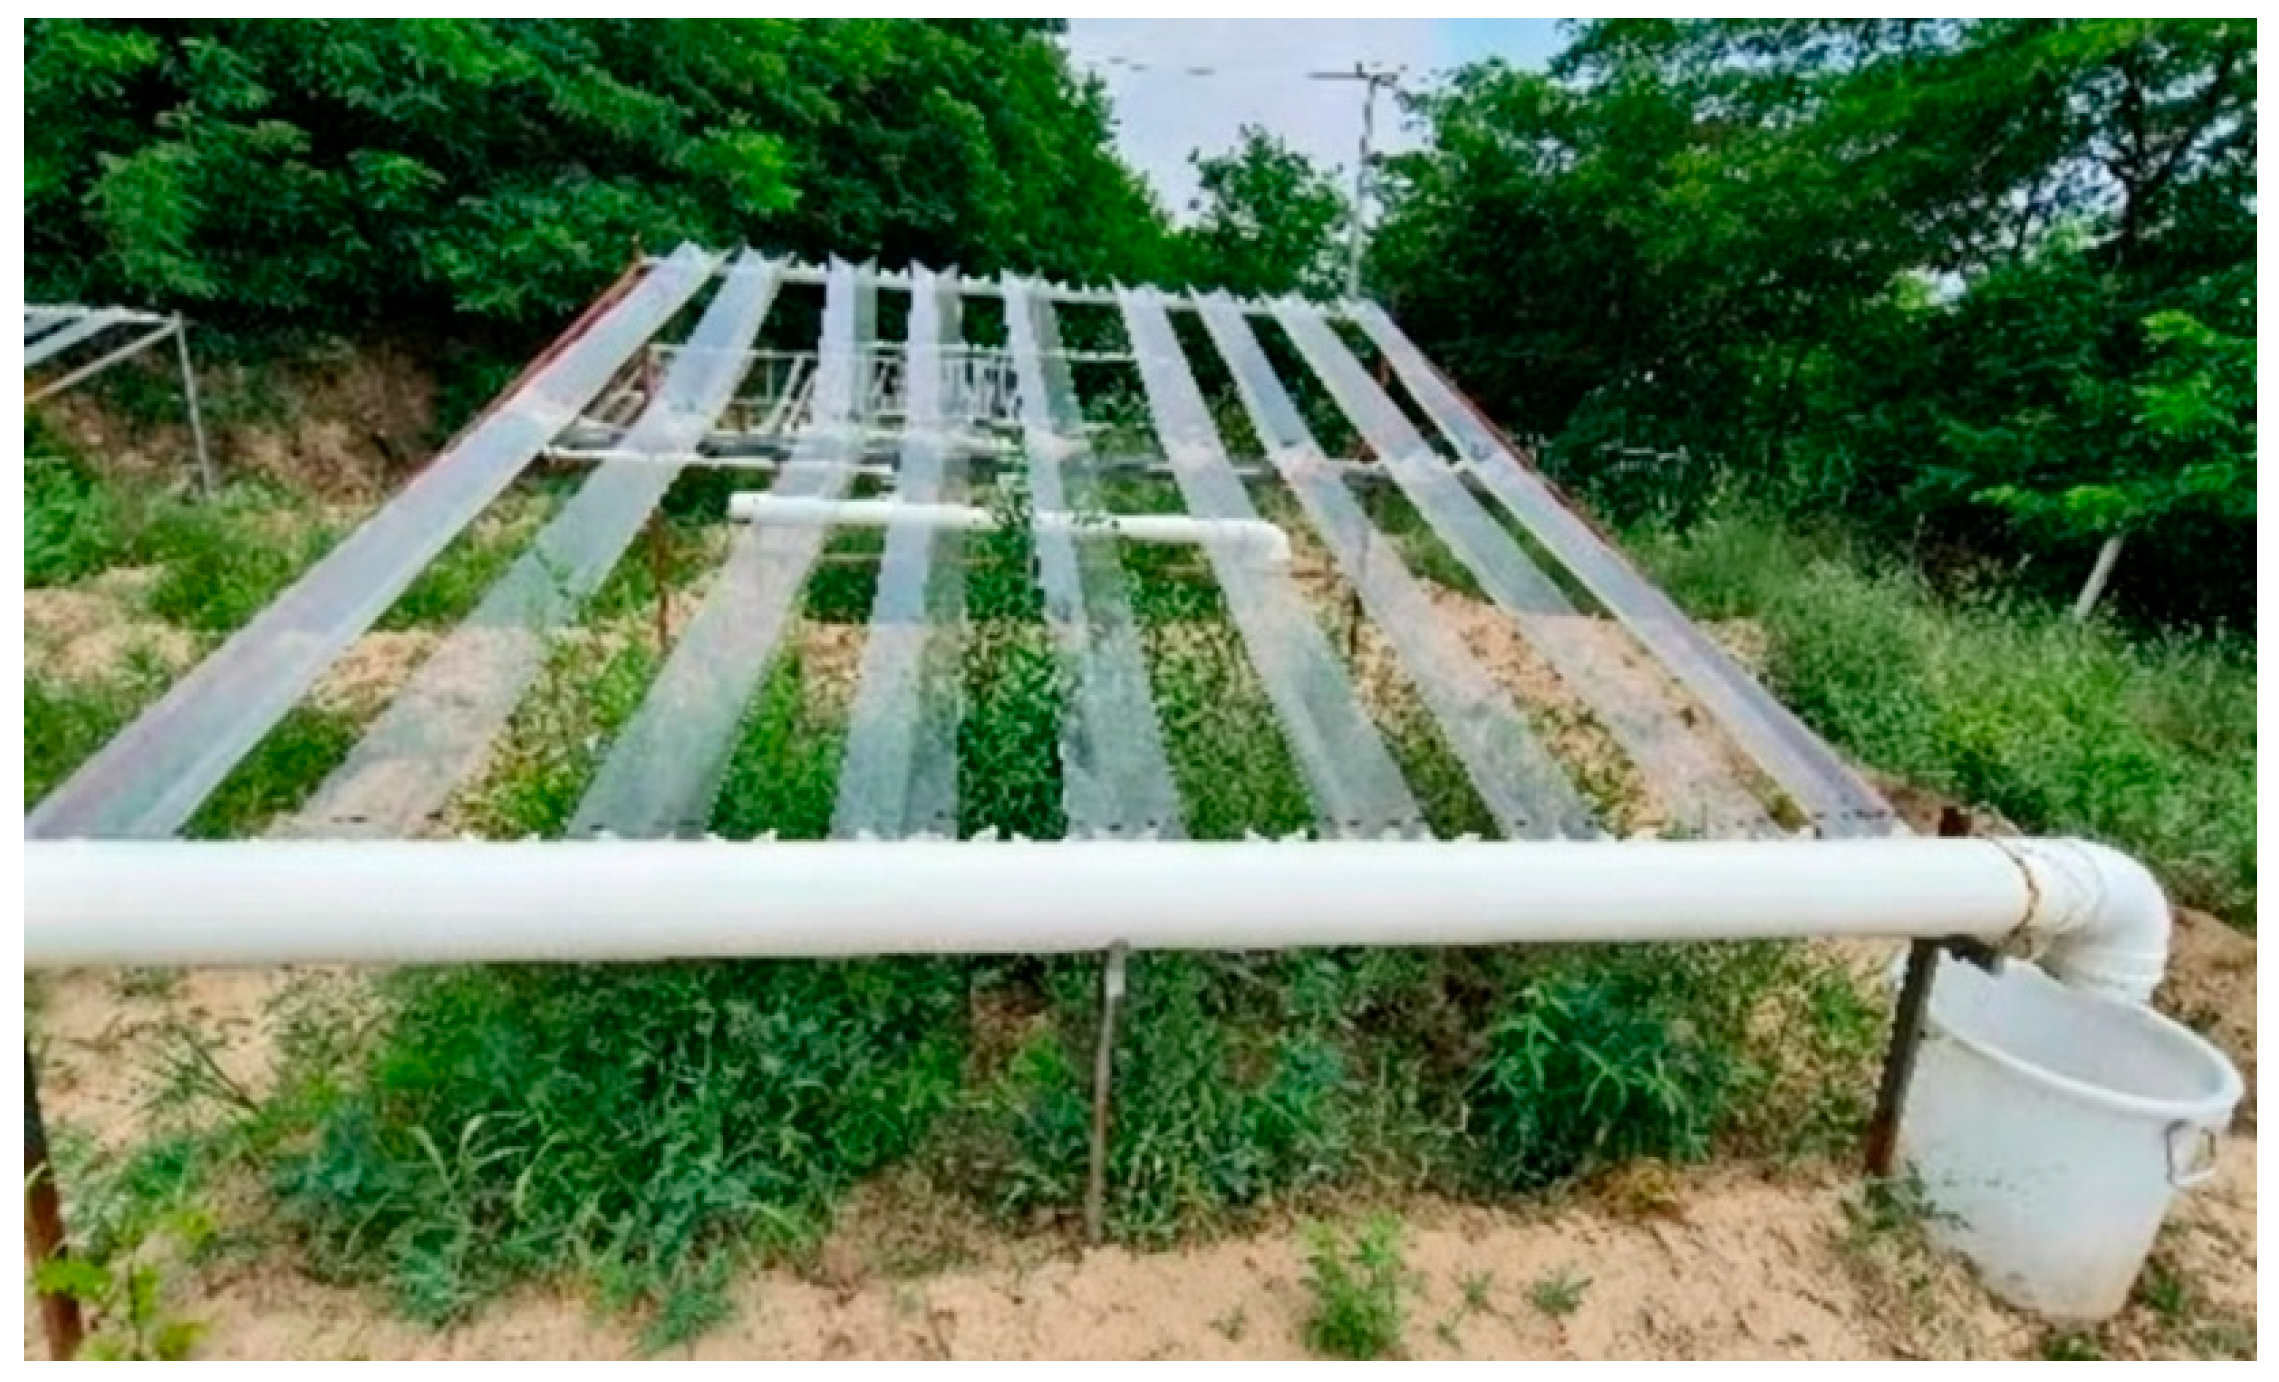
The experimental plots were established on the same, relatively flat slope position and were abandoned in 2000; prior to that, it was primarily planted with sparse, older varieties of fruit trees. For each rainfall gradient, four small quadrats of 3 m × 3 m were set up, spaced 2 m apart. The vegetation type in the quadrats was natural grassland, with an average cover of 80%. In early 2015, iron fences were installed around the experimental plots, and the plots were weeded and plowed; thereafter, no further anthropogenic management was applied. The experiment simulated changes in precipitation gradients by constructing a rain shelter. The device consisted of three parts: a steel support structure, transparent V-shaped rain deflectors (made of acrylic with a light transmittance of >92%, 2 mm thick, 1.8 m long, with a V-shaped opening 0.1 m wide and an angle of 20° to the horizontal plane), and plastic buckets for collecting water (Figure 2). The horizontal projection area of each polymethyl methacrylate is 3 m × 0.10 m. The number of rain-shielding V-shaped channels was adjusted according to the gradient of rainfall reduction. The study area was divided into seven rainfall gradient treatments: a control plot with no canopy (CK), 20% increased rainfall (A+), 40% increased rainfall (B+), 60% increased rainfall (C+), 20% reduced rainfall (A−), 40% reduced rainfall (B−) and 60% reduced rainfall (C−). In the reduced rainfall treatment plots, several plexiglass sheets were installed to cover 20%, 40%, and 60% of the plot area, respectively, thereby artificially reducing natural rainfall. In the increased rainfall treatment plots, the rainwater intercepted by the plexiglass sheets from the corresponding reduced rainfall treatments was diverted via PVC gutters into collection barrels and then evenly sprinkled onto the augmented rainfall plots. The number of plexiglass sheets installed in each treatment plot was calculated as follows:
Rainfall   reduction = 3 × 0.1 × n 3 × 3
In the formula, n represents the number of acrylic sheets.

2.3. Determination of Soil Physicochemical Properties

Soil samples were collected in April 2024. Three sampling points were randomly selected at each of seven plots with different rainfall gradients, with sampling depths of 0–5 cm and 5–20 cm, respectively. Soil samples were collected in layers from the sampling points using a earth borer and a ring cutter (volume: 100 cm3). Soil bulk density was determined using the ring-knife method [21]; soil particle size distribution was analyzed using a Master Sizer 2000 laser particle analyzer [22]; and organic matter content was determined using the K2Cr2O7 titration method [23].

2.4. Characteristics of Soil Aggregates

A combined dry–wet sieving method was used to determine soil aggregate characteristics. At each sampling point in the study area, standard sampling boxes (dimensions: 20 cm × 12.5 cm × 6 cm) were used to collect undisturbed soil samples from the 0–5 cm surface layer and the 5–20 cm subsurface layer. After manually removing any mixed plant roots and gravel, the material was placed in a cool, well-ventilated area to dry naturally. Primary sorting was performed using the dry sieving method. The material was sequentially sieved through a series of standard sieves (with mesh sizes of 5, 2, 1, 0.5, and 0.25 mm). The mass of agglomerates in each particle size fraction (>5 mm, 2–5 mm, 1–2 mm, 0.5–1 mm, 0.25–0.5 mm, and <0.25 mm) is precisely weighed, and their mass fractions are calculated. To determine water-stable agglomerates, the sample is placed in a mechanical wet sieving apparatus and sieved at a frequency of 30 rpm (sieving time: 1 min). The oversize material from each particle size fraction is collected, rinsed with deionized water, and transferred to a constant-weight beaker. After drying in a sand bath (105 °C ± 2 °C) to constant weight, the mass percentage of water-stable agglomerates in each particle size fraction is accurately determined.
The formulas for calculating the mean weight diameter (MWD), geometric mean diameter (GMD), and fractal dimension (D) are based on internationally accepted methods, as follows [24]:
w i = W i / W T × 100 %
d 0.25 5 = W d > 0.25 W d > 5 W T = 1 W d > 5 W d < 0.25 W T
MWD = i = 1 n ( d - i w i ) i = 1 n w i
GMD = exp i = 1 n w i ln d i
In the equation, w i represents the percentage of the total aggregate mass accounted for by the i th size fraction; w i represents the mass of the i th size fraction of water-stable aggregates; W T represents the total mass of aggregates in each size fraction; and d i represents the average diameter of the i th size fraction.

2.5. Determination of Soil Water Infiltration Characteristics

To perform the measurement using a disc infiltrometer [25], first clear the surface of any debris and prepare a flat area with a radius greater than 6 cm. Place a steel ring with a radius of 6 cm and a thickness of 3 mm at the measurement location and press it firmly into the ground. Fill the ring with fine sand (3 mm thick) and level it with a steel ruler. Then, remove the steel ring. Refill the water reservoir of the disc infiltrometer and check the device for airtightness. After adjusting the water level in the pressure pipe of the disc infiltration apparatus to a negative pressure of 0, place the apparatus gently on the surface of the packed sand layer. Record the water level in the reservoir and the water temperature at the start of the test. Open the sealing clamp at the top of the reservoir and press the stopwatch to start the timer. During the infiltration process, read and record the water level in the reservoir tube every 10 s for the first 90 s. From 90 s to 3 min, record the water level every 30 s. From 3 min to 9 min, record the water level every minute. After 9 min, record the water level every 3 min, continuing until the infiltration rate stabilizes.
The formula for calculating the infiltration rate is
f s = Δ hD 2 2 Δ tD 1 2 ( 0.7 + 0.03 T )
In the equation, f s is the infiltration rate at a water temperature of 10 °C (mm/min); Δ h is the difference in water level over a measurement interval Δ t (mm); D 1 is the effective diameter of the infiltration pan (cm); D 2 is the diameter of the infiltration meter’s water storage tube (cm); Δ t is the measurement interval (min); and T is the average water temperature over a measurement interval (°C).

2.6. Data Processing

In this study, Microsoft Excel 2016 was used to compile the data, and SPSS 22 was used for statistical analysis. The data were analyzed using one-way analysis of variance (ANOVA) and Pearson’s correlation analysis. This study employed one-way analysis of variance (ANOVA) to compare differences in soil physicochemical properties, as well as soil aggregate composition and characteristics, across different rainfall gradients. Duncan’s post hoc test was used to compare soil infiltration characteristics among treatments with different rainfall gradients. Pearson’s correlation analysis was used to evaluate the relationships between soil infiltration characteristics and soil physicochemical properties, as well as aggregate composition and characteristics. All statistical analyses were performed using IBM SPSS Statistics 20.0, with a significance level of p < 0.05 or p < 0.01.

3. Results

3.1. Physicochemical Properties of the Soil

As shown in Table 1, the bulk density of each plot ranged from 1.01 to 1.23 g/cm3. In both the 0–5 cm and 5–20 cm soil layers, the bulk density of the 40% increased rainfall plots and the 60% increased rainfall plots was significantly lower than that of the other plots; however, in the 0–5 cm soil layer, as the rainfall gradient increased from 40% reduced rainfall to 40% increased rainfall, the soil bulk density decreased significantly by 9.27%, and the soil bulk density in the 60% reduced rainfall plots increased significantly by 5.47% compared to the 60% increased rainfall plots (p < 0.05). The trend of total soil porosity is opposite to that of bulk density. In the 0–5 cm soil layer, the total porosity of the 40% rainfall increase plot is the highest, reaching 61.72%, followed by the 60% rainfall increase plot at 60.86%. Both are significantly higher than those of other plots (p < 0.05). In the 5–20 cm soil layer, as the precipitation gradient increased from 0% to 60%, the total soil porosity increased significantly by 4.03% to 58.68% (p < 0.05). Soil organic carbon (SOC) decreases significantly with increasing soil depth, with SOC in the topsoil being 1.4 to 2.8 times higher than in deeper layers. In the 0–5 cm soil layer, SOC showed an upward trend as rainfall enhancement increased from 0% to 60%; SOC in plots with 40% and 60% rainfall enhancement was significantly higher than in other plots (p < 0.05).
The clay particle content of naturally restored grasslands under different precipitation gradients ranged from 8% to 12%. In the 0–5 cm soil layer, the clay particle content in plots with 40% and 60% increased precipitation was significantly higher than that in plots with 20% increased precipitation, 20% decreased precipitation, and 60% decreased precipitation (p < 0.05). In the 5–20 cm soil layer, the clay particle content in the 20% rain enhancement treatment was significantly higher than CK, 20% rain reduction, 60% rain reduction, and 60% rain enhancement treatments (p < 0.05). The overall proportion of silt particles was relatively high, ranging from 55% to 60%. In the 5–20 cm soil layer, the silt particles content in the 20% increased rainfall treatment was significantly higher than CK, 40% increased rainfall, 60% increased rainfall, and 60% decreased rainfall treatments (p < 0.05). The highest sand particle content in the 0–5 cm soil layer was observed in the 60% rain reduction plot, at 34.71%, representing a significant increase of 11.31% compared to the 60% rain enhancement plot (p < 0.05).

3.2. Composition and Characteristics of Soil Aggregates

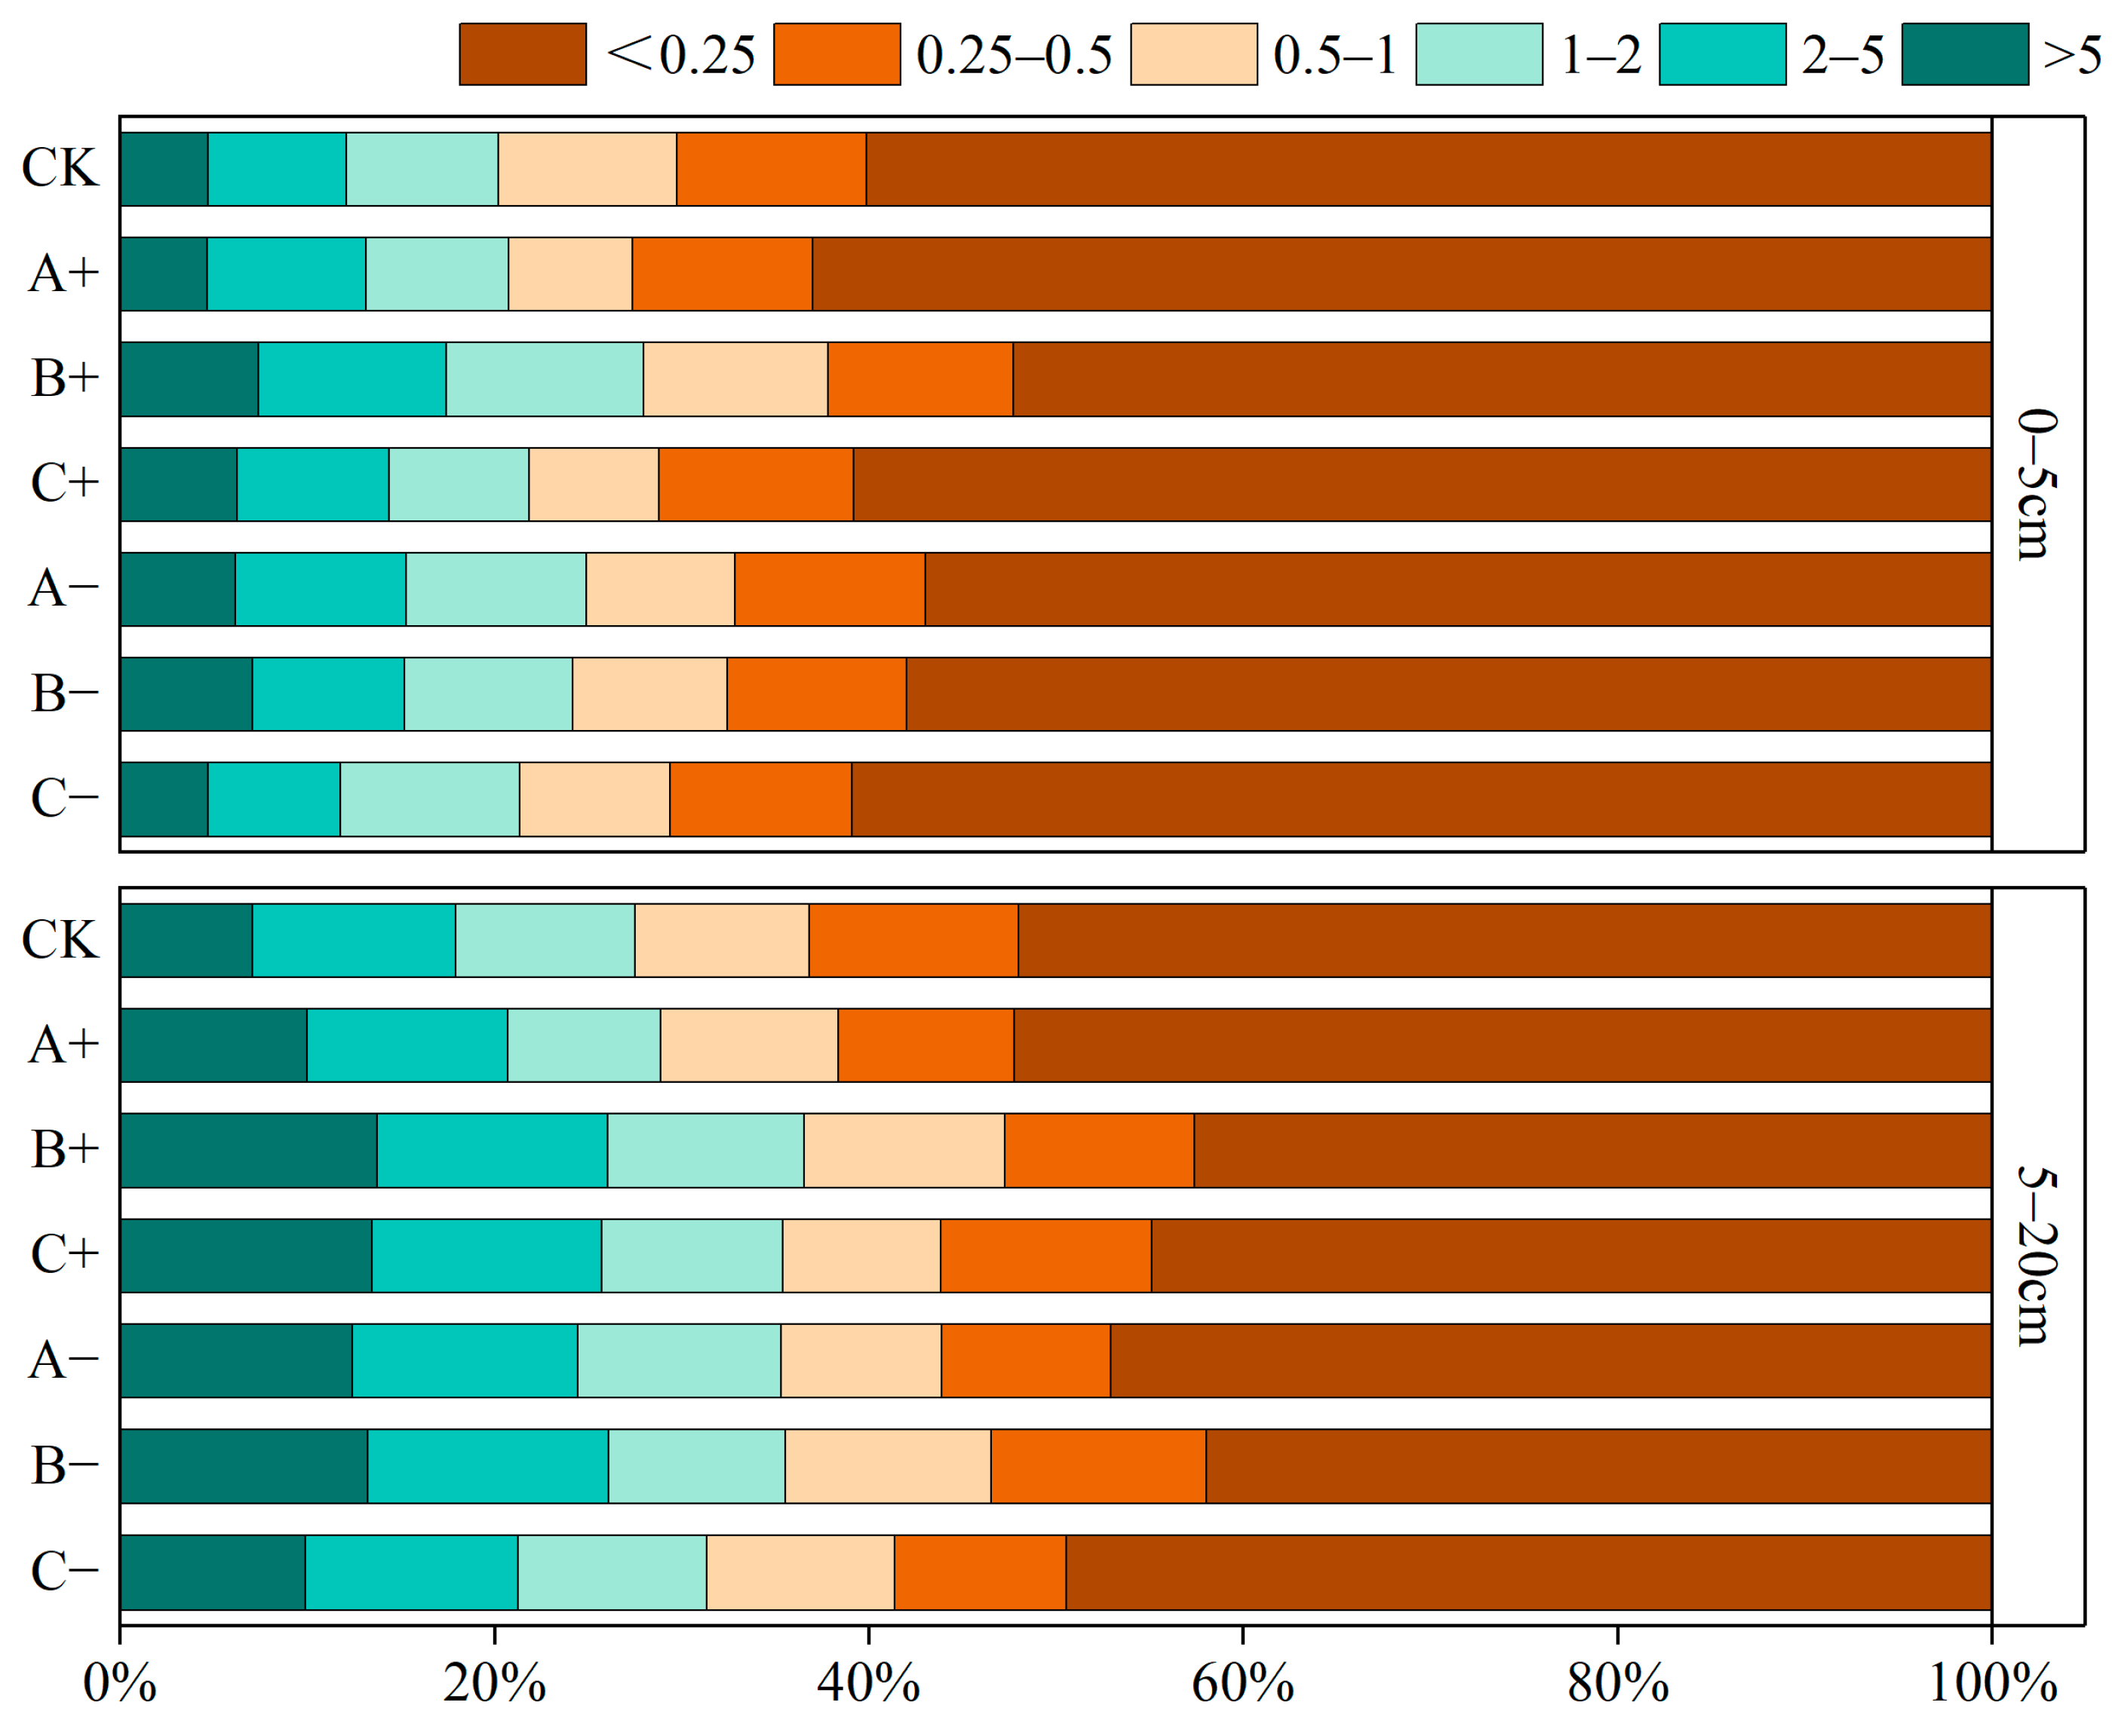
Figure 3 shows the distribution of water-stable aggregates across different particle sizes in restored grassland soils under various rainfall gradient treatments. There are significant differences in the composition of water-stable aggregates in the 0–20 cm soil layer. The proportion of stabilized aggregates in the <0.25 mm size class was the highest, with an average content ranging from 47.21% to 58.24%, and this proportion decreased with increasing soil depth. In the 0–5 cm soil layer, the content of water-stable aggregates >5 mm followed this order: 40% rainfall increase > 40% rainfall reduction > 60% rainfall increase > 20% rainfall reduction > 60% rainfall reduction > control group > 20% rainfall increase. The content of <0.25 mm aggregate particles in the 40% increased rainfall treatment was lower than in all other plots, while the content of >5 mm aggregate particles in the 20% increased rainfall, 60% decreased rainfall, and control groups was lower than in all other plots. In the 5–20 cm soil layer, the content of water-stable aggregates >5 mm followed this order: 40% increased rainfall > 60% increased rainfall > 40% reduced rainfall > 20% reduced rainfall > 20% increased rainfall > 60% reduced rainfall > CK. The content of water-stable aggregates with particle sizes of 2–5 mm and >5 mm in the 40% increased rainfall, 40% decreased rainfall, and 60% increased rainfall treatments was higher than in other plots, while the content of aggregates with particle sizes <0.25 mm was less than 50%.
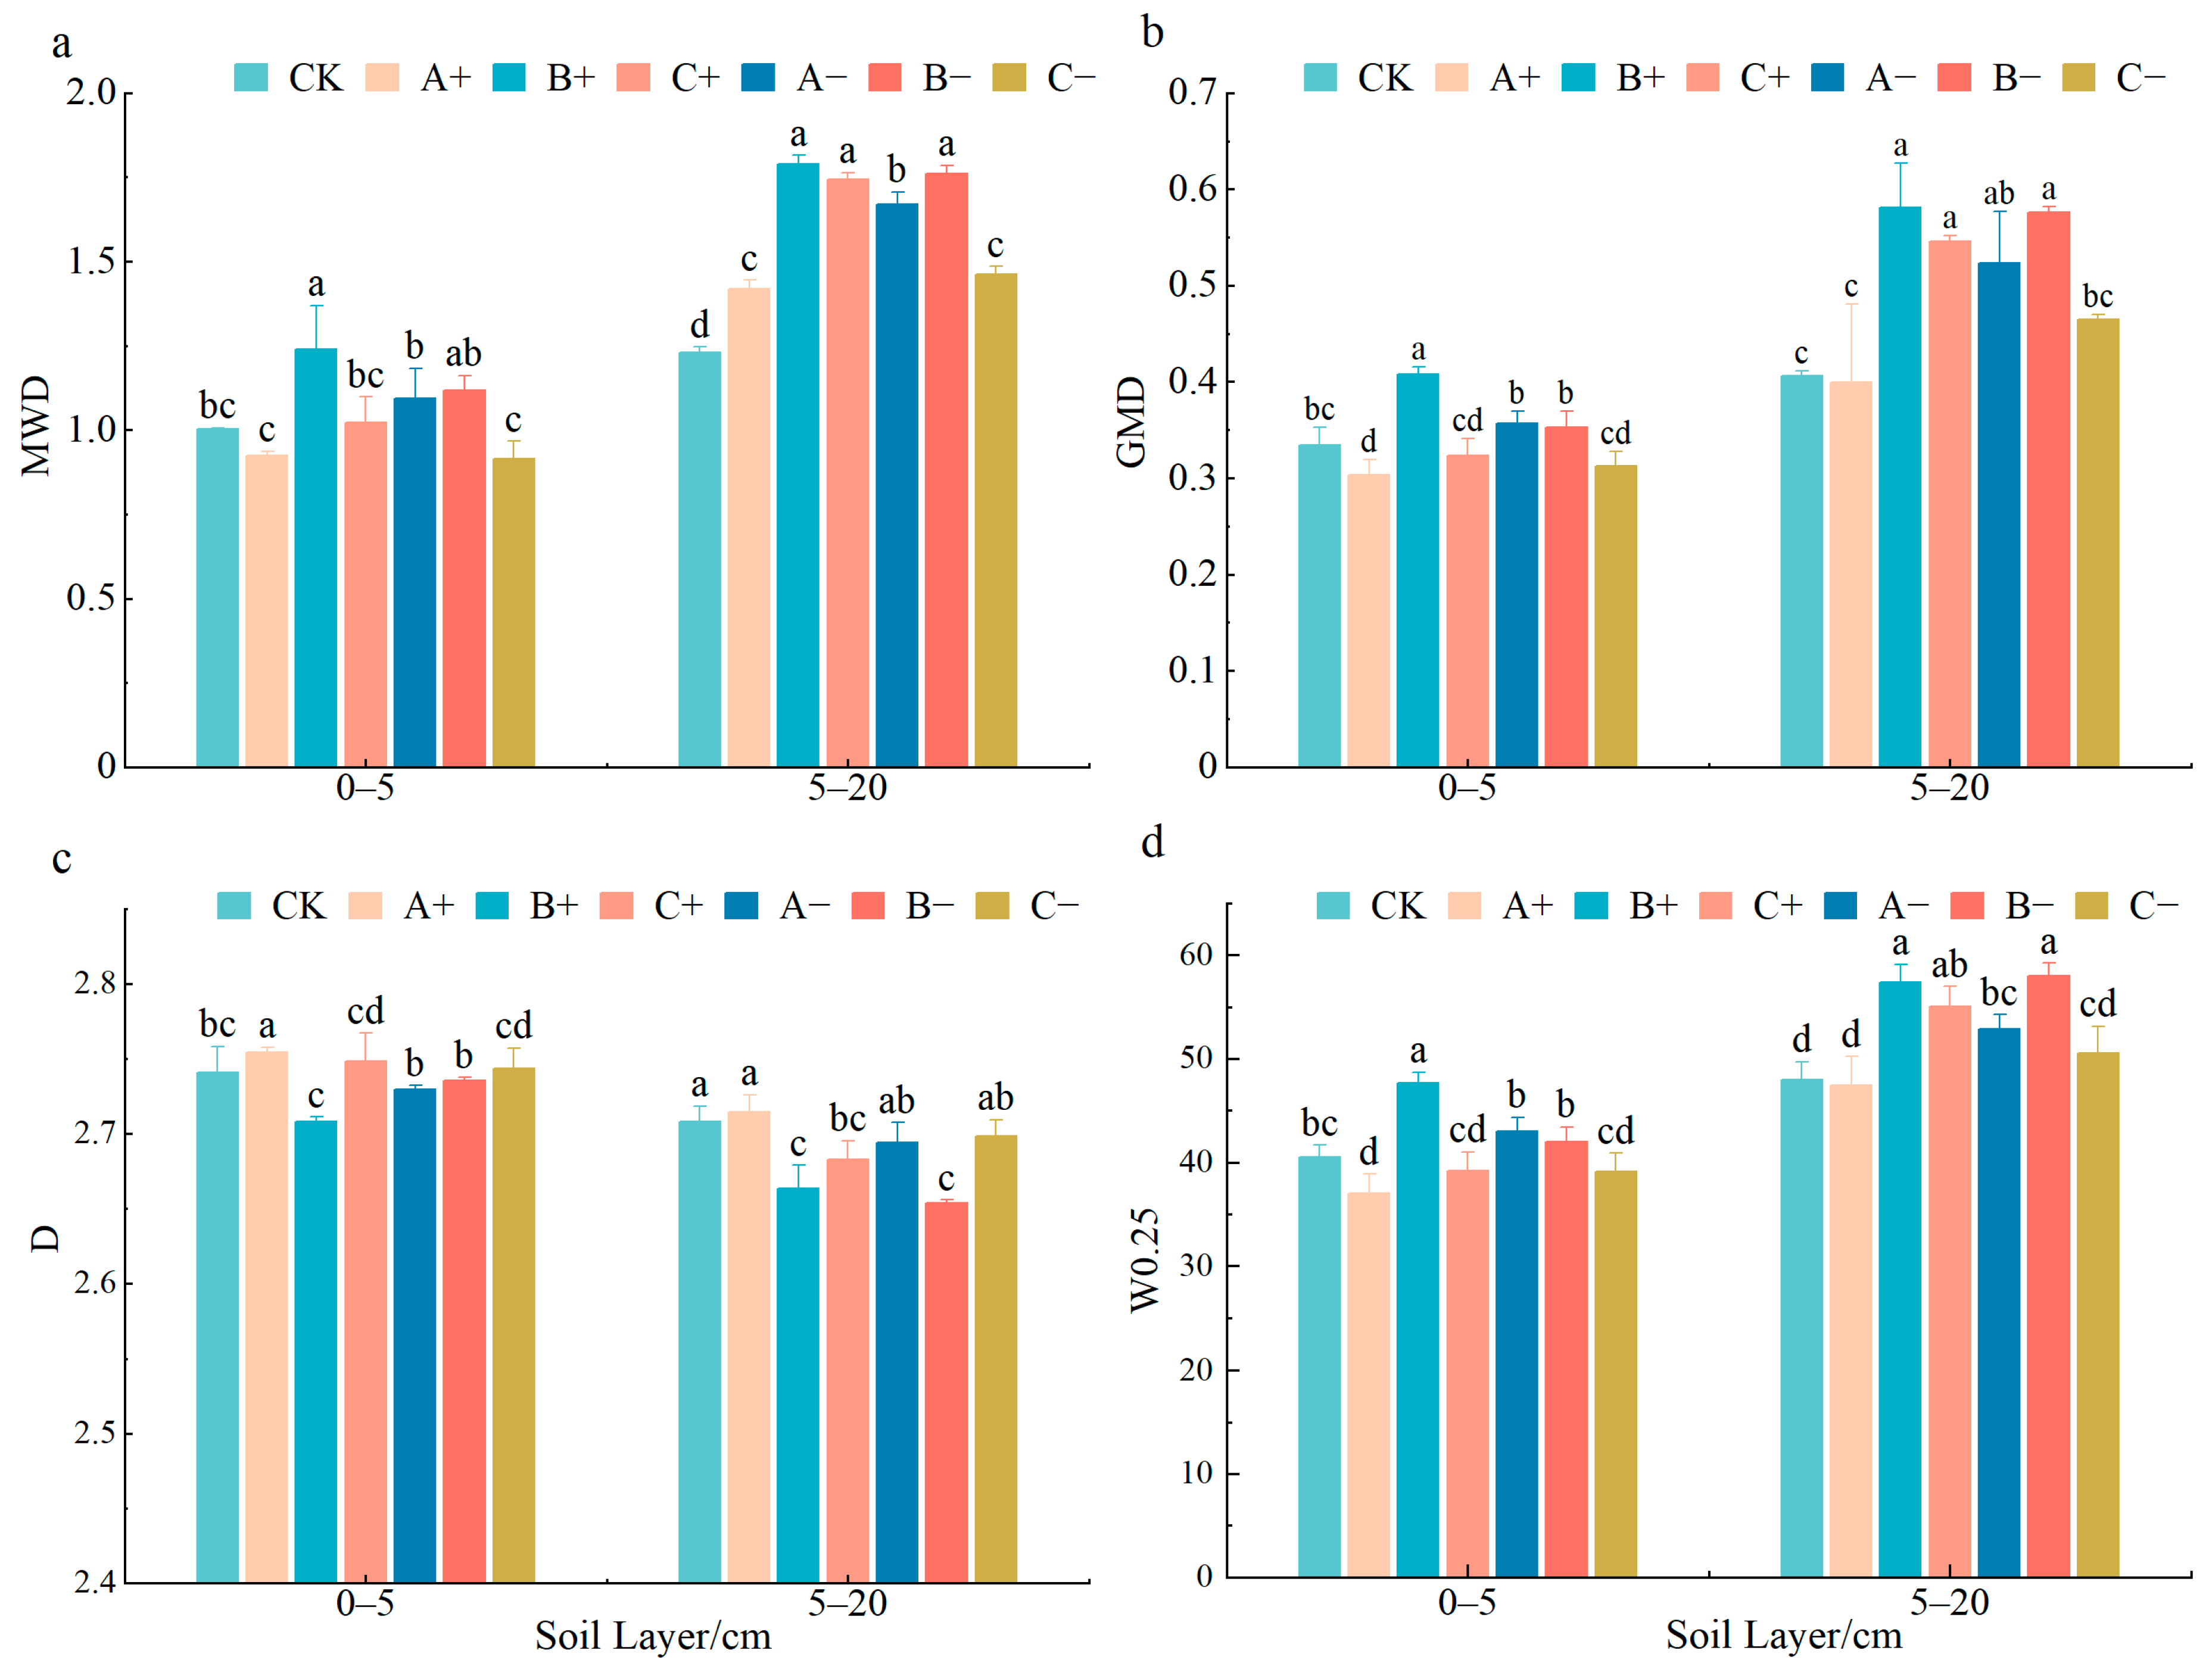
As shown in Figure 4d, the overall content of 40% rain-induced large aggregates was generally high. In the 0–5 cm soil layer, the content of water-stable aggregates of the >0.25 mm fraction in the 40% increased rainfall plots was significantly higher than in the other rainfall gradient treatments (p < 0.05). The content of water-stable aggregates in the >0.25 mm fraction within the 5–20 cm soil layer was as follows: 40% increased rainfall > 40% reduced rainfall > 60% increased rainfall > 20% reduced rainfall > CK > 20% increased rainfall, with the 40% increased rainfall group showing a value 1.2 times that of the control group (p < 0.05).
Soil aggregate stability is a key indicator of soil structure’s resistance to erosion and is commonly assessed using metrics such as the mean weight diameter (MWD), geometric mean diameter (GMD), and aggregate fractal dimension (D). As shown in Figure 4a, the MWD of soil aggregates decreases with increasing soil depth. Furthermore, as rainfall intensity increases, the MWD of soil aggregates first increases and then decreases. In the 0–5 cm soil layer, under rainfall intensities of 40% and 60%, the rain enhancement treatment increased the MWD values of soil aggregates; however, under a rainfall intensity of 20%, the MWD values in the rain enhancement treatment were significantly lower by 17.84% compared to those in the rain reduction treatment (p < 0.05). Similar trends were observed in the 5–20 cm soil layer, where the MWD value of soil aggregates in the 60% rainfall increase treatment increased significantly by 11.67% compared to the 60% rainfall reduction treatment (p < 0.05). The fractal dimension of soil aggregates in the 40% rainfall increase treatment was significantly lower than that in other rainfall gradient treatments (p < 0.05), and this trend was consistent across different soil layers (Figure 4c).

3.3. Soil Infiltration Characteristics

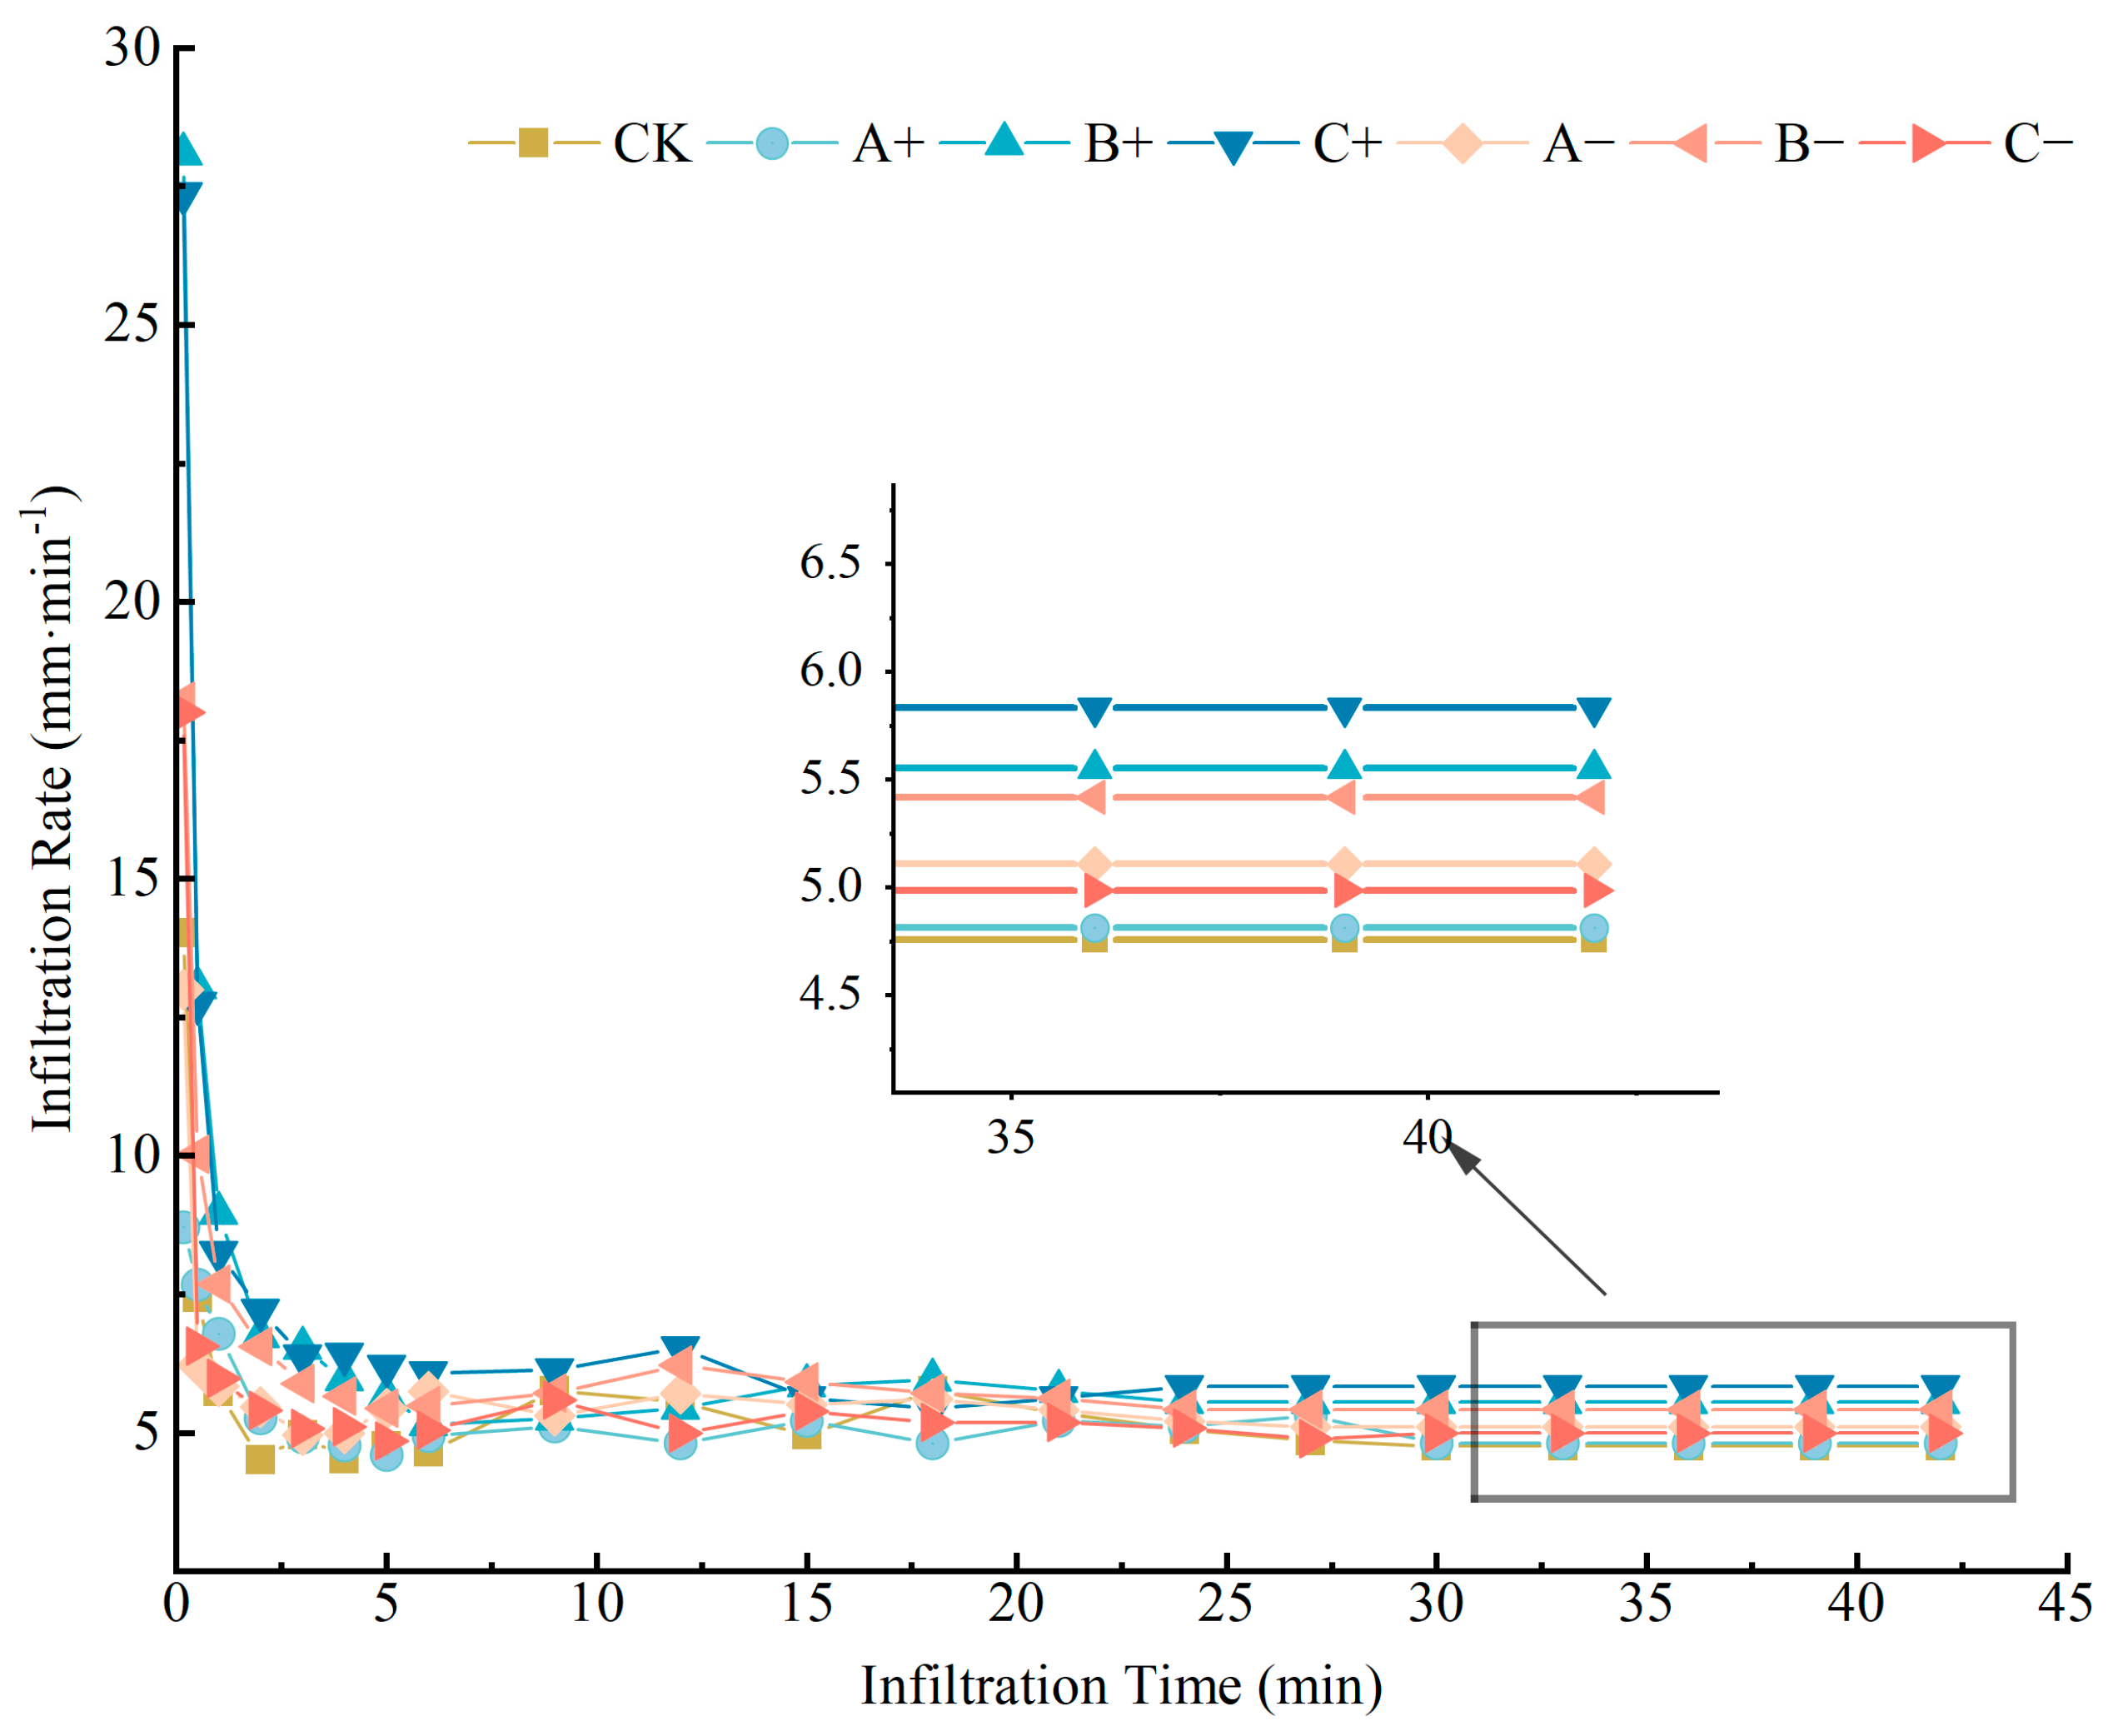
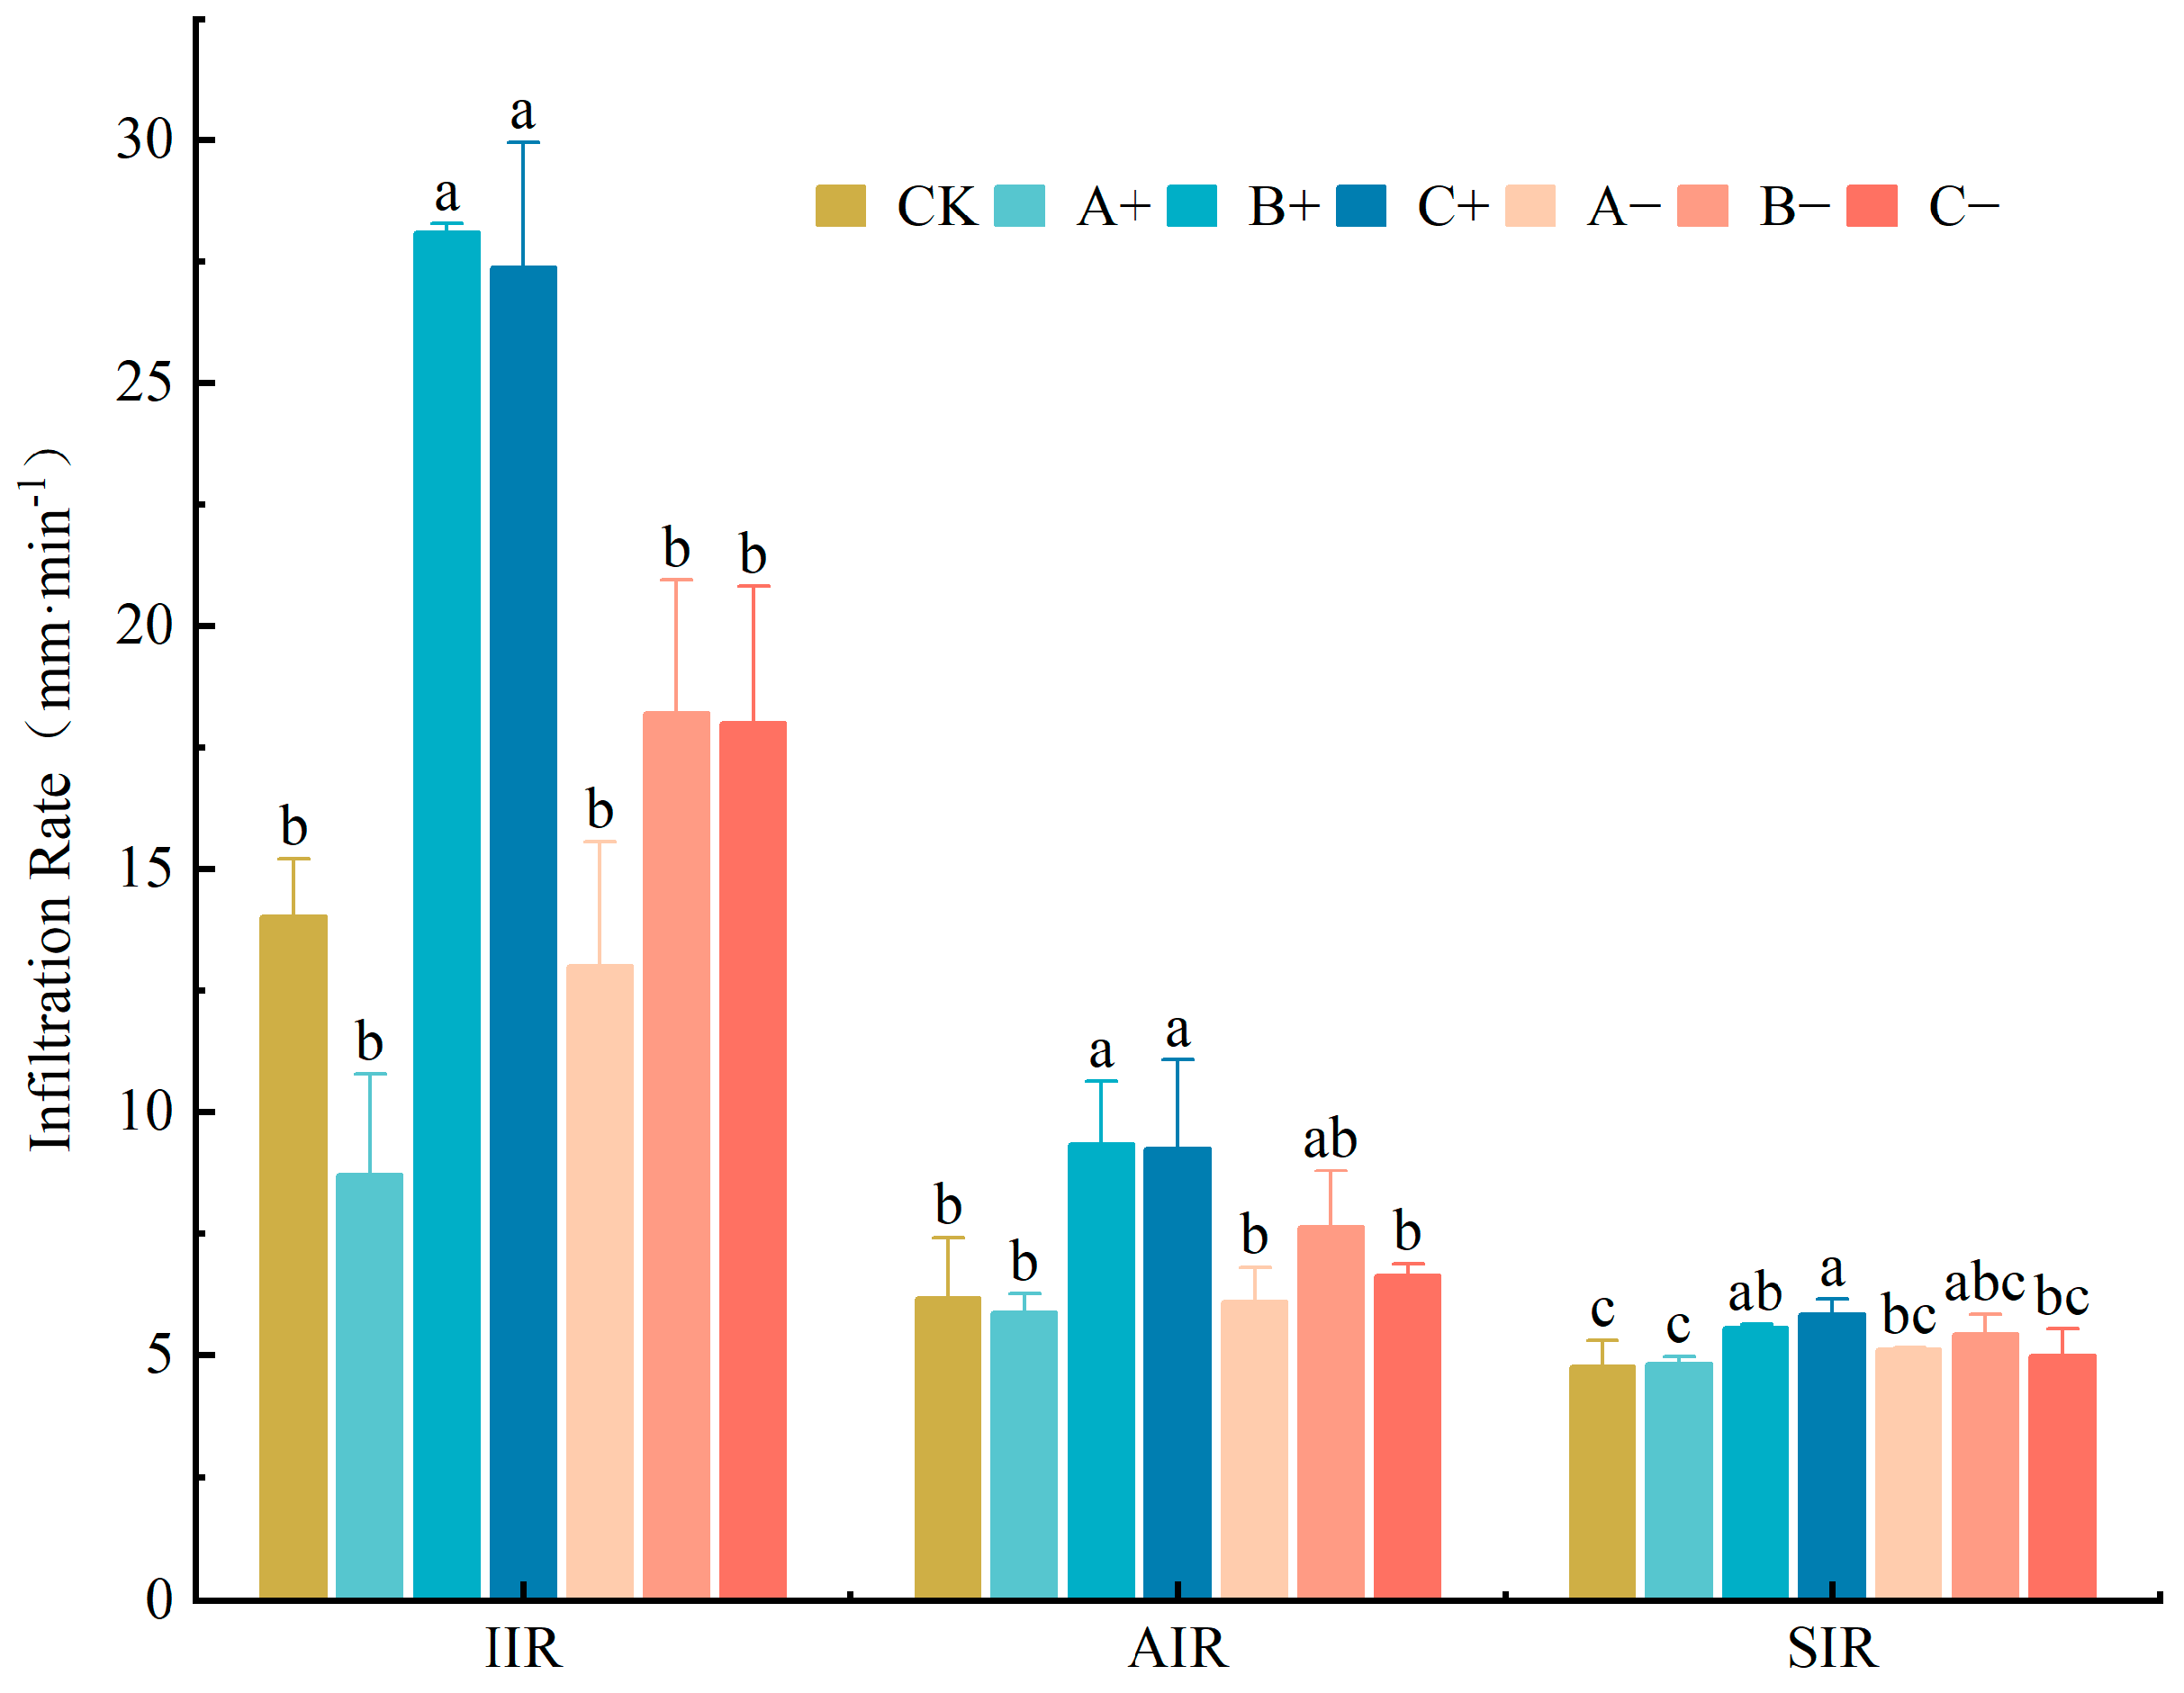
Figure 5 shows the infiltration process in restored grassland soil under different rainfall gradients. During the initial infiltration phase (0–5 min), the infiltration rate declined rapidly, with a decrease ranging from 17.16% to 36.87%. Over the next 15 min, the infiltration rate fluctuated slightly before stabilizing after 35 min. There were significant differences in infiltration rates among restored grasslands under different rainfall gradient treatments. The initial infiltration rates for the 60% and 40% rainfall increase treatments were 2.0-fold and 1.95-fold higher than those of CK, respectively, and were significantly higher than those of the other rainfall gradient treatments (p < 0.05). As the infiltration process proceeds and reaches the steady-state infiltration phase, the steady-state infiltration rates at the various sites show little variation.
The steady-state infiltration rates of restored grasslands under different rainfall gradients were as follows: 60% increased rainfall > 40% increased rainfall > 40% reduced rainfall > 20% reduced rainfall > 60% reduced rainfall > 20% increased rainfall > CK (Figure 6). The steady-state infiltration rate for the 60% increased rainfall treatment was 5.83 mm/min, which was significantly higher than that of the 60% reduced rainfall, CK, 20% increased rainfall, and 20% reduced rainfall treatments (p < 0.05). The average infiltration rate for the 60% rain enhancement treatment was 9.24 mm/min, representing a significant increase of 39.23% and 49.89% compared to the 60% rain reduction treatment and CK, respectively (p < 0.05). Compared to the stable infiltration rate of CK at 4.76 mm/min, the stable infiltration rates of the treatments with 20%, 40%, and 60% precipitation enhancement increased by 1.13%, 16.67%, and 22.54%, respectively. Overall, at the same treatment intensity, the rain-enhanced treatment resulted in higher infiltration rates in the restored grassland compared to the rain-reduced treatment. Furthermore, as the rain-enhancement gradient increased, the infiltration capacity of the restored grassland also improved significantly. The stable infiltration rate of the restored grassland reached its peak under the 60% rainfall enhancement treatment, but there was no significant difference compared to the 40% rainfall enhancement treatment. Throughout the entire infiltration process, the average infiltration rates of the 40% and 60% rainfall enhancement treatments were significantly higher than those of other rainfall gradient treatments, except for the 40% rainfall reduction treatment.

3.4. Analysis of Factors Affecting Soil Infiltration Characteristics

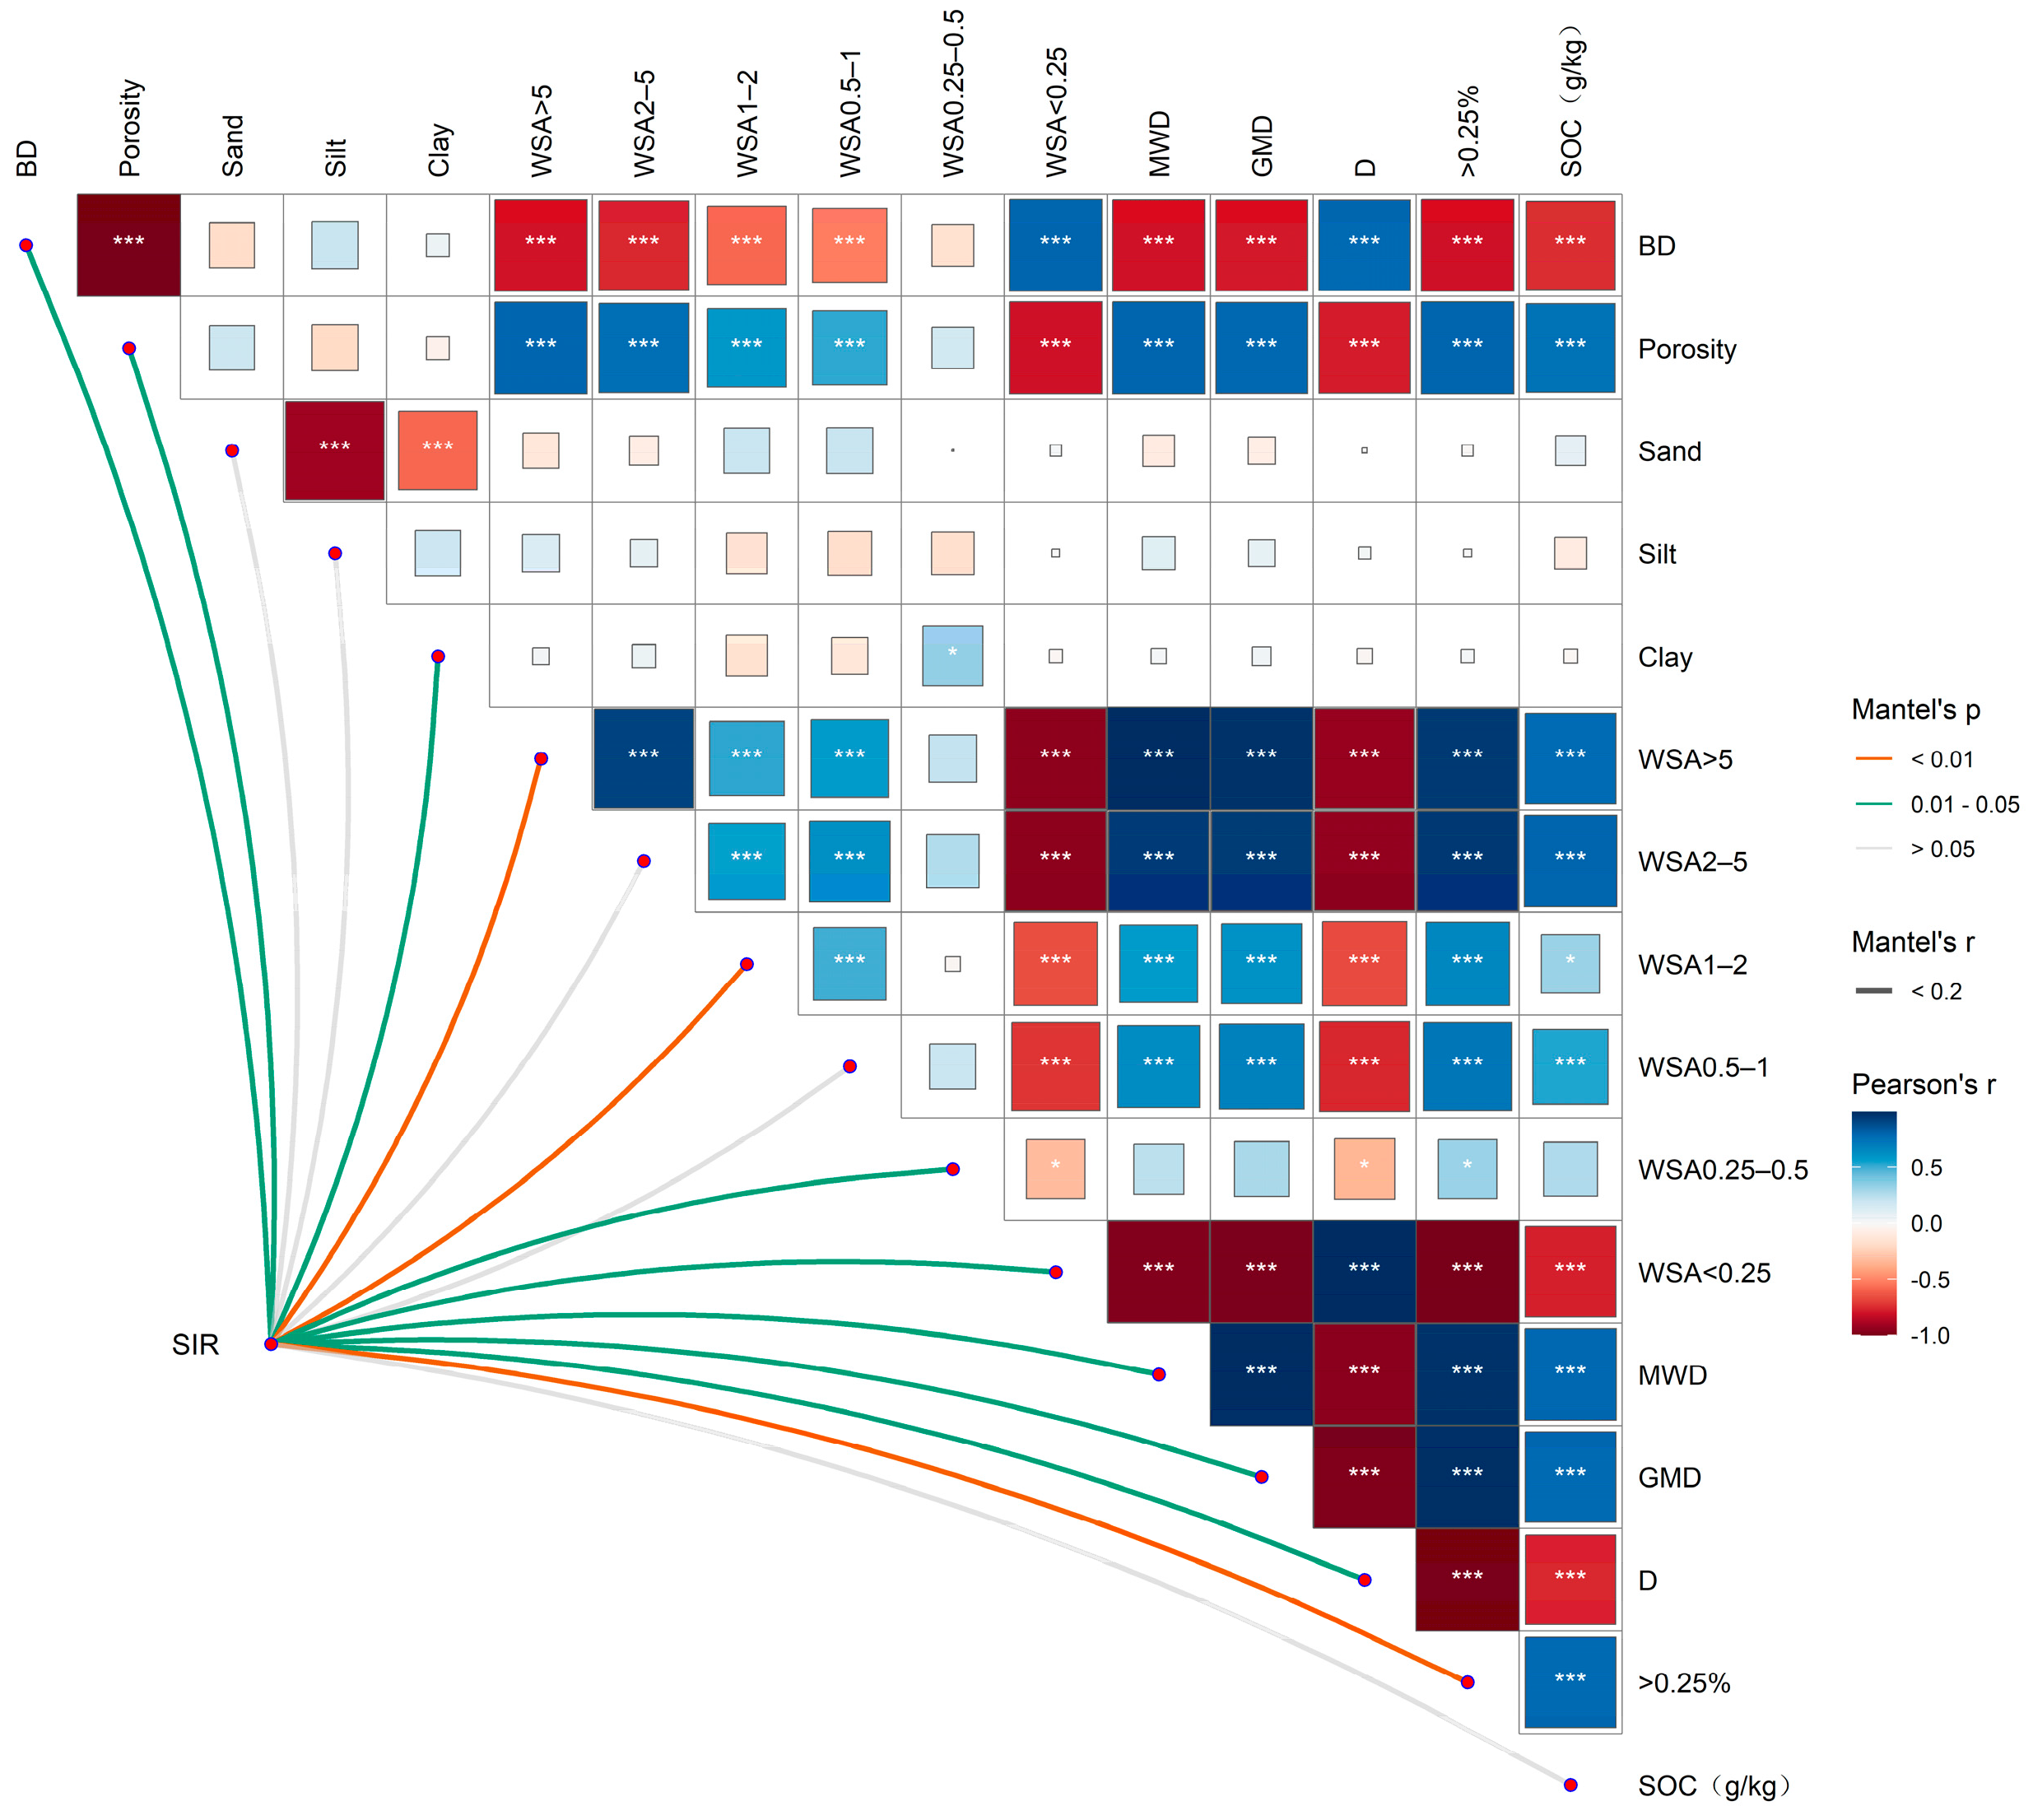
Figure 7 illustrates the correlation between soil steady-state infiltration rates and soil physicochemical properties and aggregate characteristics. At the highly significant level (p < 0.01), the soil steady-state infiltration rate showed significant correlations with bulk density, total porosity, SOC, the content of water-stable aggregates >5 mm, the content of water-stable aggregates 2–5 mm, the content of water-stable aggregates 0.25–0.5 mm, and the content of water-stable aggregates <0.25 mm. Among these, bulk density and the content of water-stable aggregates <0.25 mm showed a highly significant negative correlation with infiltration rate; that is, the higher the bulk density and the higher the content of micro-aggregates, the lower the infiltration rate; conversely, total porosity, SOC, the content of water-stable aggregates >5 mm, the content of water-stable aggregates 2–5 mm, and the content of water-stable aggregates 0.25–0.5 mm showed a highly significant positive correlation with infiltration rate, indicating that soils with well-developed porosity, high organic carbon content, and a high proportion of large aggregates exhibit stronger infiltration performance. At a significant level (p < 0.05), the infiltration rate showed a significant positive correlation with the content of water-stable aggregates in the 0.5–1 mm size range and the MWD. This also indicates that a higher proportion of large aggregates enhances structural stability, which is more conducive to improving infiltration performance; however, it showed a significant negative correlation with the fractal dimension D, reflecting that the more complex the fractal characteristics of soil particles, the lower the infiltration rate. Overall, soil infiltration rate is primarily influenced by SOC and soil structure, particularly the content of large aggregates and the stability of aggregates.

4. Discussion

4.1. Effects of Different Rainfall Gradients on the Physicochemical Properties of Restored Grassland Soils

Climate change, particularly shifts in precipitation patterns, can influence plant growth, photosynthetic performance, and root development, while also altering the community structure and species diversity of grassland vegetation, thereby exerting a significant impact on both aboveground and belowground biomass [26]. Studies on simulated rainfall have found that both increased and reduced rainfall can increase soil organic carbon content to some extent [27]. This is consistent with the findings of the present study: in the 0–5 cm soil layer, soil organic carbon content was significantly higher than CK in all rainfall gradient treatments except for the 20% reduced rainfall treatment (p < 0.05). This is because the rain enhancement treatment provides ample moisture for vegetation growth and recovery; consequently, under long-term rain enhancement, a significant amount of litter has accumulated on the ground surface [28], which is one of the primary sources of soil organic carbon. In addition, root exudates and underground root systems also contribute to soil organic carbon under the influence of microorganisms [29,30,31]. However, the effects of rain reduction treatments on plant growth and even on soil organic matter are quite complex. On the one hand, reduced rainfall encourages plants to develop deeper root systems, thereby increasing the underground biomass of vegetation [32]. On the other hand, reduced rainfall stressors on dominant vegetation species reduce competitive inhibition from other associated species and certain annual plants, leading to increased species diversity in restored grasslands [33], while also significantly enhancing the community’s resistance to drought [34]. Overall, however, the soil organic carbon content in the rain enhancement treatment was still higher than that in the rain reduction treatment.
Changes in soil organic carbon also directly determine changes in soil bulk density [35]. Bulk density represents the compactness of soil and also indicates soil structure and soil permeability [36]. In this study, the rain enhancement treatment reduced soil bulk density, which showed a trend of first decreasing and then increasing with increasing rain intensity; the soil bulk density was lowest at a 40% rain enhancement level, which was contrary to the trend observed for organic carbon content. Figure 7 also shows that soil organic matter is negatively correlated with soil bulk density but positively correlated with total soil porosity. The total soil porosity in the rain enhancement treatment was higher than that in the rain reduction treatment (Table 1). Soil porosity has a significant impact on plant root development and rainfall infiltration [37]. Higher soil porosity facilitates rapid water transport and enhances soil water storage and retention capacity [38].

4.2. Effects of Different Rainfall Gradients on the Composition and Characteristics of Soil Aggregates in Restored Grasslands

Climate change can lead to changes in vegetation types and soil structure, while frequent droughts and extreme rainfall can cause soil degradation. Soil structure refers to the degree of aggregation of soil particles and their arrangement and distribution [39]. Good soil structure requires adequate soil particle cementation and aggregate stability, which are typically directly proportional to soil organic carbon content [40]. The results showed that the treatment with 40% rain enhancement had the highest content of large aggregates compared to the other rainfall gradient treatments, and the content of water-stable aggregates larger than 0.25 mm in the 0–5 cm soil layer was significantly higher than that in the other rainfall gradient treatments (p < 0.05). This suggests that a certain degree of rain enhancement treatment promotes soil aggregate formation. However, when rainfall intensity exceeds this level and reaches 60%, the content of large soil aggregates decreases significantly, particularly in the top 0–5 cm of the soil profile; in fact, higher rainfall intensity tends to disrupt soil aggregates.
The fractal dimension reflects the degree of soil disturbance [24]. As shown in Figure 4c, the soil fractal dimension in the 0–5 cm soil layer was significantly higher in the 60% rain enhancement treatment than in the 40% rain enhancement treatment, whereas in the 5–20 cm soil layer, it was significantly lower than that of CK (p < 0.05). Soil MWD and GMD are indices used to evaluate soil aggregate stability. In this study, the rain enhancement treatment increased soil MWD and GMD; specifically, the soil MWD and GMD values for the 40% rain enhancement treatment were significantly higher than those for the other rainfall gradient treatments, indicating stronger aggregate stability. This is precisely due to the high soil organic carbon content; soil organic carbon is a key component in aggregate formation, and generally speaking, as its content increases, so does the proportion of large soil aggregates [23].

4.3. Effects of Different Rainfall Gradients on the Restoration of Soil Infiltration Capacity in Grasslands

The permeability of soil determines the proportion of rainfall that is converted into soil water and influences the spatial distribution and movement pathways of water within the soil; soils with high infiltration capacity are also less susceptible to erosion from precipitation [41]. In this study, long-term rainfall regulation had a certain impact on soil infiltration capacity. The initial infiltration rates for the 40% and 60% rainfall increase treatments were higher than those for the rainfall reduction treatment and the control group, and the steady-state infiltration rates for both treatments were also significantly higher than those of the control group. These differences are closely related to the growth of restored grassland vegetation under different precipitation conditions.
Changes in soil infiltration capacity are primarily influenced by soil structure, which, on the one hand, is positively affected by soil organic carbon. On the other hand, it is shaped by plant root activity. The interlacing movement of roots as they grow through the soil, as well as the root cavities left behind when roots die, create interconnected, larger pores in the soil. These pores can rapidly transport precipitation to deeper soil layers; physical processes such as wetting and drying can also create cracks that serve a similar function [10,42]. Consequently, the soil infiltration rate in the 40% rainfall reduction treatment was higher than that of CK. This was due to the soil cracks that formed under drought conditions, while plant roots grew deeper to absorb water from deeper soil layers, creating more infiltration pathways.
In addition, soil macropores can form between large aggregates, thereby enhancing soil infiltration capacity and providing greater resistance to erosion [43]. Compared to microaggregates, macroaggregates have a more stable structure and are less prone to dispersion due to external conditions [44]. This explains why the 40% rainfall enhancement treatment showed a relatively rapid recovery in grassland infiltration rates, with little difference from the 60% treatment. In the 60% treatment, the topsoil of the restored grassland was subjected to heavy rainfall, resulting in poor aggregate stability; however, aggregate stability was good in the 5–20 cm soil layer. Furthermore, with a relatively abundant supply of rainfall, the 60% treatment exhibited higher organic carbon content. Appropriate rainfall enhancement treatments promote organic carbon accumulation and aggregate formation, effectively enhancing soil infiltration capacity. However, when the rainfall enhancement intensity exceeds 60%, it begins to damage soil structure and no longer significantly increases infiltration rate.
In this study, through long-term precipitation manipulation and soil infiltration rate observations on restored grassland in the hilly region of the Loess Plateau, we systematically analyzed changes in soil structure under altered precipitation patterns and their regulatory effects on soil infiltration performance in the restored grassland. These results provide an important basis for deepening our understanding of the mechanisms influencing soil infiltration function in the hilly Loess Plateau under precipitation change. However, this study focused primarily on soil physical structure and hydrological processes, without examining the dynamic responses of aboveground plant community composition under changing precipitation, and the study was conducted at a relatively small scale. To comprehensively assess the integrated impacts of climate change on the structure and function of grassland ecosystems, future research should establish long-term fixed-site monitoring stations along different natural precipitation gradients. Based on continuous co-observation of soil hydrological processes and aboveground vegetation community dynamics, further multi-site precipitation manipulation experiments should be conducted to comprehensively evaluate the effects of precipitation change on soil structure and infiltration capacity.

5. Conclusions

This study systematically investigated the effects of different precipitation conditions on the infiltration capacity of restored grassland in the hilly region of the Loess Plateau through a simulated rainfall gradient experiment. Compared with the natural rainfall control, the +20%, +40%, and +60% rainfall increase treatments increased the total porosity of the 0–5 cm soil layer by 0.29%, 4.64%, and 3.18%, respectively, and increased soil organic carbon content by 28.42%, 62.46%, and 63.16%, respectively. Soil infiltration rate was correspondingly enhanced. Relative to the steady-state infiltration rate of the control (4.76 mm/min), the +20%, +40%, and +60% treatments increased it by 1.13%, 16.67%, and 22.54%, respectively, with the +60% treatment achieving the highest steady-state infiltration rate of 5.83 mm/min. The macroaggregate content in the +40% treatment was 47.70%, significantly higher than in the other treatments, and the improvement in infiltration capacity was mainly attributed to enhanced soil structure. In the +60% treatment, although raindrop splash caused partial destruction of surface aggregates, the abundant overall organic carbon accumulation and well-preserved deep soil structure resulted in the highest steady-state infiltration rate among all treatments, reaching 5.83 mm/min.

Author Contributions

Conceptualization, X.X.; methodology, X.X.; Software, Q.W.; Validation, X.X.; Formal analysis, Y.Q.; Investigation, Y.Q., Q.W., J.W. and Y.W.; Resources, Y.Q., Q.W., J.W. and Y.W.; Writing—original draft, Y.Q.; Writing—review and editing, Q.W.; Visualization, Y.Q.; Supervision, X.X.; Project administration, X.X.; Funding acquisition, X.X. All authors have read and agreed to the published version of the manuscript.

Funding

This research was supported by the National Natural Science Foundation of China (Grant No. 41977426).

Data Availability Statement

We do not provide public access to the dataset due to protection of the privacy of participants. Regarding the details of the data, please contact the corresponding author.

Conflicts of Interest

The authors declare no conflicts of interest.

References

  1. Yin, Z.; Song, X.; Zhou, B.; Jiang, W.; Chen, H.; Wang, H. Traditional meiyu-baiu has been suspended by global warming. Natl. Sci. Rev. 2024, 11, nwae166. [Google Scholar] [CrossRef] [PubMed]
  2. Chen, H.; Sun, J. Contribution of human influence to increased daily precipitation extremes over China. Geophys. Res. Lett. 2017, 44, 2436–2444. [Google Scholar] [CrossRef]
  3. Zhang, W.; Furtado, K.; Wu, P.; Zhou, T.; Chadwick, R.; Marzin, C.; Rostron, J.; Sexton, D. Increasing precipitation variability on daily-to-multiyear time scales in a warmer world. Sci. Adv. 2021, 7, eabf8021. [Google Scholar] [CrossRef] [PubMed]
  4. Kayitesi, N.M.; Guzha, A.C.; Mariethoz, G. Impacts of land use land cover change and climate change on river hydro-morphology—A review of research studies in tropical regions. J. Hydrol. 2022, 615, 128702. [Google Scholar] [CrossRef]
  5. Wei, W.; Chen, L.; Fu, B.; Chen, J. Water erosion response to rainfall and land use in different drought-level years in a loess hilly area of China. CATENA 2010, 81, 24–31. [Google Scholar] [CrossRef]
  6. Zhang, S.; Zhao, G.; Liu, Y.; Tian, P.; Mu, X. Soil infiltration responses to vegetation restoration along a precipitation gradient on the loess plateau. CATENA 2026, 268, 110088. [Google Scholar] [CrossRef]
  7. Wang, L.; Zheng, F.; Hu, W.; Zhang, X.J.; Shi, H. Interactive effects of rainfall intensity, kinetic energy and antecedent soil moisture regime on splash erosion in the ultisol region of south China. CATENA 2023, 222, 106863. [Google Scholar]
  8. Zhao, Y.; Wu, P.; Zhao, S.; Feng, H. Variation of soil infiltrability across a 79-year chronosequence of naturally restored grassland on the loess plateau, China. J. Hydrol. 2013, 504, 94–103. [Google Scholar] [CrossRef]
  9. Vinatier, F.; Rudi, G.; Coulouma, G.; Dagès, C.; Bailly, J.-S. Dynamics of quasi-steady ponded infiltration under contrasting plant cover and management strategies. Soil Tillage Res. 2024, 237, 105985. [Google Scholar] [CrossRef]
  10. Bargués-Tobella, A.; Winowiecki, L.A.; Sheil, D.; Vågen, T.G. Determinants of soil field-saturated hydraulic conductivity across sub-saharan africa: Texture and beyond. Water Resour. Res. 2024, 60, e2023WR035510. [Google Scholar] [CrossRef]
  11. Tang, B.; Jiao, J.; Yan, F.; Li, H. Variations in soil infiltration capacity after vegetation restoration in the hilly and gully regions of the loess plateau, China. J. Soils Sediments 2019, 19, 1456–1466. [Google Scholar]
  12. Rawls, W.J.; Nemes, A.; Pachepsky, Y. Effect of soil organic carbon on soil hydraulic properties. Dev. Soil Sci. 2004, 30, 95–114. [Google Scholar] [CrossRef]
  13. Fu, B.; Liu, Y.; Lü, Y.; He, C.; Zeng, Y.; Wu, B. Assessing the soil erosion control service of ecosystems change in the loess plateau of China. Ecol. Complex. 2011, 8, 284–293. [Google Scholar] [CrossRef]
  14. Niraula, R.; Saleh, A.; Bhattarai, N.; Bajgain, R.; Kannan, N.; Osei, E.; Gowda, P.; Neel, J.; Xiao, X.; Basara, J. Understanding the effects of pasture type and stocking rate on the hydrology of the southern great plains. Sci. Total Environ. 2020, 708, 134873. [Google Scholar] [CrossRef] [PubMed]
  15. Ding, Z.; Su, Z.; Gu, Z.; Wu, X.; Lin, X.; Zhang, Q. Plant diversity and precipitation gradients drive litter return and SOC in alpine vegetation. Carbon Balance Manag. 2025, 21, 3. [Google Scholar] [CrossRef] [PubMed]
  16. Huang, T.; Pang, Z.; Edmunds, W.M. Soil profile evolution following land-use change: Implications for groundwater quantity and quality. Hydrol. Process. 2013, 27, 1238–1252. [Google Scholar]
  17. Mateo, C.; Dezzotti, A.; El Mujtar, V.; Marchelli, P.; Sbrancia, R.; Peñalba, M.G.; Lara, M.; Sola, G. Effects of forest management on vascular plant diversity of mixed temperate nothofagus forests along a precipitation gradient. For. Ecol. Manag. 2025, 593, 122915. [Google Scholar] [CrossRef]
  18. Zhai, C.; Yang, Y.; Kong, L.; Wang, X.; Hou, J.; Zeng, Q.; Ge, A.; Yao, B.; Zhou, Z.; Feng, J.; et al. Nitrogen deposition decouples grassland plant community from soil bacterial and fungal communities along a precipitation gradient. J. Ecol. 2025, 113, 1269–1280. [Google Scholar] [CrossRef]
  19. Sannino, A.; Ghaderpour, E.; Iacobucci, G.; Del Monte, M.; Vergari, F. Insights into global change effects on a Mediterranean rural landscape with badlands: A remote sensing approach on climate and land cover changes. GISci. Remote Sens. 2026, 63, 2662163. [Google Scholar] [CrossRef]
  20. Zhu, L.; Chen, T.; Chen, X.; Liu, S.; Zhou, S.; Wang, S.; Li, W. Investigation of the Key Drivers of Vegetation Change Based on a Paired Land Use Experiment Approach—A Case Study of the Emin River Transboundary Basin. Land 2025, 14, 437. [Google Scholar] [CrossRef]
  21. Price, K.; Jackson, C.R.; Parker, A.J. Variation of Surficial Soil Hydraulic Properties across Land Uses in the Southern Blue Ridge Mountains, North Carolina, USA. J. Hydrol. 2010, 383, 256–268. [Google Scholar] [CrossRef]
  22. Montero, E. Rényi dimensions analysis of soil particle-size distributions. Ecol. Model. 2005, 182, 305–315. [Google Scholar] [CrossRef]
  23. Vitti, C.; Stellacci, A.M.; Leogrande, R.; Mastrangelo, M.; Cazzato, E.; Ventrella, D. Assessment of organic carbon in soils: A comparison between the Springer–Klee wet digestion and the dry combustion methods in Mediterranean soils (Southern Italy). CATENA 2016, 137, 113–119. [Google Scholar] [CrossRef]
  24. Saiedi, N.; Besalatpour, A.A.; Shirani, H.; Abbaszadeh Dehaji, P.; Esfandiarpour, I.; Faramarzi, M. Aggregation and fractal dimension of aggregates formed in sand dunes stabilized by Pistachio PAM and Pistachio PVA c mulches. Eur. J. Soil Sci. 2017, 68, 783–791. [Google Scholar]
  25. Bodner, G.; Leitner, D.; Kaul, H.-P. Coarse and fine root plants affect pore size distributions differently. Plant Soil 2014, 380, 133–151. [Google Scholar] [CrossRef] [PubMed]
  26. Li, C.; Li, Y.; Li, X.; Ma, L.; Xiao, Y.; Zhang, C. Differential responses of plant primary productivity to nutrient addition in natural and restored alpine grasslands in the qinghai lake basin. Front. Plant Sci. 2021, 12, 792123. [Google Scholar] [CrossRef] [PubMed]
  27. Wang, Y.; Hong, Y.; Tian, Y.; Tian, G.; Zhang, J.; Wu, H.; Bai, Y.; Qian, J. Changes in bacterial community composition and soil properties altered the response of soil respiration to rain addition in desert biological soil crusts. Geoderma 2022, 409, 115635. [Google Scholar] [CrossRef]
  28. Li, R.; Kan, S.; Zhu, M.; Chen, J.; Ai, X.; Chen, Z.; Zhang, J.; Ai, Y. Effect of different vegetation restoration types on fundamental parameters, structural characteristics and the soil quality index of artificial soil. Soil Tillage Res. 2018, 184, 11–23. [Google Scholar] [CrossRef]
  29. Shi, J.; Cui, L. Soil carbon change and its affecting factors following afforestation in China. Landsc. Urban Plan. 2010, 98, 75–85. [Google Scholar] [CrossRef]
  30. Yang, Y.; Luo, Y. Carbon: Nitrogen stoichiometry in forest ecosystems during stand development: C:N stoichiometry over age sequence. Glob. Ecol. Biogeogr. 2011, 20, 354–361. [Google Scholar]
  31. Qiao, Y.; Zhu, H.; Zhong, H.; Li, Y. Stratified data reconstruction and spatial pattern analyses of soil bulk density in the northern grasslands of China. ISPRS Int. J. Geo-Inf. 2020, 9, 682. [Google Scholar] [CrossRef]
  32. Dreesen, F.E.; De Boeck, H.J.; Janssens, I.A.; Nijs, I. Summer heat and drought extremes trigger unexpected changes in productivity of a temperate annual/biannual plant community. Environ. Exp. Bot. 2012, 79, 21–30. [Google Scholar] [CrossRef]
  33. Bakker, E.S.; Olff, H. Impact of different-sized herbivores on recruitment opportunities for subordinate herbs in grasslands. J. Veg. Sci. 2003, 14, 465–474. [Google Scholar] [CrossRef]
  34. Hautier, Y.; Seabloom, E.W.; Borer, E.T.; Adler, P.B.; Harpole, W.S.; Hillebrand, H.; Lind, E.M.; MacDougall, A.S.; Stevens, C.J.; Bakker, J.D.; et al. Eutrophication weakens stabilizing effects of diversity in natural grasslands. Nature 2014, 508, 521–525. [Google Scholar] [CrossRef] [PubMed]
  35. Wiesmeier, M.; Urbanski, L.; Hobley, E.; Lang, B.; Von Lützow, M.; Marin-Spiotta, E.; Van Wesemael, B.; Rabot, E.; Ließ, M.; Garcia-Franco, N.; et al. Soil organic carbon storage as a key function of soils—A review of drivers and indicators at various scales. Geoderma 2019, 333, 149–162. [Google Scholar]
  36. Wen, T.; Wang, P.; Shao, L.; Guo, X. Experimental investigations of soil shrinkage characteristics and their effects on the soil water characteristic curve. Eng. Geol. 2021, 284, 106035. [Google Scholar] [CrossRef]
  37. Feeney, D.S.; Crawford, J.W.; Daniell, T.; Hallett, P.D.; Nunan, N.; Ritz, K.; Rivers, M.; Young, I.M. Three-dimensional microorganization of the soil–root–microbe system. Microb. Ecol. 2006, 52, 151–158. [Google Scholar] [PubMed]
  38. Ouattara, K.; Ouattara, B.; Assa, A.; Sédogo, P.M. Long-term effect of ploughing, and organic matter input on soil moisture characteristics of a ferric lixisol in burkina faso. Soil Tillage Res. 2006, 88, 217–224. [Google Scholar] [CrossRef]
  39. Merino-Martín, L.; Stokes, A.; Gweon, H.S.; Moragues-Saitua, L.; Staunton, S.; Plassard, C.; Oliver, A.; Le Bissonnais, Y.; Griffiths, R.I. Interacting effects of land use type, microbes and plant traits on soil aggregate stability. Soil Biol. Biochem. 2021, 154, 108072. [Google Scholar] [CrossRef]
  40. Moreno-de Las Heras, M. Development of soil physical structure and biological functionality in mining spoils affected by soil erosion in a mediterranean-continental environment. Geoderma 2009, 149, 249–256. [Google Scholar] [CrossRef]
  41. Abiven, S.; Menasseri, S.; Angers, D.A.; Leterme, P. Dynamics of aggregate stability and biological binding agents during decomposition of organic materials. Eur. J. Soil Sci. 2007, 58, 239–247. [Google Scholar] [CrossRef]
  42. Qu, Y.; Wu, Q.; Khan, F.U.; Wang, J.; Ren, X.; Chai, X.; Xu, X.; Du, F. The impact of root systems on soil macropore abundance and soil infiltration capacity. Plant Soil. 2025, 513, 1197–1214. [Google Scholar] [CrossRef]
  43. Wu, W.; Chen, G.; Meng, T.; Li, C.; Feng, H.; Si, B.; Siddique, K.H.M. Effect of different vegetation restoration on soil properties in the semi-arid loess plateau of China. CATENA 2023, 220, 106630. [Google Scholar]
  44. Mawodza, T.; Menon, M.; Brooks, H.; Magdysyuk, O.V.; Burca, G.; Casson, S. Preferential wheat (Triticum aestivum. L cv. Fielder) root growth in different sized aggregates. Soil Tillage Res. 2021, 212, 105054. [Google Scholar] [CrossRef]
Figure 1. Study area.
Land 15 01104 g001
Figure 2. Site facilities.
Land 15 01104 g002
Figure 3. Composition of water-stable soil aggregates under different precipitation changes.
Land 15 01104 g003
Figure 4. Soil Aggregate Characteristics. Note: (a) presents the Mean Weight Diameter (MWD) of soil aggregates. (b) displays the Geometric Mean Diameter (GMD) of soil aggregates. (c) illustrates the Fractal Dimension (D) of soil aggregates. (d) shows the content of water-stable soil aggregates with a particle size greater than 0.25 mm. Different lowercase letters indicate significant differences (p < 0.05) among different precipitation change treatments.
Land 15 01104 g004
Figure 5. Soil water infiltration time and rate under different rainfall treatments.
Land 15 01104 g005
Figure 6. Soil Water Infiltration Rate. Note: IIR: initial infiltration rate; SIR: steady infiltration rate; AIR: average infiltration rate. Different lowercase letters indicate the significant differences between different depths of each plot (p < 0.05).
Land 15 01104 g006
Figure 7. Correlation Analysis of Soil Infiltration Rates and Influencing Factors.
Land 15 01104 g007
Table 1. Physical properties of soil in 0–5 cm and 5–20 cm layers in different rainfall gradient sample sites.
PlotSoil LayerSoil Bulk
Density
Total PorositySoil Organic
Carbon
Mechanical Components
(cm)(g/cm3)(%)(g·kg−1)Sandy Particles Silt ParticlesClay Particles
CK0~51.09 ± 0.01 ab58.98 ± 0.48 cd5.70 ± 0.17 d34.42 ± 0.19 a54.99 ± 0.17 b10.58 ± 0.19 ab
5~201.19 ± 0.03 ab55.05 ± 1.30 cd4.08 ± 1.18 a32.49 ± 0.42 b57.00 ± 0.30 bc10.51 ± 0.59 b
A+0~51.08 ± 0.01 ab59.15 ± 0.17 cd7.32 ± 0.29 c32.07 ± 0.57 ab58.39 ± 0.87 a9.54 ± 0.52 bc
5~201.23 ± 0.02 a53.73 ± 0.75 d3.66 ± 0.18 ab28.70 ± 1.09 c59.66 ± 0.54 a11.64 ± 0.55 a
B+0~51.01 ± 0.01 d61.72 ± 0.35 a9.26 ± 0.12 a32.14 ± 2.06 ab56.53 ± 2.17 ab11.33 ± 0.14 a
5~201.10 ± 0.02 d58.68 ± 0.71 a3.30 ± 0.02 abc33.63 ± 2.32 ab55.24 ± 2.19 c11.13 ± 0.29 ab
C+0~51.04 ± 0.01 cd60.86 ± 0.42 ab9.30 ± 0.20 a31.18 ± 1.31 b57.39 ± 0.23 ab11.43 ± 1.26 a
5~201.13 ± 0.01 cd57.46 ± 0.21 ab3.40 ± 0.16 ab33.64 ± 1.04 ab55.79 ± 0.29 c10.57 ± 0.75 b
A−0~51.06 ± 0.03 bc60.10 ± 1.14 bc5.99 ± 0.15 d31.39 ± 2.38 b58.81 ± 1.96 a9.80 ± 0.54 bc
5~201.19 ± 0.03 ab54.99 ± 1.2 cd3.09 ± 0.15 bc31.10 ± 2.70 bc58.22 ± 2.38 ab10.68 ± 0.41 b
B−0~51.11 ± 0.02 a58.17 ± 0.87 d8.44 ± 0.13 b31.08 ± 0.82 b58.55 ± 0.60 a10.37 ± 0.39 ab
5~201.15 ± 0.02 bc56.46 ± 0.69 bc3.28 ± 0.05 abc29.59 ± 0.65 c59.33 ± 0.56 ab11.08 ± 0.27 ab
C−0~51.09 ± 0.01 a58.71 ± 0.41 d7.00 ± 0.22 c34.71 ± 1.74 a56.40 ± 2.15 ab8.89 ± 0.44 c
5~201.19 ± 0.03 ab55.05 ± 1.30 cd2.46 ± 0.23 c32.49 ± 0.42 b57.00 ± 0.30 bc10.51 ± 0.59 b
Note: Values are represented as mean ± standard error (n = 3). Different lowercase letters indicate significant differences (p < 0.05) in the same soil layer parameters across different plots. CK represents the control group, A+ indicates a 20% increase in rainfall, B+ indicates a 40% increase in rainfall, C+ indicates a 60% increase in rainfall, A− indicates a 20% decrease in rainfall, B− indicates a 40% decrease in rainfall and C− indicates a 60% decrease in rainfall.
Disclaimer/Publisher’s Note: The statements, opinions and data contained in all publications are solely those of the individual author(s) and contributor(s) and not of MDPI and/or the editor(s). MDPI and/or the editor(s) disclaim responsibility for any injury to people or property resulting from any ideas, methods, instructions or products referred to in the content.