Article

Inclusive Innovation Spaces in Changsha: Spatial Distribution, Agglomeration Characteristics, and Driving Factors


School of Architecture and Art, Central South University, Changsha 410083, China
*
Author to whom correspondence should be addressed.
Land 2026, 15(6), 1102; https://doi.org/10.3390/land15061102
Submission received: 9 May 2026 / Revised: 16 June 2026 / Accepted: 16 June 2026 / Published: 22 June 2026

Abstract

Against the backdrop of China’s urban modernization pathway, the core value of urban innovation systems is increasingly shifting toward an inclusive orientation. Grounded in the theoretical connotation of inclusive urban innovation, this study establishes an evaluation index system covering equal participation opportunities, procedural fairness, and outcome sharing, and applies the entropy method, kernel density analysis, and spatial autocorrelation to empirically examine the spatial distribution characteristics and formation mechanisms of inclusive innovation spaces in Changsha. The results show that (1) Changsha’s inclusive innovation level presents a gradient decline from the central urban area to the periphery; (2) high–high clusters mainly in areas with stronger innovation–resource concentration and better public service conditions, such as Yuelu District and other districts associated with major innovation platforms. Low–low agglomeration zones cluster in peripheral urban areas like certain townships in Liuyang City and remote regions of Ningxiang City; (3) the spatial differentiation of inclusive innovation is jointly shaped by multiple factors, among which Cultural Education and Industrial Structure show relatively stronger explanatory power; and (4) improving inclusive innovation requires enhancing not only innovation agglomeration, but also public service accessibility, talent support, employment inclusion, and the local sharing of innovation outcomes. This study provides a systematic framework for evaluating urban inclusive innovation space and offers policy insights for promoting balanced and inclusive innovation development in regional innovation cities.

1. Introduction

Cities, as pivotal engines of regional economic development, contribute over 60% to regional growth through enhanced innovation capacity, with the scientificity of innovation resource allocation and spatial organization emerging as a key criterion for evaluating urban comprehensive competitiveness [1]. Guided by the fundamental value pursuit of “achieving common prosperity for all people” in China’s modernization drive [2], the innovation-driven development strategy has become an indispensable pillar of sustained progress. Against this backdrop, integrating innovation-led growth with inclusive development has become an inevitable requirement for high-quality urban development, serving as a critical pathway to narrowing regional disparities and promoting coordinated progress [3]. A pressing challenge for contemporary cities thus lies in balancing innovation vitality with the equity of spatial resource allocation, realizing their organic unification and synergistic advancement [4].
Research on innovation spaces is evolving from classical innovation theory to spatially embedded and socially oriented perspectives. Schumpeter’s innovation theory laid the foundation for understanding innovation as a key driver of economic development [5], while Perroux’s growth pole theory linked innovation with spatial organization by emphasizing agglomeration and diffusion effects in specific regions [6]. With globalization and informatization, scholars have increasingly focused on the dynamic evolution of innovation spaces, cross-regional cooperation, and the interaction between innovation activities and socioeconomic environments [7]. Castells’ network society theory further highlights how information networks reshape the organizational forms and functional layouts of innovation spaces [8]. In China, related research emerged in the 1990s and has gradually shifted from theoretical introduction to localized empirical analysis, covering the connotation, spatial structure, evaluation system, and planning strategies of innovation spaces [9,10]. Existing studies have mainly focused on innovation-oriented metropolises such as Beijing, Shanghai, and Shenzhen, and have confirmed the important role of innovation spaces in promoting urban innovation capacity and spatial restructuring [11].
Nevertheless, most existing studies emphasize the agglomeration efficiency and development models of innovation spaces, while paying insufficient attention to their inclusiveness. Specifically, it remains unclear whether areas with concentrated innovation resources also provide equal access to innovation opportunities, fair participation conditions, and shared innovation outcomes. To address this gap, spatial justice and inclusive city theories provide useful perspectives. Spatial justice theory stems from critical reflections on spatial inequality. Lefebvre first proposed the concept of urban rights, defining it as “the right of all urban residents not to be excluded from daily life spaces, not to be deprived of urban development benefits, and to access urban renewal processes” [12]. Soja further developed the concept of spatial justice and emphasized the mutual shaping relationship between space and society [13]. In parallel, the concept of Inclusive Cities was formally proposed by UN-Habitat in 2000, underpinned by distinct dual social contexts at both international and domestic levels. Internationally, issues such as the proliferation of urban slums, exclusion of transnational migrants (refugees), and racial–religious spatial segregation have become increasingly prominent [14]. Domestically, the context stemmed more from invisible exclusionary issues under the household registration system, such as the ‘compound dual structure’ and the marginalisation of ‘low-skilled labour’. In the World Urban Report 2020, UN-Habitat (2020) established an inclusive cities framework that closely links spatial justice with the Sustainable Development Goals (SDGs), strengthening their theoretical bond [15]. Participatory planning and recent studies on spatial justice also suggest that inclusiveness is a core dimension of equitable spatial governance [16,17]. UNESCO’s Guidelines for Cultural Policies in Cities advances the practical combination of cultural inclusivity and spatial justice. Together, they provide a sound theoretical and practical basis for equitable and sustainable spatial governance.
Based on these theoretical developments, this study introduces the perspectives of spatial justice and inclusive cities into the analysis of urban innovation spaces and proposes the concept of inclusive innovation space. Unlike traditional approaches that mainly focus on innovation factor agglomeration or technological output, inclusive innovation space emphasizes whether innovation resources are accessible, whether innovation processes are fair, and whether innovation outcomes are widely shared. It therefore provides a systematic framework based on opportunity inclusion, process inclusion, and outcome inclusion.
This perspective is particularly relevant to the current development of Chinese innovation cities. According to the Global Innovation Hubs Index 2025 [18], jointly released by the Center for Industrial Development and Environmental Governance of Tsinghua University and Springer Nature, Chinese cities have shown strong performance in global innovation networks [19]. Beijing ranked third globally, and the Guangdong–Hong Kong–Macao Greater Bay Area rose to fourth place. Changsha also entered the global top 100, ranking 76th overall. These rankings indicate that China’s urban innovation development is no longer limited to a few top-tier innovation hubs, but is increasingly reflected in the growth of regional innovation cities.
As a core city in the Middle Yangtze River Urban Agglomeration, Changsha shoulders the dual missions of the “Three Highlands and Four New Missions” strategy and the “Strong Provincial Capital” strategy. In 2024, Changsha’s GDP exceeded 1.5 trillion yuan, with high-tech industry added value accounting for 35% of the total, solidifying innovation as the core driver of urban development. The report shows its scientific center ranking, 39th, was significantly higher than its innovation highland and innovation ecosystem rankings, 86th and 98th, respectively. Moreover, Changsha was listed among the top 20 cities in the research institution indicator, indicating the international visibility of its university and research-institution base. However, its innovation ecosystem score remained relatively modest, 63.33, with relatively limited performance in openness and cooperation, entrepreneurship support, and innovation culture. This indicates that Changsha has relatively strong scientific-center foundations but still needs to improve its innovation ecosystem. At the same time, Changsha differs from top-tier global innovation hubs. It is better understood as a regional innovation city with a relatively strong scientific foundation but a still-developing innovation ecosystem. This feature makes Changsha a useful case for examining how regional cities coordinate innovation agglomeration with inclusive development. Therefore, the study of Changsha is not intended to present it as a top-tier global innovation hub, but to examine how a regional innovation city organizes innovation spaces and coordinates innovation agglomeration with inclusive development. Specifically, the core research questions of this paper are as follows:
What is the nature of inclusive innovation spaces in Changsha, and what are their spatial pattern characteristics?
Which factors dominate the spatial differentiation pattern of inclusive innovation in Changsha?

2. Materials and Methods

2.1. Study Area

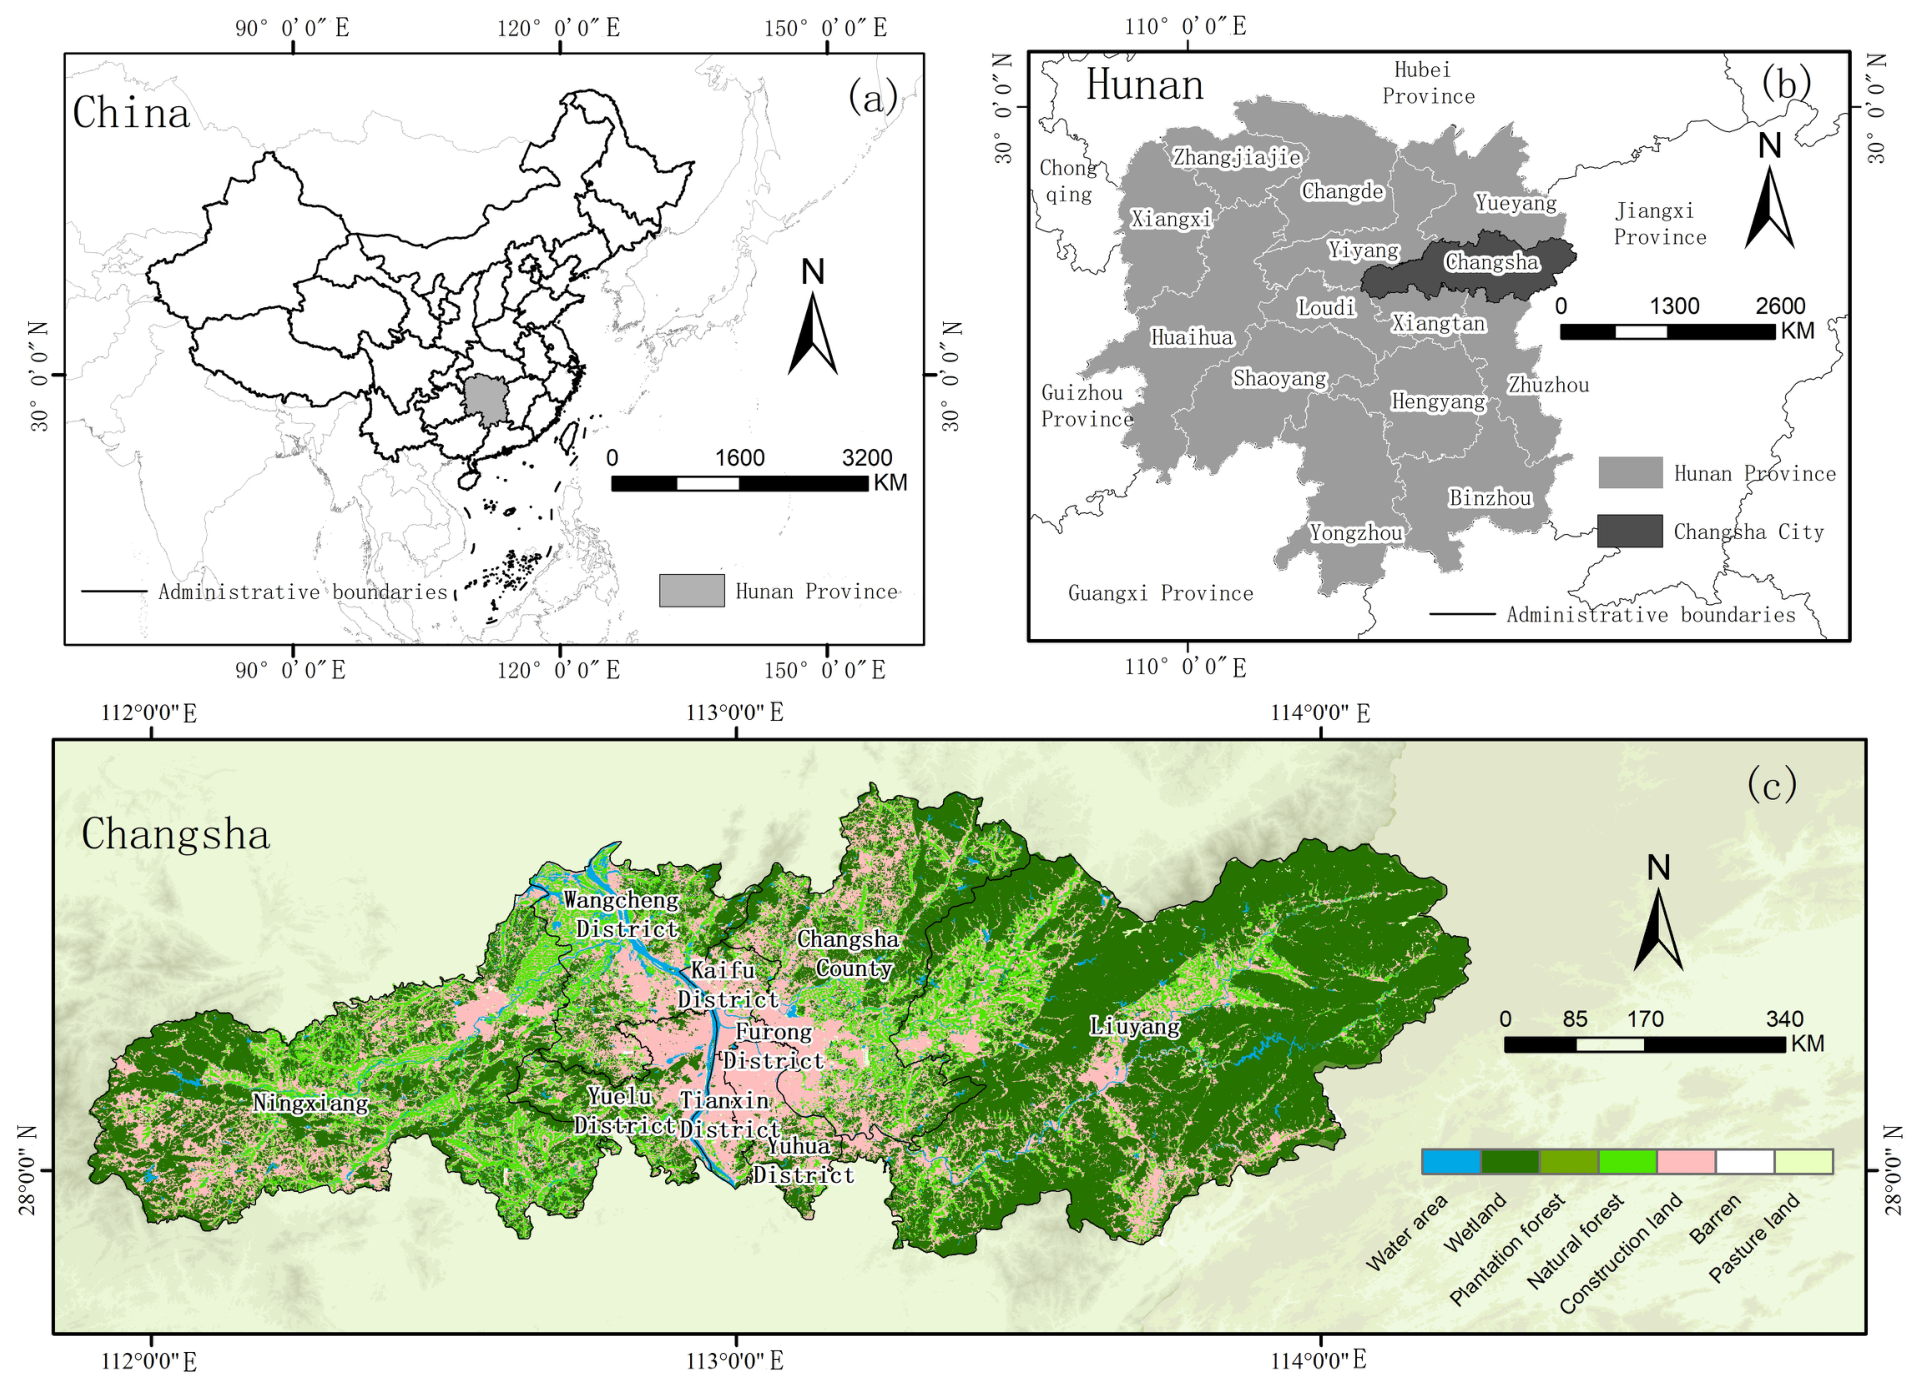
This study defines the entire administrative area of Changsha City as the geographical scope for empirical analysis (see Figure 1 for specific boundaries). This scope fully encompasses all nine districts under its jurisdiction (Yuelu District, Furong District, Tianxin District, Kaifu District, Yuhua District, and Wangcheng District, Changsha County, Ningxiang City, and Liuyang City).

2.2. Data Sources

Some official statistical indicators for 2025 had not yet been fully released at the time of this study, so this research used 2024 data as the latest complete and comparable annual dataset. This ensured consistency across indicators and data sources. The data for this study primarily originates from four sources: First, government statistical data, including the Changsha Statistical Yearbook, the Changsha Science and Technology Statistical Yearbook, and the Changsha National Economic and Social Development Statistical Bulletin, which provide macroeconomic indicators such as total economic output, industrial structure, and innovation investment. Second, enterprise microdata, collected through platforms like the National Enterprise Credit Information Publicity System and Qichacha, which gather information on high-tech enterprises’ registered addresses, primary business operations, and patent application volumes. Research institution data was sourced from university websites and annual reports of research institutes, compiling spatial distributions and research directions of platforms like key laboratories and engineering technology research centers. Finally, spatial geographic data—including map data and certain influencing factor data—was obtained from the Open Street Map (OSM) dataset. Table 1 shows the detailed information of datasets.

2.3. Identification Innovation Spaces

Currently, the academic community has yet to reach a unified consensus on the concept of “innovation space.” Generally speaking, this concept does not refer to a specific spatial form but rather broadly denotes a comprehensive spatial system and structural network characterized by extensive coverage and diverse structures. In terms of understanding, researchers typically define it along two dimensions: broadly and narrowly. Broadly, it is viewed as the comprehensive spatial environment that underpins various innovative activities within cities; narrowly, it specifically denotes the physical locations or functional zones directly hosting innovation activities and innovation actors [9]. This study adopts a broad perspective, conceptualizing urban innovation spaces as holistic environments that provide suitable conditions and specialized support services for diverse innovation actors.
Drawing on existing studies on the identification and evaluation of technological innovation spaces, this study used valid invention patents and high-tech enterprises as key indicators for identifying innovation spaces in Changsha. Valid invention patent data were obtained from the Wanfang Patent Search Platform (https://c.wanfangdata.com.cn/patent, accessed on 1 October 2025) by using “Changsha” as the application address and “valid” as the application status. After data cleaning and spatial screening, patent records within the study area were retained, including applicant, application date, application status, application address, and other attributes.
High-tech enterprise data were obtained from the Qichacha platform. Enterprises were retrieved by setting the enterprise address as “Changsha” and the registration status as “normal,” with labels including private technology enterprises, specialized and sophisticated little giant enterprises, technological innovation demonstration enterprises, and enterprise technology centers. After data cleaning, high-tech enterprise records from 2024 were obtained, including enterprise name, establishment date, registered capital, industry type, operating status, and address.
On this basis, patent and high-tech enterprise data were combined with innovation-related POI data to identify innovation spaces more accurately. Patent and enterprise addresses were first geocoded to locate innovation activities. Innovation-related POIs, including high-tech zones, industrial parks, science parks, incubators, maker spaces, research institutions, and technology service platforms, were then extracted to identify the spatial carriers of innovation. Finally, the geocoded innovation–activity data were spatially matched with POI data. Spaces where patent or high-tech enterprise records corresponded with innovation-related POIs were identified as innovation spaces.

2.4. Research Methodology

2.4.1. Entropy Method

This method aims to objectively determine the weight of urban inclusive innovation evaluation indicators, avoid the subjective judgment bias that may exist in the analytic hierarchy process and expert scoring method, and adapt to the data-driven quantitative evaluation needs of this study. Specifically, the entropy method is used to assign values to each evaluation index, and the linear weighted synthesis method is used to quantitatively evaluate the urban inclusive innovation level of each administrative unit in Changsha City. In the process of data processing, the original data is first dimensionlessly processed by the range standardization method, and then the weight coefficients of each index are obtained by information entropy calculation.

2.4.2. Kernel Density Estimation Method

This method is used to visualize the agglomeration intensity and hot spots of innovation space, and intuitively present the spatial distribution characteristics of high-tech enterprises. The specific operation is as follows: Obtain the relevant city point of interest (POI) data through the map platform API. At the same time, based on the data of the 2024 statistical yearbook of Changsha City and the policy documents of the Science and Technology Bureau, the kernel density estimation method is used to visualize the spatial distribution of high-tech enterprises. By calculating the density of enterprises per unit area, the degree of agglomeration of innovation space and the scope of hot spots are clarified.

2.4.3. Spatial Autocorrelation Analysis

This method is used to test the spatial dependence and agglomeration mode of innovation space, and systematically reveal its spatial distribution law. Specifically, the spatial autocorrelation analysis method is used to detect the overall agglomeration trend and local heterogeneity characteristics of the spatial distribution of innovation from the global and local levels, so as to systematically explain the dependence and difference laws presented in the spatial dimension.

2.4.4. Geographical Detector

The geographical detector model was selected to further analyze the factors influencing urban inclusive innovation. The geographical detector used to detect spatial heterogeneity and its driving forces, as well as to explain the extent to which these factors exert influence. This model is well-suited for handling mixed-type data; in this study, factor interaction detection was employed to examine the varying effects of specific geographical factors on urban inclusive innovation.

2.4.5. Pearson Correlation Analysis

Pearson correlation analysis was used to examine the linear relationships among the selected influencing factors of urban inclusive innovation. The coefficient ranges from −1 to 1. Positive values indicate positive linear associations, negative values indicate negative linear associations, and larger absolute values indicate stronger correlations.

2.5. Urban Inclusive Innovation and Measurement Framework

2.5.1. Urban Inclusive Innovation

Spatial justice is the core value of inclusive cities and provides a fairness-oriented theoretical foundation for urban development. Innovative spaces act as important practical carriers for inclusive urban ideas. In this context, the inclusive innovation proposed in this study essentially reflects the values of spatial justice in the governance of innovative spaces. It also represents an important path for the two theories to move from conceptual integration to practical application. Inclusive innovation is not measured solely by narrowly defined inputs and outputs of innovation; but as a systemic interaction among innovation actors, innovation resources, spatial carriers, institutional conditions, and outcome-sharing mechanisms. rather, it should be understood as a regional innovation ecosystem—one in which diverse actors can access opportunities for innovation, participate in the innovation process under relatively equitable spatial and institutional conditions, and share in the public benefits and economic gains generated by innovation-driven development [20]. It clarifies that inclusive innovation is not only related to innovation output, but also to the accessibility of resources, fairness of participation, and diffusion of innovation benefits. Therefore, an assessment of urban inclusive innovation should encompass the following dimensions: Opportunity inclusiveness, Process inclusiveness and Outcome inclusiveness.

2.5.2. Three Dimensions of Inclusive Urban Innovation System

Within this system, opportunity inclusion, process inclusion, and outcome inclusion are interrelated rather than independent. Opportunity inclusion refers to whether different groups can obtain access to innovation-related resources and basic supporting conditions [21], such as housing support, public transport accessibility, employment opportunities, and innovation service facilities. Process inclusion emphasizes whether different actors can participate in innovation activities under relatively fair institutional, service, and spatial conditions [22], including public service sharing, income fairness among different skill groups, and access to innovation support. Outcome inclusion focuses on whether innovation achievements can be transformed into local employment, industrial upgrading, public welfare improvement, and shared urban benefits [23].
These three dimensions form a circular and mutually reinforcing relationship. Better opportunity inclusion can expand the range of actors who are able to participate in innovation activities. Fairer process inclusion can improve the quality and continuity of such participation. Broader outcome inclusion can further strengthen the social and spatial foundation for future innovation by creating employment, improving public services, and enhancing the local diffusion of innovation benefits. Conversely, insufficient opportunity inclusion may restrict participation at the initial stage; unfair participation conditions may weaken the inclusiveness of the innovation process; and limited outcome sharing may reduce the broader social benefits of innovation. Based on this logic, the specific classification framework is as follows:
(1)
The “opportunity-inclusive” innovation space which primarily reflects whether different social groups can equitably obtain the basic conditions for participating in innovation activities. This dimension emphasizes the entry barriers and spatial accessibility of innovation opportunities, and focuses on whether different groups have the basic conditions to access innovation resources, employment opportunities and entrepreneurship support.
(2)
The “process-inclusive” innovation space which primarily reflects the fairness of participation and the degree of service sharing among different entities in the process of innovation activities. This dimension emphasizes fair participation and capacity support in the innovation process, and focus on ordinary workers, such as manufacturing employees and service industry practitioners.
(3)
The “result-inclusive” innovation space that integrates diverse groups reflecting the principle of “innovation dividends shared by all.” This dimension emphasizes whether the employment opportunities, industrial upgrading, and public service improvements brought about by innovation development can benefit a broader urban population, rather than being concentrated only in a small number of innovation entities or core areas.

2.5.3. Indicator System for Influencing Factors

Based on the definition and characteristics of urban inclusive innovation, this paper selects relevant indicators across three dimensions—Opportunity inclusiveness, Process inclusiveness and Outcome inclusiveness—to comprehensively measure and analyze the level of urban inclusive innovation. The indicator system is not limited to narrow innovation inputs and outputs. Instead, it is designed from the perspective of a regional innovation ecosystem, aiming to evaluate systematically the level of inclusive innovation in the city. Therefore, beyond direct innovation-related indicators, such as innovation resources, and education, this study includes several supporting indicators that indirectly shape the inclusive innovation environment. These indicators serve as supplementary variables reflecting mobility conditions, and public service capacity. They are included to enhance the completeness and systemic coverage of the evaluation framework, rather than to equate inclusive innovation with general socioeconomic development.
In terms of equitable participation opportunities, the degree of fairness in urban innovation participation is comprehensively reflected across four dimensions: participating groups, innovation opportunities, innovation resources, and supporting infrastructure.
(1)
Participating Groups: Against the backdrop of accelerated population mobility, the scale of urban migrant populations continues to expand, and the lack of “citizen rights” for these groups warrants urgent attention [24]. Additionally, in certain regions—particularly underdeveloped areas—gender factors may constitute hidden barriers within the education-to-employment pathway, leading to structural exclusion of women from innovation participation [25]. Therefore, the “proportion of non-local permanent residents” and “gender structure proportionality” are employed as dual indicators to quantify the practical foundation for non-traditional dominant groups to engage in innovation.
(2)
Innovation Opportunities: The occupational displacement effect triggered by technological iteration reduces employment capacity for low-skilled labor in innovation-driven cities, creating an opportunity gap for disadvantaged groups to participate in innovation. Enhancing occupational capabilities can effectively strengthen their capacity for innovation practice [26]. Empirically, we select “unemployment registration rate per 10,000 people” and “number of vocational skills training institutions” as quantitative measures, with the former reflecting labor market pressure and the latter indicating the intensity of capacity-building support.
(3)
Innovation Resources: The spatial allocation of innovation resources is a prerequisite for innovation activities [27]. Shared innovation platforms lower innovation barriers by providing inclusive services. Small and medium-sized enterprises (SMEs), serving as the “capillaries” of the innovation ecosystem, possess innovative vitality but face financing constraints. The dual variables “number of maker spaces per 10,000 people” and “coverage rate of incubation services for technology-based SMEs” measure both the supply level of public platforms and the extent of resource empowerment for start-ups.
(4)
Supportive Facilities: Equitable provision of public services and infrastructure is crucial for mitigating social exclusion [28]. This study selects four indicators—”civilian motor vehicle ownership per 10,000 people”, “R&D intensity across society”, “commercial building rental rates by district,” and “hospital beds per 10,000 people”—to construct a quantitative evaluation matrix for supportive facility accessibility. Specifically, “civilian motor vehicle ownership per 10,000 people” is used as an auxiliary proxy for mobility and accessibility. Although it does not directly measure innovation participation, it reflects, to some extent, residents’ ability to access employment, education, entrepreneurship, and innovation service resources [29,30]. “Hospital beds per 10,000 people” reflects the supply capacity of basic public health services. Since health and public service security are important conditions for maintaining labor participation, talent stability, and residents’ willingness to engage in innovation activities [31,32], this indicator is indirectly related to opportunity inclusion.
In the dimension of procedural fairness, the level of fairness is comprehensively reflected through two aspects: the participation rate in innovation skills training and the proportion of ordinary residents (including migrant populations) involved in community innovation deliberations [33]. These aspects quantify the actual degree of integration of different groups (including migrant populations) in the processes of “innovation skill enhancement” and “community innovation decision-making.”
In the dimension of innovation outcome sharing, a systematic assessment is conducted across four levels—scientific and technological development, environmental quality, economic advancement, and social welfare—to evaluate the extent of innovation outcome sharing among different groups.
(1)
Scientific and technological development outcomes: As a direct manifestation of innovation outcomes, the value of technology contracts concluded per 10,000 people and the number of patent applications granted per 10,000 people are used to measure societal sharing of technological progress achievements.
(2)
Environmental Quality Improvement: As an indirect benefit of innovation [34,35], the decline rate of energy consumption per 10,000 yuan of GDP and the rate of harmless treatment of domestic waste are selected to reflect innovation’s contribution to environmental sustainability.
(3)
Economic Enhancement Effect: As a direct reflection of innovation’s economic outcomes [36], per capita regional GDP and per capita disposable income are used to evaluate the social sharing of economic development achievements.
(4)
Social Welfare Enhancement: As an indirect social benefit of innovation development [37], indicators such as the number of social work institutions providing accommodation per 10,000 people and the number of beds in residential care facilities per 10,000 people measure the allocation of social welfare resources and the sharing mechanisms.
This paper uses the entropy method to determine the index weight. This method is more objective than the analytic hierarchy process and the expert scoring method. It can quantify the weight based on the original data of the inclusive innovation index of the Changsha municipal district, avoid the subjective judgment deviation, and more suitable for the empirical analysis logic driven by the data of this study. The specific operation is as follows: Firstly, the original data are obtained by statistics, and the range method is used for standardization. Then, the index weight is determined by extracting information entropy. The specific composition indexes and their weights are shown in the following table.
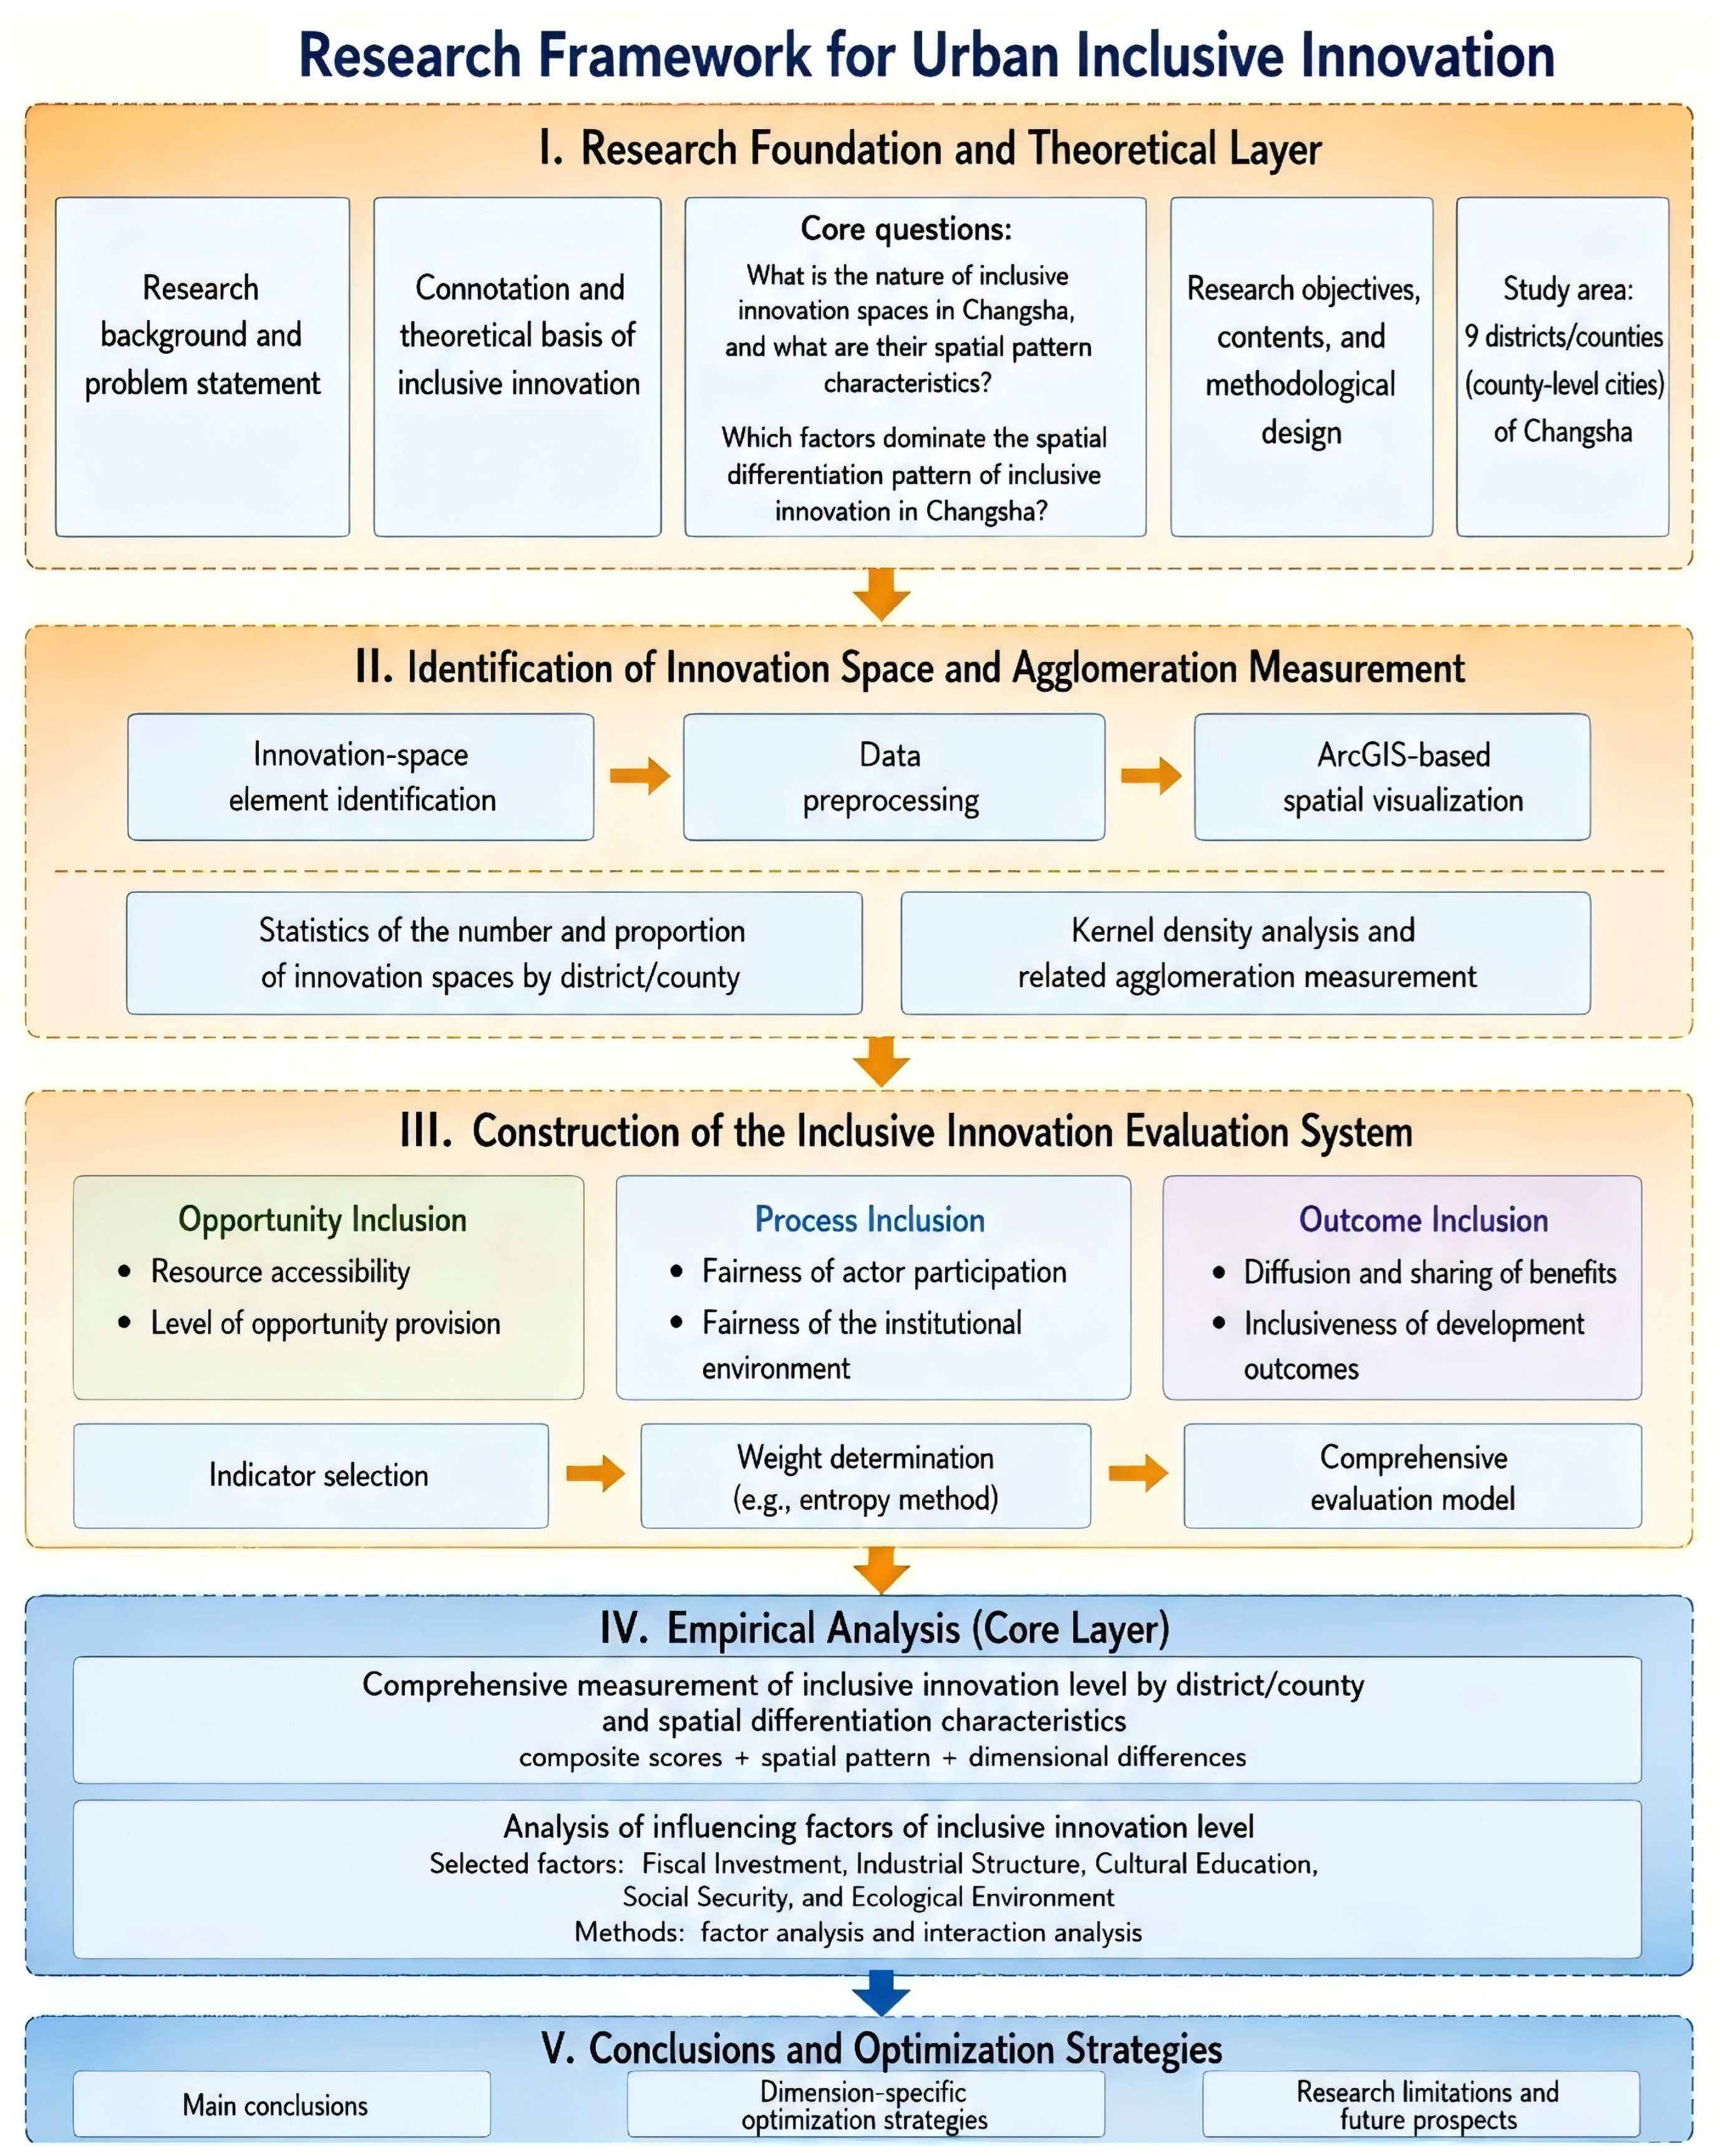
According to the aforementioned research foundation and logic, this study constructs a theoretical model for assessing the level of inclusive innovation in cities (Figure 2).

3. Results

3.1. Spatial Distribution Characteristics of Innovation Spaces in Changsha

3.1.1. Distribution Points of Changsha’s Innovation Spaces

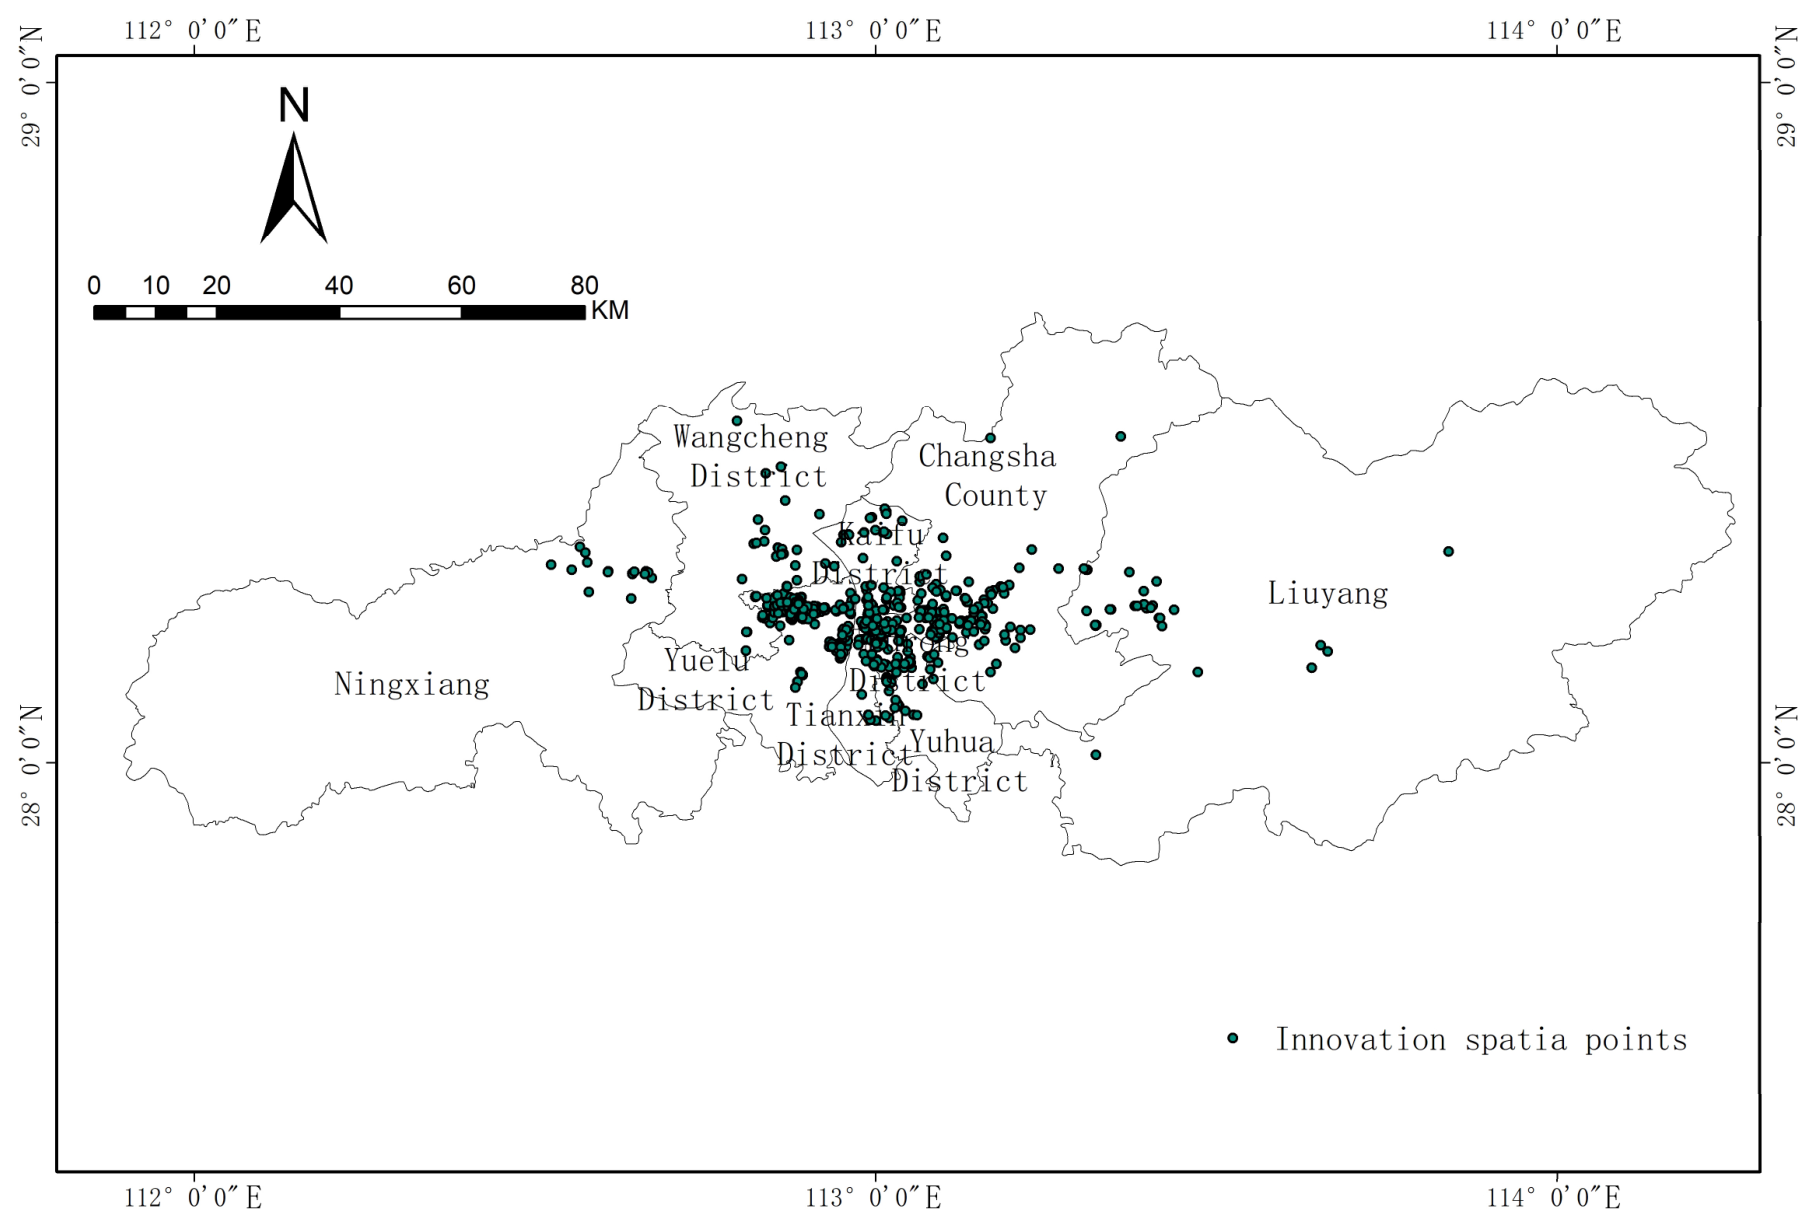
The preprocessed data was visualized spatially in ArcGIS 10.7 (see Figure 3). The proportions of innovation space across districts and counties of Changsha are calculated as follows: Yuelu District 29.7%, Furong District 16.8%, Yuhua District 13.2%, Tianxin District 12.1%, Kaifu District 9.6%, Changsha County 7.1%, Wangcheng District 5.5%, Liuyang City 3.3%, Ningxiang City 2.7%. The analysis indicates that:
(1)
Innovation spaces exhibit widespread distribution across the entire Changsha metropolitan area, with all nine subordinate administrative districts hosting innovation carriers of varying scales.
(2)
In terms of the number of innovation spaces, Yuelu District outperformed all other administrative districts and ranked first in the city, indicating a high concentration of innovation resources in the area.
(3)
Furong District, Tianxin District and Yuhua District rank the second tier in terms of the scale of innovation spaces, whose combined proportion accounts for 42.1% of the city’s total. In contrast, the scale of innovation space distribution in the remaining county-level administrative areas is relatively limited. Such an uneven spatial distribution not only affects the accessibility of urban innovation resources, but also gives rise to potential regional imbalance in innovation development.
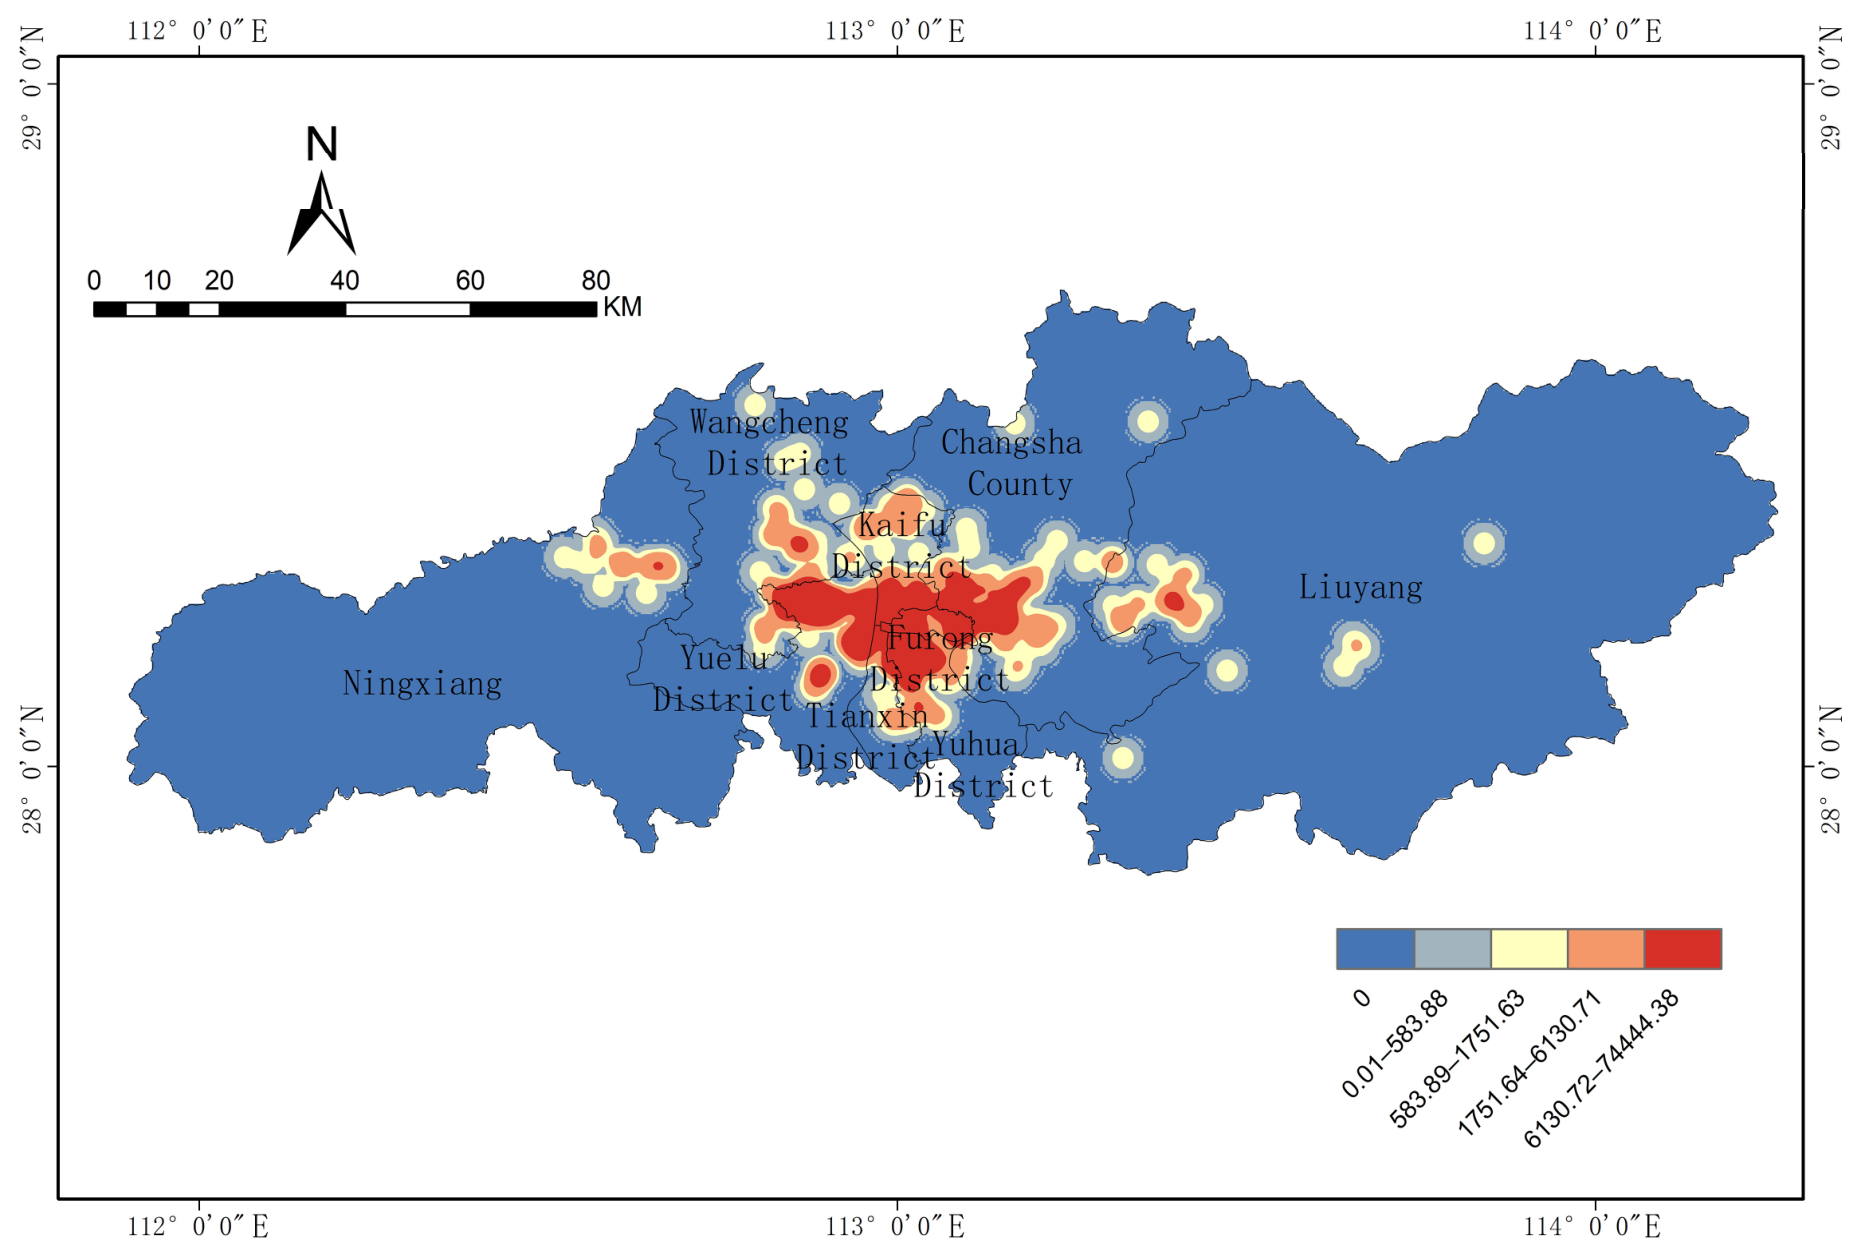
Subsequently, kernel density estimation analysis was performed on the collected innovation space data using ArcGIS 10.7 software. The results revealed that innovation spaces in Changsha exhibit distinct clustering patterns, forming multiple high-density clusters (see Figure 4).The results show the following characteristics:
(1)
Changsha’s innovation platforms exhibit a multi-centered, networked spatial clustering pattern with a pronounced core–periphery structure. Particularly along the Xiangjiang River corridor, various innovation display large-scale, continuous distribution.
(2)
Innovation resources exhibit pronounced spatial differentiation. High-tech industrial parks and economic and technological development zones have become areas with highly concentrated innovation factors. One high-value agglomeration nucleus was identified citywide, primarily distributed within the Changsha High-Tech Industrial Development Zone; one medium-high-value agglomeration nucleus was also found, concentrated in the Changsha Economic and Technological Development Zone; Additionally, nine medium-value clusters exist, most situated within national or provincial-level industrial parks.
(3)
Based on the overlay of the kernel density results with the known distribution of universities and research institutions, this high-density area can be cautiously associated with the Yuelushan University Science and Technology City and its surrounding areas. The presence of Central South University, Hunan University, and other research-oriented institutions provides a plausible explanation for the formation of this innovation cluster.
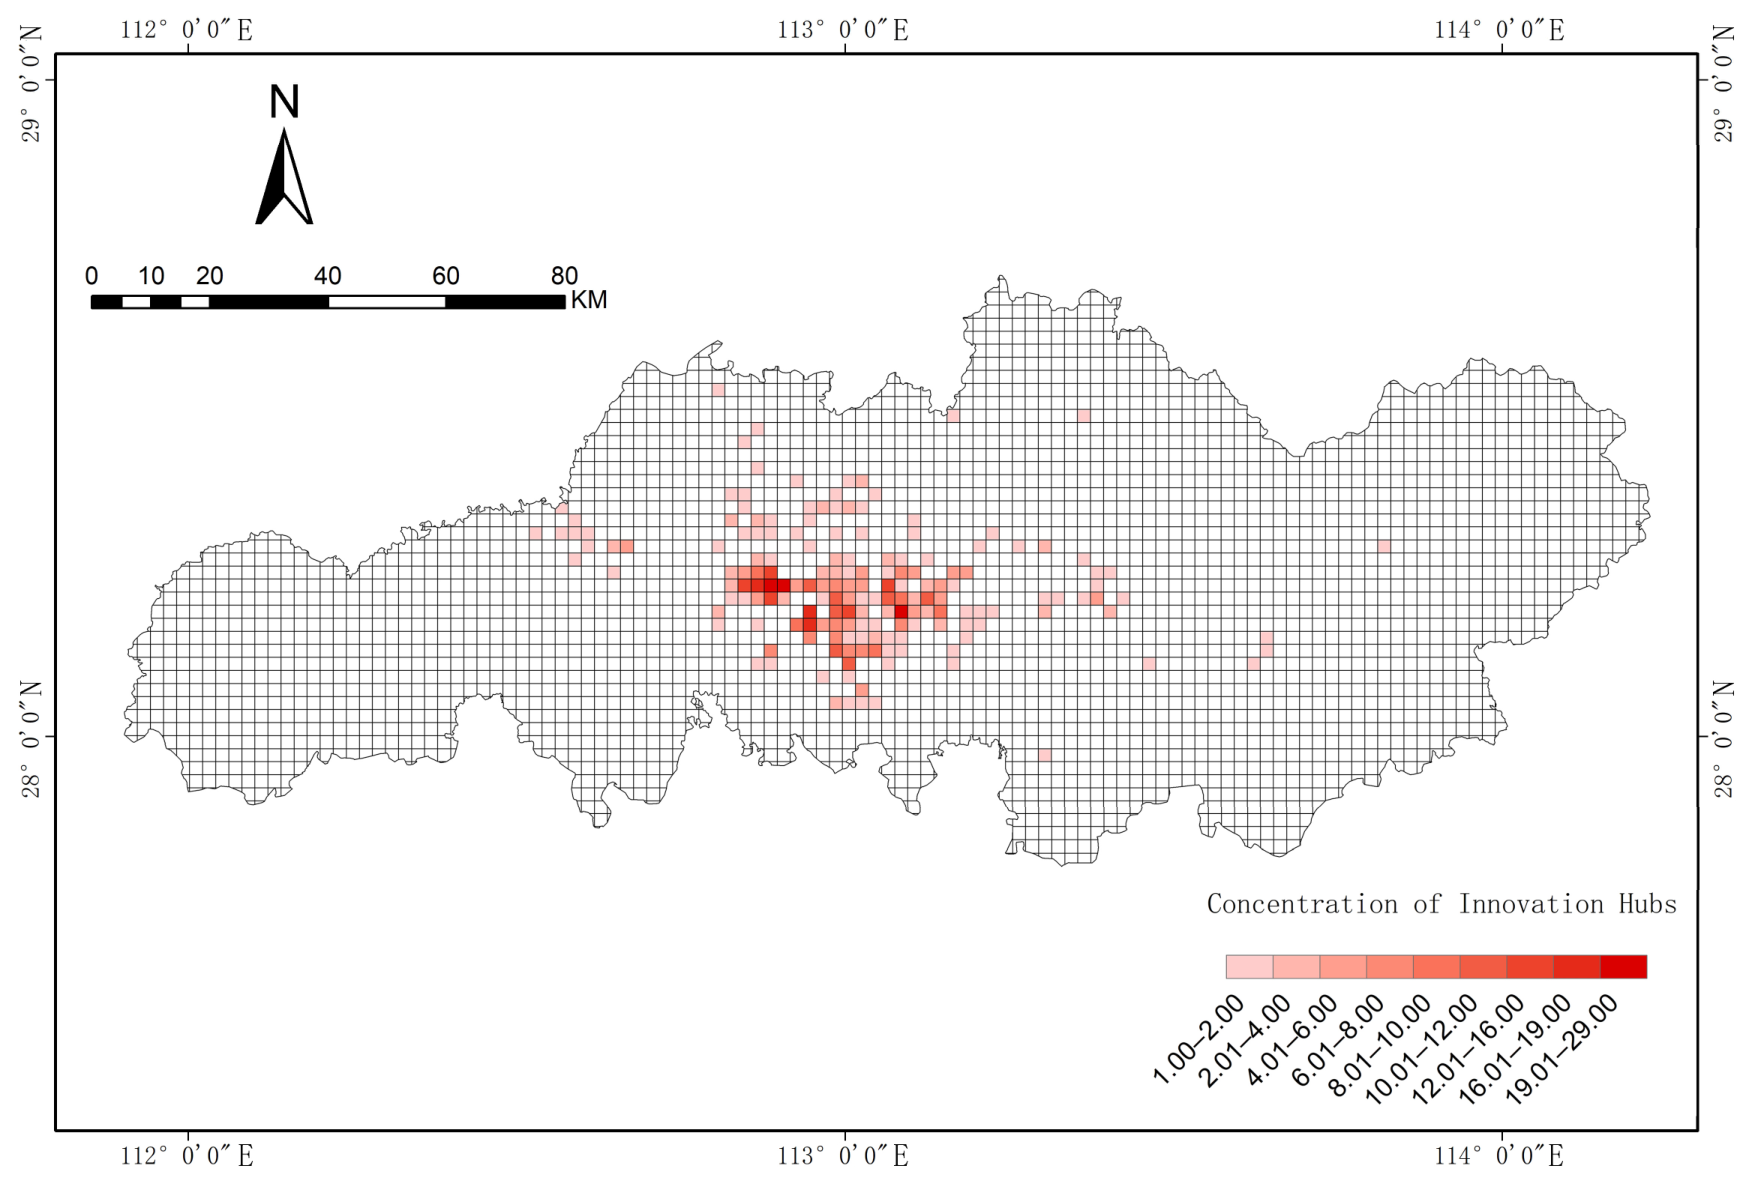
Next, using ArcGIS 10.7 software, a 500 × 500 m grid was constructed. The collected innovation space data was assigned values to attribute them to grid cells. For grid cells not containing innovation space, field calculators replaced null values with 0 to ensure data integrity. Results indicate that Changsha’s innovation spaces exhibit distinct spatial clustering patterns. Districts (cities) farther from the central urban area demonstrate significantly weaker innovation capacity development and lower heat values (see Figure 5).

3.1.2. Distribution of Inclusive Innovation Spaces in Changsha City

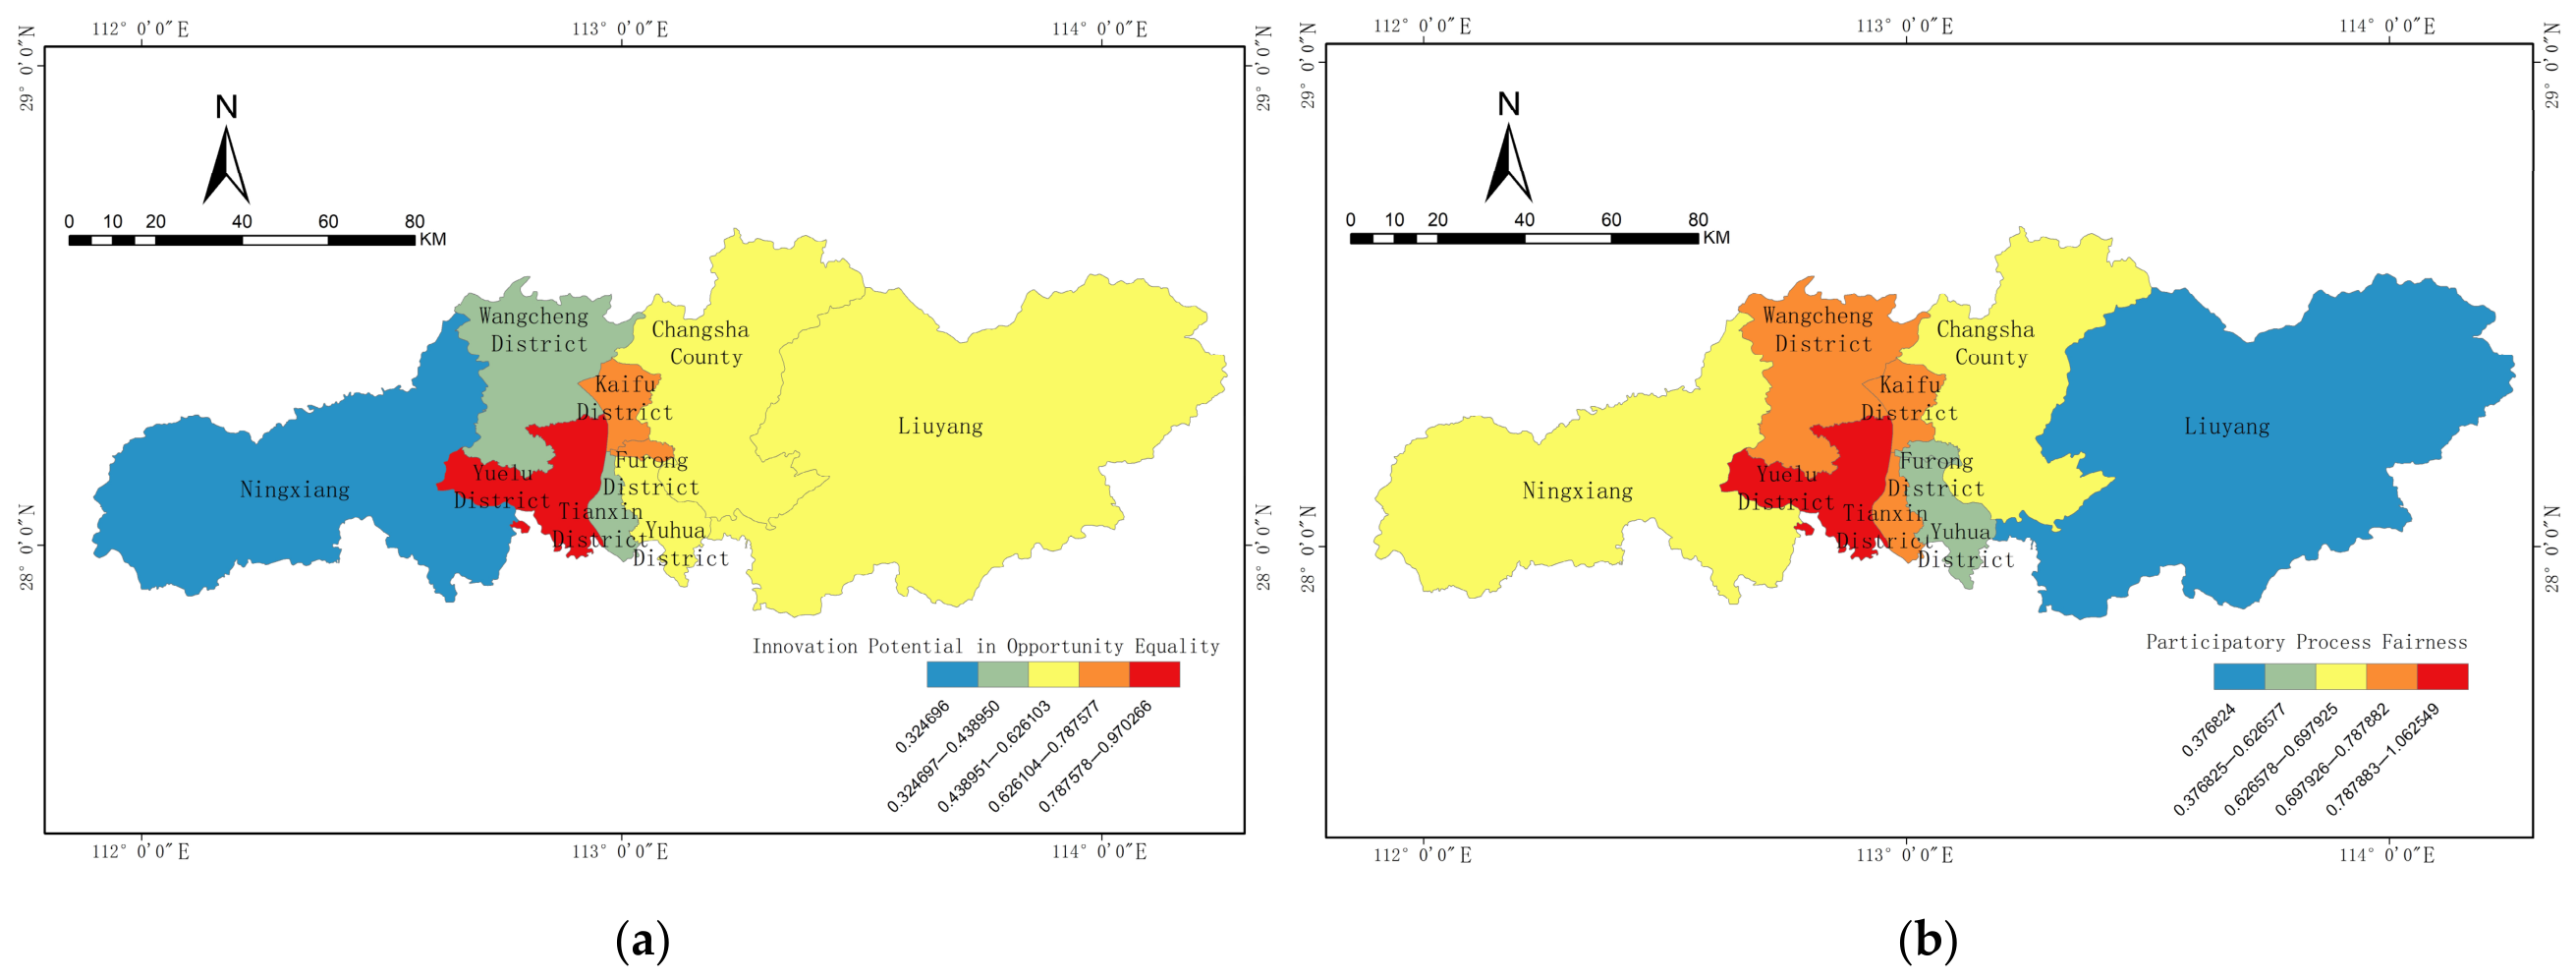
The level of inclusive innovation space was calculated based on official statistical data from the Changsha Statistical Yearbook 2024 [38] and other government documents. The evaluation followed the indicator system and weights reported in Table 2. Since the evaluation indicators cover multiple aspects of inclusive innovation, this study first calculated three sub-dimensional scores for each district/county: the equity of participation opportunities, the spatial distribution of fairness in participation processes, and innovation outcome sharing. These three dimensions were then integrated to obtain the overall inclusive innovation level. To make indicators with different units comparable, all original indicators were first standardized. For positive indicators, higher values indicate a higher level of inclusive innovation; for negative indicators, the standardized direction was reversed. After standardization, the score of each dimension for each district was calculated using a weighted summation method. Utilizing the spatial analysis functions of the ArcMap platform, the spatial distribution patterns of participation opportunity equity, process fairness, and outcome sharing within Changsha’s inclusive innovation system were analyzed using the natural breakpoint classification method.
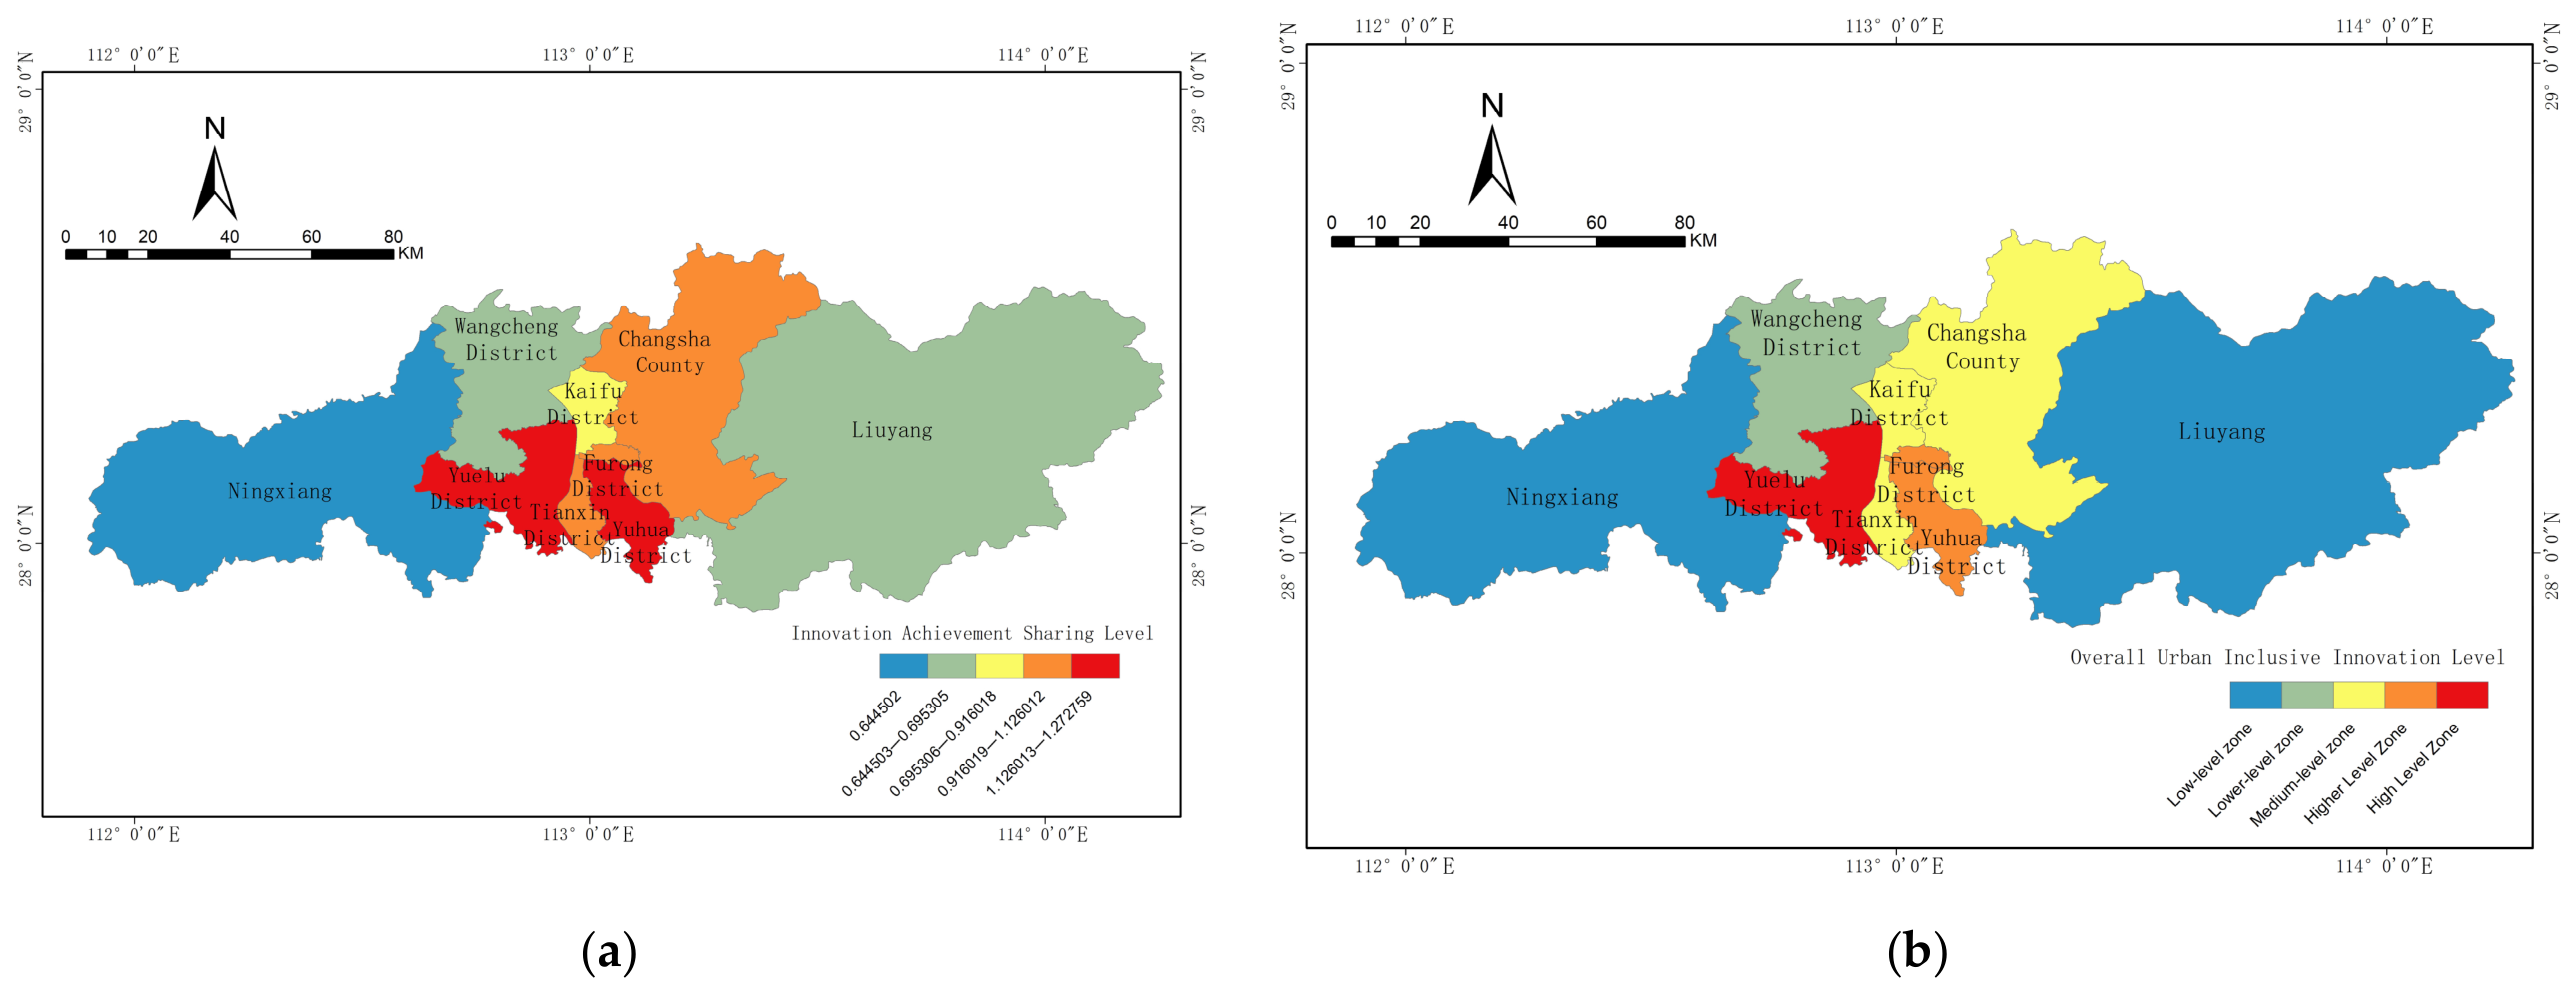
The inclusive innovation level of the study area was divided into five gradient tiers: Low-level zone, Lower-level zone, Medium-level zone, Higher-level zone, and High-level zone. As shown in Figure 6a, the participation opportunity fairness scores are categorized as follows: Low-level zone [0.324696, 0.324697), Lower-level zone [0.324697, 0.438951), Medium-level zone [0.438951, 0.626104), Higher-Level Zone [0.626104, 0.787578], and High-Level Zone [0.787578, 0.970266]. As shown in Figure 6b, the fairness of participation process scores are categorized as: Low-Level Zone [0.376824, 0.376825], Lower-Level Zone [0.376825, 0.626578), moderate level [0.626578, 0.697926], higher level [0.697926, 0.787883], and high level [0.787883, 1.062549]. As shown in Figure 7a, Innovation outcome-sharing scores were categorized as: low level [0.644502, 0.644503), lower level [0.644503, 0.695306], medium level [0.695306, 0.916019], higher level [0.916019, 1.126013], and high level [1.126013, 1.272759].
Regarding equity of participation opportunities, the spatial pattern generally exhibits a trend of gradual decline from the urban core to the periphery. Specifically, Yuelu District received the highest evaluation in this dimension; Kai Fu District and Fu Rong District hold relatively leading positions; Yu Hua District, Changsha County, and Liuyang City are at an intermediate level; certain areas within Wang Cheng District and Tian Xin District show slight deficiencies; while Ning Xiang City exhibits a pronounced disadvantage with relatively lagging development. This spatial differentiation pattern may be closely linked to the uneven spatial distribution of Changsha’s innovation factors and infrastructure [39].
Regarding the spatial distribution of fairness in participation processes, distinct clustering patterns emerge. Central urban districts including Kaifu, Furong, Tianxin, Wangcheng, Yuelu, and Yuhua collectively form clusters of high and relatively high values; Ningxiang City and Changsha County represent areas of moderate levels; certain sections of Furong and Yuhua districts form a continuous belt of lower levels; while Liuyang City as a whole remains in a developmental trough, manifesting as distinct low-level zones.
In terms of innovation outcome sharing, the spatial distribution exhibits an overall gradient decline from the urban core to the periphery. Yuelu District and Yuhua District received the highest evaluations in this aspect; Tianxin District, Furong District, and Changsha County rank at a relatively high level; Kaifu District falls within the medium development tier; Wangcheng District and Liuyang City collectively form a cluster with lower levels; while Ningxiang City stands out as a distinct low-value area. It should be noted that the effectiveness of innovation outcome sharing largely depends on a region’s overall innovation capacity. The higher scores of Yuelu District and Yuhua District therefore indicate that these districts have comparatively stronger conditions for innovation outcome transformation and diffusion. Yuelu District’s concentration of universities, research institutions, and innovation platforms may provide a supportive basis for local employment creation, technology application, and innovation service diffusion. Nevertheless, these findings should be interpreted as evidence of stronger enabling conditions for outcome sharing, not as direct proof that innovation outcomes have been equally shared across all social groups.
As shown in Figure 7b, Yuelu District ranks first in the comprehensive score, with Furong District and Yuhua District occupying relatively leading positions; Kaifu District, Changsha County, and Tianxin District form a cluster of medium-level performance; Wangcheng District constitutes a contiguous area of relatively low level; while Ningxiang City and Liuyang City both remain at a low developmental stage. This indicates that areas with denser innovation spaces tend to have more favorable conditions for inclusive innovation, such as stronger innovation–resource concentration, better public service provision, and higher accessibility. However, the two patterns are not completely identical. The number or proportion of innovation spaces does not directly determine the level of inclusive innovation. For example, Tianxin District has a relatively high proportion of innovation spaces, but its overall inclusive innovation level is not the highest. Changsha County has a lower share of innovation spaces than several central districts, but still shows a medium-level inclusive innovation performance. This suggests that inclusive innovation is shaped not only by the spatial concentration of innovation carriers, but also by multiple factors such as industrial structure, public services, social security, transport accessibility, and the local transformation of innovation outcomes [40].

3.2. Spatial Autocorrelation Analysis

3.2.1. Spatial Autocorrelation

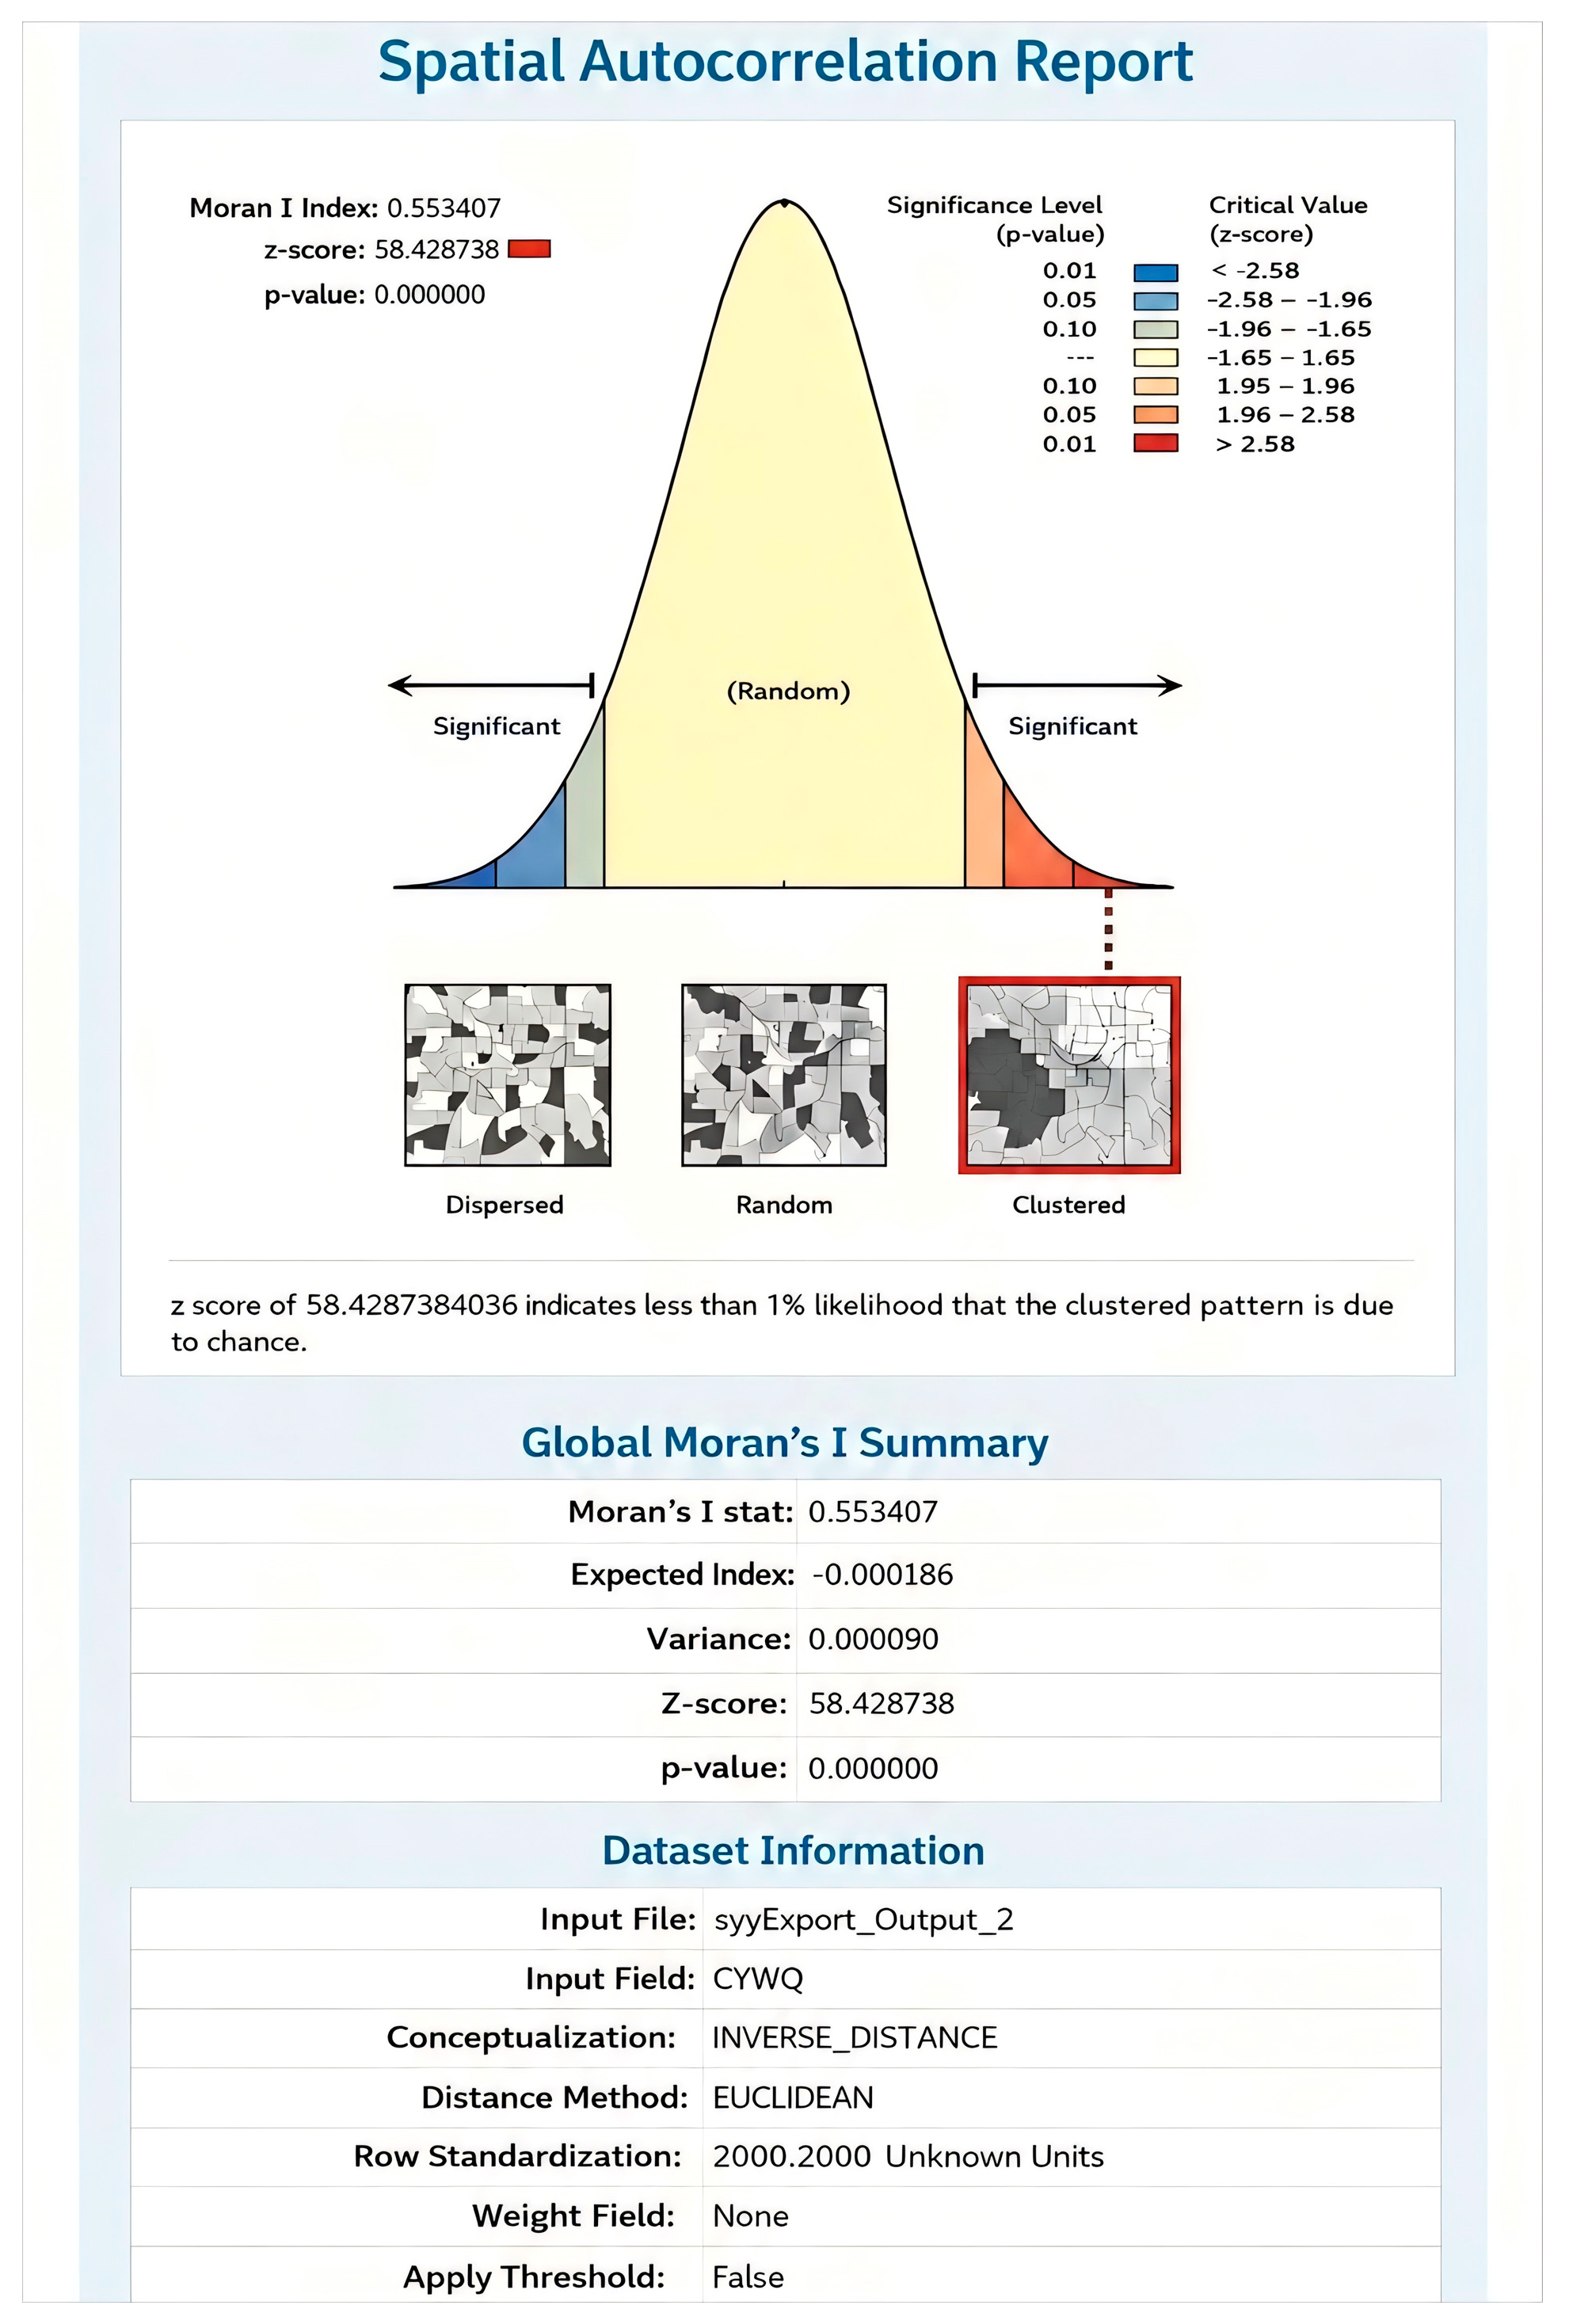
The global spatial autocorrelation of Changsha’s innovation space was analyzed using the global Moran’s I index. The calculation results (as shown in Figure 8) indicate that the global Moran’s I index is 0.553407, with a z-score of 58.42. with a p-value of 0 (z-score > 1.96 and p-value < 0.01). Therefore, at a 99% confidence level, Changsha’s innovation spaces exhibit significant positive spatial autocorrelation overall. This indicates a distinct spatial clustering pattern for innovation spaces [25,41], where high-tech enterprises tend to concentrate in specific areas rather than being randomly dispersed. This clustering arises partly from geographic proximity effects, where business agglomeration reduces information exchange costs and facilitates shared infrastructure and technological resources [42]. Additionally, government industrial policies and regional development plans drive the concentration of innovation resources in specific areas.

3.2.2. Local Spatial Autocorrelation

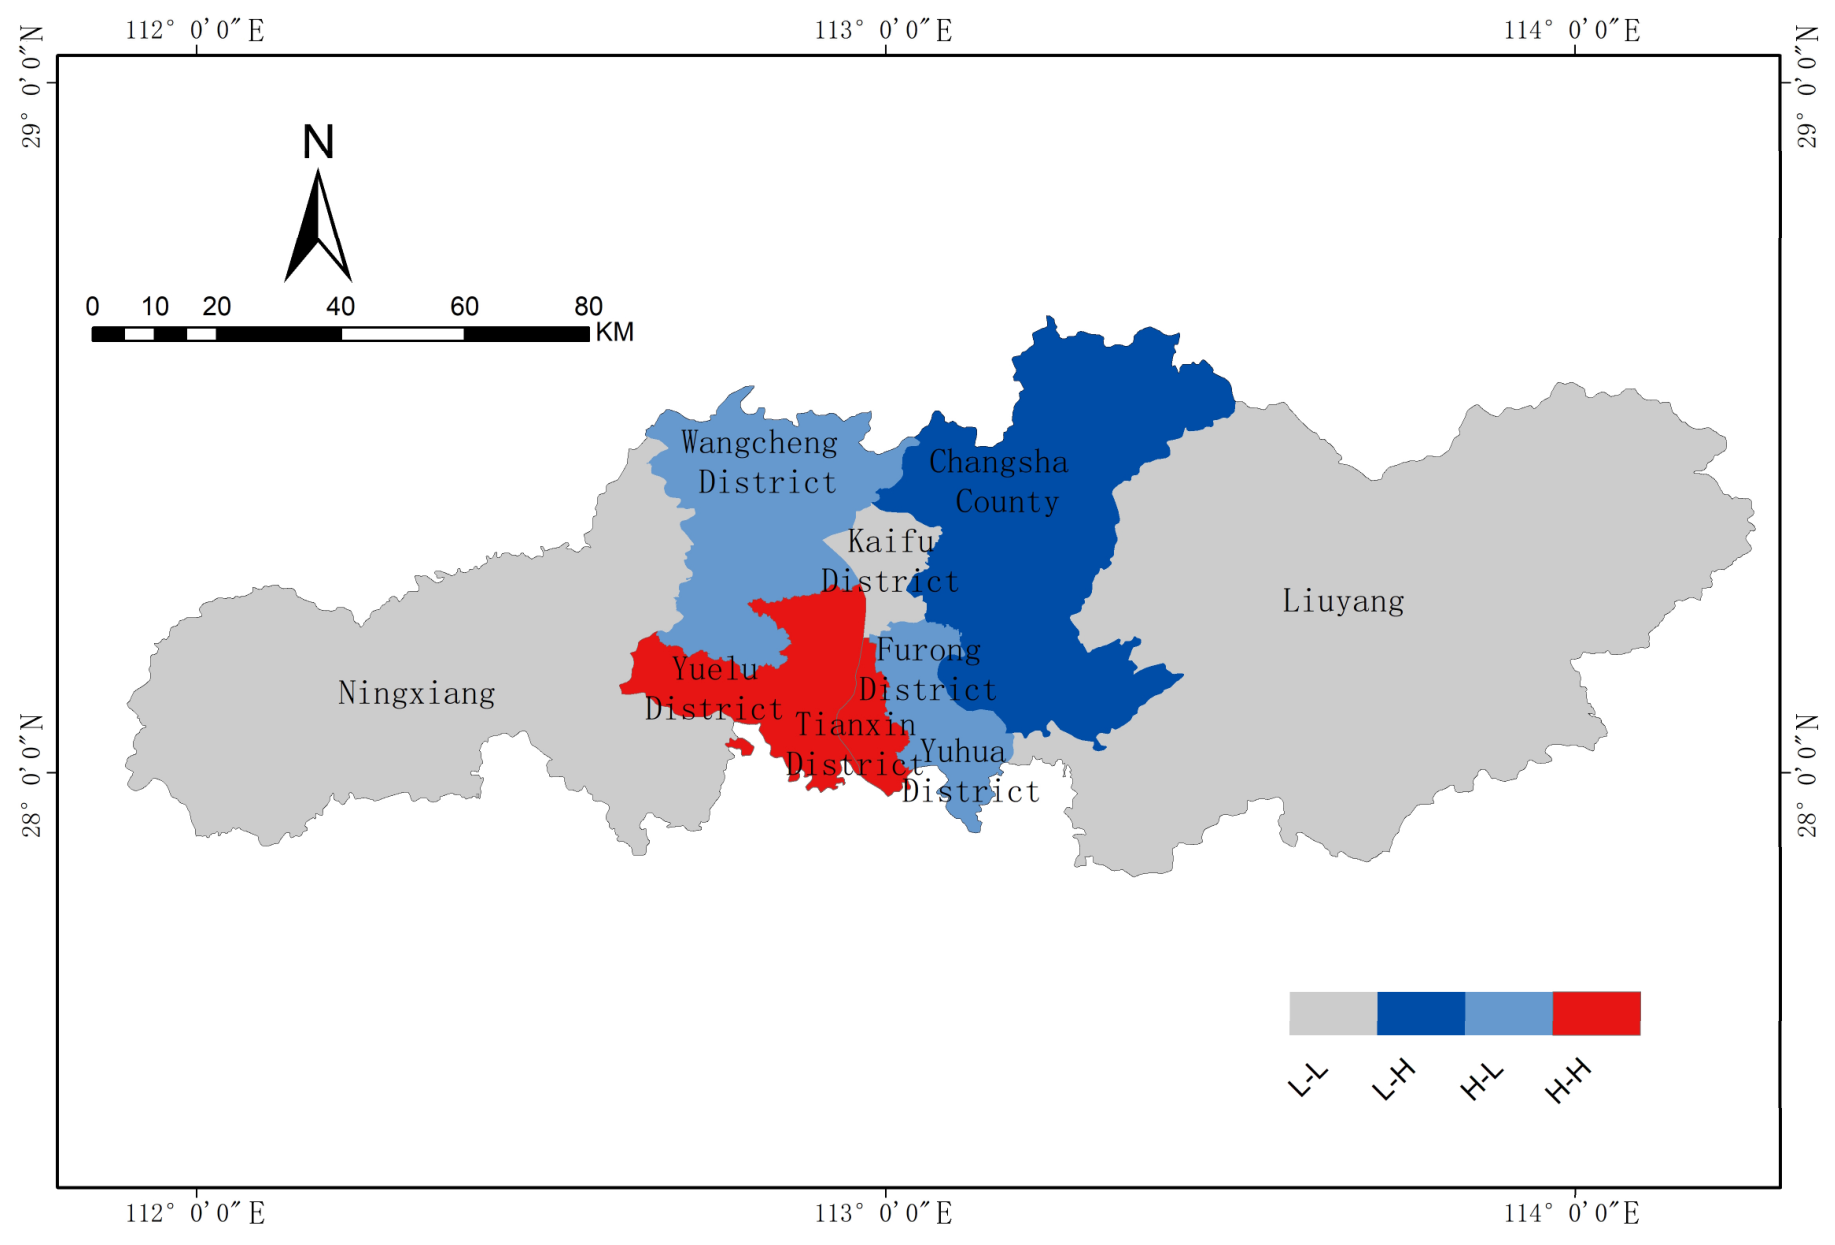
Applying the local Moran’s I index for spatial correlation measurement and generating corresponding Local Indicators of Spatial Association (LISA) clustering maps (Figure 9) enables in-depth revelation of local agglomeration patterns in innovation spatial distribution.
Analysis indicates that Changsha’s innovation spatial pattern exhibits four typical spatial correlation modes: high–high (H-H), low–low (L-L), high–low (H-L), and low–high (L-H). High–high zones are primarily concentrated in core innovation hubs such as Yuelu Mountain University Science and Technology City, Changsha High-Tech Industrial Development Zone, and Changsha Economic and Technological Development Zone. These areas possess dense innovation factors and vibrant innovation ecosystems, generating strong spatial spillover and driving effects on neighboring regions. Low–low zones are predominantly found in peripheral counties and districts like certain townships in Liuyang City and remote areas of Ningxiang City. These regions exhibit lower economic development levels, scarce innovation resources, and generally weaker spatial agglomeration. High-low and low-high zones primarily occupy transitional locations between the aforementioned two types, reflecting the spatial gradient differentiation and local heterogeneity of innovation clusters. Taking the border area between Yuelu District and Wangcheng District as an example, despite its proximity to the core innovation zone, it forms a high-low cluster due to constraints such as administrative barriers and infrastructure limitations. Conversely, certain areas of Changsha County adjacent to the Economic and Technological Development Zone exhibit a low-high clustering pattern, benefiting from its spillover effects and demonstrating a trend of gradually activated innovation activities.

3.3. Factors Influencing the Spatial Distribution of Inclusive Innovation Spaces in Changsha City

3.3.1. Inclusive Analysis of Influencing Factors

Fiscal Investment in science and technology, employment, and social welfare provides financial, technical, and institutional support for disadvantaged or excluded groups, thereby creating basic conditions for their participation in innovation activities [43]. Industrial Structure affects the distribution of employment opportunities and industrial platforms, which are important prerequisites for broader participation in urban innovation [44]. Cultural Education influences human capital, innovation awareness, and residents’ willingness to engage in entrepreneurial and innovative activities [45]. Social Security helps reduce uncertainty and enhance residents’ sense of security, thereby supporting participation in innovation and entrepreneurship [43]. In addition, the ecological environment affects the attractiveness of urban areas to innovation actors by shaping living quality, environmental comfort, and talent retention conditions [46]. Therefore, based on previous studies, data availability, and indicator measurability, this study summarizes the influencing factors of urban inclusive innovation space into five dimensions: Fiscal Investment, Industrial Structure, Cultural Education, Social Security, and ecological environment. They jointly affect the spatial distribution of inclusive innovation by shaping innovation support, employment opportunities, human capital, risk protection, and living-environment quality.
In terms of the selection of specific factor indicators, Fiscal Investment is measured by the proportion of science and technology expenditure in total fiscal expenditure and the proportion of social security and employment expenditure in total fiscal expenditure. Both are positive indicators. Industrial Structure is measured by the ratio of tertiary industry output to secondary industry output. This indicator reflects the degree of industrial structure optimization and the relative strength of service-oriented and knowledge-intensive economic activities. It is treated as a positive indicator. Cultural Education is measured by the number of public library books per 10,000 people and the number of full-time primary and secondary school teachers per 10,000 people as indicators of Cultural Education. which reflect the supply of public cultural resources and basic educational resources, respectively, and both are positive indicators. Social Security is measured by the number of participants in basic medical insurance for urban employees per 10,000 people and the number of participants in unemployment insurance per 10,000 people. These indicators reflect the coverage of basic medical and employment-related security systems. Both are positive indicators. Ecological environment is measured by annual average PM2.5 concentration and forest greening rate as indicators of ecological environment. Since a higher PM2.5 concentration indicates poorer air quality, it is treated as a negative indicator, while forest greening rate is treated as a positive indicator. Together, they capture the ecological and livability conditions that may affect the attraction and retention of innovation actors.
To identify the main factors influencing the spatial differentiation of inclusive innovation in Changsha, this study used the entropy method to calculate the weights of the indicators related to the influencing factors in 2024. The specific definitions and weight allocations for these variables are presented in Table 3. First, raw data matrices were constructed using historical statistical yearbooks and databases. Positive and negative indicators were standardized using corresponding formulas to eliminate dimensional differences. After obtaining the standardized matrix, the minimum value was introduced to avoid meaningless logarithmic operations. The proportion of each evaluation object in each indicator was calculated. Then, based on the definition of information entropy, the information entropy of each indicator was computed. Finally, the coefficient of variation for all indicators was normalized to obtain the final indicator weights.

3.3.2. Factor Testing

On this basis, the weighted scores of the five influencing factors—Fiscal Investment, Industrial Structure, Cultural Education, Social Security, and ecological environment—were calculated for each district/county according to the indicator weights reported in Table 3. The natural breaks method in ArcMap was then used to discretize the scores of these influencing factors, so as to meet the requirement of GeoDetector (Version 2024) for categorical variables. Furthermore, GeoDetector factor detection was employed to analyze the explanatory power of each influencing factor and their combined effects on the spatial differentiation of inclusive innovation.
The results show that, in 2024, the q-values of Fiscal Investment, Industrial Structure, Cultural Education, Social Security, and ecological environment were 0.332, 0.586, 0.718, 0.287, and 0.214, respectively. Among them, Cultural Education and Industrial Structure show relatively strong explanatory power, indicating that knowledge resources, human capital, innovation culture, and industrial platforms are the main factors shaping the spatial differentiation of inclusive innovation in Changsha. The q-value of ecological environment is relatively low. This does not imply that ecological environment is unimportant for innovation or urban development [47]. Rather, it suggests that differences in ecological conditions among Changsha’s districts/counties have relatively limited explanatory power for the spatial differentiation of inclusive innovation compared with Cultural Education and Industrial Structure. Some peripheral areas may have better ecological conditions but weaker innovation resources, industrial platforms, and public service capacity, which limits the direct transformation of ecological advantages into higher inclusive innovation levels. It should be noted that the q-values mainly reflect the statistical explanatory power of different factors for spatial differentiation and should not be interpreted as evidence of strict causal relationships.

3.3.3. Interactive Detection

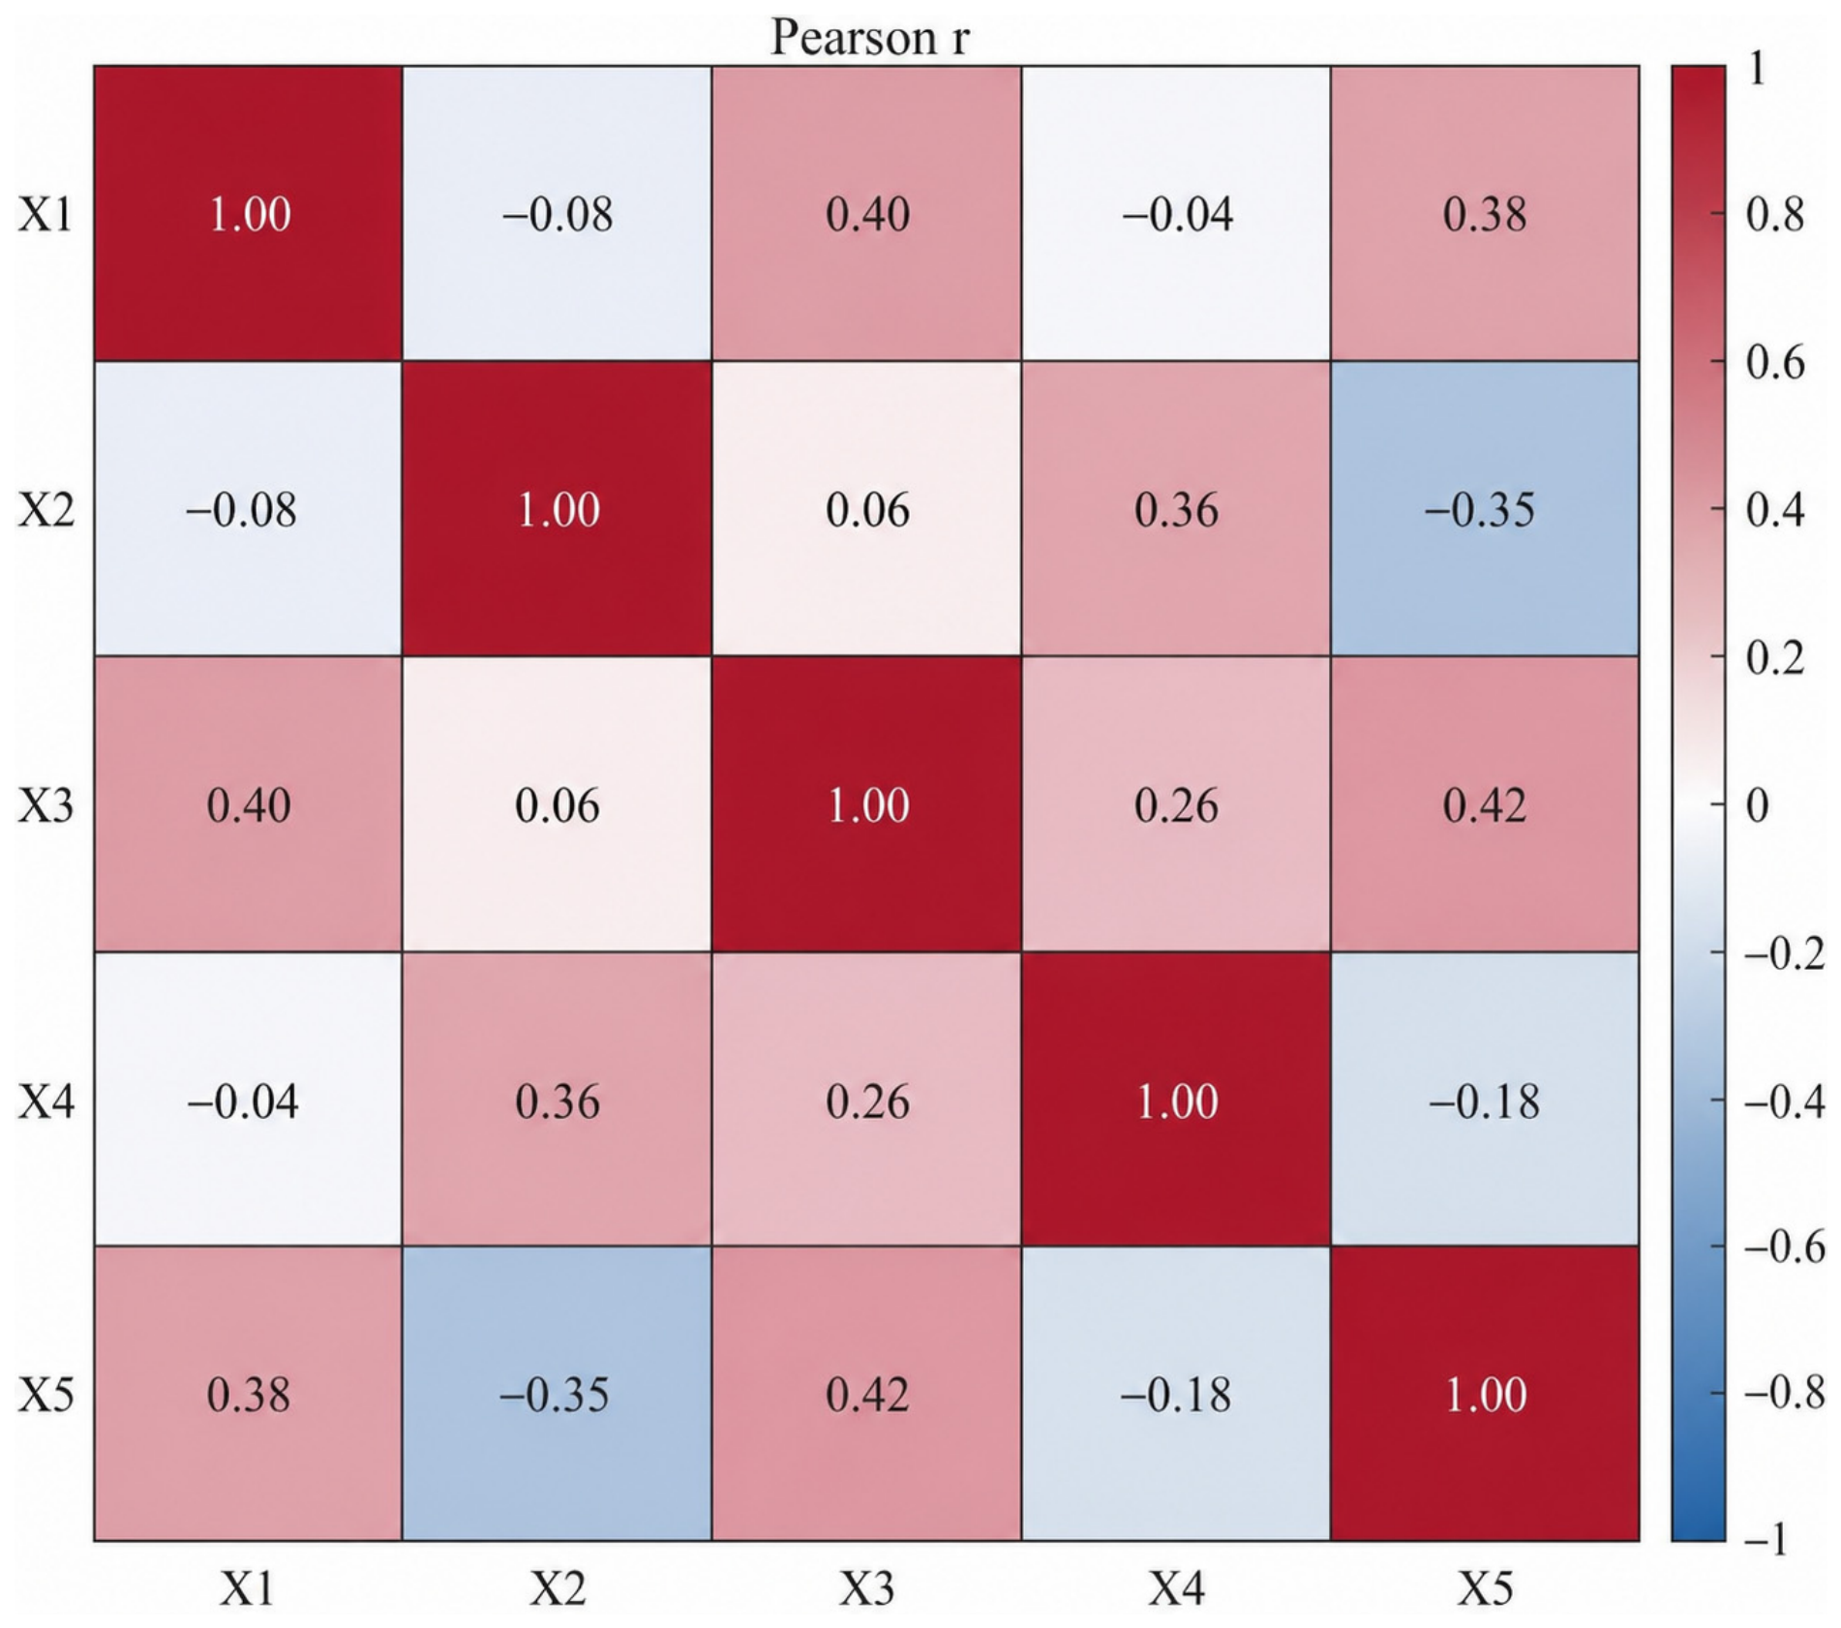
Pearson correlation analysis was also used to examine the linear relationships and potential multicollinearity among the five influencing factors, producing the results shown in Figure 10.
Figure 10 presents the Pearson correlation coefficient matrix among the five influencing factors. The values in the figure represent the pairwise linear correlation coefficients between Fiscal Investment, Industrial Structure, Cultural Education, Social Security, and ecological environment. A positive value indicates a positive linear association between two factors, while a negative value indicates a negative linear association. The larger the absolute value, the stronger the linear correlation between the corresponding pair of factors. The results show that the absolute values of all pairwise correlation coefficients are below 0.7, indicating that there is no serious multicollinearity among the selected variables and supporting the rationality of the factor selection. Among them, Cultural Education and ecological environment show a relatively strong positive correlation (r = 0.42), followed by Fiscal Investment and Cultural Education (r = 0.40), and Fiscal Investment and ecological environment (r = 0.38). These relationships suggest that Changsha’s inclusive innovation environment is partly characterized by the coupling of educational–cultural resources and ecological conditions. In contrast, Industrial Structure and ecological environment show a moderate negative correlation (r = −0.35), which may reflect a spatial mismatch between traditional industrial development and ecological environmental quality.
Further interaction analysis shows that the interactions between all factor pairs present either bi-factor enhancement or nonlinear enhancement effects, with no weakening effect observed. This suggests that the spatial differentiation pattern of inclusive innovation in Changsha is not dominated by a single factor, but rather results from the coordinated and coupled interactions of multiple factors. Among these, cultural education was identified as the most influential driving factor demonstrating an exceptionally significant promotional effect on inclusive innovation. Further analysis reveals strong interdependencies between cultural education and both the city’s natural environment and social security systems, as well as fiscal investments. Districts with stronger Cultural Education, better Social Security, higher Fiscal Investment, and more favorable ecological conditions tend to provide stronger human capital support, institutional protection, public service capacity, and urban attractiveness, which may help explain the concentration of innovation activities and innovation-related resources in these areas. However, it should be noted that the Pearson correlation coefficients in Figure 10 only indicate linear statistical associations between variables. They should not be interpreted as direct evidence of causal relationships.

4. Conclusions and Discussion

4.1. Conclusions

Inclusive innovation serves as a vital pathway for advancing the objectives of Chinese modernization. this study constructs a measurement framework for inclusive innovation at the urban level based on an interpretation of its core essence. Taking Changsha as the research subject, it systematically analyzes the spatial distribution patterns and formation mechanisms of its inclusive innovation. Key findings are as follows:
(1)
Urban inclusive innovation is underpinned by an inclusive policy system, aiming to create conditions for equitable participation in the innovation process and shared benefits among all social groups, thereby advancing the city’s innovation system toward greater fairness. This framework can be comprehensively measured across three dimensions: equal participation opportunities, procedural fairness, and outcome sharing.
(2)
In terms of equitable participation opportunities, Changsha shows an uneven spatial pattern, with relatively higher scores concentrated in central urban districts and lower scores observed in some peripheral areas, decreasing from the central urban area toward peripheral regions. The local spatial autocorrelation results identify high–high clusters mainly in areas with stronger innovation–resource concentration and better public service conditions, such as Yuelu District and other districts associated with major innovation platforms. Low–low agglomeration zones cluster in peripheral urban areas like certain townships in Liuyang City and remote regions of Ningxiang City.
(3)
The spatial differentiation pattern of inclusive innovation in Changsha is not dominated by a single factor, but rather results from the coordinated and coupled interactions of multiple factors. Cultural and educational levels are the primary driver.
The results reveal clear spatial differentiation in Changsha’s inclusive innovation level, with relatively stronger conditions in central urban districts and weaker conditions in some peripheral areas. Similar to major Chinese innovation cities such as Beijing, Hangzhou, Wuhan, and Chengdu, innovation resources in Changsha tend to concentrate in central districts, university clusters, high-tech zones, and development zones [48]. This suggests that the core–periphery differentiation observed in Changsha is not an isolated local phenomenon, but reflects a broader spatial logic of urban innovation systems: innovation activities are more likely to agglomerate in areas where knowledge resources, industrial platforms, public services, transport accessibility, and policy support are jointly concentrated [49].
However, the results should be interpreted cautiously. The spatial concentration of innovation activities does not necessarily mean that innovation development is inclusive. High-scoring areas indicate relatively favorable spatial conditions for inclusive innovation, but they do not directly prove that different social groups have equal access to innovation resources or innovation benefits. Likewise, lower-scoring areas indicate weaker enabling conditions, rather than the absence of social inclusion. For such cities, the key issue is not only how to strengthen innovation cores, but also how to improve the accessibility, diffusion capacity, and public-service connectivity of innovation resources across different districts and social groups.
International innovation regions also show similar patterns of innovation clustering around knowledge-intensive districts, technology corridors, research institutions, science parks, and entrepreneurial ecosystems [50]. Such concentration may improve innovation efficiency through knowledge spillovers, talent mobility, and institutional collaboration. However, it does not automatically lead to inclusive innovation. If innovation resources remain concentrated in a few core areas, peripheral communities, small enterprises, ordinary workers, and disadvantaged groups may still face barriers to accessing innovation facilities, employment opportunities, entrepreneurial services, and public resources [51]. Therefore, this study highlights the need to distinguish between the spatial concentration of innovation resources and their social accessibility. High-density innovation areas in Changsha indicate relatively favorable spatial conditions for inclusive innovation, but they do not directly prove that innovation opportunities have been equally accessed by all groups. Similarly, peripheral areas with lower innovation density should be interpreted as areas with weaker enabling conditions, rather than as areas where social inclusion is necessarily absent. The findings suggest that inclusive innovation systems require not only innovation agglomeration, but also stronger transport accessibility, public service sharing, employment inclusion, affordable housing support, and local transformation of innovation outcomes.

4.2. Recommendations

In the background of Chinese-style modernization, the core value of urban innovation is increasingly shifting toward an inclusive orientation. Based on the findings of this study, the following policy recommendations are proposed:
In the practice of building innovative cities, an “innovation-inclusivity” coordination system should be established by integrating three dimensions—equal participation opportunities, procedural fairness, and outcome sharing—with three policy dimensions: policy tools, spatial planning, and implementation safeguards. At the level of policy tools, attention should be paid not only to increasing innovation outputs, but also to improving the social accessibility and public value of innovation outcomes. Local governments may establish an “innovation–inclusion” policy package that links technology transfer, entrepreneurship support, talent services, affordable housing, public service provision, and employment creation.
At the level of spatial planning, innovation resources should be connected more closely with inclusive urban facilities. Incorporate metrics like “patent ownership per 10,000 residents” and “youth housing coverage rate” into mandatory spatial planning assessments to make the inclusive effects of innovation development more measurable.
At the level of implementation safeguards, a dynamic monitoring and evaluation mechanism should be established to assess the coordination between innovation agglomeration and inclusive development. Inclusive indicators, such as employment inclusion, and innovation outcome transformation, can be embedded into urban innovation planning and territorial spatial planning. Regular monitoring of these indicators would help identify whether innovation resources are excessively concentrated in core areas or whether peripheral areas and disadvantaged groups face insufficient access to innovation opportunities. Through continuous assessment and policy adjustment, innovative city development can move beyond a single focus on innovation output and propell innovative city development from a “single-indicator orientation” toward a “diverse and inclusive orientation.” This facilitates the deep integration of innovative development with social inclusivity.

4.3. Discussion

The urban innovation system is vast and complex. This paper introduces the concept of inclusive cities and attempts to construct a theoretical framework and data analysis methodology for studying inclusive innovation spaces, with significant scope for future in-depth research. This study still has several limitations. First, the inclusive innovation level in this study is evaluated through three dimensions: opportunity inclusion, process inclusion, and outcome inclusion. This framework provides a relative measurement of the spatial conditions and potential constraints of inclusive innovation across Changsha, but it cannot fully capture individual-level participation or the actual distribution of innovation benefits. Future research should incorporate survey data, individual-level participation data, enterprise-level service-use data, and public innovation platform usage data to more directly examine the accessibility of innovation resources and the sharing of innovation outcomes among different social groups. Second, this study primarily analyzes data from Changsha City without comparative research on other similar regions. Additionally, the spatial distribution of innovation factors is relatively dispersed due to geographical fragmentation affecting land use. These two factors make it difficult for spatial econometric models to achieve high accuracy in measuring impact effects. Finally, this study provides an inclusive analysis of Changsha’s current innovation space. However, spatial patterns of innovation space exhibit distinct characteristics across different socioeconomic contexts. To systematically examine a city’s innovation spatial structure and comprehensively interpret its formation mechanisms, further research is needed that accounts for regional variations and dynamic changes. Future studies should address these limitations through deeper, broader investigations to provide evidence-based guidance for the scientific development and advancement of innovation spaces.

Author Contributions

Conceptualization, Y.C.; Methodology, Y.C. and X.L.; Software, X.M.; Formal analysis, X.L.; Investigation, Y.C.; Writing—original draft, Y.C.; Writing—review & editing, X.L.; Visualization, Y.C.; Supervision, X.L.; Project administration, X.L. All authors have read and agreed to the published version of the manuscript.

Funding

This research received no external funding.

Data Availability Statement

The original contributions presented in this study are included in the article. Further inquiries can be directed to the corresponding author.

Conflicts of Interest

The authors declare no conflict of interest.

References

  1. Huang, D.; Xu, G.; Li, C.; Yang, S. Effects of High-Tech Industrial Agglomeration and Innovation on Regional Economic Development in China: Evidence from Spatial-Temporal Analysis and Spatial Durbin Model. Econ. Anal. Policy 2025, 86, 692–712. [Google Scholar] [CrossRef]
  2. Gao, K.; Yuan, Y. Government Intervention, Spillover Effect and Urban Innovation Performance: Empirical Evidence from National Innovative City Pilot Policy in China. Technol. Soc. 2022, 70, 102035. [Google Scholar] [CrossRef]
  3. Ren, Y.; He, X.; Jiang, Q.; Zhang, F.; Zhang, B. Advancing High-Quality Development in China: Unraveling the Dynamics, Disparities, and Determinants of Inclusive Green Growth at the Prefecture Level. Ecol. Indic. 2024, 169, 112898. [Google Scholar] [CrossRef]
  4. Cui, W. Shadow and Spillover: The Influence of Neighboring Innovative Cities on Regional Innovation Growth. China Econ. Rev. 2025, 90, 102355. [Google Scholar] [CrossRef]
  5. Henrekson, M.; Johansson, D.; Karlsson, J. To Be or Not to Be: The Entrepreneur in Neo-Schumpeterian Growth Theory. Entrep. Theory Pract. 2023, 48, 104–140. [Google Scholar] [CrossRef]
  6. Duarte, M.P.; de Carvalho, F.M.P.O.; Ferreira, M.P. Agglomeration Externalities in National Systems of Innovation: The Role of Industrial Diversity and Competition on Countries’ Innovative Levels. SAGE Open 2025, 15, 21582440251316935. [Google Scholar] [CrossRef]
  7. Mascarini, S.; Garcia, R.; Quatraro, F. Local Knowledge Spillovers and the Effects of Related and Unrelated Variety on the Novelty of Innovation. Reg. Stud. 2023, 57, 1666–1680. [Google Scholar] [CrossRef]
  8. De Silva, M.; Howells, J.; Khan, Z.; Meyer, M. Innovation Ambidexterity and Public Innovation Intermediaries: The Mediating Role of Capabilities. J. Bus. Res. 2022, 149, 14–29. [Google Scholar] [CrossRef]
  9. Liu, W.; Zhou, W.; Lu, L. An Innovative Digitization Evaluation Scheme for Spatio-Temporal Coordination Relationship between Multiple Knowledge Driven Rural Economic Development and Agricultural Ecological Environment-Coupling Coordination Model Analysis Based on Guangxi. J. Innov. Knowl. 2022, 7, 100208. [Google Scholar] [CrossRef]
  10. Leckel, A.; Veilleux, S.; Piller, F. How Spatial Proximity Facilitates Distant Search–a Social Capital Perspective on Local Open Innovation. Ind. Innov. 2022, 29, 899–926. [Google Scholar] [CrossRef]
  11. Liu, B.; Li, Y.; Liu, J.; Hou, Y. Does Urban Innovation Policy Accelerate the Digital Transformation of Enterprises? Evidence Based on the Innovative City Pilot Policy. China Econ. Rev. 2024, 85, 102167. [Google Scholar] [CrossRef]
  12. Kayanan, C.M. A Critique of Innovation Districts: Entrepreneurial Living and the Burden of Shouldering Urban Development. Environ. Plan. A 2022, 54, 50–66. [Google Scholar] [CrossRef]
  13. Boschma, R.; Fitjar, R.D.; Giuliani, E.; Iammarino, S. Unseen Costs: The Inequities of the Geography of Innovation. Reg. Stud. 2025, 59, 2445594. [Google Scholar] [CrossRef]
  14. Cui, W.; Tang, J. Innovation Convergence Clubs and Their Driving Factors within Urban Agglomeration. Econ. Model. 2023, 121, 106199. [Google Scholar] [CrossRef]
  15. Kalliomaki, H.; Oinas, P.; Salo, T. Innovation Districts as Strategic Urban Projects: The Emergence of Strategic Spatial Planning for Urban Innovation. Eur. Plan. Stud. 2024, 32, 78–96. [Google Scholar] [CrossRef]
  16. Li, Y.; Du, R. Polycentric Urban Structure and Innovation: Evidence from a Panel of Chinese Cities. Reg. Stud. 2022, 56, 113–127. [Google Scholar] [CrossRef]
  17. Dembski, F.; Wössner, U.; Letzgus, M.; Ruddat, M.; Yamu, C. Urban Digital Twins for Smart Cities and Citizens: The Case Study of Herrenberg, Germany. Sustainability 2020, 12, 2307. [Google Scholar] [CrossRef]
  18. Tsinghua University; Nature Research Intelligence. Global Innovation Hubs Index 2025: AI and the Shifting Paradigm of Innovation Leadership; Tsinghua University: Beijing, China, 2025. Available online: https://en.ncsti.gov.cn/watchThis/index_1/gihi2025/ (accessed on 1 October 2025).
  19. Brueck, C.; Losacker, S.; Liefner, I. China’s Digital and Green (Twin) Transition: Insights from National and Regional Innovation Policies. Reg. Stud. 2025, 59, 2384411. [Google Scholar] [CrossRef]
  20. Lee, N. Inclusive Innovation in Cities: From Buzzword to Policy. Reg. Stud. 2025, 59, 2168637. [Google Scholar] [CrossRef]
  21. Klingler-Vidra, R.; Liu, Y. Inclusive Innovation Policy as Social Capital Accumulation Strategy. Int. Aff. 2020, 96, 1033–1050. [Google Scholar] [CrossRef]
  22. Morales, D.; Green, L.; Marlow, D.; Cadena Gaitán, C.; Deitrick, S.; Glass, M.R.; Kempton, L. Defining Inclusive Innovation: Challenges and Lessons for Innovation Districts. Reg. Stud. Reg. Sci. 2025, 12, 740–753. [Google Scholar] [CrossRef]
  23. Cai, Q.; Liu, H.; Pan, Y.; Zou, J. The Innovation Effects of Local Talent Competition: The Case of China’s Municipal “Vying for Talent” Policies. Habitat Int. 2025, 164, 103523. [Google Scholar] [CrossRef]
  24. Duan, Y.; Lu, D.; Bian, L. New Method of Evaluating Spatial Quality for Innovation Districts: A Case Study of Haidian and Chaoyang Districts, Beijing. Front. Archit. Res. 2024, 13, 1288–1307. [Google Scholar] [CrossRef]
  25. Wang, S.; Liu, H.; Li, Y.; Hu, M. Exploring the Innovation Potential of Urban Space at the Micro Scale: A Case Study of Suzhou’s Main Urban Area. Humanit. Soc. Sci. Commun. 2025, 12, 80. [Google Scholar] [CrossRef]
  26. Li, Y.; Phelps, N.A.; Derudder, B. Prometheus in the Periphery? The Extent, Drivers, and Nature of Innovation in the Urban Peripheries of Chinese Cities. Ann. Am. Assoc. Geogr. 2025, 115, 1424–1443. [Google Scholar] [CrossRef]
  27. Qin, X.; Wang, X.; Kwan, M.-P. The Contrasting Effects of Interregional Networks and Local Agglomeration on R&D Productivity in Chinese Provinces: Insights from an Empirical Spatial Durbin Model. Technol. Forecast. Soc. Change 2023, 193, 122608. [Google Scholar] [CrossRef]
  28. Li, Y.; Ren, Z.; Tu, M. Urban Innovation Structures and Economic Productivity of Chinese Cities. Reg. Stud. 2025, 59, 2579626. [Google Scholar] [CrossRef]
  29. Morris, E.A.; Blumenberg, E.; Guerra, E. Does Lacking a Car Put the Brakes on Activity Participation? Private Vehicle Access and Access to Opportunities among Low-Income Adults. Transp. Res. Part A Policy Pract. 2020, 136, 375–397. [Google Scholar] [CrossRef]
  30. Komikado, H.; Morikawa, S.; Bhatt, A.; Kato, H. High-Speed Rail, Inter-Regional Accessibility, and Regional Innovation: Evidence from Japan. Technol. Forecast. Soc. Change 2021, 167, 120697. [Google Scholar] [CrossRef]
  31. Cheng, S.; Fan, W.; Wang, J. Investigating the Humanitarian Labor Efficiency of China: A Factor-Specific Model. Ann. Oper. Res. 2022, 319, 439–461. [Google Scholar] [CrossRef]
  32. OECD. Megatrends and the Future of Social Protection. Available online: https://www.oecd.org/en/publications/megatrends-and-the-future-of-social-protection_6c9202e8-en.html (accessed on 11 June 2026).
  33. Obschonka, M.; Tavassoli, S.; Rentfrow, P.J.; Potter, J.; Gosling, S.D. Innovation and Inter-City Knowledge Spillovers: Social, Geographical, and Technological Connectedness and Psychological Openness. Res. Policy 2023, 52, 104849. [Google Scholar] [CrossRef]
  34. Chen, Y.; Li, W.; Zeng, L.; Chen, M. Quality or Quantity? The Impact of Voluntary Environmental Regulation on Firm’s Green Technological Innovation: Evidence from Green Factory Certification in China. Sustainability 2025, 17, 2498. [Google Scholar] [CrossRef]
  35. Li, Z.; Lin, B. Quantity or Quality? The Impact Assessment of Environmental Regulation on Green Innovation. Environ. Impact Assess. Rev. 2025, 110, 107726. [Google Scholar] [CrossRef]
  36. Coelli, F. Trade Policy Uncertainty and Innovation: Evidence from China. J. Int. Econ. 2025, 158, 104170. [Google Scholar] [CrossRef]
  37. Sharifi, A.; Khavarian-Garmsir, A.R.; Allam, Z.; Asadzadeh, A. Progress and Prospects in Planning: A Bibliometric Review of Literature in Urban Studies and Regional and Urban Planning, 1956–2022. Prog. Plan. 2023, 173, 100740. [Google Scholar] [CrossRef]
  38. Changsha Municipal Bureau of Statistics; Changsha Investigation Team of National Bureau of Statistics. Changsha Statistical Yearbook 2024; Changsha Municipal Bureau of Statistics; Changsha Investigation Team of National Bureau of Statistics: Changsha, China, 2025.
  39. Dong, R.; Shen, S.; Yang, Y. Evolution Characteristics and Driving Mechanisms of Innovation’s Spatial Pattern in Beijing–Tianjin–Hebei Urban Agglomeration under Coordinated Development Policy: Evidence from Patent Data. Land 2025, 14, 2206. [Google Scholar] [CrossRef]
  40. Roper, S.; Jibril, H. Understanding the Geographical Distribution of Innovation in England: Density, Accessibility and Spillover Effects. Reg. Stud. 2024, 58, 1320–1338. [Google Scholar] [CrossRef]
  41. Castaldi, C. The Geography of Urban Innovation beyond Patents Only: New Evidence on Large and Secondary Cities in the United States. Urban Stud. 2024, 61, 1248–1272. [Google Scholar] [CrossRef]
  42. Huang, Y.; Hong, T.; Ma, T. Urban Network Externalities, Agglomeration Economies and Urban Economic Growth. Cities 2020, 107, 102882. [Google Scholar] [CrossRef]
  43. Castellacci, F. Innovation and Social Welfare: A New Research Agenda. J. Econ. Surv. 2023, 37, 1156–1191. [Google Scholar] [CrossRef]
  44. Zou, T. Technological Innovation Promotes Industrial Upgrading: An Analytical Framework. Struct. Change Econ. Dyn. 2024, 70, 150–167. [Google Scholar] [CrossRef]
  45. Moica, S.; Socaciu, T.; Rădulescu, E. Model Innovation System for Economical Development Using Entrepreneurship Education. Procedia Econ. Financ. 2012, 3, 521–526. [Google Scholar] [CrossRef][Green Version]
  46. Khanna, G.; Liang, W.; Mobarak, A.M.; Song, R. The Productivity Consequences of Pollution-Induced Migration in China. Am. Econ. J. Appl. Econ. 2025, 17, 184–224. [Google Scholar] [CrossRef]
  47. Ferreira, J.J.M.; Fernandes, C.I.; Ferreira, F.A.F. Technology Transfer, Climate Change Mitigation, and Environmental Patent Impact on Sustainability and Economic Growth: A Comparison of European Countries. Technol. Forecast. Soc. Change 2020, 150, 119770. [Google Scholar] [CrossRef]
  48. Ye, Q.; Zhang, X.; Zeng, G.; Cao, Z.; Zhou, S. The Spatial Distribution and Synergistic Effect of Different Innovation Activities in Chinese Cities: An Analysis Based on Technology, Design, and Market Activities. Appl. Geogr. 2025, 176, 103527. [Google Scholar] [CrossRef]
  49. Chen, Q.; Liu, Y.; Yao, Z. Spatial–Temporal Pattern Evolution and Differentiation Mechanism of Urban Dual Innovation: A Case Study of China’s Three Major Urban Agglomerations. Land 2024, 13, 1399. [Google Scholar] [CrossRef]
  50. OECD. OECD Science, Technology and Innovation Outlook 2025: Policy Insights to Navigate Today’s Shifting Landscape. In OECD Science, Technology and Innovation Outlook; OECD Publishing: Paris, France, 2025; ISBN 978-92-64-39942-6. [Google Scholar]
  51. Rodríguez-Pose, A.; Wilkie, C.; Zhang, M. Innovating in “Lagging” Cities: A Comparative Exploration of the Dynamics of Innovation in Chinese Cities. Appl. Geogr. 2021, 132, 102475. [Google Scholar] [CrossRef]
Figure 1. Research Scope (a) Location of Hunan Province in China; (b) Location of Changsha City in Hunan Province; (c) The current situation map of Changsha City. (Source: Authors’ GIS calculation from self-built database).
Land 15 01102 g001
Figure 2. Theoretical Framework of Urban Inclusive Innovation (Source: Original conceptual diagram independently designed by the authors).
Land 15 01102 g002
Figure 3. Distribution Map of Innovation Spaces in Changsha City. (Source: Compiled by the authors from statistical yearbooks, government open data, POI datasets and official catalogues; complete data information and corresponding access URLs are provided in the table in Section 2.2 Data Sources).
Land 15 01102 g003
Figure 4. Nuclear Density Analysis Map of Changsha’s Innovation Spaces. (Source: Authors’ GIS calculation from self-built database).
Land 15 01102 g004
Figure 5. Distribution Map of Innovation Spaces in Changsha City. (Source: consistent with Figure 4).
Land 15 01102 g005
Figure 6. (a) Changsha’s Innovation Potential in Opportunity Equality; (b) Innovation Space for Participatory Process Fairness in Changsha City. (Source: consistent with Figure 4).
Land 15 01102 g006
Figure 7. (a) Innovation Space for Changsha’s Innovation Achievement Sharing Level; (b) Distribution of Changsha City’s Overall Urban Inclusive Innovation Level (Source: consistent with Figure 4).
Land 15 01102 g007
Figure 8. Innovation Space Autocorrelation Analysis Report (Source: consistent with Figure 4).
Land 15 01102 g008
Figure 9. Partial Autocorrelation Analysis Map of Changsha City’s Innovation Spaces (Source: consistent with Figure 4).
Land 15 01102 g009
Figure 10. Interaction Detection Results Diagram (Source: Authors’ own Pearson correlation analysis and visualization based on the self-built research dataset).
Land 15 01102 g010
Table 1. The detailed information of Datasets.
Data typeSpecific DataSource/PlatformWebsite URL
Government statistical dataEconomic output, industrial structure, population, employment, public service indicators, R&D investmentChangsha Statistical Yearbookhttp://tjj.changsha.gov.cn/tjxx/tjsj/tjnj/ (accessed on 1 October 2025)
Government statistical dataAnnual macroeconomic and social development indicatorsChangsha National Economic and Social Development Statistical Bulletinhttps://tjj.hunan.gov.cn/hntj/tjfx/tjgb/szgb/zss_1/index.html (accessed on 1 October 2025)
Science and technology statistical dataScience and technology input, R&D activity, innovation platform and related indicatorsHunan Science and Technology Statistical Yearbook/Hunan Provincial Department of Science and Technologyhttps://kjt.hunan.gov.cn/kjt/xxgk/kjtj/202404/t20240417_33279143.html (accessed on 1 October 2025)
Patent dataValid invention patents filed in ChangshaWanfang Patent Search Platformhttps://c.wanfangdata.com.cn/patent
Enterprise microdataHigh-tech and innovation-oriented enterprisesQichachahttps://www.qichacha.com/ (accessed on 1 October 2025)
Innovation-related POI dataHigh-tech zones, industrial parks, science parks, incubators, maker spaces, research institutions, technology service platformsOverpass APIhttps://overpass-turbo.eu/ (accessed on 1 October 2025)
Spatial geographic dataAdministrative boundaries, road network, public transport facilities, spatial coordinatesOpenStreetMap; Geofabrik Download Serverhttps://download.geofabrik.de/asia/china.html (accessed on 1 October 2025)
(Source: Compiled by the authors, listing detailed access URLs of all datasets adopted in this study).
Table 2. Factors Influencing Innovation Spatial Agglomeration.
Primary IndicatorSecondary IndicatorEvaluation IndicatorAttributeWeight
Opportunity for Participation 0.261Participating groups
0.193
Proportion of permanent non-local residents/%+0.615
Percentage of female residents/%+0.385
Opportunities for Innovation 0.084Registered unemployment rate per 10,000 people0.325
Number of vocational skills training institutions per 10,000 people+0.675
Innovation Resources 0.361Number of high-tech enterprises per 10,000 people+0.309
Number of technology incubators per 10,000 people+0.691
Supporting facilities 0.362Number of passenger vehicles per 10,000 residents+0.385
R&D intensity as a percentage of GDP+0.203
Commercial building rental rates by district (CNY/m2/month)+0.172
Hospital beds per 10,000 residents+0.240
Fairness in Participation Processes 0.122EngagementParticipation rate in innovation skills training+0.691
0.122Proportion of ordinary residents (including migrant populations) participating in community innovation deliberations+0.309
Sharing of Innovative Achievements 0.617Technological progressValue of technology contracts concluded per 10,000 people/CNY+0.689
0.377Number of patent applications granted per 10,000 people/units+0.311
Environmental ImprovementPercentage reduction in energy consumption per unit of GDP+0.558
0.082Percentage of municipal solid waste treated safely+0.442
Economic growthPer capita gross domestic product (GDP)/yuan+0.549
0.332Per capita disposable income/yuan+0.451
Social WelfareNumber of social work agencies providing accommodation services per 10,000 people/units+0.514
0.209Number of adoption-related beds per 10,000 people+0.486
(Source: Calculated and compiled by the authors based on the constructed evaluation index system).
Table 3. Indicators and Weights for Factors Influencing Urban Inclusive Innovation.
Impact FactorIndicator FactorAttributeWeight
X1 fiscal investmentThe proportion of science and technology expenditures in total expenditures+0.481
Share of social security and employment expenditures in total expenditures+0.305
Regional Economic Development Level (GDP)+0.214
X2 Industrial StructureThe ratio of tertiary industry output value to secondary industry output value+1.000
X3 Cultural EducationPublic library book holdings per 10,000 people+0.515
Number of full-time primary and secondary school teachers per 10,000 people+0.485
X4 Social SecurityPersons enrolled in basic medical insurance for employees per 10,000 population+0.561
Enrollment in unemployment insurance per 10,000 people+0.439
X5 Natural EnvironmentAnnual average PM2.5 mass concentration/(μg/m3)0.516
Forest coverage rate within the region+0.384
(Source: Calculated and compiled by the authors based on the constructed evaluation index system).
Disclaimer/Publisher’s Note: The statements, opinions and data contained in all publications are solely those of the individual author(s) and contributor(s) and not of MDPI and/or the editor(s). MDPI and/or the editor(s) disclaim responsibility for any injury to people or property resulting from any ideas, methods, instructions or products referred to in the content.