Article

Evaluating Spatial Distribution of Cultural Ecosystem Services (CESs) Based on Rural Landscape Characteristics

1
The College of Horticulture, Nanjing Agricultural University, Nanjing 210095, China
2
School of Environmental Science, Nanjing Xiaozhuang University, Nanjing 211171, China
3
School of Business, Changzhou University, Changzhou 213164, China
*
Authors to whom correspondence should be addressed.
Land 2026, 15(9), 1540; https://doi.org/10.3390/land15091540
Submission received: 20 July 2026 / Revised: 17 August 2026 / Accepted: 20 August 2026 / Published: 24 August 2026

Highlights

  • Social media data were used to identify typical rural landscape characteristics of CESs.
  • The Maxent model was used to map the spatial distributions of CESs.
  • Clustering analysis was used to identify the spatial zoning types of CESs.
  • The spatial distribution of CESs substantially overlapped.
  • Future rural optimization should account for the spatial distribution of CESs.

Abstract

Cultural ecosystem service (CES) assessment is essential for comprehensively understanding and evaluating ecosystem services. Optimizing the spatial zoning of CESs can provide more targeted information for ecosystem management. By identifying the typical landscape characteristics of different CESs, rural landscape value can be more effectively recognized. This study constructed a set of rural landscape characteristics indicators, identified the typical characteristics of different CESs based on public preferences, mapped their spatial distributions using the Maxent model, and applied K-means clustering analysis to optimize the spatial zoning in rural Huzhou. The results show that the four CESs categories are associated with different rural landscape characteristics. The spatial distributions of the CESs showed substantial overlap and were mainly concentrated in southern Anji County, around the Moganshan Scenic Area, and along the shoreline of Lake Taihu. Five types of rural landscapes were identified based on spatial distribution of the CESs. This study provides a reference for identifying the landscape value of CESs in rural areas and supports the incorporation of CES assessment into rural landscape management decision-making.

1. Introduction

Ecosystem services form an important basis for sustainable development, and their systematic assessment can inform biodiversity conservation, economic development, and improvements in human well-being [1]. Ecosystem services are generally classified as provisioning, regulating, cultural, and supporting services [2]. Among these, cultural ecosystem services are regarded as critical components of ecosystem services and make a significant contribution to human well-being [3]. Cultural ecosystem services (CESs) refer to the non-material benefits that people obtain from ecosystems through aesthetic experiences, recreation, cultural identity, spiritual experiences, and educational inspiration [4,5]. Compared with provisioning and regulating services, CESs depend more strongly on human perception, experience, and cultural context [6,7]. Accordingly, identifying and quantifying CESs can enhance public engagement, support for landscape planning, and human welfare [8].
Spatially mapping CESs remains challenging because of their intangible nature [4,9] and the subjectivity involved in estimating spiritual values [7]. Because CESs are not readily represented by biophysical quantities, monetary valuation and model simulation have become the principal approaches for their quantification [10]. The monetary valuation methods can be divided into direct market, surrogate market, and simulated market approaches, and the monetization of CESs has focused mainly on the benefits derived from recreation and aesthetics [11]. However, these methods require numerous input parameters, involve complex procedures, may overlook the many values of cultural services, and are strongly influenced by subjective assumptions. Among the model-based approaches, maximum entropy modeling has been widely used with multi-source data. By using participatory mapping locations, social media photographs, or other public perception data as sample sites, the Maxent model can represent the potential spatial distributions of different CESs [12,13,14,15]. Nevertheless, many studies have used the same or a broadly generic set of environmental variables for different CES categories, including land use, distance to roads and water bodies, topographic factors, and landscape diversity [12,14,15], potentially overlooking the differences in the landscape characteristics underlying distinct cultural services.
Landscape characteristics primarily refer to combinations of natural, cultural, and infrastructural elements. Different combinations can generate different cultural services and constitute fundamental sources of the spatial differences among CESs [16]. Rural landscape assessment has often emphasized aesthetic quality [17], whereas comparatively few studies have examined the relationships between landscape characteristics and CESs. Identifying the typical rural landscape characteristics of different CESs is therefore important for providing theoretical and technical support for rural planning, design, and development.
Different landscape characteristics have mainly been used to classify CESs. Dai [18] distinguished experiential, physical, and intellectual CESs in urban parks using indicators such as the proportion of landscape visible within the viewshed, biodiversity, and the proportion of recreational space. Other studies identified different CES categories from landscape elements in social media photographs, supplemented the classification with word frequency information from reviews, or used expert evaluations of landscape characteristics [16]. Research on CESs-related landscape characteristics has extensively examined experiential and physical CESs [19], while the relationships between landscape characteristics and other CES categories have received less attention.
Studies on CESs have focused on landscape functional zoning planning. Li et al. conducted a study on the rural areas in Huzhou City, Zhejiang Province, to quantitatively evaluate the value of CESs and delineate rural landscape functional zones through cluster analysis. Similar studies provide a scientific basis for optimizing rural landscape spaces from the perspective of CESs [3]. The current research has focused on the value of CESs in rural landscapes and the alignment of supply and demand [14]. Methods such as cluster analysis and spatial autocorrelation analysis have been frequently used to optimize landscape zoning [20]. Research on these methods is relatively well-established, providing methodological support for the management and optimization of rural landscape spaces.
Advances in remote sensing and geographic information systems (GISs) have provided new methods and data sources for constructing landscape characteristic systems based on public preferences [21]. Geosocial media platforms such as Flickr have also provided large amounts of spatial information on recreation and human–environment interactions [22]. Social media data can reflect public preferences through the spatial density of shared photographs and user ratings, while textual reviews contain visitors’ assessments of the strengths and weaknesses of tourist attractions; word frequency analysis of these reviews can therefore support the evaluation of landscape characteristics [23]. However, social media research has focused mainly on preferences for parks and urban green spaces, with fewer applications to rural landscapes.
With abundant rural tourism resources and a developed regional economy, Huzhou provides a suitable rural study area in the Yangtze River Delta. This study aimed to spatially quantify CESs by identifying the typical rural landscape characteristics associated with physical, experiential, intellectual, and inspirational CESs. It addressed three questions: (1) How can the typical rural landscape characteristics of different CESs be identified based on public preferences? (2) How can the spatial distribution of different CESs in rural areas be quantified using differentiated landscape characteristic indicators? (3) How can priority CES types be identified from the spatial distributions of multiple CESs at the regional scale to support rural development? To address these questions, this study identified the typical landscape characteristics of CESs in the natural, cultural, and infrastructural dimensions, visualized the spatial distributions of multiple CESs using the Maxent model, and further identified priority CES types through clustering analysis, thereby providing theoretical support for identifying the dominant CES types in rural landscapes and optimizing rural landscape management.

2. Materials and Methods

This study developed a method for identifying the spatial distribution of different cultural ecosystem services (CESs) based on social media data (Figure 1). The method comprised four main steps: (1) preprocessing data obtained from online travel platforms and identifying the CES category of each rural tourist attraction through word-frequency analysis of visitor reviews; (2) constructing a rural landscape characteristic indicators database and identifying the important landscape characteristic indicators associated with different CESs by incorporating public preference scores; (3) using typical landscape sample sites and important landscape characteristic indicators of different CESs as inputs to the Maxent model to estimate their spatial distributions; and (4) conducting clustering analysis of the spatial distributions of the four CESs.

2.1. Study Area

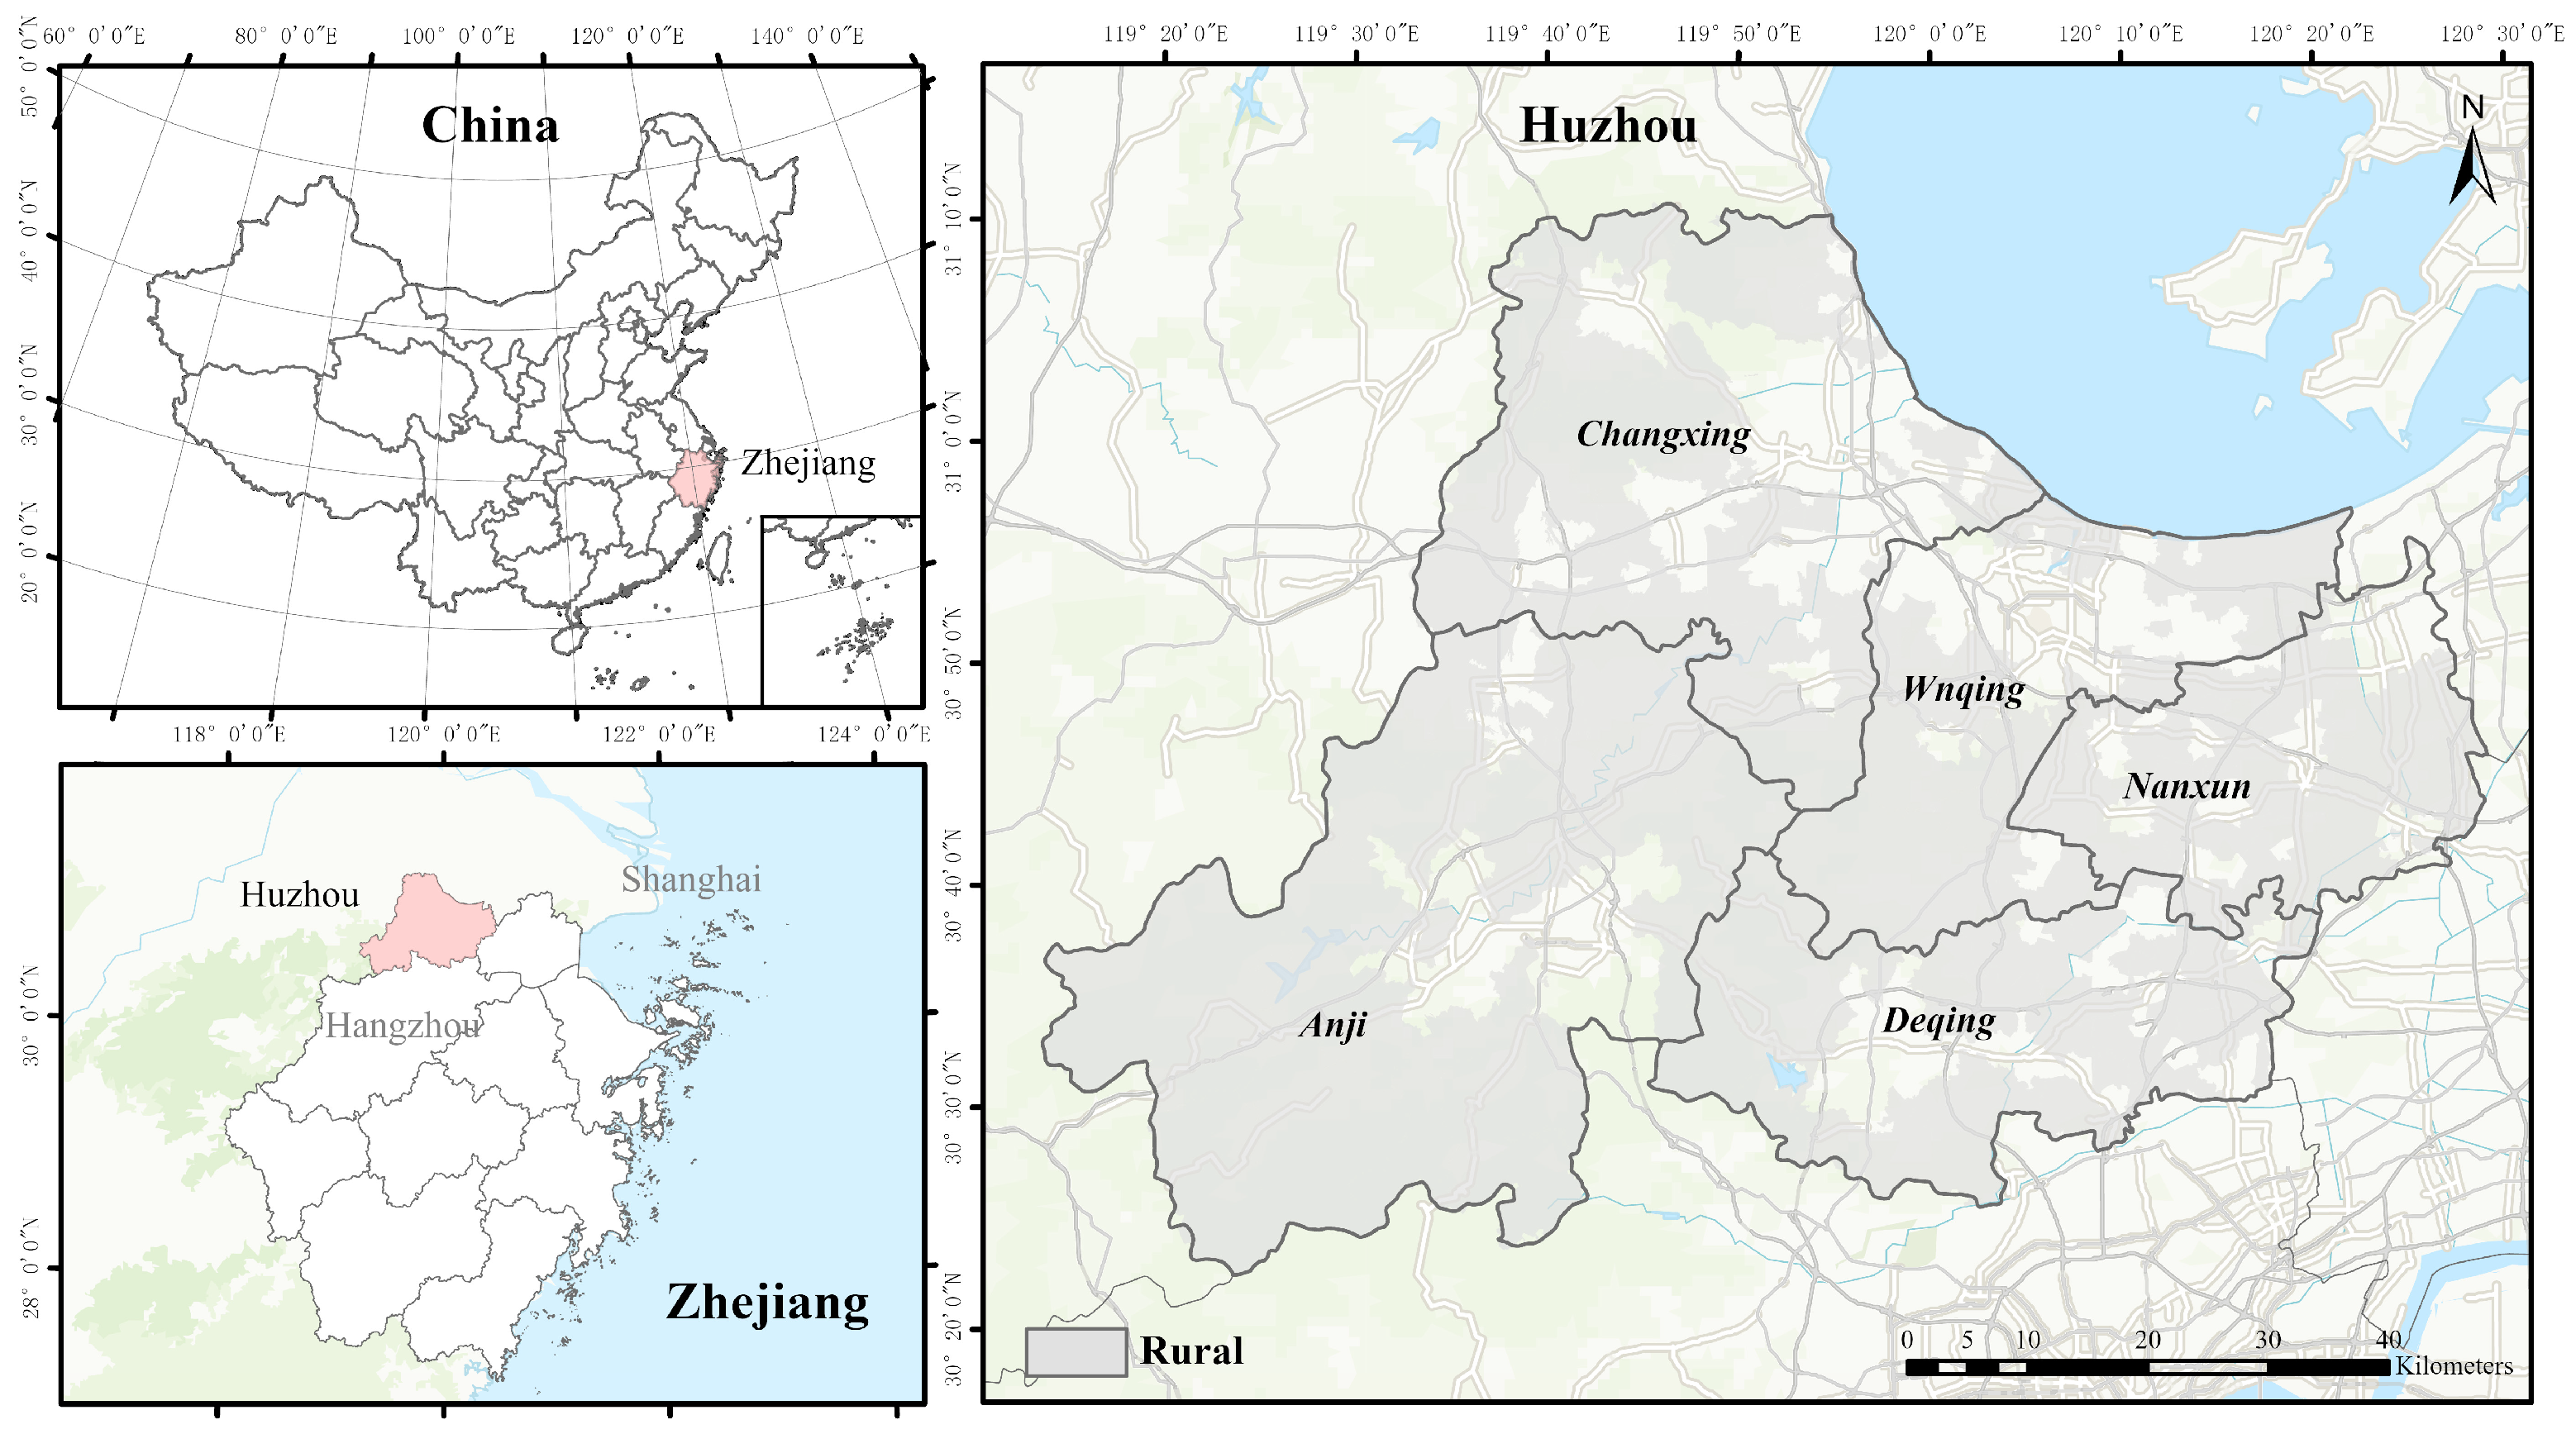
The rural areas of Huzhou city, Zhejiang province, China, were selected as the study area. Huzhou is located in northern Zhejiang province, on the southern shore of Lake Taihu, and in the central Yangtze River Delta, covering a total area of approximately 5820 km2 [24] (Figure 2). The region encompasses diverse landscape types, including mountains, forests, rivers and lakes, farmland, and rural settlements, and has a strong rural tourism, homestay tourism, and ecological recreation foundation. Its diverse rural landscape resources, relatively well-developed tourism service system, and pronounced intra-regional development disparities make Huzhou a representative area for investigating the spatial distribution of different CESs.
The rural extent was delineated according to the Rules for Compiling Statistical Zoning Codes and Urban-Rural Classification Codes issued by the National Bureau of Statistics of China. Areas with urban–rural classification codes beginning with “1” were classified as urban areas, whereas those with codes beginning with “2” were classified as rural areas [25]. Based on this classification, the urban and rural areas of Huzhou were delineated in ArcGIS 10.8 using administrative boundary data. The results were subsequently cross-checked against 2019 Gaofen-1 (GF-1) satellite imagery obtained from the China Centre for Resources Satellite Data and Application (CRESDA) [26].

2.2. Identification of CESs

Ctrip and Qunar are widely used online travel platforms in China. They provide basic information on tourist attractions, visitor ratings, and textual reviews, which can reflect visitors’ actual travel experiences and landscape preferences [27]. Python 3.14.0 was used to retrieve data on tourist attractions and their associated reviews in Huzhou [28]. After the basic information was cleaned and the coordinates were transformed, the attractions were spatially filtered according to the boundary of rural Huzhou. Attractions with fewer than 20 reviews were excluded, resulting in a total of 148 rural tourist attractions. The corresponding reviews were subsequently extracted, and duplicate and platform-generated reviews were removed, yielding 37,854 valid reviews.
Following the Common International Classification of Ecosystem Services (CICES) and considering the specific cultural services provided by rural landscapes, CESs were classified into four categories: physical, experiential, intellectual, and inspirational CESs [12,29]. Jieba was used to perform word segmentation and word frequency analysis of the 37,854 reviews. The extracted keywords were grouped into four major categories—biological and natural landscape elements, cultural landscape elements, perceptual elements, and sense-of-place elements—and 20 subcategories [30,31,32]. A text–feature matrix was constructed using the relative frequencies of the different keyword categories in the reviews of each attraction. The matrix was standardized using the Z-score method, and K-means clustering was subsequently applied to classify the 148 attractions into four CES sample groups [33,34]. Because K-means assigns each attraction to a single cluster according to its distance to the cluster centroids, each attraction was classified into one CES category for the subsequent analyses. The assigned category represents the CES characteristics that are most strongly expressed in the standardized review-based feature space. However, this classification does not imply that other CES characteristics are absent from the same attraction. To make the relationships between individual attractions and the four CES categories more transparent, the Euclidean distances from each attraction to all four cluster centroids were calculated. The nearest and second-nearest centroid distances, the distance margin, the distance ratio, and the silhouette coefficient are reported in Supplementary Table S1.
To test the reliability of the word frequency classification procedure, three professionals independently evaluated the content of the 37,854 reviews from the 148 attractions to determine whether the K-means clustering results based on the word frequency characteristics corresponded to the cultural service functions represented in the review content. Cohen’s kappa coefficient was used to evaluate the agreement between the clustering results and the independent classifications conducted by relevant professionals [35]. Ultimately, 49 sample sites were identified for physical CESs, 47 for experiential CESs, 44 for intellectual CESs, and 8 for inspirational CESs. Detailed procedures for data preprocessing, keyword classification, clustering, and consistency testing are provided in Li et al. [16].

2.3. Identification of Indicators of CESs’ Typical Landscape Characteristics

2.3.1. Indicators of Landscape Characteristics

To evaluate public preferences for rural landscape characteristics, this study developed a rural landscape characteristic indicator database based on previous studies [14,16,19,36]. The indicator system comprised three categories: natural elements, cultural elements, and infrastructural elements. Natural elements encompassed visibility, landscape type composition, landscape pattern, environmental quality, and perceptual evaluation. Cultural elements mainly included cultural landscapes, ancient villages, ancient and notable trees, beautiful countryside, and geographical indication agricultural products. Infrastructural elements primarily reflected accessibility to roads, town centers, accommodation facilities, restaurants, and communal facilities. To ensure spatial consistency among the source datasets, indicator-specific preprocessing was first conducted according to the characteristics of each dataset, after which all derived spatial indicators were harmonized to a 10 m × 10 m analytical grid. The definitions and calculation methods of all indicators are presented in Table 1. Detailed information on the original data sources and preprocessing procedures is provided in Supplementary Tables S2 and S3 and in Li et al. [16].

2.3.2. Assessing Public Preferences

To comprehensively represent public preferences for rural landscapes, this study integrated visitor ratings from online travel platforms with government assessments of tourist attraction quality grades. Visitor ratings were obtained from online travel platforms and reflected visitors’ subjective evaluations of landscape experiences and service quality. Government assessment scores are based on the official quality grading system for tourist attractions and reflect the overall performance of tourist attractions in terms of transportation, sightseeing services, safety, sanitation, management, and the protection of tourism resources and the environment [37].
Both visitor ratings and government assessment scores were converted to a five-point scale and assigned equal weights. The public preference score for each tourist attraction was calculated as follows:
S = S p e o p l e + S g o v e r n m e n t
where S represents the public preference score of a tourist attraction; Speople represents the visitor rating obtained from online travel platforms; Sgovernment represents the assessment score converted from the government-designated quality grade of the tourist attraction. Government assessments comprise five grades, with 1A-, 2A-, 3A-, 4A-, and 5A-rated tourist attractions assigned scores of 1, 2, 3, 4, and 5, respectively.

2.3.3. Identification of Important Indicators of Landscape Characteristics

Random forest regression was used to examine the relationships between landscape characteristics and public preferences and to identify important indicators of landscape characteristics for the overall rural landscape and the four CES types [38,39]. The public preference score was used as the continuous response variable, and the indicators of landscape characteristics were used as predictor variables. Separate random forest regression models were constructed for the overall rural landscape and for the physical, experiential, intellectual, and inspirational CES groups. The number of regression trees was set to 500, and the number of predictor variables randomly selected at each split (mtry) was set to the square root of the total number of input variables. Variable importance was evaluated based on the reduction in prediction error associated with each predictor and was normalized for comparison. Based on the variable importance rankings, the ten highest-ranked indicators for the overall rural landscape and each of the four CES types were selected as the explanatory variables for the subsequent Maxent models.

2.4. Statistical Analysis

2.4.1. Maxent Model

The maximum entropy (Maxent) model is a machine learning method based on the principle of maximum entropy. It infers the probability distribution of a target phenomenon in unsampled areas from known sample sites and environmental variables [12,40]. Its core principle is maximizing the information entropy of the predicted probability distribution while satisfying the known constraints [41]. Assuming that P(x) represents the probability distribution of an unknown spatial unit x and X is the finite set of spatial units within the study area, entropy is calculated as follows:
H ( P ) = x X P ( x ) ln P ( x )
where H(P) represents the information entropy of probability distribution P, P(x) represents the predicted probability of the target phenomenon in spatial unit x, and X represents the set of all spatial units within the study area. In this study, the typical landscape sample sites of physical, experiential, intellectual, and inspirational CESs were used as presence data, while the corresponding important landscape characteristic indicators identified by the random forest model were used as environmental variables. The Maxent model was then applied to simulate the spatial distributions of the four CES categories. In addition, all rural tourist attractions and the important landscape characteristic indicators identified for the overall rural landscape were used as inputs to simulate the overall spatial distribution of the rural CESs.

2.4.2. K-Means Clustering Analysis

K-means is one of the most widely used clustering algorithms [33]. In this study, the elbow method was applied to determine the optimal number of clusters, k. As k increases, within-cluster cohesion generally improves, and the sum of squared errors decreases rapidly. After an inflection point is reached, however, the reduction in the sum of squared errors becomes relatively small. This inflection point is therefore commonly regarded as the optimal value of k. The spatial distribution values of the physical, experiential, intellectual, and inspirational CESs were standardized using the Z-score method and individually classified into high, medium, and low levels using the natural break classification method. The raster outputs of the Maxent models were subsequently converted into 100 m × 100 m vector grids for clustering analysis.

3. Results

3.1. Typical Landscape Characteristics of Different CESs

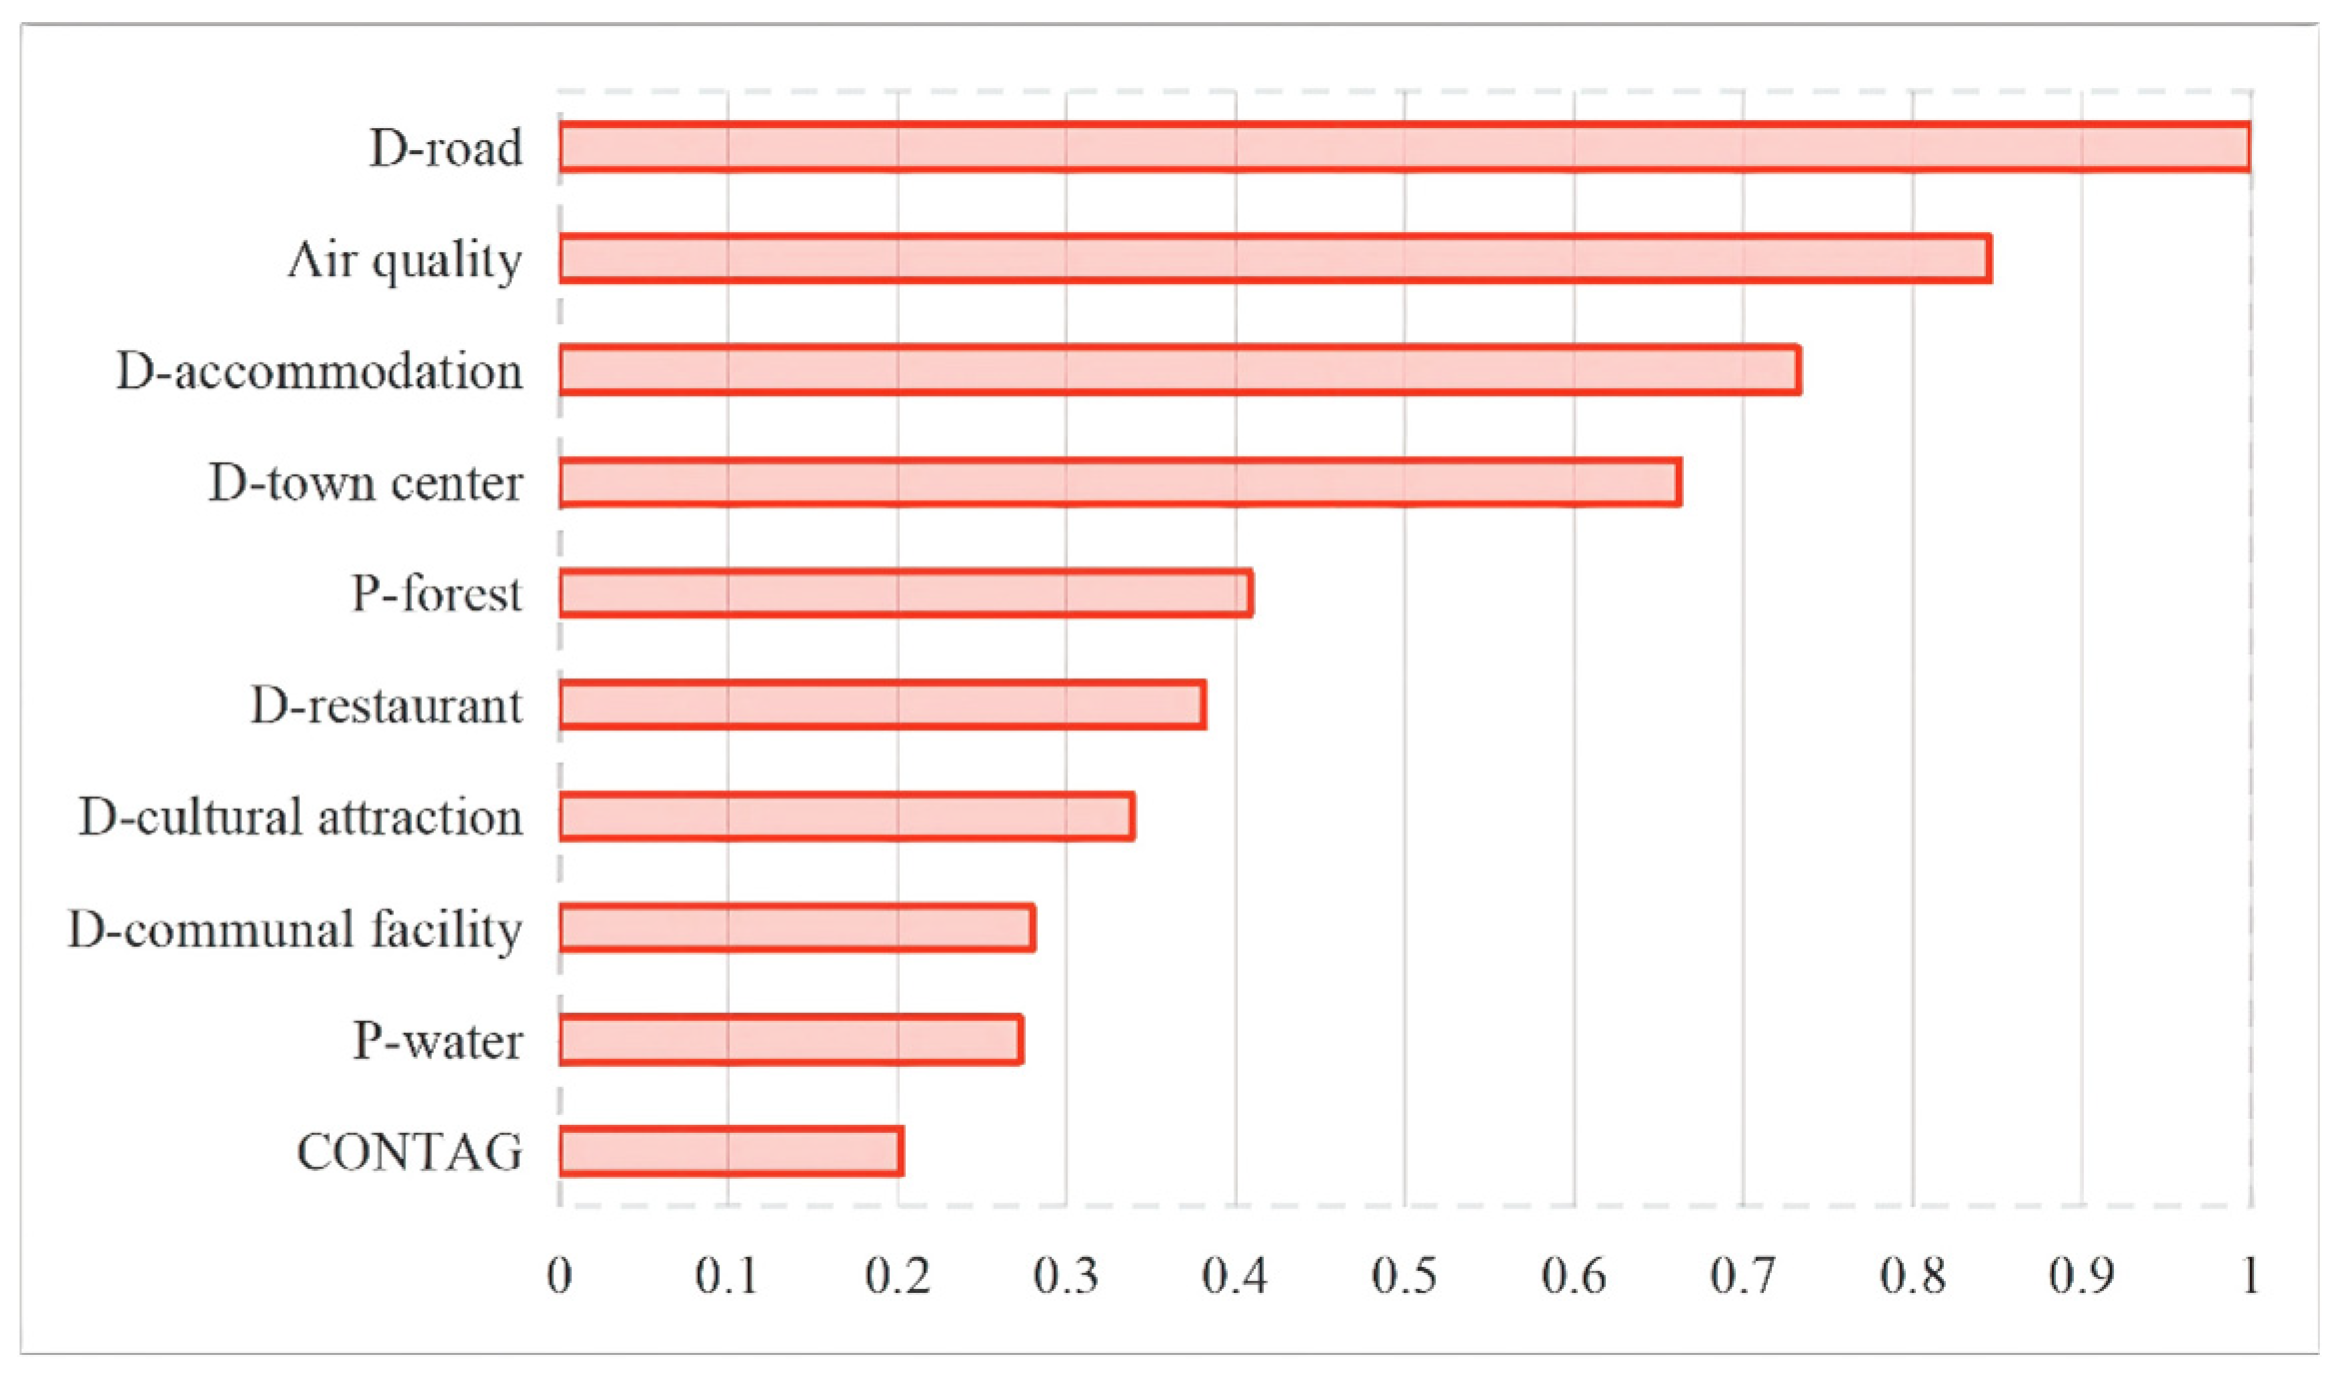
Based on the random forest variable importance rankings, the ten highest-ranked landscape characteristics were selected as important indicators for the rural CESs overall and for the experiential, physical, intellectual, and inspirational CES categories. The important indicators for the overall rural landscape mainly comprised natural elements (four indicators) and infrastructural elements (five indicators). The three most important indicators were D-road, Air quality, and D-accommodation (Figure 3).
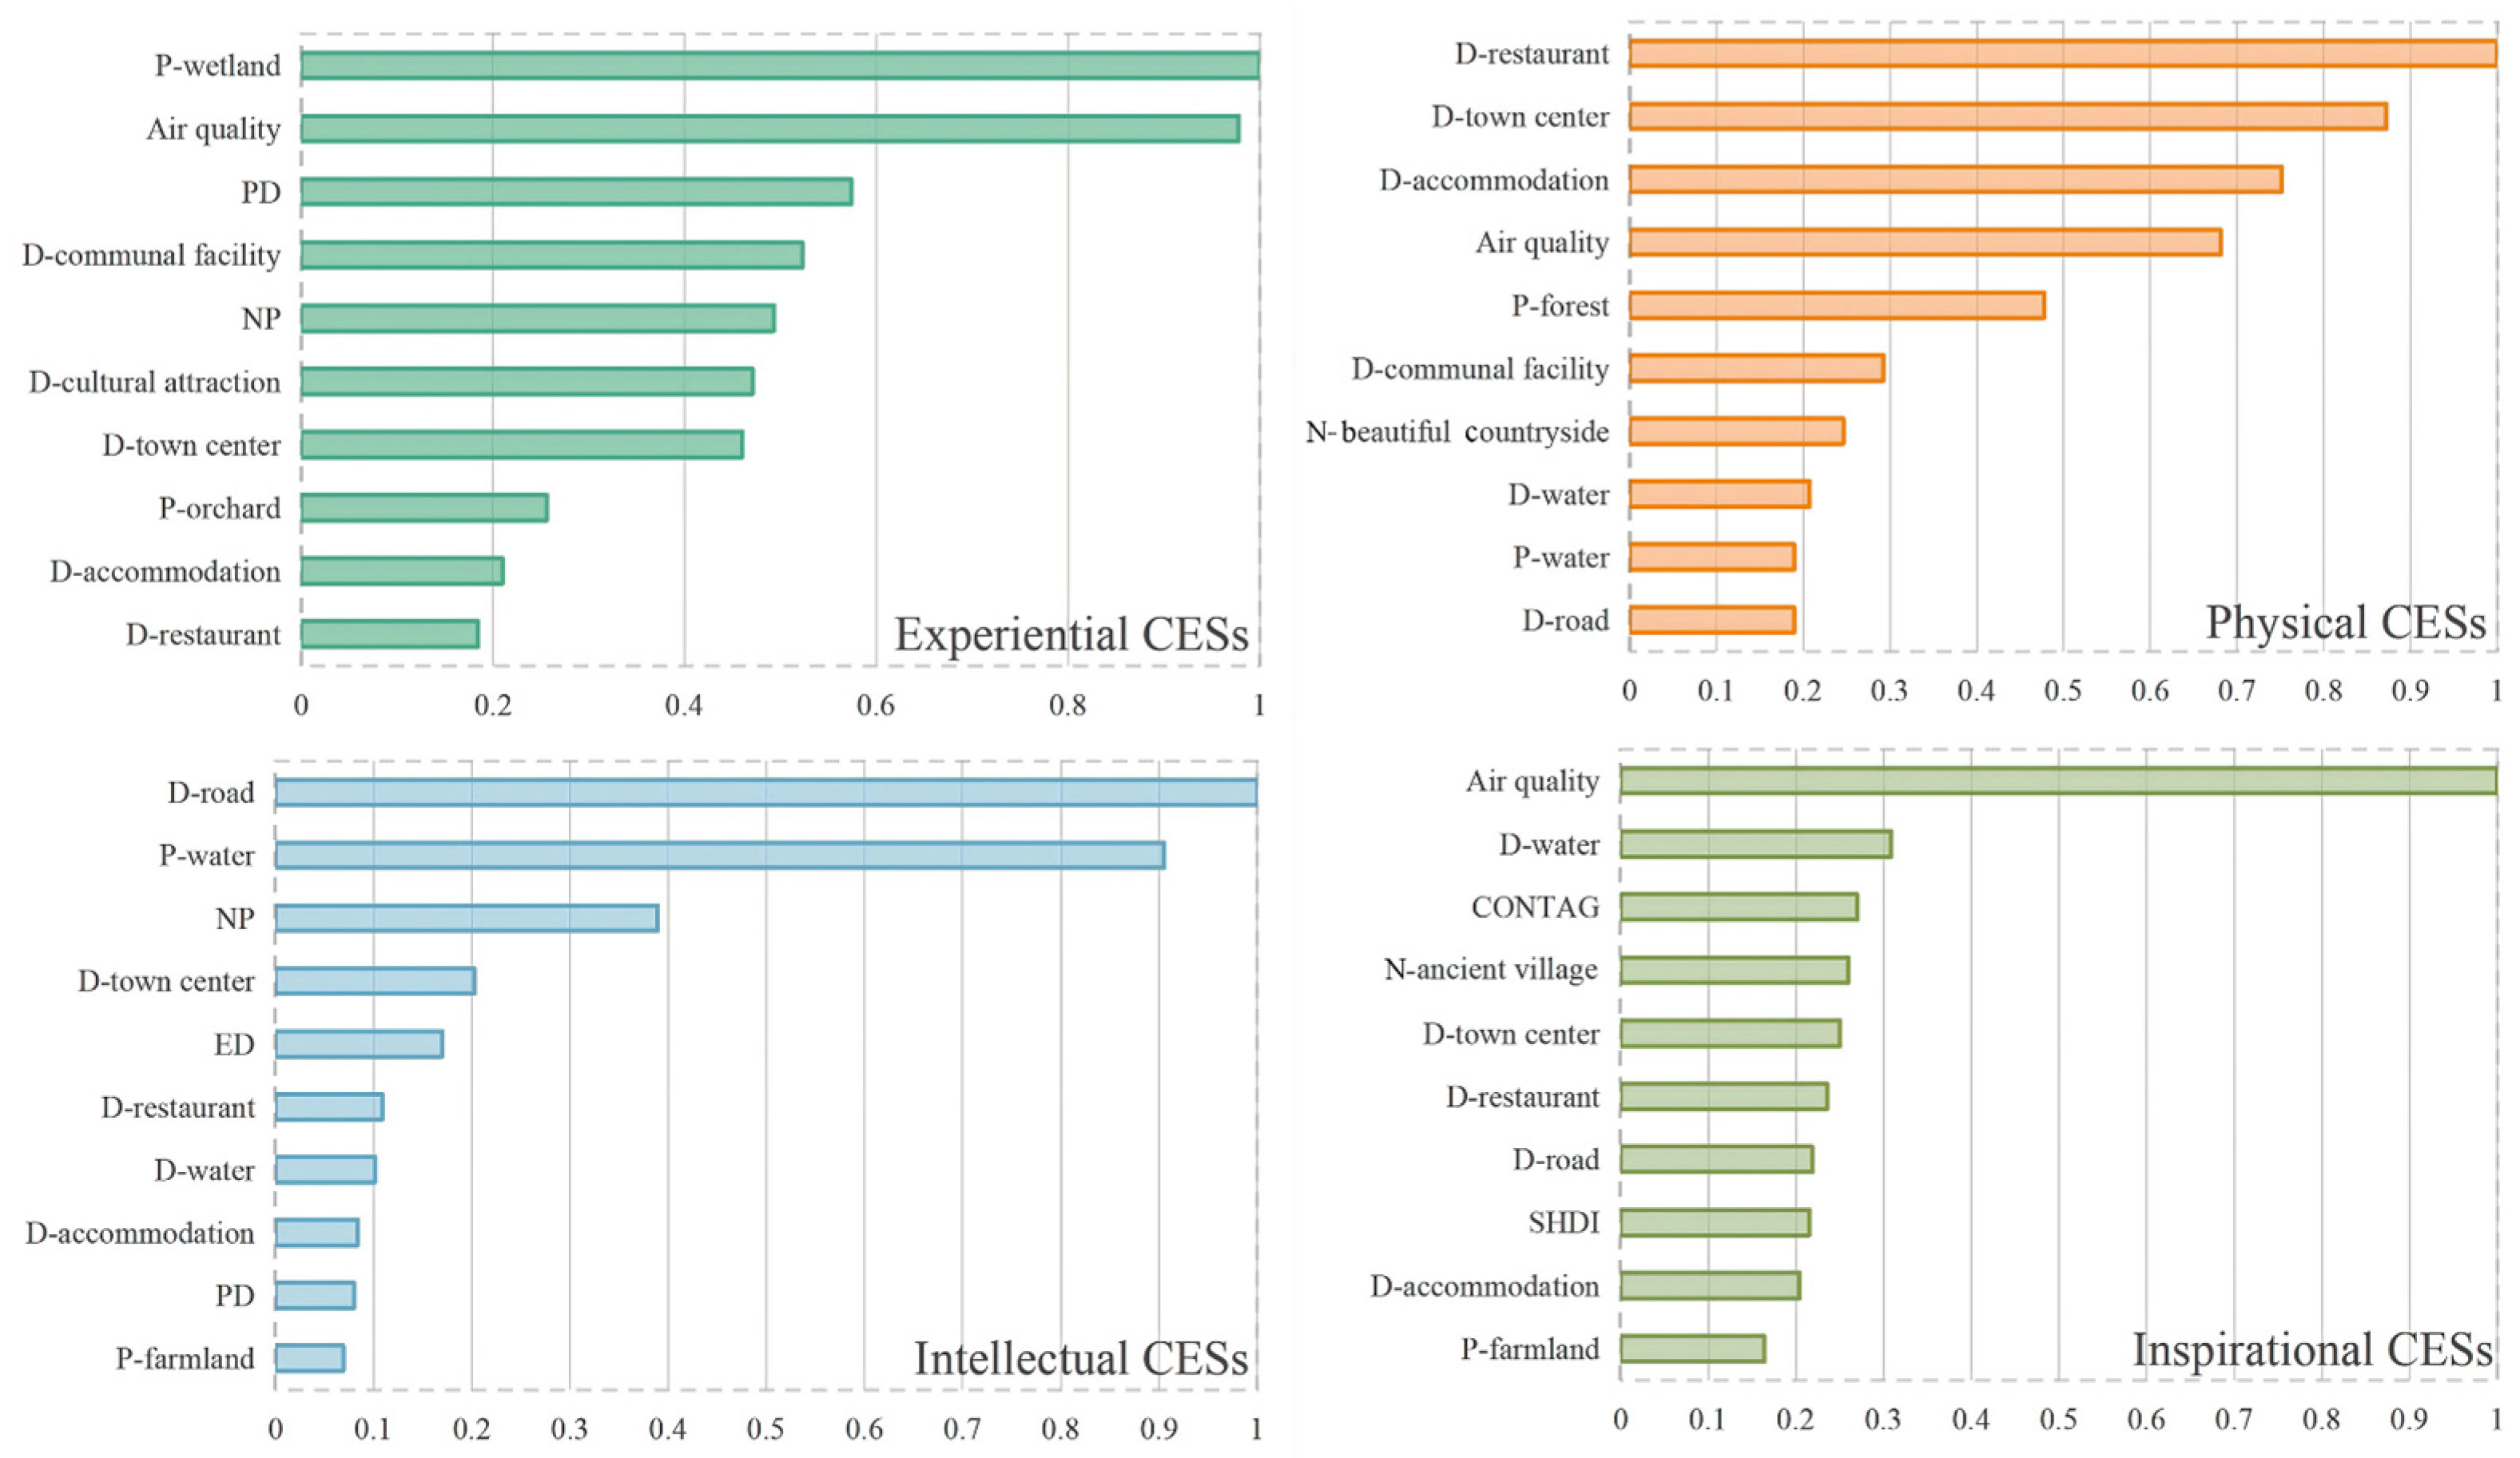
The important indicators for experiential CESs mainly comprised natural elements (five indicators) and infrastructural elements (four indicators), with P-wetland, Air quality, and PD ranking as the three most important indicators. The important indicators for physical CESs mainly comprised natural elements (four indicators) and infrastructural elements (five indicators), with D-restaurant, D-town center, and D-accommodation ranking highest. The important indicators for intellectual CESs mainly comprised natural elements (six indicators) and infrastructural elements (four indicators), with D-road, P-water, and D-town center ranking highest. The important indicators for inspirational CESs mainly comprised natural elements (five indicators) and infrastructural elements (four indicators), with Air quality, D-water, and CONTAG ranking highest (Figure 4).

3.2. Spatial Distribution of Different CESs

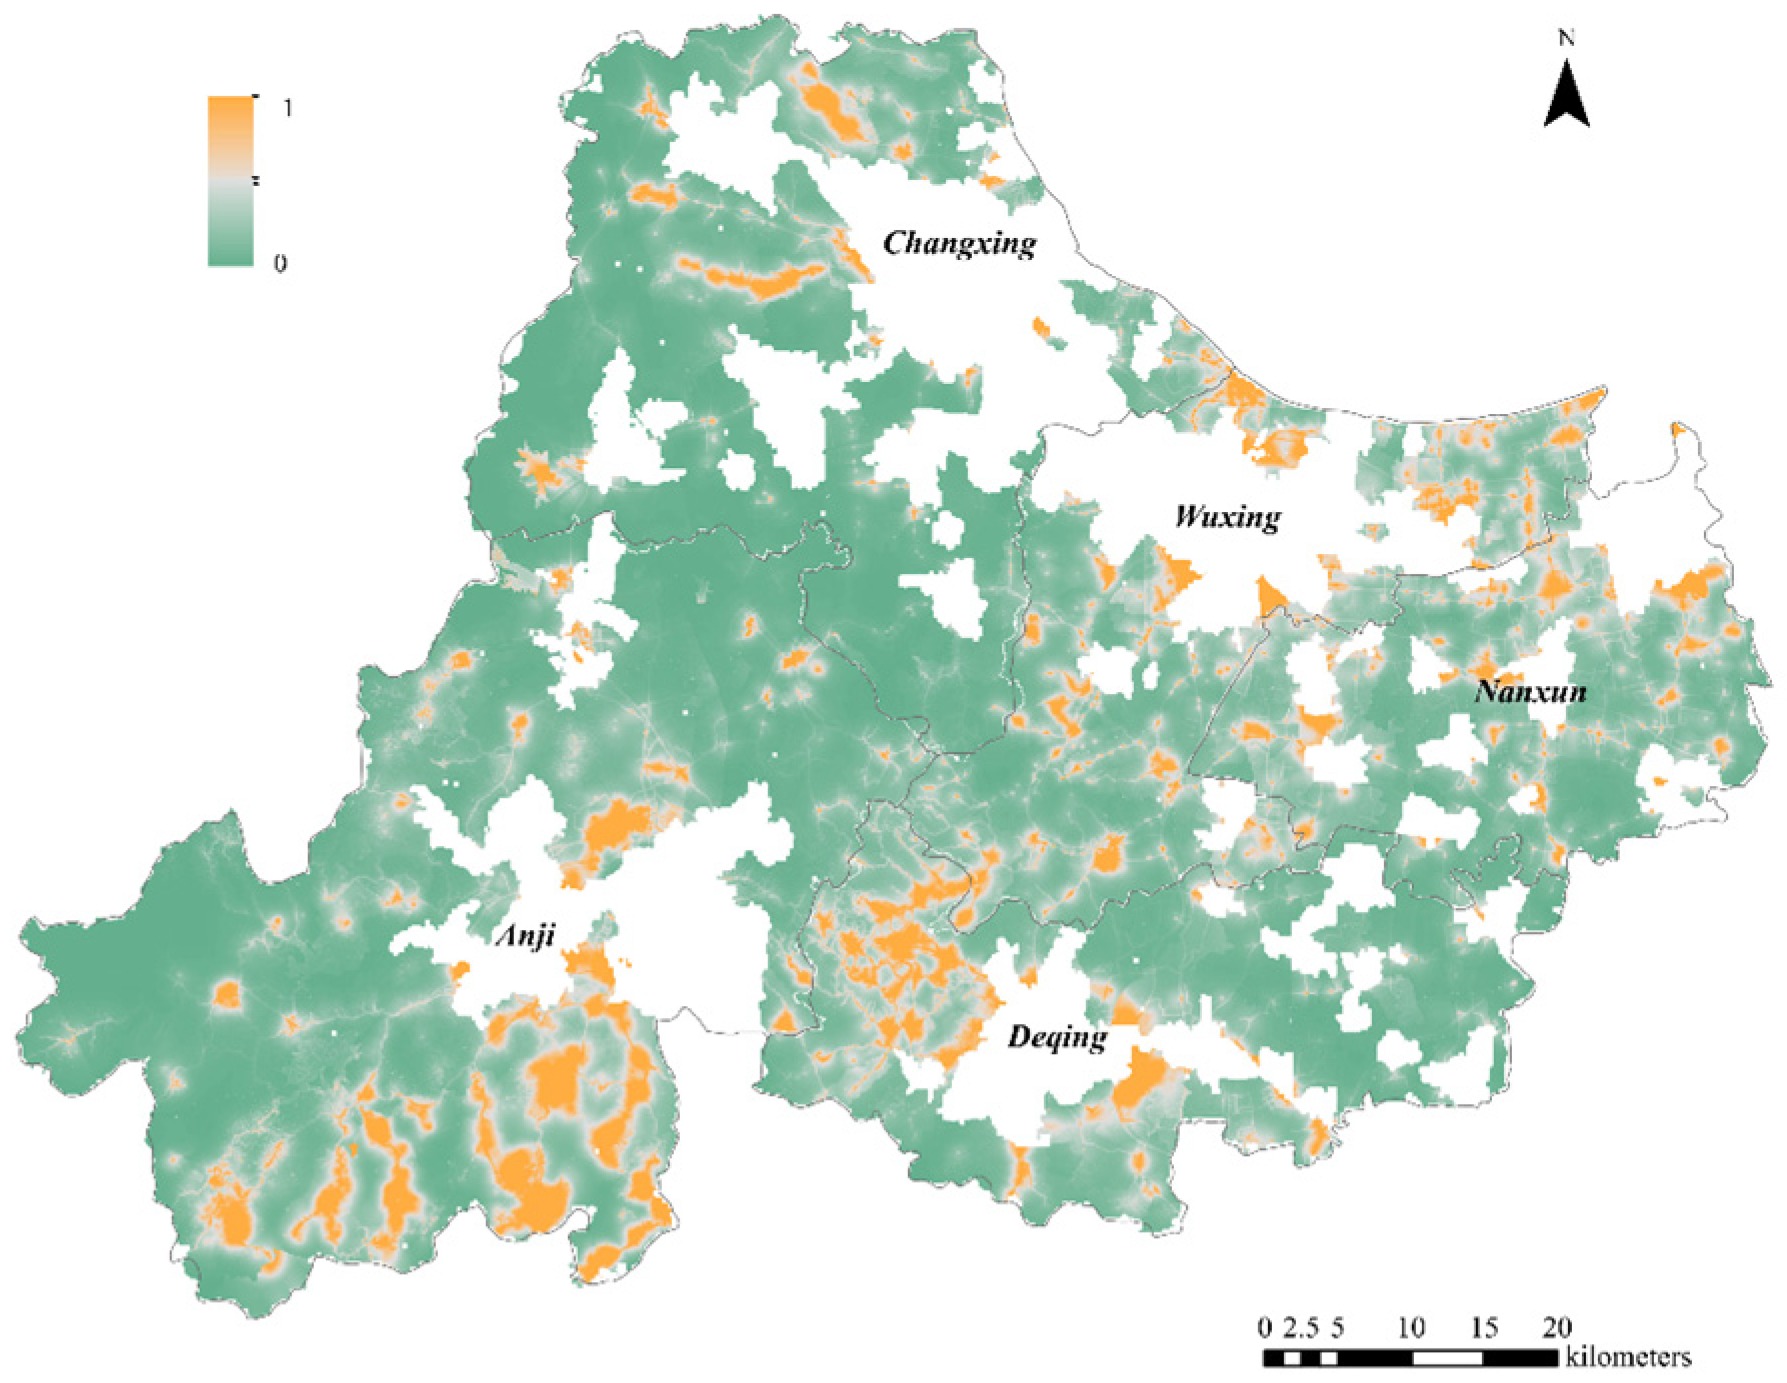
Areas with high overall rural landscape values primarily concentrated in southern Huzhou, whereas high-value areas elsewhere occurred as scattered patches. These areas were generally located near tourist attractions with convenient transportation, particularly in southern Anji County, around the Moganshan Scenic Area in central Deqing County, near Shuikou Township and the Badu Jie Scenic Area in Changxing County, around the Taihu Lake Tourist Resort in Wuxing District, and near Nanxun Ancient Town in Nanxun District (Figure 5).
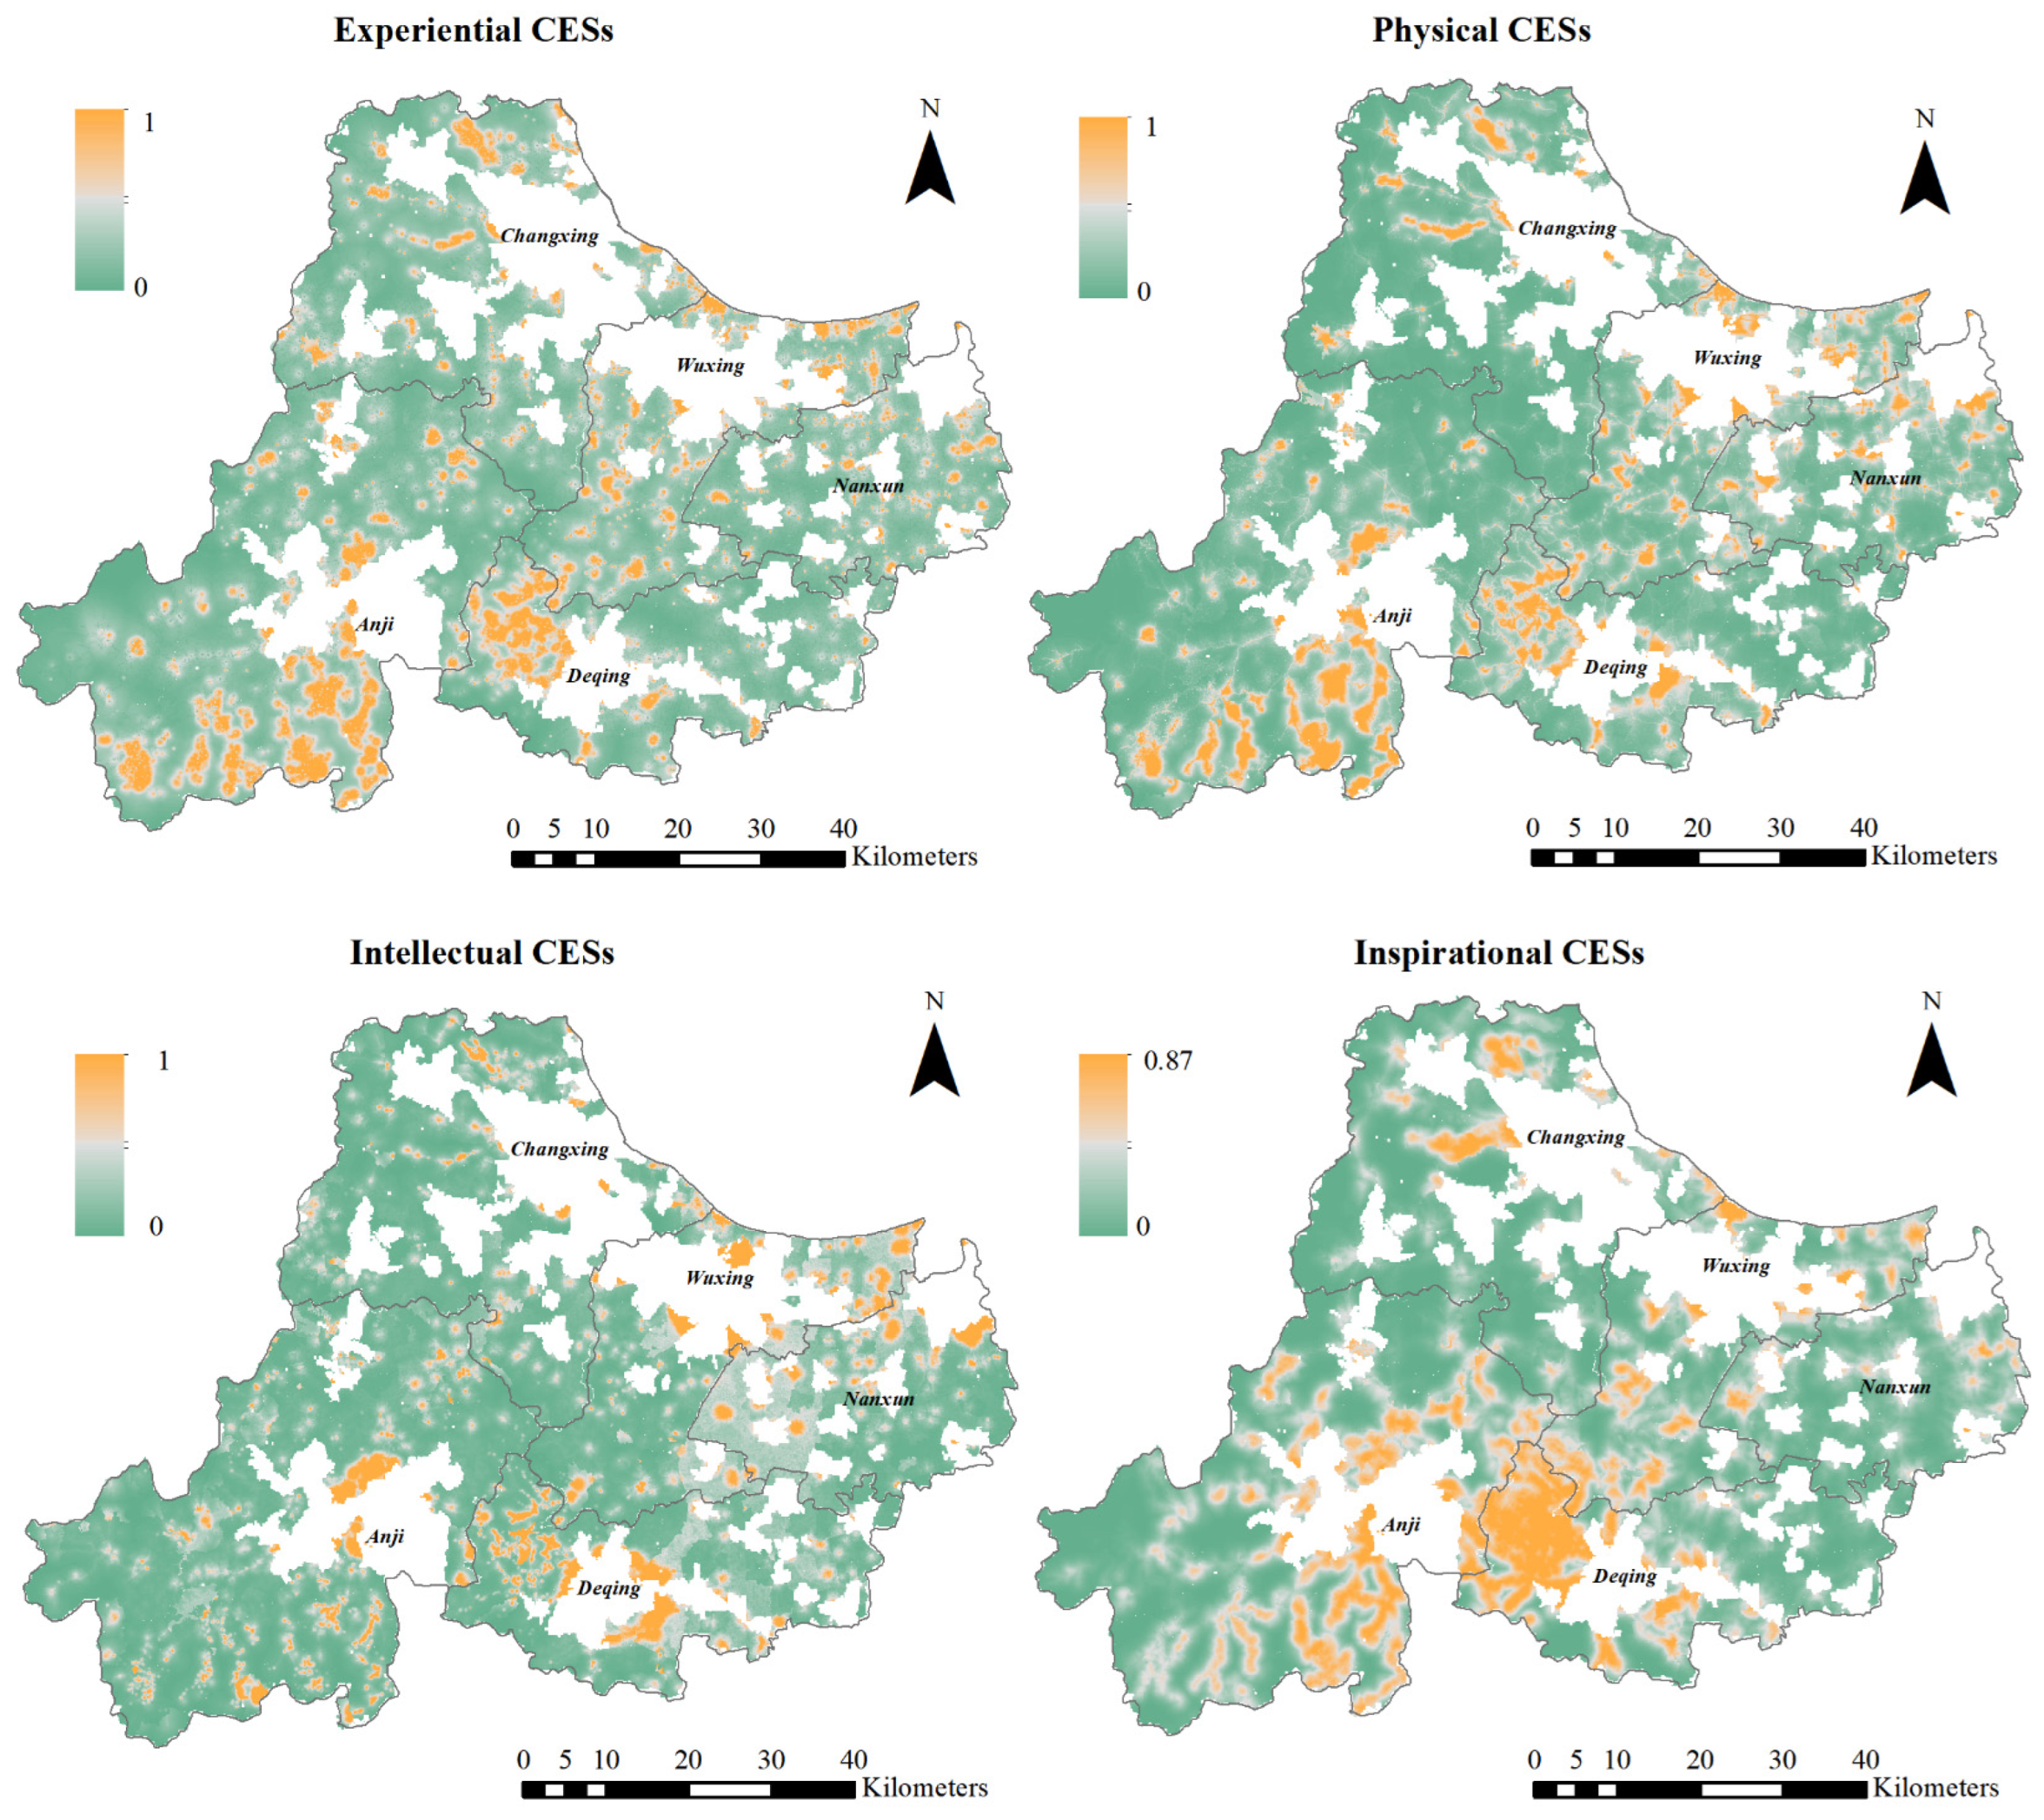
Specifically, experiential CESs were mainly distributed in southern Huzhou and exhibited a relatively scattered spatial pattern. Physical CESs concentrated in southern Anji County and around the Moganshan Scenic Area, showing clear local clustering. Intellectual CESs occupied a relatively limited area and were generally distributed as scattered patches, suggesting that they depended on synergies with other CESs. Inspirational CESs were more spatially concentrated, with typical clustering in relatively tranquil forested and mountainous areas associated with ancient architecture and religious sites (Figure 6).

3.3. Spatial Zoning Optimization of CESs

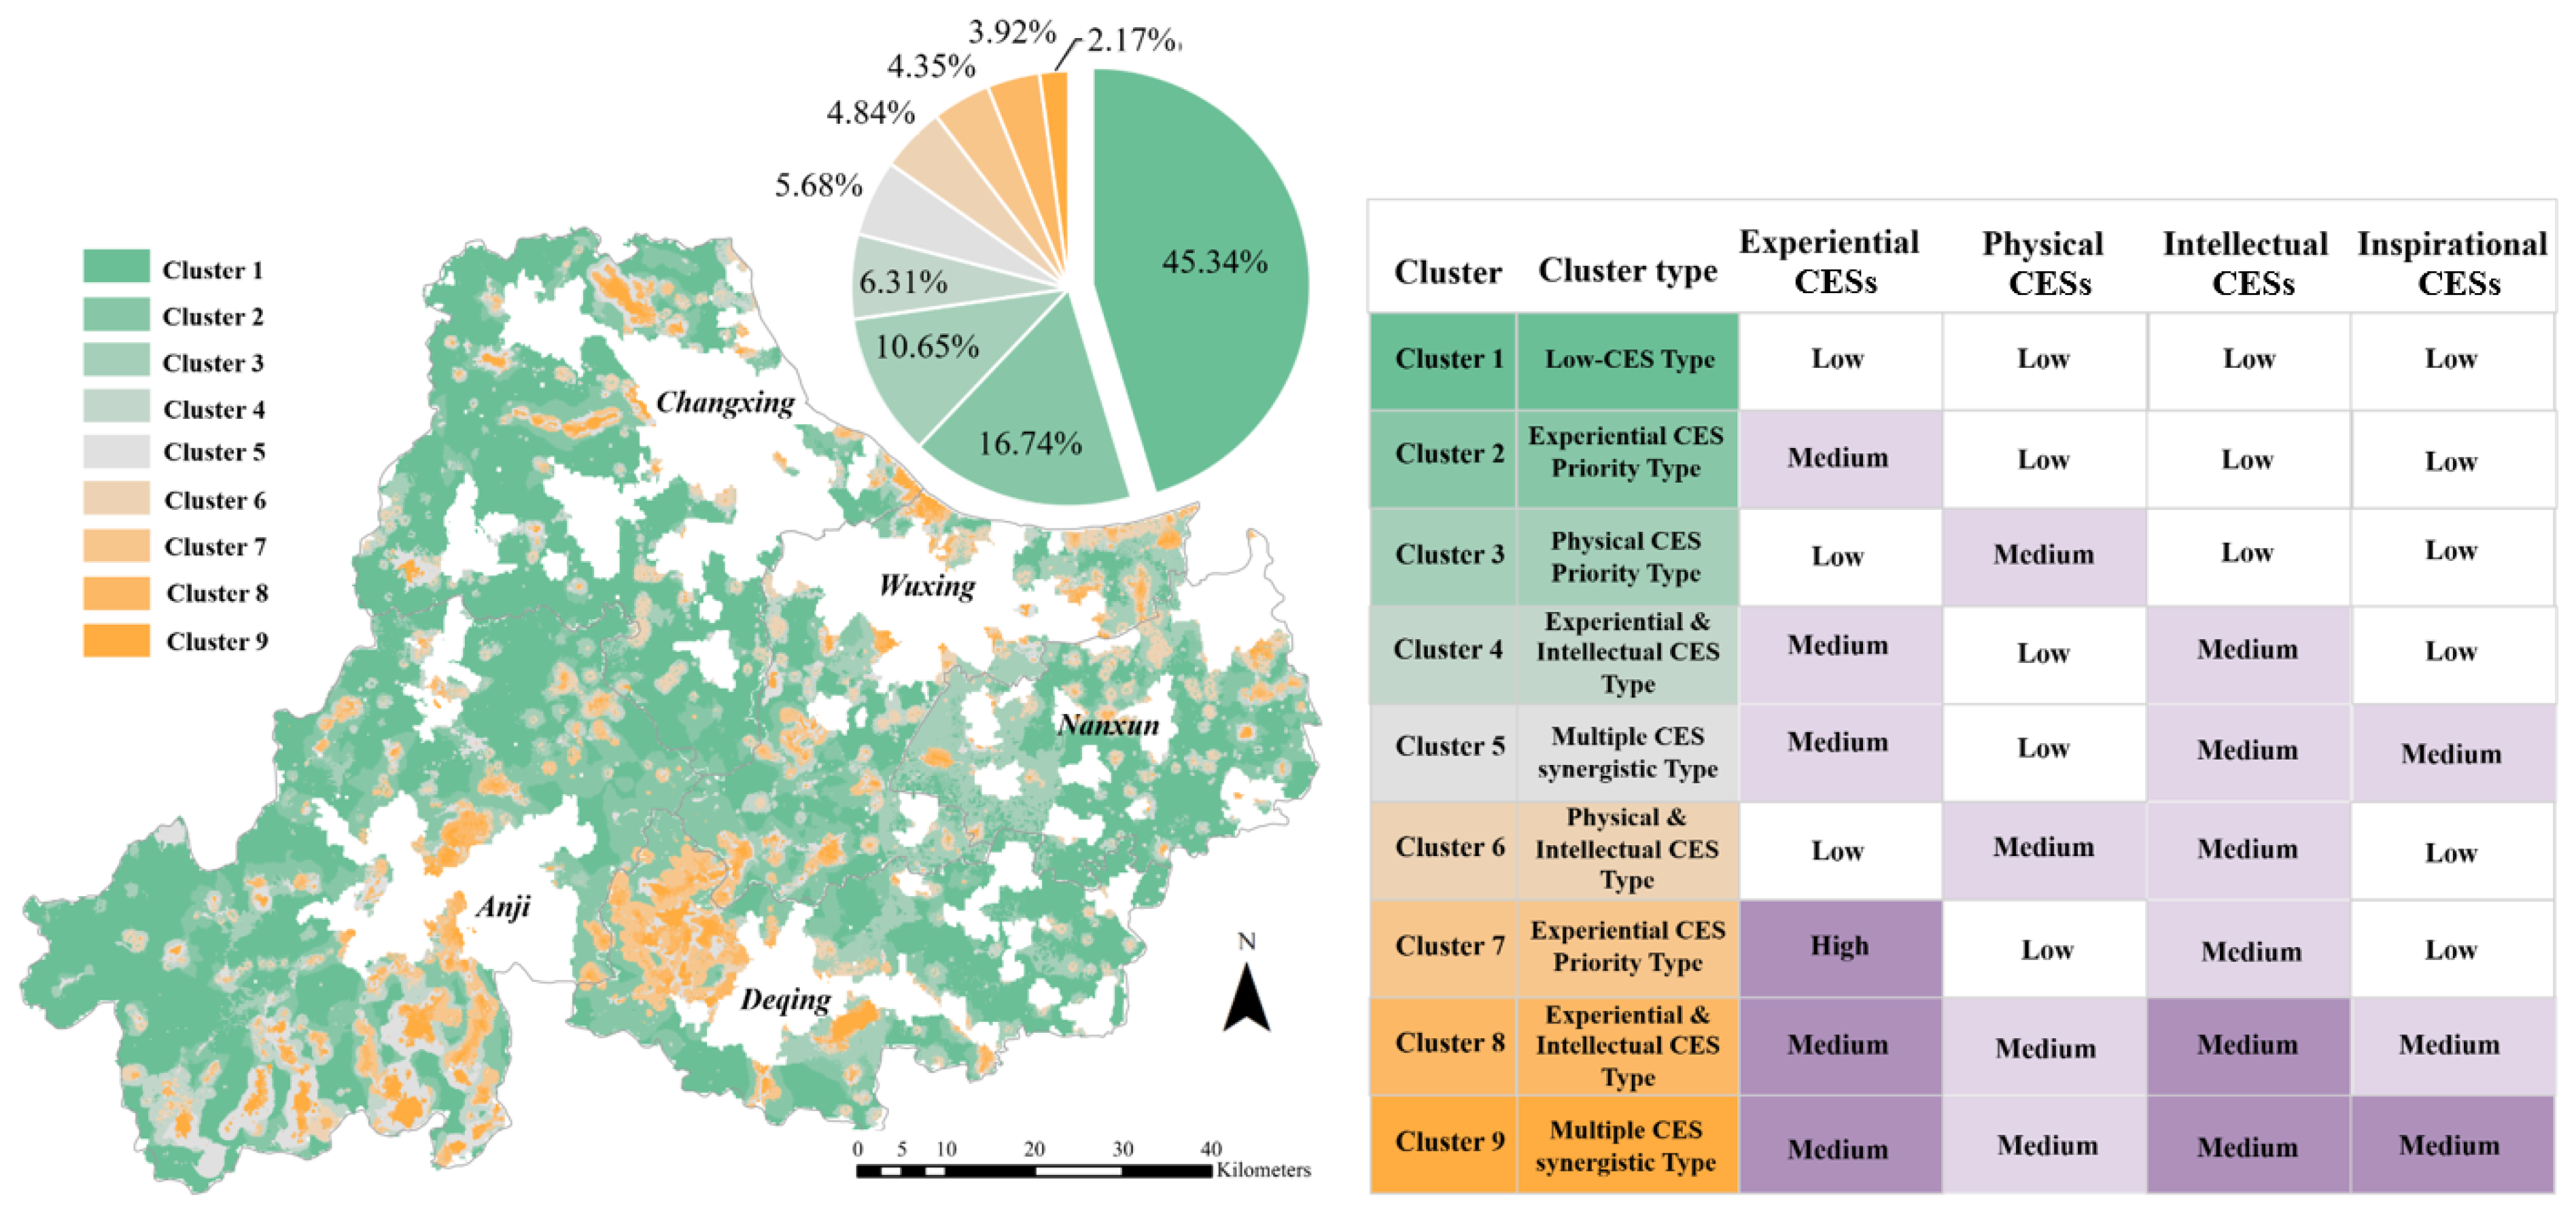
K-means clustering analysis identified nine optimal clusters, which were further consolidated into five priority CES types according to the relative levels of the four CES categories: Physical CES Priority Type, Experiential CES Priority Type, Physical & Intellectual CES Type, Experiential & Intellectual CES Type, and Multiple CES synergistic type.
The Experiential CES Priority Type comprised Clusters 2 (16.74%) and 7 (4.35%), in which the experiential CES values were higher than those of the other CES categories. This type accounted for 21.09% of the study area and was mainly distributed near the boundaries of Anji County, Deqing County, and Wuxing District, with a relatively concentrated distribution around Moganshan Town in Deqing County. The Physical CES Priority Type was represented by Cluster 3 (6.31%), in which physical CES values were higher than those of the other CES categories. It formed a belt-like pattern extending across Wuxing District, Nanxun District, and Deqing County. The Experiential & Intellectual CES Type comprised Clusters 4 (6.31%) and 8 (3.92%), in which the experiential and intellectual CES values were higher than physical and inspirational CES values. This type accounted for 10.23% of the study area, was relatively scattered across several counties and districts, and concentrated mainly in central and southern Anji County. The Physical & Intellectual CES Type was represented by Cluster 6 (4.84%), in which physical and intellectual CES values were higher than experiential and inspirational CES values. It occurred mainly as scattered patches near the boundary between Wuxing and Nanxun Districts along Lake Taihu and was spatially adjacent to the Physical CES Priority Type. The Multiple CES Synergistic type comprised Clusters 1 (45.34%), 5 (5.68%), and 9 (2.17%). Cluster 1 exhibited low values for all four CES categories and had the widest distribution; because it was considered unsuitable for tourism development based on landscape resources, it was excluded from subsequent zoning. Clusters 5 and 9 together accounted for 7.85% of the study area and exhibited medium or high values for at least three CES categories. They were mainly concentrated around popular tourist attractions, including the Moganshan Scenic Area and the shoreline of Lake Taihu, and displayed a degree of spatial agglomeration (Figure 7).
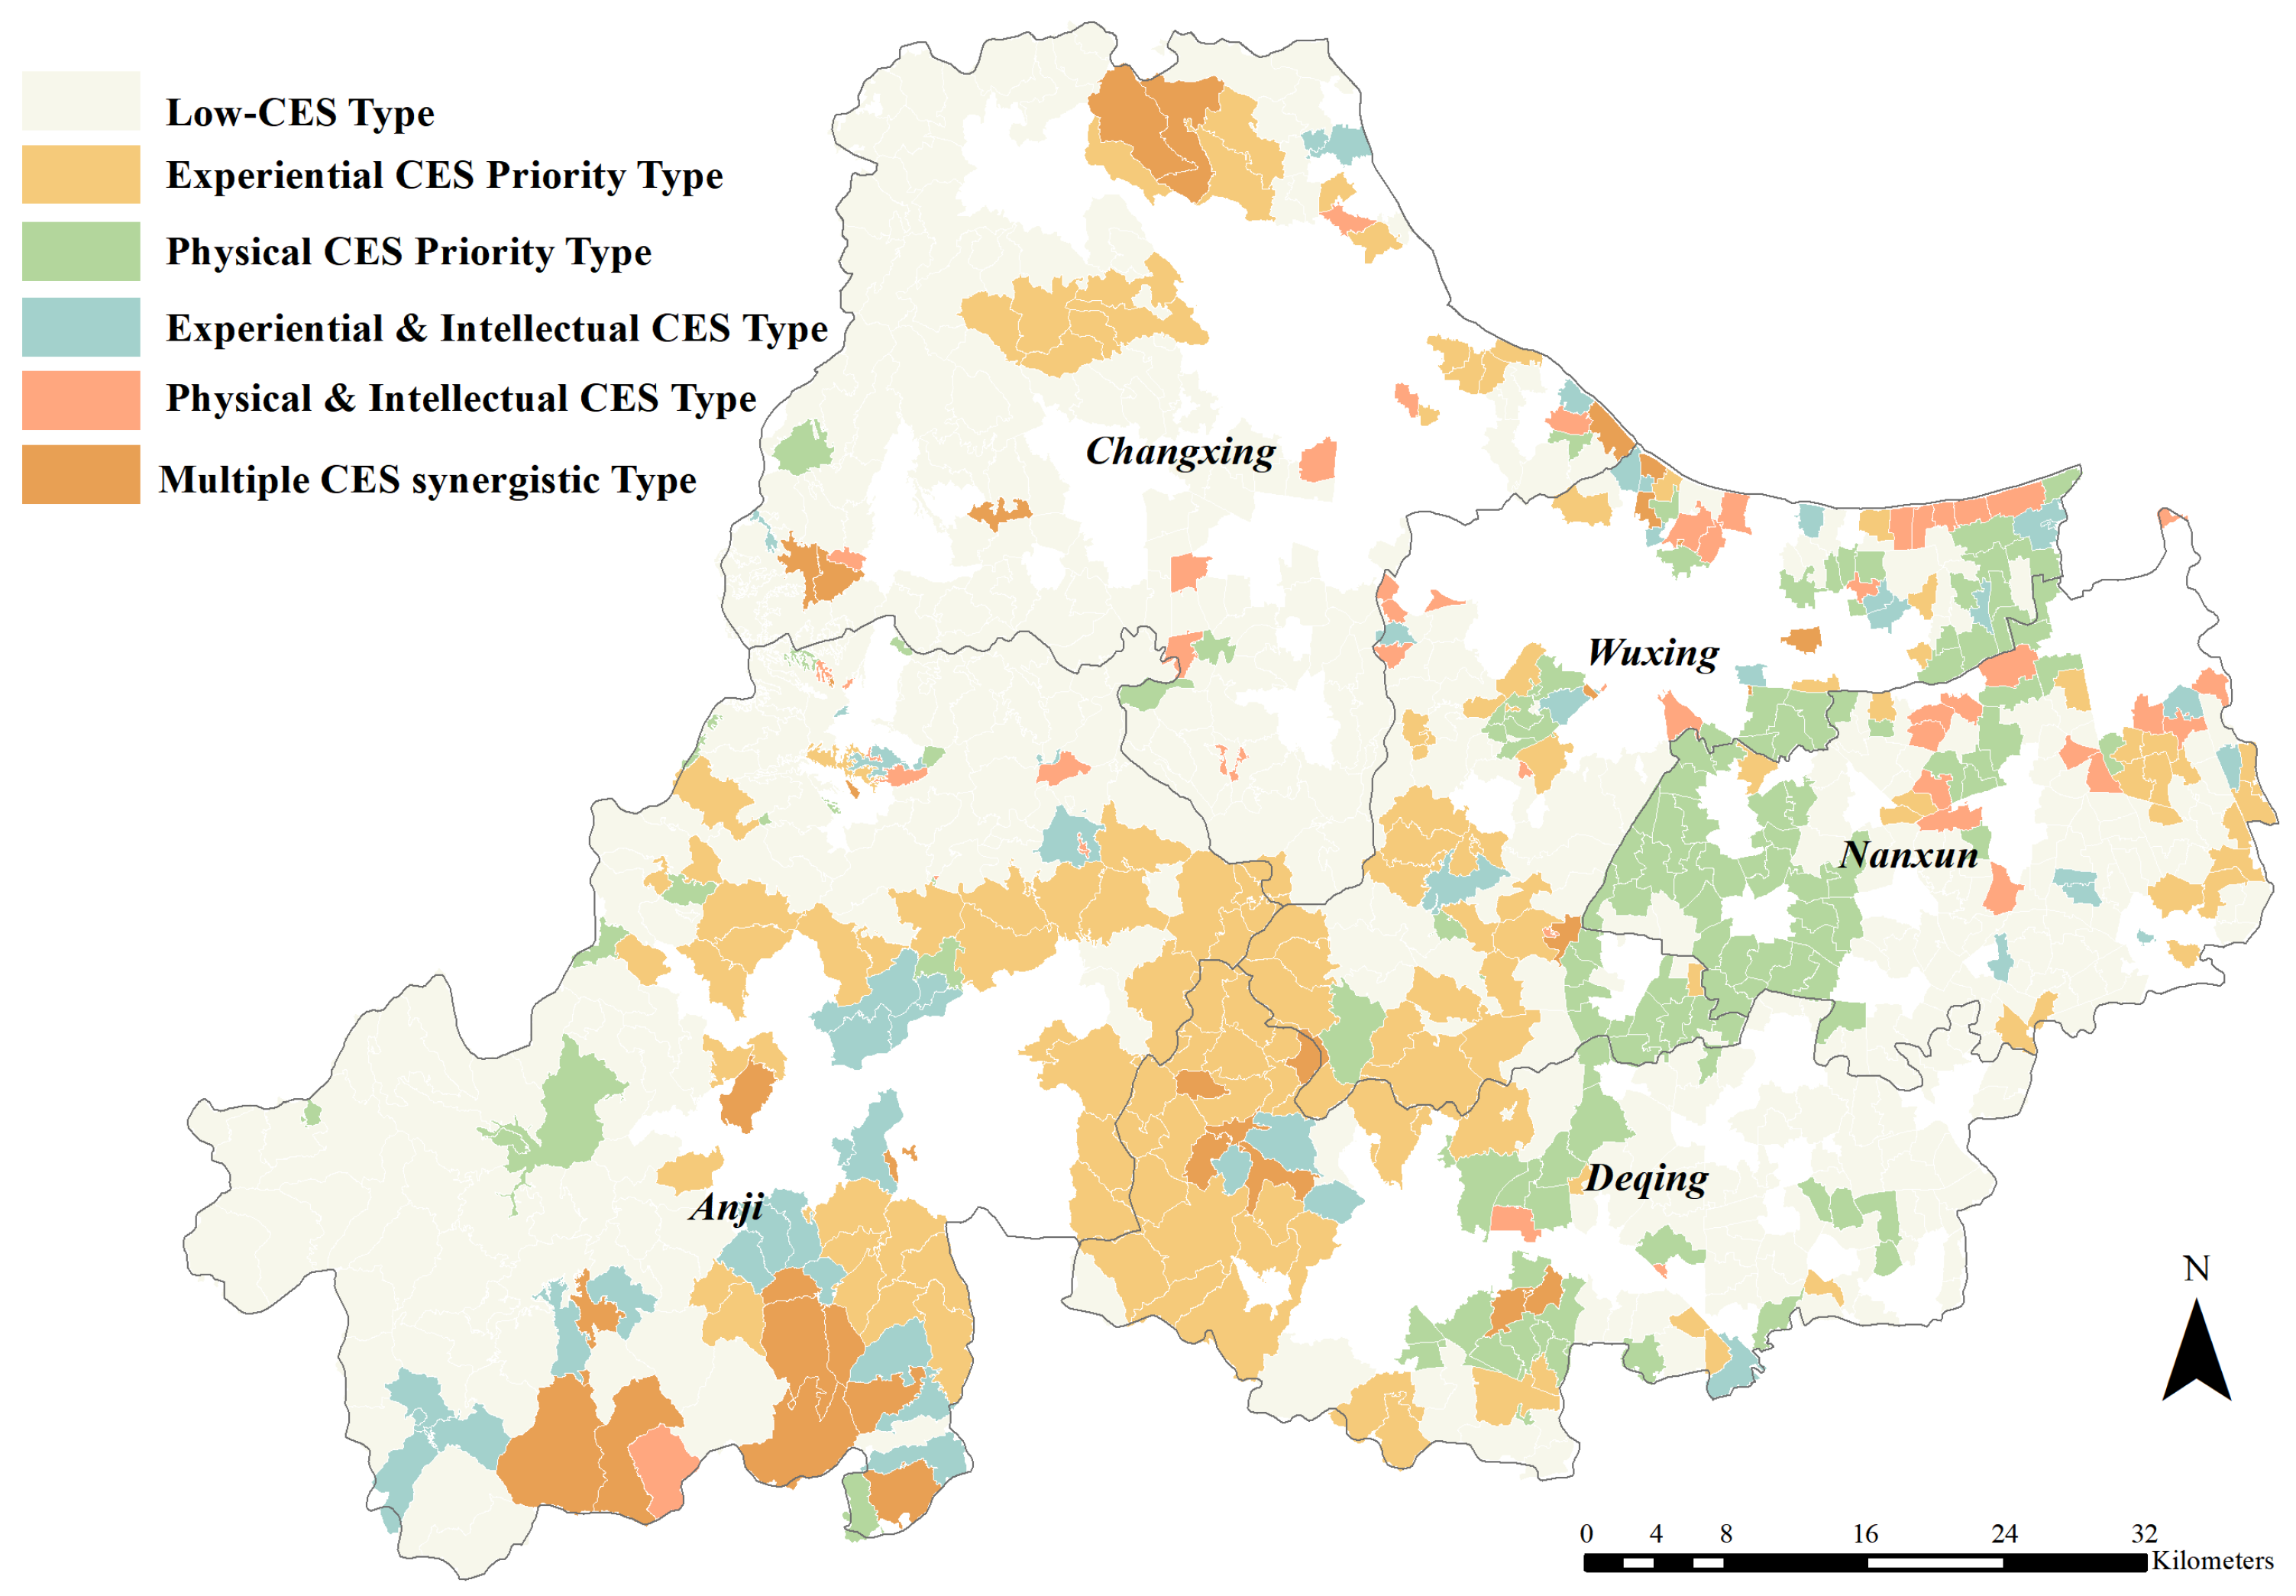
To further identify the priority CES types at the village scale, the area of each grid-scale cluster within each village was calculated, and the cluster occupying the largest proportion of village area was designated as the priority CES type. The Experiential CES Priority Type mainly concentrated near the boundaries of Anji County, Deqing County, and Wuxing District. The Physical CES Priority Type formed a belt-like distribution across Wuxing District, Nanxun District, and Deqing County. The Experiential & Intellectual CES Type was mainly distributed in central and southern Anji County. The Physical & Intellectual CES Type was primarily located near the boundary between Wuxing and Nanxun Districts along Lake Taihu. The higher-level Multiple CES Synergistic type was mainly distributed around the Moganshan Scenic Area and the Taihu Lake Tourist Resort (Figure 8).

4. Discussion

4.1. Spatial Mapping Framework of Landscape Characteristics Based on CES

This study proposes a framework for identifying typical CES-specific landscape characteristics based on public preferences and for spatially quantifying CESs, thereby enabling more precise identification of rural landscape values. Existing studies have shown that combining public perception data with spatial models can effectively support CES mapping, including the use of social media photographs and species distribution models to simulate cultural service distributions and the integration of participatory mapping with Maxent to extend place-based CES perceptions to the regional scale [12,15,42]. Unlike approaches that directly apply the same generic environmental variables to all CES categories, this study constructed a database of natural, cultural, and infrastructure elements, used public preference scores to identify the key landscape characteristic indicators for each CES category, and introduced these indicators as explanatory variables in Maxent. Because CESs are closely associated with perception, experience, and cultural contexts, embedding public preferences in indicator construction may better reflect the mechanisms underlying CES formation [8,9]. Maxent can infer potential spatial distributions from known sample sites and explanatory variables and estimate the contribution of individual variables, making it suitable for evaluating the explanatory capacity of differentiated landscape characteristics [43,44]. The findings showed that the CESs presented different spatial patterns matching local resource endowment characteristics, which suggests that the indicator framework explains CES spatial heterogeneity and facilitates more-precise identification of rural landscape values. In addition, the landscape characteristic indicators and public preferences in this study were obtained from social media data, which have strong availability and can be transferred to research areas in various countries [12,32].

4.2. Practical Implications for Rural Landscapes

The results indicate that experiential CESs were mainly associated with natural elements, physical CESs were primarily influenced by infrastructure elements, intellectual CESs were influenced by both natural and infrastructural elements, and inspirational CESs placed greater emphasis on natural elements. These findings are consistent with Li et al. [16]. Different CESs have different rural landscape characteristics; therefore, identifying typical rural landscape characteristics helps to better recognize the distinctive features of rural landscapes. A national policy document calls for promoting “one product per village and one distinctive feature per town” [45]. Making full use of local resource endowments and identifying priority CESs can support the precise spatial positioning of landscape value and the differentiated development of rural landscapes. In rural landscape management, this approach enables tailored strategies that incorporate regional characteristics to achieve differentiated regional development, which is of great significance for improving landscape management practices.
Spatial visualization of CESs can provide intuitive evidence for rural landscape planning and local decision-making [46]. Rural development practices in Huzhou have already established a planning foundation centered on ecological protection, beautiful countryside development, rural tourism, homestay resorts, and infrastructure improvement. In particular, the Moganshan homestay cluster has reached a mature stage of development [47] and has shown continued spatial expansion and agglomeration [48]. Areas with high values for multiple CESs should therefore not continue to pursue incremental development as single-purpose tourism destinations or homestay clusters. Instead, they should be optimized as multifunctional rural landscape development areas that coordinate aesthetic appreciation, recreation, science education, and cultural experience on the basis of existing ecotourism and resort industries. Areas of the Experiential CES Priority Type around Moganshan and at the junction of Anji, Deqing, and Wuxing should shift from quantitative growth to quality improvement and spatial regulation [47,48]. Priority measures include protecting mountain forests, orchards, wetlands, traditional village characters, and important visual corridors, while avoiding the over-commercialization that weakens local landscape identity. Areas of the Physical CES Priority Type represented by the Wuxing–Nanxun–Deqing corridor should strengthen recreational networks, improve road accessibility, accommodation, catering, and public service facilities, and develop activities such as hiking, rafting, and rural recreation in accordance with Huzhou’s mountain resources.

4.3. Study Limitations

Although this study developed a differentiated CES indicator system from the perspective of public preferences and used Maxent and clustering analysis to identify priority CES types in rural Huzhou, several limitations remain. First, data from Ctrip, Qunar, and other online travel platforms can effectively reflect tourists’ landscape preferences and behavior, but they are biased towards attractions listed on tourism platforms and places that tourists have visited. They therefore cannot fully represent the cultural service perceptions of all stakeholders and provide limited information on ordinary rural living spaces, the everyday perceptions of local residents, and less-visited landscapes. This also resulted in a smaller number of sample points for the “Inspirational CES” category. Second, semantic uncertainty remains in the identification of CES categories. Word frequency analysis and K-means clustering can process large volumes of review data, and expert assessment and Cohen’s kappa coefficient were used to test consistency; nevertheless, word frequencies cannot fully capture context, emotional intensity, negation, or implicit meaning. The same term may correspond to different experiences in different review contexts, and a single attraction may simultaneously provide experiential, physical, intellectual, and inspirational CESs. Although each attraction was assigned to one CES category for subsequent analysis, multiple CES characteristics may coexist at the same site; the additional distance-based information in Supplementary Table S1 helps make this overlap more transparent. Third, using typical CES-specific landscape characteristics as explanatory variables in Maxent can simulate potential spatial distributions, but more-complex interactions may exist among public preferences, landscape characteristics, and CES formation mechanisms. The model assumes a linear relationship between environmental and target variables, and more-complex nonlinear relationships or interaction effects may not be accurately captured [20].

5. Conclusions

This study integrated online travel reviews, public preference scores, and geospatial data to develop a public-preference-based framework for identifying, mapping, and spatially zoning rural cultural ecosystem services (CESs). This study aimed to provide theoretical support for identifying the dominant CES types in rural landscapes and optimizing rural landscape management. The results showed that physical, experiential, intellectual, and inspirational CESs had different indicators of landscape characteristics. Experiential and inspirational CESs were more strongly influenced by natural landscape conditions, physical CESs depended more on accessibility and tourism service facilities, and intellectual CESs were jointly affected by natural and infrastructural elements. The spatial distribution showed substantial overlap among the four CES categories, with high-value areas mainly concentrated in southern Anji County, around the Moganshan Scenic Area, and along the shoreline of Lake Taihu. Spatial zoning further identified five types. These results provide a basis for differentiated rural landscape planning by linking priority CES functions with local landscape resources and development conditions. Future research should combine social media data with participatory mapping, resident surveys, and stakeholder interviews, while incorporating more dynamic data to improve the representation of local perceptions, temporal changes, and interactions among CESs.

Supplementary Materials

The following supporting information can be downloaded at: https://www.mdpi.com/article/10.3390/land15091540/s1, Table S1: K-means centroid distances and classification uncertainty for the 148 rural tourist attractions; Table S2: Main datasets and their sources used in this study; Table S3: Data preprocessing and harmonization procedures for landscape indicators.

Author Contributions

Conceptualization, methodology, software, Y.L., L.Z. and M.Z.; validation, formal analysis, data curation, Y.L. and J.S.; writing—original draft preparation, Y.L. and J.S.; writing—review and editing, J.W., X.J., L.Z. and M.Z.; visualization, Y.L. and J.S.; supervision, J.W., X.J., L.Z. and M.Z. All authors have read and agreed to the published version of the manuscript.

Funding

This research was funded by National Natural Science Foundation of China (grant number 42401116; 42301360; 32572127; 52408069), the Natural Science Foundation of the Jiangsu Higher Education Institutions of China (grant number 25KJD1700050), the Natural Science Foundation of Jiangsu Province (grant number BK20241563).

Data Availability Statement

The raw data supporting the conclusions of this article will be made available by the authors on request.

Conflicts of Interest

The authors declare no conflicts of interest.

References

  1. Guo, R.; Lin, L.; Xu, J.; Dai, W.; Song, Y.; Dong, M. Spatio-temporal characteristics of cultural ecosystem services and their relations to landscape factors in Hangzhou Xixi National Wetland Park, China. Ecol. Indic. 2023, 154, 110910. [Google Scholar] [CrossRef] [Scilit]
  2. Millennium Ecosystem Assessment. Ecosystems and Human Well-Being: Synthesis; Island Press: Washington, DC, USA, 2005. [Google Scholar]
  3. Alvarez-Codoceo, S.; Cerda, C.; Perez-Quezada, J.F. Mapping the provision of cultural ecosystem services in large cities: The case of the Andean piedmont in Santiago, Chile. Urban For. Urban Green. 2021, 66, 127390. [Google Scholar] [CrossRef] [Scilit]
  4. Chan, K.M.A.; Satterfield, T.; Goldstein, J. Rethinking ecosystem services to better address and navigate cultural values. Ecol. Econ. 2012, 74, 8–18. [Google Scholar] [CrossRef] [Scilit]
  5. Small, N.; Munday, M.; Durance, I. The challenge of valuing ecosystem services that have no material benefits. Glob. Environ. Chang. 2017, 44, 57–67. [Google Scholar] [CrossRef] [Scilit]
  6. Hernández-Morcillo, M.; Plieninger, T.; Bieling, C. An empirical review of cultural ecosystem service indicators. Ecol. Indic. 2013, 29, 434–444. [Google Scholar] [CrossRef] [Scilit]
  7. Plieninger, T.; Dijks, S.; Oteros-Rozas, E.; Bieling, C. Assessing, mapping, and quantifying cultural ecosystem services at community level. Land Use Policy 2013, 33, 118–129. [Google Scholar] [CrossRef] [Scilit]
  8. Plieninger, T.; Bieling, C.; Fagerholm, N.; Byg, A.; Hartel, T.; Hurley, P.; López-Santiago, C.A.; Nagabhatla, N.; Oteros-Rozas, E.; Raymond, C.M.; et al. The role of cultural ecosystem services in landscape management and planning. Curr. Opin. Environ. Sustain. 2015, 14, 28–33. [Google Scholar] [CrossRef] [Scilit]
  9. Daniel, T.C.; Muhar, A.; Arnberger, A.; Aznar, O.; Boyd, J.W.; Chan, K.M.A.; Costanza, R.; Elmqvist, T.; Flint, C.G.; Gobster, P.H.; et al. Contributions of cultural services to the ecosystem services agenda. Proc. Natl. Acad. Sci. USA 2012, 109, 8812–8819. [Google Scholar] [CrossRef] [Scilit] [PubMed]
  10. Mao, Q.; Huang, G.; Wu, J. A review of urban ecosystem services. Chin. J. Appl. Ecol. 2015, 26, 1023–1033. (In Chinese) [Google Scholar]
  11. Cisneros-Montemayor, A.M.; Sumaila, U.R. A global estimate of benefits from ecosystem-based marine recreation: Potential impacts and implications for management. J. Bioecon. 2010, 12, 245–268. [Google Scholar] [CrossRef] [Scilit]
  12. Clemente, P.; Calvache, M.; Antunes, P.; Santos, R.; Cerdeira, J.O.; Martins, M.J. Combining social media photographs and species distribution models to map cultural ecosystem services: The case of a natural park in Portugal. Ecol. Indic. 2019, 96, 59–68. [Google Scholar] [CrossRef] [Scilit]
  13. Yoshimura, N.; Hiura, T. Demand and supply of cultural ecosystem services: Use of geotagged photos to map the aesthetic value of landscapes in Hokkaido. Ecosyst. Serv. 2017, 24, 68–78. [Google Scholar] [CrossRef] [Scilit]
  14. He, S.; Su, Y.; Shahtahmassebi, A.R.; Huang, L.; Zhou, M.; Gan, M.; Deng, J.; Zhao, G.; Wang, K. Assessing and mapping cultural ecosystem services supply, demand and flow of farmlands in the Hangzhou metropolitan area, China. Sci. Total Environ. 2019, 692, 756–768. [Google Scholar] [CrossRef] [Scilit] [PubMed]
  15. Shi, Q.; Chen, H.; Liang, X.; Liu, D.; Geng, T.; Zhang, H. Combination of participatory mapping and Maxent model to visualize the cultural ecosystem services at county scale. Ecosyst. Serv. 2025, 72, 101710. [Google Scholar] [CrossRef] [Scilit]
  16. Li, Y.; Xie, L.; Zhang, L.; Huang, L.; Lin, Y.; Su, Y.; Shahtahmassebi, A.; He, S.; Zhu, C.; Li, S.; et al. Understanding different cultural ecosystem services: An exploration of rural landscape preferences based on geographic and social media data. J. Environ. Manag. 2022, 317, 115487. [Google Scholar] [CrossRef] [Scilit] [PubMed]
  17. Wang, X.; Luo, C.; Cai, W.; Jin, H. Research progress on rural landscape characteristic systems in China over the past two decades. Chin. Landsc. Archit. 2022, 38, 44–49. (In Chinese) [Google Scholar]
  18. Dai, P. Cultural Ecosystem Service Values of Urban Parks and Their Estimation Methods. Master’s Thesis, China University of Mining and Technology, Xuzhou, China, 2020. (In Chinese) [Google Scholar]
  19. Tieskens, K.F.; Van Zanten, B.T.; Schulp, C.J.E.; Verburg, P.H. Aesthetic appreciation of the cultural landscape through social media: An analysis of revealed preference in the Dutch river landscape. Landsc. Urban Plan. 2018, 177, 128–137. [Google Scholar] [CrossRef] [Scilit]
  20. You, C.; Qu, H.; Feng, C.; Guo, L. Evaluating the match between natural ecosystem service supply and cultural ecosystem service demand: Perspectives on spatiotemporal heterogeneity. Environ. Impact Assess. Rev. 2024, 108, 107592. [Google Scholar] [CrossRef] [Scilit]
  21. Zhang, X.; Li, L.; Wang, X.; Xiao, H.; Ji, N.; Wang, J. Agricultural landscape characteristic preference model based on subjective preferences and landscape spatial indicators: A case study of 11 agricultural landscape characteristic regions in Beijing. Chin. J. Eco-Agric. 2010, 18, 180–184. (In Chinese) [Google Scholar] [CrossRef] [Scilit]
  22. You, S.; Zheng, Q.; Chen, B.; Xu, Z.; Lin, Y.; Gan, M.; Zhu, C.; Deng, J.; Wang, K. Identifying the spatiotemporal dynamics of forest ecotourism values with remotely sensed images and social media data: A perspective of public preferences. J. Clean. Prod. 2022, 341, 130715. [Google Scholar] [CrossRef] [Scilit]
  23. Zhang, Z.; Zhang, Z.; Yang, Y. The power of expert identity: How website-recognized expert reviews influence travelers’ online rating behavior. Tour. Manag. 2016, 55, 15–24. [Google Scholar] [CrossRef] [Scilit]
  24. Huzhou Municipal People’s Government. Overview of Huzhou. Available online: https://www.huzhou.gov.cn/art/2024/2/5/art_1229213498_59066409.html (accessed on 20 July 2026).
  25. National Bureau of Statistics of China. Rules for Compiling Statistical Zoning Codes and Urban-Rural Classification Codes. 2009. Available online: https://www.stats.gov.cn/sj/tjbz/gjtjbz/202302/t20230213_1902741.html (accessed on 20 July 2026).
  26. China Centre for Resources Satellite Data and Application. Gaofen-1 (GF-1) Satellite Data Service. Available online: https://www.cresda.cn/ (accessed on 20 July 2026).
  27. Sun, Y.; Shao, Y.; Chan, E.H.W. Co-visitation network in tourism-driven peri-urban areas based on social media analytics: A case study in Shenzhen, China. Landsc. Urban Plan. 2020, 204, 103934. [Google Scholar] [CrossRef] [Scilit]
  28. Hou, Z.; Cui, F.; Meng, Y.; Lian, T.; Yu, C. Opinion mining from online travel reviews: A comparative analysis of Chinese major OTAs using semantic association analysis. Tour. Manag. 2019, 74, 276–289. [Google Scholar] [CrossRef] [Scilit]
  29. Haines-Young, R.; Potschin, M. Common International Classification of Ecosystem Services (CICES): Consultation on Version 4, August–December 2012; Report to the European Environment Agency, EEA Framework Contract No. EEA/IEA/09/003, 2013. Available online: https://cices.eu/content/uploads/sites/8/2012/07/CICES-V43_Revised-Final_Report_29012013.pdf (accessed on 20 July 2026).
  30. Komossa, F.; Wartmann, F.M.; Kienast, F.; Verburg, P.H. Comparing outdoor recreation preferences in peri-urban landscapes using different data gathering methods. Landsc. Urban Plan. 2020, 199, 103796. [Google Scholar] [CrossRef] [Scilit]
  31. Wang, Z.; Zhu, Z.; Xu, M.; Qureshi, S. Fine-grained assessment of greenspace satisfaction at a regional scale using content analysis of social media and machine learning. Sci. Total Environ. 2021, 776, 145908. [Google Scholar] [CrossRef] [Scilit] [PubMed]
  32. Wartmann, F.M.; Purves, R.S. Investigating sense of place as a cultural ecosystem service in different landscapes through the lens of language. Landsc. Urban Plan. 2018, 175, 169–183. [Google Scholar] [CrossRef] [Scilit]
  33. Jain, A.K. Data clustering: 50 years beyond K-means. Pattern Recognit. Lett. 2010, 31, 651–666. [Google Scholar] [CrossRef] [Scilit]
  34. Zheng, Q.; Weng, Q.; Huang, L.; Wang, K.; Deng, J.; Jiang, R.; Ye, Z.; Gan, M. A new source of multispectral high-spatial-resolution nighttime light imagery—JL1-3B. Remote Sens. Environ. 2018, 215, 300–312. [Google Scholar] [CrossRef] [Scilit]
  35. Cohen, J. A coefficient of agreement for nominal scales. Educ. Psychol. Meas. 1960, 20, 37–46. [Google Scholar] [CrossRef] [Scilit]
  36. Schirpke, U.; Timmermann, F.; Tappeiner, U.; Tasser, E. Cultural ecosystem services of mountain regions: Modelling the aesthetic value. Ecol. Indic. 2016, 69, 78–90. [Google Scholar] [CrossRef] [Scilit] [PubMed]
  37. China National Tourism Administration. Measures for the Administration of Quality Grades of Tourist Attractions. 2012. Available online: https://zwgk.mct.gov.cn/zfxxgkml/zcfg/gfxwj/202012/t20201204_906214.html (accessed on 20 July 2026).
  38. Breiman, L. Random forests. Mach. Learn. 2001, 45, 5–32. [Google Scholar] [CrossRef] [Scilit]
  39. Belgiu, M.; Drăguţ, L. Random forest in remote sensing: A review of applications and future directions. ISPRS J. Photogramm. Remote Sens. 2016, 114, 24–31. [Google Scholar] [CrossRef] [Scilit]
  40. Swets, J.A. Measuring the accuracy of diagnostic systems. Science 1988, 240, 1285–1293. [Google Scholar] [CrossRef] [Scilit] [PubMed]
  41. Zheng, C.; Wen, Z.; Guo, Q.; Fan, Y.; Yang, Y.; Gao, F. Suitable distribution and functional traits of herbaceous plants in the Yanhe River Basin based on the MaxEnt model. Acta Ecol. Sin. 2021, 41, 6825–6835. (In Chinese) [Google Scholar]
  42. Arslan, E.S.; Örücü, Ö.K. MaxEnt modelling of the potential distribution areas of cultural ecosystem services using social media data and GIS. Environ. Dev. Sustain. 2021, 23, 2655–2667. [Google Scholar] [CrossRef] [Scilit]
  43. Phillips, S.J.; Anderson, R.P.; Schapire, R.E. Maximum entropy modeling of species geographic distributions. Ecol. Model. 2006, 190, 231–259. [Google Scholar] [CrossRef] [Scilit]
  44. Elith, J.; Phillips, S.J.; Hastie, T.; Dudík, M.; Chee, Y.E.; Yates, C.J. A statistical explanation of MaxEnt for ecologists. Divers. Distrib. 2011, 17, 43–57. [Google Scholar] [CrossRef] [Scilit]
  45. Ministry of Agriculture and Rural Affairs of the People’s Republic of China. Notice of the General Office of the Ministry of Agriculture and Rural Affairs on Issuing the Key Tasks for Rural Industries in 2020 (Nong Ban Chan [2020] No. 1). 2020. Available online: https://xccys.moa.gov.cn/gzdt/202002/t20200217_6337169.htm (accessed on 20 July 2026).
  46. Depietri, Y.; Ghermandi, A.; Campisi-Pinto, S.; Orenstein, D.E. Public participation GIS versus geolocated social media data to assess urban cultural ecosystem services: Instances of complementarity. Ecosyst. Serv. 2021, 50, 101277. [Google Scholar] [CrossRef] [Scilit]
  47. Long, F.; Liu, J.; Zhang, S.; Yu, H.; Jiang, H. Development characteristics and evolution mechanism of homestay agglomeration in Mogan Mountain, China. Sustainability 2018, 10, 2964. [Google Scholar] [CrossRef] [Scilit]
  48. Zheng, J.; Huang, L. Characterizing the spatiotemporal patterns and key determinants of homestay industry agglomeration in rural China using multi-geospatial datasets. Sustainability 2022, 14, 7242. [Google Scholar] [CrossRef] [Scilit]
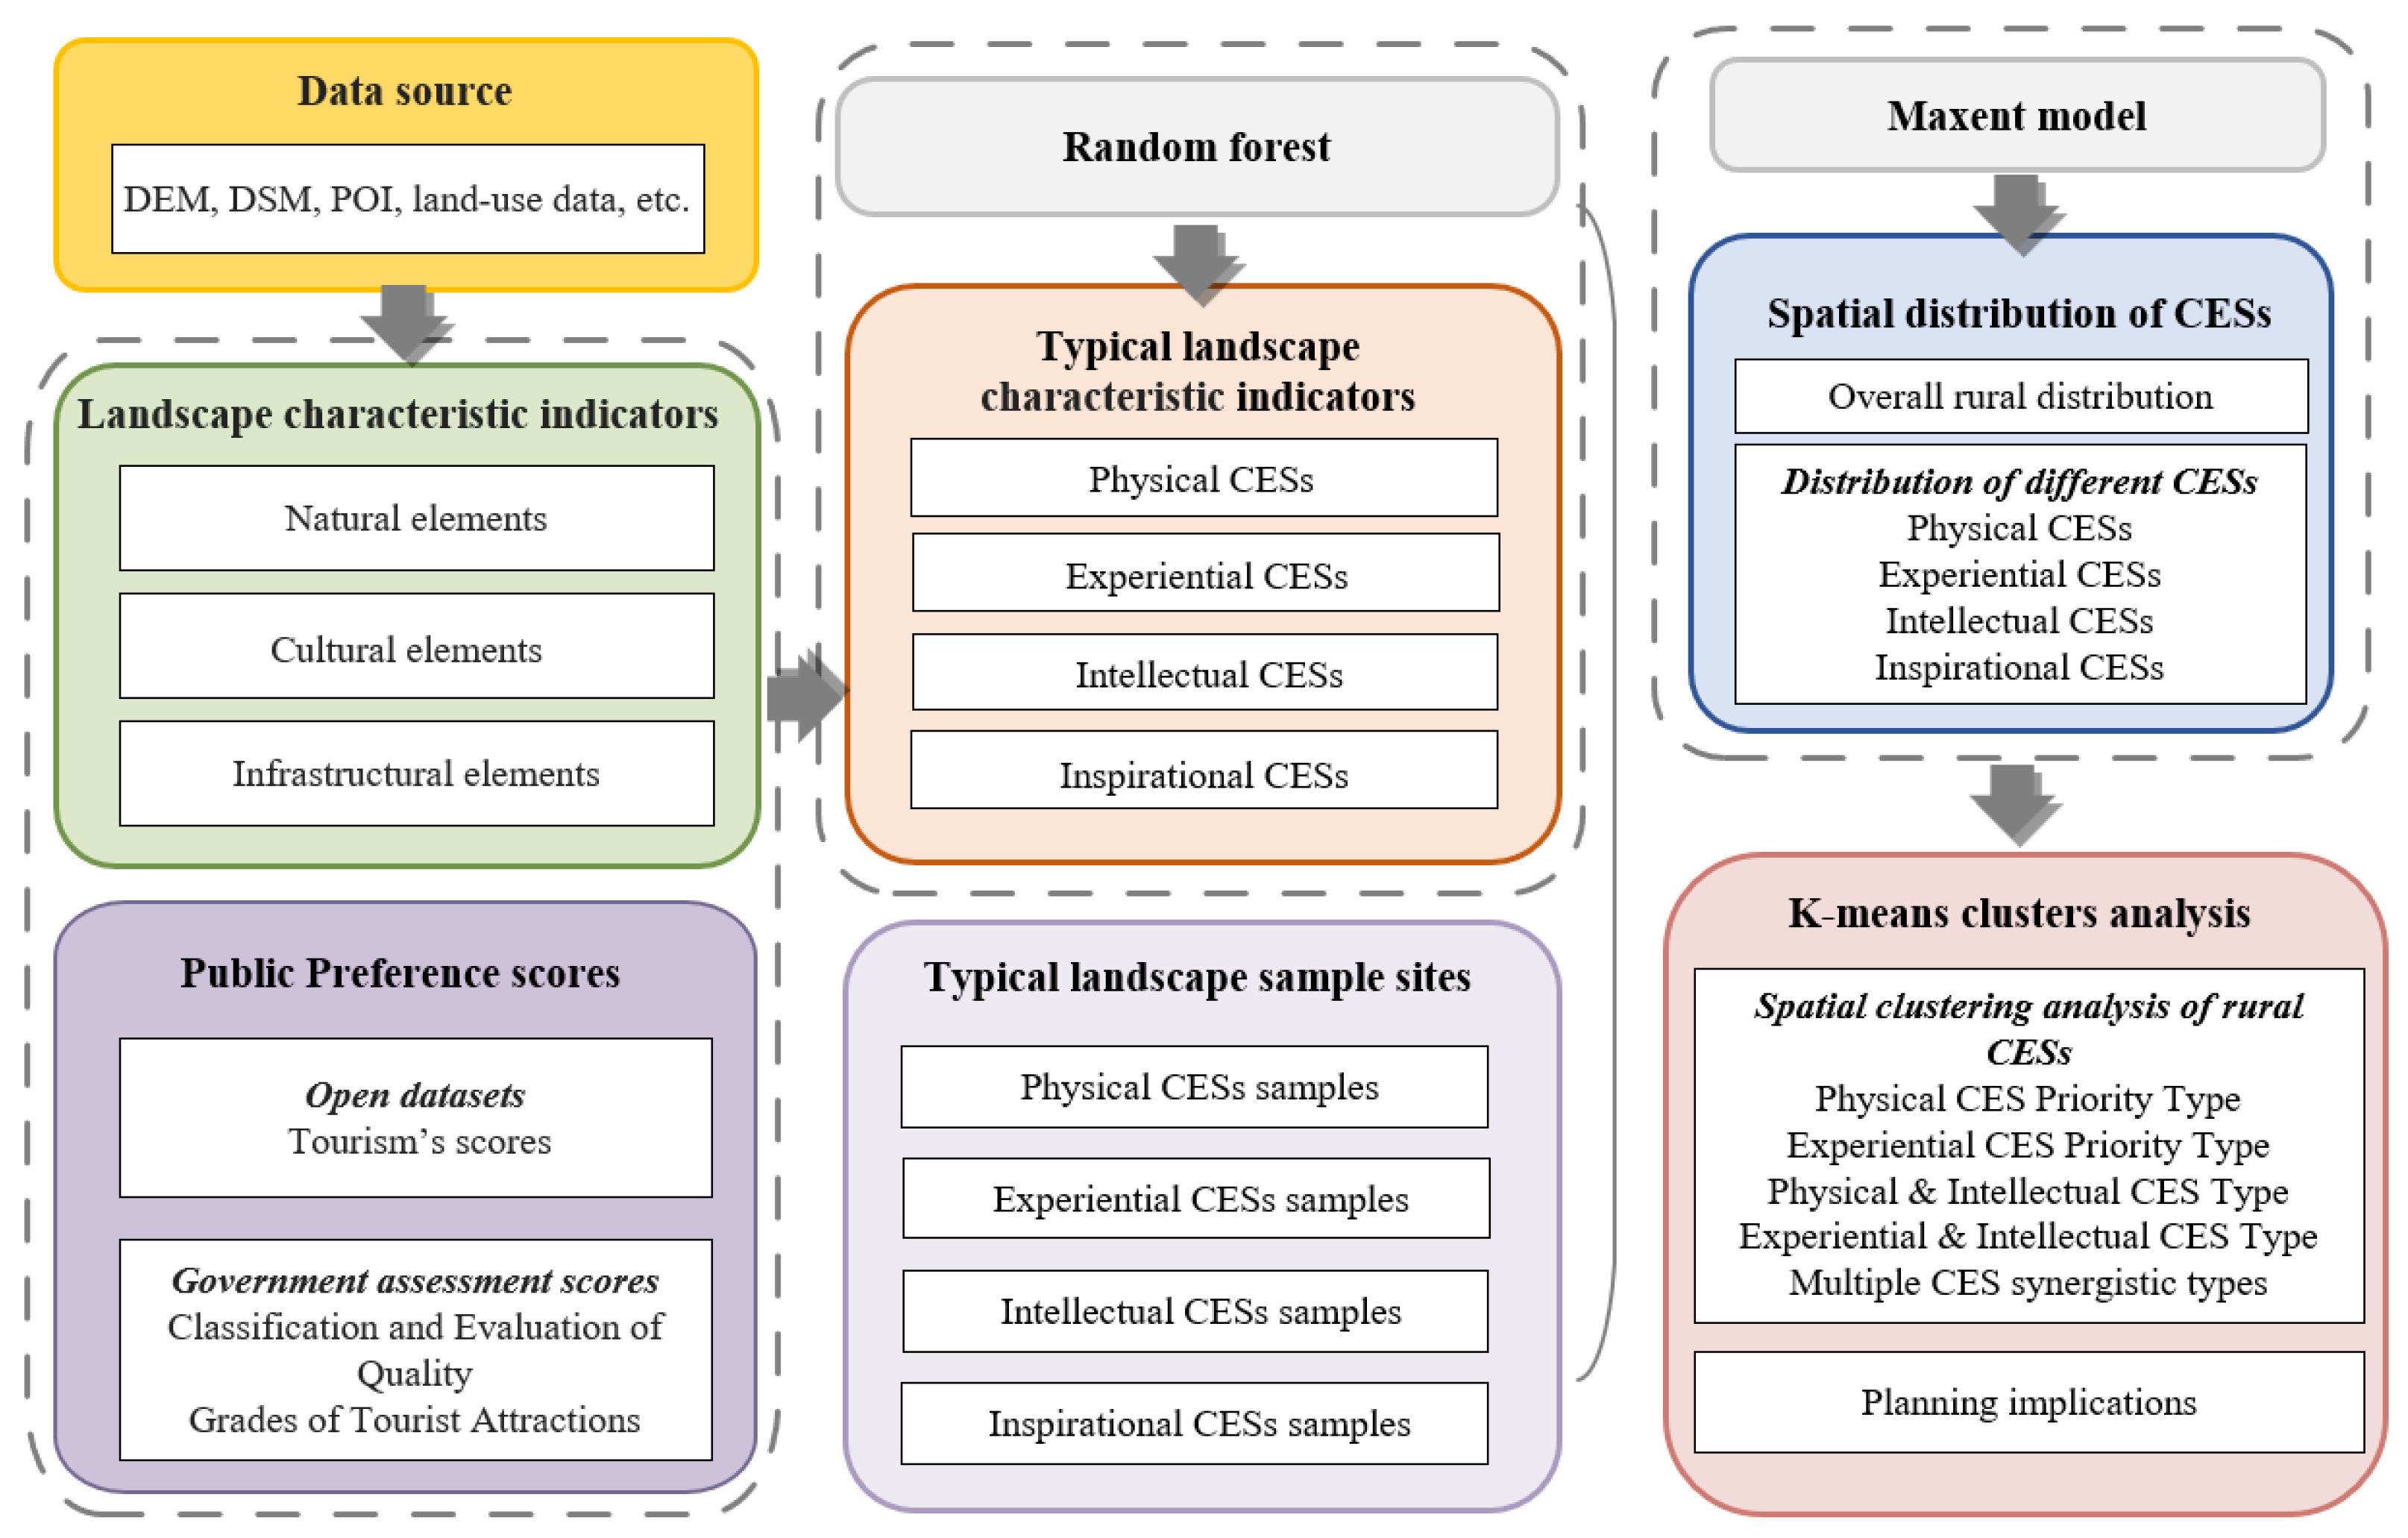
Figure 1. Research framework.
Land 15 01540 g001
Figure 2. Location of study area.
Land 15 01540 g002
Figure 3. Relative importance of landscape characteristic indicators for overall rural landscape.
Land 15 01540 g003
Figure 4. Relative importance of landscape characteristic indicators for different CESs.
Land 15 01540 g004
Figure 5. Overall spatial distribution of rural landscape.
Land 15 01540 g005
Figure 6. Spatial distribution of different CESs.
Land 15 01540 g006
Figure 7. Spatial distribution, area proportions of CES clusters in Huzhou.
Land 15 01540 g007
Figure 8. Spatial zoning optimization of CESs.
Land 15 01540 g008
Table 1. Indicators of rural landscape characteristics.
DimensionCodeMeaningMethod
Natural elementsNPNumber of patches; larger values indicate more dispersed landscape.FRAGSTATS 3.3
Natural elementsPDPatch density, expressed as number of patches per square kilometer; larger values indicate denser fragmentation.FRAGSTATS 3.3
EDEdge density, expressed as total edge length between heterogeneous landscape patches per unit area.FRAGSTATS 3.3
CONTAGContagion index, representing aggregation or extension tendency of different patch types; larger values indicate greater aggregation and connectivity of dominant patches.FRAGSTATS 3.3
SHDIShannon’s diversity index, reflecting landscape heterogeneity; larger values indicate greater landscape diversity.FRAGSTATS 3.3
D-waterDistance to nearest water body.Euclidean distance
Air qualityNumber of days Air Quality Index (AQI) standard was met at monitoring stations in Huzhou and surrounding cities.Kriging interpolation
P-waterPercentage of water in viewshed of each tourist attraction.Area proportion
P-farmlandPercentage of farmland in viewshed of each tourist attraction.Area proportion
P-orchardPercentage of orchards in viewshed of each tourist attraction.Area proportion
P-forestPercentage of forest in viewshed of each tourist attraction.Area proportion
P-wetlandPercentage of wetland in viewshed of each tourist attraction.Area proportion
P-grassPercentage of grassland in viewshed of each tourist attraction.Area proportion
P-tea gardenPercentage of tea gardens in viewshed of each tourist attraction.Area proportion
Environmental comfortDistribution of human activity inferred from Weibo check-in data.Kernel density analysis
Cultural elementsD-cultural attractionDistance to nearest cultural attraction.Euclidean distance
N-ancient villageWhether village containing the tourist attraction is designated as ancient village.Binary indicator
N-ancient and notable treesNumber of ancient and notable trees in the village containing the tourist attraction.Spatial count
N-beautiful countrysideAmount of beautiful countryside in the village containing the tourist attraction.Spatial count
N-geographical indication productsNumber of geographical indication agricultural products in the village containing the tourist attraction.Spatial count
Infrastructural elementsD-roadDistance to nearest road.Euclidean distance
D-town centerDistance to nearest town center.Euclidean distance
D-accommodationDistance to nearest accommodation facility.Euclidean distance
D-restaurantDistance to nearest restaurant.Euclidean distance
D-communal facilityDistance to nearest communal facility, such as parking area or public toilet.Euclidean distance
Disclaimer/Publisher’s Note: The statements, opinions and data contained in all publications are solely those of the individual author(s) and contributor(s) and not of MDPI and/or the editor(s). MDPI and/or the editor(s) disclaim responsibility for any injury to people or property resulting from any ideas, methods, instructions or products referred to in the content.