1. Introduction
In July 2023, the Haihe River Basin experienced catastrophic flooding triggered by the most intense rainfall recorded in the region in 140 years. This event offered a stark reminder of the escalating climate risks facing densely populated areas. Globally, extreme weather events are increasing in both frequency and intensity, transforming economically important river basins into hotspots of compound risk where development pressures increasingly confront environmental limits [
1,
2]. This trend highlights a fundamental challenge: how can socio-economic prosperity, ecological integrity, and public safety be balanced under rapid environmental change [
3]? The Haihe River Basin is not unique in this respect. Similar vulnerabilities are emerging across high-risk regions in Asia, Africa, and Latin America, where more frequent climate extremes have intensified debates over flood-risk management, disaster risk reduction, and sustainable development. Recent international research has further advanced these debates through flood modeling, flood risk mapping, and vulnerability assessment, which have improved the identification of hazard-prone areas, inundation pathways, exposed assets, and at-risk populations [
4,
5,
6,
7].
The study of social–ecological systems (SESs) has received sustained attention as a framework for systematically examining interactions between human activities and the natural environment. Flood-prone river basins are socio-spatial systems in which land development, ecological functions, and safety infrastructure co-evolve under the combined pressures of urbanization and climate extremes. In such settings, flood control is not merely a hydraulic issue but also a basic condition for territorial resilience and sustainable regional development. Existing studies have largely focused on the development of theoretical and analytical SES frameworks [
8,
9,
10] or on multi-factor coupling within these systems [
11,
12,
13,
14]. River basins are typical examples of complex SESs, in which human and natural components are linked through feedbacks and emergent properties [
9,
15]. In the Chinese context, large-scale water conservancy projects and flood-control works have improved regional protection capacity, but uneven infrastructure investment and fragmented administration continue to shape local vulnerability patterns. From this perspective, flood-control safety should be treated not as external background context, but as an integral dimension of basin resilience that connects infrastructure performance, ecological conditions, and development outcomes.
The Haihe River Basin, which includes major economic centers such as Beijing and Tianjin, exemplifies these challenges. Despite its economic vitality, the basin faces severe water scarcity and high ecological vulnerability [
16]. Its development is shaped by the coexistence of upstream ecological conservation, downstream urban concentration, and complex interprovincial coordination. Under these conditions, flood control safety should be regarded as a core support dimension of regional development rather than a secondary sectoral concern. Managing flood risk in such a layered socio-ecological environment is therefore of broader international relevance. For example, coastal systems along the U.S. Atlantic coast have increasingly recognized that traditional grey infrastructure alone is insufficient to address contemporary climate risks, prompting a shift toward green infrastructure to enhance resilience [
17]. These experiences underscore the wider significance of integrated and adaptive flood-risk governance.
Historically, flood-risk management has relied heavily on grey infrastructure, including dams, dikes, and diversion projects [
18]. Although these measures can provide immediate protection, they often entail substantial ecological costs by altering hydrological regimes and fragmenting habitats [
19]. This trade-off is not unique to China; similar ecological degradation has been documented in diverse basins such as the Nile and the Amazon, highlighting the limitations of relying exclusively on conventional engineering approaches [
20,
21]. As a result, flood governance in many regions has shifted toward integrated Nature-based Solutions (NbS). This transition, which is also gaining momentum in the Haihe River Basin, provides an important reference for other regions undergoing similar transformations. Recent studies further suggest that effective flood-risk reduction increasingly depends on combining engineering measures, ecological restoration, and spatial planning rather than relying on any single intervention alone [
22,
23,
24].
Despite these advances, important gaps remain in our understanding of coupled basin systems, particularly with respect to flood control safety (FCS). In much of the existing literature, FCS is treated as background context or as an external condition rather than as an explicitly evaluated safety dimension in basin development assessment. Previous studies have examined pairwise relationships, such as those between urbanization and the environment [
25] or between ecosystem services and human well-being [
26], but frameworks that systematically connect social–ecological coordination with flood-control capacity remain limited. As a result, it is still difficult to explain how flood-control capacity interacts with socio-economic development and ecological change over time, or how weaknesses in safety infrastructure may constrain broader development outcomes. Integrating these dimensions therefore has important theoretical and practical value for advancing research on resilient basin development [
27,
28]. This perspective is intended to complement, rather than replace, event-based flood simulation and detailed risk-mapping studies by focusing on long-term coordination and development conditions at the basin scale [
6,
29,
30].
A further limitation in the literature is the insufficient treatment of spatial heterogeneity. Many basin-scale studies treat highly diverse river basins such as the Haihe as internally homogeneous, thereby obscuring critical differences among provinces, subregions, and administrative units [
31,
32]. Other studies focus too narrowly on individual sub-catchments, which limits the broader applicability of their conclusions [
33,
34]. In reality, river basins are mosaics of administrative systems, ecosystems, and socio-economic landscapes, each with different sensitivities to policy intervention [
35,
36]. Ignoring such heterogeneity may lead to one-size-fits-all policies that are ineffective or even counterproductive [
22,
37]. Recent basin and floodplain studies in China further suggest that the socio-economic–flood-safety–ecological nexus can reveal policy-relevant imbalances; however, more work is needed to explain spatial heterogeneity and its governance implications at the basin scale. From a land-system perspective, analysis of the Haihe River Basin should therefore address not only how social–ecological coordination evolves, but also where flood-control capacity remains insufficient and what this implies for spatially differentiated governance and planning. This issue is especially important in basins where hydrological processes and protection systems extend across administrative boundaries, making province-based development gains difficult to interpret without considering cross-boundary risk and infrastructure dependence.
Against this background, the Haihe River Basin was selected as the study area because it is a representative flood-prone basin in northern China, characterized by high population density, rapid urbanization, intense human–land interactions, and frequent flood disturbances. At the same time, the basin exhibits pronounced upstream–downstream differences in natural conditions, development patterns, and flood-control pressures, making it particularly suitable for examining the coordinated development of social–ecological systems under persistent flood risk. This study therefore integrates Flood Control Safety (FCS) into a social–ecological system framework and examines the coordinated development of the Haihe River Basin from 2008 to 2022. Specifically, it aims to: (1) evaluate the temporal evolution of social–ecological coordination; (2) reveal basin-scale spatial differentiation and upstream–downstream heterogeneity in both coordination patterns and flood-control conditions; and (3) identify the main FCS-related drivers associated with coordinated change and derive implications for regional planning and territorial governance. By positioning flood control safety as a foundational element of territorial resilience, this study offers a governance-oriented analytical perspective for flood-prone river basins. In this sense, the study seeks to complement existing flood modeling and risk-mapping research by explaining whether broader development trajectories are becoming more coordinated under persistent flood risk [
38].
2. Study Area
The Haihe River Basin, with a total area of 320,600 km
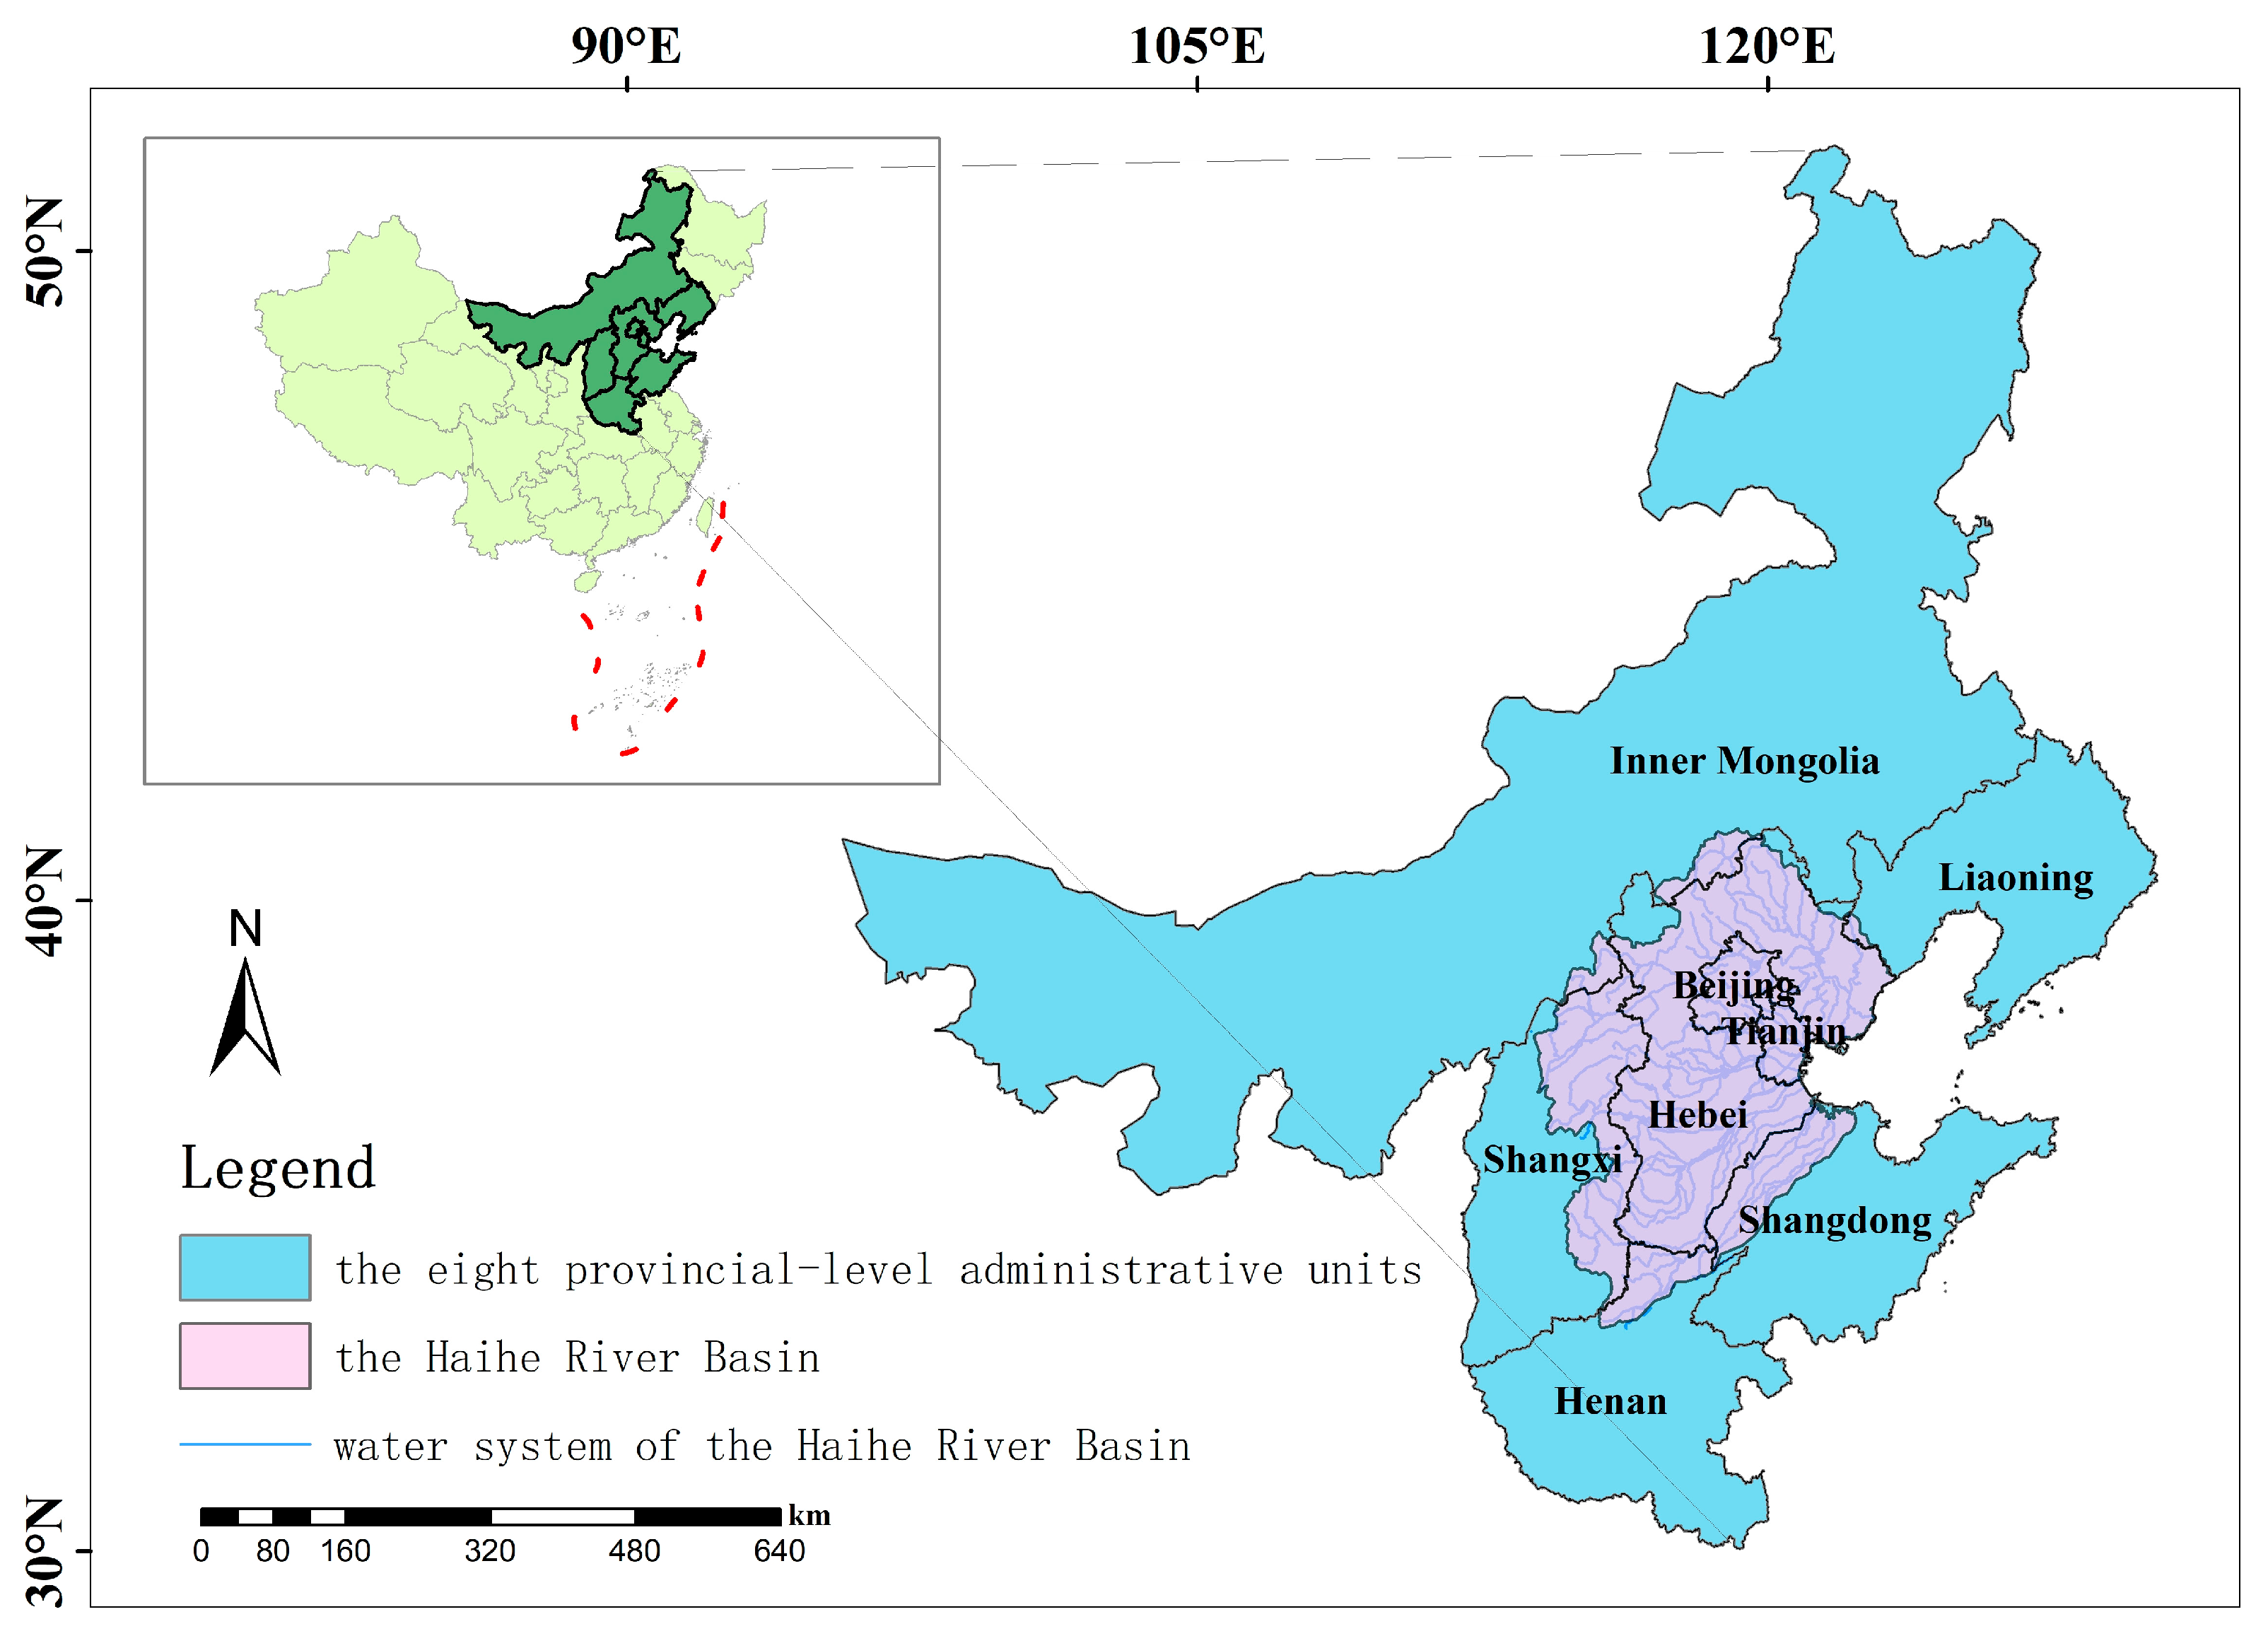
2, is primarily composed of three major water systems: the Luanhe River, the Haihe River, and the Tuhai–Majia River. It intersects eight provincial-level administrative units in northern China, including Beijing, Tianjin, Hebei, Shanxi, Shandong, Henan, Liaoning, and Inner Mongolia. Because the hydrological boundary of the basin does not coincide with provincial administrative boundaries, the degree of territorial overlap varies considerably across these units. In the research, the actual basin boundary is explicitly mapped together with provincial boundaries to clarify this spatial relationship (
Figure 1). Influenced by climatic and topographic factors, the basin is characterized by an uneven spatiotemporal distribution of precipitation. Annual precipitation across the basin generally ranges from 527.2 mm. Spatially, the highest precipitation occurs in the southern foothills of the Yan Mountains and the eastern foothills of the Taihang Mountains, where annual precipitation ranges from 700 to 800 mm. Temporally, the mean precipitation during the flood season (June to September) accounts for 76.7% of the annual total. In recent years, under the combined effects of the El Niño phenomenon and global climate change, the basin has been successively impacted by extreme weather events, including the severe torrential rain and flood of July 2016, the persistent floods during the summer and autumn of 2021, and the basin-wide catastrophic flood of July 2023. The July 2016 event triggered above-warning floods in rivers such as the Zhangweihe River and caused multiple levee breaches. In severely affected areas such as Anyang in Henan and Xingtai in Hebei, large numbers of residents were impacted or urgently evacuated, with substantial casualties and serious damage to urban and rural infrastructure. The summer–autumn floods of 2021 were historically rare and generated the largest flood in the Zhangweihe River since 1963. Although disaster losses were reduced through precise flood regulation, 11 flood detention areas were activated and more than 700,000 people were relocated, indicating considerable pressure on regional flood-control and territorial management systems. In July 2023, under the influence of Typhoon Doksuri, the Haihe River Basin experienced another catastrophic basin-wide flood. The disaster severely affected the Beijing–Tianjin–Hebei region, with more than 5 million people affected and about 1.8 million people urgently evacuated; large numbers of houses, farmlands, and infrastructure facilities were damaged or destroyed. These events not only caused major human and economic losses, but also exposed the high vulnerability of settlements, cultivated land, flood-control facilities, and critical infrastructure across the basin. This study treats the Haihe River Basin as a socio-spatial system in which ecological conditions, socio-economic development, and flood control safety jointly shape territorial resilience. Accordingly, the empirical framework links subsystem evaluation, coupling-coordination diagnosis, and driver identification within a common basin-governance perspective. Given current data constraints, however, the empirical analysis should be understood as a basin-related assessment based on province-level proxy data rather than as a fully basin-delimited statistical reconstruction.
3. Materials and Methods
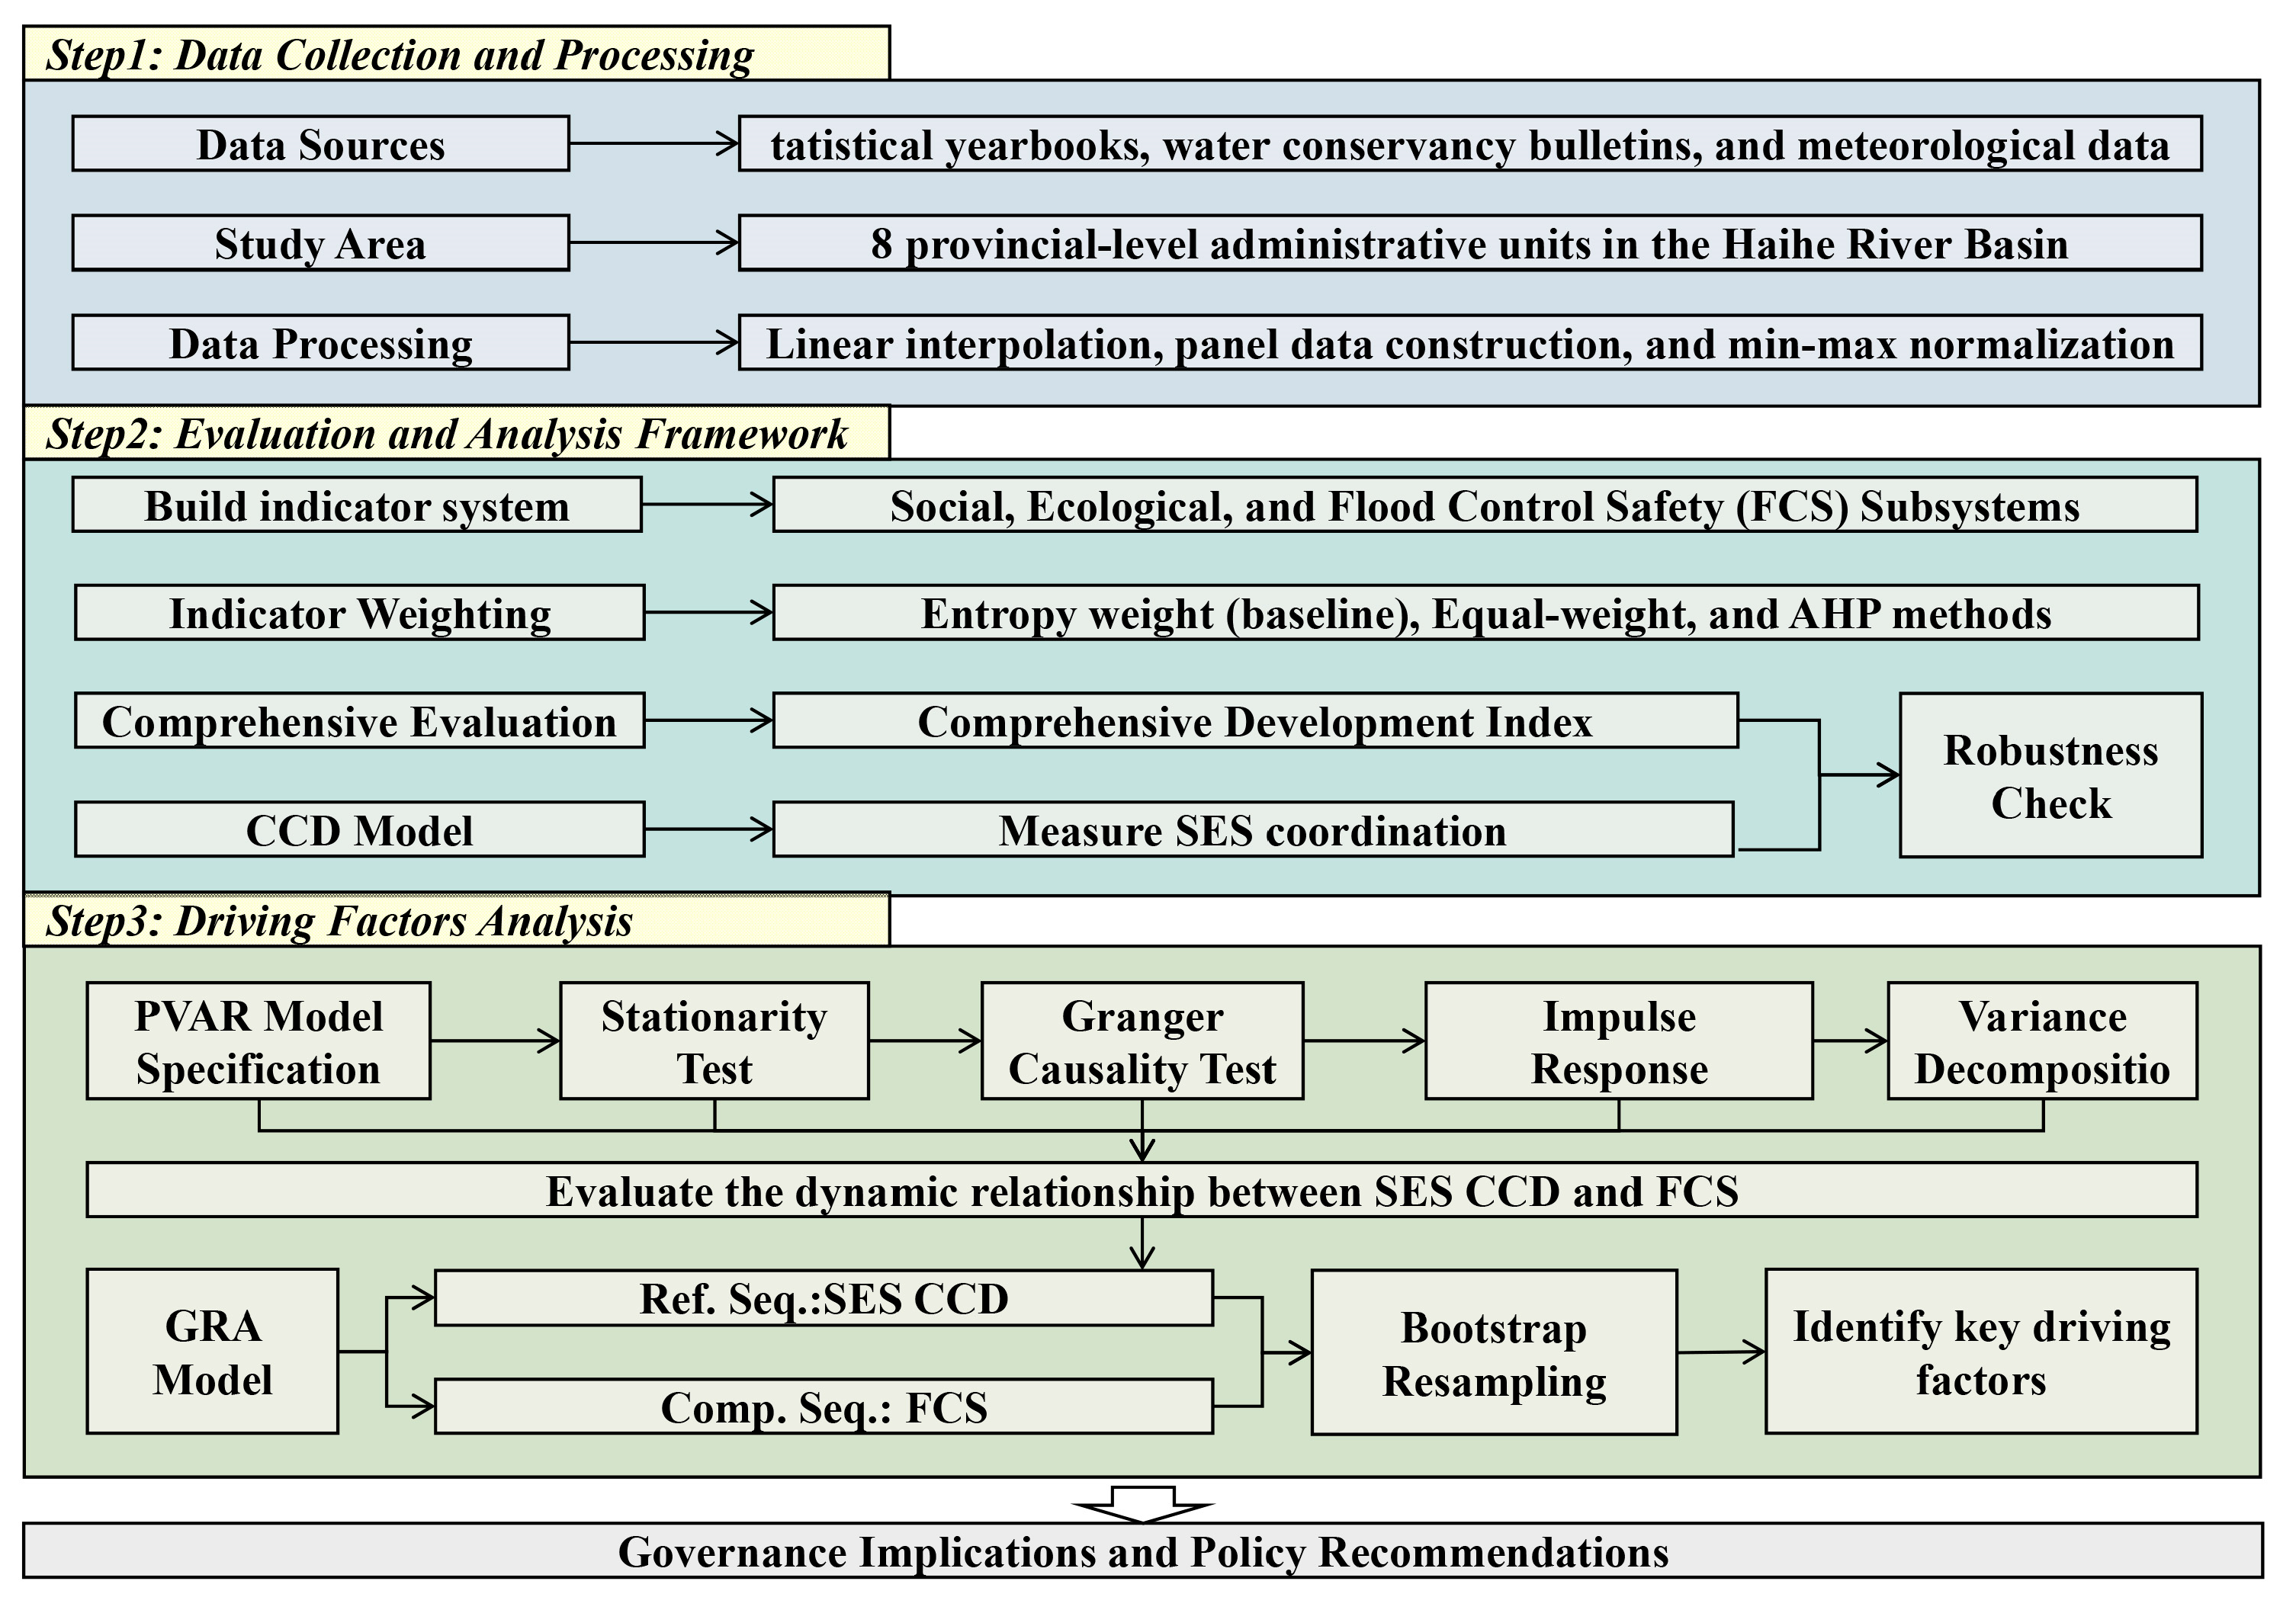
To better illustrate the overall methodological framework of this study, including indicator system construction, subsystem evaluation, and the analysis of the relationship between social–ecological coordination and flood control safety, a flowchart is provided in
Figure 2.
3.1. Data Sources and Processing
A comprehensive panel dataset for the period 2008–2022 was constructed to analyze the SES of the Haihe River Basin. The data were sourced from authoritative national and regional publications, including the China Statistical Yearbook, China Environment Yearbook, Haihe River Yearbook, and China Water Conservancy Statistical Yearbook.
A key methodological challenge is that the geographical boundary of the Haihe River Basin does not coincide with administrative boundaries, while fully basin-delimited time-series datasets remain unavailable for several socio-economic and ecological indicators. To address this constraint, the baseline analysis uses provincial-level statistics from the eight administrative units intersecting the basin: Beijing, Tianjin, Hebei, Shanxi, Shandong, Henan, Liaoning, and Inner Mongolia. These data should therefore be understood as a province-based proxy for basin-related social–ecological conditions rather than as a precise basin-delimited measurement system.
To make this limitation transparent, the
Table A1 (
Appendix A) explicitly reports the proportion of each provincial-level administrative unit located within the Haihe River Basin and incorporates the actual basin boundary into the study-area map (
Figure 1). In addition, a basin-area-weighted sensitivity analysis was conducted by weighting each administrative unit according to its territorial overlap with the basin and recalculating the subsystem indices. The comparison between the baseline and weighted results is presented in
Figure 3.
To ensure data continuity, missing values for individual indicators in specific years were estimated using linear interpolation. To improve transparency,
Table A2 in the
Appendix A reports the number and proportion of interpolated observations for each indicator and each province. As shown in
Table A2, the interpolation ratio is relatively low. The results show that the main empirical conclusions of this paper are unlikely to be driven by data imputation itself, although the extent of missingness varies across indicators and regions. This treatment allowed us to construct a consistent time-series dataset for empirical analysis, while the potential uncertainty introduced by interpolation is taken into account in the interpretation of the results.
3.2. Basin-Area-Weighted Sensitivity Analysis
To assess the possible influence of spatial scale mismatch between hydrological basin boundaries and provincial statistical units, a basin-area-weighted sensitivity analysis was performed. Specifically, a weight was assigned to each provincial-level administrative unit based on the proportion of its territorial area located within the Haihe River Basin. Using these weights, the subsystem indices were recalculated and compared with the baseline estimates derived from unweighted province-level data.
This weighting procedure does not fully reconstruct basin-specific statistics, because socio-economic activities, ecological assets, and flood-control infrastructure are not uniformly distributed within each province. It is therefore used as a robustness check rather than as a substitute for fully basin-delimited data. If the weighted results remain broadly consistent with the baseline estimates, the principal conclusions can be regarded as reasonably robust to this spatial support mismatch.
3.3. Research Methods
3.3.1. Conceptual Framework and Indicator Selection
To analyze the flood security challenges within the Haihe River Basin, we conceptualize it as a complex SES, where human activities and the natural environment are deeply intertwined. The core of our analysis is to understand the dynamic coupling between the social subsystem (e.g., urbanization, economic development) and the ecological subsystem (e.g., water resources, land cover), and how this coupling relationship ultimately determines the basin’s FCS status.
Under this framework, taking into comprehensive consideration the coupling, coordination, and mutual restraint relationships between the socio-economic system and the ecological environment is crucial for comprehensively assessing the level of safe development and the degree of coordination in the Haihe River Basin. The coupling relationship between the social subsystem and the ecological subsystem will transmit pressure to the material space, policy support, ecological foundation, and resilience, thereby altering the state and resilience of FCS. This, in turn, will drive the regulation of industrial policies or the enhancement of ecological service values within the basin.
Building on this framework, to accurately evaluate the relationship between the SES and the FCS system, guided by the principles of scientific validity and data availability, we respectively constructed a socio-ecological coupling evaluation index system (
Table 1) and an FCS system synergistic benefit index system (
Table 2). The FCS subsystem used in this study should be understood as a partial and structurally oriented proxy of flood safety within the broader SES framework. Given the need for long-term interprovincial comparability over 2008–2022, the selected indicators mainly capture relatively observable dimensions of flood protection capacity, including structural defense conditions, conservation support, and fiscal input. As a result, several important non-structural and outcome-oriented dimensions of contemporary flood risk management—such as drainage capacity, floodplain land-use control, early warning, emergency response, insurance protection, critical asset exposure, and nature-based or Sponge City measures—are not explicitly represented in the present index system. These omissions should be interpreted as a data- and scale-related limitation of the operationalization rather than as a dismissal of their substantive importance. We populated these dimensions with specific, measurable indicators that have been validated in previous studies [
7,
10,
11,
12,
13,
14] and are highly pertinent to the specific challenges faced by the Haihe Basin, such as rapid urbanization and water scarcity. The “Direction” in
Table 1 and
Table 2 refers to the expected contribution of each indicator to the improvement of the corresponding subsystem and, ultimately, to the coordinated development of the SES, rather than to flood risk pressure considered in isolation. Accordingly, a positive sign indicates that a higher indicator value is associated with stronger development support, adaptive capacity, or system functioning in the evaluation framework, whereas a negative sign indicates that a higher value tends to increase development pressure, exposure, or coordination constraints.
It should be noted that the substantive importance of an indicator within a social–ecological or flood-related system does not necessarily correspond to its statistical variability across time and space. In particular, some ecologically foundational variables, such as vegetation coverage or land-cover-related indicators, may exhibit relatively limited temporal variation while still playing a critical role in runoff regulation, infiltration, and watershed resilience. For this reason, the research supplements the entropy-based weighting scheme with equal-weight and expert-informed weighting scenarios to assess the robustness of the subsystem evaluation and subsequent coupling-coordination results (
Table A3 and
Table A4).
3.3.2. Comprehensive Development Evaluation Model
To construct a composite index for each subsystem, all indicators were first standardized using min–max normalization to transform them into a comparable dimensionless scale. The baseline indicator weights were then determined using the entropy weight method [
30]. This data-driven weighting approach was adopted because it derives weights from the information content and dispersion of the observed data, thereby reducing arbitrariness in the baseline specification.
However, entropy weighting emphasizes cross-sectional and temporal variability rather than the theoretical or process-based importance of indicators. As a result, indicators that are hydrologically or ecologically important but relatively stable over time may receive comparatively low weights. To address this potential limitation, the research supplements the baseline entropy weighting scheme with two alternative specifications: an equal-weight scheme, in which all indicators within each subsystem are assigned identical weights, and an expert-informed weighting scheme based on analytic hierarchy process (AHP) principles. These alternative schemes are used as robustness checks to examine whether the subsystem development trajectories and the subsequent coupling-coordination results are sensitive to the choice of weighting method.
The comprehensive development level for each subsystem was then calculated using a linear weighted sum model, as shown in Equation (1):
where
Sk represents the comprehensive development index for a given subsystem
k (where
k denotes the Social, Ecological, or Flood Control subsystem).
ωj is the entropy-derived weight of indicator
j,
is its normalized value for year
i, and
q is the total number of indicators. We acknowledge that this linear aggregation model rests on an assumption of compensability among indicators. However, it remains a robust and widely used method for creating composite indices in sustainability and environmental science, providing a clear and replicable measure of overall performance.
3.3.3. Robustness Analysis of Weighting Schemes
To test whether the empirical findings depend heavily on the choice of weighting method, three weighting schemes were compared in this study: (1) entropy weighting as the baseline data-driven specification; (2) equal weighting as a neutral benchmark; and (3) expert-informed weighting derived from AHP-based judgments on the relative importance of indicators within each subsystem.
Under each weighting scheme, subsystem composite indices were recalculated and subsequently used to estimate the coupling coordination degree (CCD). The comparison focuses on two aspects: first, whether the temporal evolution of subsystem development remains broadly consistent; and second, whether the CCD trajectory and its stage classification are sensitive to the weighting scheme. If the main temporal patterns remain stable across schemes, the study’s core conclusions can be regarded as robust to weighting choice.
3.3.4. Coupling Coordination Degree Model
To assess the complex interplay between the social and ecological subsystems, we employed the widely used CCD model. This model allows for a nuanced evaluation that distinguishes between the strength of the interaction (coupling) and the quality of that interaction (coordination). First, the coupling degree (
C), which measures how strongly the two subsystems influence each other, is calculated as:
where
U1 and
U2 are the comprehensive development indices for the social and ecological subsystems.
Second, to evaluate whether the interaction is harmonious, we calculate the CCD (
D). This requires an intermediate comprehensive coordination index (
T):
Here,
D is the final metric, which is classified into 10 levels (
Table 3) [
39]. In this article, the CCD was calculated under all three weighting schemes to assess the robustness of coordination trajectories to alternative indicator-weight assumptions. The coefficients
α and
β represent the relative importance of the social and ecological subsystems. In this study, both
α and
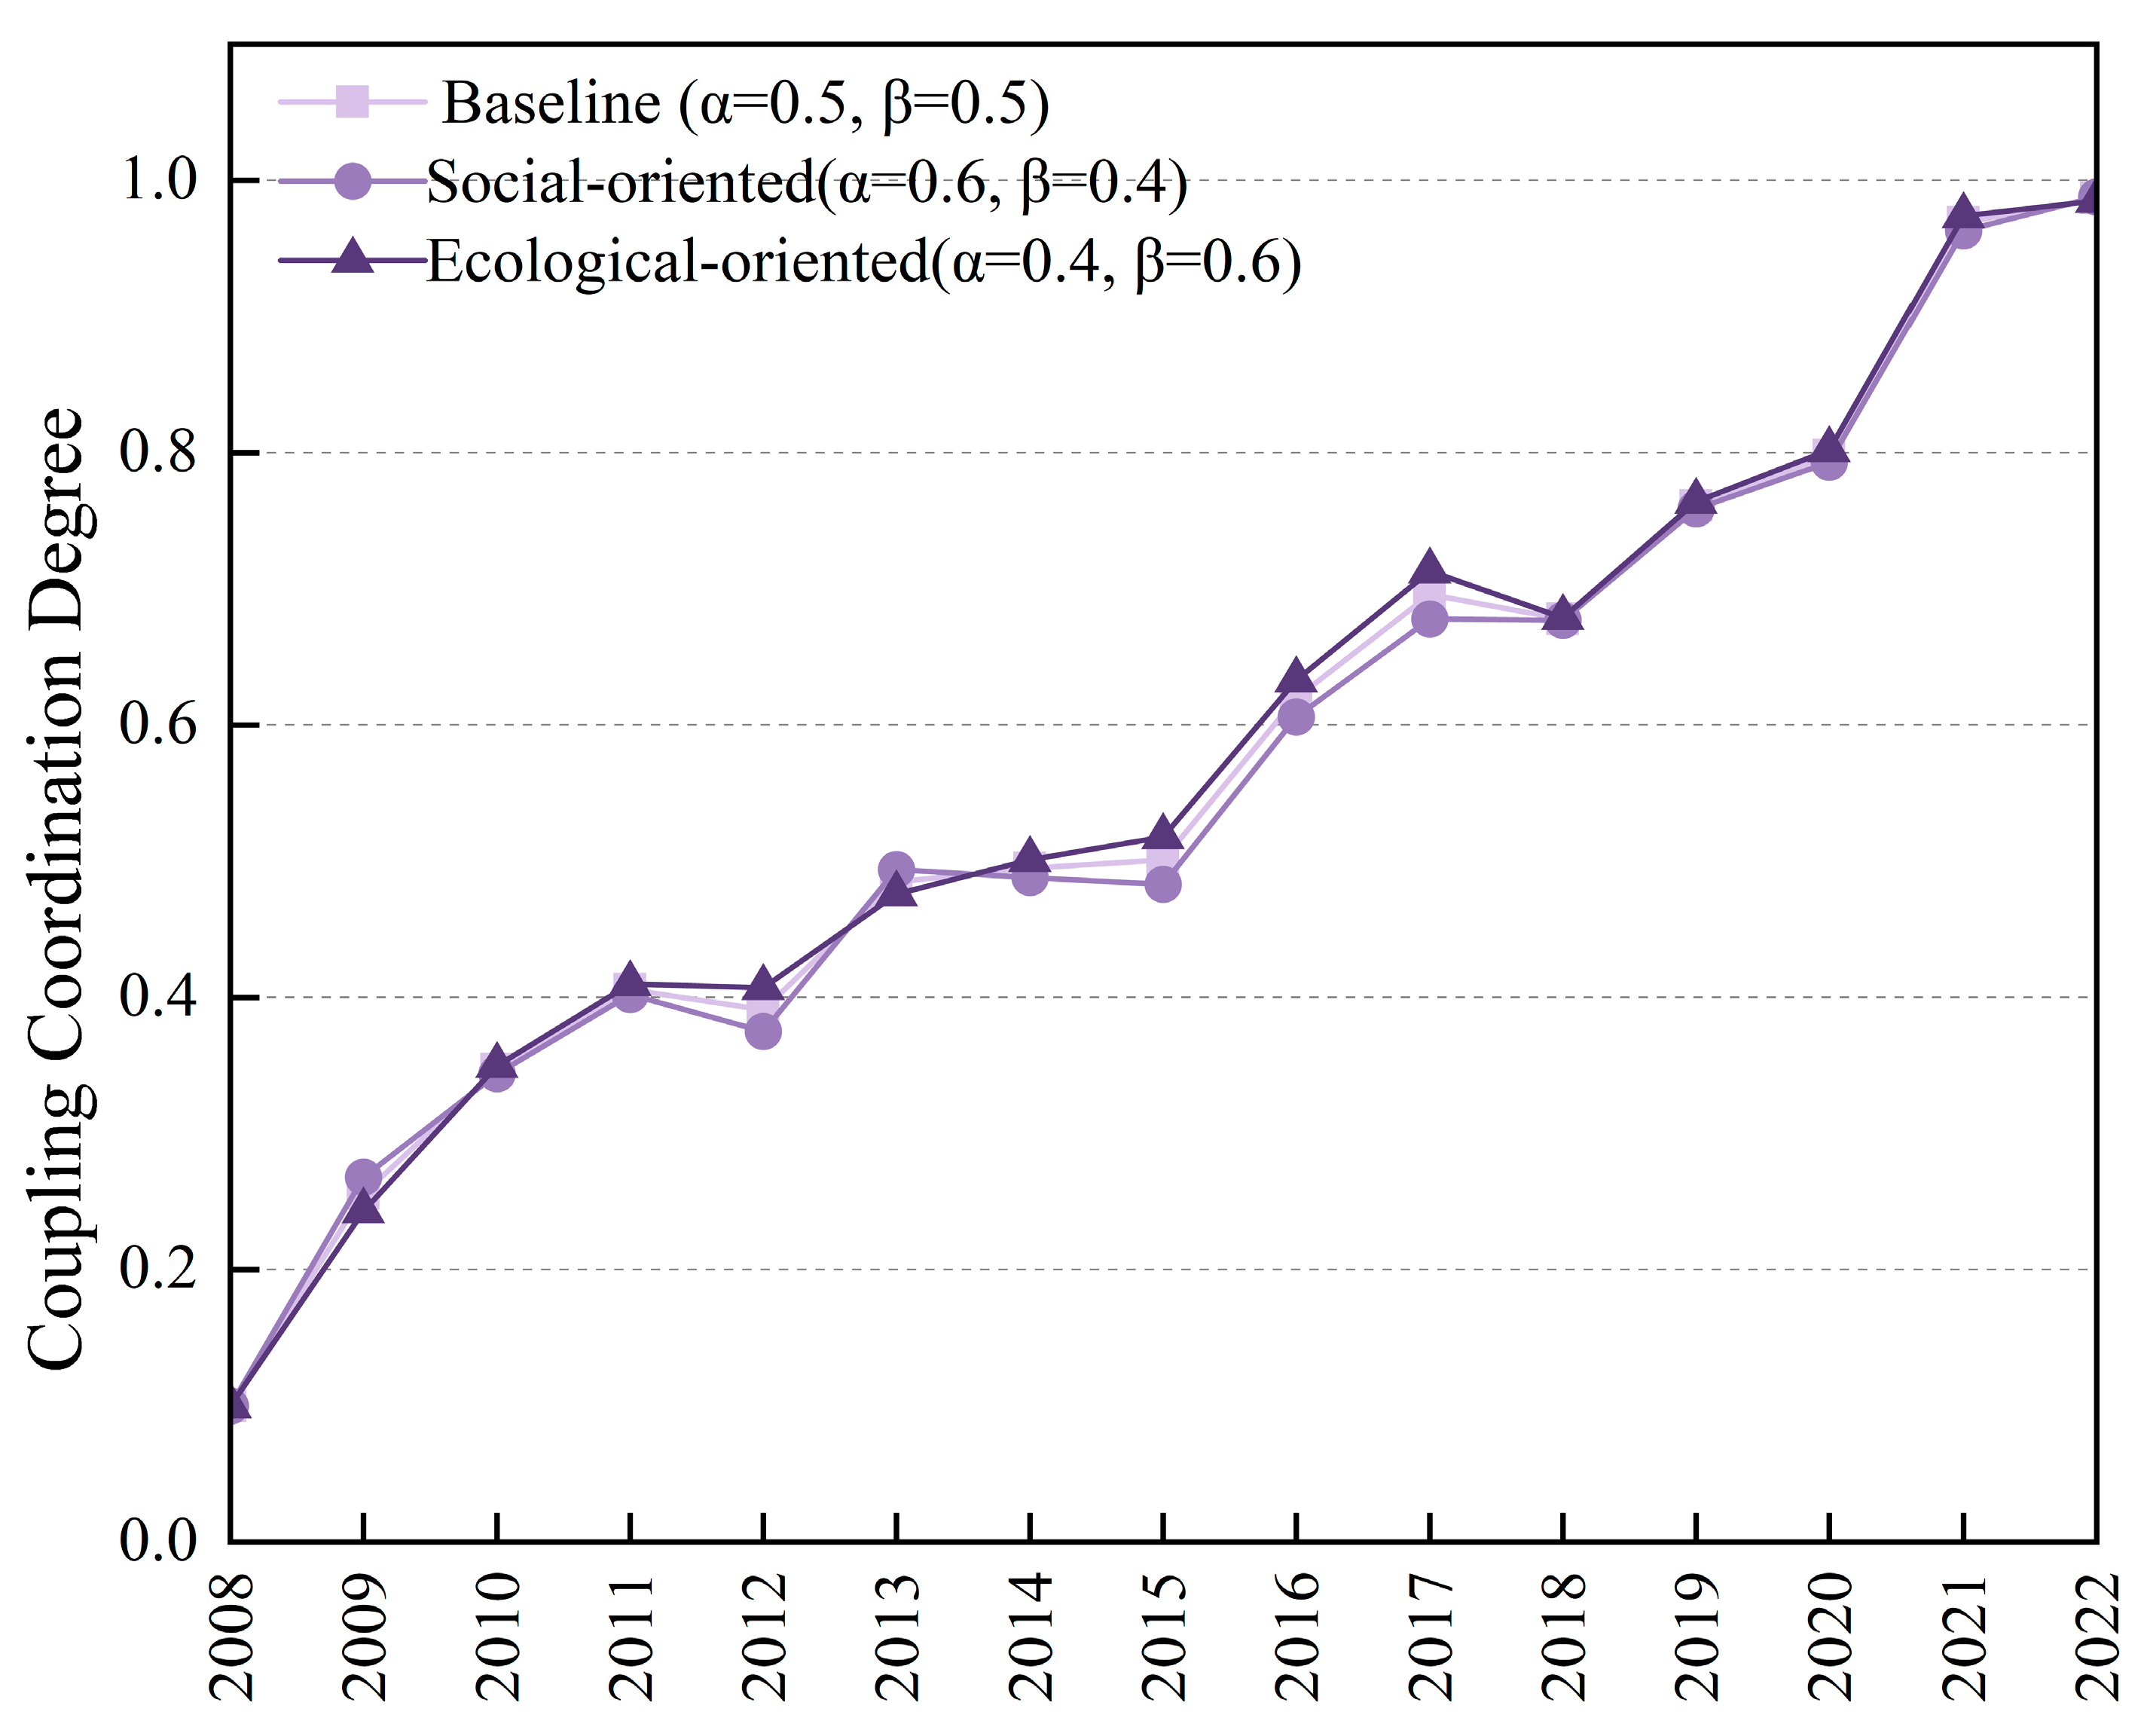
β were set to 0.5. This choice reflects the guiding principle of sustainable development, which posits that the social and ecological domains are of equal importance and should be advanced in a balanced manner. This balanced weighting ensures that the final coordination score reflects a synergistic development rather than the progress of one subsystem at the expense of the other. To assess the sensitivity of the CCD trajectories to this normative assumption, we additionally tested two alternative weighting schemes: a social-oriented specification (
α = 0.6,
β = 0.4) and an ecological-oriented specification (
α = 0.4,
β = 0.6). The resulting trajectories are compared with the baseline series in
Figure A1. As shown there, the three series are highly consistent over time, indicating that the main temporal pattern of CCD evolution is robust to moderate changes in subsystem weights.
3.3.5. Driving Factor Analysis
To quantitatively investigate the dynamic relationship between FCS and the overall system’s health, we employed a two-stage econometric analysis. First, a panel vector autoregression (PVAR) model was established to examine the dynamic interaction between FCS and the CCD of the SES using province-year panel data [
40,
41]. This specification is preferred to a basin-aggregate annual VAR because it makes use of both the cross-sectional and temporal variation in the dataset and is therefore more statistically defensible for the present sample. Second, a Grey Relational Analysis (GRA) model was used to identify the relative importance of individual FCS indicators in influencing the system’s coupling coordination, thus providing a more granular diagnosis.
This study uses a PVAR model to analyze the relationship of FCS’s impact on the system’s CCD. The model is as follows:
where
represents a k-dimensional vector of endogenous variables for the
i-th individual at time
t;
p denotes the lag order, and
j indicates the corresponding lag period;
Aj is a k × k matrix of parameters to be estimated, capturing the dynamic effects of lagged terms on current values;
μi and
λt denote the individual fixed effect and time fixed effect, respectively, which control for unobserved individual heterogeneity and common time-specific shocks;
εit is a vector of random disturbance terms.
- 2.
Grey Relational Analysis (GRA) Model:
The GRA model is used to identify the driving mechanisms of FCS on coupling coordination. The CCD of the SES is set as the reference sequence, while the indicators of FCS are the comparison sequences. The expressions are:
where
ξa is the relational grade between FCS indicator
a and the CCD;
ξia is the grey relational coefficient;
Δia is the absolute difference;
Δmin and
Δmax are the minimum and maximum of the absolute differences; and
ρ is the resolution coefficient, set to 0.5. Based on prior research, the relational grade is classified into three levels: weak (0 <
ξa ≤ 0.35), moderate (0.35 <
ξa ≤ 0.7), and strong (0.7 <
ξa ≤ 1.0). The model helps to identify the sensitivity and dominant roles of different FCS factors, offering theoretical support for the optimization of flood management policies and the improvement of regional resilience.
4. Results and Analysis
4.1. Temporal Evolution of Subsystem Development Levels
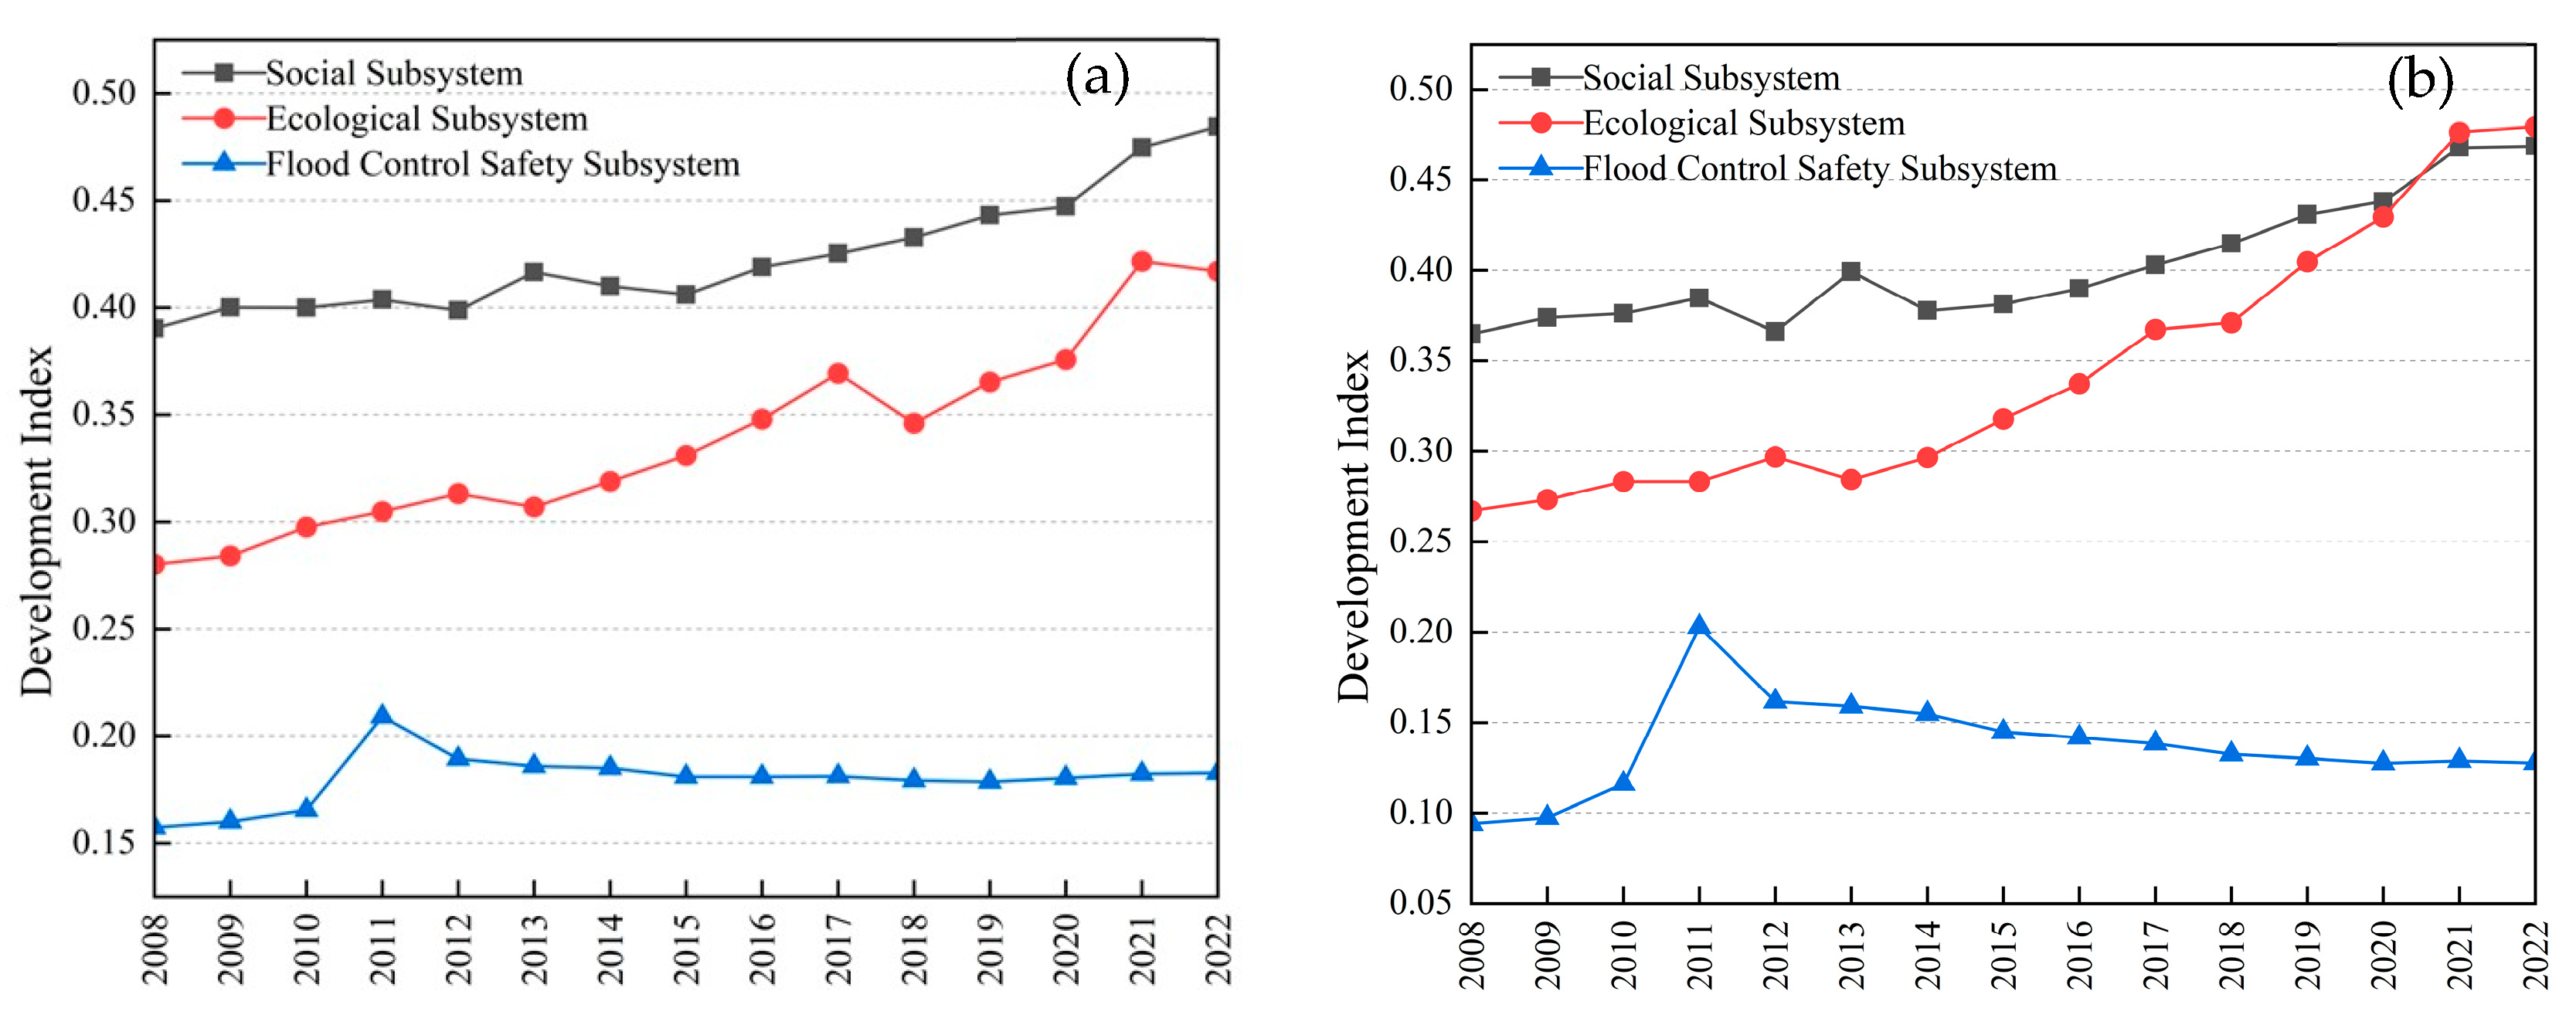
The comprehensive development indices of the social, ecological, and flood-control safety (FCS) subsystems all exhibit an overall upward tendency from 2008 to 2022, although their rates of change and sensitivity to spatial weighting differ markedly (
Figure 3a). Under the baseline province-level specification, the ecological subsystem shows the fastest improvement, followed by the social subsystem, whereas the FCS subsystem records the slowest growth. A noticeable but short-lived fluctuation appears in the basin-wide FCS series around 2011–2012, characterized by a temporary increase in 2011 followed by a decline in 2012. This movement is consistent with the sharp rise observed in Hebei’s FCS index in 2011 and likely reflects a combination of concentrated infrastructure-related improvements, the sensitivity of the composite index to a small number of highly variable indicators, and possible year-to-year reporting discontinuities. After 2012, the FCS index returned to a relatively stable trajectory, indicating that this fluctuation did not alter the broader pattern of slow and constrained improvement.
Figure 3b presents basin-area-weighted indices, which quantify the impact of administrative-scale mismatch. The basin-area-weighted sensitivity results confirm that the social subsystem maintains a broadly similar upward trajectory throughout the study period, although its values are slightly lower than the baseline estimates in most years. This indicates that the use of whole-province statistics may somewhat overestimate basin-specific social development levels, but it does not alter the overall conclusion that social development improved gradually over time.
A similarly robust pattern is observed for the ecological subsystem. Both the baseline and weighted series show sustained long-term improvement; however, the weighted ecological index rises more rapidly in the later years and exceeds the baseline estimates toward the end of the study period. This suggests that ecological improvement in the basin-related area may have outpaced the broader provincial average, especially in the later stage of the observation period.
In contrast, the FCS subsystem is much more sensitive to the area-weighting adjustment. Although the baseline series suggests modest and relatively stable improvement, the weighted FCS index remains substantially lower than the baseline estimates for most years and displays a more constrained trajectory. This indicates that the use of whole-province statistics likely overestimates basin-specific flood-control conditions. Therefore, the slower growth of the FCS subsystem should not be interpreted primarily as evidence that flood-control infrastructure has already reached a mature stage with diminishing marginal returns. Rather, the weighted results suggest that flood-control safety remains structurally weaker than implied by the baseline series and continues to constitute the most prominent bottleneck in the coordinated development of the Haihe River Basin context.
Taken together, the sensitivity analysis does not overturn the main temporal findings of the study. Instead, it shows that the overall improvement of the social and ecological subsystems is reasonably robust, while the flood-control dimension is more strongly affected by the mismatch between hydrological and administrative boundaries. As a result, the research interprets province-based estimates more cautiously and places greater emphasis on the persistent weakness of the FCS subsystem in basin-related territorial resilience.
4.1.1. Regional Heterogeneity in the Social Subsystem
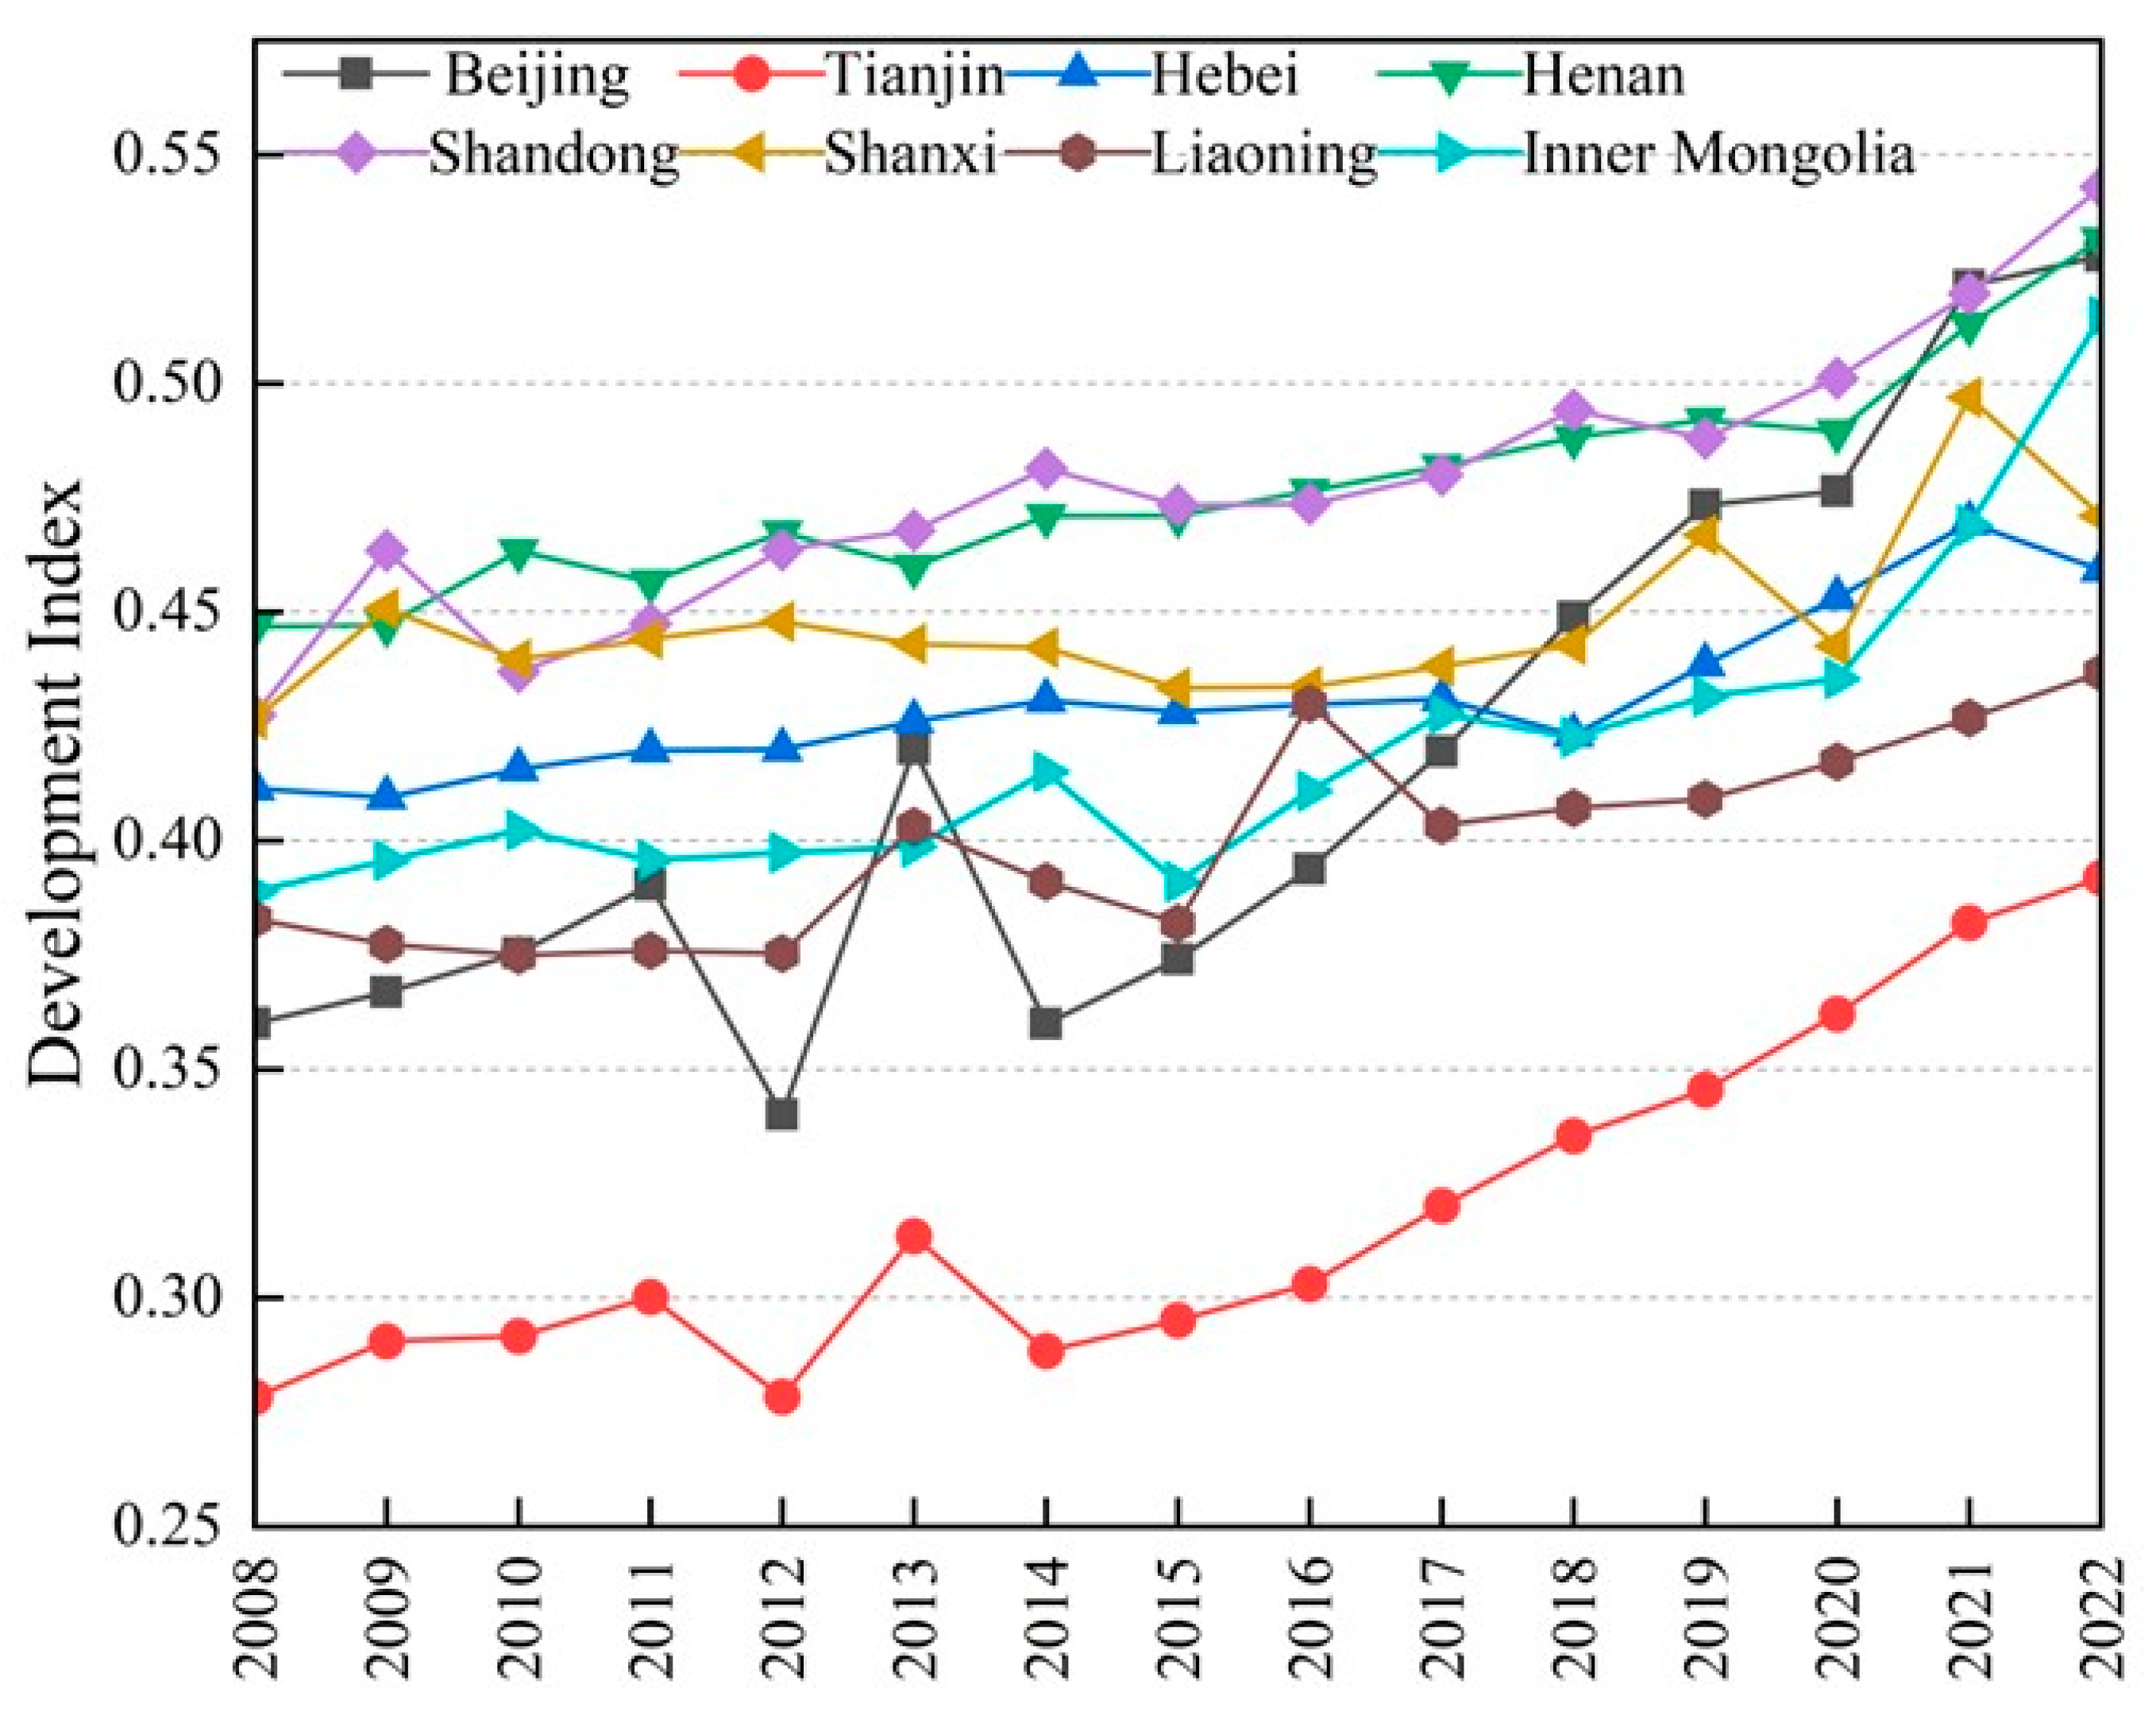
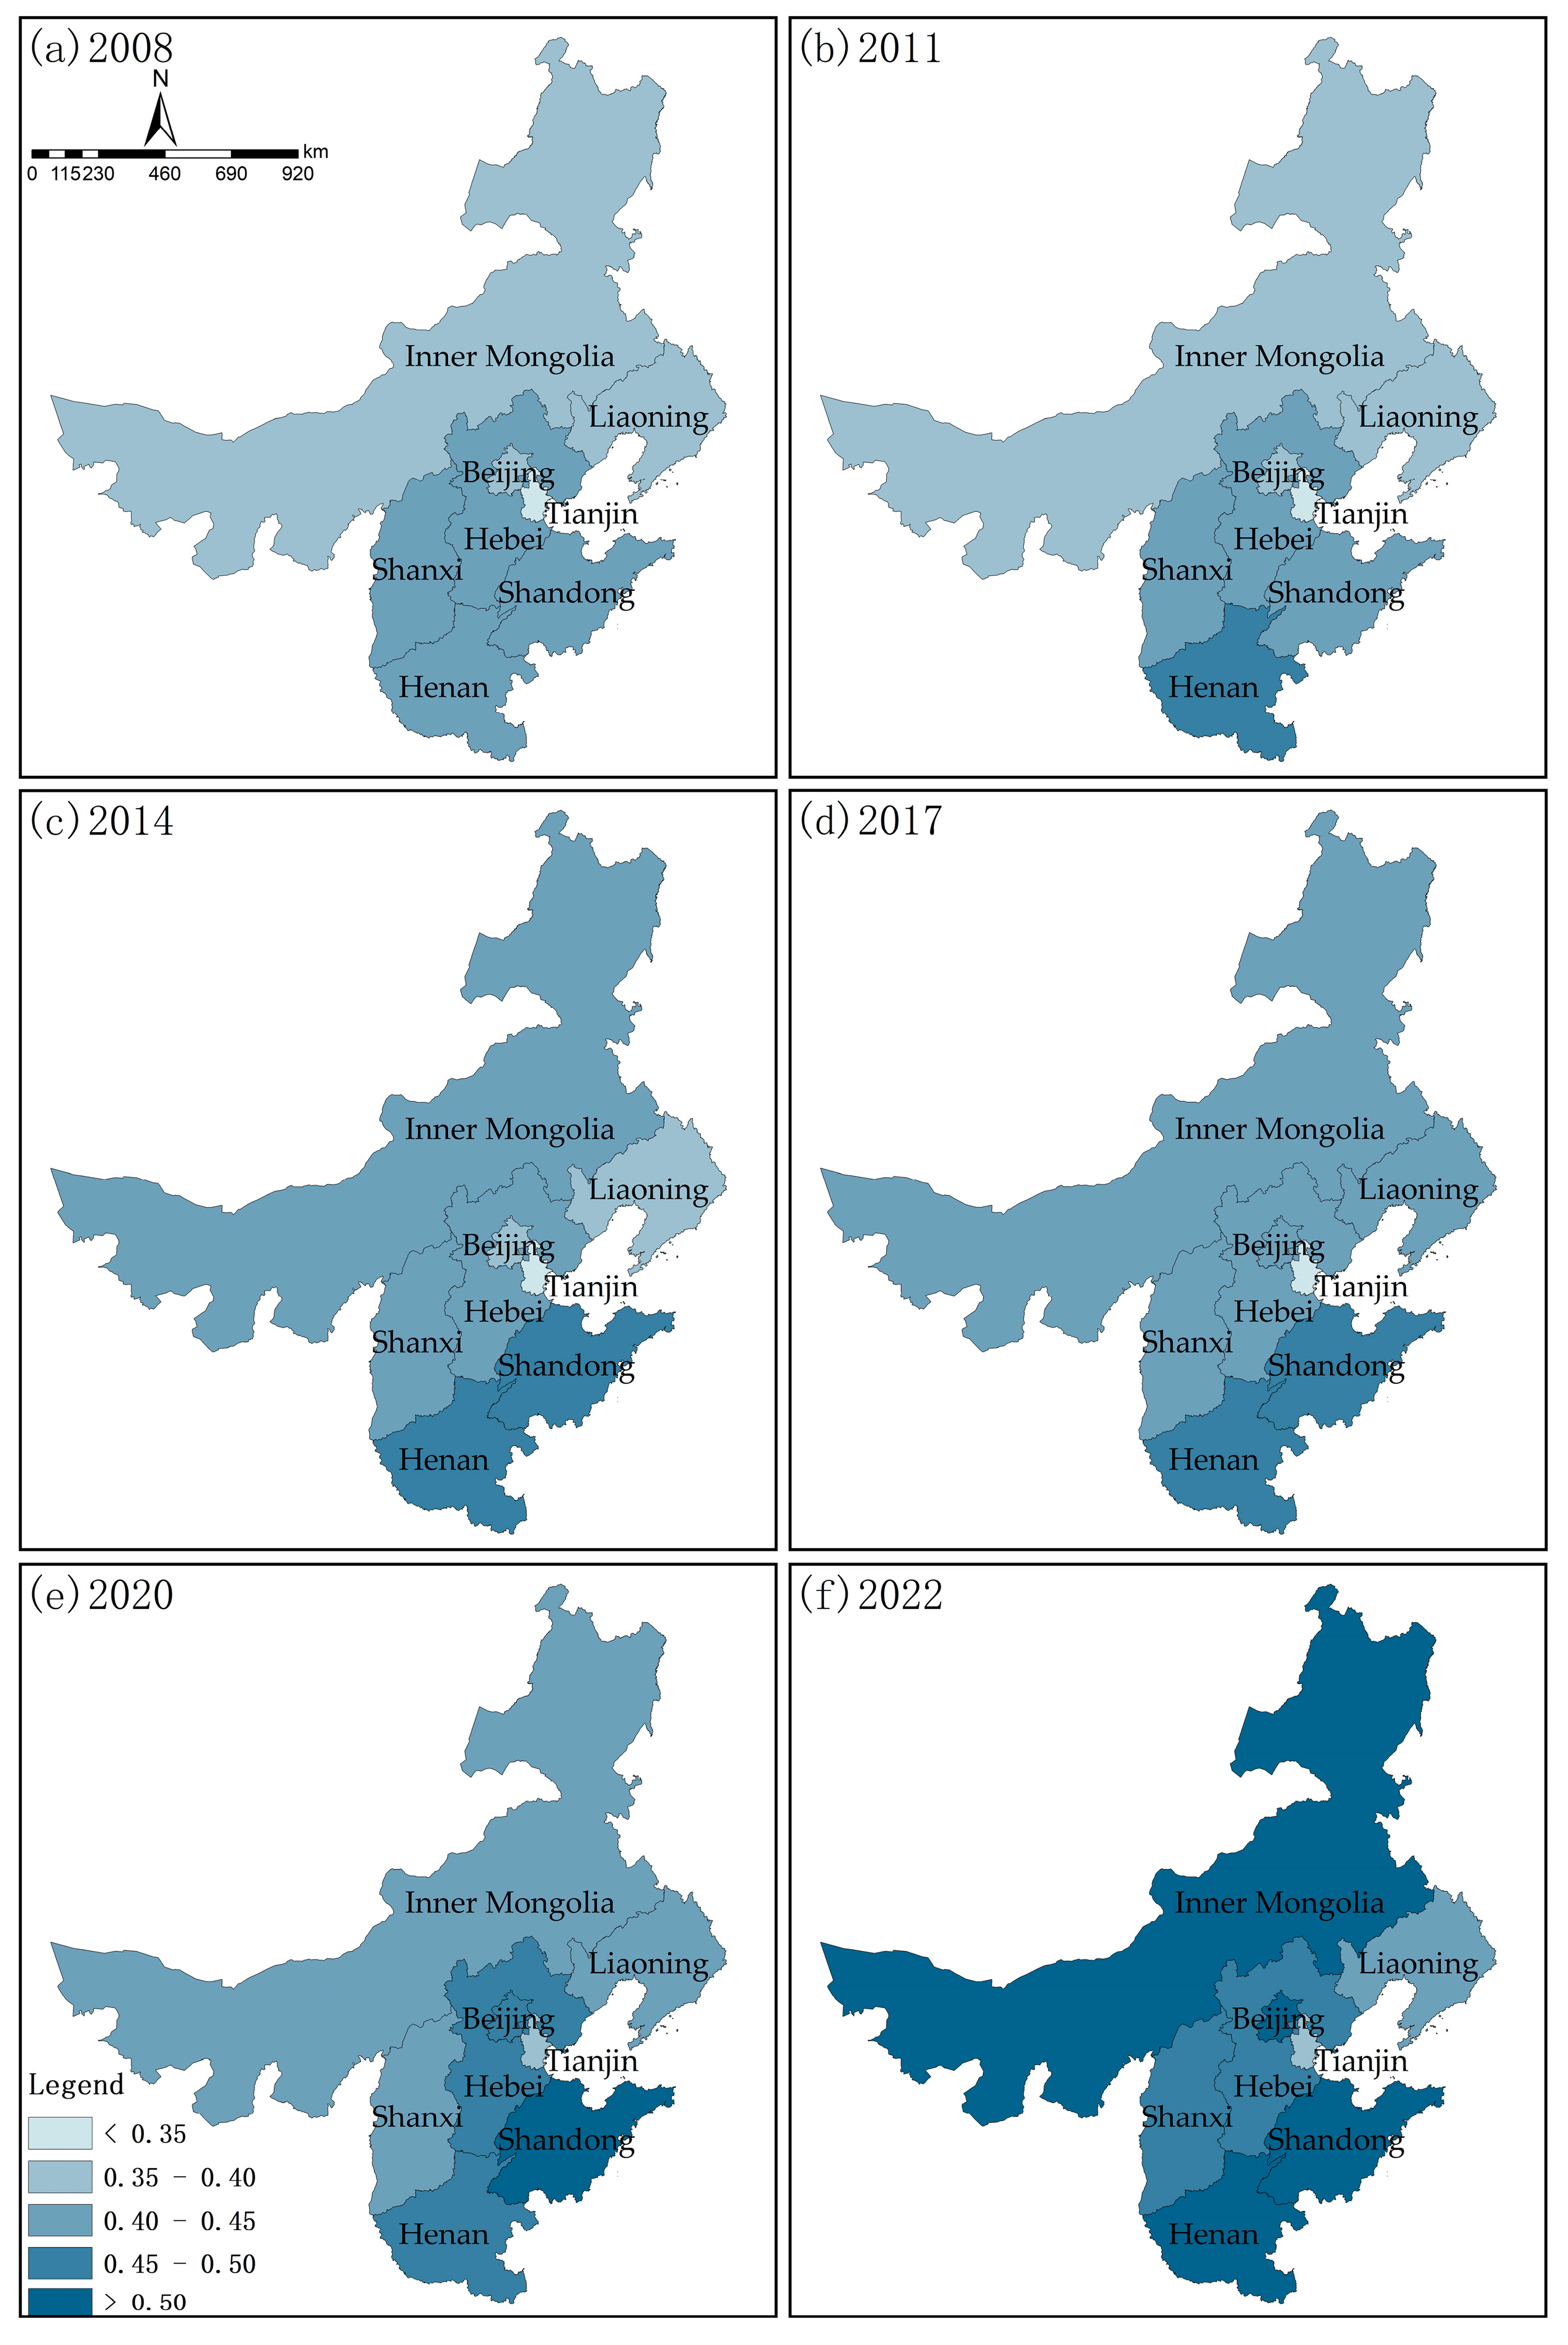
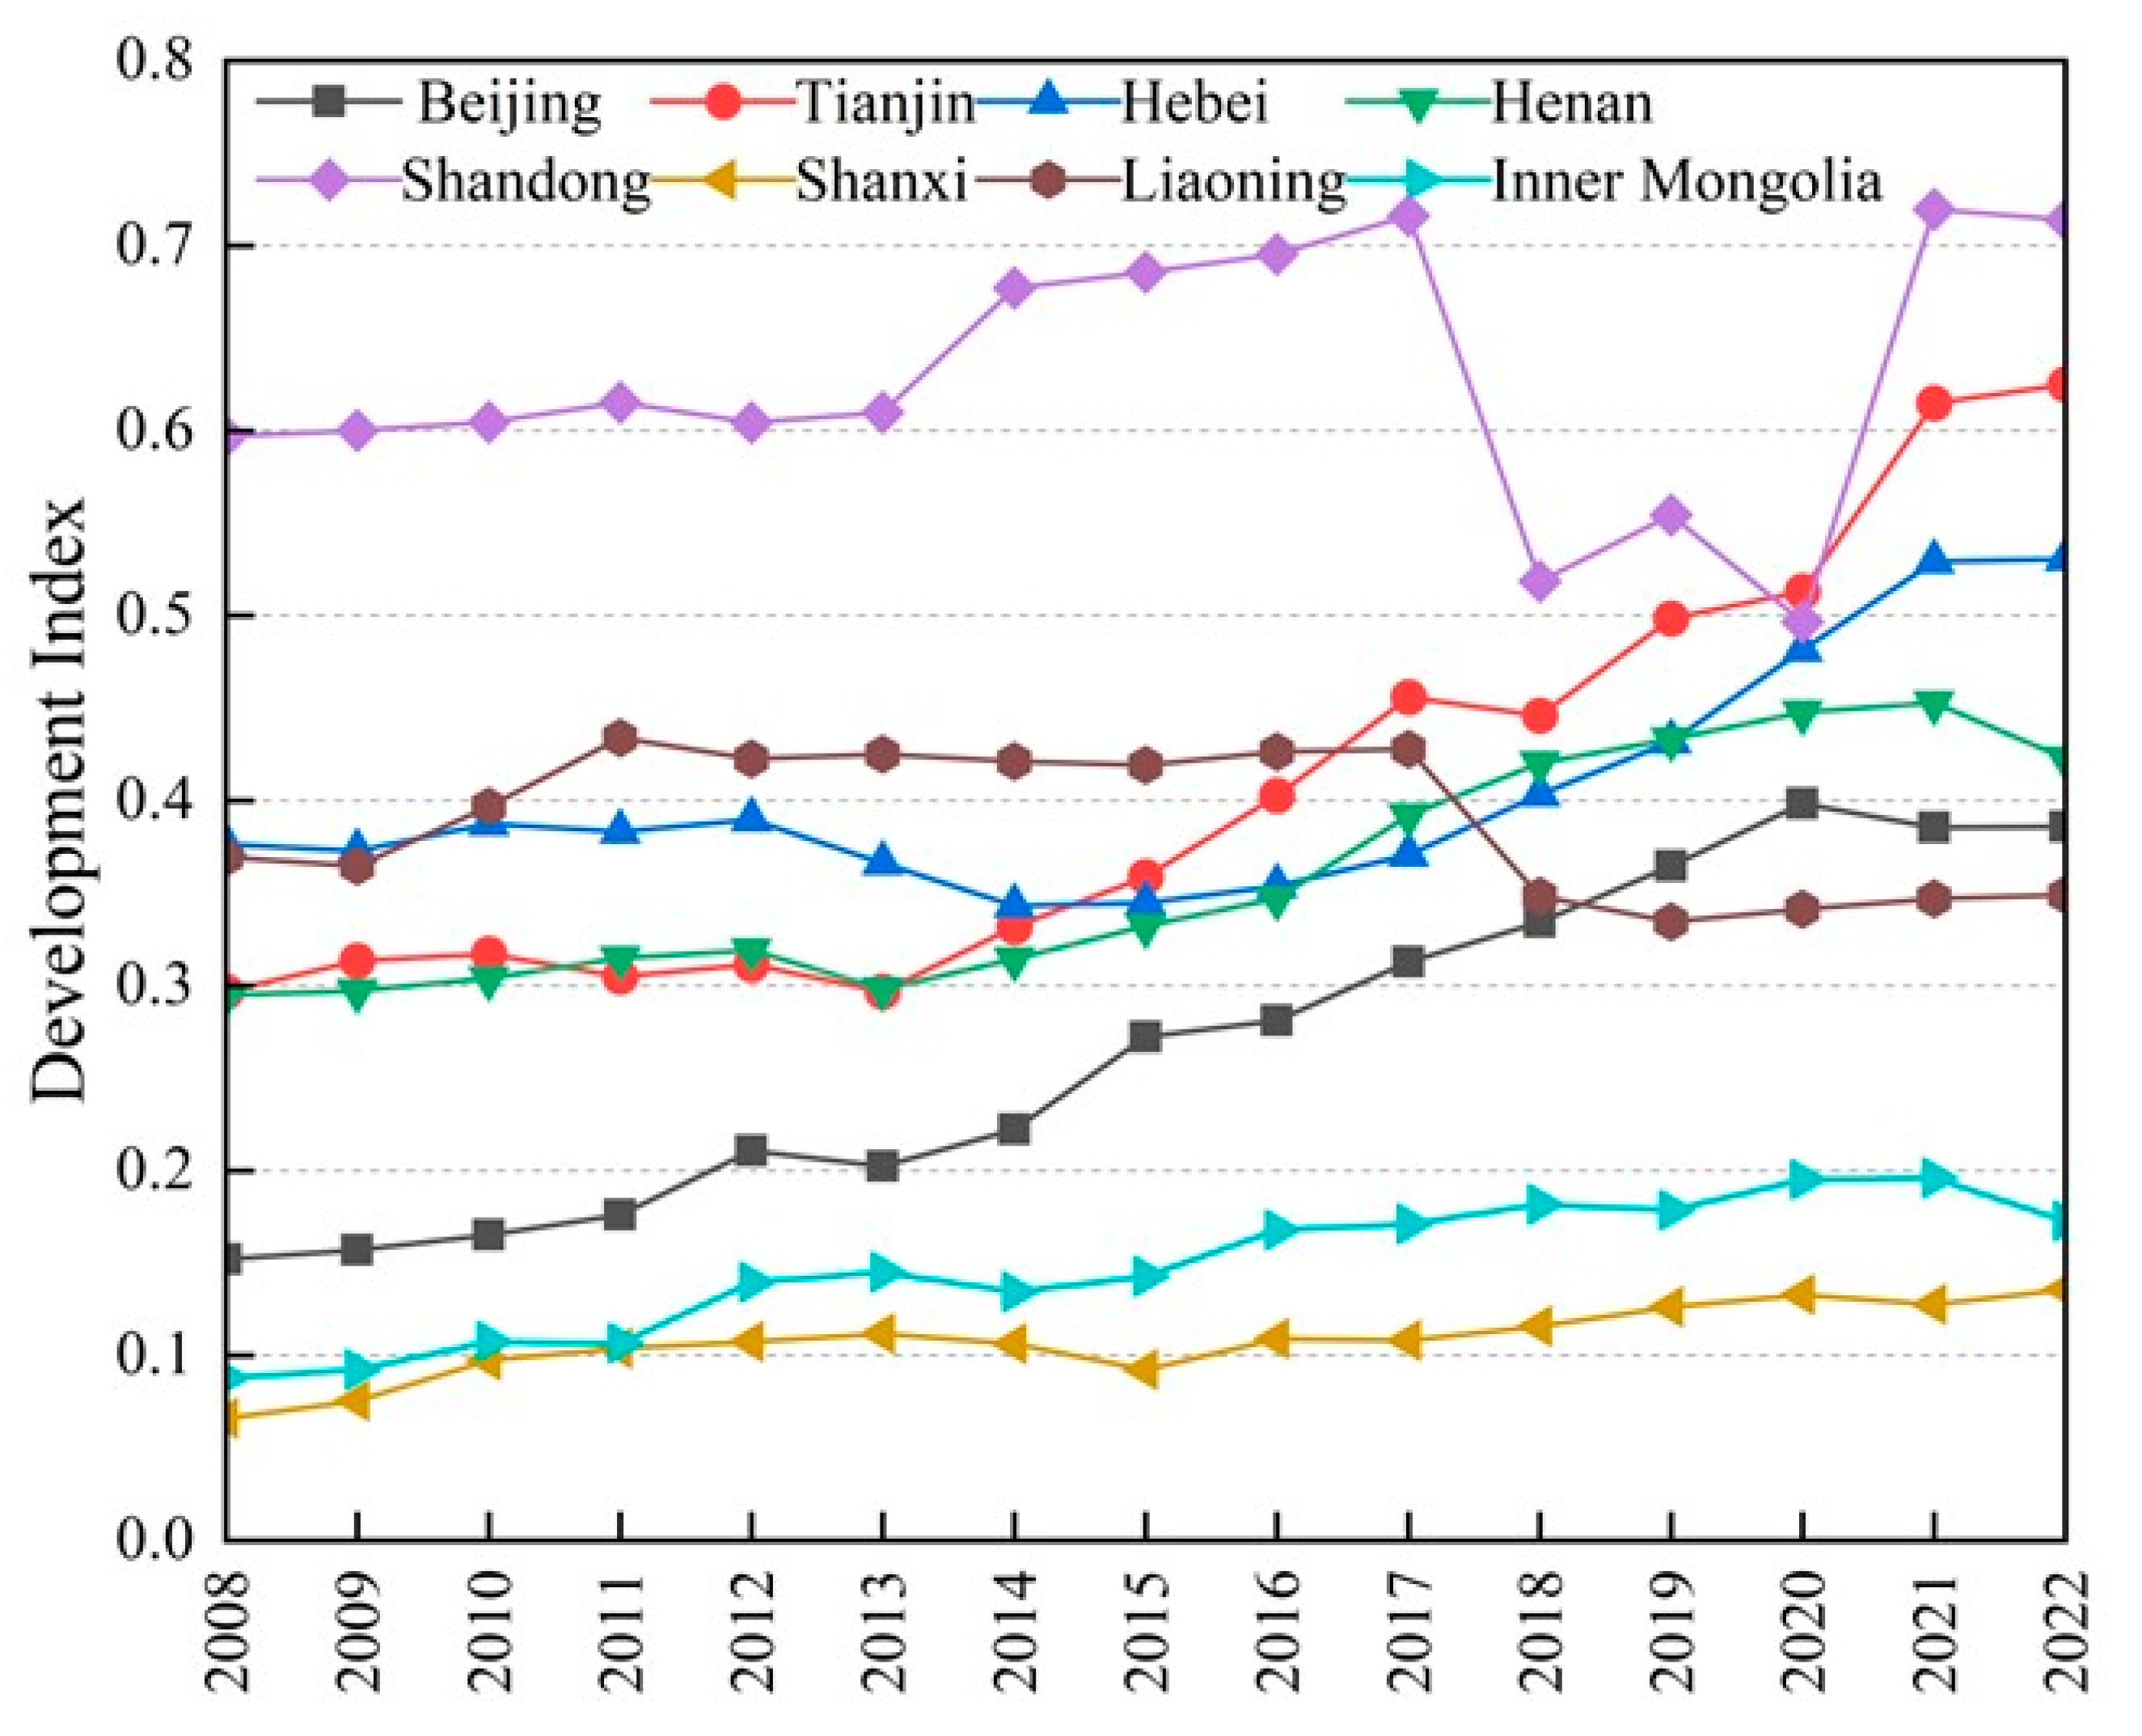
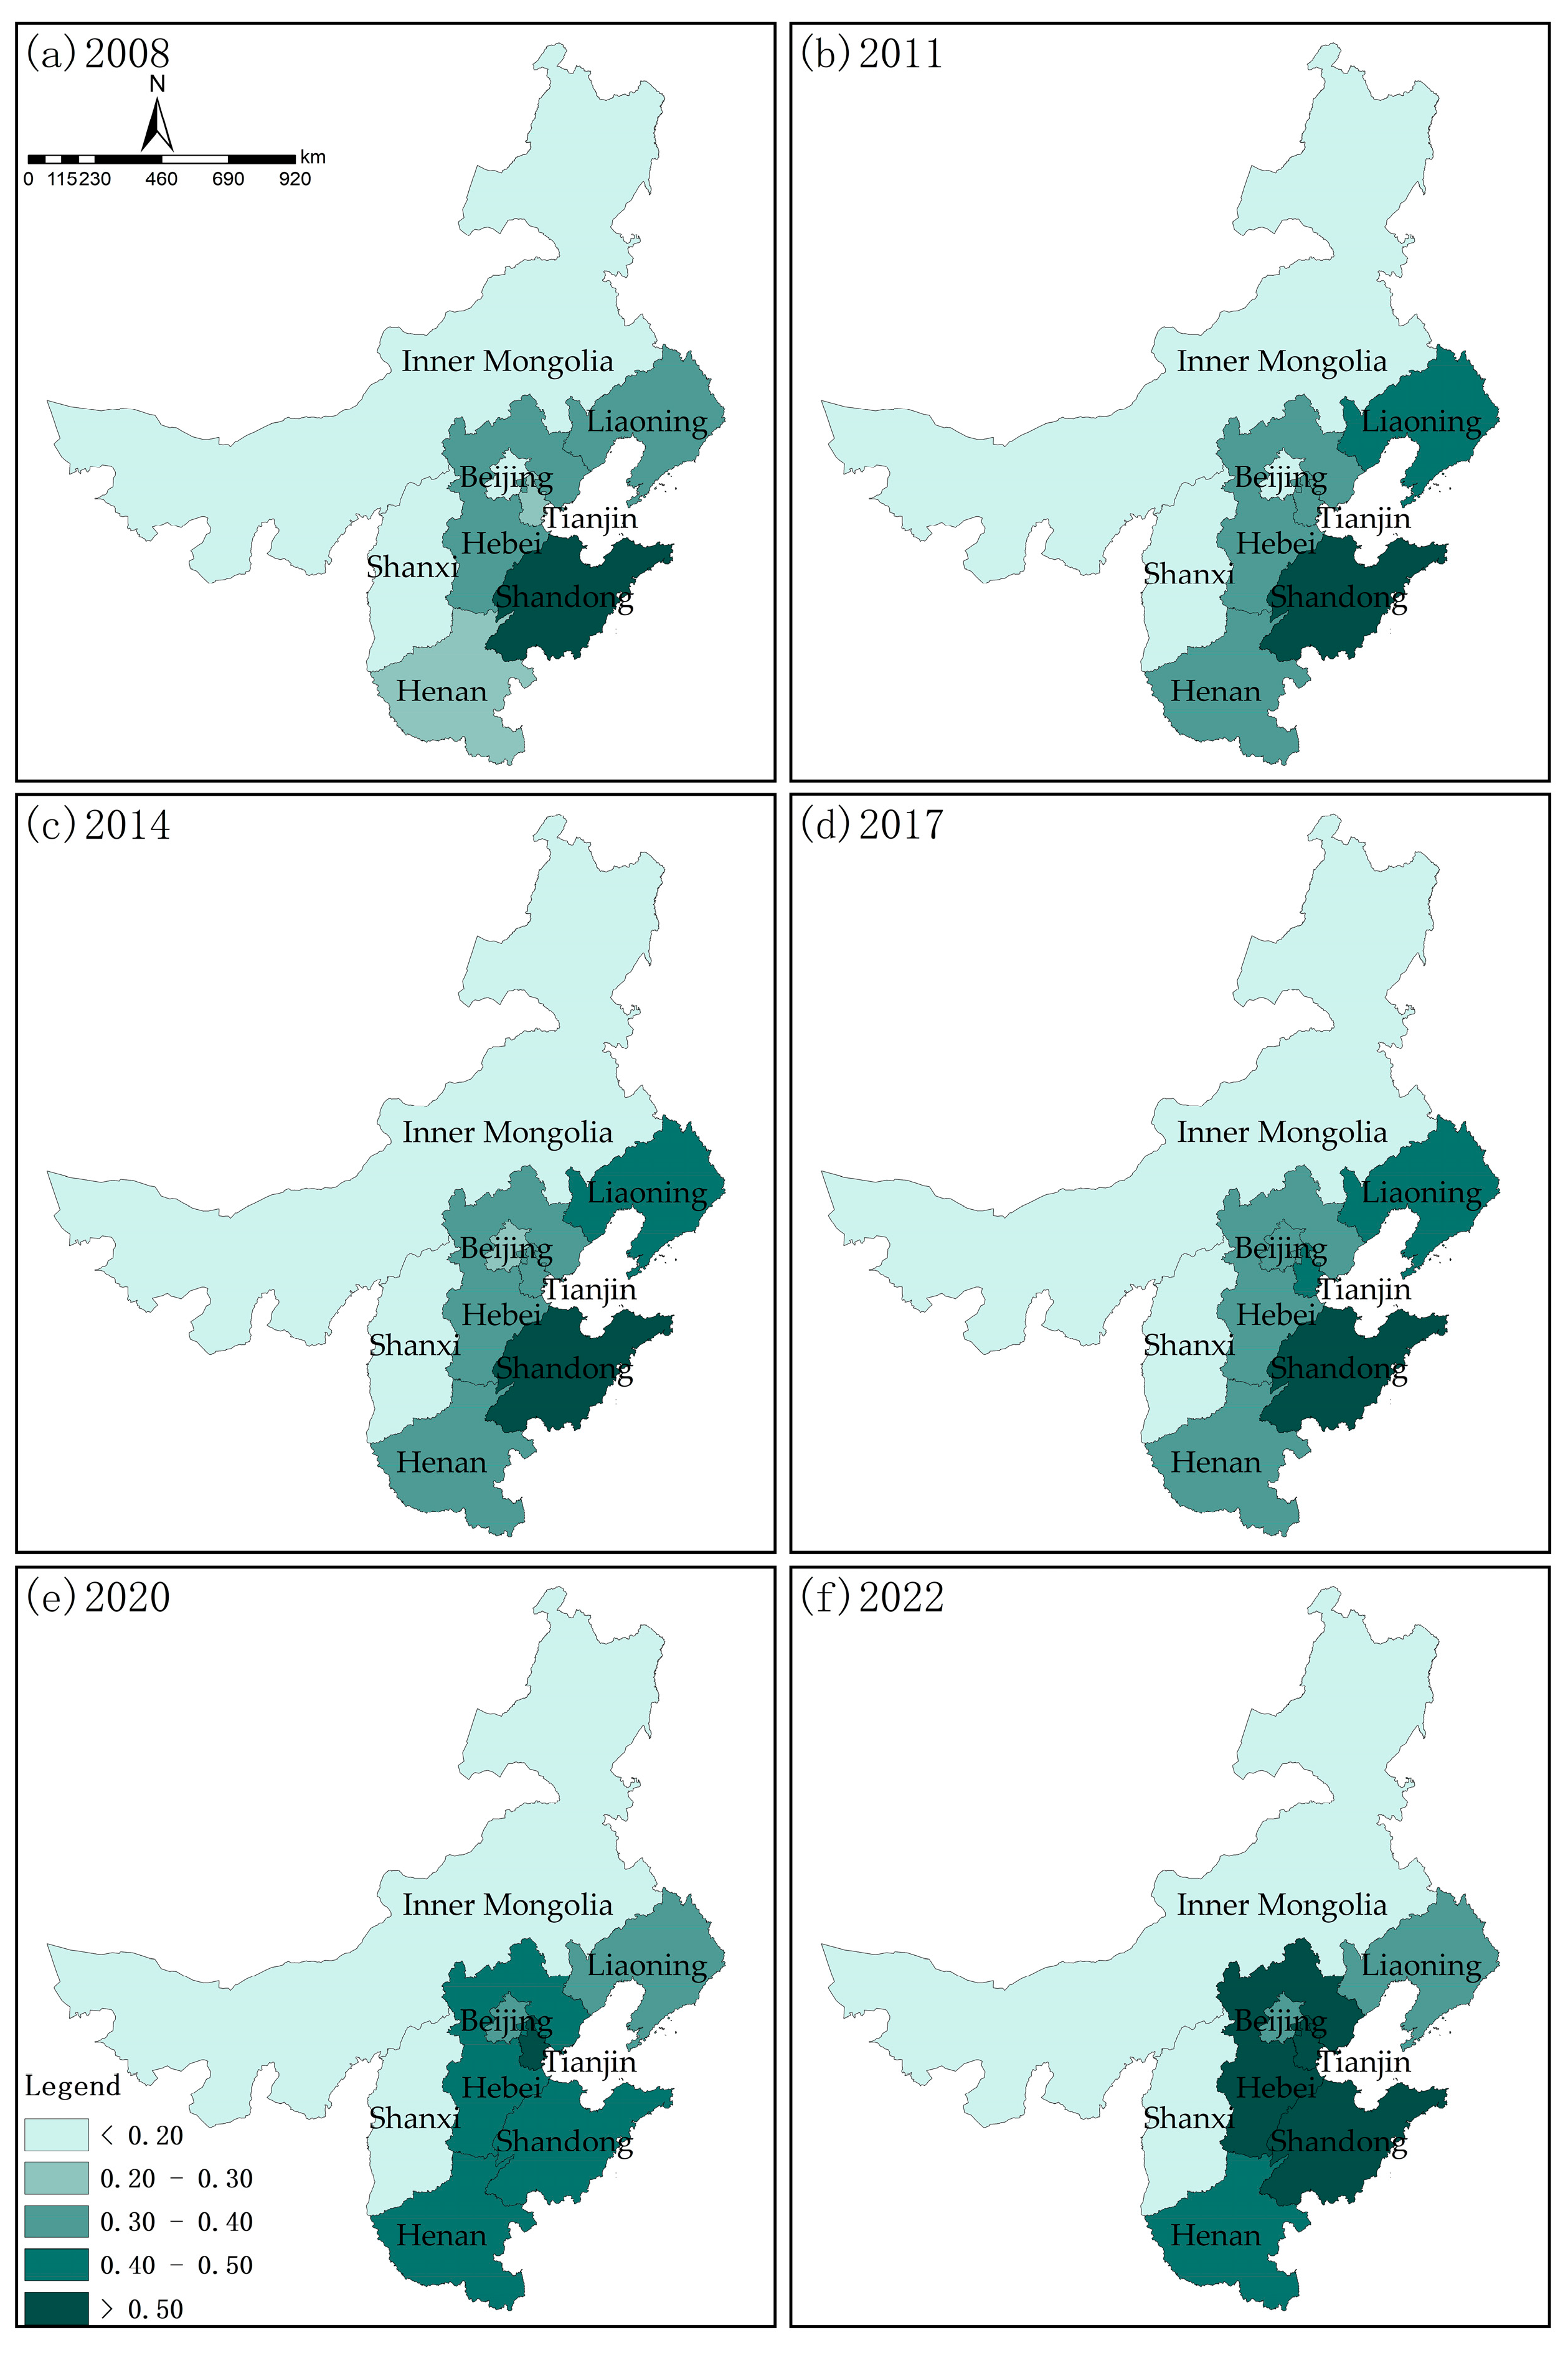
A disaggregated analysis reveals significant regional heterogeneity in the development pathways of the social subsystem across the Haihe River Basin from 2008 to 2022 (
Figure 4 and
Figure 5). We identify three distinct patterns:
Consistent High Performers: Beijing consistently led, driven by its unique status as the capital, which concentrates political, technological, and human capital resources. Though at a different absolute level, Shandong and Henan also maintained a high development index, leveraging their large populations and strong agricultural foundations to fuel industrialization and economic growth.
Resource-Dependent Volatility: Hebei, Shanxi, and Inner Mongolia showed a more volatile upward trend. Their development trajectories appear to be strongly influenced by their reliance on heavy industry and natural resources. This economic structure makes them susceptible to national policy shifts regarding environmental protection and market fluctuations in commodity prices, leading to less stable growth patterns compared to more diversified economies.
Policy-Driven Stable Growth: Tianjin stands out with a remarkably stable and consistent growth pattern. This is likely attributable to its strategic role in the Beijing–Tianjin–Hebei Coordinated Development strategy, which has facilitated a successful transition from traditional heavy industry towards advanced manufacturing, logistics, and a modern port-centric economy.
Looking forward, while national strategies aim to promote balanced regional development across China, the persistent structural differences observed here suggest that narrowing these gaps will remain a long-term challenge. The future convergence of development levels will largely depend on the success of industrial restructuring in the resource-dependent provinces.
4.1.2. Spatiotemporal Dynamics of the Ecological Subsystem
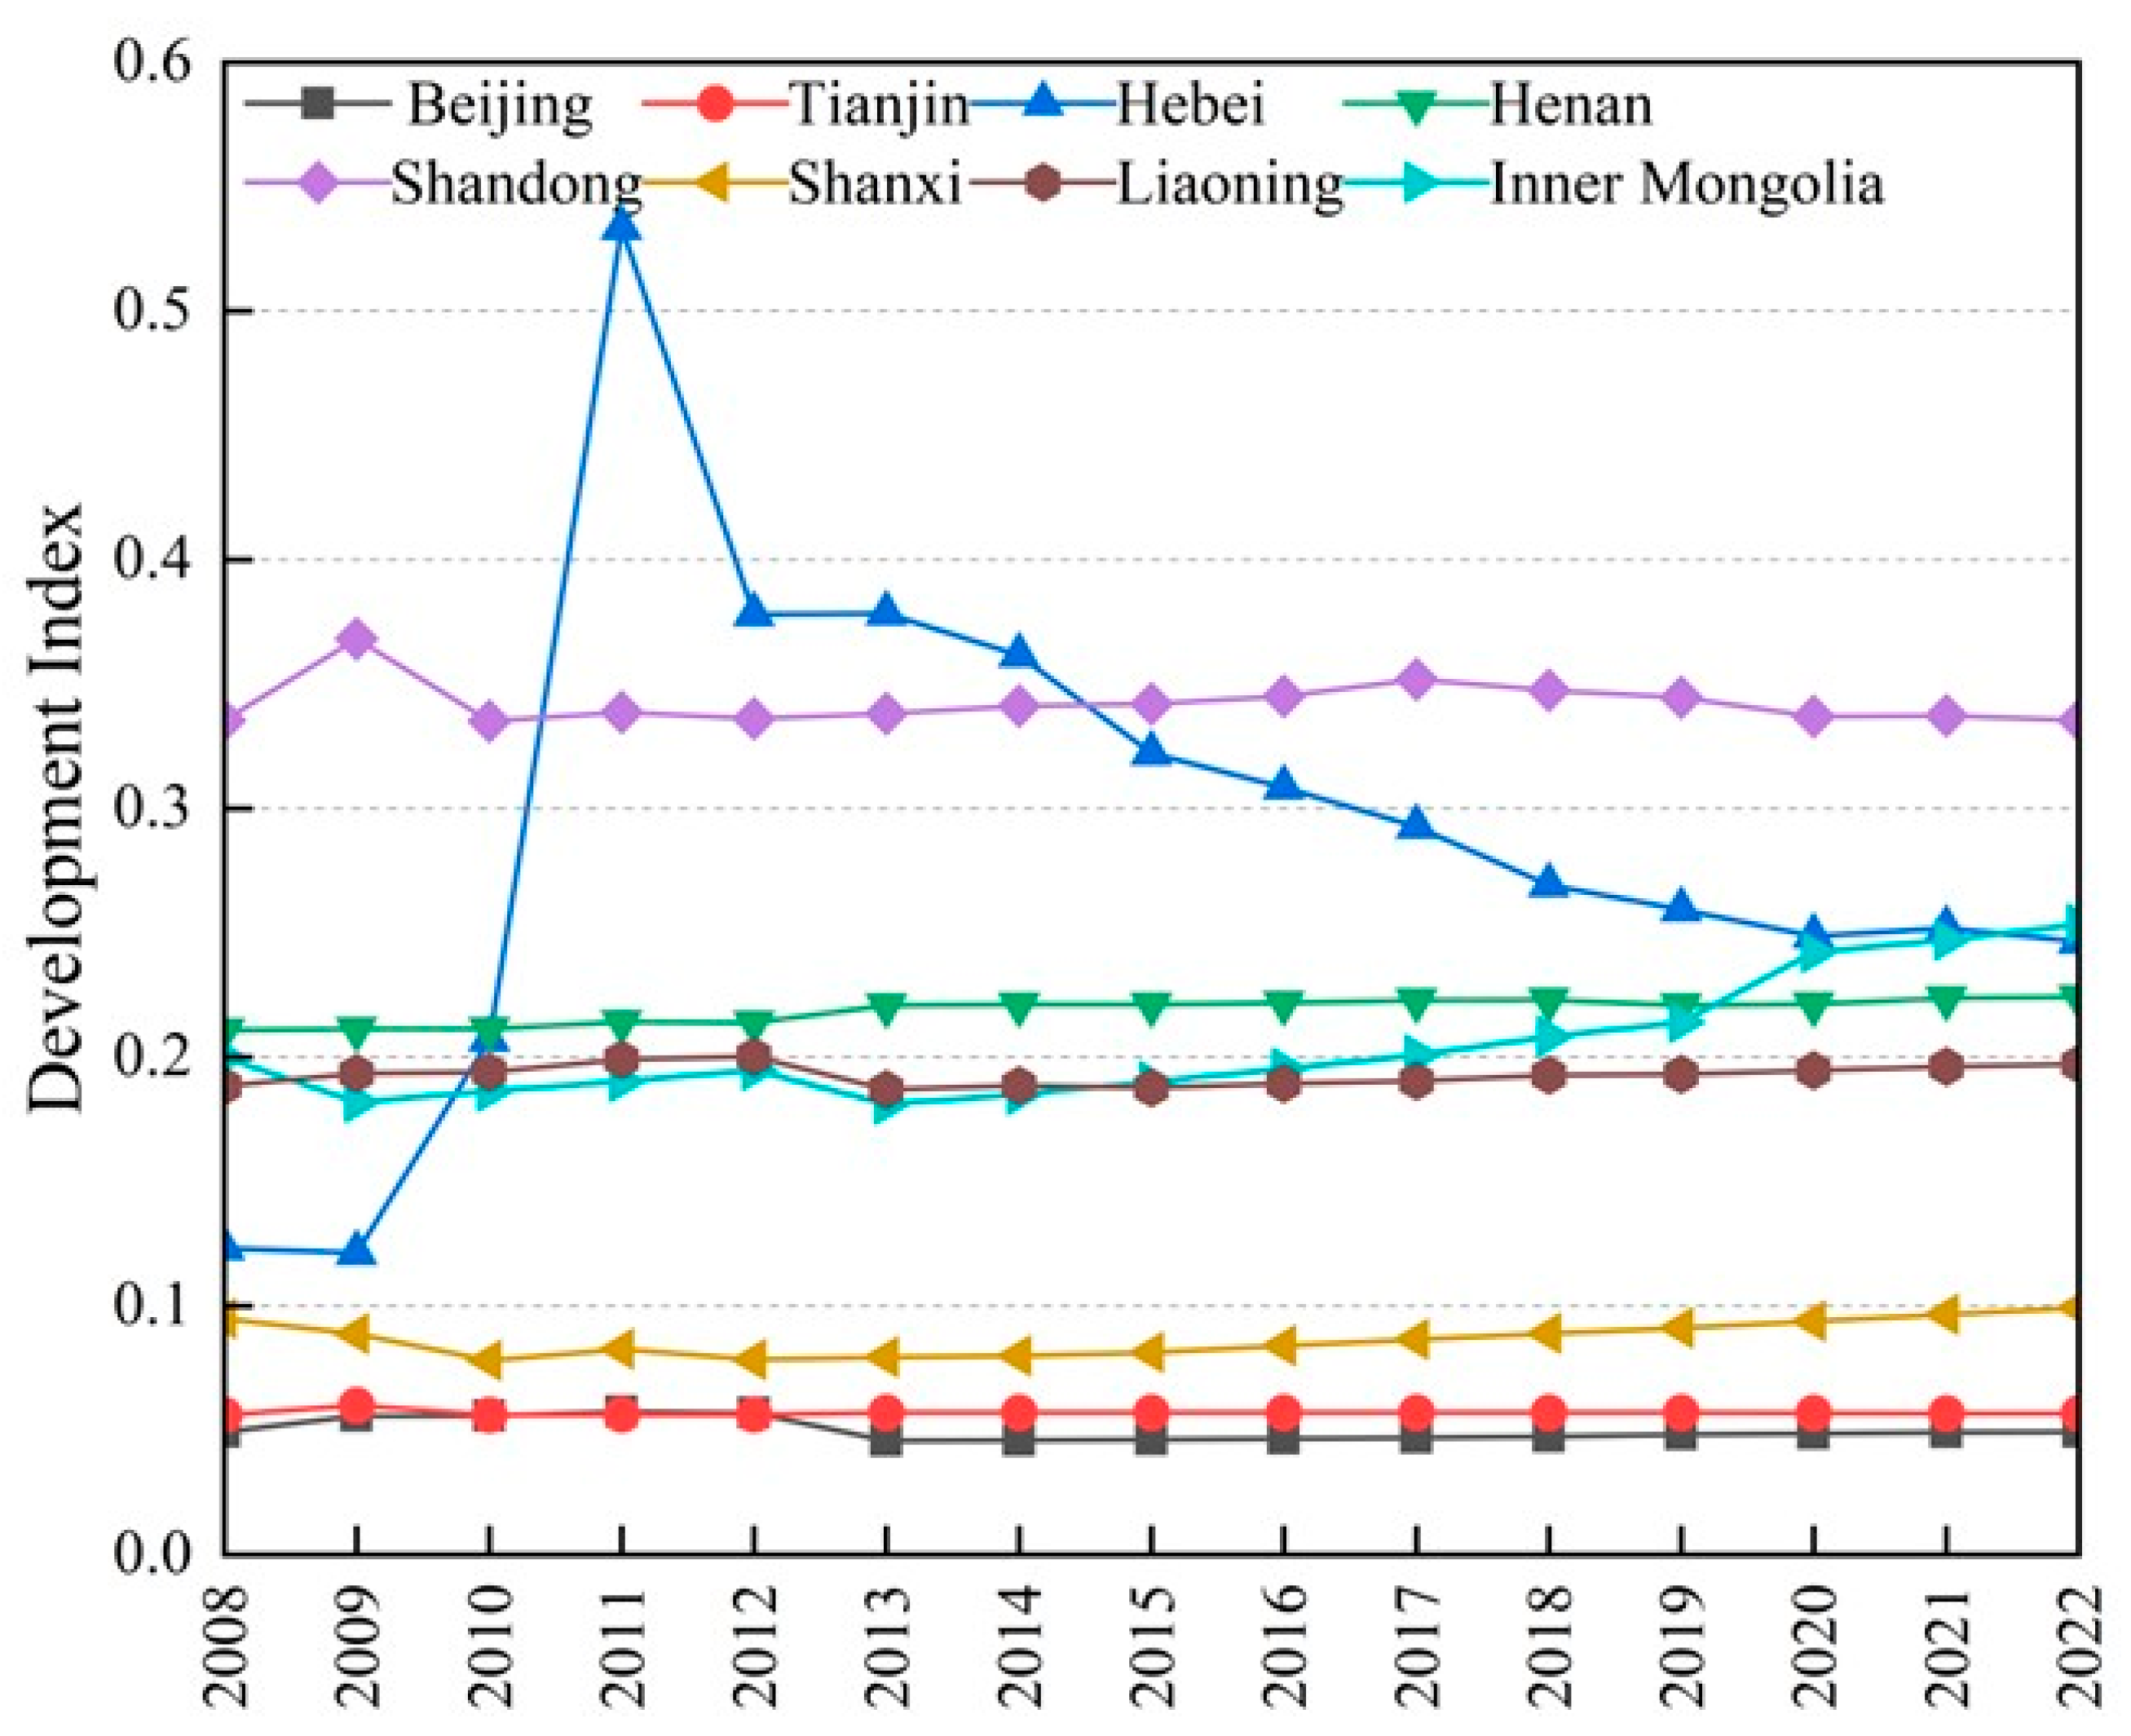
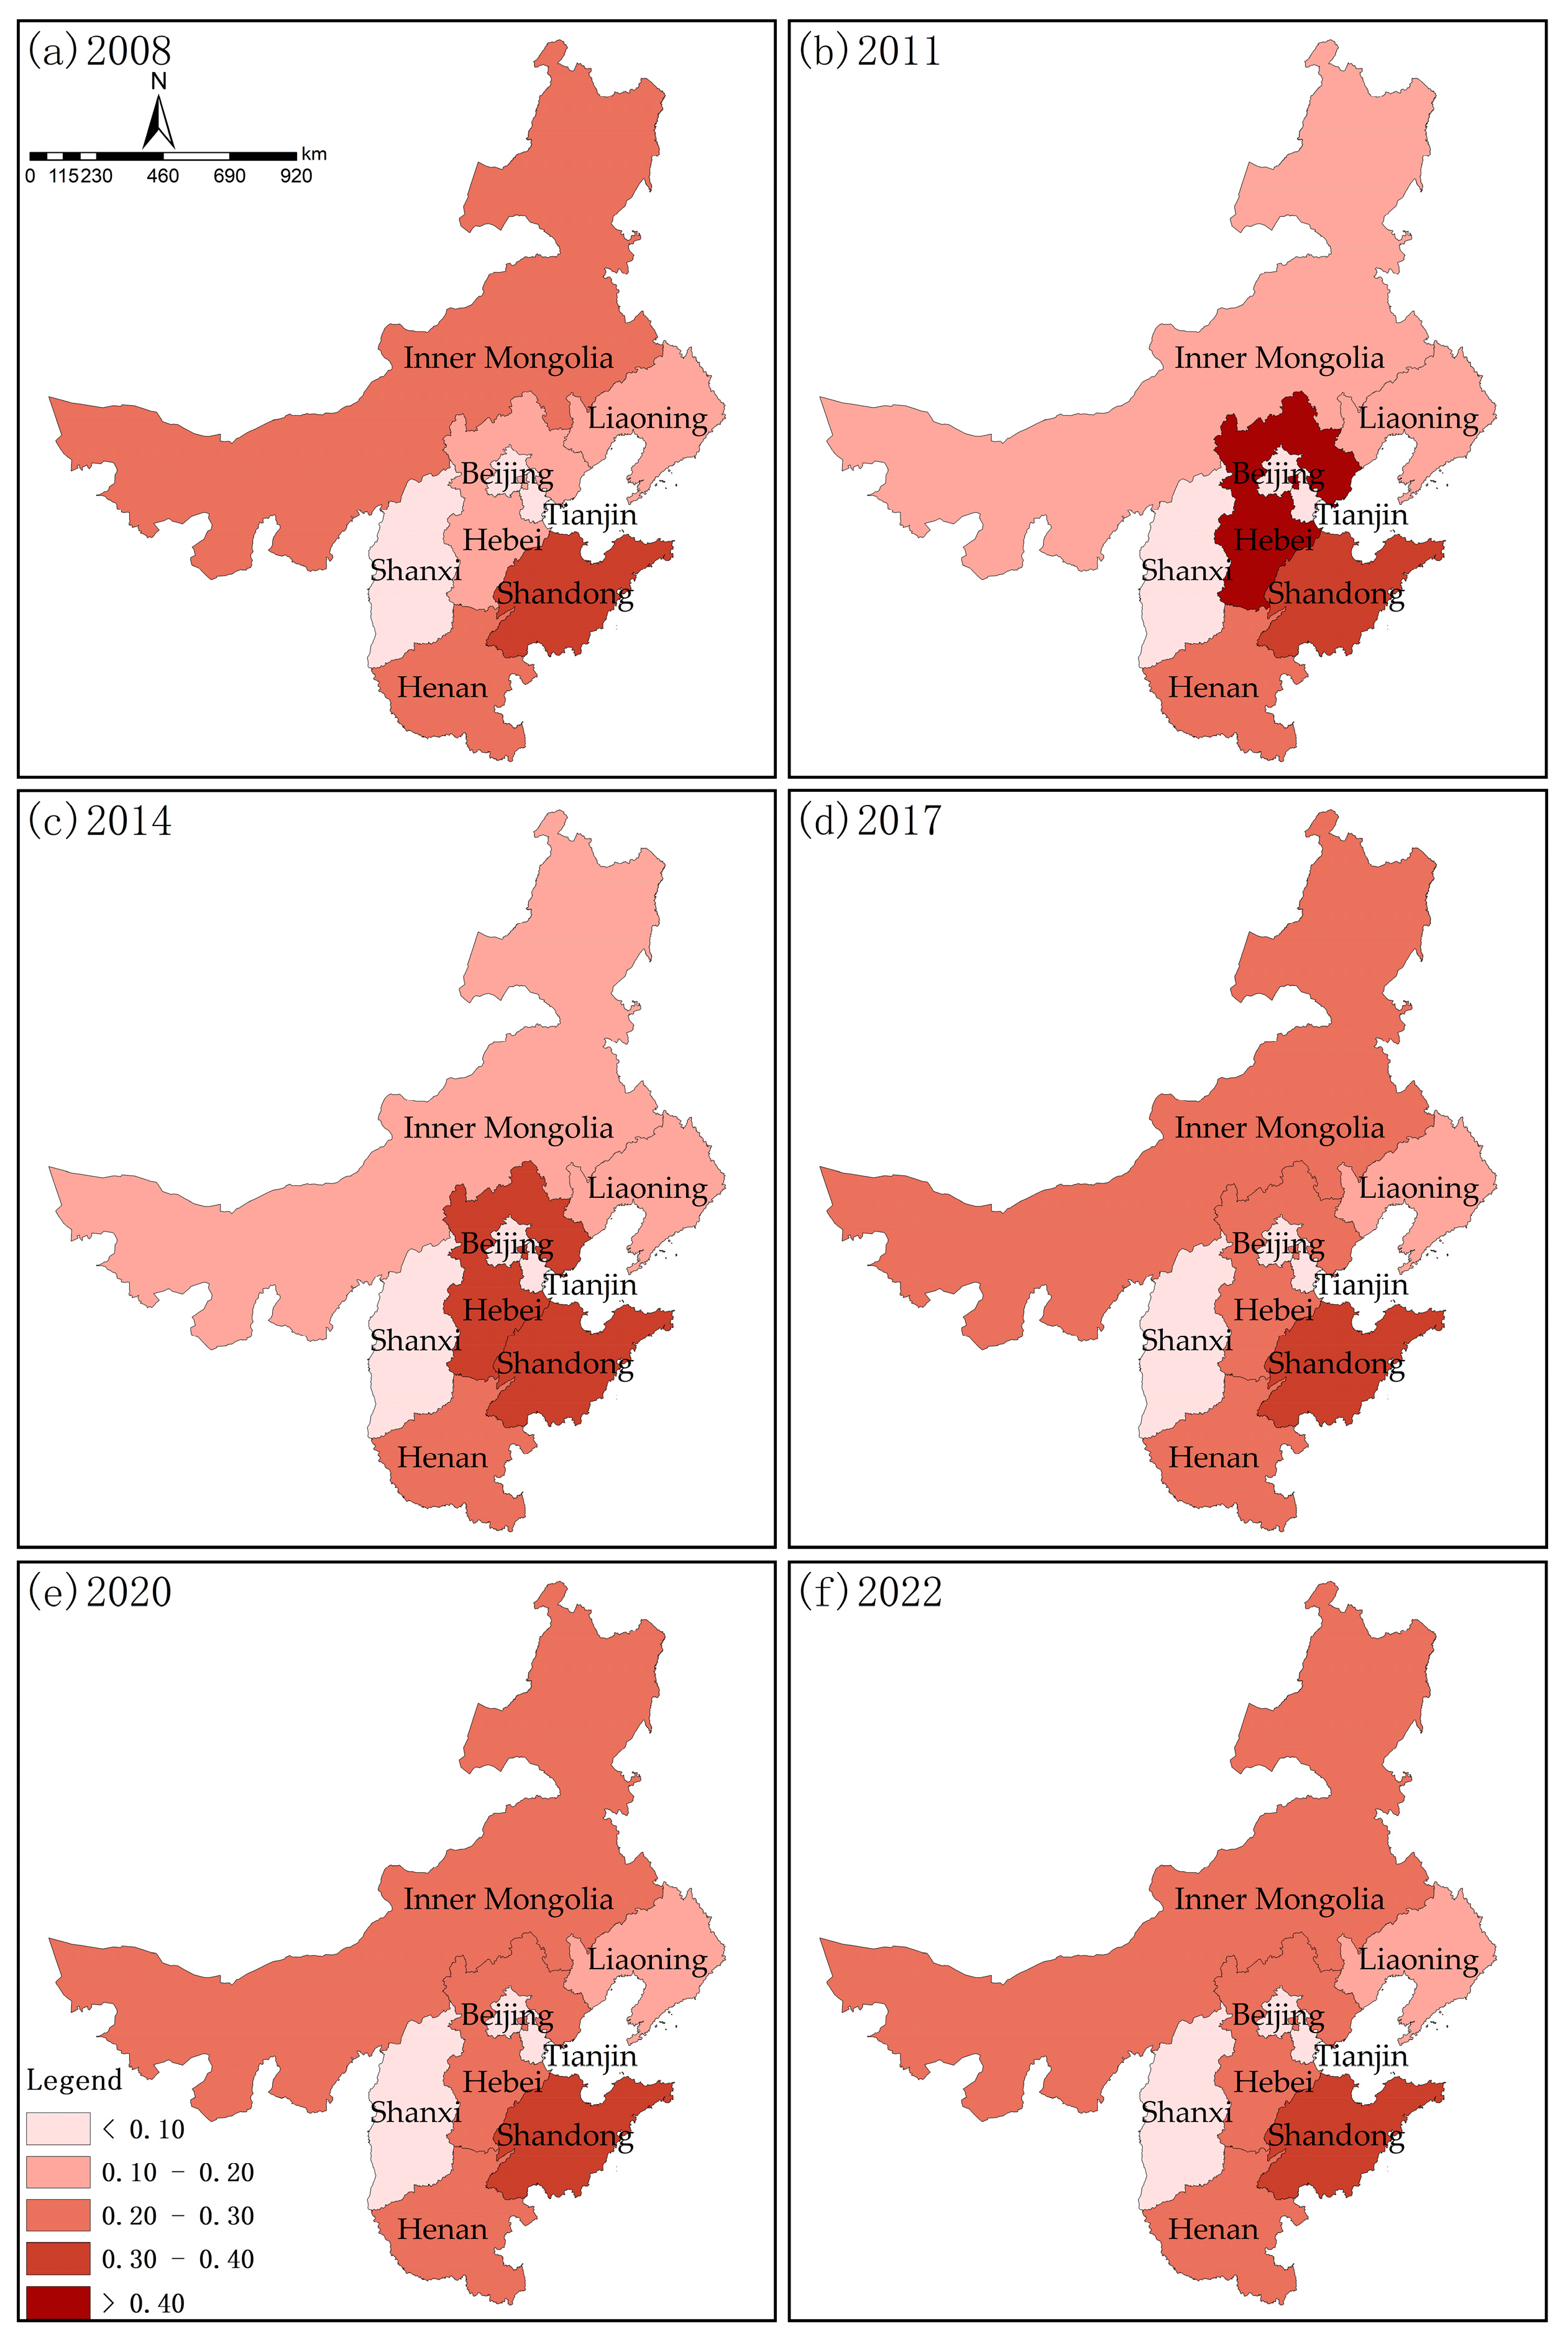
The evolution of the ecological subsystem reveals a complex story of both progress and challenge, characterized by distinct spatial patterns and temporal dynamics (
Figure 6 and
Figure 7).
Spatially, the ecological subsystem exhibits three broad trajectory types. First, Shandong stands out as a high-level trajectory, maintaining the highest ecological subsystem score for most of the study period despite some fluctuation after 2017. Second, Tianjin, Hebei, Henan, Liaoning and Beijing can be characterized as an intermediate and rising group, showing varying initial levels but an overall upward trend over time. Among them, Tianjin and Hebei experienced the most pronounced improvement in the later period, while Henan and Beijing showed steadier increases. Third, Inner Mongolia, and Shanxi form a lower-level and relatively stable group, with ecological subsystem scores remaining comparatively low and improving only gradually.
Temporally, the basin’s ecological health evolved through two phases: an initial period of steady improvement (2008–2013) driven by national mandates like the Beijing Olympics cleanup, followed by a period of volatile progress (2014–2022). This later period is particularly revealing. The overall upward trend confirms the effectiveness of sustained ecological protection efforts. However, the intermittent dips observed in some years (e.g., 2018 and 2021) suggest that ecological improvement was not strictly linear over time. One possible explanation is that periods of intensive environmental governance and industrial adjustment in the Beijing–Tianjin–Hebei region may have generated short-term disruptions that affected some ecological indicators. At the same time, this interpretation should be treated as a plausible hypothesis rather than a demonstrated causal attribution, since the composite index alone does not permit direct identification of the specific policy drivers behind year-to-year fluctuations. More generally, these temporary declines underscore the complexity of system-wide transformation and the possibility that ecological recovery may proceed unevenly in the short term.
4.1.3. Adaptive Lags of the FCS Subsystem
The evolution of the FCS subsystem reveals a critical challenge: while the evaluation index shows modest long-term growth, its significant volatility and downward shifts in certain years suggest that existing flood defense capabilities are being outpaced by the new risks created by rapid regional development (
Figure 8 and
Figure 9). A particularly notable feature is the sharp jump in Hebei’s FCS index between 2010 and 2011, followed by a gradual decline over the subsequent decade. Because Hebei occupies a large share of the basin area, this fluctuation also exerts a visible influence on the basin-wide FCS trajectory. To address this issue, we rechecked the original data and index calculation and found no obvious data-entry error. This jump may reflect concentrated changes in several infrastructure- and investment-related indicators during the early 12th Five-Year Plan period, but it may also partly reflect the sensitivity of the entropy-weighted composite index to a small number of highly variable indicators. Because province-level annual statistics do not allow us to fully distinguish between substantive capacity improvement and possible reporting discontinuities, this fluctuation should be interpreted with caution.
The system’s vulnerability is rooted in a combination of factors. First, inherent geographical and meteorological risks—such as the confluence of mountain ranges with plains and the seasonal overlap of torrential rains with river flood peaks—make areas like Beijing and Hebei perpetually susceptible to catastrophic flash floods. Second, these inherent risks are being dangerously amplified by high-speed development. Rapid urbanization has led to increased populations and high-value economic assets concentrated in historically flood-prone areas, dramatically raising the potential consequences of a flood event. In this context, greater attention should be paid to historical flood events and the delineation of previously affected areas, which provide important evidence for risk-informed land-use planning and development regulation [
42,
43]. Third, the infrastructure designed to mitigate these risks is aging and, in some cases, inadequate, such as the lagging development of crucial flood storage and detention zones.
The history of policy in this domain has been largely reactive. Key disaster events, most notably the Beijing “7.21” flash flood of 2012, have acted as powerful “trigger points,” catalyzing much-needed policy shifts towards more integrated solutions like the “Sponge City” concept. However, the overall instability of the index underscores that these reactive measures are struggling to keep up with the escalating risks.
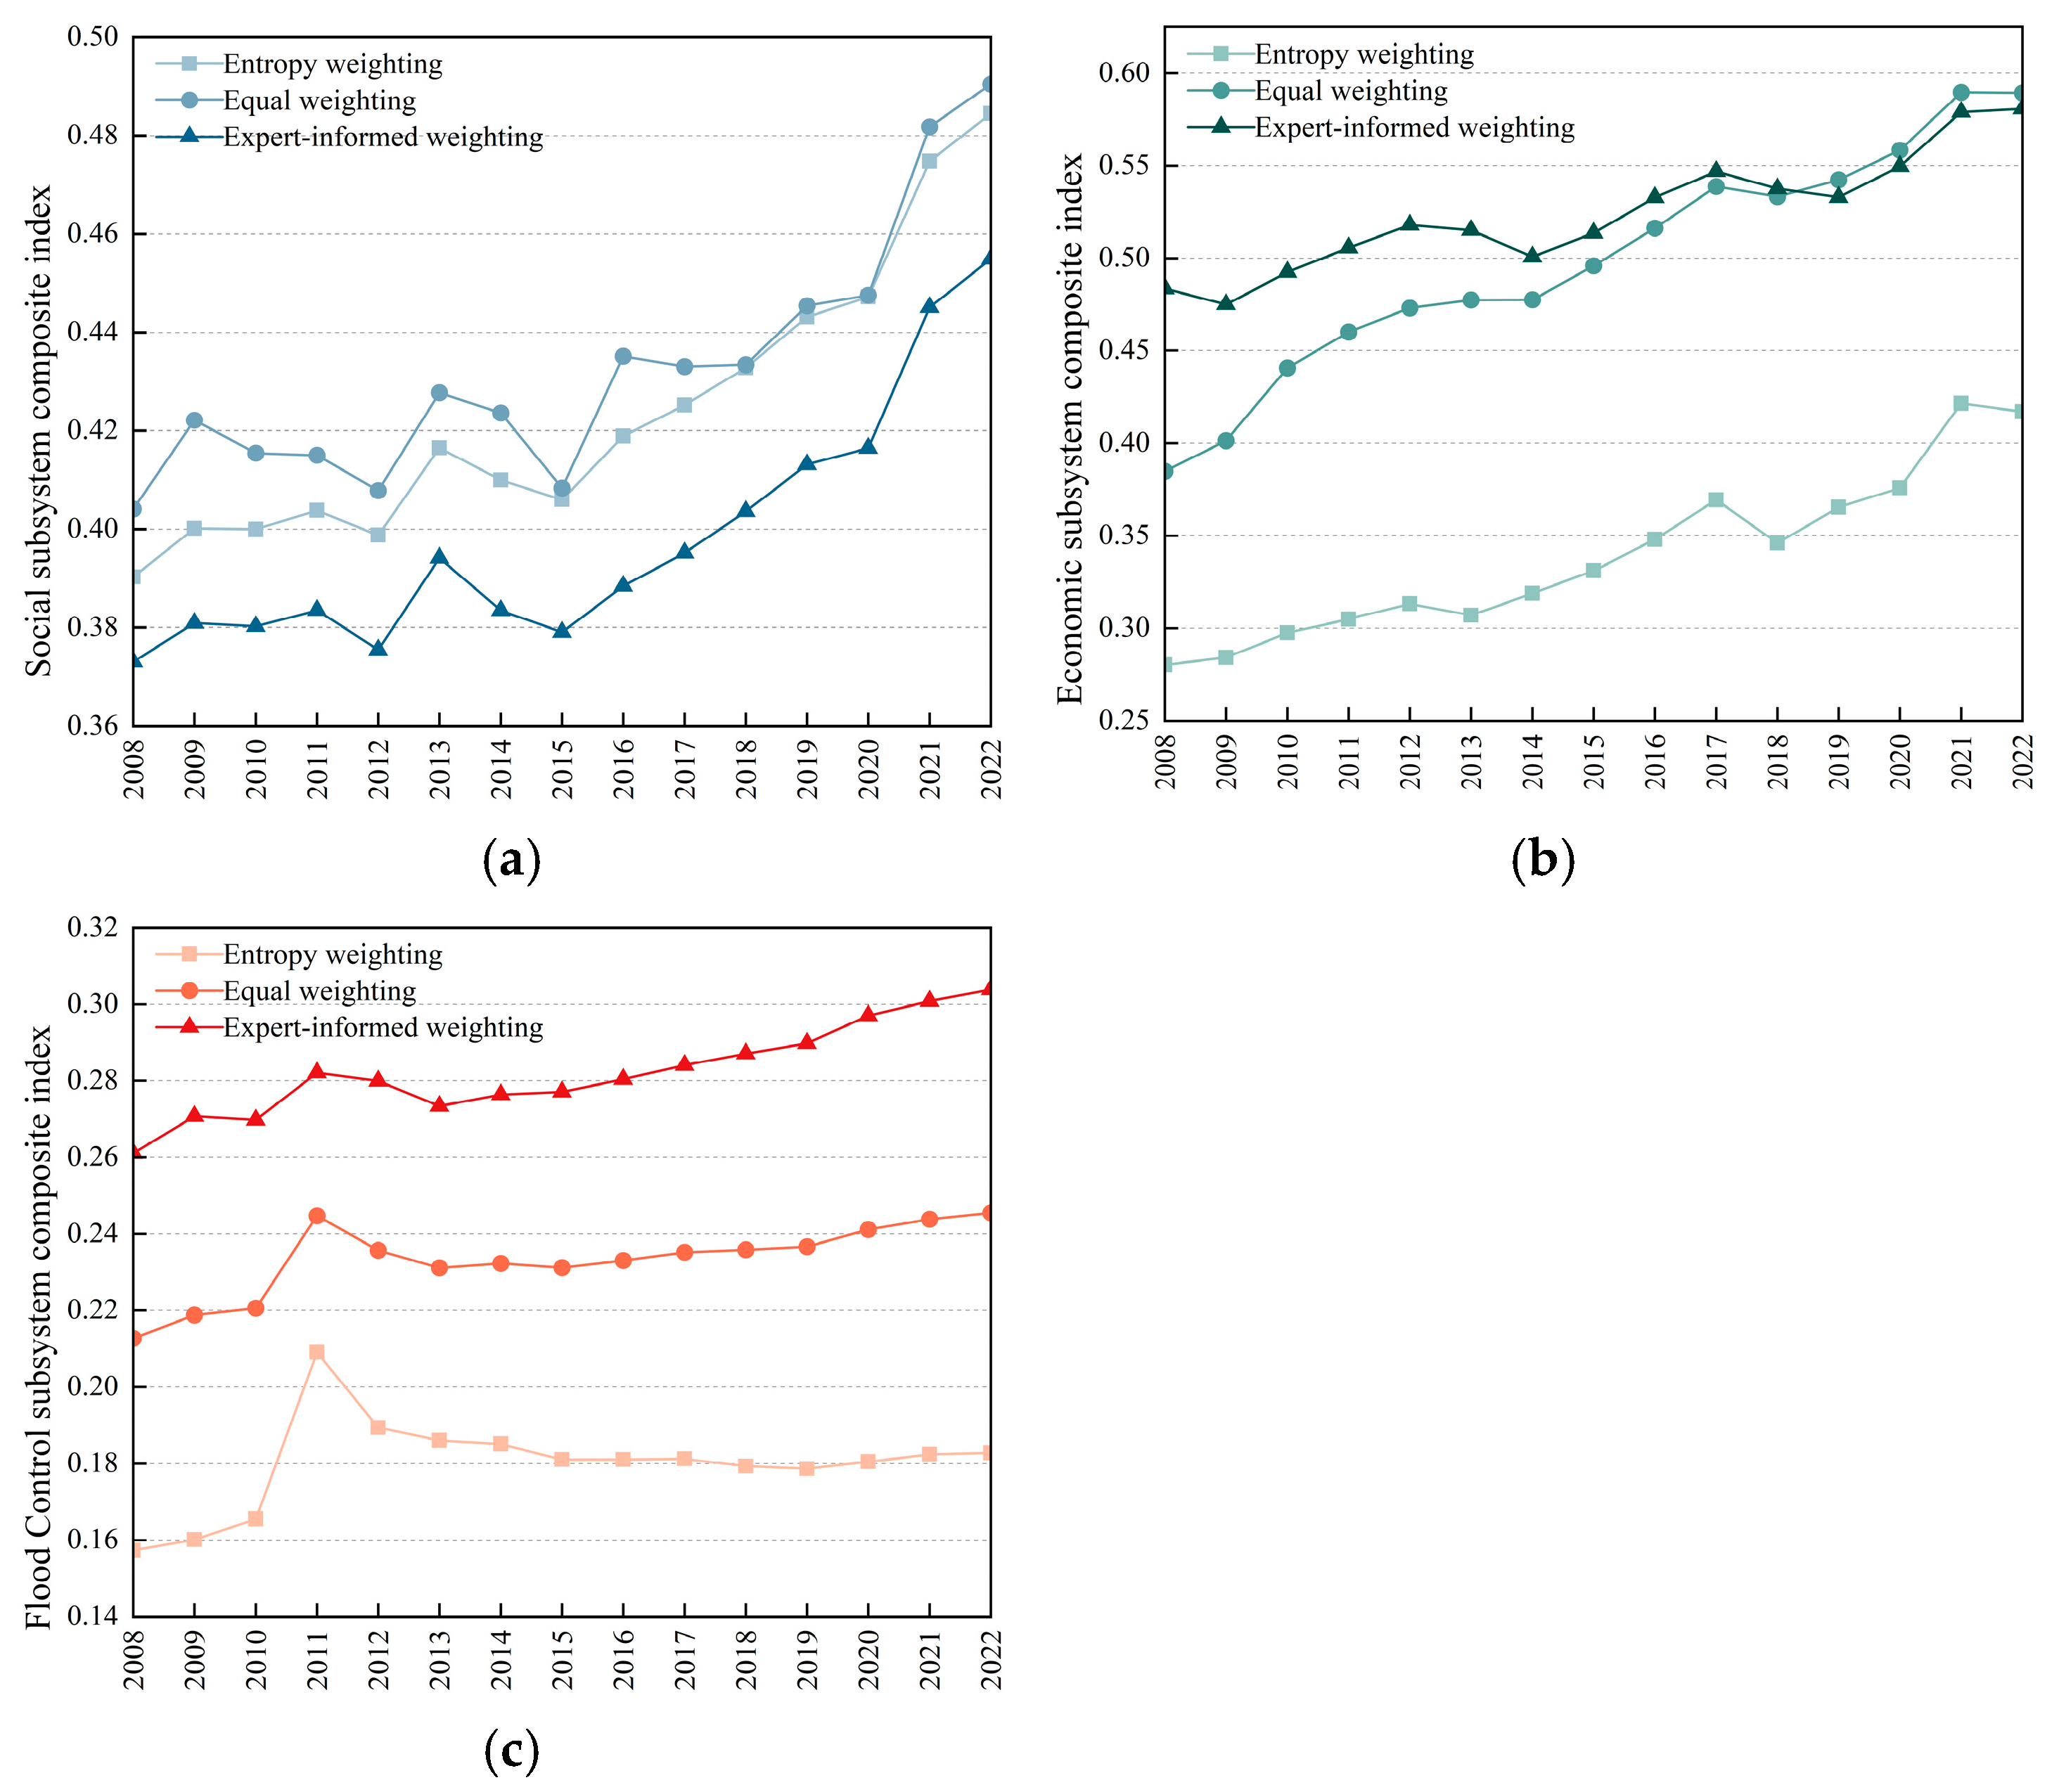
4.1.4. Sensitivity of Subsystem Development to Weighting Schemes
Given that the indicator system is constructed from provincial statistical data, it is necessary to examine whether the observed subsystem development patterns are sensitive to alternative weighting methods. To this end, this study compares the composite indices derived from three weighting schemes—entropy weighting, equal weighting, and expert-informed weighting. This comparison is conducted using the aggregated results for the eight provincial-level administrative units associated with the Haihe River Basin, rather than values calculated strictly within the basin’s hydrological boundary. The purpose of this exercise is to evaluate the robustness of the index construction method and to determine whether the main temporal patterns reported in this study depend materially on the weighting scheme adopted.
As shown in
Figure 10, the three weighting schemes produce highly similar temporal trajectories for all three subsystems. For the social subsystem (
Figure 10a), the composite index shows a generally upward trend throughout the study period under all three schemes. Although minor differences in absolute values can be observed in some years, the direction of change, fluctuation pattern, and major turning points remain broadly consistent. For the ecological subsystem (
Figure 10b), the trajectories under the three weighting schemes are also closely aligned, indicating that the measured evolution of ecological development is not strongly affected by moderate changes in indicator weights. For the FCS subsystem (
Figure 10c), the temporal patterns likewise remain similar across the three schemes, although some modest divergence appears in the earlier years, suggesting that the FCS subsystem is slightly more sensitive to alternative weighting assumptions than the social and ecological subsystems.
Overall,
Figure 10 indicates that the main developmental trajectories of the social, ecological, and FCS subsystems are robust to reasonable changes in weight assignment. The use of entropy weighting, equal weighting, or expert-informed weighting affects the absolute level of the composite indices only to a limited extent and does not materially alter the long-term trend, the relative temporal evolution, or the identification of major transition points. This suggests that the subsystem development patterns identified in this study primarily reflect underlying changes in regional social, ecological, and flood-control conditions, rather than artifacts introduced by a particular weighting approach. Nevertheless, the close correspondence among the results obtained under the three weighting schemes provides additional support for the reliability of the subsystem evaluation results used in the subsequent analysis.
4.2. Robustness, Decomposition, and Regional Heterogeneity of SES CCD
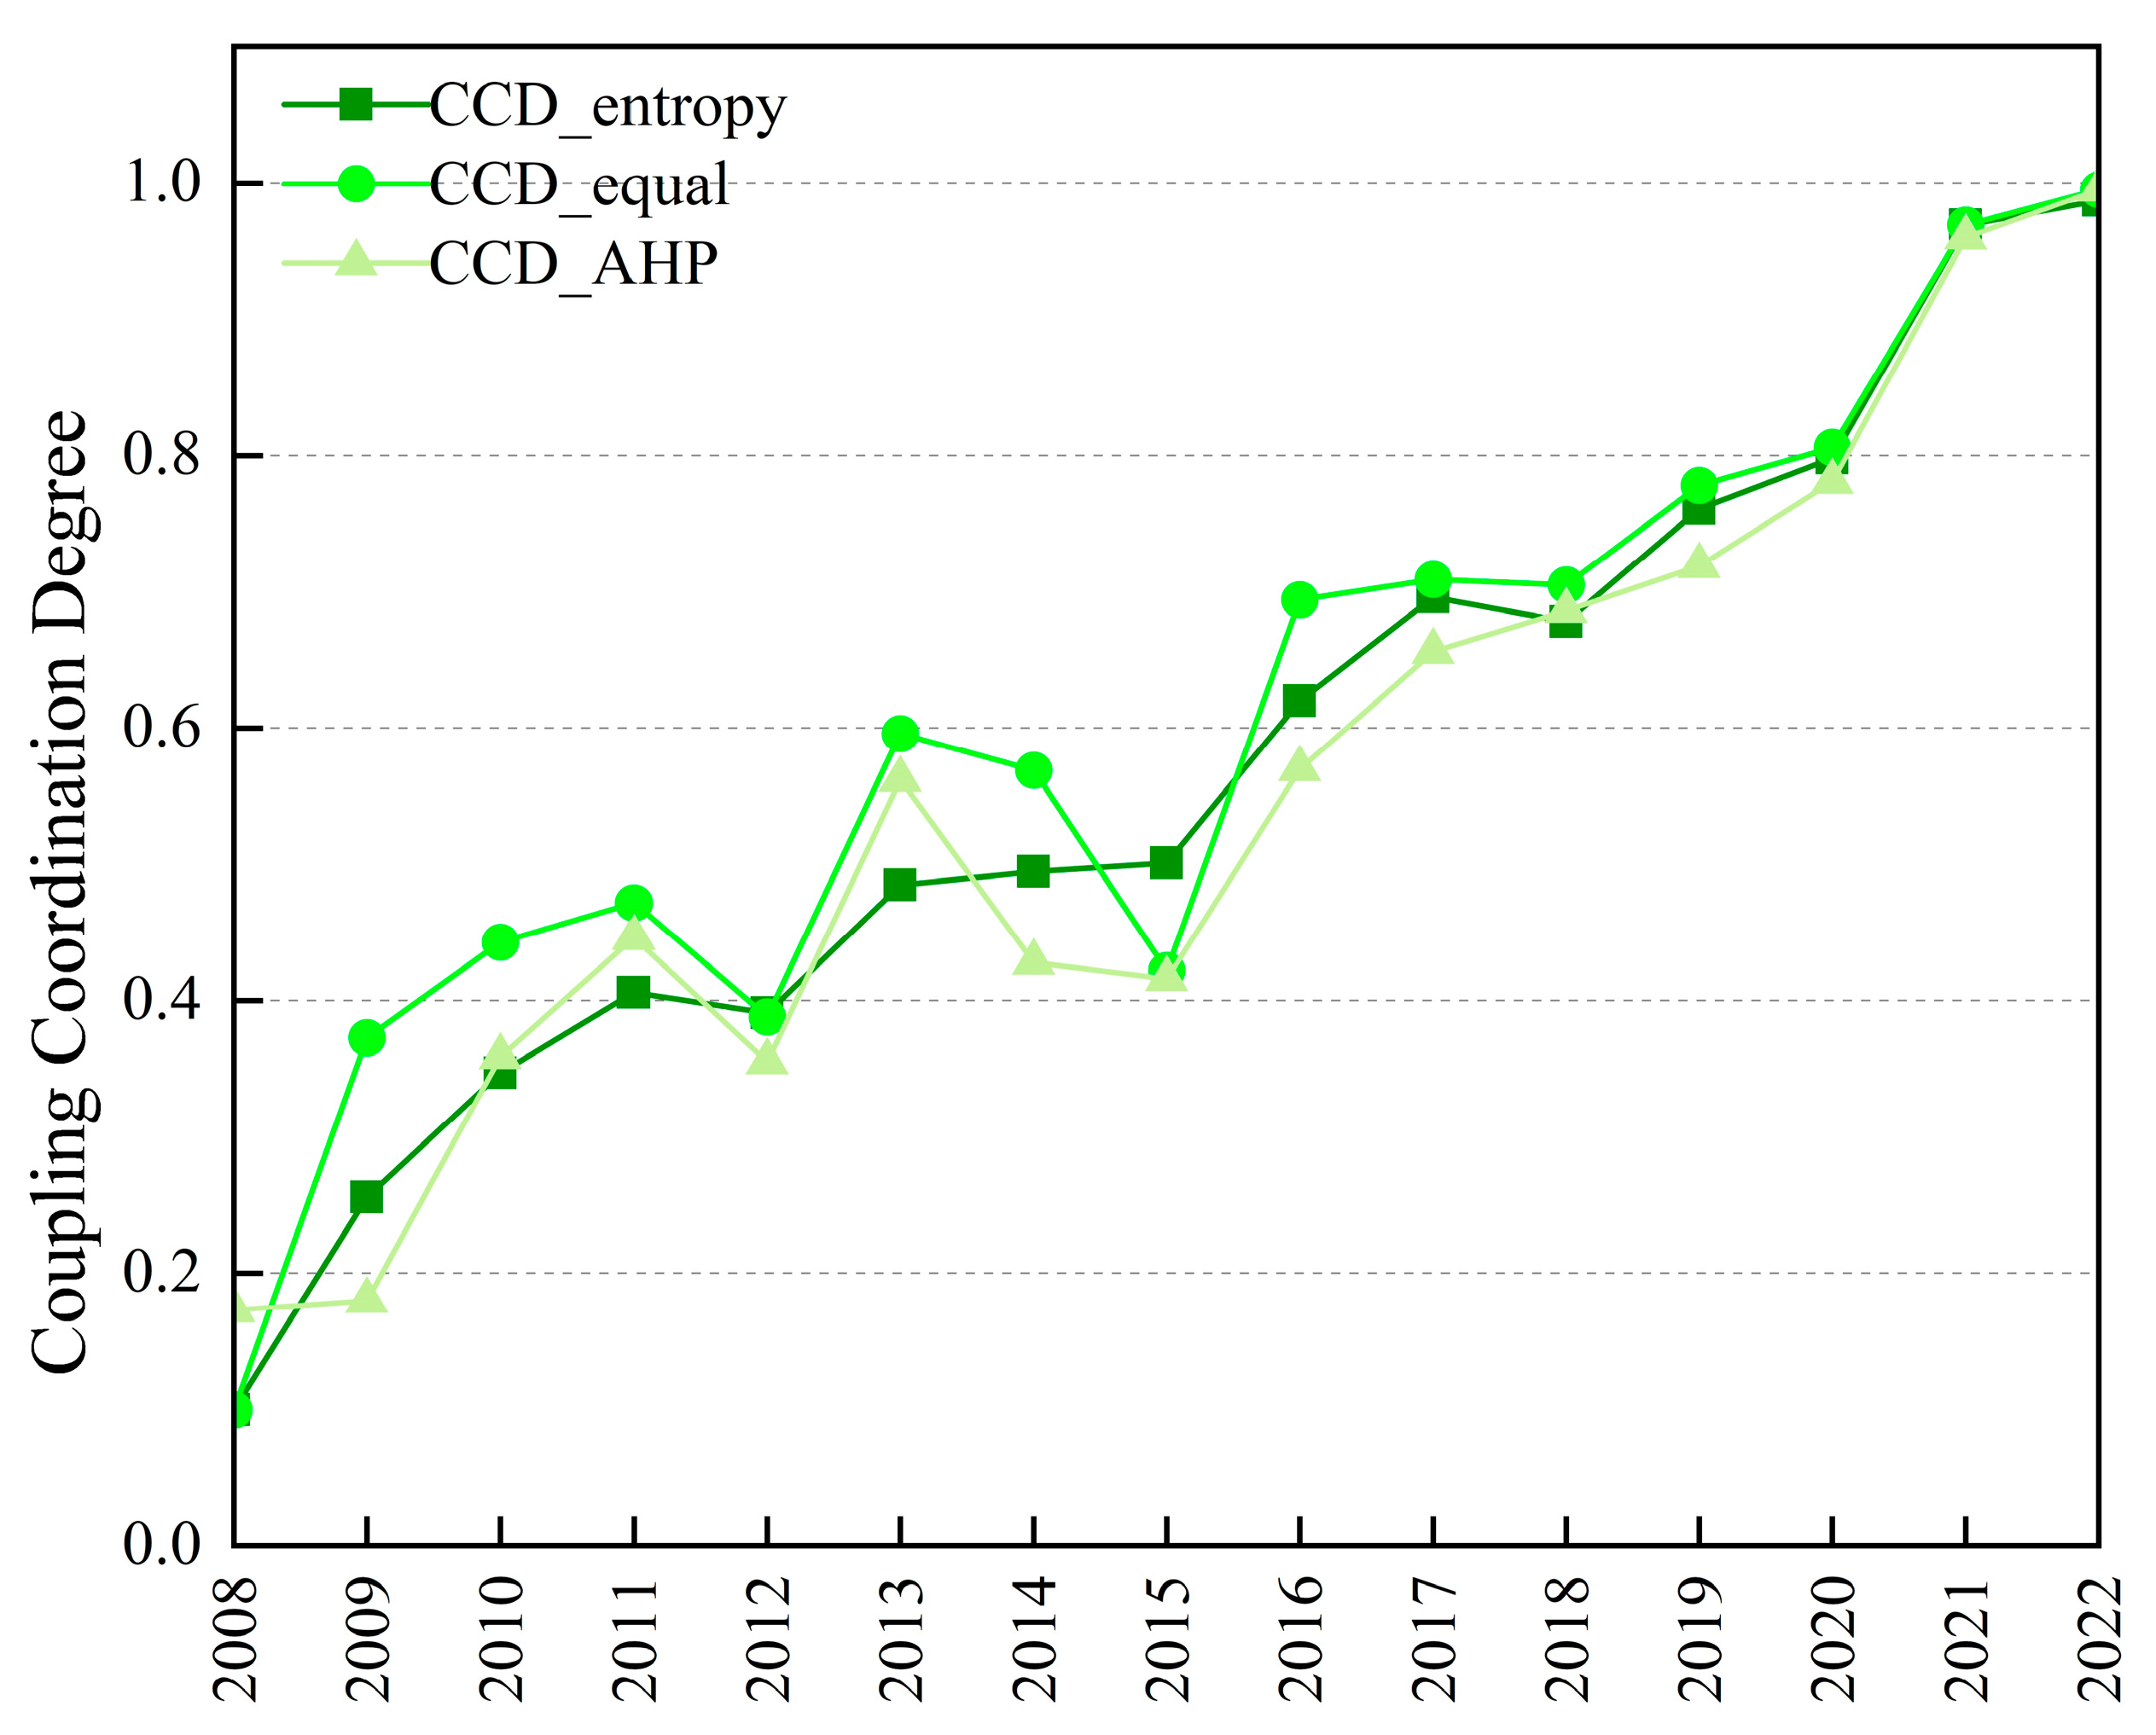
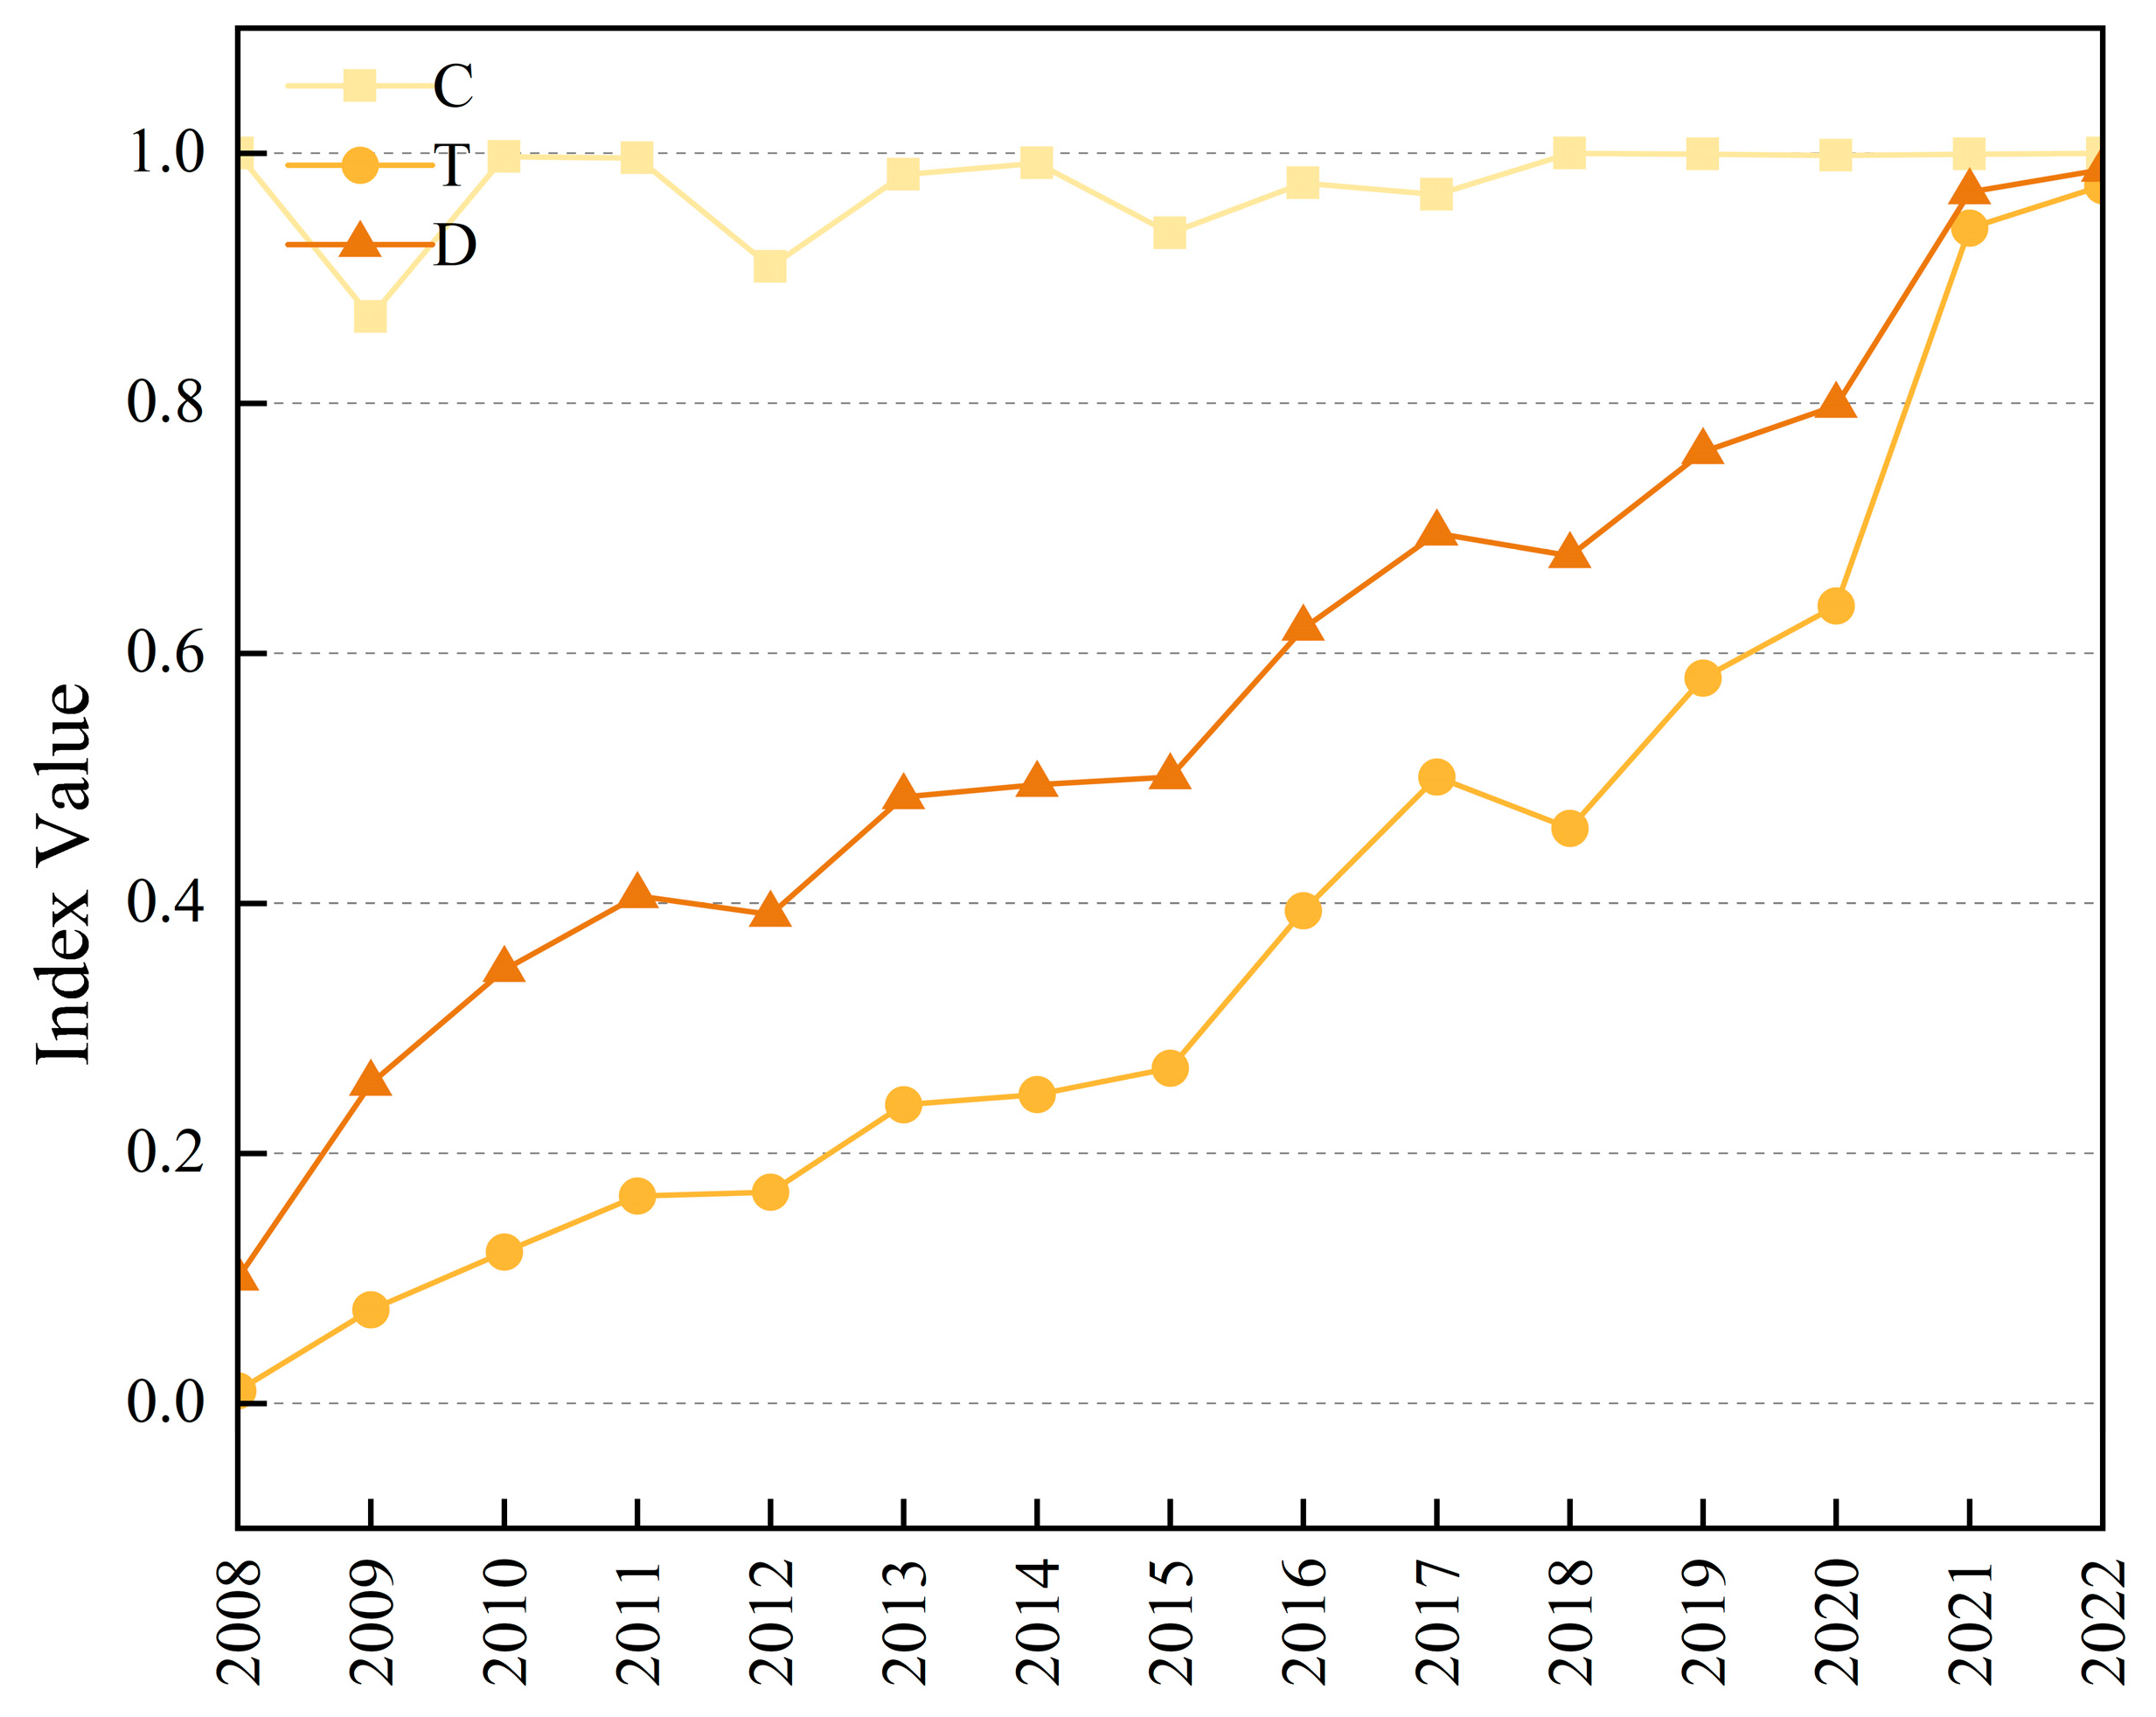
The Coupling Coordination Degree (CCD) of the social–ecological system shows a marked upward trajectory from 2008 to 2022 under all three weighting schemes, although the absolute values and timing of stage transitions differ somewhat across specifications (
Figure 11). Under the baseline entropy-weighted specification, the CCD rises from “severe imbalance” to a near-optimal level by 2022. However, the comparison across weighting schemes suggests that this near-maximal value should be interpreted cautiously, as part of the increase reflects both numerical convergence between subsystem indices and the sensitivity of composite scores to indicator weighting.
The weighting robustness analysis indicates that the general conclusion of improving social–ecological coordination is stable: regardless of whether entropy, equal, or expert-informed weights are used, the basin exhibits a clear departure from earlier states of severe imbalance. At the same time, the entropy-based specification yields the highest coordination values in the later years, especially when rapid improvement in a few highly variable ecological indicators drives convergence with the social subsystem. By contrast, the expert-informed weighting scheme produces a more moderate CCD trajectory, because ecologically foundational but less variable indicators retain greater influence in the subsystem evaluation. This comparison suggests that the precise level of coordination is method-sensitive even though the overall improving trend is robust.
Further insight is provided by decomposing the baseline CCD trajectory into its two components, the coupling degree (C) and the comprehensive coordination index (T) (
Figure 12). The results show that the temporal evolution of D is driven mainly by the sustained increase in T rather than by large variation in C. For most years, C remains at a high level and close to its theoretical upper bound, suggesting that the social and ecological subsystems were strongly linked in a numerical sense even when their overall development levels remained limited. By contrast, T increases much more gradually, especially after 2015, and this improvement in the joint development level of the two subsystems is the principal source of the rise in D. This decomposition clarifies that a high CCD value does not necessarily imply fully realized social–ecological synergy; rather, it may partly reflect persistently high coupling combined with progressive improvement in the composite development level. A notable inflection occurred around 2015, coinciding with the implementation of major national strategies, including supply-side structural reforms and the 13th Five-Year Plan. These policies accelerated ecological restoration from a low baseline. The rapid expansion of the Ecological Subsystem Index and its convergence with the more gradually rising Social Subsystem Index helped maintain C near its upper bound, while also raising T through improvement in the joint development level of the two subsystems. This issue is particularly important under entropy weighting, where a small number of highly variable ecological indicators receive dominant weights and may accelerate apparent convergence between the social and ecological subsystem indices.
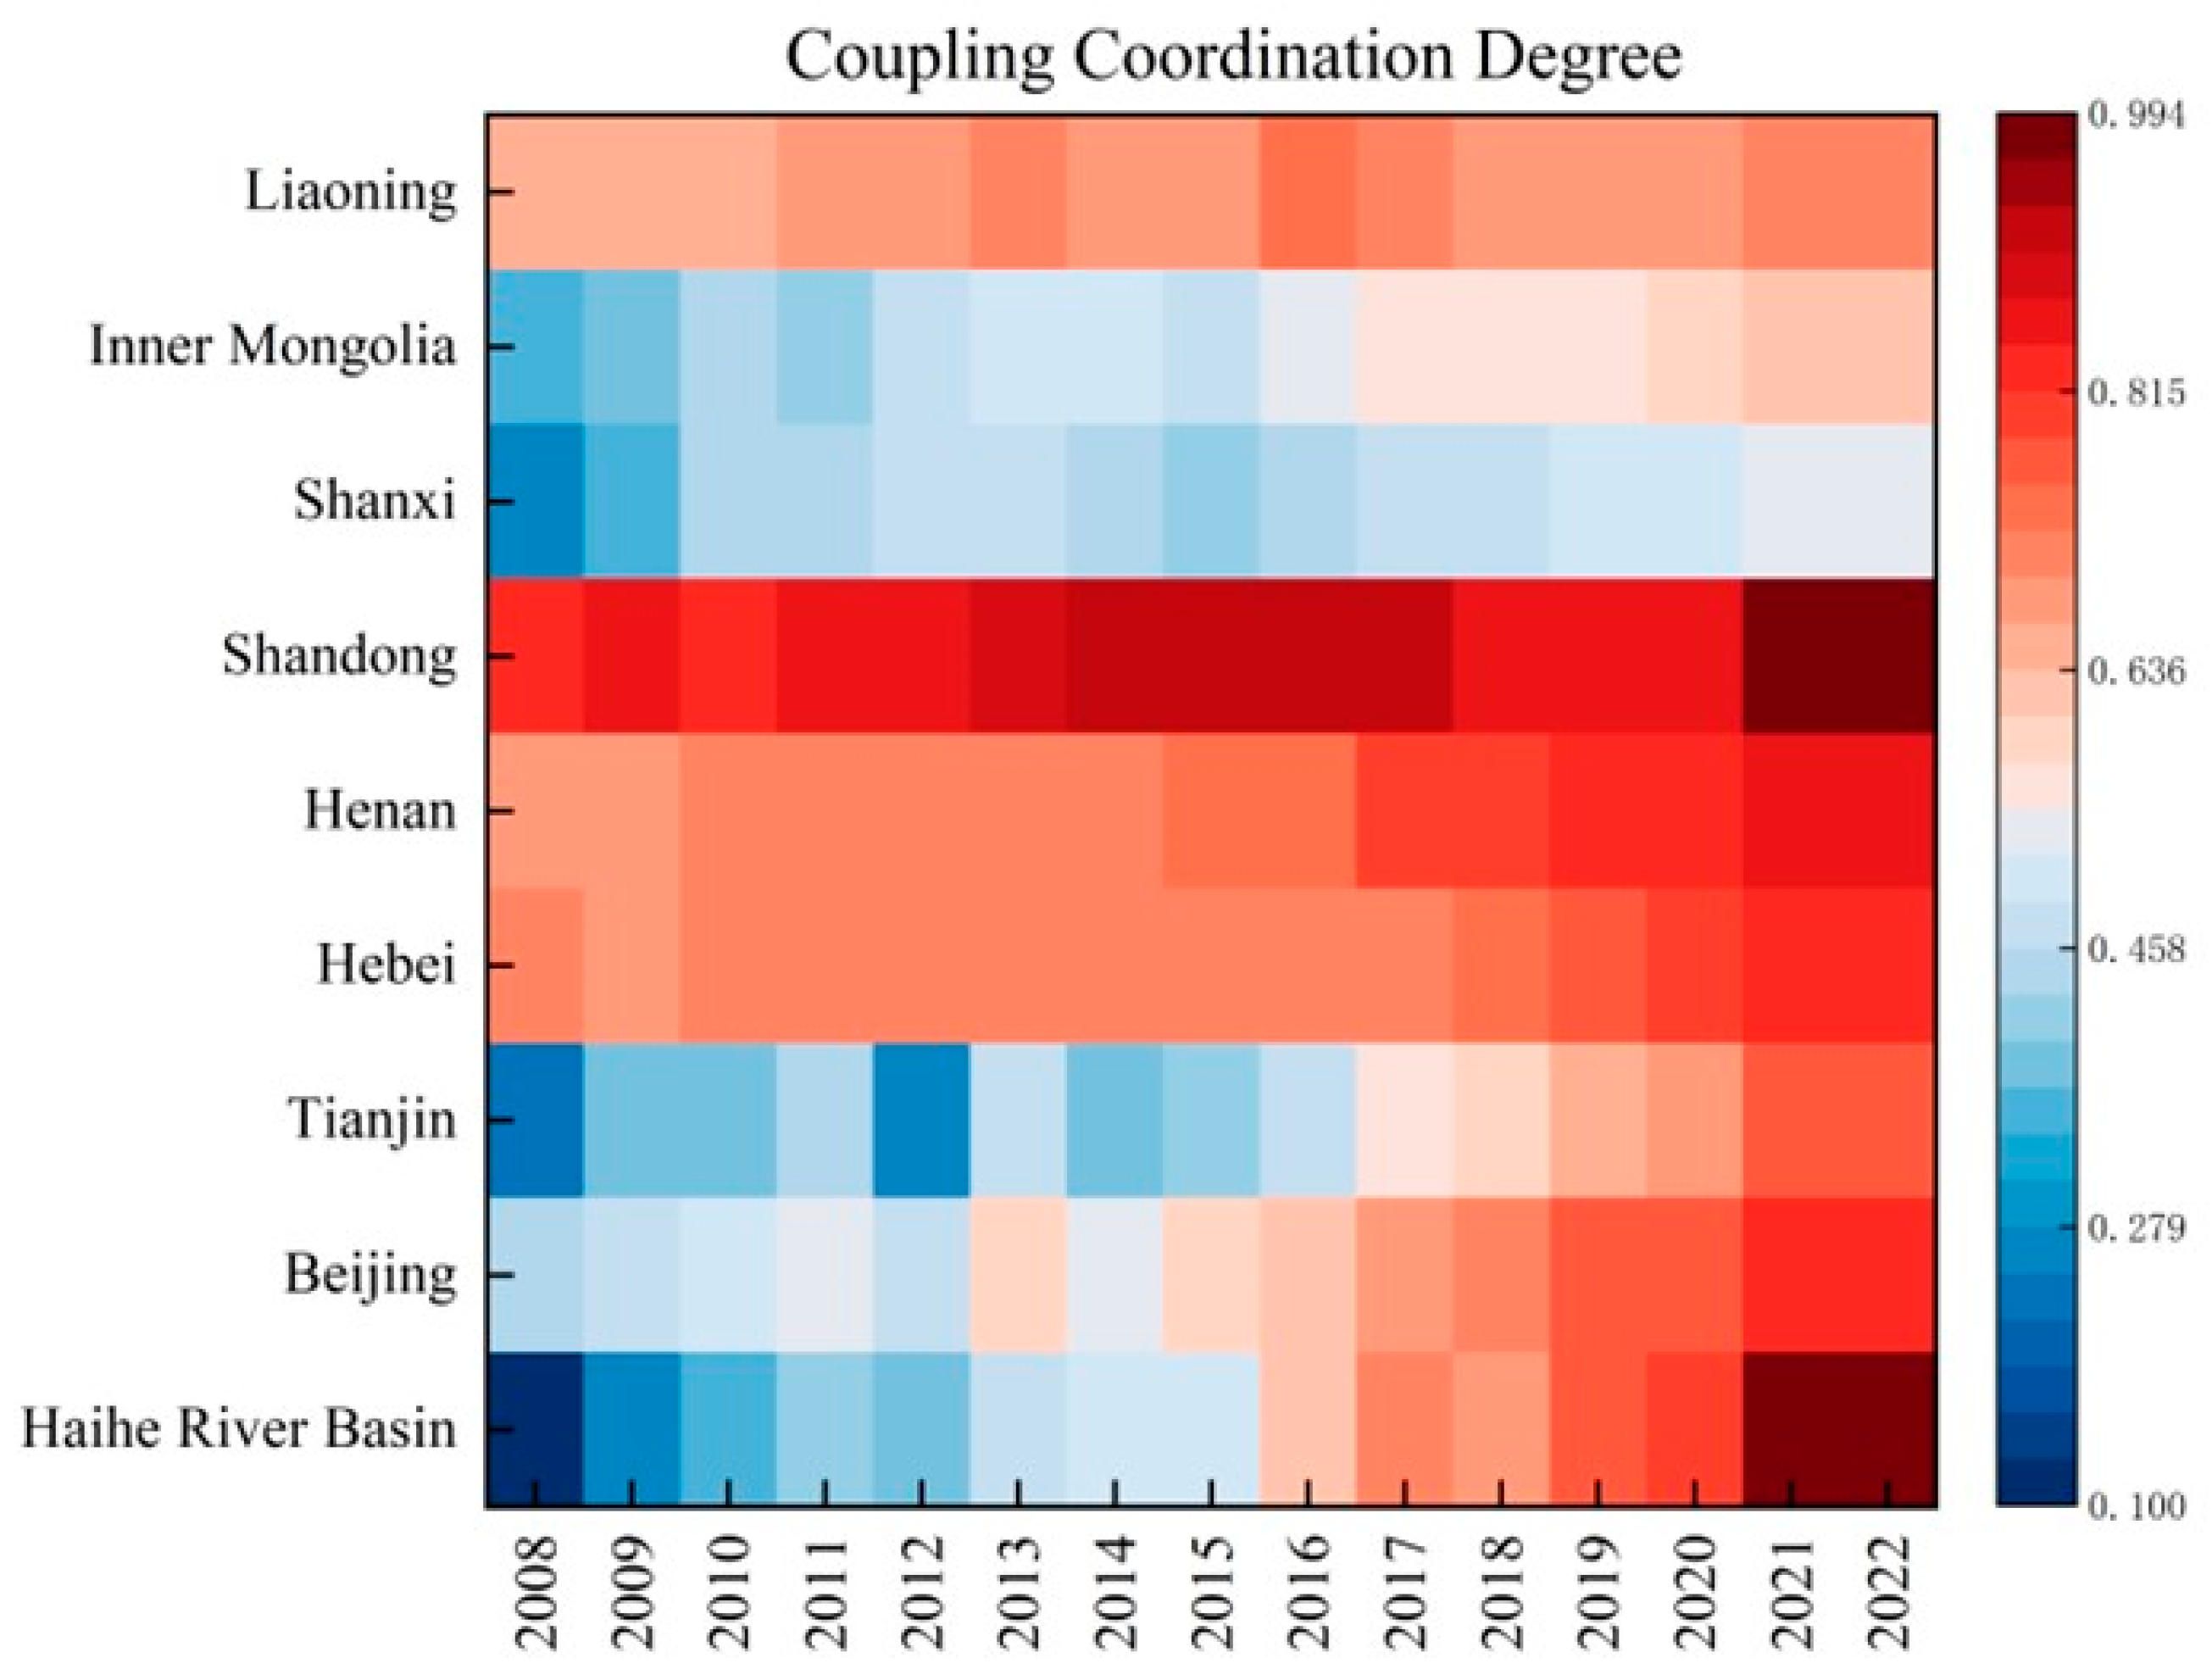
As shown in
Figure 13, spatial disparities further highlight this issue. Shandong exhibits relatively stable and balanced progress, suggesting more effective alignment of economic diversification with ecological protection. In contrast, Beijing and Tianjin show pronounced fluctuations, reflecting the tension between urban expansion and limited ecological capacity. Shanxi and Inner Mongolia remain constrained by coal-dependent economic structures, leading to unstable CCD values and persistent trade-offs. For these regions, the basin-wide CCD score provides a misleading impression of coordination.
In summary, while the CCD index signals a departure from historically unsustainable trajectories, it does not necessarily indicate that durable and equitable coordination has been achieved. Policy and planning efforts should therefore prioritize addressing entrenched structural conflicts at the regional scale, ensuring that composite indicators are complemented by more nuanced, disaggregated evaluations.
4.3. Dynamic Relationships and Driving Mechanisms Between FCS and SES CCD
4.3.1. Dynamic Interactions Between FCS and SES CCD
To avoid the phenomenon of spurious regression in panel data, it is necessary to perform a unit root test. To eliminate the effects of heteroscedasticity, the variables were log-transformed and denoted as ln D and ln FCS, where D represents the CCD of the social–ecological system, and FCS denotes the comprehensive development level of FCS. As non-stationary panel data cannot be directly used for model construction, processing such as logarithmic transformation and first-order differencing is required. Therefore, the Im–Pesaran–Shin (IPS) test was applied to examine the stationarity of the ln D and ln FCS series. The test results show that the original time series both pass the critical value test at the 1% significance level, indicating that both ln D and ln FCS are stationary time series (
Table 4). Based on a comprehensive evaluation using the Akaike Information Criterion (AIC), Schwarz Information Criterion (BIC), and Hannan–Quinn (HQIC) information criterion, the optimal lag order for the model was determined to be 5 (
Table 5).
- 2.
Granger Causality Test:
The Granger causality test was conducted to examine the predictive relationship between ln D and ln FCS. The results show that the
p-value for the null hypothesis “ln FCS does not Granger cause ln D” is 0.000 (
Table 6), which is statistically significant at the 1% level. Therefore, we reject the null hypothesis, indicating that past values of ln FCS provide statistically significant predictive information for ln D within the model specification. On the other hand, the reverse hypothesis “ln D does not Granger cause ln FCS” has a
p-value of 0.692, which is not statistically significant, meaning we fail to reject the null hypothesis for this direction. This suggests that while FCS has a predictive relationship with SES coordination, the reverse relationship is weak and does not show significant causality at the 1% level.
It is important to note that while FCS demonstrates a strong predictive precedence over SES coordination (ln D), the test results in the reverse direction (ln D to ln FCS) are not statistically significant. Therefore, the findings should be interpreted as indicating Granger-causal precedence from FCS to SES coordination, with no statistically significant evidence of reverse predictive precedence in the current specification.
It is important to highlight that the Granger causality test demonstrates a strong predictive relationship from FCS to SES coordination (ln D), but fails to show statistical significance for the reverse direction. The reverse hypothesis “ln D does not Granger cause ln FCS” has a p-value of 0.692, indicating a lack of predictive precedence in that direction. Given the small sample size (n = 15), the results should be interpreted with caution, and the predictive relationship observed should be understood as directional, with stronger predictive precedence from ln FCS to ln D than in the reverse direction.
- 3.
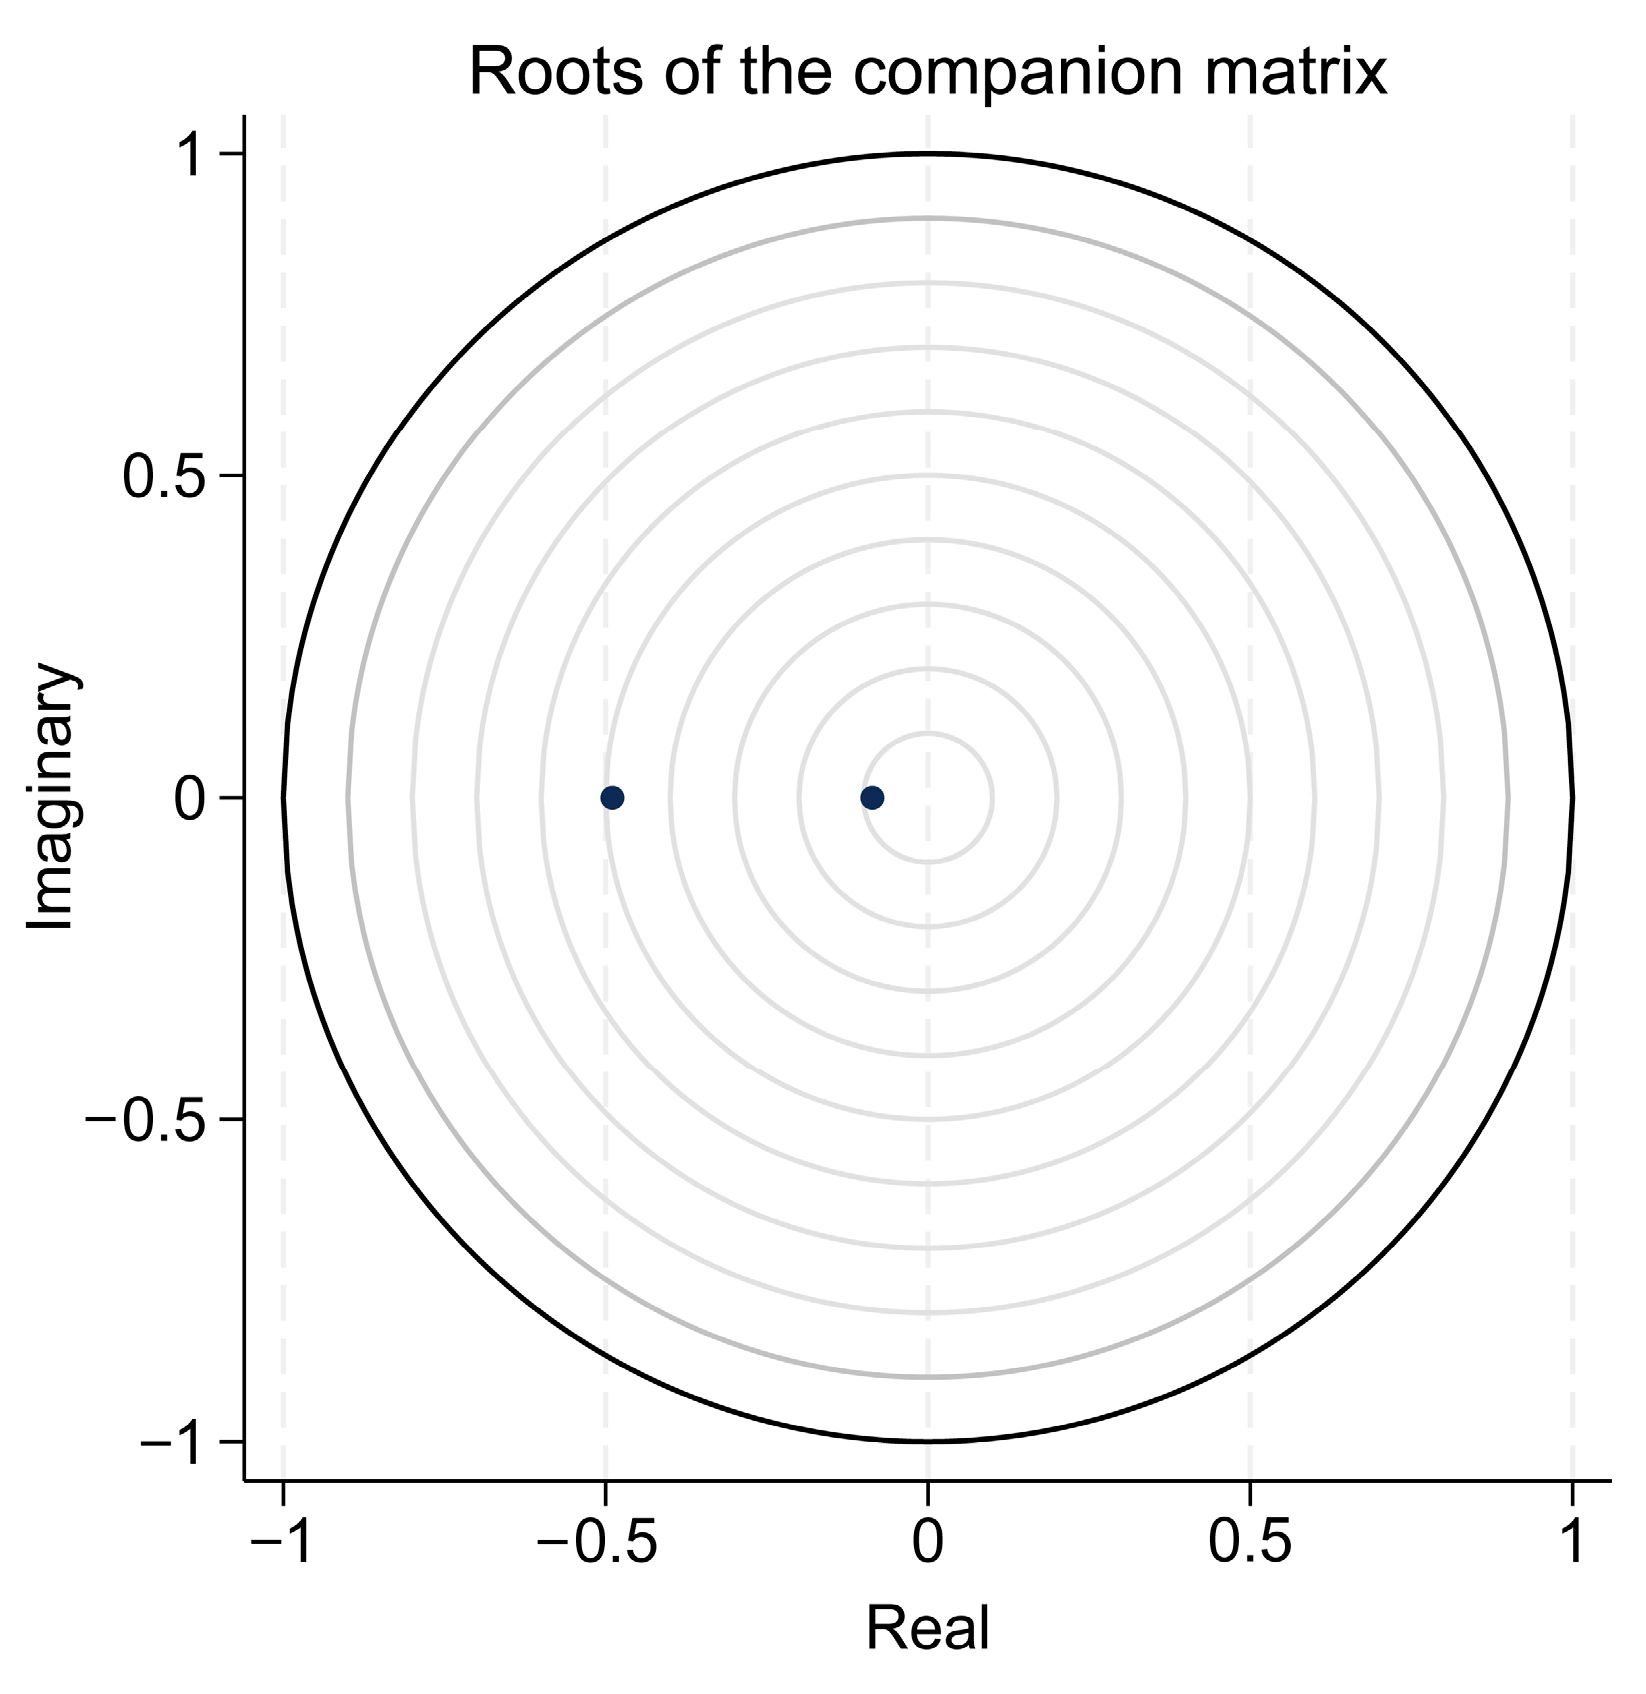
Model Stability Test:
Before performing impulse response analysis and variance decomposition, it is necessary to test whether the model satisfies the stability condition. All characteristic roots of PVAR model lie strictly inside the unit (
Figure 14).
- 4.
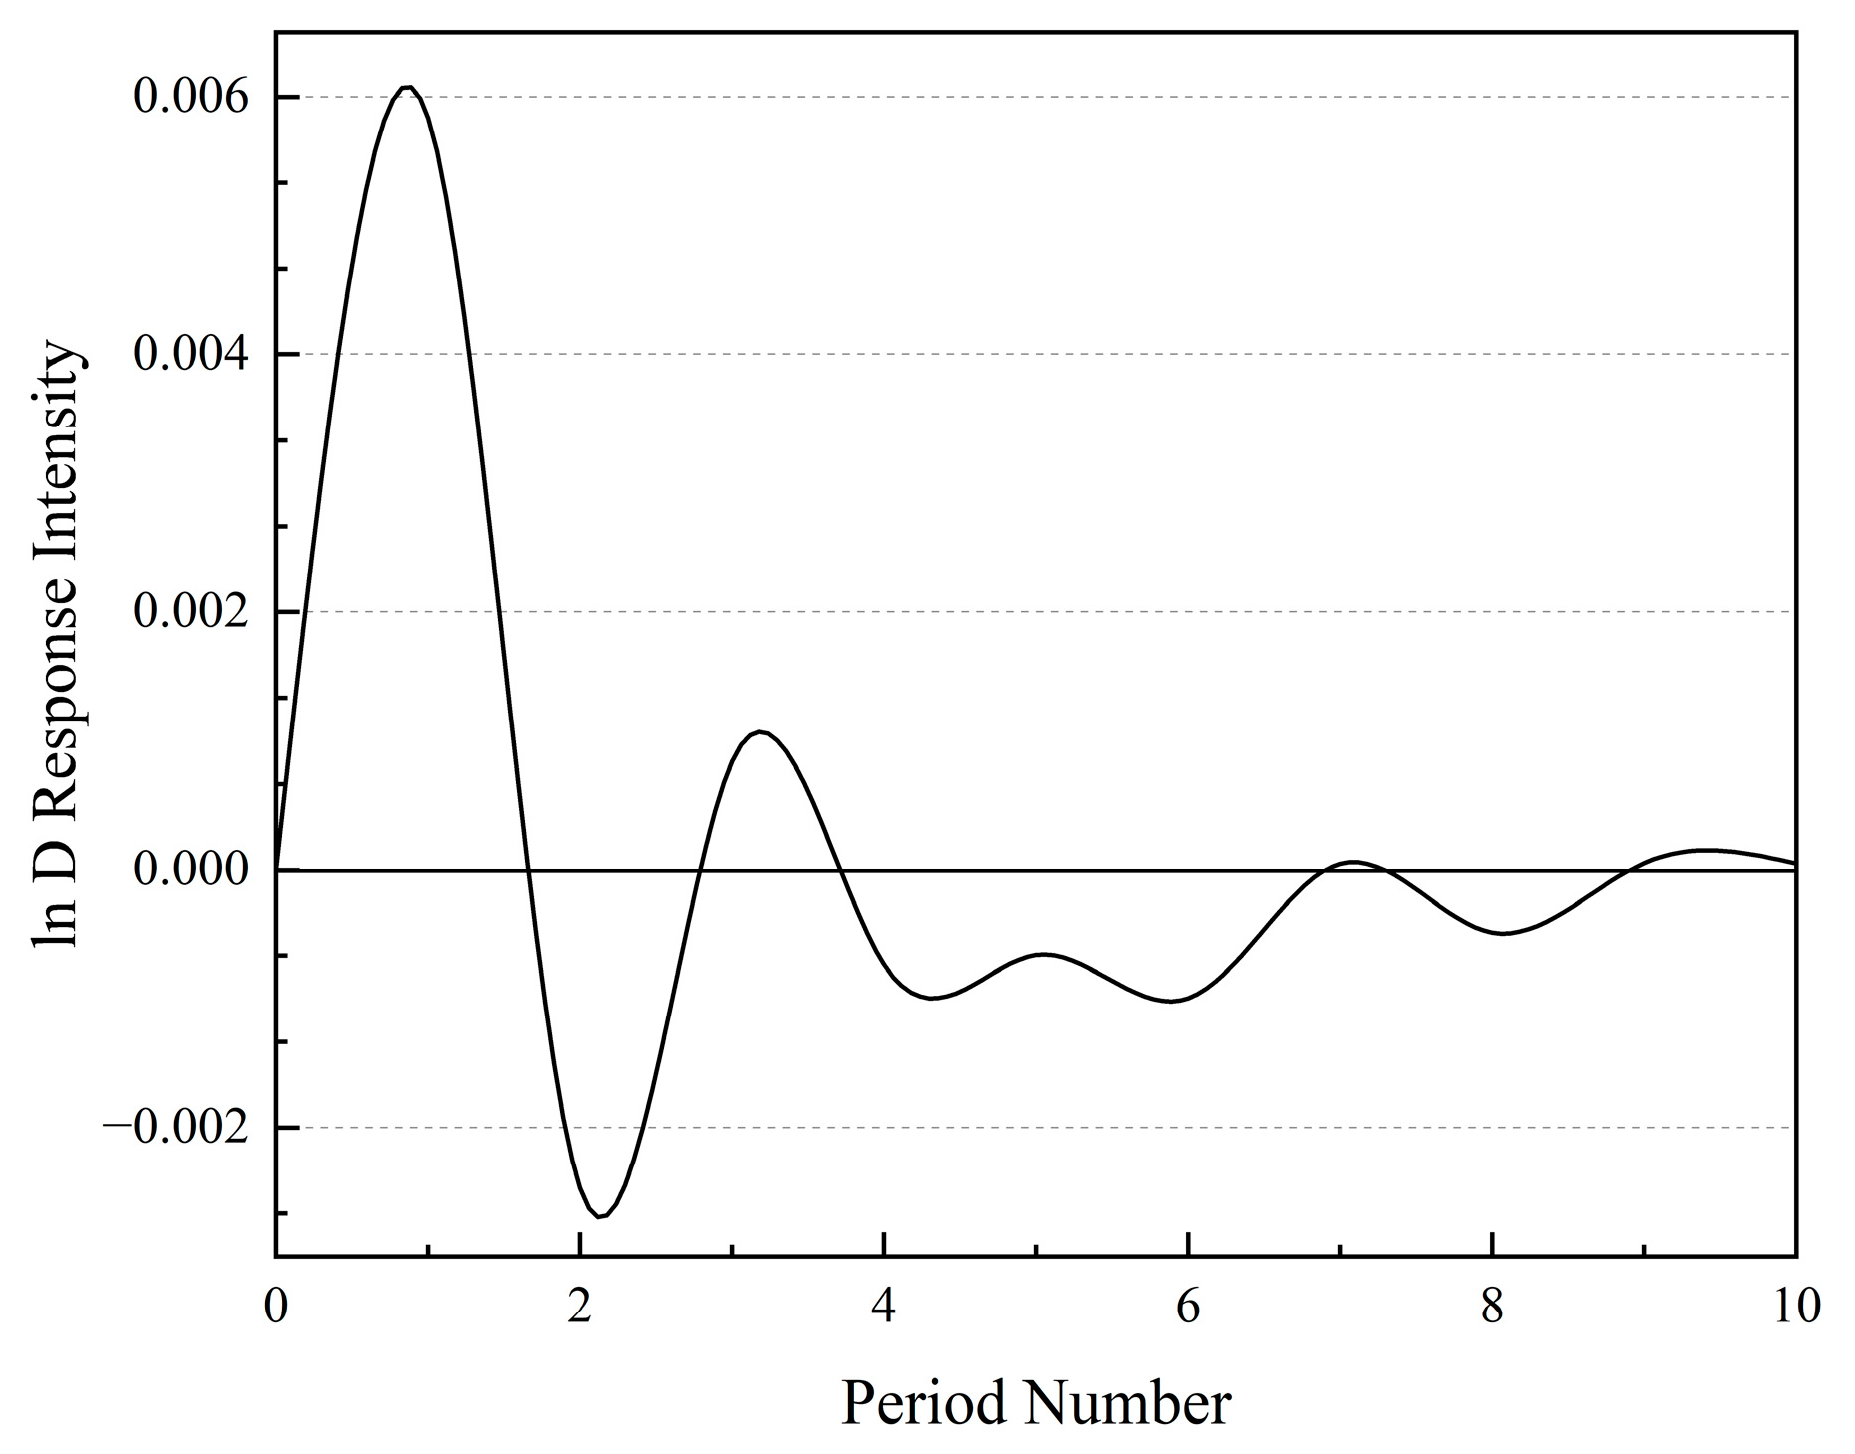
Impulse Response and Variance Decomposition
The impulse response function is employed to analyze the temporal evolution of the SES’s CCD in response to a shock from FCS. In the initial stage (period 1), the response of ln D to a shock in ln FCS is zero. It increases to a maximum of 0.006 by the first period and subsequently exhibits a gradual declining trend (
Figure 15). This confirms that FCS measures have a significant regulatory effect on social–ecological coordinated development in the early stages of policy implementation, but their marginal benefit diminishes over time.
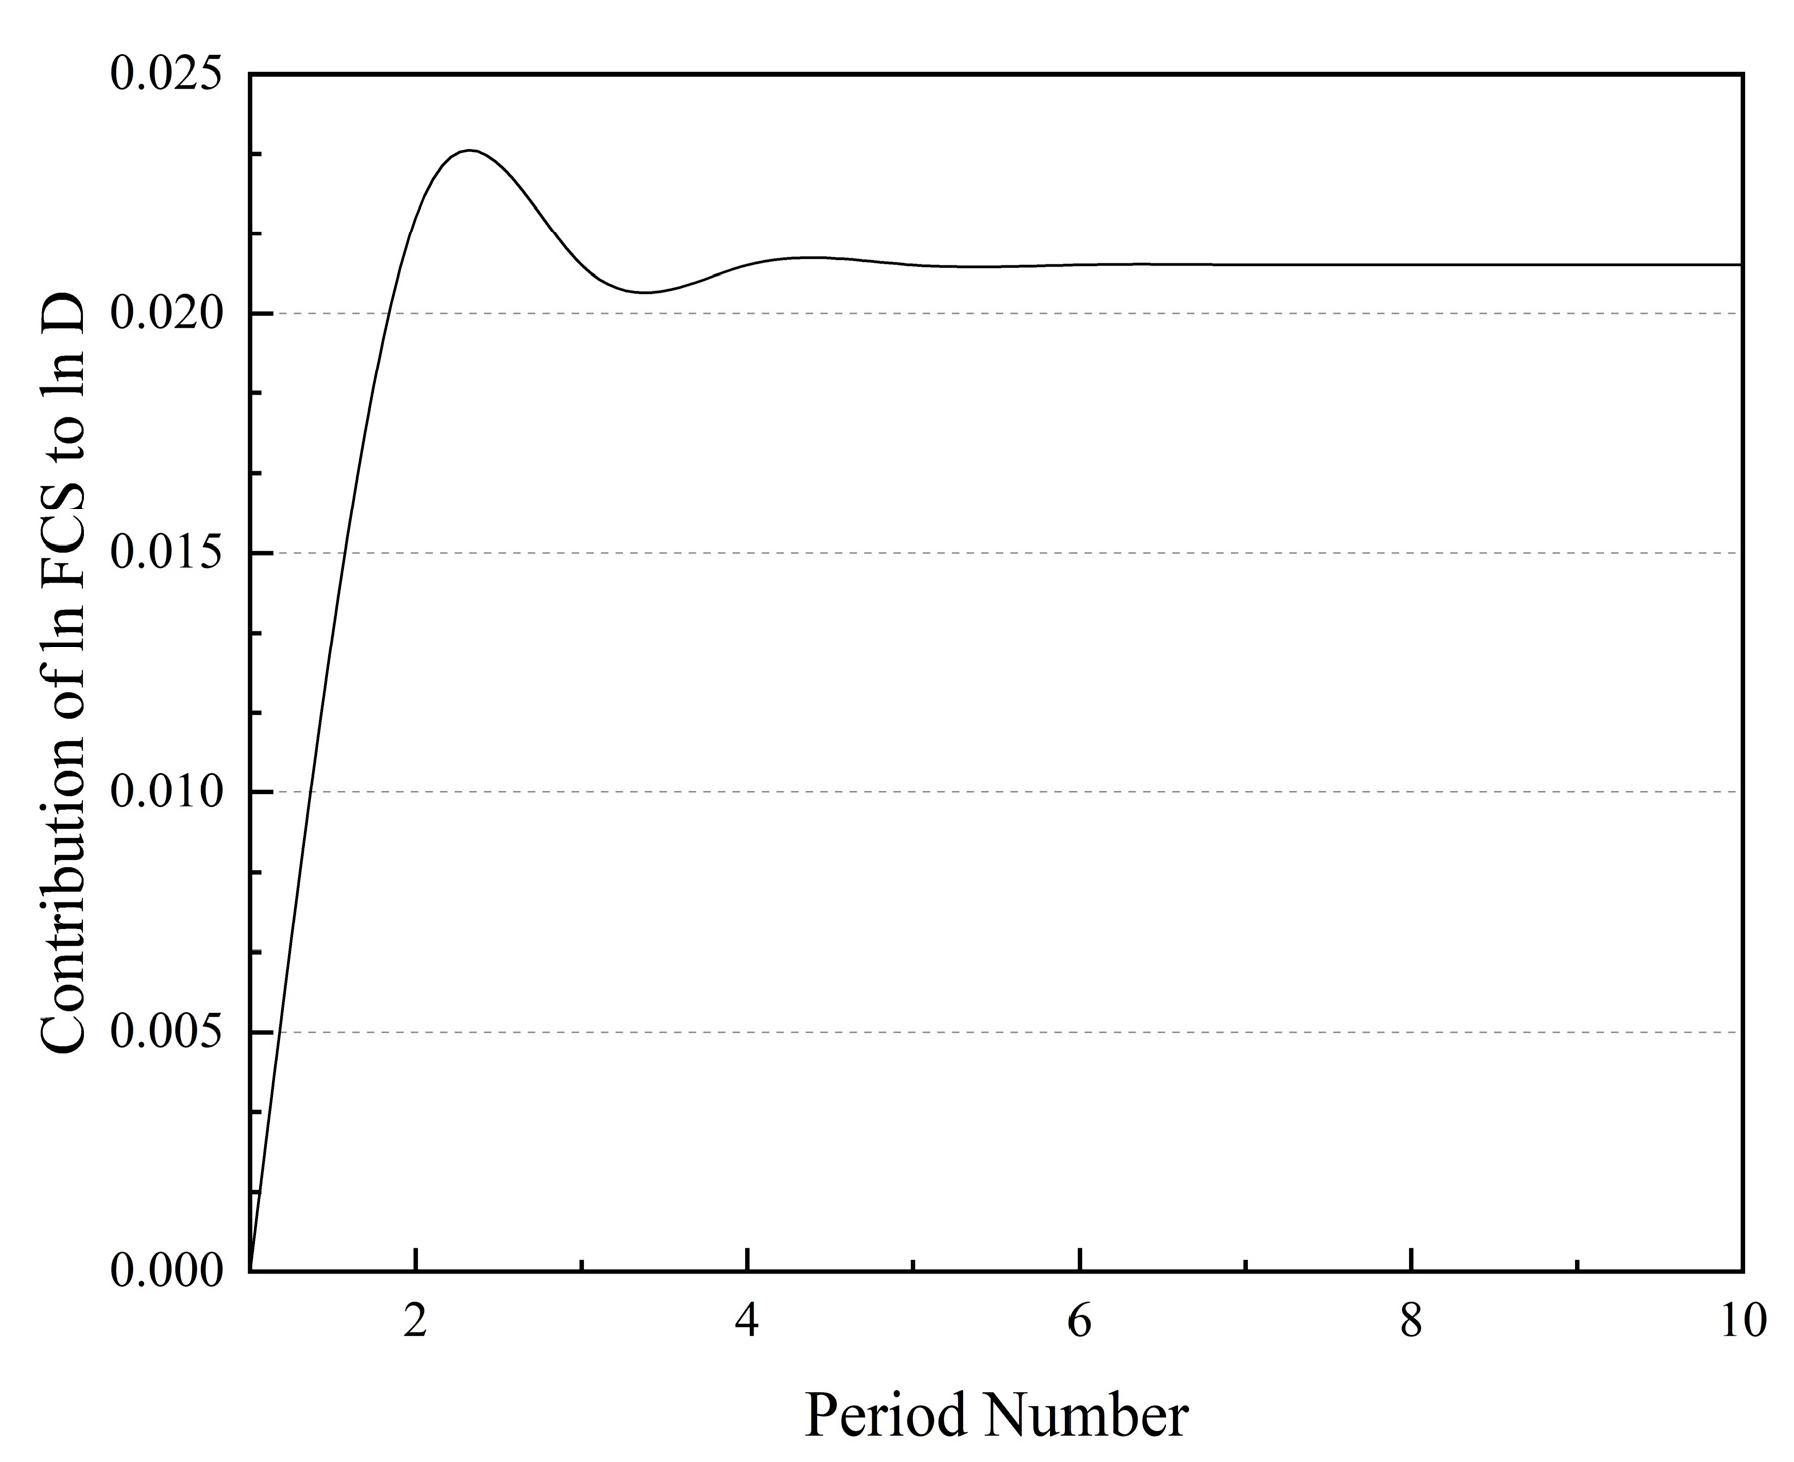
Variance decomposition further clarifies the contribution of FCS to the CCD of the SES in the Haihe River Basin. As shown in
Figure 16, the contribution of ln FCS to the variance of ln D increases gradually over the forecast horizon, but remains limited in absolute magnitude. Combined with the impulse response results in
Figure 15, this suggests that FCS exerts a modest positive dynamic influence on SES coordination, especially in the early periods, with the marginal effect weakening over time. Therefore, the results are better interpreted as evidence of a gradually emerging but quantitatively limited association, rather than a strong long-term cumulative effect. Within the social–ecological framework, FCS appears to contribute positively to the stabilization of SES coordination, but the magnitude of this contribution should be interpreted cautiously.
4.3.2. FCS-Related Drivers of SES CCD
A positive association is observed between the coupling coordination degree (CCD) of the SES and flood control safety (FCS) in the Haihe River Basin. As shown in
Table 7, the grey relational grades between FCS indicators and the SES CCD range from 0.628 to 0.986, suggesting that multiple aspects of FCS are closely related to coordinated social–ecological development. However, given that most indicators exhibit relatively high correlation levels, the differences among them are generally small, and the ranking results should be interpreted as descriptive rather than indicative of statistically meaningful or substantively meaningful distinctions.
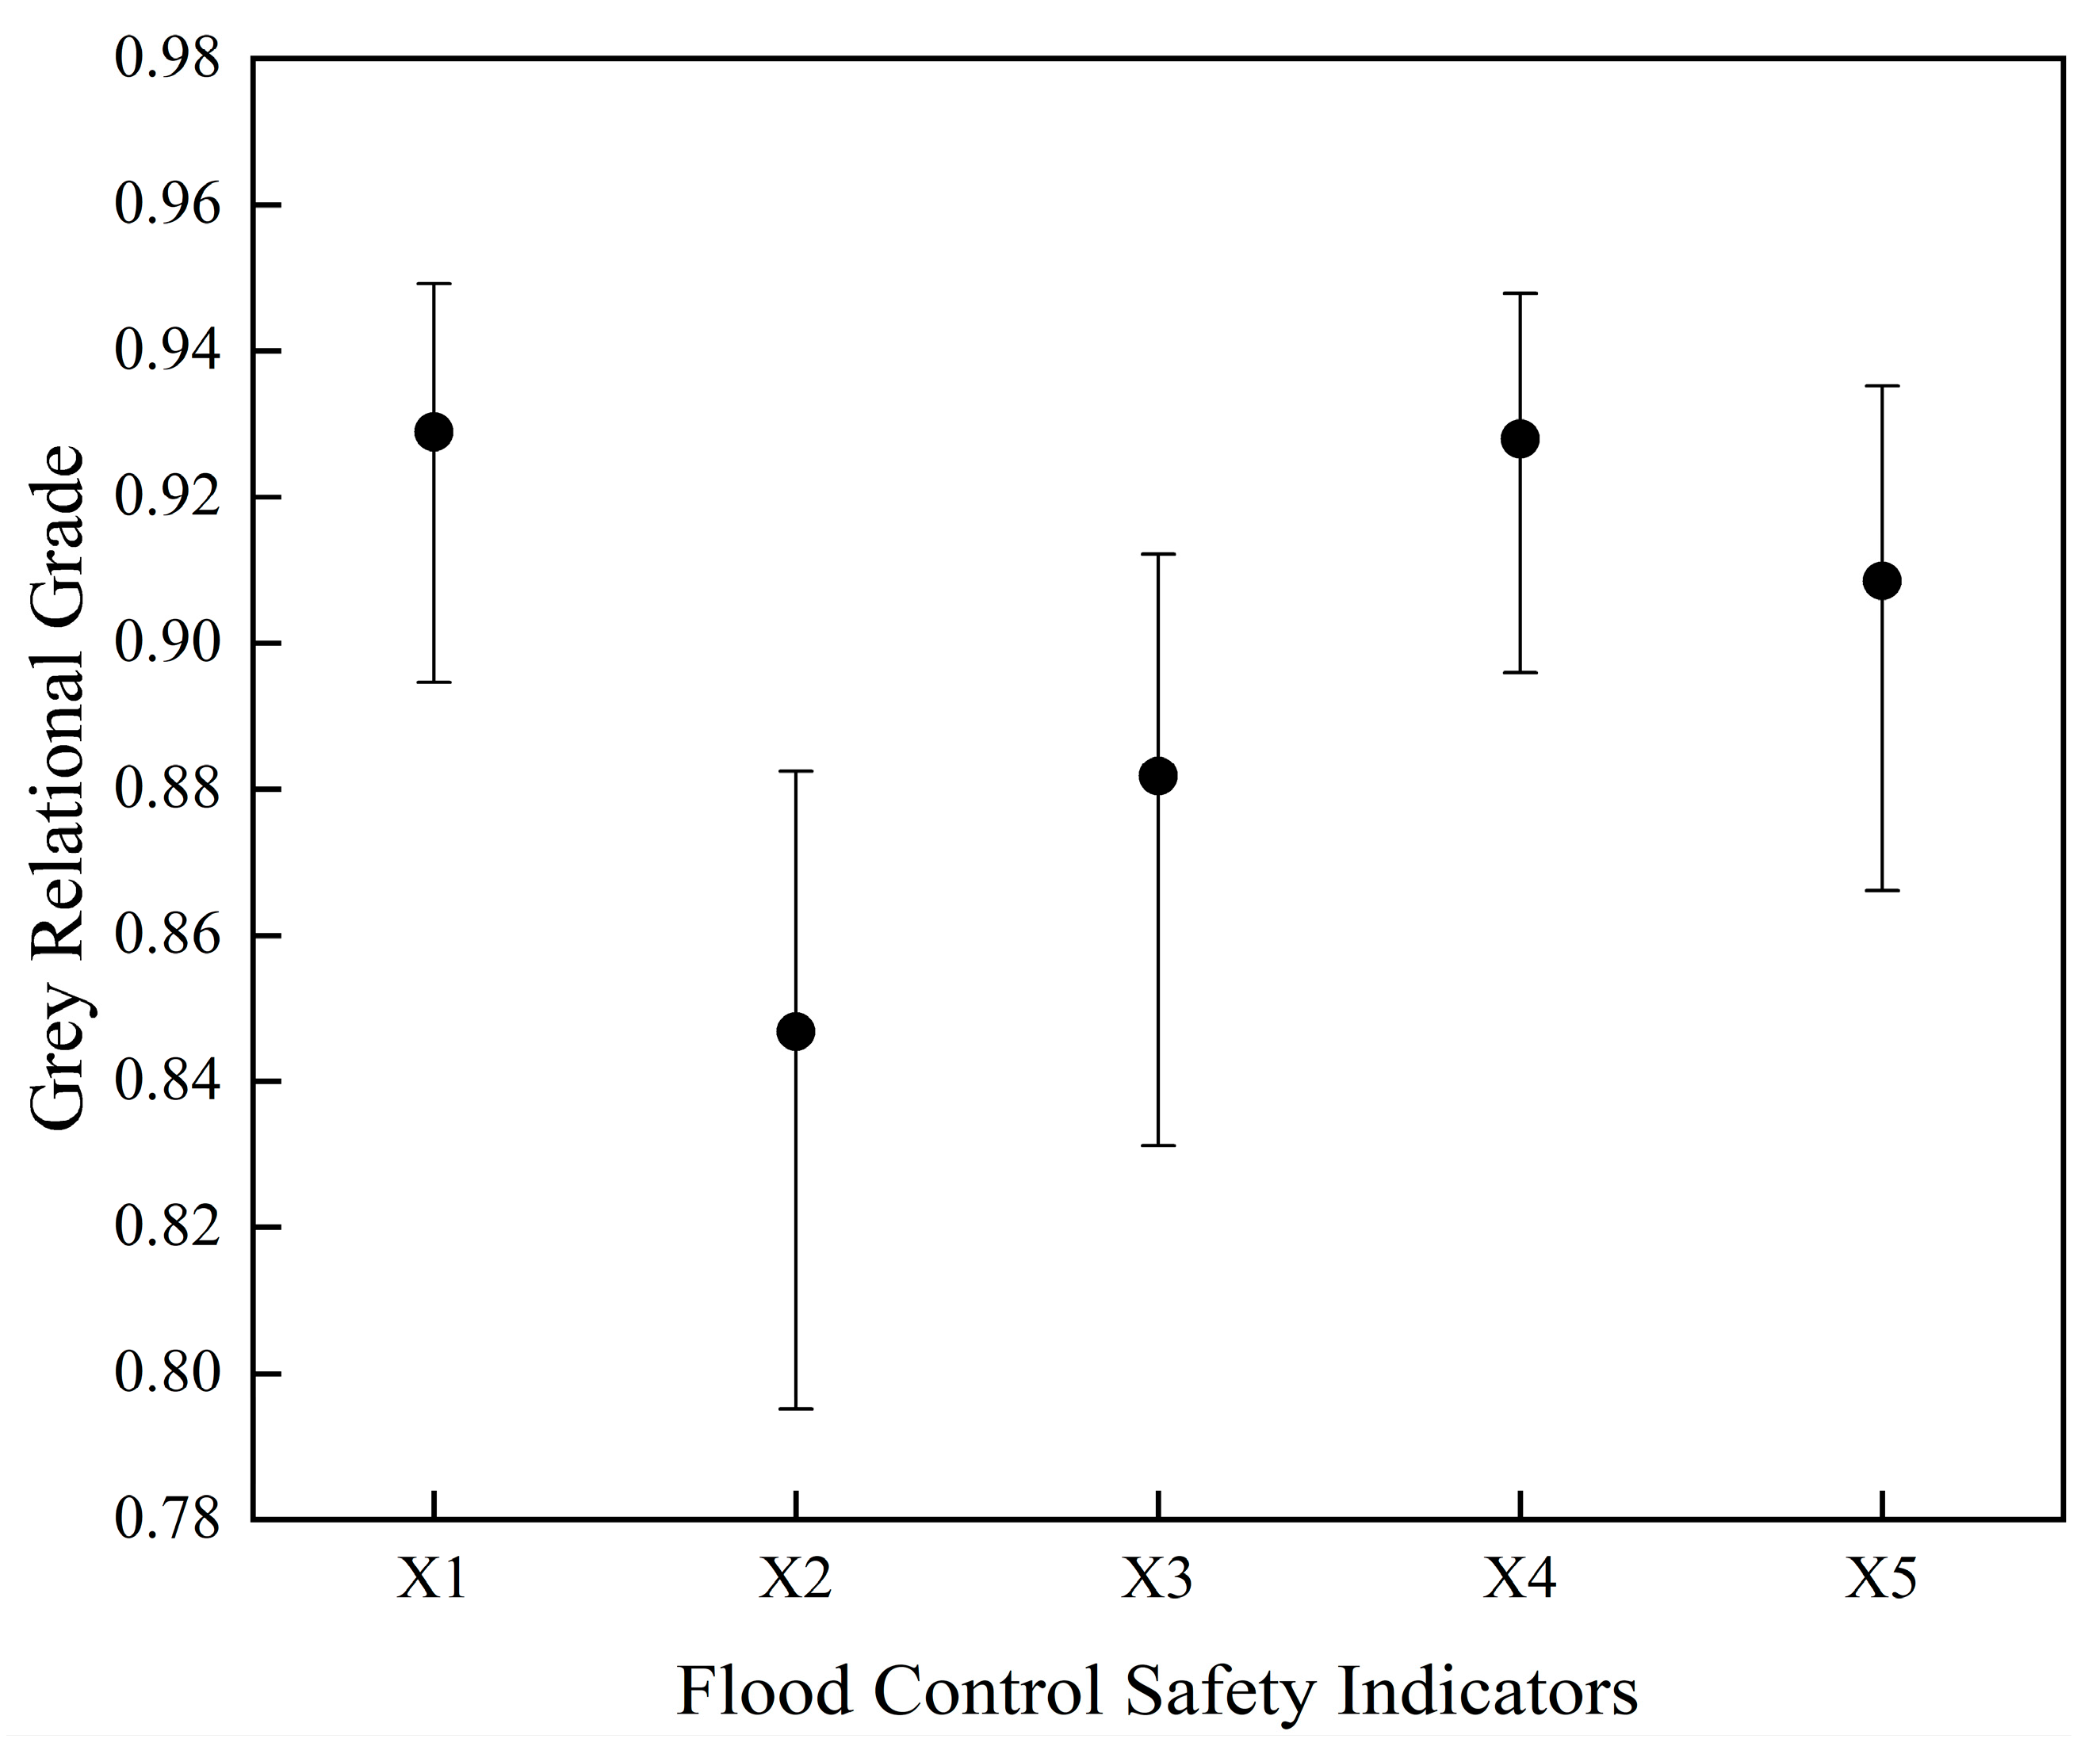
To further assess the robustness of the GRA results, a bootstrap resampling procedure with 1000 iterations was conducted, and the results are reported in
Table A5 and visualized in
Figure A2. The results show that the 95% confidence intervals of several key indicators—such as the length of levees and total reservoir capacity—overlap substantially. This indicates that the small differences in their mean GRA values are not statistically significant. Therefore, these indicators should be interpreted as having comparable levels of association with the SES CCD, rather than a strictly ordered hierarchy.
At the basin scale, the length of levees and total reservoir capacity both exhibit high levels of association with the SES CCD. However, their differences are minimal and fall within overlapping uncertainty ranges, suggesting that they play similarly important roles in influencing coordinated development. In contrast, the proportion of flood control expenditure tends to show relatively lower relational grades, although these differences remain modest and should not be overinterpreted; its contribution should still be understood as part of a broader set of interacting factors rather than being negligible.
Given the substantial heterogeneity in socio-economic conditions, ecological capacity, and flood control infrastructure across the eight provincial-level units, the patterns of association vary at the provincial scale. Instead of identifying a single dominant factor, the results indicate that multiple indicators often exhibit similarly high relational grades within each province, reflecting the joint influence of different dimensions of FCS. For example, total reservoir capacity, levee length, and soil and water erosion control measures all show relatively strong associations with the SES CCD across several provinces, although their relative rankings differ slightly.
For indicators with comparatively lower relational grades, some regional differences can still be observed. For instance, the proportion of flood control expenditure in Beijing and Shanxi shows relatively weaker associations compared to other regions. Similarly, the relationship between total reservoir capacity and the SES CCD in Shanxi appears weaker than in other provinces. These patterns may reflect differences in investment structure, such as a higher baseline of fiscal expenditure in Beijing leading to diminishing marginal effects, and a greater emphasis on post-disaster compensation rather than preventive infrastructure investment in Shanxi.
Overall, the results suggest that the coordinated development of the SES in the Haihe River Basin is shaped by the combined effects of multiple flood control factors. While GRA provides useful insights into relative associations, its ability to discriminate among highly correlated indicators is limited. Therefore, the findings should be interpreted with caution, emphasizing the collective and complementary roles of different FCS components rather than strict rankings.
5. Discussion
5.1. Flood Control Safety as a Foundational Dimension of Territorial Resilience
This study shows that social–ecological coordination in the Haihe River Basin improved markedly from 2008 to 2022, indicating a transition from severe imbalance toward a more coordinated development trajectory. This interpretation is consistent with the temporal patterns identified in
Section 3.1, where the composite indices of the social, ecological, and flood-control safety (FCS) subsystems all increased over time. However, this aggregate improvement should not be interpreted as evidence that stable resilience has already been achieved. Subsystem analysis—especially the basin-area-weighted sensitivity results—shows that FCS remained comparatively weak throughout the study period, and that its weakness is more pronounced in basin-related areas than suggested by province-level baseline estimates. This implies that relatively high coordination scores may still conceal structurally important bottlenecks. From a territorial systems perspective, social and ecological progress may advance faster than the strengthening of protective infrastructure, producing an apparently improving but still risk-sensitive development pattern. In this sense, flood-control safety should not be treated as a secondary engineering variable, but as a foundational condition for regional resilience.
This finding extends existing social–ecological system (SES) research by identifying a form of security–development mismatch at the basin scale. When infrastructure capacity does not improve in step with development intensity and land-use transformation, exposure and disturbance risks remain embedded in the territorial system. This interpretation is consistent with the dynamic predictive relationship identified in the PVAR/Granger analysis, which suggests that changes in FCS precede subsequent changes in SES coordination, although the model does not establish strict long-term causality. Therefore, the coordination state observed in the Haihe River Basin should be understood not as a stable endpoint, but as a dynamic and potentially transitional condition shaped by the interaction of infrastructure robustness, ecological restoration, and governance capacity.
A key feature of this evolution is the asymmetry among subsystems. Driven in part by China’s policy agenda of ecological civilization and balanced regional development [
44], the ecological subsystem grew more rapidly than both the social and FCS subsystems. At the same time, the results show that ecological improvement was not strictly linear, with some short-term fluctuations in later years. This suggests that ecological recovery can contribute positively to overall coordination without automatically producing proportional gains in territorial safety. More broadly, the findings support the view that resilience assessment should move beyond aggregate coordination indices and pay closer attention to subsystem imbalance and structurally persistent vulnerabilities in flood-sensitive basins. This point becomes clearer when the index trajectories are viewed alongside major flood events within the study period. Although the 2023 extreme flood is discussed as a contextual case, it lies outside the study period and therefore should not be treated as a formal validation test. To provide a more appropriate in-sample reference, we briefly examined the trajectories of the FCS index and the SES–FCS coupling coordination degree (CCD) around major flood events that occurred during the observation period, including the 2012 Beijing flood and the representative flood years of 2016 and 2021. The comparison suggests that these indices generally evolve gradually rather than showing sharp contemporaneous shifts in every event year. This result is consistent with the construction of the FCS subsystem as a capacity-oriented and structurally grounded measure, which is more sensitive to medium- to long-term changes in protection conditions and support capacity than to single-event disaster outcomes. In this sense, the in-sample event comparison serves as a qualitative consistency check, while the 2023 flood is used only as an out-of-sample contextual illustration.
5.2. Spatial Heterogeneity and Differentiated Governance Pathways
Another important finding is that the coordination pattern of the Haihe River Basin is shaped by strong spatial heterogeneity rather than by a single basin-wide mechanism. This is reflected in both the provincial comparisons and the grey relational analysis, which together indicate that different parts of the basin are characterized by distinct development conditions, ecological capacities, and flood-control infrastructure configurations. As a result, the basin does not follow a uniform pathway of coordinated change.
In densely populated metropolitan areas such as Beijing, Shandong, and Henan, reservoir regulation capacity tends to show a strong association with SES coordination, reflecting the need to attenuate flood peaks rapidly in order to protect concentrated populations, critical infrastructure, and high-value economic assets [
23]. However, the bootstrap results indicate substantial overlap in the confidence intervals of several major FCS indicators, including reservoir capacity and levee length. Thus, these findings should not be interpreted as evidence of a strictly dominant single factor. A more cautious interpretation is that coordinated improvement in such areas depends on the joint contribution of multiple flood-control components. By contrast, in upstream provinces such as Hebei and Shanxi, levee-based protection also shows relatively strong association with coordinated development. In these areas, linear defense systems remain important for safeguarding agricultural land, dispersed settlements, and transitional ecological zones. This pattern likely reflects both historical infrastructure legacies and hydrological constraints imposed by topography. In low-lying coastal areas such as Tianjin, green infrastructure—represented here by per capita soil and water conservation area—also appears to play a meaningful role, consistent with planning approaches that integrate stormwater management, ecological regulation, and urban adaptation [
45].
This spatially differentiated pattern is consistent with international experience in major river basins such as the Mississippi, Rhine, and Ganges, where resilience is rarely produced by a single standardized engineering solution and more often depends on context-specific combinations of structural protection, ecological adaptation, and institutional coordination [
46,
47,
48]. For land governance and spatial planning, these findings support differentiated interventions. Upstream areas require closer integration of ecological conservation, flood retention capacity, and targeted protective investment, whereas more intensively developed downstream areas require stronger coordination among land-use control, reservoir operation, and infrastructure upgrading. At the basin scale, these findings also reinforce the importance of adaptive, cross-jurisdictional governance, because flood risk and infrastructure imbalance rarely align neatly with administrative boundaries.
This governance implication is also aligned with the principles of the Sendai Framework for Disaster Risk Reduction 2015–2030 [
49,
50], which emphasizes understanding disaster risk, strengthening disaster risk governance, investing in resilience, and enhancing preparedness for effective response and recovery. In the context of the Haihe River Basin, this means that flood-control safety should be addressed not only through sectoral water engineering, but also through integrated territorial planning and multi-level coordination across provinces and functional regions.
5.3. Theoretical Contribution, Planning Relevance, and Limitations
Theoretically, this study contributes to the SES literature by bringing flood control safety into a broader analytical framework of basin development and territorial resilience. In doing so, it responds to growing calls to connect disaster risk reduction more explicitly with sustainability science and resilience-oriented territorial governance [
11,
51]. More importantly, the present approach should be understood as complementary to event-based flood simulation and flood-risk mapping rather than as a substitute for them. Flood simulation and risk mapping are crucial for identifying hazard intensity, inundation extent, and exposure at specific times and locations, whereas the present study focuses on long-term coordination dynamics and structural development conditions at the basin scale. Our findings are also broadly consistent with recent studies reporting improved social–ecological coordination in major Chinese river basins, such as the Yellow River and the Yangtze River [
13,
52]. At the same time, this study adds an important qualification: compared with physical flood-control components such as levees and reservoir capacity, the proportion of flood-control expenditure tends to show relatively weaker association with SES coordination. Given the generally high relational grades and the limited discrimination among indicators, this result should not be interpreted as a dismissal of fiscal investment. Rather, it suggests that budgetary input alone does not automatically translate into higher coordination unless it is effectively converted into functioning and territorially appropriate protective capacity.
In practical terms, the study indicates that flood-control safety is not only a water-management issue but also a territorial planning issue. Improving FCS requires coordination with land-use regulation, urban expansion control, ecological restoration, and, where appropriate, nature-based solutions such as flood retention landscapes, wetland restoration, and sponge-city measures. Such an integrated approach is increasingly recognized as essential for reducing long-term vulnerability in rapidly transforming and hazard-sensitive regions.
Several limitations should be acknowledged. First, although the study introduces basin-area-weighted sensitivity analysis to reduce the mismatch between administrative statistics and hydrological boundaries, the use of province-level panel data still masks considerable intra-provincial variation. Future research would benefit from prefecture-level city, county, or grid-level datasets that can better capture localized social, ecological, and flood-risk dynamics. Second, while the PVAR/Granger and grey relational approaches are useful for identifying dynamic predictive relationships and relative associations, they do not establish strict long-term causal mechanisms and have limited ability to distinguish among highly correlated indicators. Future work could strengthen causal inference by integrating scenario analysis, quasi-experimental strategies, and event-based flood simulation or flood-risk mapping methods. Third, the FCS indicator system used here still emphasizes infrastructure and expenditure variables; future studies could incorporate additional dimensions such as annual direct flood losses normalized by GDP or by population exposed, emergency response capacity, insurance coverage and social vulnerability [
53] in order to provide a more comprehensive understanding of territorial flood resilience. In addition, abrupt year-to-year movements in some provincial composite scores—such as the 2011 spike observed for Hebei in the FCS subsystem—may reflect a combination of substantive infrastructure change, index sensitivity, and possible reporting discontinuities that cannot be fully disentangled using province-level annual statistics.
Overall, the Haihe River Basin appears to be moving toward greater systemic coordination, but this coordination remains conditionally fragile. Strengthening flood control safety is still the central prerequisite for securing durable territorial resilience in the basin. Future progress will depend not simply on increasing investment, but on improving the adaptive, spatially differentiated, and cross-jurisdictional governance of land, infrastructure, and ecological systems. Under intensifying climate extremes, the Haihe River Basin thus provides a valuable reference for other climate-sensitive river basins seeking to reconcile ecological restoration, spatial development, and risk governance in pursuit of long-term resilience.
6. Conclusions
This study examined the coordinated development of the social, ecological, and flood-control safety (FCS) subsystems in the Haihe River Basin from 2008 to 2022 by integrating composite index evaluation, coupling coordination analysis, PVAR/Granger causality testing, and grey relational analysis. The results show that the social–ecological system (SES) coordination level of the basin improved significantly over the study period, indicating a transition from severe imbalance toward a more coordinated development trajectory. However, this improvement should not be interpreted as evidence that territorial resilience has already been fully established. Across the study period, FCS remained the relatively weakest subsystem, and basin-area-weighted sensitivity analysis further suggests that province-level statistics may overestimate actual flood-control conditions within the basin. In addition, the weighting robustness analysis shows that although the overall upward trend is stable, the absolute level of coordination is somewhat sensitive to weighting schemes, which means that high coupling coordination degree values should be interpreted with caution.
The study also provides evidence that flood-control safety plays a structurally important role in basin coordination. The PVAR/Granger results indicate that changes in FCS precede subsequent changes in SES coordination in a predictive sense, suggesting that flood-control capacity forms an important enabling condition for long-term territorial stability. At the same time, the grey relational analysis reveals strong spatial heterogeneity across provinces. Different regions of the basin are associated with different combinations of reservoir regulation, levee protection, ecological conservation, and fiscal support, while bootstrap results suggest that these factors should be understood as jointly contributing to coordination rather than forming a strict hierarchy of single dominant drivers. Taken together, these findings imply that improving resilience in the Haihe River Basin requires differentiated governance strategies that integrate flood-control infrastructure, ecological restoration, land-use regulation, and cross-jurisdictional coordination, in line with broader disaster risk reduction principles such as those emphasized in the Sendai Framework.
Despite these contributions, the study still has several limitations. The use of province-level panel data cannot fully capture intra-provincial heterogeneity, and the empirical methods employed here identify dynamic predictive relationships and relative associations rather than strict long-term causal mechanisms. Future research should therefore incorporate finer-scale spatial data, event-based flood simulation, flood-risk mapping, and broader indicators of institutional preparedness and social vulnerability. Nevertheless, this study demonstrates that incorporating flood-control safety into SES coordination analysis is both necessary and informative for understanding territorial resilience in flood-prone river basins. It provides a useful empirical basis for moving from growth-oriented development assessment toward a more risk-sensitive and resilience-oriented framework of basin governance.