Article

Asymmetry Analysis and Hazard Assessment of Drought–Flood Abrupt Alternation Events in the Yellow River Basin

1
School of Geography and Tourism, Qufu Normal University, Rizhao 276826, China
2
Sino-Belgian Joint Laboratory of Geo-Information, Rizhao 276826, China
3
Department of Geography, Ghent University, 9000 Gent, Belgium
4
Sino-Belgian Joint Laboratory of Geo-Information, 9000 Gent, Belgium
*
Author to whom correspondence should be addressed.
Land 2026, 15(5), 840; https://doi.org/10.3390/land15050840
Submission received: 21 April 2026 / Revised: 8 May 2026 / Accepted: 12 May 2026 / Published: 14 May 2026
(This article belongs to the Special Issue Natural Disaster Monitoring and Land Mapping)

Abstract

Drought–flood abrupt alternation (DFAA) is a typical compound hydroclimatic extreme process and has important implications for regional water resources regulation, agricultural production, and ecological stability. However, existing studies have mainly focused on event identification and frequency variation, while lacking a systematic investigation of the directional differences between drought-to-flood (DF) and flood-to-drought (FD) events in terms of process structure, cumulative effects, and spatial hazard patterns. Based on daily precipitation data from 1960 to 2024, this study identified DFAA events in the Yellow River Basin by combining the standardized weighted average precipitation (SWAP) index with run theory, and analyzed the asymmetric characteristics of DF and FD events from the perspectives of event frequency, phase duration, abrupt-transition characteristics, cumulative severity, and integrated hazard. The results show that: (1) the frequency of DFAA events in the Yellow River Basin exhibited pronounced spatial heterogeneity, with an overall pattern of being higher in the middle reaches and lower in the upper and lower reaches. The frequency of DF events was generally higher than that of FD events, and their spatial distribution was also more continuous. No significant long-term trend was detected in the annual frequency, although clear interdecadal variability was observed, characterized by a transition from relatively low-frequency periods to medium- and high-frequency periods. (2) DF and FD events exhibited stable asymmetry in process structure. The abrupt-transition duration of DF events was mainly concentrated within 1–2 days, whereas that of FD events was mainly concentrated within 3–5 days. The two event types had comparable pre-transition durations, but DF events tended to shift more rapidly and were followed by a longer-lasting flood phase. (3) The differences between the two event types in terms of instantaneous intensity were relatively limited, whereas clearer divergence was observed in cumulative severity, with DF events showing greater overall severity than FD events. This indicates that the directional difference is manifested primarily in cumulative process effects rather than in the magnitude at a single moment. (4) The comprehensive hazard index (CHI) revealed that the northern and central-eastern parts of the middle reaches of the Yellow River Basin were the main hotspots of DFAA hazard. Among them, high-hazard areas of DF events were more extensive, whereas FD hazards were characterized more by localized intensification. These findings indicate that within the identification framework adopted here, DFAA in the Yellow River Basin is characterized not only by rapid dry–wet transitions, but also by clear directional differences between DF and FD in process structure and hazard pattern. This study can provide a scientific reference for the monitoring, early warning, and zonal hazard prevention of DFAA in the basin.

1. Introduction

In the context of current global climate warming, increasing attention has been paid to the compound and sequential characteristics of extreme hydroclimatic events [1,2,3,4]. Drought–flood abrupt alternation (DFAA) is a representative compound and sequential hydroclimatic process characterized by a rapid transition between anomalously dry and anomalously wet conditions within a short period [5,6]. In this study, DFAA was identified from daily SWAP anomalies, and the “flood phase” refers to an anomalously wet precipitation phase rather than observed river flooding or inundation [4,5,7]. Compared with a single drought or flood event, this type of process involves not only the successive occurrence of two contrasting anomalous states, but also a short-duration transition stage, and its impacts often depend on the combined effects of antecedent accumulation, transition rate, and post-transition persistence [8,9]. Therefore, the key to DFAA lies not merely in the sequence of “drought followed by flood” or “flood followed by drought”, but more importantly in how the entire event evolves, how the transition unfolds, and how different stages jointly determine its potential impacts.
In recent years, research on DFAA has grown steadily, with existing research mainly focusing on four aspects. First, event identification and index development have received considerable attention. Existing studies have defined and identified DFAA from different process perspectives, including precipitation-based dry–wet anomalies, evapotranspiration-related moisture conditions, soil moisture variations, runoff responses, and multivariate hydroclimatic or natural–social system frameworks [4,7,10,11,12,13]. Second, spatiotemporal variation analysis has revealed regional differences in the occurrence frequency, temporal fluctuations, and spatial patterns of DFAA across different regions of China and at the scale of several river basins [14,15,16,17]. Third, future change assessment and climate change response analysis have been explored in some studies, which used model simulations to examine the evolutionary trends of DFAA and the regions where such events may intensify under a warming climate [18,19,20]. Fourth, impact assessment has gradually emerged as an important research direction, with increasing attention being paid to the potential effects of DFAA on agricultural production, ecosystems, and regional water resource security [21,22,23]. Overall, existing studies have demonstrated that DFAA is not merely an occasional local phenomenon, but rather an important hydroclimatic process that deserves sustained attention from the perspective of compound extreme events.
Nevertheless, existing studies still have certain limitations in terms of identification scale and event characterization. Early research was largely conducted using indices such as the standardized precipitation index (SPI), standardized precipitation evapotranspiration index (SPEI), and standardized runoff index (SRI) [15,24,25,26]. In particular, SPI has been widely applied in river-basin studies to identify and characterize both drought and flood conditions because it provides a standardized measure of precipitation anomalies over different accumulation periods [27,28]. Although these indices are well-suited for characterizing dry–wet anomalies at the monthly scale and above, most of them are based on temporal aggregation and therefore have relatively limited capacity to capture abrupt fluctuations and rapid transitions occurring over short periods [8,9,29]. Previous studies have pointed out that DFAA often occurs at sub-monthly or even daily scales; thus, when monthly-scale indices are still employed, extreme signals can easily be smoothed out during the aggregation process, thereby affecting the determination of event onset and termination, transition duration, and cumulative intensity [24,30]. In addition to the issue of temporal scale, if dry and wet states are identified solely on the basis of discrete time points or fixed thresholds, the continuous evolution of the process may be oversimplified as an instantaneous jump, which in turn weakens the ability to identify event boundaries, phase duration, and cumulative anomalies [13,31]. Therefore, for compound processes such as DFAA that emphasize continuous transitions, simple state identification is often insufficient; a process-based perspective capable of identifying complete event boundaries and phase structure is also required.
Against this background, the standardized weighted average precipitation (SWAP) index, constructed from daily precipitation data, together with run theory, provides a more suitable analytical basis for DFAA identification. Compared with monthly-scale indices such as SPI and SPEI, which may lead to biased identification of event onset and termination and weaken the ability to quantify the details of abrupt transition processes [32,33,34], SWAP can capture short-term precipitation anomalies while simultaneously accounting for the cumulative effects of antecedent precipitation, making it more suitable for the identification and comparison of abrupt alternation events over long time series and at the regional scale [12,35,36]. In terms of identification strategy, traditional fixed-threshold methods are prone to recognition bias [37,38,39,40], whereas run theory can identify consecutive periods below or above a threshold as integrated event units with complete boundaries, duration, and cumulative anomalies, thereby providing a more effective framework for characterizing the continuous evolution of “drought–transition–flood” or “flood–transition–drought” processes [41,42,43]. Therefore, the combination of run theory and the SWAP index helps to simultaneously capture rapid changes in precipitation anomalies and the cumulative effects of antecedent conditions, thus enabling a more detailed quantification of the persistence structure, transition duration, and abruptness intensity of DFAA events [44,45]. However, despite these advances, one important question remains insufficiently addressed in the existing literature: whether different transition directions correspond to different modes of process organization.
A limited number of existing studies have suggested that drought-to-flood (DF) and flood-to-drought (FD) events may not be entirely consistent in terms of event frequency, duration configuration, or transition rate [12,17,46]. For example, Bai et al. [7], based on a study in the Pearl River Basin, found that the potential driving factors differed between DF and FD events. Li et al. [47], in the Poyang Lake Basin, reported significant spatial heterogeneity in both the frequency and intensity of DF and FD events. Huang et al. [48] showed that different types of DFAA events in the Heilongjiang River Basin differed markedly in both spatial distribution and dominant drivers. Zhou et al. [12] further pointed out that the evolution process of DF events is usually shorter than that of FD events. Overall, however, most existing studies have still focused primarily on the overall distribution, temporal variation, or comparison of individual indicators, while systematic comparisons between DF and FD in terms of phase duration, transition duration, severity, and spatial distribution remain insufficient. In other words, although the directional differences of DFAA have been noted, its process asymmetry has not yet been comprehensively quantified. In this study, “process asymmetry” refers to systematic differences between DF and FD events in terms of occurrence frequency, phase-duration configuration, transition duration, cumulative severity, phase contribution structure, and spatial hazard expression, rather than merely the opposite ordering of drought and flood phases.
The Yellow River Basin is an important ecological security barrier and a major grain-producing region in China. It is characterized by pronounced climatic transitionality, complex topography and geomorphology, uneven spatiotemporal distribution of water resources, and a fragile ecological environment, making it highly sensitive to extreme hydroclimatic variations [49,50]. Under the combined influence of monsoonal activity, large-scale atmospheric circulation, and complex underlying surface conditions, precipitation in the basin exhibits strong interannual variability, marked regional contrasts in dry–wet conditions, and frequent alternation between drought and flood [51]. Against the backdrop of global warming, both extreme precipitation events and persistent droughts have shown increasing tendencies in the Yellow River Basin, and the hazard of DFAA has risen accordingly [20,52,53]. Therefore, investigating the directional asymmetry of DFAA in the Yellow River Basin is not only of clear regional relevance, but also contributes to a better understanding of compound DFAA processes in monsoon transitional zones.
Accordingly, this study focused on the Yellow River Basin and used the updated CHM_PRE V2 daily gridded precipitation dataset from 1960 to 2024 to identify DFAA by combining the SWAP index with run theory, with a focus on addressing the following three questions:
(1) What are the spatiotemporal distribution characteristics of DFAA events in the Yellow River Basin, and how do DF and FD events differ in occurrence frequency?
(2) What process asymmetry exists between DF and FD events in terms of phase duration, transition duration, severity, and contribution structure?
(3) How is the process asymmetry between DF and FD events manifested in the corresponding spatial hazard patterns?
By answering these questions, this study aims to characterize the directional process asymmetry of DFAA events in the Yellow River Basin from an event-process perspective and identify the spatial patterns of CHI values associated with DFAA processes, thereby providing a scientific basis for the regional monitoring and zonal prevention of DFAA.

2. Materials and Methods

2.1. Study Area

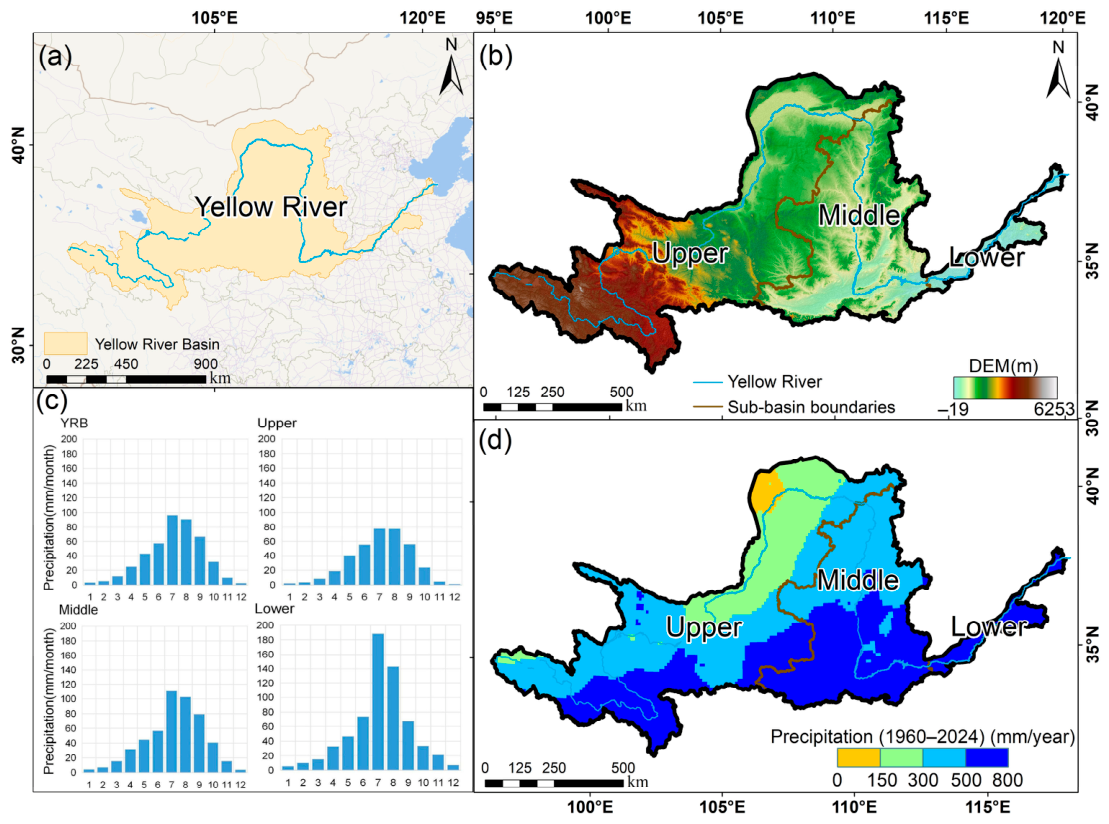
The Yellow River Basin is located between 32°10′–41°50′ N and 95°53′–119°05′ E, bounded by the Yinshan Mountains to the north, the Qinling Mountains to the south, the Tibetan Plateau to the west, and the Bohai Sea to the east, with a total drainage area of approximately 7.95 × 10⁵ km2 [54,55]. The basin spans nine provinces (autonomous regions), including Qinghai, Sichuan, Gansu, Ningxia, Inner Mongolia, Shanxi, Shaanxi, Henan, and Shandong, exhibiting a large geographical extent and complex physiographic conditions. The topography presents a pronounced stepwise pattern: the upper reaches are mainly located along the northeastern margin of the Tibetan Plateau and the Qilian Mountains, the middle reaches predominantly traverse the Loess Plateau, and the lower reaches extend across the North China Plain to the Yellow River Delta (Figure 1a,b).
Influenced jointly by topographic gradients and monsoonal circulation, the basin exhibits diverse climatic regimes, spanning the cold Tibetan Plateau zone, the temperate arid and semi-arid regions, and the warm temperate semi-humid region, with significant spatial heterogeneity in hydrothermal conditions [56,57]. The multi-year mean annual precipitation ranges from approximately 300 to 800 mm, generally increasing from northwest to southeast. Precipitation is unevenly distributed throughout the year, with about 60–70% concentrated in June to September, and July–August constituting the primary flood season. Summer precipitation is relatively low in the upper reaches, approximately 150–300 mm, while it is generally higher in the middle and lower reaches, reaching 300–500 mm (Figure 1c,d). The pronounced topographic gradients and spatiotemporal variability of precipitation result in strong spatial heterogeneity in dry–wet background conditions, precipitation concentration, and water availability across different river sections, thereby providing a representative regional setting for identifying and comparing the spatial distribution and process characteristics of DFAA events.

2.2. Precipitation Dataset

This study employed the CHM_PRE V2 daily gridded precipitation dataset for mainland China, which was developed by Hu et al. [58]. Released by the National Tibetan Plateau Data Center, this dataset was developed based on long-term daily precipitation observations from 3476 national meteorological stations, and integrates 11 meteorological variables, including air temperature, relative humidity, and atmospheric pressure. It was generated using a spatial interpolation framework that combines an improved inverse distance weighting (IDW) method with the light gradient boosting machine (LightGBM) algorithm [59]. The dataset provides daily precipitation data at a spatial resolution of 0.1° for mainland China and surrounding regions (18–54° N, 72–136° E) from 1960 to 2024.
Existing evaluation results have shown that CHM_PRE performs well at the national scale, with a median daily root mean square error (RMSE) of 8.8 mm d−1, while the upgraded V2 version achieves a Kling–Gupta efficiency (KGE) of up to 0.88 [58]. Meanwhile, the dataset also exhibits good spatial consistency and stability in regions with complex terrain and relatively sparse station coverage, such as the Tibetan Plateau and western China [58,59]. Therefore, CHM_PRE V2 can effectively meet the requirements of this study for daily precipitation data with a long time series and relatively high spatial resolution, and has been widely applied in studies of climate change, hydrological processes, and extreme precipitation events [60,61]. The precipitation data preprocessing, DFAA event extraction, and related statistical calculations in this study were performed using Python (v3.9, 64-bit).

2.3. Methods

2.3.1. Standardized Weighted Average Precipitation (SWAP)

This study adopted the theoretical framework of the weighted average precipitation (WAP) proposed by Lu et al. [35] to construct the standardized weighted average precipitation (SWAP), which was used to characterize daily-scale dry–wet conditions and their rapid transition processes. This method applies an exponentially decaying weighting scheme to antecedent precipitation, thereby capturing both the cumulative effects of precipitation and its temporal decay characteristics. The WAP [35] is calculated as follows:
W A P = n = 0 N ω n P n
ω n = ( 1 α ) α n 1
In Equation (1), P n denotes the precipitation amount observed n days before the current day; in Equation (2), ω n represents the corresponding weight coefficient; α is the parameter controlling the temporal decay of the weights; N is the length of the antecedent period. The parameter values α = 0.9 and N = 44 were used to balance antecedent precipitation accumulation and short-term precipitation response. Specifically, α = 0.9 indicates a gradual decay of precipitation weights, allowing the persistence of wetness or dryness conditions to be represented, while N = 44 defines a 44-day antecedent window that captures cumulative moisture anomalies without excessively smoothing abrupt transition signals. This parameter setting is consistent with previous studies and supports methodological comparability [12,44,62].
Based on this, WAP values for each calendar day were grouped across years by day of year. A Gamma distribution was then fitted to the multi-year WAP series for the same calendar day, and a standard normal transformation is subsequently applied to obtain the corresponding SWAP values. The resulting SWAP was a continuous index that can be used to characterize daily dry–wet anomalies. Following the nine-grade SWAP classification scheme of Zhao et al. [44], daily conditions of drought or flood were classified into nine categories: extreme drought, severe drought, moderate drought, slight drought, normal, slight flood, moderate flood, severe flood, and extreme flood. In this classification, the term “flood” denotes a precipitation-based wet anomaly category indicated by positive SWAP values, rather than a hydrological flood event defined by river discharge or inundation. The specific classification criteria are shown in Table 1.

2.3.2. Definition and Characterization of DFAA Events

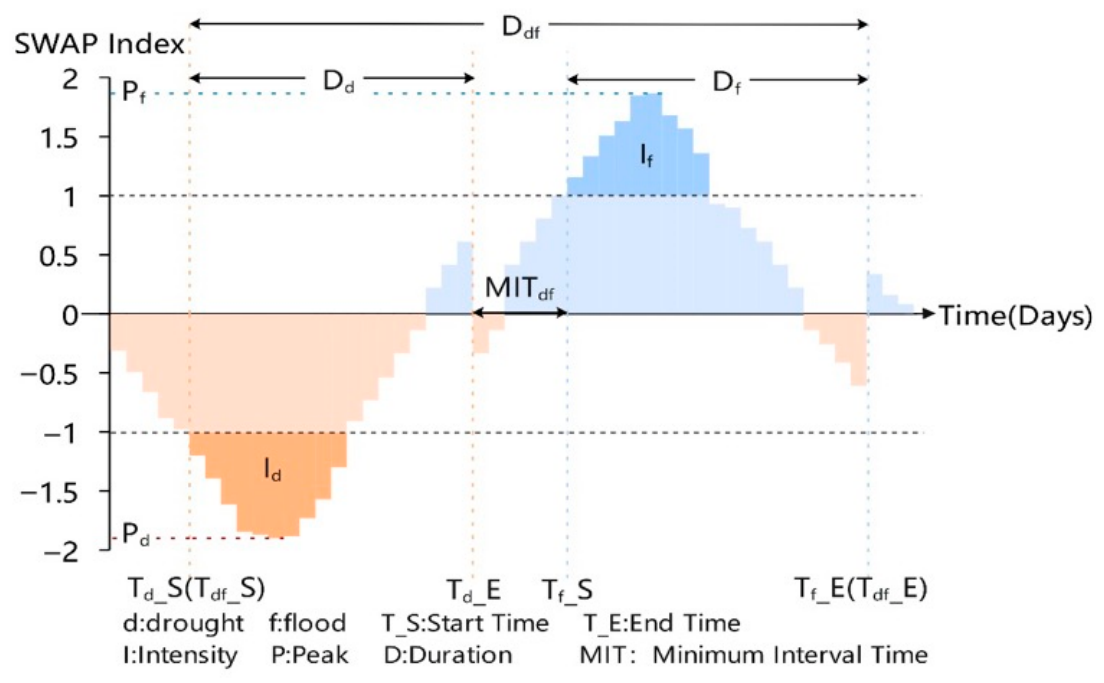
In this study, DFAA events were identified based on the SWAP index and multi-threshold run theory (Figure 2). The DFAA identification framework was adapted mainly from Zhao et al. [44], who used the daily SWAP index together with run theory to identify drought, flood, and DFAA events. In this study, the threshold-based procedure was further adjusted according to the characteristics of daily gridded precipitation in the Yellow River Basin. The identification procedure consisted of three steps. First, independent drought and flood events were identified. Second, DFAA events were determined according to the maximum allowable interval between adjacent events. Finally, the identified events were classified by transition direction, and the corresponding characteristic indicators were extracted.
For drought events, a drought process was considered to begin when SWAP remained continuously below the drought onset threshold, T d _ S = 1 . The drought process was considered to end when the SWAP rose above the drought termination threshold, T d _ E = 0.5 . To reduce the interference caused by short-term fluctuations, only processes with a duration of no less than D d = 7 days were defined as valid drought events. If the interval between two adjacent drought events did not exceed 2 days, they were merged into one complete drought process.
For flood events, a flood process was considered to begin when SWAP remained continuously above the flood onset threshold, T f _ S = 1 . The flood process was considered to end when SWAP fell below the flood termination threshold, T f _ E = 0.5 . The minimum duration threshold for a flood event was set to D f = 7 days to exclude the influence of short-duration fluctuations. If the interval between two adjacent flood events did not exceed 2 days, they were merged into one complete flood process.
After independent drought and flood events were identified, a minimum inter-event interval threshold ( M I I T = 5 ) was further introduced to determine DFAA events. Specifically, a DFAA event was identified when the interval between the end of a drought event and the onset of the subsequent flood event did not exceed 5 days, or when the interval between the end of a flood event and the onset of the subsequent drought event did not exceed 5 days.
According to the direction of transition, DFAA events were further classified into two types. DF events refer to cases in which a preceding drought event is followed by a flood phase within a short period, whereas FD events refer to cases in which a preceding flood event is followed by a drought phase within a short period. This classification was used to compare the two event types in terms of process structure, cumulative effects, and spatial distribution, and served as the basis for the subsequent analysis of directional asymmetry. Here, “process structure” refers to the temporal configuration of a DFAA event, including the duration of the preceding anomalous phase, the transition interval between the two opposite phases, and the duration of the subsequent anomalous phase.
For each identified DFAA event, this study established a multidimensional characteristic index system to describe event attributes from the perspectives of duration, frequency, severity, and transition characteristics (Table 2). Specifically, event duration (ED) represents the duration of the drought phase, flood phase, and abrupt transition phase; event frequency (EF) denotes the number of DFAA events occurring within a given period; event severity (ES) refers to the cumulative magnitude of SWAP anomalies over the whole DFAA process, whereas intensity (I) describes the extremity of instantaneous drought or wet conditions within an event. Thus, ES characterizes cumulative process effects, while I reflects short-term extremity; abrupt-transition intensity (K) represents the magnitude and rate of change between drought and flood states; minimum interphase interval time (MIT) denotes the interval between the end of the preceding phase and the onset of the following opposite phase. In this study, MIT is used as a proxy for abrupt-transition duration, with shorter MIT values indicating a more rapid transition; and the severity contribution ratio of the drought and flood phases (R) was defined as the ratio of drought-phase cumulative severity to flood-phase cumulative severity. Values of R > 1 indicate a greater drought-phase contribution, whereas values of R < 1 indicate a greater flood-phase contribution. Together, these indices were used to characterize the process structure of DFAA and its directional differences, and to provide a basis for the subsequent analyses of asymmetry and hazard identification.

2.3.3. Correlation Analysis and Temporal Trend Test

To analyze the temporal variations and interrelationships of the indicators associated with DFAA events, this study conducted statistical analyses from two perspectives: time-series trend detection and monotonic correlation analysis among variables.
To quantitatively identify the long-term trend in the annual frequency series of DFAA events, this study combined the Theil–Sen slope estimator [63,64] with the nonparametric Mann–Kendall (MK) test [65,66]. The Theil–Sen method [63,64] estimates the overall trend by calculating the median of the slopes between all possible pairs of points in a time series, and its expression is given as follows:
β = m e d i a n ( x j x i j i ) ,       j > i
where β denotes the trend slope, while x i and x j represent the values of the time series at times i and j , respectively. This method is insensitive to outliers and is therefore particularly suitable for hydroclimatic time series with strong interannual variability.
The Mann–Kendall [65,66] test was used to assess the significance of the trend in the time series, and its test statistic is defined as follows:
S = i = 1 n 1 j = i + 1 n s g n ( x j x i )
Here, the sign function is defined as follows:
s g n ( x j x i ) = { 1 , x j x i > 0 0 , x j x i = 0 1 , x j x i < 0
The variance is given by:
V a r ( S ) = n ( n 1 ) ( 2 n + 5 ) 18
The standardized test statistic Z is defined as follows:
Z = { S 1 V a r ( S ) , S > 0 0 , S = 0 S + 1 V a r ( S ) , S < 0
The significance level (p-value) was obtained by calculating the Z statistic and referring to the standard normal distribution, and was used to determine whether the trend passed the statistical significance test.
To analyze the monotonic relationships among DFAA-related indicators, this study employed the Spearman rank correlation coefficient [67]. Compared with the Pearson correlation coefficient, this method does not require the variables to follow a normal distribution and is therefore more suitable for the potentially non-normal and nonlinear relationships among hydroclimatic variables [67,68]. Its equation is given as follows [67,68]:
ρ = 1 6 d i 2 n ( n 2 1 )
where d i is the difference between the ranks of the two variables, and the statistical significance of the association was assessed based on the p-value.
In addition, to reduce the influence of interannual variability on result presentation, a 5-year moving average was calculated for the annual DFAA frequency series to facilitate the characterization of interdecadal variations during the study period. It should be noted that the moving-average results were used only for visualization purposes and were not included in the Theil–Sen slope estimation or the Mann–Kendall significance test.

2.3.4. Hazard Assessment

To identify areas with higher relative hazard levels associated with DFAA processes in the Yellow River Basin, this study constructed a comprehensive hazard index (CHI). CHI is defined as a relative composite hazard index that integrates the frequency, duration, severity, abrupt-transition intensity, and minimum interphase interval time of identified precipitation-based DFAA processes to compare their physical hazard-forming potential across grid cells, rather than to predict the probability of future disaster occurrence. In this study, “hazard” refers to the physical hazard-forming potential of identified precipitation-based hydroclimatic DFAA processes, rather than socioeconomic risk or disaster loss [69].
Considering the process characteristics of DFAA, this study selected five indicators—event duration (D), event frequency (F), event severity (S), abrupt-transition intensity (K), and minimum interphase interval time (MIT)—to construct the hazard assessment system. These indicators were selected because they represent the main physical dimensions of DFAA processes. Frequency reflects the occurrence level of DFAA events; duration reflects process persistence; severity represents cumulative dry–wet anomalies; abrupt-transition intensity characterizes the magnitude and rate of dry–wet state change; and MIT reflects the rapidity of phase transition. Previous DFAA studies have commonly used frequency, duration, intensity, and severity to characterize DFAA events, whereas transition-related indicators have recently received increasing attention. Therefore, by incorporating both commonly used indicators and transition-related metrics represented by K and MIT, the indicator system used in this study provides a more comprehensive characterization of the occurrence, persistence, magnitude, and abrupt-transition features of DFAA processes [5,12,44,70]. Because these indicators differ in dimension and magnitude, the range standardization method (Equation (9)) was first applied to normalize them. This procedure follows the general logic of composite-index construction, in which multiple indicators are normalized, directionally unified, weighted, and aggregated into a single comparative index [71]:
X i = X i X m i n X m a x X m i n
where X i denotes the original value of the indicator, and X i denotes the standardized value.
In the absence of a clear basis for assigning prior weights, an equal-weighting method was adopted to integrate the standardized indicators, thereby deriving the comprehensive hazard index:
C H I = D + S + K + M I T + F D F / F D 5
where D , S , K , M I T and F represent the standardized values of duration, severity, abrupt-transition intensity, minimum interphase interval time, and frequency, respectively. To ensure directional consistency in hazard characterization, all indicators were transformed so that higher standardized values consistently indicate higher relative physical hazard. In particular, MIT was inversely normalized because a shorter interphase interval indicates a more abrupt transition and thus a higher physical hazard-forming potential.
A higher CHI value indicates that DFAA events in a given grid cell generally exhibit stronger hazard-related hydroclimatic characteristics, such as higher frequency, longer persistence, greater cumulative severity, and more abrupt transitions, thereby implying a higher relative physical hazard potential. Because CHI does not include exposure or vulnerability, it should be interpreted as a hazard-oriented index rather than a risk index. Subsequently, the natural breaks method was applied to classify CHI into different relative hazard levels, so as to identify the spatial pattern of CHI values in the Yellow River Basin. To compare the spatial differences between different transition directions, CHI was calculated separately for DF and FD events, followed by a comparative spatial analysis.

3. Results

3.1. Basic Spatiotemporal Characteristics of DFAA Events

Based on the DFAA events identified from daily precipitation data during 1960–2024, DFAA in the Yellow River Basin exhibited pronounced regional differences in occurrence frequency, process structure, and spatial distribution. The following analysis first focuses on the spatial pattern and interannual variation of event frequency.

3.1.1. Spatial Distribution of Event Frequency

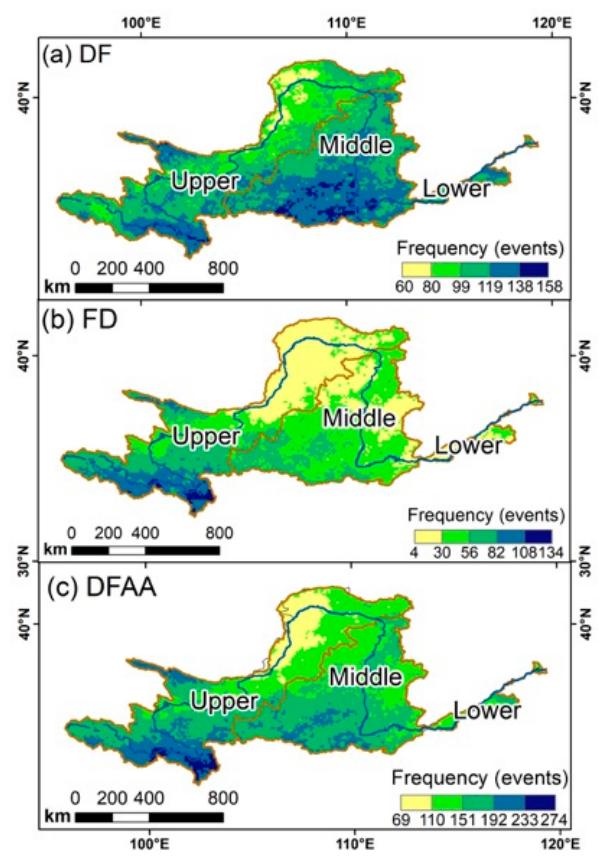
Figure 3 shows the spatial distribution patterns of the occurrence frequency of DF, FD, and overall DFAA events in the Yellow River Basin. Overall, the frequency of DFAA events in the Yellow River Basin exhibited pronounced spatial heterogeneity, with the middle reaches constituting the primary high-frequency cluster, the upper reaches showing moderate frequencies, and the lower reaches being characterized by relatively low frequencies overall.
By event type, the occurrence frequency of DF events was generally higher than that of FD events, and their spatial structure was more continuous. DF events overall exhibited a distribution pattern characterized by “high frequencies in the middle reaches and relatively low frequencies in the upper and lower reaches”. In the upper reaches, frequencies were mainly at a moderate level, with high-value areas scattered sporadically. In the middle reaches, the frequency increased markedly and formed a continuous high-frequency cluster, making this region the most active area for DF events across the entire basin. In the lower reaches, the frequency declined, and the extent of high-frequency areas decreased substantially. In contrast, FD events generally occurred at a lower frequency level, with smaller high-frequency areas and a more fragmented spatial distribution. In the upper reaches, only a few localized sub-high-frequency areas were observed; the middle reaches were dominated by medium- to low-frequency areas, while the lower reaches were mainly characterized by low-frequency areas, indicating relatively weak spatial continuity.
The spatial distribution of the overall event frequency was highly consistent with that of the DF events. The middle reaches formed the most prominent high-frequency core area, the upper reaches remained at an overall moderate level, and the lower reaches were dominated by low-frequency areas, suggesting that the overall spatial pattern of DFAA in the Yellow River Basin was primarily controlled by DF events. Overall, DF and FD exhibited clear differences in both frequency level and spatial organization: the former was characterized by higher frequency and stronger clustering, whereas the latter was dominated by low frequency and a more dispersed distribution. This indicates that DFAA in the Yellow River Basin already shows evident directional differences in terms of event frequency.

3.1.2. Temporal Variation in Annual Frequency

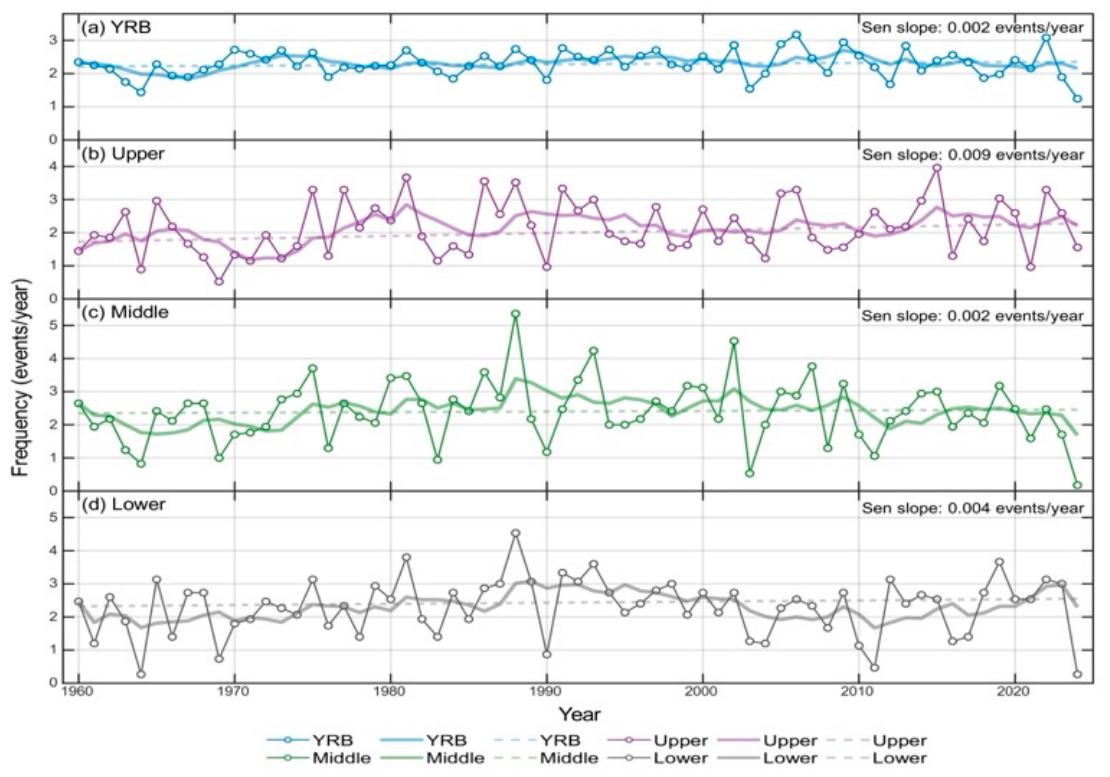
In terms of temporal variation, the annual frequency of DFAA in the Yellow River Basin did not exhibit a significant long-term trend during 1960–2024 (Figure 4). The Theil–Sen slope was 0.002 events yr−1, and the Mann–Kendall test indicated that this trend was not statistically significant, indicating that the annual frequency of DFAA remained generally stable over the study period. The annual frequency mainly fluctuated between 2.0 and 2.8 events yr−1 without showing a significant monotonic increasing trend.
Although the long-term trend was not statistically significant, the 5-year moving average still revealed a certain interdecadal signal. Before the mid-1970s, the annual frequency of DFAA remained at a relatively low level overall. Thereafter, the moving-average curve increased and remained at a relatively high level after the mid-to-late 1990s, while interannual variability also became stronger and high-frequency years occurred more frequently. A regional comparison showed that the number of high-frequency years increased in the later period in the upper reaches, changes were relatively stable in the middle reaches, and the lower reaches exhibited stronger interannual fluctuations. Overall, although the frequency of DFAA in the Yellow River Basin did not show a significant linear trend, it did exhibit an interdecadal pattern characterized by a transition from a relatively low-frequency stage to a medium-to-high-frequency stage, accompanied by enhanced variability.

3.2. Asymmetric Process Structure of DF and FD Events

3.2.1. Differences in Drought and Flood Stage Duration

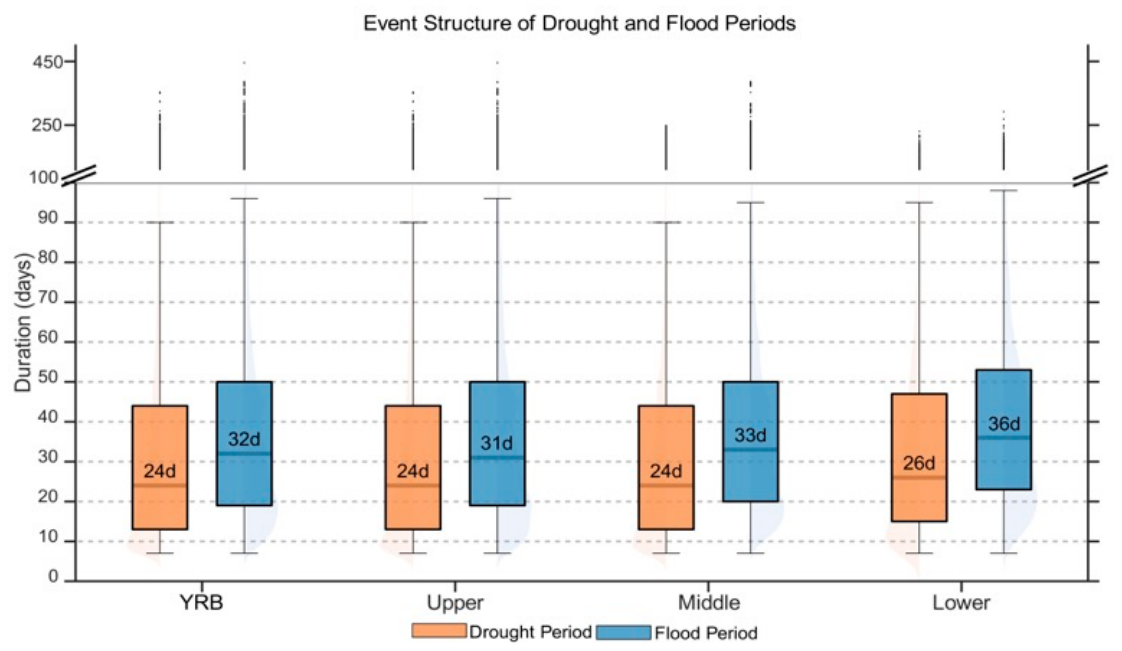
The DFAA events identified based on the SWAP index indicate that DFAA in the Yellow River Basin is not composed of instantaneous switches between dry and wet conditions, but usually includes a preceding anomalous phase and a subsequent anomalous phase, both with clear durations. Overall, the durations of both the drought phase and the flood phase were mainly distributed on the scale of several tens of days, with the flood phase being generally slightly longer than the drought phase. As shown in the statistical results in Figure 5, for the entire basin, the median duration of the drought phase was approximately 24 days, whereas that of the flood phase was about 32 days. In the upper reaches, the median durations of the drought and flood phases were about 24 and 31 days, respectively; in the middle reaches, they were about 24 and 33 days, respectively; and in the lower reaches, they were about 26 and 36 days, respectively. Meanwhile, both at the basin scale and within the sub-basins, the distribution of flood-phase duration was more dispersed and exhibited a certain long-tail characteristic, indicating that some events could persist for a relatively long period after transitioning into the flood phase.

3.2.2. Differences in Transition Duration and Its Relation to Antecedent-Stage Persistence

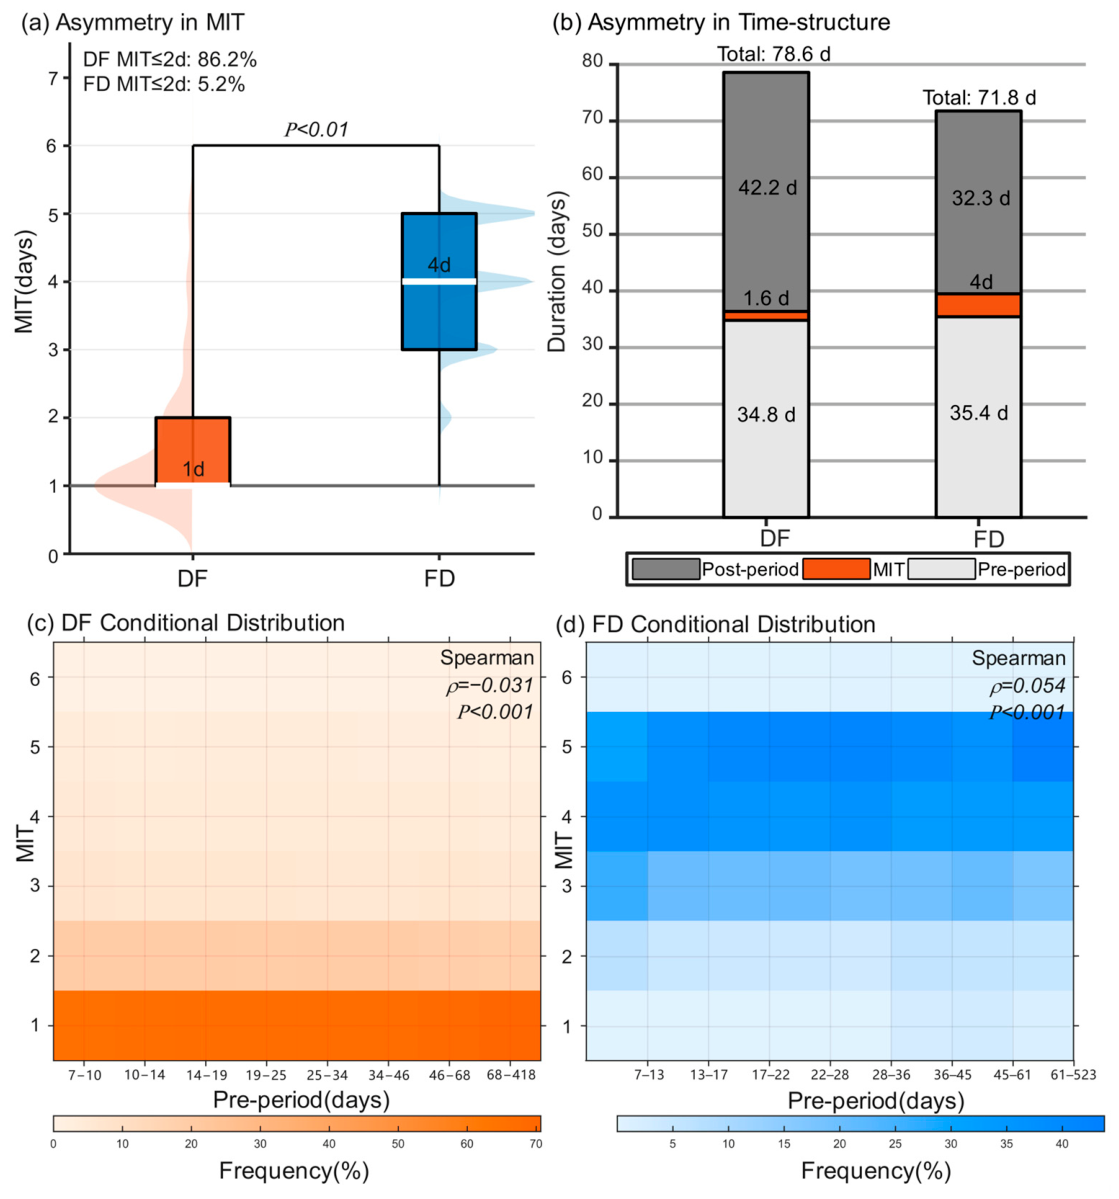
On this basis, DF and FD exhibited markedly different temporal configurations during the transition phase (Figure 6). The abrupt-transition duration (MIT) of DF events was highly concentrated within 1–2 days, with 86.2% of events having M I T 2 days, indicating that the transition from drought to flood usually occurred over an extremely short timescale. In contrast, the MIT of FD events was mainly concentrated within 3–5 days, and only 5.2% of events had M I T 2 days, suggesting that the transition from flood to drought was generally more gradual. The difference in MIT distributions between the two event types was statistically significant ( p < 0.001 ), indicating that this difference was not the result of random fluctuation, but rather a direct manifestation of directional differences in process structure.
A further comparison of the complete event process showed that DF and FD differed in the configuration of the three phases: pre-transition, transition, and post-transition. The durations of the pre-transition phase were comparable in magnitude between the two event types: the mean duration of the pre-transition drought phase in DF events was about 34.8 days, whereas the mean duration of the pre-transition flood phase in FD events was about 35.4 days, indicating that both types of events shared a similar persistence background before entering the abrupt-transition phase. However, the difference in the transition phase was highly pronounced: the mean MIT of DF was only about 1.6 days, whereas that of FD reached 4.0 days. After entering the post-transition phase, this difference became even more evident. The mean duration of the post-transition flood phase in DF events was about 42.2 days, which was clearly longer than the 32.3 days of the post-transition drought phase in FD events. Therefore, the difference between DF and FD was reflected not only in the speed of transition, but also in the persistence structure after the transition: the pre-transition phases were broadly comparable, the transition phases diverged significantly, and the post-transition phases further widened this contrast.
The directional difference of DFAA in the Yellow River Basin was first manifested in process structure. Compared with FD, DF more closely followed an event organization pattern characterized by “antecedent accumulation–rapid shift–prolonged post-transition flood persistence”, whereas FD exhibited a structural pattern of “antecedent flood persistence–relatively gradual transition–relatively shorter post-transition drought persistence”. This indicates that DF and FD are not simply the same process occurring in opposite directions, but rather two distinct types of events with different temporal configurations.
To further examine whether the transition phase was regulated by the antecedent persistence process, the relationship between MIT and the duration of the pre-transition phase was analyzed. The results showed that the two event types also differed markedly in this relationship. For DF events, MIT remained mainly concentrated within 1–2 days across different quantile intervals of antecedent drought duration, with only small differences among intervals. The corresponding Spearman rank correlation coefficient was ρ = 0.03 ( p < 0.001 ), indicating that there was almost no evident monotonic relationship between transition duration and antecedent drought duration. This suggests that once a DF event enters the transition phase, its abrupt-transition duration generally remains confined to a short timescale, reflecting relatively high stability.
In contrast, the MIT distribution of FD events was more dispersed and showed greater variability with changes in the duration of the antecedent flood phase. Its Spearman rank correlation coefficient was ρ = 0.05 ( p < 0.001 ). Although the correlation was still weak, it already indicated a certain degree of dependence compared with DF. This suggests that the transition phase of FD events was more dispersed than that of DF. Although a statistical relationship existed between MIT and antecedent flood duration, the correlation strength remained weak, indicating that this relationship was more a general tendency than a stable one-to-one correspondence.
The asymmetry between DF and FD is reflected not only in the differences in phase duration at the mean level, but also in the stability of the transition process. DF exhibited a shorter and more concentrated transition duration, indicating a more compact process structure. In contrast, FD showed a longer transition duration and greater dispersion, suggesting that its process organization was characterized by a more gradual mode of change. This result further supports the central argument of this study: the directional difference of DFAA in the Yellow River Basin is essentially manifested in different modes of process organization, rather than simply in the sequence of event occurrence.

3.3. Asymmetry in Event Attributes Between DF and FD

3.3.1. Differences in Intensity and Severity

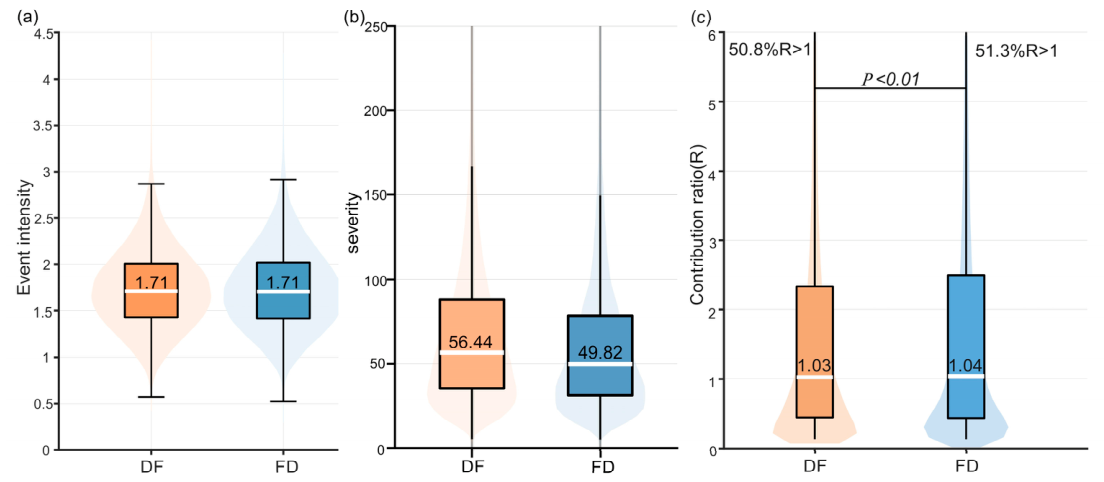
At the level of event attributes, DF and FD did not exhibit asymmetry of the same magnitude across all indicators. As shown in Figure 7, the degree of difference between the two event types varied among intensity, severity, and the drought–flood contribution ratio, with relatively limited differences in instantaneous intensity but much clearer differences in cumulative severity.
In terms of the distribution of intensity ( I ), DF and FD events showed highly similar distributions. The median values of the two event types were nearly identical, and their interquartile ranges overlapped substantially. Both exhibited an overall unimodal distribution with slight right skewness. Meanwhile, the extent of the high-value tails was also broadly similar, with neither event type showing a clear advantage in terms of extreme intensity. Overall, no evident difference in intensity was observed between DF and FD, suggesting that the direction of abrupt transition had a relatively limited effect on instantaneous intensity characteristics.
In contrast, severity ( S ) exhibited a more stable difference between the two event types. The mean and median total severity of DF events were 68.26 and 56.44, respectively, both higher than the corresponding values of 61.39 and 49.82 for FD events. The upper quartile of DF events was 87.81, also exceeding the 78.48 observed for FD events. At the same time, DF events showed more pronounced right skewness and a longer tail, with a wider range of extreme values; the maximum value reached 468.45 compared with 419.56 for FD events. The probability distribution further indicated that DF events had a higher probability of occurring within the medium-to-high severity range, whereas FD events were more concentrated within the moderate severity range. These results suggest that although the two event types were similar in terms of instantaneous intensity, they were not symmetric in cumulative effects, with DF overall exhibiting a higher level of cumulative anomaly.
The contrast between intensity and severity indicates that the directional difference between DF and FD is not mainly reflected in the strength at a single moment, but rather in the cumulative effects developed over the course of the event. This result is consistent with the previous analysis of process structure, namely that the rapid transition and longer post-transition flood phase of DF events are more likely to amplify event strength in a cumulative sense, whereas the more gradual transition of FD events does not necessarily correspond to higher total severity.

3.3.2. Differences in Drought–Flood Contribution Structure

Compared with severity, the asymmetry reflected by the drought–flood contribution ratio ( R ) was weaker, although it still showed a certain statistical difference. Overall, the distributions of R for DF and FD were relatively similar, being mainly concentrated within the range of 0–3, with median values close to 1 in both cases. This indicates that in most events, the contributions of the two phases before and after the transition to total event severity were broadly comparable. Both event types also exhibited a certain degree of right skewness, suggesting that a small number of events were characterized by a clearly dominant contribution from one phase.
A further comparison showed that the proportion of events with R > 1 was 50.8% for DF and 51.3% for FD, with a difference of only 0.5%. Although this difference was statistically significant ( p < 0.01 ), indicating that the overall distribution of contribution structure was not completely identical between the two event types, the actual effect size was small, suggesting that its practical significance should be interpreted with caution in conjunction with the effect size. In other words, DF and FD did not exhibit as strong a divergence in phase dominance as they did in MIT or severity, but the two event types were still not fully symmetric in their phase contribution configuration.
Overall, DF and FD exhibited a hierarchical pattern of asymmetry at the level of event attributes. The distribution of intensity was approximately symmetric, indicating limited differences in instantaneous intensity; severity showed the clearest difference, suggesting that cumulative effects constituted an important manifestation of directional asymmetry; and the contribution ratio lay between the two, displaying only relatively weak differences in probability structure. Therefore, the directional asymmetry of DFAA in the Yellow River Basin is not reflected in a synchronous divergence across all indicators, but arises mainly from differences in cumulative process effects and phase configuration, rather than from instantaneous intensity itself.

3.4. Spatial Manifestation of Asymmetry and Hazard Pattern of DFAA

3.4.1. Spatial Manifestation of Asymmetric Process Characteristics

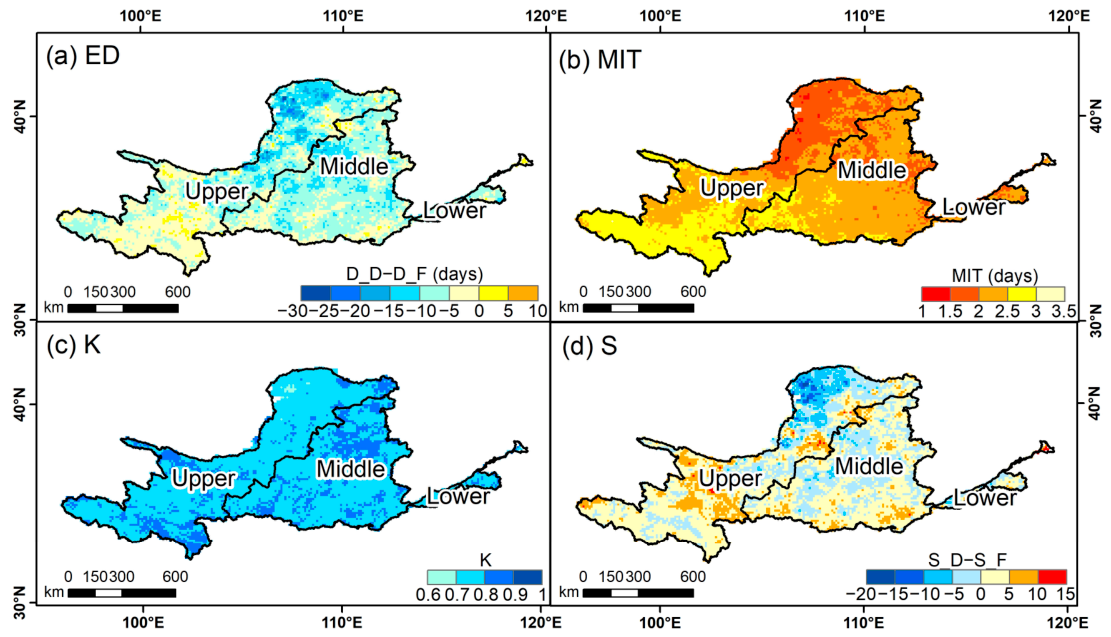
Figure 8 presents the spatial distributions of four process-asymmetry indicators for DFAA events in the Yellow River Basin, including the difference between drought-phase and flood-phase duration (Figure 8a), mean abrupt-transition duration (Figure 8b), abrupt-transition intensity (Figure 8c), and the difference between drought-phase and flood-phase severity (Figure 8d). Overall, these indicators exhibited pronounced spatial heterogeneity at the basin scale, indicating that the directional differences of DFAA are not only manifested at the event scale but also have clear regional expressions. Taken together, the spatial patterns of these indicators suggest that different regions of the Yellow River Basin are characterized by distinct dominant process structures.
In terms of duration differences, the difference between drought-phase and flood-phase duration exhibited an overall spatial pattern of “high in the southwest and low in the northeast”. Positive values were mainly observed in the southwestern upper reaches and the southern middle reaches, indicating that the drought phase generally persisted longer than the flood phase in these regions. In contrast, negative values dominated the northern middle reaches and most of the lower reaches, suggesting that flood-phase duration was more predominant there. This pattern reflects a continuous transition in the Yellow River Basin from drought-phase dominance in the upper reaches to flood-phase dominance in the lower reaches. At the same time, the average abrupt-transition duration (MIT) showed a spatial gradient decreasing from west to east: relatively long transition phases generally occurred in the upper reaches and the western middle reaches, whereas the eastern middle reaches and the lower reaches were mainly characterized by shorter MIT values, indicating that rapid transitions were more likely to occur in the middle and lower reaches.
From the perspectives of transition intensity and severity difference, the middle reaches constituted the most prominent region of process asymmetry. Abrupt-transition intensity ( K ) formed the most distinct high-value concentration in the middle reaches, indicating that dry–wet state transitions were more intense in this region. The severity difference exhibited a relatively clear north–south contrast: negative values were mainly found in the northern upper reaches and the northern margin of the middle reaches, indicating the dominance of flood-phase severity, whereas positive values were concentrated in the southern middle reaches and the southern margin of the upper reaches, suggesting stronger drought-phase severity. Taken together, the four categories of indicators suggest that the spatial asymmetry of DFAA in the Yellow River Basin can be broadly summarized into three regional patterns: the upper reaches and western regions were characterized by drought-phase persistence dominance and relatively gradual transitions; the middle reaches were marked by strong transitions and pronounced process differences; and the lower reaches were mainly characterized by flood-phase persistence dominance and relatively rapid transitions. Therefore, the directional differences between DF and FD were not uniformly distributed across the entire basin, but instead exhibited different dominant process structures in different regions.

3.4.2. Relative Hazard Pattern Derived from Asymmetric DFAA Processes

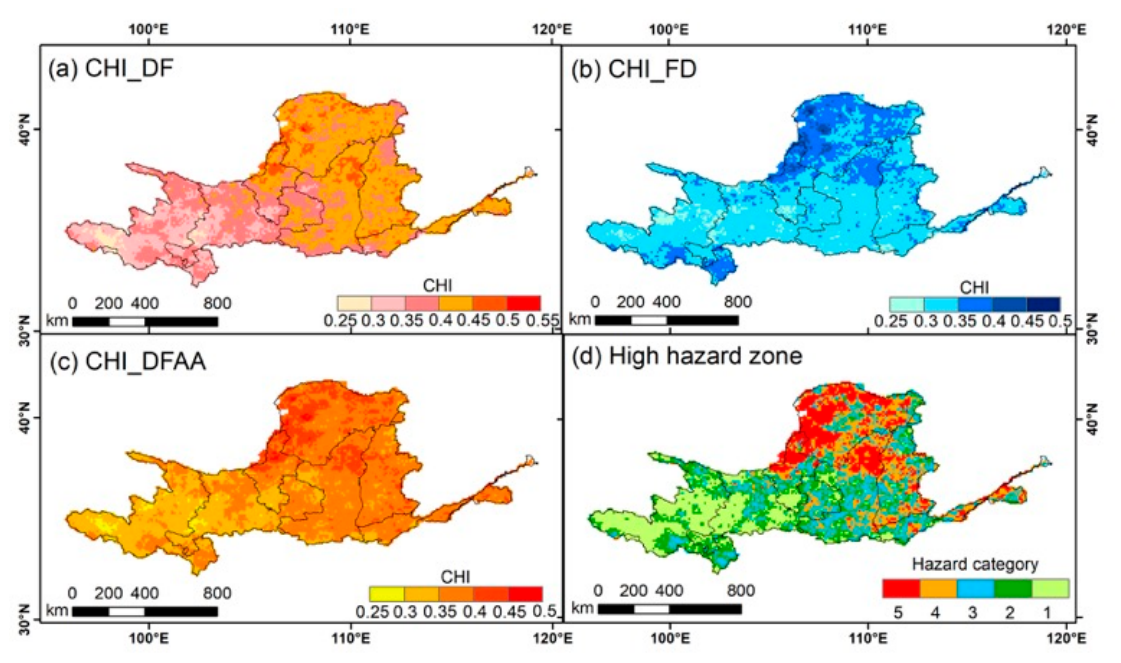
Based on the spatial distribution of the comprehensive hazard index (CHI) (Figure 9), CHI values in the Yellow River Basin exhibited a pronounced spatial clustering pattern. Overall, CHI showed a distribution characterized by “high values in the middle reaches and relatively low values in the upper and lower reaches”, with the northern and central-eastern parts of the middle reaches constituting the most prominent high-value areas. The southwestern part of the upper reaches was generally dominated by low values, whereas the lower reaches were mainly characterized by secondary high-value areas and moderate relative hazard levels. These results indicate that regions with stronger process asymmetry also tended to show higher CHI values.
By event type, the spatial patterns of CHI of DF and FD were not consistent. Areas with higher CHI values associated with DF events were more extensive, mainly forming a continuous belt along northern Shanxi, northern Shaanxi, and the southern margin of the Hetao region, with secondary high-value patches also appearing in northern Henan and northwestern Shandong. In contrast, the areas with higher CHI values of FD events were more localized, being mainly concentrated in the hilly and gully region along the northern Shaanxi–northern Shanxi border, with a spatial extent clearly smaller than that of DF. This indicates that from the perspective of CHI values, the spatial pattern of DFAA in the Yellow River Basin was still primarily dominated by DF events, whereas FD events were characterized more by localized intensification.
According to the classification results, Grades 4–5 high-hazard areas were mainly distributed in the northern and central-eastern parts of the middle reaches, forming a continuous high-value cluster, among which the Grade 5 very high-hazard areas were most prominent along the northern Shaanxi–northern Shanxi border and the southern margin of the Hetao region. Grade 3 moderate-hazard areas were mainly located in the southern middle reaches and parts of the plains in the lower reaches. Grades 1–2 low-hazard areas were mainly distributed in the southwestern plateau region of the upper reaches and the southern margin of the lower reaches. These results suggest that the integrated CHI of DFAA events in the Yellow River Basin does not simply correspond to high values of any single indicator, but rather represents the spatial outcome of the combined effects of multiple process characteristics. Among all regions, the northern and central-eastern parts of the middle reaches constitute the most critical area with concentrated high CHI values in the entire basin.

4. Discussion

4.1. Interpreting the Asymmetric Process of DF and FD

This study shows that DF and FD in the Yellow River Basin are not simply the same type of abrupt alternation event occurring in opposite directions; rather, they exhibit stable differences in transition duration, post-transition persistence, and cumulative effects. Specifically, DF events are generally characterized by a shorter transition phase and a longer-lasting post-transition flood phase, whereas FD events more often exhibit a relatively gradual transition and a more dispersed process structure. This suggests that the directional difference of DFAA is not merely a matter of event sequence, but more fundamentally reflects different modes of process organization between DF and FD transitions [7,12,47].
From the perspective of atmospheric moisture input, the rapid transition of DF events may be associated with a concentrated intensification of precipitation conditions over a short period. Under conditions of strong monsoonal influence or sudden enhancement of moisture transport, a region may rapidly enter a heavy precipitation stage before the antecedent drought has been fully alleviated, thereby exhibiting an abrupt shift from drought to flood within 1–2 days [5,20,72]. Such processes are more likely to form a temporal configuration characterized by “antecedent drought accumulation–short-term heavy precipitation triggering–prolonged post-transition flood persistence”. This pattern may be particularly evident in the middle and lower reaches, where precipitation is more concentrated and flood-season processes are stronger, such that a short-term increase in moisture input may more readily lead to shorter MIT and higher cumulative severity in DF events [15,73]. Although DF events do not appear to be markedly stronger than FD events in terms of instantaneous intensity, they are generally more severe overall, indicating that the difference is more likely to arise from the cumulative amplification jointly caused by rapid transition and prolonged post-transition flood persistence, rather than from anomalous intensity at a single moment alone [12,74].
In contrast, the transition of FD events is usually more gradual, which may be related to the fact that the adjustment from flood to drought requires more time. After the end of a flood process, the shift from a wet state to a drought state depends not only on whether precipitation ceases, but also on processes such as soil moisture depletion, enhanced evapotranspiration, and near-surface moisture redistribution [13,72]. Therefore, the transition from a flood background to drought conditions is often not completed instantaneously, but is more likely to manifest as a gradual drying process over several days. This interpretation is consistent with the results of this study, in which the MIT of FD events was mainly concentrated within 3–5 days and exhibited greater dispersion in transition duration. The asymmetry of FD is thus not primarily reflected in a stronger instantaneous shift, but rather in a longer adjustment phase and a more dispersed mode of event organization [5,7,12].
The regional background of the Yellow River Basin may further reinforce this directional difference. The basin spans arid, semi-arid, and semi-humid zones and is characterized by pronounced topographic relief, with substantial differences among river sections in precipitation concentration, antecedent moisture conditions, and surface storage-regulation capacity [75,76,77]. This study found that the middle reaches were not only the region with higher abrupt-transition intensity, but also the area with relatively high CHI-based hazard potential, suggesting that this region may be more likely to amplify the differences between DF and FD in terms of transition rhythm and post-transition persistence. In particular, in regions with strong climatic transitionality, concentrated intra-annual precipitation, and sensitive surface-process responses, the transitions from drought to flood and from flood to drought may not share the same temporal scale or process form [5,78,79].
The above interpretations are discussed on the basis of the event-process identification results of this study, in conjunction with previous research. The findings indicate that the differences between DF and FD are not simply opposite in direction, but are manifested as relatively stable process asymmetry. A deeper understanding of their formation background and regional differences will still require integrated analyses combining atmospheric circulation, land–surface moisture conditions, and hydrological response processes, in order to more systematically reveal the formation conditions and spatial differentiation of directional differences in DFAA within the Yellow River Basin [80,81,82].

4.2. Pronounced Asymmetry and Hazard in the Middle Reaches of the Yellow River

This study indicates that the middle reaches of the Yellow River are not only the region where the asymmetry of DFAA processes is most pronounced, but also the area where high CHI values are most concentrated. This spatial coincidence suggests that the middle reaches are not merely characterized by a higher frequency of event occurrence; more importantly, the event processes themselves are more likely to exhibit strong transitions, marked differentiation, and higher cumulative effects [83,84].
From the perspective of regional climatic background, the Yellow River Basin as a whole is located in a transitional zone from the influence of the East Asian monsoon to the inland arid and semi-arid regions, while the middle reaches lie in the area where this transitional characteristic is particularly pronounced. Previous studies have pointed out that the Yellow River Basin is a transitional zone jointly influenced by the East Asian monsoon and the westerlies, and that precipitation in the monsoon marginal zone is highly sensitive to changes in large-scale circulation patterns and moisture transport. The interaction or mutual constraint between the westerlies and the monsoon may both lead to strong fluctuations in the timing and intensity of precipitation [85,86]. Against this background, the middle reaches may be more prone to rapid adjustment processes, such as a shift from antecedent dryness to short-term heavy precipitation, or from antecedent wetness to sustained drying, thereby exhibiting stronger directional differences at the event scale [6,16].
From the perspective of topography and underlying surface conditions, the middle reaches of the Yellow River mainly traverse the Loess Plateau and its hilly and gully regions, forming a key topographic transition zone from the upstream plateau and mountain areas to the downstream plains. This region is characterized by pronounced relief, dense gullies, and a fragmented surface, resulting in strong spatial sensitivity in the precipitation–runoff response relationship. Event-scale studies have shown that runoff responses in different subregions of the Loess Plateau are jointly affected by rainfall intensity, rainfall duration, antecedent soil moisture conditions, and land-use characteristics, and that some hilly and gully areas are more likely to generate rapid runoff responses under short-duration heavy rainfall [87,88]. Therefore, the more pronounced asymmetry and hazard observed in the middle reaches may not arise solely from precipitation anomalies themselves, but may also be related to the faster surface and hillslope responses after rainfall input, as well as the more evident amplification of the process [89].
Overall, the stronger asymmetry and higher hazard observed simultaneously in the middle reaches of the Yellow River are likely attributable to the combined influence of two background conditions. First, this region lies in a setting characterized by strong interaction between the monsoon and the westerlies, as well as pronounced dry–wet transitionality, which makes the precipitation process itself more variable. Second, the region is situated within a marked topographic transition zone, where event-scale hydrological responses are more sensitive to rainfall input. The former may make drought–flood state transitions more prone to strong differentiation, whereas the latter may further amplify the expression of such process differences in terms of hazard. However, the evidence provided in this study still remains mainly at the level of event identification and spatial statistics. Further integrated analyses combining atmospheric circulation, moisture transport, soil moisture, and runoff data are still needed to more rigorously examine the formation conditions and dominant drivers of the high asymmetry and high hazard in the middle reaches of the Yellow River [90,91]. It should also be noted that the present study focused on precipitation-based hydroclimatic DFAA events identified from gridded daily SWAP anomalies. Future studies could further extend the present framework from the grid-scale hydroclimatic perspective to a basin-scale hydrological perspective by incorporating streamflow, soil moisture, reservoir regulation, runoff-generation processes, and socioeconomic exposure, so as to better distinguish meteorological, hydrological, and impact-based DFAA processes [4].

5. Conclusions

Based on daily precipitation data from 1960 to 2024, this study developed an identification and asymmetry analysis framework for DFAA events by integrating the SWAP index with run theory, and systematically revealed the spatiotemporal evolution, process-structure differences, and comprehensive hazard patterns of DFAA events in the Yellow River Basin. The main conclusions are as follows:
(1) DFAA does not follow a single evolutionary pattern, and DF dominates in both occurrence frequency and spatial continuity. DFAA in the Yellow River Basin exhibited pronounced spatial heterogeneity, with an overall pattern of “higher in the middle reaches and lower in the upper and lower reaches”. The occurrence of DF and FD was clearly asymmetric. DF events were generally more frequent than FD events and formed a more continuous high-frequency active belt in the middle reaches, whereas FD events were characterized by a distinctly low-frequency and spatially fragmented pattern. This indicates that the overall spatial pattern and hazard distribution of DFAA in the Yellow River Basin are influenced to a greater extent by the frequency and spatial continuity of DF events.
(2) Under the identification framework adopted in this study, the major differences between DF and FD were concentrated more in process structure and cumulative effects than in instantaneous intensity itself. The two event types showed no significant difference in intensity, but exhibited fundamental asymmetry in their temporal organization. DF was characterized by a compact structure of “short drought–rapid flood transition–prolonged post-transition persistence”, with an extremely short transition duration (MIT; mostly 1–2 days) and a significantly longer-lasting post-transition flood phase. In contrast, FD exhibited a pattern of “gradual transition–more dispersed process organization”, in which the transition process usually required a longer adjustment period (mostly 3–5 days).
(3) The asymmetry was reflected mainly in cumulative severity rather than in instantaneous magnitude. The directional difference was manifested more in the cumulative effects of moisture anomalies. Because DF was characterized by a faster transition rhythm and longer post-transition persistence, its severity was significantly higher than that of FD, and it exhibited a higher occurrence frequency within the medium-to-high severity range. This suggests that the directional difference of DFAA arises mainly from the temporal configuration and cumulative intensity of the process, rather than from the magnitude of change at a single moment.
(4) Process asymmetry had a clear spatial projection, and the middle reaches exhibited relatively high CHI-based hazard potential. The assessment based on the comprehensive hazard index (CHI) revealed that the northern and central-eastern parts of the middle reaches of the Yellow River constituted the major concentration areas of DFAA hazard in the entire basin. This region was not only characterized by the highest abrupt-transition intensity and the most pronounced process asymmetry, but also represented the area where both DF- and FD-related high-CHI features were evident. It should be noted that such high-value areas represent extreme physical process characteristics and potential hazard-forming capacity, and do not directly equate to socioeconomic loss risk; accordingly, refined prevention and control in these areas should place greater emphasis on rapid response during critical transition periods.

Author Contributions

Conceptualization, H.G. and S.Z.; methodology, H.G.; software, H.G.; validation, S.Z. and W.G.; formal analysis, S.Z.; resources, P.D.M. and H.G.; data curation, H.G.; writing—original draft preparation, S.Z.; writing—review and editing, H.G., W.W., L.Z., W.G., P.D.M. and S.Z.; visualization, S.Z.; supervision, H.G.; project administration, H.G.; funding acquisition, H.G. All authors have read and agreed to the published version of the manuscript.

Funding

This research was funded by the Natural Science Foundation of Shandong Province (Grant No. ZR2025MS536), the Rizhao Natural Science Foundation (Grant No. RZ2024ZR12), and the Youth Innovation Teams in Colleges and Universities of Shandong Province (2022KJ178).

Data Availability Statement

The CHM_PRE V2 precipitation dataset used in this study is publicly available from the National Tibetan Plateau Data Center. The processed data and codes that support the findings of this study are available from the corresponding author upon reasonable request.

Acknowledgments

The authors would like to thank the National Tibetan Plateau Data Center for providing the CHM_PRE V2 daily gridded precipitation dataset used in this study. The authors also sincerely appreciate the editors and anonymous reviewers for their constructive comments and valuable suggestions, which helped improve the quality of this manuscript. During the preparation of this manuscript, the authors used ChatGPT version 5.5 (OpenAI, accessed on 10 April 2026) for language polishing and expression refinement. The authors have reviewed and edited the output and take full responsibility for the content of this publication.

Conflicts of Interest

The authors declare no conflicts of interest.

References

  1. Hao, Z.; Singh, V.P.; Hao, F. Compound Extremes in Hydroclimatology: A Review. Water 2018, 10, 718. [Google Scholar] [CrossRef]
  2. Liu, S.; Chen, Y.; Yin, Y.; Gu, Q.; Long, X.; Li, Y.; Yu, W.; Huang, P. The frequency, intensity, and alternation timing of dry-wet abrupt alternation events and the possible correlation with the summer rain belt/season in China. Atmos. Res. 2025, 326, 108263. [Google Scholar] [CrossRef]
  3. Wang, H.; Wang, S.; Shu, X.; He, Y.; Huang, J. Increasing occurrence of sudden turns from drought to flood over China. J. Geophys. Res. Atmos. 2024, 129, e2023JD039974. [Google Scholar] [CrossRef]
  4. Cui, H.; Jiang, S.; Ren, L.; Qin, T.; Zhu, Q.; Fang, X.; Xu, C.-Y. Identification of drought-flood abrupt alternation by a new non-stationary framework considering natural-social system impacts. J. Hydrol. 2025, 654, 132899. [Google Scholar]
  5. Zhang, G.; Wang, H.; Gan, T.Y.; Zhang, S.; Zhao, J.; Su, X.; Fu, X.; Shi, L.; Xu, P.; Lu, M.; et al. A comprehensive review of recent progress on the drought-flood abrupt alternation. J. Hydrol. 2025, 661, 133806. [Google Scholar] [CrossRef]
  6. Su, J.; Ding, Y.; Liu, Y.; Wang, J.; Zhang, Y. China is suffering from fewer but more severe drought to flood abrupt alternation events. Weather Clim. Extrem. 2024, 46, 100737. [Google Scholar]
  7. Bai, X.Y.; Wang, Z.X.; Wu, J.F.; Zhang, Z.X.; Zhang, P.P. A novel multivariate multiscale index for drought-flood abrupt alternations: Considering precipitation, evapotranspiration, and soil moisture. J. Hydrol. 2024, 643, 132039. [Google Scholar] [CrossRef]
  8. Zhao, L.; Aiyub, K.; Ata, F.M.; Lam, K.C.; Sun, M. A systematic review of methods for identifying drought-flood abrupt alternation: Advances and future directions. Front. Environ. Sci. 2025, 13, 1590613. [Google Scholar] [CrossRef]
  9. Bai, X.; Zhao, C.; Tang, Y.; Zhang, Z.; Yang, B.; Wang, Z. Identification, physical mechanisms and impacts of drought–flood abrupt alternation: A review. Front. Earth Sci. 2023, 11, 1203603. [Google Scholar] [CrossRef]
  10. He, N.; Yin, J.; Liu, P.; Fu, X.; Zhang, Q.; Cheng, L.; Moulds, S.; Volchak, A. Global increases in dry-wet abrupt alternation events under climate change. Geophys. Res. Lett. 2025, 52, e2025GL117322. [Google Scholar] [CrossRef]
  11. Zhang, W.; Luo, M.; Gao, S.; Chen, W.; Hari, V.; Khouakhi, A. Compound hydrometeorological extremes: Drivers, mechanisms and methods. Front. Earth Sci. 2021, 9, 673495. [Google Scholar] [CrossRef]
  12. Zhou, W.; Liu, D.D.; Zhang, J.Y.; Jiang, S.N.; Xing, S.Y.; Wang, J.D.; Cheng, Y.F.; Chen, N.N. Identification and frequency analysis of drought-flood abrupt alternation events using a daily-scale standardized weighted average of the precipitation index. Front. Environ. Sci. 2023, 11, 1142259. [Google Scholar] [CrossRef]
  13. Liang, Y.; Han, P.; Kim, T.-W.; Zhang, X.; Li, Z.; Liu, H.; Chen, S. Development of drought-flood abrupt alternations identification method based on daily soil moisture index: Spatiotemporal characterization and risk assessment in the middle and lower reaches of Yangtze River Basin. J. Hydrol. Reg. Stud. 2025, 61, 102690. [Google Scholar] [CrossRef]
  14. Zhao, D.; Deng, S.; Zhang, J. Spatiotemporal characteristics of dry-wet abrupt alternation events in China during 1960–2018. Int. J. Climatol. 2022, 42, 9612–9625. [Google Scholar] [CrossRef]
  15. Tong, Y.; Chen, Y.; Qu, Y.; Bento, V.A.; Song, H.; Qiu, H.; Shui, W.; Zeng, J.; Wang, Q. Evolution and prediction of drought-flood abrupt alternation in mainland China using an improved index. Clim. Dyn. 2025, 63, 392. [Google Scholar] [CrossRef]
  16. Bi, W.; Li, M.; Weng, B.; Yan, D.; Dong, Z.; Feng, J.; Wang, H. Drought-flood abrupt alteration events over China. Sci. Total Environ. 2023, 875, 162529. [Google Scholar] [CrossRef] [PubMed]
  17. Zhang, Y.; You, Q.; Ullah, S.; Chen, C.; Shen, L.; Liu, Z. Substantial increase in abrupt shifts between drought and flood events in China based on observations and model simulations. Sci. Total Environ. 2023, 876, 162822. [Google Scholar] [CrossRef] [PubMed]
  18. Zheng, S.; Weng, B.; Bi, W.; Yan, D.; Ren, L.; Wang, H. Significant increase and escalation of drought-flood abrupt alteration in China’s future. Agric. Water Manag. 2025, 312, 109449. [Google Scholar] [CrossRef]
  19. Wei, Y.; Li, H.; Zhou, Y.; Commey, N.A.; Jin, J.; Zhou, P. Study on the evolution of regional future drought-flood abrupt alternation events. J. Hydrol. Reg. Stud. 2025, 59, 102459. [Google Scholar] [CrossRef]
  20. Ren, J.; Wang, W.; Wei, J.; Li, H.; Li, X.; Liu, G.; Chen, Y.; Ye, S. Evolution and prediction of drought-flood abrupt alternation events in Huang-Huai-Hai River Basin, China. Sci. Total Environ. 2023, 869, 161707. [Google Scholar] [CrossRef]
  21. Ji, Y.; Lu, X.; Zhang, X.; Hui, F. Spatiotemporal dynamics and agricultural impacts of droughts and floods in China: A systematic review. Nat. Hazards 2025, 121, 20729–20758. [Google Scholar] [CrossRef]
  22. Arias-Real, R.; Delgado-Baquerizo, M.; Sabater, S.; Gutiérrez-Cánovas, C.; Valencia, E.; Aragón, G.; Cantón, Y.; Datry, T.; Giordani, P.; Medina, N.G. Unfolding the dynamics of ecosystems undergoing alternating wet-dry transitional states. Ecol. Lett. 2024, 27, e14488. [Google Scholar] [CrossRef]
  23. Duan, J.; Yang, N.; Yue, Y.; Jiao, Y.; Wu, B.; Li, H. Investigating the Mechanisms of Hydrological Impact due to Drought–Flood Abrupt Alternation in the Upper Hanjiang River Basin, China. J. Hydrometeorol. 2025, 26, 1493–1509. [Google Scholar] [CrossRef]
  24. Wang, L.; Guo, S.L.; Wang, J.; Chen, Y.B.; Qiu, H.; Zhang, J.; Wei, X.J. A novel multi-scale standardized index analyzing monthly to sub-seasonal drought-flood abrupt alternation events in the Yangtze River basin. J. Hydrol. 2024, 633, 130999. [Google Scholar]
  25. Vicente-Serrano, S.M.; Beguería, S.; López-Moreno, J.I. A Multiscalar Drought Index Sensitive to Global Warming: The Standardized Precipitation Evapotranspiration Index. J. Clim. 2010, 23, 1696–1718. [Google Scholar] [CrossRef]
  26. Shukla, S.; Wood, A.W. Use of a standardized runoff index for characterizing hydrologic drought. Geophys. Res. Lett. 2008, 35, L02405. [Google Scholar] [CrossRef]
  27. Sabljić, L.; Lukić, T.; Bajić, D.; Marković, S.B.; Spalevic, V.; Cvetković, V.M.; Delić, D.; Adžić, D.; Aleksova, B.; Milevski, I. Spatio-temporal analysis of flood events using GIS and remote sensing-based approach in the Ukrina River Basin, Bosnia and Herzegovina. Open Geosci. 2025, 17, 20250856. [Google Scholar] [CrossRef]
  28. Sabljić, L.; Bajić, D.; Marković, S.B.; Adžić, D.; Spalevic, V.; Sestraș, P.; Pavić, D.; Lukić, T. Remote Sensing and GIS Assessment of Drought Dynamics in the Ukrina River Basin, Bosnia and Herzegovina. Atmosphere 2026, 17, 124. [Google Scholar] [CrossRef]
  29. Qiao, Y.; Xu, W.; Wu, D.; Meng, C.; Qin, L.; Li, Z.; Zhang, X. Changes in the spatiotemporal patterns of dry/wet abrupt alternation frequency, duration, and severity in Mainland China, 1980–2019. Sci. Total Environ. 2022, 838, 156521. [Google Scholar] [CrossRef]
  30. Lai, C.G.; Wang, Y.X.; Zhao, Y.X.; Wang, Z.L.; Wu, X.S.; Bai, X.Y. A novel daily-scale index for detecting drought-flood abrupt alternation events: Proof from Pearl River Basin, China. Atmos. Res. 2025, 315, 107892. [Google Scholar] [CrossRef]
  31. Yang, J.; Chen, H.; Hou, Y.; Zhao, Y.; Chen, Q.; Xu, C.; Chen, J. A method to identify the drought-flood transition based on the meteorological drought index. Acta Geogr. Sin. 2019, 74, 2358–2370. [Google Scholar]
  32. Zhang, R.; Bento, V.A.; Qi, J.; Xu, F.; Wu, J.; Qiu, J.; Li, J.; Shui, W.; Wang, Q. The first high spatial resolution multi-scale daily SPI and SPEI raster dataset for drought monitoring and evaluating over China from 1979 to 2018. Big Earth Data 2023, 7, 860–885. [Google Scholar] [CrossRef]
  33. Baez-Villanueva, O.M.; Zambrano-Bigiarini, M.; Miralles, D.G.; Beck, H.E.; Siegmund, J.F.; Alvarez-Garreton, C.; Verbist, K.; Garreaud, R.; Boisier, J.P.; Galleguillos, M. On the timescale of drought indices for monitoring streamflow drought considering catchment hydrological regimes. Hydrol. Earth Syst. Sci. 2024, 28, 1415–1439. [Google Scholar] [CrossRef]
  34. Gebrechorkos, S.H.; Peng, J.; Dyer, E.; Miralles, D.G.; Vicente-Serrano, S.M.; Funk, C.; Beck, H.E.; Asfaw, D.T.; Singer, M.B.; Dadson, S.J. Global high-resolution drought indices for 1981–2022. Earth Syst. Sci. Data 2023, 15, 5449–5466. [Google Scholar] [CrossRef]
  35. Lu, E. Determining the start, duration, and strength of flood and drought with daily precipitation: Rationale. Geophys. Res. Lett. 2009, 36, L12707. [Google Scholar] [CrossRef]
  36. Zhang, B.W.; Chen, Y.; Chen, X.W.; Gao, L.; Liu, M.B. Spatial-Temporal Variations of Drought-Flood Abrupt Alternation Events in Southeast China. Water 2024, 16, 498. [Google Scholar] [CrossRef]
  37. Faiz, M.A.; Zhang, Y.; Ma, N.; Baig, F.; Naz, F.; Niaz, Y. Drought indices: Aggregation is necessary or is it only the researcher’s choice? Water Supply 2021, 21, 3987–4002. [Google Scholar] [CrossRef]
  38. Anderson, B.J.; Muñoz-Castro, E.; Tallaksen, L.M.; Matano, A.; Götte, J.; Armitage, R.; Magee, E.; Brunner, M.I. What is a drought-to-flood transition? Pitfalls and recommendations for defining consecutive hydrological extreme events. Hydrol. Earth Syst. Sci. 2025, 29, 6069–6092. [Google Scholar]
  39. Abebe, A.K.; Zhou, X.; Lv, T.; Tao, Z.; Bayissa, Y.; Zhang, H.; Elnashar, A. Advancing basin-scale drought monitoring: Development of a regional combined drought index using precipitation, soil moisture, and vegetation data. Agric. Water Manag. 2025, 318, 109734. [Google Scholar] [CrossRef]
  40. Li, Y.; Li, H.; Feng, K. Deriving phase-contingent dynamic drought-limited water levels: An adaptive framework for managing megadrought evolution. J. Hydrol. Reg. Stud. 2026, 64, 103309. [Google Scholar] [CrossRef]
  41. Yevjevich, V.M. An Objective Approach to Definitions and Investigations of Continental Hydrologic Droughts; Colorado State University: Fort Collins, CO, USA, 1967. [Google Scholar]
  42. Mishra, A.K.; Singh, V.P. A review of drought concepts. J. Hydrol. 2010, 391, 202–216. [Google Scholar] [CrossRef]
  43. Nam, W.-H.; Hayes, M.J.; Svoboda, M.D.; Tadesse, T.; Wilhite, D.A. Drought hazard assessment in the context of climate change for South Korea. Agric. Water Manag. 2015, 160, 106–117. [Google Scholar] [CrossRef]
  44. Zhao, Y.; Weng, Z.H.; Chen, H.; Yang, J.W. Analysis of the Evolution of Drought, Flood, and Drought-Flood Abrupt Alternation Events under Climate Change Using the Daily SWAP Index. Water 2020, 12, 1969. [Google Scholar] [CrossRef]
  45. Wang, L.; Yuan, Z.; Shi, X.L.; Yin, J.; Qin, T.L.; Zhang, J. A driving force analysis method for drought-flood abrupt alternation events. Ecol. Inform. 2025, 90, 103214. [Google Scholar] [CrossRef]
  46. Jin, Y.; Luo, M.; Liu, B.-J.; Wang, M.; Xu, H.; Ma, S.-Y.; Tian, Y.-L.; Fu, J. Climate change characteristics of regional drought–flood abrupt alternation events in the low-latitude plateau of southwest China. J. Water Clim. Change 2026, 17, 380. [Google Scholar] [CrossRef]
  47. Li, X.; Yuan, C.; Sun, T.; Fan, H. Identifying the spatiotemporal patterns of drought-flood alternation based on IMERG product in the humid subtropical Poyang Lake basin, China. J. Hydrol. Reg. Stud. 2024, 54, 101912. [Google Scholar] [CrossRef]
  48. Huang, F.; Jing, J.; Dai, C.; Qi, P. Drought–Flood Abrupt Alternation in the Heilongjiang River Basin Under Climate Change: Spatiotemporal Patterns, Drivers, and Projections. Water 2025, 17, 3436. [Google Scholar] [CrossRef]
  49. Piao, S.; Ciais, P.; Huang, Y.; Shen, Z.; Peng, S.; Li, J.; Zhou, L.; Liu, H.; Ma, Y.; Ding, Y. The impacts of climate change on water resources and agriculture in China. Nature 2010, 467, 43–51. [Google Scholar] [CrossRef] [PubMed]
  50. Feng, S.; Hu, Q.; Qian, W. Quality control of daily meteorological data in China, 1951–2000: A new dataset. Int. J. Climatol. J. R. Meteorol. Soc. 2004, 24, 853–870. [Google Scholar] [CrossRef]
  51. Huang, J.; Li, Y.; Fu, C.; Chen, F.; Fu, Q.; Dai, A.; Shinoda, M.; Ma, Z.; Guo, W.; Li, Z. Dryland climate change: Recent progress and challenges. Rev. Geophys. 2017, 55, 719–778. [Google Scholar] [CrossRef]
  52. Jiang, S.; Cui, H.; Ren, L.; Yan, D.; Yang, X.; Yuan, S.; Liu, Y.; Wang, M.; Xu, C.-Y. Will China’s Yellow River basin suffer more serious combined dry and wet abrupt alternation in the future? J. Hydrol. 2023, 624, 129871. [Google Scholar] [CrossRef]
  53. Barendrecht, M.H.; Matanó, A.; Mendoza, H.; Weesie, R.; Rohse, M.; Koehler, J.; de Ruiter, M.; Garcia, M.; Mazzoleni, M.; Aerts, J.C. Exploring drought-to-flood interactions and dynamics: A global case review. Wiley Interdiscip. Rev. Water 2024, 11, e1726. [Google Scholar] [CrossRef]
  54. Zhang, Z.W.; Wang, S.Y.; Zhang, J.Y. Spatiotemporal evolution of carbon budget and carbon compensation zoning of urban agglomerations in the Yellow River Basin. Sci. Rep. 2024, 14, 17984. [Google Scholar] [CrossRef]
  55. Lu, J.; Su, X.; Zhang, T.; Wu, H. Increased risks of spatially concurrent droughts in the yellow river basin under climate warming. J. Hydrol. 2025, 663, 134186. [Google Scholar] [CrossRef]
  56. Wang, Q.; Wang, Y.; Niu, C.; Huang, M. Constructing the Joint Probability Spatial Distribution of Different Levels of Drought Risk Based on Copula Functions: A Case Study in the Yellow River Basin. Water 2024, 16, 3374. [Google Scholar] [CrossRef]
  57. Li, Y.; Wang, X.H.; Wan, Y.X.; Xu, B. Spatial pattern evolution and driving forces of ecosystem service value in the Yellow River Basin. Front. Environ. Sci. 2025, 13, 1562274. [Google Scholar] [CrossRef]
  58. Hu, J.; Miao, C.; Su, J.; Zhang, Q.; Gou, J.; Sun, Q. An upgraded high-precision gridded precipitation dataset for the Chinese mainland considering spatial autocorrelation and covariates. Earth Syst. Sci. Data 2025, 17, 3987–4004. [Google Scholar] [CrossRef]
  59. Han, J.; Miao, C.; Gou, J.; Zheng, H.; Zhang, Q.; Guo, X. A new daily gridded precipitation dataset for the Chinese mainland based on gauge observations. Earth Syst. Sci. Data 2023, 15, 3147–3161. [Google Scholar] [CrossRef]
  60. Sun, Q.; Miao, C.; Duan, Q.; Ashouri, H.; Sorooshian, S.; Hsu, K.L. A review of global precipitation data sets: Data sources, estimation, and intercomparisons. Rev. Geophys. 2018, 56, 79–107. [Google Scholar] [CrossRef]
  61. Cao, H.; Yang, Q.; Yang, W.; Zhao, L. China’s three major cereal crops exposed to compound drought and extreme rainfall events. Nat. Hazards Earth Syst. Sci. 2025, 25, 5017–5031. [Google Scholar] [CrossRef]
  62. Li, X.; Wei, Y.; Li, F. Optimality of antecedent precipitation index and its application. J. Hydrol. 2021, 595, 126027. [Google Scholar] [CrossRef]
  63. Theil, H. A rank-invariant method of linear and polynomial regression analysis. Indag. Math. 1950, 12, 173. [Google Scholar]
  64. Sen, P.K. Estimates of the regression coefficient based on Kendall’s tau. J. Am. Stat. Assoc. 1968, 63, 1379–1389. [Google Scholar] [CrossRef]
  65. Mann, H.B. Nonparametric tests against trend. Econom. J. Econom. Soc. 1945, 13, 245–259. [Google Scholar] [CrossRef]
  66. Kendall, M.G. Rank Correlation Methods, 3rd ed.; Charles Griffin & Company Ltd.: London, UK, 1962. [Google Scholar]
  67. Yue, S.; Pilon, P.; Cavadias, G. Power of the Mann–Kendall and Spearman’s rho tests for detecting monotonic trends in hydrological series. J. Hydrol. 2002, 259, 254–271. [Google Scholar] [CrossRef]
  68. Helsel, D.R.; Hirsch, R.M. Statistical Methods in Water Resources; Elsevier: Amsterdam, The Netherlands, 1993. [Google Scholar]
  69. IPCC. The Concept of Risk in the IPCC Sixth Assessment Report: A Summary of Cross-Working Group Discussions; Intergovernmental Panel on Climate Change: Geneva, Switzerland, 2020. [Google Scholar]
  70. Son, H.-J.; Kim, J.E.; Byun, S.H.; Lee, J.-H.; Kim, T.-W. Monitoring and evaluating the severity of drought-flood abrupt alternation events using daily standardized precipitation index. KSCE J. Civ. Eng. 2024, 28, 1002–1010. [Google Scholar] [CrossRef]
  71. Michela, N.; Michaela, S.; Andrea, S.; Stefano, T.; Anders, H.; Enrico, G. Handbook on Constructing Composite Indicators: Methodology and User Guide; OECD publishing: Paris, France, 2008. [Google Scholar]
  72. Shi, W.; Huang, S.; Liu, D.; Huang, Q.; Han, Z.; Leng, G.; Wang, H.; Liang, H.; Li, P.; Wei, X. Drought-flood abrupt alternation dynamics and their potential driving forces in a changing environment. J. Hydrol. 2021, 597, 126179. [Google Scholar] [CrossRef]
  73. Xue, L.; Zhang, Y.; Liu, Y. Comparative study on change characteristics of drought-flood abrupt alternation in arid and humid zones. Water Resour. Prot. 2024, 40, 1–8. [Google Scholar]
  74. Yan, J.; Zheng, T.; Zhao, J.; Luo, J. Bridging rarity of drought-flood abrupt alternation events with reverse distributions or reverse copulas. Water Res. 2025, 287, 124433. [Google Scholar] [CrossRef]
  75. Yu, J.; Xiao, R.; Liang, M.; Wang, Y.; Wang, S. Hydrological drought assessment of the Yellow River Basin based on non-stationary model. J. Hydrol. Reg. Stud. 2024, 56, 101974. [Google Scholar] [CrossRef]
  76. Li, X.; Zou, L.; Xia, J.; Wang, F.; Hu, B.; Li, H. Clarifying the impacts of climate and vegetation changes on hydrological drought in the Yellow River Basin, China. J. Hydrol. Reg. Stud. 2025, 61, 102678. [Google Scholar] [CrossRef]
  77. Wang, M.; Chen, Y.; Li, J.; Zhao, Y. Spatiotemporal evolution and driving force analysis of drought characteristics in the Yellow River Basin. Ecol. Indic. 2025, 170, 113007. [Google Scholar] [CrossRef]
  78. Meng, X.; Lin, C.; Ding, J.; Wang, G.; Zhang, J.; Wang, H.; Chu, C. Spatiotemporal evolution of droughts and floods in the Yellow River Basin: A novel approach combining CMADS-L evaluation, hydroclimatic zonation and CNN-LSTM prediction. J. Hydrol. Reg. Stud. 2025, 58, 102250. [Google Scholar] [CrossRef]
  79. Wei, C.; Su, D.; Zhao, D.; Li, Y.; He, J.; Wang, Z.; Cao, L.; Jia, H. Spatiotemporal analysis of drought and its driving factors in the Yellow River Basin based on a standardized precipitation evapotranspiration index. Atmosphere 2025, 16, 145. [Google Scholar] [CrossRef]
  80. Xie, M.; Ren, Z.; Li, Z.; Zhang, X.; Ma, X.; Li, P.; Shen, Z. Evolution of the precipitation–stream runoff relationship in different precipitation scenarios in the Yellow River Basin. Urban Clim. 2023, 51, 101609. [Google Scholar] [CrossRef]
  81. Ji, P.; Yuan, X.; Jiao, Y. Future hydrological drought changes over the upper Yellow River basin: The role of climate change, land cover change and reservoir operation. J. Hydrol. 2023, 617, 129128. [Google Scholar] [CrossRef]
  82. Wang, Y.; Wang, S.; Chen, Y.; Wang, F.; Liu, Y.; Zhao, W. Anthropogenic drought in the Yellow River basin: Multifaceted and weakening connections between meteorological and hydrological droughts. J. Hydrol. 2023, 619, 129273. [Google Scholar] [CrossRef]
  83. Kang, L.; Wen, Y.; Zhou, L.; Chen, H.; Ye, J. Drought driving mechanism and risk situation prediction based on machine learning models in the Yellow River Basin, China. Geomat. Nat. Hazards Risk 2023, 14, 2279493. [Google Scholar] [CrossRef]
  84. Sun, Y.; Zhang, Q.; Singh, V.P. Flooding in the Yellow River Basin, China: Spatiotemporal patterns, drivers and future tendency. J. Hydrol. Reg. Stud. 2024, 52, 101706. [Google Scholar] [CrossRef]
  85. Xiao, S.; Peng, X.; Tian, Q.; Ding, A.; Xie, J.; Su, J. Interaction between the East Asian summer monsoon and westerlies as shown by tree-ring records. Clim. Past 2024, 20, 1687–1701. [Google Scholar] [CrossRef]
  86. Kim, Y.-H.; Min, S.-K. Future changes in regional inter-monthly precipitation patterns of the East Asian summer monsoon and associated uncertainty factors. Earth Syst. Dyn. 2025, 16, 1135–1151. [Google Scholar] [CrossRef]
  87. Wu, Q.; Xie, T.; Liu, C.; Li, W.; Zhang, L.; Ran, G.; Xu, Y.; Tang, Y.; Han, Z.; Hu, C. Improving the understanding of rainfall-runoff processes: Temporal dynamic of event runoff response in Loess Plateau, China. J. Environ. Manag. 2025, 375, 123436. [Google Scholar] [CrossRef]
  88. Zhao, Y.; Cao, W.; Hu, C.; Wang, Y.; Wang, Z.; Zhang, X.; Zhu, B.; Cheng, C.; Yin, X.; Liu, B. Analysis of changes in characteristics of flood and sediment yield in typical basins of the Yellow River under extreme rainfall events. Catena 2019, 177, 31–40. [Google Scholar] [CrossRef]
  89. Li, Z.; Wang, Y.; Zhang, H.; Chang, J.; Yu, Y. Runoff response to changing environment in Loess Plateau, China: Implications of the influence of climate, land use/land cover, and water withdrawal changes. J. Hydrol. 2022, 613, 128458. [Google Scholar] [CrossRef]
  90. Wang, X.; Chen, D.; Pang, G.; Gou, X.; Yang, M. Historical and future climates over the upper and middle reaches of the Yellow River Basin simulated by a regional climate model in CORDEX. Clim. Dyn. 2021, 56, 2749–2771. [Google Scholar] [CrossRef]
  91. Feng, J.; Qin, T.; Lv, X.; Liu, S.; Wen, J.; Chen, J. Frequent drought and flood events in the Yellow River Basin, increasing future drought trends in the middle and upper reaches. Int. J. Appl. Earth Obs. Geoinf. 2025, 139, 104511. [Google Scholar] [CrossRef]
Figure 1. Study area. (a) Location of the Yellow River Basin; (b) terrain of the YRB; (c) multi-year mean monthly precipitation for the YRB and its three sub-basins; (d) spatial pattern of multi-year averaged precipitation during 1960–2024.
Land 15 00840 g001
Figure 2. Identification and definition of DFAA events based on run theory.
Land 15 00840 g002
Figure 3. Spatial distribution of DFAA event frequency in the Yellow River Basin: (a) DF event frequency; (b) FD event frequency; (c) DFAA event frequency.
Land 15 00840 g003
Figure 4. Interannual variation characteristics of DFAA frequency in the Yellow River Basin: (a) annual DFAA frequency in the whole Yellow River Basin; (b) annual DFAA frequency in the upper reaches; (c) annual DFAA frequency in the middle reaches; (d) annual DFAA frequency in the lower reaches.
Land 15 00840 g004
Figure 5. Duration distributions of drought and flood stages in DFAA events over the Yellow River Basin.
Land 15 00840 g005
Figure 6. Differences in transition duration and stage configuration between DF and FD events in the Yellow River Basin: (a) asymmetry in MIT; (b) asymmetry in time-structure; (c) DF conditional distribution; (d) FD conditional distribution.
Land 15 00840 g006
Figure 7. Contrasting event attributes of DF and FD events in the Yellow River Basin: (a) asymmetry in event intensity; (b) asymmetry in severity; (c) asymmetry in contribution ratio.
Land 15 00840 g007
Figure 8. Spatial patterns of asymmetric process characteristics of DFAA events in the Yellow River Basin: (a) difference between drought-stage and flood-stage durations; (b) mean transition duration (MIT); (c) transition intensity (K); (d) difference in event severity between drought and flood stages.
Land 15 00840 g008
Figure 9. Spatial patterns of the CHI for DFAA events in the Yellow River Basin: (a) CHI of DF events; (b) CHI of FD events; (c) integrated CHI of all DFAA events; (d) hazard zonation based on CHI. The grey boundaries indicate provincial-level administrative boundaries within the Yellow River Basin and are shown only as geographic references for locating the mapped hazard patterns.
Land 15 00840 g009
Table 1. Classification criteria for drought–flood intensity levels based on the SWAP index.
GradeTypeSWAP IndexProbability (%)
4Extreme flood2.0 ≤ SWAP2.67
3Severe flood1.5 ≤ SWAP < 2.04.43
2Moderate flood1.0 ≤ SWAP < 1.58.70
1Slight flood0.5 ≤ SWAP < 1.014.02
0Normal−0.5 ≤ SWAP < 0.538.75
−1Slight drought−1.0 < SWAP ≤ −0.516.50
−2Moderate drought−1.5 < SWAP ≤ −1.09.63
−3Severe drought−2.0 < SWAP ≤ −1.53.89
−4Extreme droughtSWAP ≤ −2.01.41
Table 2. Description of the multidimensional characteristic indicator system for identifying DFAA events.
Characteristic ParameterSymbolDescription
DurationEDDuration of the drought phase, flood phase, and abrupt transition phase
FrequencyEFNumber of DFAA events occurring within a given period
SeverityESCumulative event severity characterized by the accumulated SWAP anomaly
IntensityIDegree of extremity of instantaneous drought or flood conditions
Abrupt-transition intensityKMagnitude and rate of change in dry–wet conditions
Minimum interphase interval timeMITMinimum time interval between the end of the drought phase and the onset of the flood phase, or vice versa
Severity contribution ratio of the drought and flood phasesRRelative contribution of the drought and flood phases within a DFAA event
Disclaimer/Publisher’s Note: The statements, opinions and data contained in all publications are solely those of the individual author(s) and contributor(s) and not of MDPI and/or the editor(s). MDPI and/or the editor(s) disclaim responsibility for any injury to people or property resulting from any ideas, methods, instructions or products referred to in the content.