


Abstract
Aligning urban morphology with carbon emission intensity categories is essential for advancing sustainable urban development and achieving dual carbon objectives. This study utilizes data from 336 Chinese cities across 2010, 2015, and 2020 to construct multi-dimensional morphological indicators. Spectral clustering categorizes cities into four distinct classes: high-emission intensity, medium-emission ecological, medium-emission developmental, and low-emission. An integrated gradient boosting framework, combined with SHAP and PDP interpretability tools, identifies key morphological drivers and their nonlinear contributions to class assignments. Results demonstrate that morphological features exert nonlinear and threshold-dependent effects on carbon emission intensity category assignments, exhibiting substantial spatial heterogeneity across urban clusters. Core drivers, such as economic density and the landscape shape index, follow distinctly different decision pathways in each category. Furthermore, morphological factors produce non-additive interactive effects that generate region-specific shifts in classification probability. Through this classification-oriented approach, the study provides policymakers with a systematic and readily interpretable reference to inform the formulation of context-specific low-carbon spatial planning strategies.
1. Introduction
Driven by the dual imperatives of the global climate crisis and the sustainable development agenda, the carbon reduction performance of cities, as key sources of emissions, has become a focal point of international attention. Cities serve as engines of economic growth, contributing over 60% of global greenhouse gas emissions and consuming more than 78% of energy. By 2050, the global urban population is projected to increase by 2.5 billion people, with nearly 90% of this growth concentrated in Asia and Africa. As one of the countries experiencing the fastest urbanization globally, China’s dramatic evolution of urban spatial structures has driven economic development while simultaneously creating severe challenges including ecological space compression, intensified resource consumption, and rising carbon emissions [1,2]. Traditional urban development models, whether characterized by uncontrolled sprawl or a simplistic pursuit of compactness, struggle to adequately address the complex challenges of climate change and carbon reduction targets [3,4]. Therefore, moving beyond binary qualitative judgments of urban morphology as ‘good’ or ‘bad’ to deeply explore the complex relationships between its multi-dimensional characteristics and carbon emission intensity holds critical theoretical and practical urgency for formulating precise, efficient, and spatially adaptive low-carbon urban planning and management policies.
Urban morphology, referring to the structure, pattern, and three-dimensional characteristics of urban physical spaces, is widely recognized as a key adjustable variable influencing urban carbon metabolism processes [5,6,7]. Existing research has accumulated rich findings from multiple dimensions. At the theoretical framework level, scholars have systematically elaborated on how urban morphology affects urban thermal environments, air quality, and carbon metabolism by altering surface energy balance, material flows, and human activity patterns [8,9,10]. Sharifi (2019), from the perspective of resilient cities, demonstrated that macro-scale morphological characteristics (such as polycentricity and connectivity) may indirectly improve environmental performance by enhancing system adaptability and resilience [11]. In terms of empirical research, substantial work has focused on revealing associations between specific morphological indicators and individual environmental elements. For instance, the positive correlation between building density, floor area ratio, and urban heat island intensity (UHI) has been confirmed by multiple studies [12,13], while green space ratio and blue–green space connectivity have been shown to play positive roles in mitigating heat island effects and improving air quality [14,15,16]. With advances in remote sensing and geographic information system (GIS) technologies, research on the environmental effects of urban three-dimensional morphology, such as building height, sky view factor, and surface roughness, has become increasingly sophisticated, revealing the important role of vertical dimensions in regulating wind environments and solar radiation reception [17,18].
Despite these fruitful achievements, the existing literature still contains several gaps that require deepening and integration when explaining the complex geographical relationship between urban morphology and carbon emission intensity. First, most studies rely on traditional econometric models such as linear regression and correlation analysis, which assume stable, homogeneous linear relationships between variables [19]. However, urban systems, as typical complex adaptive systems, likely exhibit nonlinear, threshold, and saturation effects in the interactions among their internal elements [20]. For example, the ecological benefits of green space areas may only become significant after reaching a certain threshold, while increased building density may reduce per capita energy consumption through intensive effects in the initial stage but produce negative effects beyond a critical point due to obstructed ventilation and aggravated heat accumulation [21,22]. Such nonlinear mechanisms have not been adequately revealed and quantified in the existing research dominated by linear thinking. Second, existing studies often focus on single or several morphological indicators, lacking a comprehensive analytical framework that can systematically integrate multi-dimensional characteristics of urban development scale, spatial pattern, and socio-economic density. Urban ecological environments result from multi-dimensional interactions between natural substrates and artificial built environments, and fragmented analyses may overlook key interactive responses and synergistic effects [23].
Third, conventional urban classification schemes frequently rely on administrative boundaries, economic aggregates, or demographic thresholds, which often obscure intrinsic spatial configurations and their distinct associations with emission patterns [24]. Such predefined categorization methods may introduce arbitrary boundaries and overlook latent morphological heterogeneity within broadly defined city groups. To address this limitation, this study adopts a data-driven clustering approach grounded in multi-dimensional morphological indicators. Unlike traditional typologies, this methodology allows urban spatial categories to emerge empirically from observed physical configurations, thereby establishing a more coherent alignment between spatial form and carbon emission intensity category assignment. The application of spectral clustering further accommodates complex feature relationships and yields balanced category distributions, providing a structured foundation for subsequent classification modeling. This morphology-driven framework offers a complementary perspective to existing urban typologies, facilitating differentiated spatial governance strategies tailored to distinct form–emission trajectories.
Fourth, while spatial form constitutes a critical adjustable variable, carbon emission intensity is concurrently shaped by socio-economic, technological, and institutional factors. Economic structure, particularly industrial composition and regional energy intensity, remains a primary determinant of emission trajectories [25]. Technological advancement and energy efficiency improvements consistently demonstrate mitigating associations with carbon output [26]. Demographic characteristics, including population density and urbanization levels, influence baseline energy demands and transportation networks [27]. Furthermore, regional climate conditions and policy interventions introduce contextual variability in urban emission performance [28]. Acknowledging these multi-dimensional drivers is necessary for isolating the specific contribution of urban morphology. By incorporating these factors as control variables in the analytical framework, the study can more systematically attribute variations in emission category assignment to spatial form rather than confounding socio-economic or technological shifts. Finally, methodologically traditional models have limited capabilities in handling high dimensionality, collinearity, and complex interactions, making it difficult to accurately capture and explain nonlinear and non-additive relationship structures among variables. Although some scholars have begun applying Geodetector to detect spatial differentiation [29,30,31], or using machine learning methods such as Random Forest for prediction [32], how to deeply integrate powerful machine learning predictive capabilities with result interpretability to clearly elucidate the independent contributions, nonlinear marginal effects, and interaction mechanisms of various morphological factors on carbon emission intensity remains a cutting-edge challenge facing current research.
To systematically address these challenges, this study employs data from 336 prefecture-level cities (excluding Taiwan Province, Hong Kong SAR, and Macao SAR) in China for 2010, 2015, and 2020, yielding a total of 1008 samples. Based on this dataset, the study aims to construct an analytical system integrating multi-dimensional urban landscape pattern (urban morphology) indicators and adopt an innovative dual-interpretability machine learning framework to reveal their nonlinear influence mechanisms on carbon emission intensity. Specifically, the study will first construct a comprehensive morphological indicator system covering multi-dimensional characteristics. Subsequently, spectral clustering will be employed to classify national cities into different types based on morphological characteristics to identify their underlying heterogeneity. On this basis, this study will construct and optimize a gradient boosting model, combined with a SHAP (Shapley Additive exPlanations) and partial dependence plot (PDP) interpretability framework [33]. While SHAP quantitatively decomposes the global contribution and importance ranking of each morphological feature, PDPs are explicitly utilized to visualize the average marginal effects and nonlinear response trajectories of these features on carbon emission intensity. This dual approach addresses the interpretability challenges of traditional ‘black-box’ models: it maintains robust predictive performance while enabling the identification of critical thresholds and variations in influence patterns. This offers a detailed perspective on how specific morphological changes relate to carbon dynamics, extending beyond conventional feature ranking.
The potential contributions of this study lie in the following three aspects:
First, at the theoretical level, this study extends existing understanding by challenging the assumption that simplifies the relationship between urban morphology and carbon emission intensity into linear connections. By employing a classified modeling perspective, it empirically characterizes the prevalent nonlinear responses and context-dependent threshold effects between the two. This perspective shifts the focus from mere prediction of continuous values to identifying key morphological pathways associated with carbon emission intensity variations, offering deeper insights into the complex nonlinear dynamics in urban systems.
Second, at the methodological level, this study addresses the trade-off between predictive performance and interpretability in continuous variable regression modeling. By integrating the gradient boosting tree model with the SHAP-PDP interpretability framework, a robust analytical framework is constructed. This method enhances model generalization while quantifying the differentiated contributions of various morphological features to carbon emission intensity levels and their nonlinear influence patterns, providing a valuable methodological reference for related research.
Third, at the practical level, based on the above theory and methods, the study conducts empirical analysis on national urban samples. The research conclusions offer evidence to identify key morphological factors and their potential threshold ranges that could be considered for regulation to support low-carbon goals in different types of cities. This provides scientific evidence for national and local governments to implement typified, differentiated territorial spatial planning and targeted low-carbon urban management.
2. Study Area and Data Sources
2.1. Study Area
China was selected as the research subject primarily based on its typicality and global reference significance. China is undergoing the largest and fastest urbanization process in world history, encompassing various urban types from high-density megacities to numerous small- and medium-sized cities at different development stages, forming a highly representative ‘natural experimental field’ in the global urban development spectrum. This extreme spatial heterogeneity provides a rich sample foundation for systematically exploring the complex nonlinear relationship between urban morphology and carbon emission intensity. Compared with Western cities that have completed urbanization, Chinese cities exhibit greater uniqueness and complexity, as spatial morphological evolution and carbon reduction pressures coexist and interact during rapid industrialization and urbanization [34]. This makes the influence mechanisms identified in the Chinese context not only capable of providing scientific evidence for promoting ecological civilization construction and precise spatial planning under the ‘dual carbon’ goals but also offering important empirical experience and strategic insights for other developing countries currently in rapid urbanization, with certain international promotion value.
To ensure the completeness and comparability of the research data, this study excluded cities with severe missing data during sample selection, ultimately identifying 336 cities as the study area. Geographically, China exhibits pronounced altimetry and topographical heterogeneity, characterized by a three-step descending terrain gradient. The western region is dominated by high-altitude plateaus and mountainous systems, the central zone comprises transitional basins and hills, and the eastern region features low-lying plains and coastal belts. This complex altimetry fundamentally constrains urban spatial expansion, infrastructure layout, and land-use continuity, thereby generating a highly varied morphological landscape that serves as the critical geographical foundation for this study.
2.2. Data Sources and Preprocessing
2.2.1. Data Sources
This study integrated spatial and statistical data from multiple sources. Land use data (with a resolution of 1 km) were obtained from the Resource and Environment Data Center of the Chinese Academy of Sciences (https://www.resdc.cn/, accessed on 1 December 2023). Urban landscape pattern metrics were calculated using Fragstats 4.2 software. Population and economic output data were derived from the China City Statistical Yearbook (https://data.cnki.net/, accessed on 1 January 2022). Carbon emissions data were from the China City Greenhouse Gas Working Group (https://www.cityghg.com/, accessed on 1 January 2024). This dataset provides detailed carbon emissions data for various Chinese cities and has been widely used in previous studies. Given that the dataset is currently only updated to 2020, and to ensure consistency across all data sources, the study period is limited to 2010, 2015, and 2020, yielding a total of 1008 samples. All indicators were standardized to ensure comparability in both statistical definition and spatial coverage across years, forming a consistent panel dataset that supports the subsequent analysis of nonlinear relationships between urban form and carbon emission intensity.
2.2.2. Urban Morphological Calculations
The characteristic variable system constructs a multi-dimensional urban morphological indicator framework, mainly including the following three categories. The first category is scale characteristics, with the core indicator being the proportion of built-up area, used for the basic measurement of urban land development intensity and spatial expansion, which has been widely applied to characterize urbanization levels and their ecological environmental effects [35]. The second category is spatial morphological characteristics, drawing on mature landscape ecology principles and index systems [36] which aim to quantify the pattern attributes of urban two-dimensional space. Among them, patch density (PD) and mean patch area (AREA_MN) jointly reflect the degree of spatial fragmentation and average patch scale. Largest patch index (LPI) represents the dominance of dominant patches. Landscape shape index (LSI) and mean shape index (SHAPE_MN) describe the complexity and irregularity of patch outlines. Edge density (ED) reflects boundary length per unit area. Aggregation index (AI), clumpiness (CLUMPY), cohesion index (COHESION), and effective mesh size (MESH) measure spatial aggregation states and landscape connectivity from different perspectives. Split index (SPLIT) reflects the degree of landscape division. Indicators in the spatial morphological characteristics dimension provide standardized analytical tools for understanding the impact of spatial configuration on ecological processes [37]. The third category is density characteristics, including people density and economic density, calculated respectively as the ratio of urban population and secondary and tertiary industry added value to urban area. These two indicators are key variables characterizing the spatial agglomeration intensity of socio-economic activities, crucial for understanding the impact of human activities on resources and the environment [38,39].
Given the high dimensionality and potential multicollinearity among the initial landscape metrics, we conducted a systematic variable screening process to reduce redundancy prior to modeling. Pairwise correlation analysis was first performed, and variables with correlation coefficients exceeding 0.7 were flagged. Subsequently, a variance inflation factor (VIF) test was applied, and indicators with VIF > 10 were sequentially excluded to ensure statistical independence. This screening process reduced the initial 18 morphological indicators to 14 core variables (listed in Table 1), which adequately capture the multi-dimensional attributes of urban spatial configuration while strictly controlling for multicollinearity. These selected indicators were then standardized and incorporated into subsequent analyses. Variable definitions are shown in Table 1, and the descriptive statistics are provided in Table A1 of Appendix A.
Table 1.
Urban morphological indicators.
2.2.3. Carbon Emission Intensity Assessment
The core dependent variable of this study is carbon emission intensity, quantified using carbon dioxide emissions per unit of gross domestic product (GDP). This indicator is a key comprehensive measure for assessing the carbon production efficiency and low-carbon development level of regional or urban economic systems [40]. Its core value lies in combining the scale effect of economic activities with the absolute level of carbon emissions, directly revealing the coupling relationship between economic growth and carbon emission pressure, and thus being widely used in international comparisons and policy evaluations [41].
Conceptually, this indicator relates closely to the idea of decoupling in sustainability research. It measures the extent to which economic growth can be separated from resource use and environmental impact, with a specific focus on carbon emissions [42,43]. A decline in carbon emission intensity signals improvements in economic structure, production technology, or management practices that enable greater economic output with lower carbon inputs [44]. Compared to total emissions, this intensity measure offers a more equitable basis for comparing cities at different stages of development, as it controls for differences in economic scale [45]. It is also more directly linked to the efficiency and pattern of economic development than per capita emissions. For these reasons, carbon emission intensity has become a widely used benchmark for evaluating whether urban development pathways are consistent with low-carbon and sustainability goals.
For predictive modeling, the continuous emission intensity was operationalized as a binary classification (high- vs. low-carbon categories). This transformation is methodologically grounded in three considerations. First, urban carbon intensity typically exhibits a pronounced right-skewed distribution with extreme high-value outliers, which can destabilize continuous regression and exacerbate overfitting. Second, in the absence of universally mandated policy thresholds, the sample median provides a statistically neutral benchmark to objectively differentiate relatively efficient from inefficient urban systems. Third, median-based dichotomization yields a balanced class distribution, which enhances machine learning robustness by mitigating majority-class bias and ensuring consistent sensitivity in detecting morphological drivers across both categories. This approach preserves essential distributional characteristics while aligning the analytical framework with the study’s comparative typology objectives.
3. Methodology
3.1. Study Framework
This study adopts a systematic machine learning analysis framework to explore the impact of urban morphological indicators on carbon emission intensity (shown in Figure 1). First, an urban morphological indicator system including landscape patterns and socio-economic attributes is constructed, and carbon emission intensity indicators are calculated. Second, variance inflation factor detection is used to remove highly collinear indicators, retaining representative indicators as input for spectral clustering analysis to classify research samples into different types. Third, six machine learning algorithms, including gradient boosting, Random Forest, Multi-Layer Perceptron (MLP), eXtreme Gradient Boosting (XGBoost), Logistic Regression, and Support Vector Machine (SVM), are compared, and the model with optimal predictive performance is selected as the baseline model. Subsequently, the Bayesian optimization algorithm combined with an early stopping strategy is employed to train and optimize the model. To comprehensively interpret the results, this research integrated SHAP values for evaluating global feature importance and interaction effects with partial dependence plots (PDPs) to visualize average marginal effects and nonlinear response trajectories. While SHAP quantifies contribution magnitudes, PDPs specifically pinpoint critical threshold levels and direction shifts in the influence mechanisms. Overall, this synergistic framework effectively characterizes the complex nonlinear responses, precise thresholds, and interaction directions of urban morphological indicators on carbon emission intensity.
Figure 1.
Research flowchart.
3.2. Overview of Methods
3.2.1. Clustering Method Selection
To identify urban groups with similar morphological characteristics, this study employs a comprehensive clustering analysis framework. Given the relative stability of urban morphological traits over the observation period, three-year observational data are aggregated into representative city-level feature values to capture typical spatial patterns.
In terms of algorithm selection, this study systematically compares four classical methods: K-means clustering, Gaussian mixture model, hierarchical clustering, and spectral clustering. Spectral clustering is a graph theory-based algorithm that constructs a similarity graph from data points and utilizes eigenvalues and eigenvectors for dimensionality reduction and partitioning, making it highly effective for nonlinear and non-convex data distributions. In geospatial analysis, where data frequently exhibit spatial autocorrelation and heterogeneous distributions, this method constructs spatial weight matrices based on distance or topological relationships to effectively capture both local similarities and global structural dependencies among geographic units. Unlike traditional distance-based approaches, it is better suited for delineating irregular urban functional patterns and complex landscape configurations. Given the inherent nonlinear characteristics and potential manifold structures in urban morphological data, spectral clustering is selected as the primary analytical tool. Its specific advantages include the capacity to model nonlinear relationships, optimize graph partitioning to maximize intra-cluster similarity while minimizing inter-cluster dissimilarity, and produce spatially coherent results that align well with visual validation. All algorithms are evaluated using identical standardized feature sets and assessed through silhouette coefficients, Calinski–Harabasz indices, Davies–Bouldin indices, and clustering balance metrics. Specifically, the silhouette coefficient quantifies intra-cluster cohesion relative to inter-cluster separation, with values approaching 1 indicating well-defined and distinct partitions. The Calinski–Harabasz (CH) index calculates the ratio of between-cluster dispersion to within-cluster dispersion, where higher values denote more compact and well-separated groupings. Conversely, the Davies–Bouldin (DB) index measures the average similarity between each cluster and its most similar counterpart based on centroid distances and scatter; lower values reflect superior cluster separation and minimal overlap. By jointly applying these complementary indicators, this study ensures a robust, multi-dimensional assessment of cluster validity to determine the optimal partition. A composite scoring mechanism ensures an optimal balance between structural clarity and interpretability, ultimately confirming spectral clustering as the most robust approach.
Furthermore, this study adopts a two-step analytical strategy—first grouping cities by morphological similarity, then estimating regression models within each cluster—rather than directly modeling spatial heterogeneity through continuous local regression or hierarchical techniques. This framework is selected for three primary reasons. First, urban morphological evolution often exhibits discrete structural regimes rather than smooth spatial gradients; clustering explicitly identifies these mechanistic breakpoints, whereas continuous heterogeneity models may obscure distinct pathway variations. Second, by isolating cities with comparable spatial configurations, the within-cluster regression significantly reduces multicollinearity among landscape metrics and minimizes unobserved confounding, thereby yielding more stable and interpretable coefficient estimates. Third, the resulting typology-based framework directly aligns with urban planning practices, enabling targeted policy interventions tailored to specific morphological categories. While direct heterogeneity modeling remains valuable for capturing localized variations, the proposed two-step strategy offers superior clarity in mechanism identification, enhanced statistical robustness within homogeneous subgroups, and stronger practical relevance for differentiated urban governance.
To determine the optimal number of clusters, a comprehensive evaluation system is established. The trends of multiple clustering quality indicators are analyzed for cluster counts ranging from 2 to 10. By identifying inflection points and stable regions within these trends and integrating practical research requirements, the optimal cluster count is selected to ensure both statistical significance and clear interpretability.
To ensure the reliability of the clustering outcomes, a systematic robustness testing framework is implemented. Pattern stability is evaluated across multiple dimensions, including consistency checks under varying data aggregation schemes, comparative performance analyses of alternative algorithms, and sensitivity tests across different cluster count settings. This multi-level validation ensures that the results are not dependent on specific methods or arbitrary parameter choices, thereby strengthening the scientific rigor and reliability of the findings and providing a solid foundation for subsequent heterogeneity analysis.
3.2.2. Machine Learning Model
This study adopts a systematic machine learning analysis framework to explore the influencing mechanisms of urban morphological indicators on carbon emission intensity. The model construction and optimization process includes four key stages: data division, model comparison, hyperparameter optimization, and model interpretation.
- (1)
- Data Division and Preprocessing
First, the complete dataset is randomly divided into training and testing sets at a 7:3 ratio to ensure independence of model evaluation. The training set is used for model training and parameter tuning, while the testing set is used for final model performance verification. To address class imbalance issues, Synthetic Minority Oversampling Technique is applied to the training set to improve the model’s recognition ability for minority class samples.
- (2)
- Model Screening and Comparison
To determine the most suitable model for predicting carbon emission intensity, this study systematically compares six mainstream machine learning algorithms, including Logistic Regression, Random Forest, XGBoost, gradient boosting, Support Vector Machine, and Multi-Layer Perceptron. This multi-model comparison strategy helps avoid model bias that may arise from relying on a single algorithm and is a standard practice for ensuring the robustness of analysis conclusions [46]. Model performance evaluation adopts multi-dimensional indicators, including accuracy, precision, recall, F1 score, AUC-ROC curve area, and five-fold cross-validation accuracy. The basis for selecting this comprehensive indicator system is that classification task evaluation needs to simultaneously consider the model’s overall correctness, discrimination ability for specific categories, and ranking quality. Single indicators may be misleading, while multi-dimensional evaluation can provide a more comprehensive performance profile [47]. Among them, cross-validation is a key technique for evaluating model generalization capability and reducing overfitting [48]. By comprehensively comparing evaluation results of various models, the model with optimal performance across multiple indicators is selected as the baseline model.
- (3)
- Hyperparameter Optimization
For the selected baseline model, Bayesian optimization algorithm is used for fine-tuning of its key hyperparameters. The optimization process is based on tree-structured Parzen estimators, evaluating performance of different parameter combinations through five-fold cross-validation. To prevent overfitting, 15% of training data is reserved as early stopping validation set, automatically terminating training when model performance no longer improves. The optimization objective is to maximize performance indicators on the validation set, ultimately obtaining the optimal hyperparameter combination and best iteration rounds.
- (4)
- Model Ensemble and Interpretation
Based on selecting gradient boosting model as the optimal model, to further improve prediction stability and accuracy, this study simultaneously attempts two strategies: voting ensemble and stacking ensemble. Voting ensemble combines prediction results of multiple base learners through weighting, while stacking ensemble uses outputs of base learners as inputs for meta-learners for secondary training. Ensemble model evaluation results show that voting ensemble and stacking ensemble have improvements over single models on some indicators, but considering model complexity and computational efficiency, gradient boosting model has better interpretability while maintaining excellent prediction performance. Therefore, after comprehensive consideration of performance, complexity, and interpretability, this study ultimately selects gradient boosting model as the optimal model for subsequent in-depth feature importance and mechanism analysis.
Model interpretability analysis adopts a dual-framework approach combining SHAP and PDPs. While SHAP values, grounded in cooperative game theory, quantify each feature’s contribution to identify key influencing factors, PDPs are explicitly employed to visualize the average marginal effects and nonlinear response trajectories of individual indicators on carbon emission intensity. This synergy overcomes the limitations of single-method interpretation—SHAP reveals global importance rankings, whereas PDP precisely delineates critical threshold levels and direction shifts—providing a robust basis for understanding the complex action mechanisms of urban morphological indicators.
4. Results
4.1. City Types Based on Urban Morphology
To accurately identify urban groups with similar morphological characteristics, this study did not pre-set a single clustering algorithm but systematically evaluated the comprehensive performance of four mainstream clustering methods under different data integration strategies. First, to obtain more representative city-level characteristics and smooth annual fluctuations, an integrated dataset based on long-term trends of panel data was constructed. To ensure robustness of analysis conclusions, primary and secondary different data integration strategies were adopted to capture the central tendency of urban morphology, forming two sets of comparable but logically different foundational data. Subsequently, for each dataset, four algorithms including K-means clustering, Gaussian mixture model, agglomerative hierarchical clustering, and spectral clustering were applied. For each method, the optimal number of clusters on corresponding data was automatically determined based on multiple internal validity indicators, including silhouette coefficient, Calinski–Harabasz index, and Davies–Bouldin index. Evaluation not only focused on clustering structure compactness and separation but also specifically introduced balance scores to measure the balance of sample sizes across categories, avoiding invalid categories with too few samples.
Comprehensive evaluation results show significant differences in performance among different clustering methods. As shown in Figure 2, spectral clustering demonstrates the highest comprehensive scores under both primary and secondary integration strategies. Specifically, under the primary integration strategy, spectral clustering has a silhouette coefficient of 0.191, slightly lower than K-means (0.296), but its balance score reaches 0.737, far superior to other methods, indicating that its four categories have the most balanced sample size distribution (as shown in Figure 3a, category sample sizes are 74, 114, 61, and 87). Under the alternative integration strategy, spectral clustering also leads with a balance score of 0.823, ensuring statistical validity of classification (as shown in Figure 3b, category sample sizes are 69, 107, 73, and 87). In contrast, K-means and agglomerative hierarchical clustering produce extremely unbalanced sample sizes among categories in most cases (Figure 3c), with balance scores often approaching zero. Gaussian mixture model performance shows greater volatility across different data foundations (Figure 3d,e).
Figure 2.
Cluster method performance comparison. Note: “kmeans” is the abbreviation of K-means.
Figure 3.
Spatial distribution map of spectral clustering results.
Therefore, this study ultimately selects spectral clustering as the optimal method for urban morphological classification. This method performs partitioning based on similarity graphs of data points, excelling at identifying complex, non-spherical data distribution structures. Through t-SNE and PCA dimensionality reduction techniques for visualizing spectral clustering results under different integration strategies, the different urban categories formed show good separation trends in low-dimensional feature space, and the core category structures remain consistent between primary and secondary strategies. This systematic method comparison and sensitivity testing process, comprehensively considering clustering quality, sample balance, and conclusion robustness, ultimately ensuring the scientificity and reliability of urban type classification.
Based on a clustering analysis of urban morphological characteristics, Chinese cities were classified into four distinct groups (Figure 4). By grouping cities with similar morphological features, this approach effectively controls for within-group variation in urban forms while highlighting between-group differences in their relationship with carbon emission intensity. This classification avoids the confounding effects that would arise from analyzing cities with divergent morphological types together, thereby providing a robust basis for examining how urban form influences carbon emission intensity across different spatial development patterns.
Figure 4.
Study area.
The resulting groups exhibit pronounced spatial clustering that aligns with the regional altimetry and topographical gradients outlined in Section 2.1. Cluster 0 (C0) is predominantly distributed across central and Western China, as well as the southern inland regions, covering Sichuan, Chongqing, Guizhou, Hubei, Hunan, Jiangxi, and Anhui. This is the most spatially extensive cluster. Cities in this group share similar morphological characteristics, shaped largely by the topographical constraints of mountainous and hilly terrain in inland areas, with consistency observed in built-up area structure and density patterns. Cluster 1 (C1) is primarily located along the northern frontiers, the northwest, and the coastal margins of South China, including Inner Mongolia, Xinjiang, Qinghai, Gansu, Heilongjiang, Jilin, Northern Liaoning, Southern Guangdong and Guangxi, and Western Fujian. These cities are generally situated in sparsely populated or ecologically sensitive regions. Morphologically, these areas display low-density and dispersed spatial patterns with limited continuity in built-up zones, a characteristic that aligns with the development trajectories of resource-based and frontier cities. Cluster 2 (C2) is highly concentrated in the eastern coastal region and the core areas of the middle and lower Yangtze River, encompassing Shanghai, Jiangsu, Zhejiang, Eastern Anhui, and Eastern Fujian. This cluster corresponds to China’s most economically advanced coastal areas. Morphologically, these cities are characterized by high-density compact urban forms with highly contiguous built-up areas, reflecting the mature stage of urbanization typical of the eastern seaboard. Cluster 3 (C3) is mainly distributed across the North China Plain and the Bohai Rim region, covering Beijing, Tianjin, Hebei, Shandong, Henan, Shanxi, and Southern Liaoning. Cities in this group exhibit medium-to-high-density urban forms with monocentric ring-like expansion patterns. The consistency in morphological metrics across this cluster aligns with the spatial characteristics typical of traditional industrial bases and densely populated agglomerations in Northern China.
4.2. Gradient Boosting Model Fitting Results
Guided by the research objectives and insights from the existing literature, this study adopts a classification modeling framework in the machine learning stage. We acknowledge the valuable contributions of prior studies, such as Huang et al. (2026) [21], Cheng et al. (2026) [49], and Ru et al. (2026) [50], which effectively employed regression-based predictive models to capture continuous variations in urban efficiency. While regression is well-suited for modeling continuous variables, policy formulation often requires clear, qualitative distinctions to enable targeted interventions. Specifically, decision-makers benefit from directly identifying whether a city operates in a low-carbon or high-carbon efficiency state, rather than interpreting abstract continuous scores that require additional thresholding. To address this practical need, this study shifts to a classification framework that directly outputs categorical judgments, thereby providing an end-to-end analytical tool that enhances policy relevance and operational clarity. To further ensure the robustness and generalizability of the classification model, we integrate the Synthetic Minority Oversampling Technique (SMOTE) to address sample imbalance, Bayesian optimization for systematic hyperparameter tuning, and an early stopping strategy to mitigate overfitting risk. These methodological enhancements collectively advance the reliability of the model while aligning closely with the differentiated analytical requirements of urban carbon governance.
To determine the optimal modeling method, this study systematically compares six mainstream machine learning algorithms, including gradient boosting, Random Forest, Multi-Layer Perceptron, eXtreme Gradient Boosting, Logistic Regression, and Support Vector Machine. Model performance is comprehensively evaluated through mean accuracy of ten-fold cross-validation and multiple indicators, including accuracy, precision, recall, F1 score, and AUC. Model performance comparison results are shown in Figure 5a. gradient boosting model performs optimally across multiple indicators, with test set accuracy reaching 64.4%, mean cross-validation accuracy of 60.6%, and AUC value of 0.67, significantly outperforming other models in comprehensive performance. Benefiting from the naturally balanced class distribution (504 low-carbon vs. 504 high-carbon samples), the gradient boosting model demonstrated effective discriminative capability, yielding balanced recall and precision across both categories without the need for synthetic oversampling. Its performance evaluation confusion matrix, ROC curve, and precision–recall curve are detailed in Figure 5b. In comparison, the Random Forest model has the highest AUC value of 0.689, with performance evaluation shown in Figure 5c; while Support Vector Machine and other models show relatively weaker comprehensive performance, with specific evaluations shown in Figure 5d.
Figure 5.
Different machine learning models prediction performance comparison.
To further improve prediction stability and accuracy, this study explores ensemble learning strategies based on single models, constructing voting ensemble and stacking ensemble models. Ensemble model evaluation results show that stacking ensemble slightly outperforms voting ensemble in accuracy, F1 score, and AUC value, with AUC reaching 0.689 and accuracy of 64% (Figure 5e,f). However, considering that stacking ensemble model structure is more complex with higher computational costs while performance improvement is relatively limited, gradient boosting model maintains high prediction performance while having advantages of model simplicity, strong interpretability, and high computational efficiency. Therefore, after comprehensive weighing of performance, complexity, and interpretability, this study ultimately selects gradient boosting model as the optimal model for subsequent in-depth feature importance and mechanism analysis.
4.3. SHAP-PDP Analysis of Driving Factors
In terms of methodological design, this study references the previous work of Huang et al. (2026) but does not follow their adopted OPGD method for feature screening and interaction detection [21]. The main consideration is that OPGD, as a classical statistical method based on spatial differentiation, has analytical logic not entirely consistent with the internal mechanism of subsequent machine learning models, and its discretization process may introduce subjective bias. To ensure overall logical consistency from feature analysis to model interpretation, this study chooses to directly use the optimized gradient boosting model and complete all feature importance ranking, influence direction determination, and nonlinear relationship characterization using the SHAP framework. This approach not only fully leverages modern advantages of machine learning methods in interpretability but also avoids redundancy and inconsistency that may arise from mixed methods.
To further elucidate the specific response patterns of carbon emission intensity to urban morphological changes, we employed partial dependence plots (PDPs) to visualize the average marginal effects of key features (Figure 6b–i). The PDP results reveal predominantly nonlinear relationships, with clear threshold effects that complement the SHAP-based feature importance rankings. SHAP and partial dependence plots serve as model interpretability tools but differ in calculation logic and interpretive meaning. The PDP method marginalizes other features to reveal the global average effect of a single variable on classification probability. This approach focuses on macro trends and critical thresholds. SHAP relies on cooperative game theory to quantify the local contribution of each feature to individual predictions. It naturally captures interactions between features. These two methods produce complementary rather than contradictory results. They connect macro average trends with micro individual variations. The SHAP distribution does not conflict with the PDP curve. It supplements the PDP findings by displaying the actual dispersion of samples around the average trend.
Figure 6.
SHAP-based feature importance and PDP-derived marginal effects of urban morphological indicators on carbon emissions intensity (full sample). Note: (a) Represents the SHAP importance ranking in the full sample; (b–i) respectively represent the PDP and SHAP composite images of the Proportion of Built-up Area, SHAPE_MN, LSI, ED, LPI, AI, PD and CLUMPY.
For proportion of built-up area, ED, and PD, the global average trend shows a monotonic increase in the predicted probability of high carbon emission intensity as these variables rise, indicating that higher urbanization intensity and fragmentation consistently elevate emission risk. In contrast, CLUMPY and SHAPE_MN exhibit decreasing trends, suggesting that greater spatial aggregation and more regular patch shapes are associated with a lower likelihood of high emissions. Several variables—including LSI, LPI, and AI—display complex nonlinear responses with multiple inflection points, where the direction or magnitude of their effect on emission intensity shifts at specific threshold values. These PDP-derived patterns confirm that the influence of urban morphology is not uniform but is highly context-dependent, reinforcing the need for nuanced, threshold-aware policy interventions.
Complementing these trend observations, the SHAP summary plot based on the full sample (Figure 6a) quantifies the relative magnitude of each factor’s contribution. The analysis identifies proportion of built-up area as the most critical determinant, possessing the highest mean absolute SHAP value of 0.0200, which underscores its dominant global impact on carbon emission intensity. Following closely are SHAPE_MN (0.0193) and LSI (0.0188), highlighting the substantial role of landscape configuration. Economic density and LPI round out the top five influential characteristics with mean absolute SHAP values of 0.0173 and 0.0135, respectively. Together, the PDP trends and SHAP magnitudes offer a comprehensive view, where built-up proportion is the primary driver in terms of strength, while the configuration of the landscape (shape and density) plays an equally critical role in shaping the trajectory of urban carbon emissions.
C0, as the high-emission intensity urban cluster (Figure 7a), has AREA_MN as its most important characteristic, with a mean absolute SHAP value reaching 0.0311, ranking first among all important cluster characteristics. CLUMPY ranks second with a mean absolute SHAP value of 0.0174, and LSI follows closely with 0.0113. Proportion of built-up area and SPLIT enter the top five important characteristics with mean absolute SHAP values of 0.0102 and 0.0096, respectively.
Figure 7.
Feature importance of urban morphology indicators based on mean absolute SHAP values for the entire sample and four city zones. Note: (a–d) respectively represent the feature value rankings based on SHAP importance in Cluster 0, Cluster 1, Cluster 2, and Cluster 3.
C1, as the medium-emission ecological urban cluster (Figure 7b), has SHAPE_MN as its most important morphological characteristic, with a mean absolute SHAP value of 0.0266. LSI ranks second with a mean absolute SHAP value of 0.0160, and COHESION ranks third with 0.0094. Proportion of built-up area and AI enter the top five important characteristics with mean absolute SHAP values of 0.0090 and 0.0089, respectively.
In C2, representing the medium-emission urban cluster (Figure 7c), CLUMPY becomes the most important characteristic with a mean absolute SHAP value of 0.0223. LSI ranks second with a mean absolute SHAP value of 0.0183, and economic density ranks third with 0.0125. SHAPE_MN and AI enter the top five important characteristics with mean absolute SHAP values of 0.0124 and 0.0080, respectively.
C3, as the low-emission urban cluster (Figure 7d), has LSI as its most important characteristic, with a mean absolute SHAP value as high as 0.0562, far higher than the importance of this characteristic in other clusters. AI ranks second with a mean absolute SHAP value of 0.0244, and MESH and CLUMPY tie for third with 0.0202. Economic density enters the top five important characteristics with a mean absolute SHAP value of 0.0145.
Cross-cluster comparative analysis shows that LSI enters the top five important characteristics in all four clusters, indicating that this characteristic has universal importance across different city types, particularly showing the highest importance in C3 low-emission cluster (0.0562), which reflects the significant impact of landscape shape complexity on carbon emissions in all city types. Proportion of built-up area ranks first at the full sample level and enters the top five in C0 and C1 clusters, indicating its most significant overall impact on urban carbon emissions. CLUMPY appears in three clusters—C0, C2, and C3—indicating that this characteristic has important influence on cities with different emission levels. However, dominant characteristics vary across different clusters: the high-emission urban cluster (C0) is dominated by AREA_MN, reflecting the impact of large continuous patches on high emissions; the ecological urban cluster (C1) is dominated by SHAPE_MN, indicating the importance of patch shape regularity for medium-emission ecological cities; the medium-emission urban cluster (C2) is dominated by CLUMPY, reflecting the influence of patch aggregation degree; and the low-emission urban cluster (C3) is dominated by LSI, highlighting the prominent role of landscape boundary complexity in emission reduction.
Comparison with full sample analysis results reveals that proportion of built-up area has the highest importance at the full sample level (0.0200), though importance rankings vary significantly across clusters, only entering the top five in C0 and C1 but not in C2 and C3, indicating that the global importance of this characteristic may be dominated by some high-weight cities. LSI ranks third at the full sample level (0.0188), but enters the top five in all clusters, even reaching 0.0562 in C3, demonstrating its universal importance across city types. These findings indicate that SHAP analysis based on the full sample can identify globally important characteristics, while clustering analysis can reveal heterogeneity of characteristic influence under different urban types, providing basis for differentiated emission reduction policy formulation.
4.4. SHAP Results Based on the Bayesian-Optimized Gradient Boosting Model
4.4.1. Nonlinear and Threshold Effects of Urban Morphology Indicators on Carbon Emission Intensity
In C0, AREA_MN, CLUMPY, and LSI dominate the classification outcome. Figure 8a demonstrates that all three features consistently increase the probability of assigning a city to the high carbon intensity category. AREA_MN exerts the strongest marginal contribution toward high carbon classification. Higher CLUMPY values similarly elevate this probability. LSI also shifts predictions toward the high carbon category, although its probabilistic impact increases more gradually. This pattern suggests that cities with larger, more aggregated, and more complex landscape patches face a higher likelihood of high carbon intensity classification. From a physical and socio-economic perspective, larger patch sizes and higher aggregation often correspond to lower land-use mixing and relatively dispersed spatial structures, which may extend commuting distances and limit public transport network coverage, thereby reducing overall transport efficiency. Concurrently, complex landscape boundary configurations (LSI) may imply there are increased exterior surface areas of building envelopes, elevating heating and cooling energy demands and collectively steering the model toward high carbon intensity classification.
Figure 8.
Nonlinear effects of key urban morphology indicators by urban zone. Note: (a–d) respectively represent the top three feature values in terms of importance in Cluster 0, Cluster 1, Cluster 2, and Cluster 3 (from left to right). In Cluster 0, they are in the fol-lowing order: AREA_MN, CLUMPY and LSI; In Cluster 1, they are in the following order: SHAPE_MN, LSI and COHESION; In Cluster 2, they are in the following order: CLUMPY, LSI and Economic Density; In Cluster 3, they are LSI, AI and MESH in se-quence.
In C1, SHAPE_MN, LSI, and COHESION exert the greatest influence on classification decisions. Figure 8b reveals complex nonlinear relationships for these indicators. SHAPE_MN substantially increases the probability of high carbon classification. This indicates that more irregular patch shapes elevate the likelihood of this outcome. Conversely, LSI and COHESION decrease the probability of high carbon classification and instead promote assignment to the low carbon category. The opposing directional effects between SHAPE_MN and LSI imply that individual patch shape irregularity and overall landscape pattern complexity alter classification results through distinct pathways. Specifically, high irregularity in individual patch shapes (SHAPE_MN) typically reflects fragmented land use or disordered development, which may compromise the connectivity of road and municipal utility networks and increase energy consumption for infrastructure deployment and maintenance. In contrast, increased overall landscape complexity (LSI) and enhanced inter-patch connectivity (COHESION) are often associated with mature mixed-use zones or highly integrated urban networks. These configurations facilitate shorter travel distances and improve accessibility for public transit and active mobility, thereby promoting low carbon category assignment at the system level.
In C2, CLUMPY, LSI, and economic density emerge as the primary classification drivers. Figure 8c shows that CLUMPY and LSI both reduce the probability of high carbon classification. Higher landscape aggregation and greater shape complexity therefore favor the low carbon category. Economic density produces the opposite effect by substantially increasing the likelihood of high carbon classification as economic activity density rises. This divergence demonstrates that landscape morphology and economic density exert opposing forces on the model decision boundary within this cluster. This phenomenon reflects a dynamic balance between spatial form optimization and economic activity intensity. Higher landscape aggregation and morphological complexity may indicate that urban areas have entered a compact development phase, where agglomeration effects promote the intensive utilization of infrastructure and improve energy system efficiency. However, increased economic density is directly associated with the concentration of commercial and industrial activities, which entails higher electricity consumption, logistics turnover, and production energy use. The resulting direct and embodied carbon emissions may partially offset the decarbonization potential derived from morphological optimization, leading to opposing effects within the classification decision.
In C3, LSI, AI, and MESH rank as the most influential indicators. Figure 8d displays a distinct classification pattern. LSI generates the strongest positive contribution to high carbon classification probability among all features across every cluster. AI exerts an equally strong but opposing effect by markedly decreasing this probability and reinforcing low carbon classification. MESH shows a modest tendency to increase the high carbon classification likelihood. These results indicate that extreme landscape shape complexity acts as the primary driver elevating the probability of high carbon intensity. Higher landscape aggregation conversely serves as a key factor promoting low carbon classification. The positive influence of extreme morphological complexity (LSI) may correlate with historical irregular street networks or inefficient spatial layouts, which increase travel detour probabilities and energy transmission losses. Highly aggregated spatial structures (AI) typically correspond to contiguous and compact urban fabrics that support centralized heating, regional energy planning, and efficient public service coverage, thereby reinforcing low carbon category assignment. The modest positive contribution of MESH may reflect the presence of large single-function zones, such as industrial parks or core commercial districts, which are characterized by concentrated energy consumption patterns and specific emission profiles.
Examination of the SHAP dependence plots (Figure 7 and Figure 8) indicates that most morphological indicators do not exhibit linear relationships with carbon intensity classification. Several curves display consistent directional trends. The rate of probability shift varies across the feature range. This variation suggests that predictive contribution changes as indicator values fluctuate. Certain intervals produce sharper changes in class probability. Other intervals yield gradual shifts. This pattern reflects varying marginal contributions to the model decision boundary. These nonlinear probability responses indicate that urban morphology likely involves complex threshold effects on category assignment. When a morphological indicator reaches specific levels, its incremental impact on classification likelihood shifts substantially or stabilizes. Such nonlinear responses may correspond to critical states of urban infrastructure capacity, inflection points in transport network efficiency, or transitions in building energy consumption patterns. The variation in feature importance and directional effects across clusters further reflects heterogeneity in developmental stages, industrial structures, geographic constraints, and spatial planning policies. For instance, regions undergoing spatial expansion are more susceptible to patch scale effects, whereas economically dense areas are predominantly driven by the intensity of industrial and commercial activities. These mechanistic hypotheses provide a physical and socio-economic interpretive framework for understanding the linkage between morphological characteristics and carbon emission categories. The subsequent interaction analysis will further clarify whether these morphological indicators produce synergistic or antagonistic effects on classification outcomes.
4.4.2. Interactive Effects of Urban Morphology Indicators on Carbon Emission Intensity
Analysis of the complete dataset identifies three indicator pairs with the strongest interaction effects. Figure 9a presents the interaction between proportion of built-up area and LPI with an interaction value of 0.0057. Figure 9b displays the interaction between proportion of built-up area and SHAPE_MN with a value of 0.0056. Figure 9c illustrates the interaction between AI and CLUMPY with a value of 0.0043. High interaction intensity indicates that these feature pairs jointly shape the model decision boundary and substantially influence classification outcomes. The direction of the interaction values further clarifies how these combinations alter category assignments.
Figure 9.
SHAP interaction of key urban morphology indicators by urban zone. Note: In the figure, it shows the interaction effects between the top three most important features in the entire sample and the sample subset, as well as the most interacting feature among them. (a–c) represent the respective interaction relationships between the Proportion of Built-up Area and LPI, SHAPE_MN, as well as AI and CLUMPY within the entire sample. (d–f) successively represent the interaction relationships of AREA_MN with CLUMPY, LSI, as well as PD and LSI in Cluster0. (g–i) respectively represent the interaction relationships between LSI and SHAPE_MN, COHE-SION, as well as between AI and SHAPE_MN in Cluster1. (j–l) show the relationship between Economic Density and LSI, CLUMPY, and AI and LPI in Cluster2, respectively. (m–o) represent the interaction relationships between LSI and CLUMPY, PD, Economic Density, and MESH respectively in Cluster 3.
Examining the strongest pair of proportion of built-up area and LPI reveals predominantly negative SHAP interaction values across most value ranges. Negative values indicate that simultaneous changes in these two features jointly decrease the probability of assigning a city to the high carbon intensity category. This combined effect consistently promotes classification into the low carbon intensity category rather than increasing the likelihood of high carbon outcomes. This suggests that a high proportion of built-up areas, when coupled with a dominant largest patch, signifies a compact urban structure. Such compactness likely reduces transportation energy consumption and promotes economies of scale in infrastructure, thereby enhancing carbon emission intensity.
The interaction between proportion of built-up area and SHAPE_MN follows a comparable directional pattern. Conversely, the interaction between AI and CLUMPY shifts between positive and negative contributions across different value intervals. This variation demonstrates that their combined impact on classification probability is highly context dependent and reflects complex joint decision pathways within the model. Specifically, the transition from positive to negative values implies that while moderate aggregation might initially support development, excessive clumping without proper functional organization could lead to inefficiencies, highlighting the need for balanced spatial layouts.
Analysis of distinct urban development clusters reveals substantial heterogeneity in dominant interaction patterns, confirming the context-dependent nature of morphological impacts on carbon classification.
In C0, the strongest joint effects occur between AREA_MN and CLUMPY (Figure 9d, interaction value 0.0021) and between AREA_MN and LSI (Figure 9e, interaction value 0.0021). Within specific value ranges, the AREA_MN and CLUMPY combination yields strongly positive SHAP interaction values. This indicates that large patch sizes combined with high aggregation synergistically increase the probability of high carbon classification. From a planning perspective, this reveals a “scale inefficiency” in this cluster. It implies that simply merging small patches into larger aggregated blocks without optimizing internal functions may increase carbon intensity, suggesting that urban renewal in these areas should focus on internal structural optimization rather than mere expansion. The interaction between patch density and LSI similarly exhibits a tendency to elevate this classification likelihood (Figure 9f).
In C1, the interaction network centers on LSI and SHAPE_MN, which produce the strongest joint effect (Figure 9g, interaction value 0.0065). Predominantly positive interaction values across most ranges demonstrate that combining overall landscape complexity with irregular patch shapes synergistically elevates the probability of high carbon classification. This suggests that in these cities, the morphological penalty of having both complex landscapes and irregular shapes is severe. Notable interactions also emerge between LSI and COHESION (Figure 9h) and between the aggregation index and SHAPE_MN (Figure 9i), further confirming that spatial configuration and shape regularity are the dominant morphological determinants for carbon intensity in this cluster.
In C2, strong interactions are observed among key morphological indicators, specifically involving aggregation and shape metrics. The economic density and LSI pairing dominates (Figure 9j, interaction value 0.0064). Strongly positive interaction values in specific intervals indicate that high economic density combined with landscape complexity substantially increases the likelihood of high carbon classification. Regarding pure morphological interactions, significant joint effects also characterize the CLUMPY and AI combination (Figure 9k) and the CLUMPY and LPI combination (Figure 9l). These results highlight that in C2, the spatial aggregation of patches (CLUMPY and AI) interacts intensely with landscape composition, playing a critical role alongside economic factors.
In C3, LSI anchors the interaction network, exhibiting the strongest joint effect with CLUMPY (Figure 9m, interaction value 0.0066). High concurrent values generate strongly positive interactions that markedly increase the probability of high carbon classification. Conversely, the LSI and PD interaction yields negative values at low indicator levels, indicating a synergistic reduction in high carbon classification likelihood. This suppressive effect diminishes as either of the metrics rise (Figure 9n). This implies that while low-density, simple landscapes are carbon efficient, uncontrolled increases in complexity and aggregation can rapidly degrade environmental performance. Therefore, maintaining low landscape complexity is critical for sustaining low carbon intensity in C3 cities. The economic density and MESH interaction remains comparatively weak (Figure 9o). These patterns underscore that managing landscape shape complexity alongside spatial aggregation patterns is critical for accurate classification in this cluster.
5. Discussion
5.1. Nonlinear Effects of Urban Morphology on Carbon Emission Intensity
Prior research has predominantly examined linear relationships between urban morphology and continuous environmental metrics, with limited attention to the complex nonlinear mechanisms governing carbon intensity category assignment. Departing from this tradition, the present study integrates a gradient boosting classifier with a dual-interpretability framework. This methodology systematically quantifies the nonlinear contributions of morphological features to categorical prediction and examines their heterogeneity across distinct urban types. Results indicate that morphological features exert nonlinear effects on carbon category assignment, with the magnitude and direction of their contributions varying across city types. Partial dependence plots reveal distinct class probability trajectories, demonstrating that the relationship between morphological indicators and classification likelihood rarely follows a monotonic pattern. Instead, it frequently exhibits threshold regions where the predicted probability of category membership shifts noticeably. The detailed examination of these threshold dynamics and their quantitative benchmarks is provided in Section 5.2.
Specifically, this study identifies multiple pathways through which urban morphology influences carbon intensity category assignment. First, spatial configurations regulate the distribution and interaction of human activities and material flows. Higher spatial aggregation and landscape connectivity may enhance operational efficiency yet require alignment with economic density. When local capacity constraints are approached, these features can shift the classification probability toward higher emission categories. Second, morphological characteristics influence category assignment by modulating local microclimates. Landscape complexity and fragmentation affect ventilation and surface evaporation, thereby altering building energy demands. The nonlinear probability trajectories clarify how these microclimatic influences transition from reducing to increasing the likelihood of classification into specific intensity categories as morphological complexity rises. Finally, morphological attributes interact with the spatial distribution of socio-economic activities. Combined contributions of economic density and specific morphological metrics, such as effective mesh size, can noticeably shift classification likelihood across urban categories. Fundamentally, urban landscape patterns operate as complex systems in which spatial configuration influences category assignment through threshold-dependent nonlinear contributions. This perspective offers an alternative to linear frameworks and provides a structured reference for developing context-specific low-carbon spatial planning strategies.
5.2. Threshold Effects of Urban Morphology on Carbon Emission Intensity
The influence of key morphological indicators on carbon emission intensity category assignment does not follow a linear trajectory. Instead, the directional impact and contribution intensity of these indicators undergo observable shifts within distinct value ranges. As demonstrated in the analytical results and visualized in Figure 6, PDPs identify critical transition zones where these directional changes occur, offering measurable reference points for spatial regulation. For example, the marginal effect of urban land proportion (proportion of built-up area) on classification probability shifts from reducing to increasing the likelihood of high emission category assignment as urban expansion progresses. Similarly, the landscape shape index (LSI) exhibits a clear inflection point, beyond which increased boundary complexity consistently correlates with a higher probability of assignment to high emission categories. The mean urban patch shape index (SHAPE_MN) demonstrates a stabilizing influence up to a certain level, after which its marginal contribution gradually diminishes. These threshold-dependent patterns align with classical urban economic theory, particularly the dynamic trade-off between agglomeration economies and congestion effects. Within the present analytical framework, initial morphological compactness generates efficiency gains through shared infrastructure and reduced spatial friction; however, once critical thresholds are surpassed, these agglomeration benefits are progressively offset by congestion externalities and capacity constraints, consistent with established expectations of diminishing returns in urban spatial systems. Recognizing these nonlinear response trajectories enables planners to anticipate critical transition points and adjust spatial configurations proactively before adverse emission outcomes materialize.
Crucially, these threshold effects exhibit substantial heterogeneity across urban clusters. In the high-emission C0 cluster, thresholds for spatial aggregation and patch size appear at lower values compared to other groups, suggesting that capacity constraints emerge earlier in cities with terrain-induced spatial fragmentation. In the medium-emission ecological C1 cluster, the threshold for shape complexity interacts differently with cohesion metrics, indicating that maintaining regular patch shapes up to a certain level supports lower-emission classification. The medium-emission developmental C2 cluster shows that economic density modifies morphological thresholds, with high economic activity lowering the tolerance for landscape complexity before classification probability shifts upward. In the low-emission C3 cluster, the landscape shape index threshold is particularly pronounced, highlighting that strict control of boundary irregularity is essential to maintain low-emission status. These divergent trajectories suggest that optimizing single morphological indicators is not universally applicable. Strategies aimed at influencing category assignment through spatial regulation should account for local baseline conditions, recognizing that exceeding context-specific thresholds may yield limited or counterproductive outcomes. Furthermore, interaction effects among morphological factors indicate that combined thresholds shift under different variable pairings, reinforcing the need to evaluate morphological regulation within an integrated, cluster-specific framework.
5.3. Implications for Urban Planning and Management
Urban spatial form functions as a direct regulatory instrument for carbon management rather than a passive physical backdrop. The identified nonlinear thresholds and interaction patterns provide measurable targets for spatial planning and development control. To systematically translate these findings into actionable governance, it is essential to categorically align spatial interventions with the distinct economic development models characterizing each cluster. The four categories reflect divergent developmental trajectories, each exhibiting a unique mechanism through which economic activities interact with urban form to either exacerbate or mitigate carbon intensity. Effective implementation requires explicitly mapping these development models to ensure morphological adjustments directly support low-carbon economic transitions.
Cities in the high-emission cluster (i.e., C0) typically follow an extensive expansion model constrained by complex topography and reliant on resource intensive industries. Economic growth in these regions drives continuous physical land consumption. Planning authorities must enforce strict boundaries for urban expansion and mandate minimum landscape aggregation thresholds. Directing new industrial development toward existing compact nodes reduces infrastructure duplication and lowers transportation emissions. Municipal zoning codes should require regular plot shapes and integrated green corridors to counteract ventilation blockage from fragmented layouts. Assertively, transitioning from extensive land-driven growth to morphological consolidation constitutes the critical pathway to decouple economic expansion from carbon escalation in terrain-constrained regions. This morphological consolidation directly links spatial efficiency to reduced carbon intensity while sustaining industrial output.
Cities in the medium-emission ecological cluster (i.e., C1) operate under a dispersed development model driven by resource extraction and ecological conservation mandates. Spatially scattered economic activities increase transport distances and buildings’ energy demands. Planning must prioritize consolidating isolated settlements into coordinated service hubs. Regulatory instruments should establish connectivity standards that link functional zones without increasing overall landscape complexity. Investment in centralized heating networks and shared logistics facilities within these hubs directly couples economic efficiency with morphological carbon reduction. Crucially, shifting from dispersed resource-dependent expansion to hub-based consolidation ensures that ecological preservation mandates are structurally reinforced by compact spatial organization, directly translating economic activity into measurable carbon reduction. Consolidating economic functions while maintaining ecological corridors ensures resource activities do not trigger disproportionate emission increases.
Cities in the medium-emission developmental cluster (i.e., C2) exhibit a dense compact growth model characteristic of mature economic centers. Substantial economic output per unit area generates localized emission pressures from concentrated commercial and industrial activities. Urban management should decouple economic intensification from spatial congestion by promoting vertical mixed-use zoning and expanded underground infrastructure. Planning regulations must cap landscape shape complexity while preserving designated ventilation corridors. Allocating high value commercial functions to transit oriented nodes and relocating heavy logistics to peripheral zones ensures economic density improvements translate into measurable emission reductions. Fundamentally, economic intensification in mature centers must be structurally decoupled from horizontal sprawl; enforcing vertical densification and strict spatial boundaries guarantees that economic agglomeration yields proportional carbon intensity reduction rather than compounding environmental loads. Maintaining strict spatial boundaries while upgrading vertical capacity allows economic growth to proceed without increasing landscape fragmentation.
Cities in the low-emission cluster (i.e., C3) follow a traditional industrial development model characterized by monocentric ring expansion. Historical industrial layouts and aging infrastructure sustain moderate baseline emissions within an already efficient spatial configuration. Economic revitalization must avoid uncontrolled boundary irregularity. Municipal authorities should adopt control standards that limit the landscape shape index at current levels while mandating energy efficient retrofits for existing industrial facilities. Development incentives should prioritize brownfield redevelopment within established urban rings to preserve ecological buffers. Specifically, preserving the existing monocentric equilibrium while channeling economic revitalization inward demonstrates that morphological stability, rather than outward expansion, is the most effective driver of carbon reduction in historically industrialized cities. Channeling economic investment into existing industrial cores rather than expanding outward preserves the current reduced emission morphological equilibrium and prevents carbon intensity escalation.
The successful application of these spatial governance measures depends on integrating morphological thresholds directly into municipal development approval workflows. Local planning departments should establish automated compliance checks that evaluate proposed land use changes against cluster specific emission probability curves. Regular monitoring of landscape metric shifts will allow authorities to adjust zoning parameters before threshold crossings occur. This targeted approach ensures that economic development strategies consistently align with spatial configurations that minimize carbon intensity across diverse urban contexts.
5.4. Limitations and Future Directions
This study examines the nonlinear, threshold-dependent, and interactive contributions of urban morphology to carbon emission intensity category assignment. Given the constraints of available data and methodological scope, several limitations remain, and future research may extend the analysis in the following directions.
First, the interpretability framework primarily identifies contribution patterns and relative importance, but the underlying physical and socio-economic mechanisms driving these threshold shifts require further exploration. Future studies could integrate multi-source datasets, such as high-resolution building energy consumption records, traffic mobility patterns, or microclimate observations, and combine these with urban climate or transportation models to provide more detailed mechanistic explanations for the observed threshold and interaction effects.
Second, the current analyses relies on cross-sectional panel data, which captures static associations across discrete time points. Urban morphology and carbon emission patterns are inherently dynamic, and longitudinal changes may involve cumulative effects, lagged responses, or path dependencies. Constructing continuous temporal datasets and applying spatiotemporal modeling techniques or sequential machine learning approaches could help clarify the long-term evolution of morphological influences on category assignment.
Third, this study primarily focuses on morphological indicators, while carbon emission intensity is also shaped by non-morphological factors such as energy structure, industrial composition, technological adoption, and policy interventions. These variables are not explicitly included in the current model and may operate as unobserved influences. As a result, the importance rankings of morphological features may partly reflect correlations with these unmeasured variables rather than their intrinsic causal effects. While this study establishes robust statistical associations between urban morphology and carbon emission categories, the results do not imply direct causality. Instead, urban morphology acts as a “spatial constraint framework” that shapes carbon emission patterns indirectly by influencing traffic efficiency, energy consumption modes, and built environment configurations. Future frameworks could incorporate broader socio-economic and policy indicators (where data availability permits) to more comprehensively assess the relative contributions of morphological factors and explore their synergistic pathways with technological and institutional variables.
6. Conclusions
Based on a sample of 336 Chinese cities, this study constructs an urban morphological indicator system encompassing multi-dimensional characteristics to classify urban carbon emission intensity levels. To identify urban typologies, the K-means clustering algorithm, Gaussian mixture models, agglomerative hierarchical clustering, and spectral clustering were systematically compared. Comparative evaluation indicates that spectral clustering yields comparatively balanced category distributions, which supports the subsequent statistical representation of distinct urban types. Consequently, this study applies spectral clustering to partition the sample into four urban clusters characterized by differing development trajectories. Integrating a Bayesian optimized gradient boosting classifier with a dual-interpretability framework combining SHAP and PDPs, the study examines the relationship between urban morphology and carbon emission intensity category assignment from three perspectives. These perspectives include feature relevance, nonlinear probability transitions, and interaction mechanisms. While SHAP quantify global feature contributions to category assignment, PDPs illustrate average marginal probability shifts, facilitating the identification of transition boundaries and nonlinear classification trajectories. The results suggest that the association between urban morphology and emission category assignment exhibits nonlinearity and threshold dependency, with dominant features, directional influences, and probability transition ranges varying across urban types.
The findings indicate that uniform morphological regulation approaches may not suit all urban contexts. Within the high-emission intensity cluster, mean urban patch area and urban clumpiness demonstrate positive associations with higher emission category assignment. PDPs indicate probability transition ranges beyond which spatial expansion and extensive agglomeration correspond with elevated classification probabilities, suggesting the need for measured development controls. In the medium-ecological cluster, complex interactions and compensatory relationships exist among shape indicators. Spatial planning may benefit from coordinating morphological complexity across landscape and patch scales within probability ranges associated with lower emission categories. Within the medium-emission developmental cluster, interaction effects between economic density and morphological characteristics are notable, suggesting that spatial adjustments during development may help moderate the association between economic intensification and higher emission category assignment. In the low emission cluster, landscape shape complexity correlates with increased classification probabilities, whereas spatial aggregation demonstrates a mitigating association. PDPs indicate a probability shift boundary for the landscape shape index, suggesting that monitoring this metric may support category stability.
Furthermore, interaction effects among morphological factors exhibit considerable complexity. Analysis using SHAP indicates that combinations of key morphological features produce non-additive effects on category assignment probabilities. The magnitude and direction of these interactions demonstrate substantial variation across urban clusters. Identical feature pairs may exhibit synergistic, compensatory, or statistically neutral associations depending on the urban context. Complementing this observation, stratified partial dependence plots demonstrate how these interaction dynamics influence probability distributions and transition boundaries across different urban settings.
Overall, this study examines the nonlinear, threshold, and interaction patterns associated with the relationship between urban morphology and carbon emission intensity categories across national and subregional scales. By utilizing partial dependence plots to identify probability transition ranges and SHAP to assess feature relevance, this research offers a reference framework for developing differentiated spatial planning strategies across varying urban development contexts. Additionally, the analytical framework may be applied to examine the relationship between urban morphology and other ecological indicators, offering methodological considerations for spatial optimization and urban resilience assessment.
Author Contributions
Conceptualization, Y.T., W.L., X.Y., L.C. and M.L.; methodology, W.L. and L.C.; software, W.L. and L.C.; validation, Y.T., W.L., X.Y., L.C. and M.L.; formal analysis, W.L. and L.C.; investigation, W.L. and L.C.; resources, L.C. and M.L.; data curation, L.C.; writing—original draft preparation, Y.T., W.L. and L.C.; writing—review and editing, Y.T., W.L., X.Y., L.C. and M.L.; visualization, W.L. and L.C.; supervision, Y.T., X.Y. and M.L.; project administration, Y.T., L.C. and M.L.; funding acquisition, Y.T., L.C. and M.L. All authors have read and agreed to the published version of the manuscript.
Funding
This research was funded by the Natural Science Foundation (No. 2023NSFSC0521), Sichuan Provincial Philosophy and Social Science Research (No. SC23TJ039), Fundamental Research Funds for the Central Universities: Self-initiated Project of the School of Public Administration (2025), and Sichuan Provincial Philosophy and Social Science Fund Young Talents Project (No. SCJJ25QN12).
Data Availability Statement
Dataset available on request from the authors.
Conflicts of Interest
The authors declare no conflicts of interest.
Appendix A
Table A1.
Descriptive statistics of urban morphological indicators within the clustering area.
References
- Seto, K.C.; Fragkias, M.; Güneralp, B.; Reilly, M.K. A meta-analysis of global urban land expansion. PLoS ONE 2011, 6, e23777. [Google Scholar] [CrossRef] [Scilit]
- Hong, S.; Hui, E.C.M.; Lin, Y. Relationship between urban spatial structure and carbon emissions: A literature review. Ecol. Indic. 2022, 144, 109456. [Google Scholar] [CrossRef] [Scilit]
- Zheng, S.; Huang, Y.; Sun, Y. Effects of urban form on carbon emissions in China: Implications for low-carbon urban planning. Land 2022, 11, 1343. [Google Scholar] [CrossRef] [Scilit]
- Sun, C.; Zhang, Y.; Ma, W.; Wu, R.; Wang, S. The impacts of urban form on carbon emissions: A comprehensive review. Land 2022, 11, 1430. [Google Scholar] [CrossRef] [Scilit]
- Dalde, M.C.; Nitivattananon, V.; Sharma, D.; Ninsawat, S. Effects of urban form and socio-economic factors on transport-related carbon dioxide emissions: A structural equation approach. Int. J. Transp. Sci. Technol. 2026, 21, 191–207. [Google Scholar] [CrossRef] [Scilit]
- Jareemit, D.; Srivanit, M.; Tanapant, S.; Limeechokchai, B. Role of urban morphology integrated building envelope materials in achieving zero emissions: A simulation-based study in complex-shaped urban blocks. Energy Rep. 2025, 13, 27–39. [Google Scholar] [CrossRef] [Scilit]
- Li, L.; Sun, S.; Zhong, L.; Han, J.; Qian, X. Novel spatiotemporal nonlinear regression approach for unveiling the impact of urban spatial morphology on carbon emissions. Sustain. Cities Soc. 2025, 125, 106381. [Google Scholar] [CrossRef] [Scilit]
- Oke, T.R. The energetic basis of the urban heat island. Q. J. R. Meteorol. Soc. 1982, 108, 1–24. [Google Scholar] [CrossRef] [Scilit]
- Gago, E.J.; Roldan, J.; Pacheco-Torres, R.; Ordóñez, J. The city and urban heat islands: A review of strategies to mitigate adverse effects. Renew. Sustain. Energy Rev. 2013, 25, 749–758. [Google Scholar] [CrossRef] [Scilit]
- Yan, H.; Zhou, M.; Wang, K.; Wu, X.; Lin, T.; Zhang, G.; Liu, Y.; Ye, H. Can urban three-dimensional compact form reduce building operational carbon emissions? New evidence from a prototypical coastal city. Sustain. Cities Soc. 2025, 130, 106664. [Google Scholar] [CrossRef] [Scilit]
- Sharifi, A. Resilient urban forms: A macro-scale analysis. Cities 2019, 85, 1–14. [Google Scholar] [CrossRef] [Scilit]
- Imhoff, M.L.; Zhang, P.; Wolfe, R.E.; Bounoua, L. Remote sensing of the urban heat island effect across biomes in the continental USA. Remote Sens. Environ. 2010, 114, 504–513. [Google Scholar] [CrossRef] [Scilit]
- Yang, J.; Yang, Y.; Sun, D.; Jin, C.; Xiao, X. Influence of urban morphological characteristics on thermal environment. Sustain. Cities Soc. 2021, 72, 103045. [Google Scholar] [CrossRef] [Scilit]
- Bowler, D.E.; Buyung-Ali, L.; Knight, T.M.; Pullin, A.S. Urban greening to cool towns and cities: A systematic review of the empirical evidence. Landsc. Urban Plan. 2010, 97, 147–155. [Google Scholar] [CrossRef] [Scilit]
- Kabisch, N.; Strohbach, M.; Haase, D.; Kronenberg, J. Urban green space availability in European cities. Ecol. Indic. 2016, 70, 586–596. [Google Scholar] [CrossRef] [Scilit]
- Yu, B.; Pan, J. How do 2D and 3D urban morphology impact spatial patterns of thermal environment? A nested multi-scale local climate zone perspective. Build. Environ. 2026, 288, 114014. [Google Scholar] [CrossRef] [Scilit]
- Chen, Y.; Ma, W.; Shao, Y.; Wang, N.; Yu, Z.; Li, H.; Hu, Q. The impacts and thresholds detection of 2D/3D urban morphology on the heat island effects at the functional zone in megacity during heatwave event. Sustain. Cities Soc. 2025, 118, 106002. [Google Scholar] [CrossRef] [Scilit]
- Tang, G.; Du, X.; Wang, S. Impact mechanisms of 2D and 3D spatial morphologies on urban thermal environment in high-density urban blocks: A case study of Beijing’s Core Area. Sustain. Cities Soc. 2025, 123, 106285. [Google Scholar] [CrossRef] [Scilit]
- Bereitschaft, B.; Debbage, K. Urban form, air pollution, and CO2 emissions in large US metropolitan areas. Prof. Geogr. 2013, 65, 612–635. [Google Scholar] [CrossRef] [Scilit]
- Zhang, X.; Meng, Q.; Xu, J.; Li, K. Urbanization impacts on anthropogenic carbon dioxide emissions and the roles of urban morphologies: Insights from urban socioeconomic clusters and local climate zones in Shanghai, China. Sustain. Cities Soc. 2025, 129, 106494. [Google Scholar] [CrossRef] [Scilit]
- Huang, Y.; Wang, Z.; Zhao, H.; You, D.; Wang, W.; Peng, Y. Quantifying the nonlinear effects of urban morphological features on ecological resilience: Evidence from cities in China. Sustain. Cities Soc. 2026, 136, 107072. [Google Scholar] [CrossRef] [Scilit]
- Wang, W.; Wang, Y.; Shen, C. Quantifying the nonlinear and interactive effects of urban form on resilience to extreme precipitation: Evidence from 192 cities of Southern China. Sustain. Cities Soc. 2025, 125, 106366. [Google Scholar] [CrossRef] [Scilit]
- Guo, L.; Du, S.; Sun, W.; Fan, D.; Wu, Y. Multi-scale impact of urban building function and 2D/3D morphology on urban heat island effect: A case study in Shanghai, China. Energy Build. 2025, 338, 115719. [Google Scholar] [CrossRef] [Scilit]
- Shi, K.; Xu, T.; Li, Y.; Chen, Z.; Gong, W.; Wu, J.; Yu, B. Effects of urban forms on CO2 emissions in China from a multi-perspective analysis. J. Environ. Manag. 2020, 262, 110300. [Google Scholar] [CrossRef] [Scilit] [PubMed]
- Xie, B.; Liu, R.; Dwivedi, R. Digital economy, structural deviation, and regional carbon emissions. J. Clean. Prod. 2024, 434, 139890. [Google Scholar] [CrossRef] [Scilit]
- Li, R.; Li, L.; Wang, Q. The impact of energy efficiency on carbon emissions: Evidence from the transportation sector in Chinese 30 provinces. Sustain. Cities Soc. 2022, 82, 103880. [Google Scholar] [CrossRef] [Scilit]
- Palani, H.; Acosta-Sequeda, J.; Karatas, A.; Derrible, S. The role of socio-demographic and economic characteristics on energy-related occupant behavior. J. Build. Eng. 2023, 75, 106875. [Google Scholar] [CrossRef] [Scilit]
- Xue, J.; Liu, T.; Long, F.; Ge, C.; Weng, Z. Short and long-term impact assessment of urban low-carbon pilot policies on household decarbonization. Environ. Impact Assess. Rev. 2026, 117, 108234. [Google Scholar] [CrossRef] [Scilit]
- Wang, J.F.; Li, X.H.; Christakos, G.; Liao, Y.L.; Zhang, T.; Gu, X.; Zheng, X.Y. Geographical detectors-based health risk assessment and its application in the neural tube defects study of the Heshun Region, China. Int. J. Geogr. Inf. Sci. 2010, 24, 107–127. [Google Scholar] [CrossRef] [Scilit]
- Huang, Y.; Li, S.; Lin, J.; Zheng, L.; Zhuang, C.; Guan, C.; Guo, Y.; Zhuang, Y. Nonlinear and threshold effects of urban building form on carbon emissions. Energy Build. 2025, 329, 115243. [Google Scholar] [CrossRef] [Scilit]
- Chen, L.; Tang, P.; Li, J.; Li, J. Assessment of Low-Carbon Utilization in Territorial Space and Identification of Its Driving Factors: A Case Study of the Yangtze River Economic Belt in China. Land 2025, 14, 738. [Google Scholar] [CrossRef] [Scilit]
- Li, Y.; Liu, L.; Zhang, T.; Liang, Y.; Chen, Z.; Chu, L.; He, C. Climate change and human activities drive the warm-season rooftop solar photovoltaic potential in the Chinese Chengdu-Chongqing urban agglomeration. Sustain. Cities Soc. 2025, 119, 106110. [Google Scholar] [CrossRef] [Scilit]
- Lundberg, S.M.; Lee, S.I. A unified approach to interpreting model predictions. In Advances in Neural Information Processing Systems 30; NIPS Foundation: San Diego, CA, USA, 2017; Volume 30. [Google Scholar]
- Xia, Z.; Li, C.; Zhang, F.; Yan, Y.; Sun, J.; Ma, D.; Guo, Z. Spatial–temporal heterogeneous analysis of the coupling coordination between new urbanization and urban ecological resilience. Int. J. Urban Sci. 2025, 1–29. [Google Scholar] [CrossRef] [Scilit]
- Chen, J.; Gao, M.; Cheng, S.; Liu, X.; Hou, W.; Song, M.; Li, D.; Fan, W. China’s city-level carbon emissions during 1992–2017 based on the inter-calibration of nighttime light data. Sci. Rep. 2021, 11, 3323. [Google Scholar] [CrossRef] [Scilit]
- McGrane, S.J. Impacts of urbanisation on hydrological and water quality dynamics, and urban water management: A review. Hydrol. Sci. J. 2016, 61, 2295–2311. [Google Scholar] [CrossRef] [Scilit]
- McGarigal, K.; Marks, B.J. FRAGSTATS: Spatial Pattern Analysis Program for Quantifying Landscape Structure; USDA Forest Service, Pacific Northwest Research Station: Portland, OR, USA, 1995.
- Bettencourt, L.M. The origins of scaling in cities. Science 2013, 340, 1438–1441. [Google Scholar] [CrossRef] [Scilit] [PubMed]
- Seto, K.C.; Sánchez-Rodríguez, R.; Fragkias, M. The new geography of contemporary urbanization and the environment. Annu. Rev. Environ. Resour. 2010, 35, 167–194. [Google Scholar] [CrossRef] [Scilit]
- Bashmakov, I.A.; Nilsson, L.J.; Acquaye, A.; Bataille, C.; Cullen, J.M.; de la Rue du Can, S.; Fischedick, M.; Geng, Y.; Tanaka, K. Climate Change 2022: Mitigation of Climate Change; Contribution of working group III to the sixth assessment report of the intergovernmental panel on climate change; Cambridge University Press: Cambridge, UK; New York, NY, USA, 2022; Chapter 11. [Google Scholar]
- Andrew, J.; Kaidonis, M.A.; Andrew, B. Carbon tax: Challenging neoliberal solutions to climate change. Crit. Perspect. Account. 2010, 21, 611–618. [Google Scholar] [CrossRef] [Scilit]
- Tapio, P. Towards a theory of decoupling: Degrees of decoupling in the EU and the case of road traffic in Finland between 1970 and 2001. Transp. Policy 2005, 12, 137–151. [Google Scholar] [CrossRef] [Scilit]
- Wu, Y.; Zhu, Q.; Zhu, B. Decoupling analysis of world economic growth and CO2 emissions: A study comparing developed and developing countries. J. Clean. Prod. 2018, 190, 94–103. [Google Scholar] [CrossRef] [Scilit]
- Stern, N. The economics of climate change. Am. Econ. Rev. 2008, 98, 1–37. [Google Scholar] [CrossRef] [Scilit]
- Wang, S.; Zhao, Y.; Wiedmann, T. Carbon emissions embodied in China–Australia trade: A scenario analysis based on input–output analysis and panel regression models. J. Clean. Prod. 2019, 220, 721–731. [Google Scholar] [CrossRef] [Scilit]
- Caruana, R.; Niculescu-Mizil, A. An empirical comparison of supervised learning algorithms. In Proceedings of the 23rd International Conference on Machine Learning; Association for Computing Machinery: New York, NY, USA, 2006; pp. 161–168. [Google Scholar]
- Sokolova, M.; Lapalme, G. A systematic analysis of performance measures for classification tasks. Inf. Process. Manag. 2009, 45, 427–437. [Google Scholar] [CrossRef] [Scilit]
- Hastie, T.; Tibshirani, R.; Friedman, J.H. The Elements of Statistical Learning; Springer: New York, NY, USA, 2009; Volume 2. [Google Scholar]
- Cheng, Y.; Zhang, X.; Yu, S.; Liu, Y.; Hu, J.; Jiang, Y.; Zhang, C.; Wu, X. Leveraging Explainable Machine Learning to Decipher Ecosystem Health and Nonlinear Dynamics in the Henan Yellow River Basin. Land 2026, 15, 429. [Google Scholar] [CrossRef] [Scilit]
- Ru, J.; Li, J.; Gan, L.; Yusufu, G. Digital–Intelligent Transformation and Urban Carbon Efficiency in the Yellow River Basin: A Hybrid Super-Efficiency DEA and Interpretable Machine-Learning Framework. Land 2026, 15, 159. [Google Scholar] [CrossRef] [Scilit]
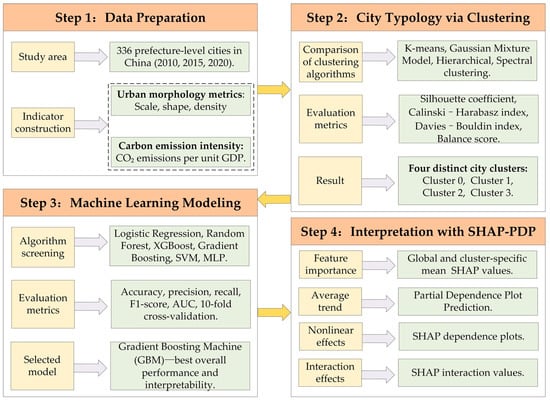
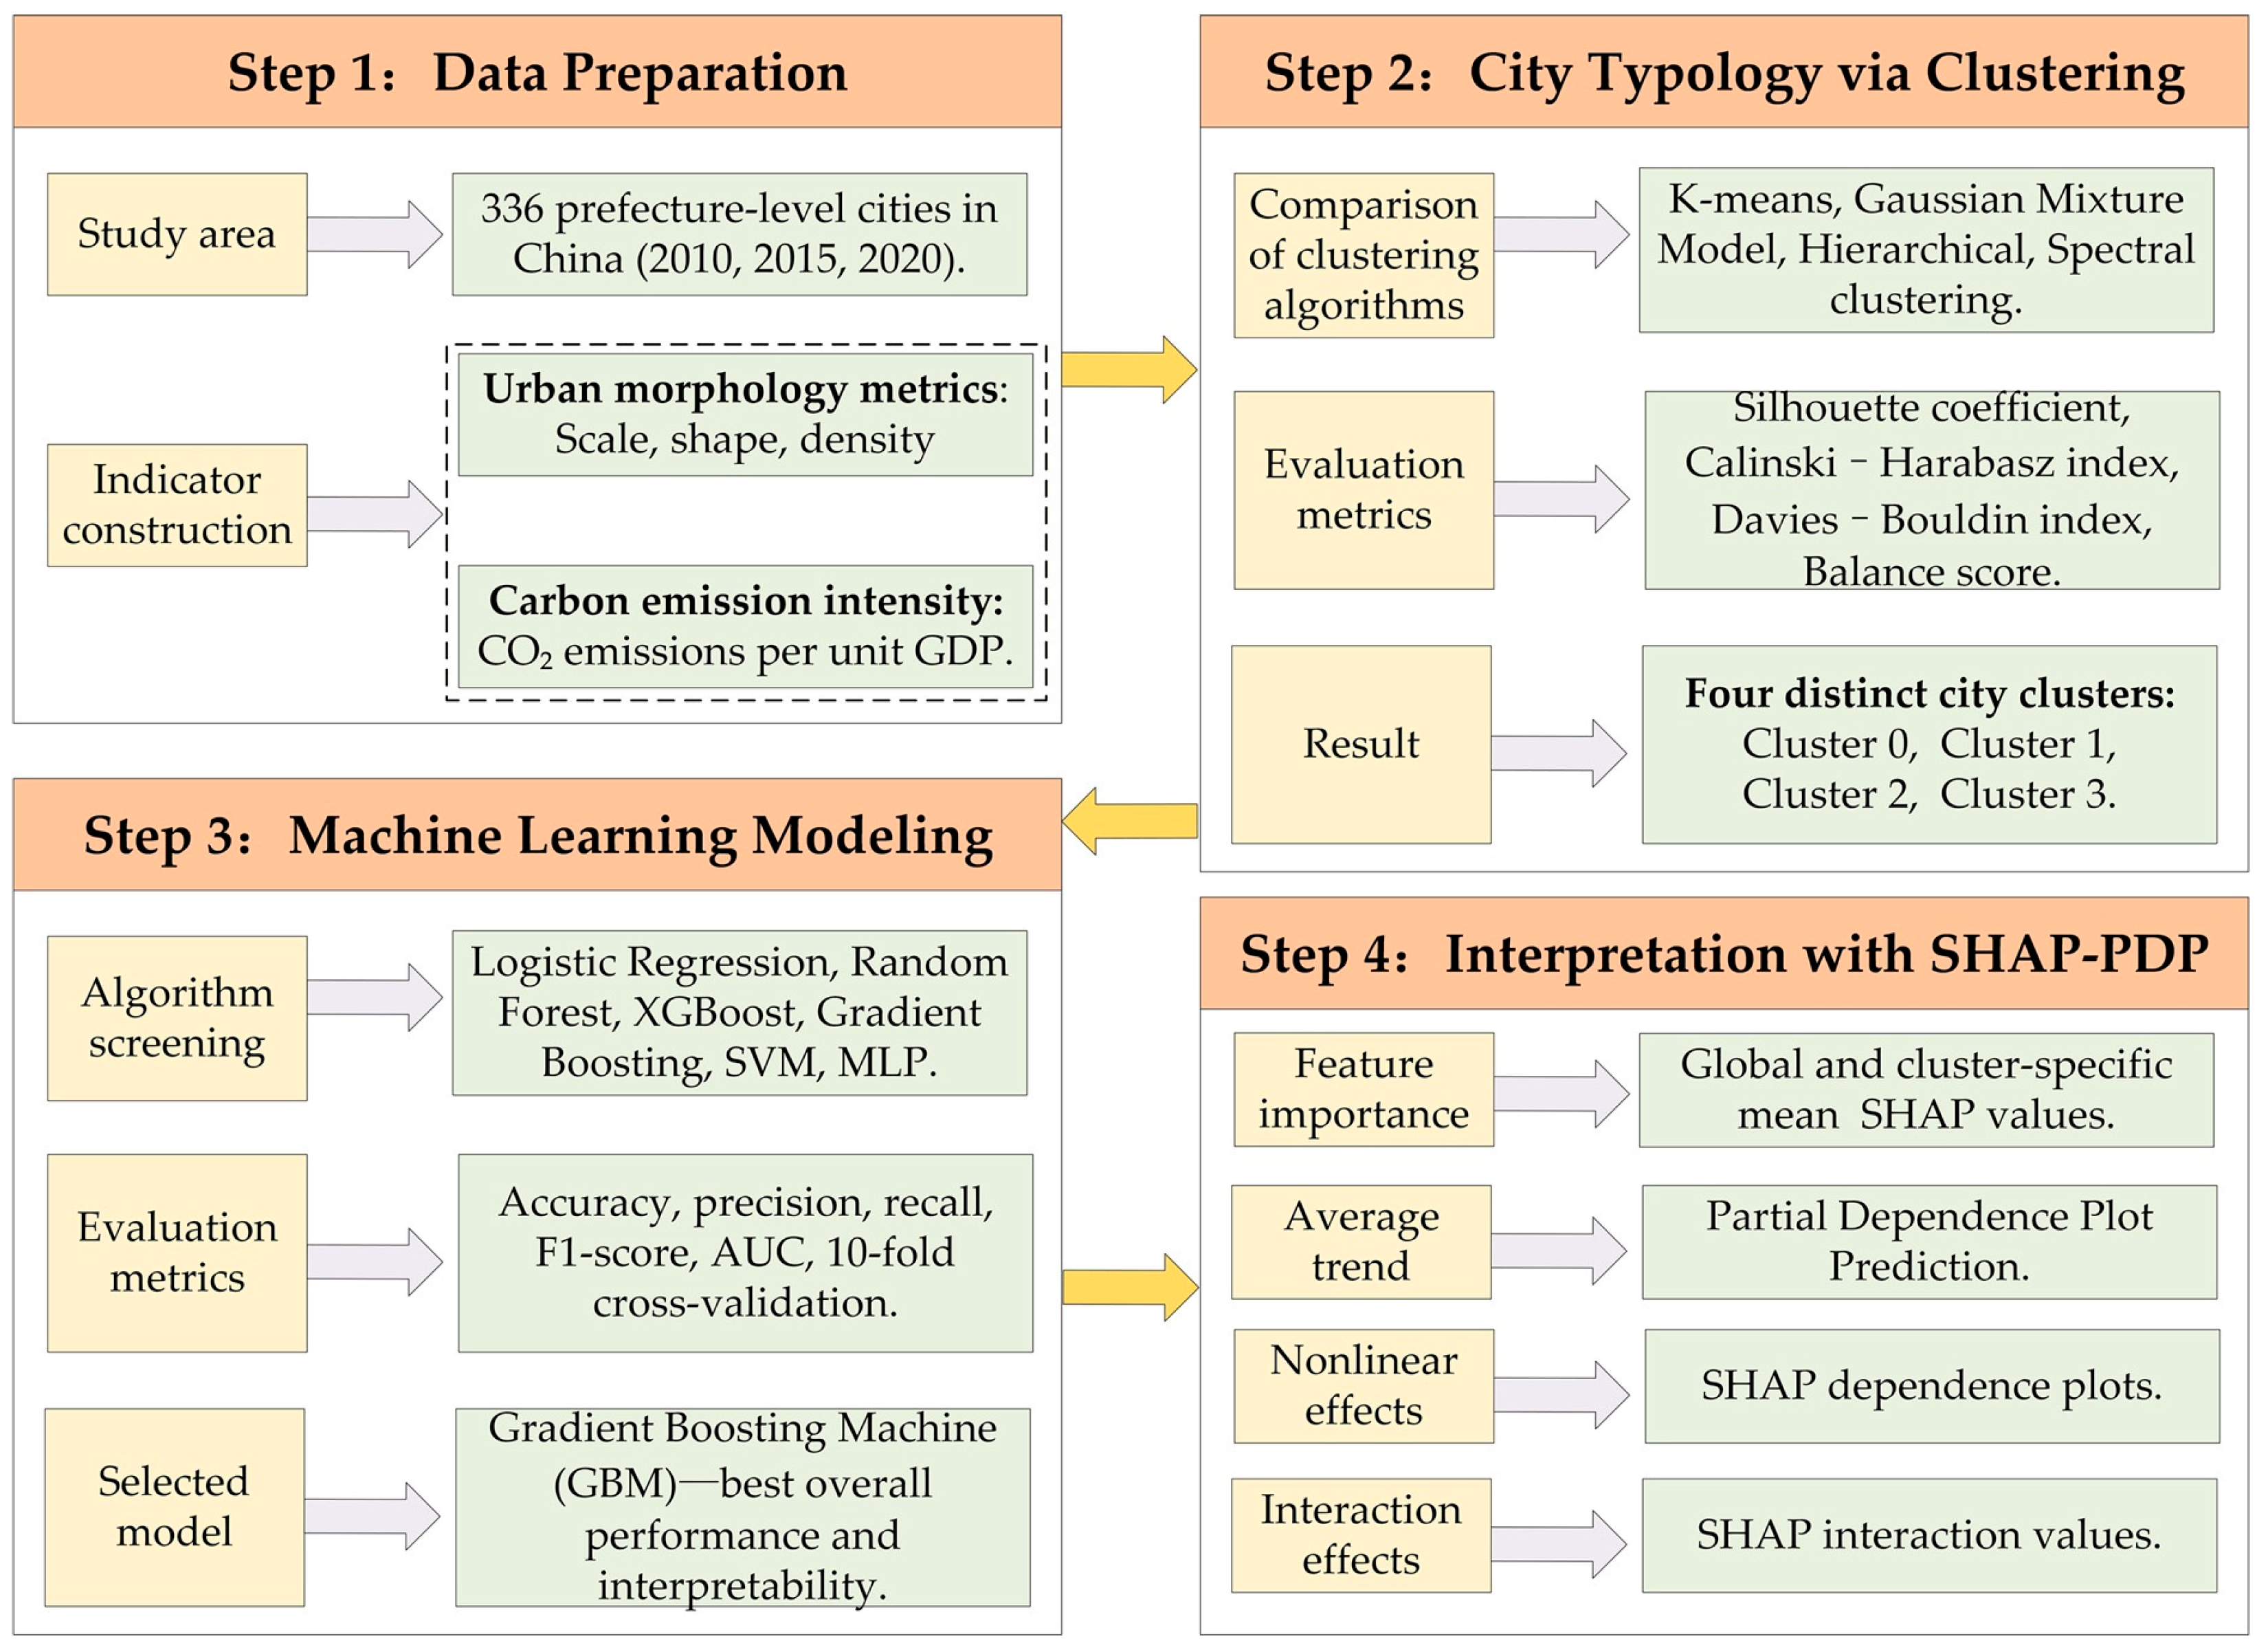
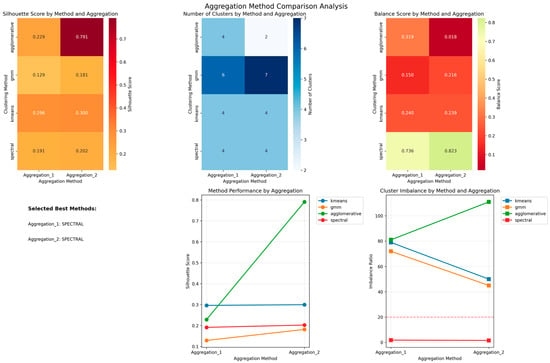
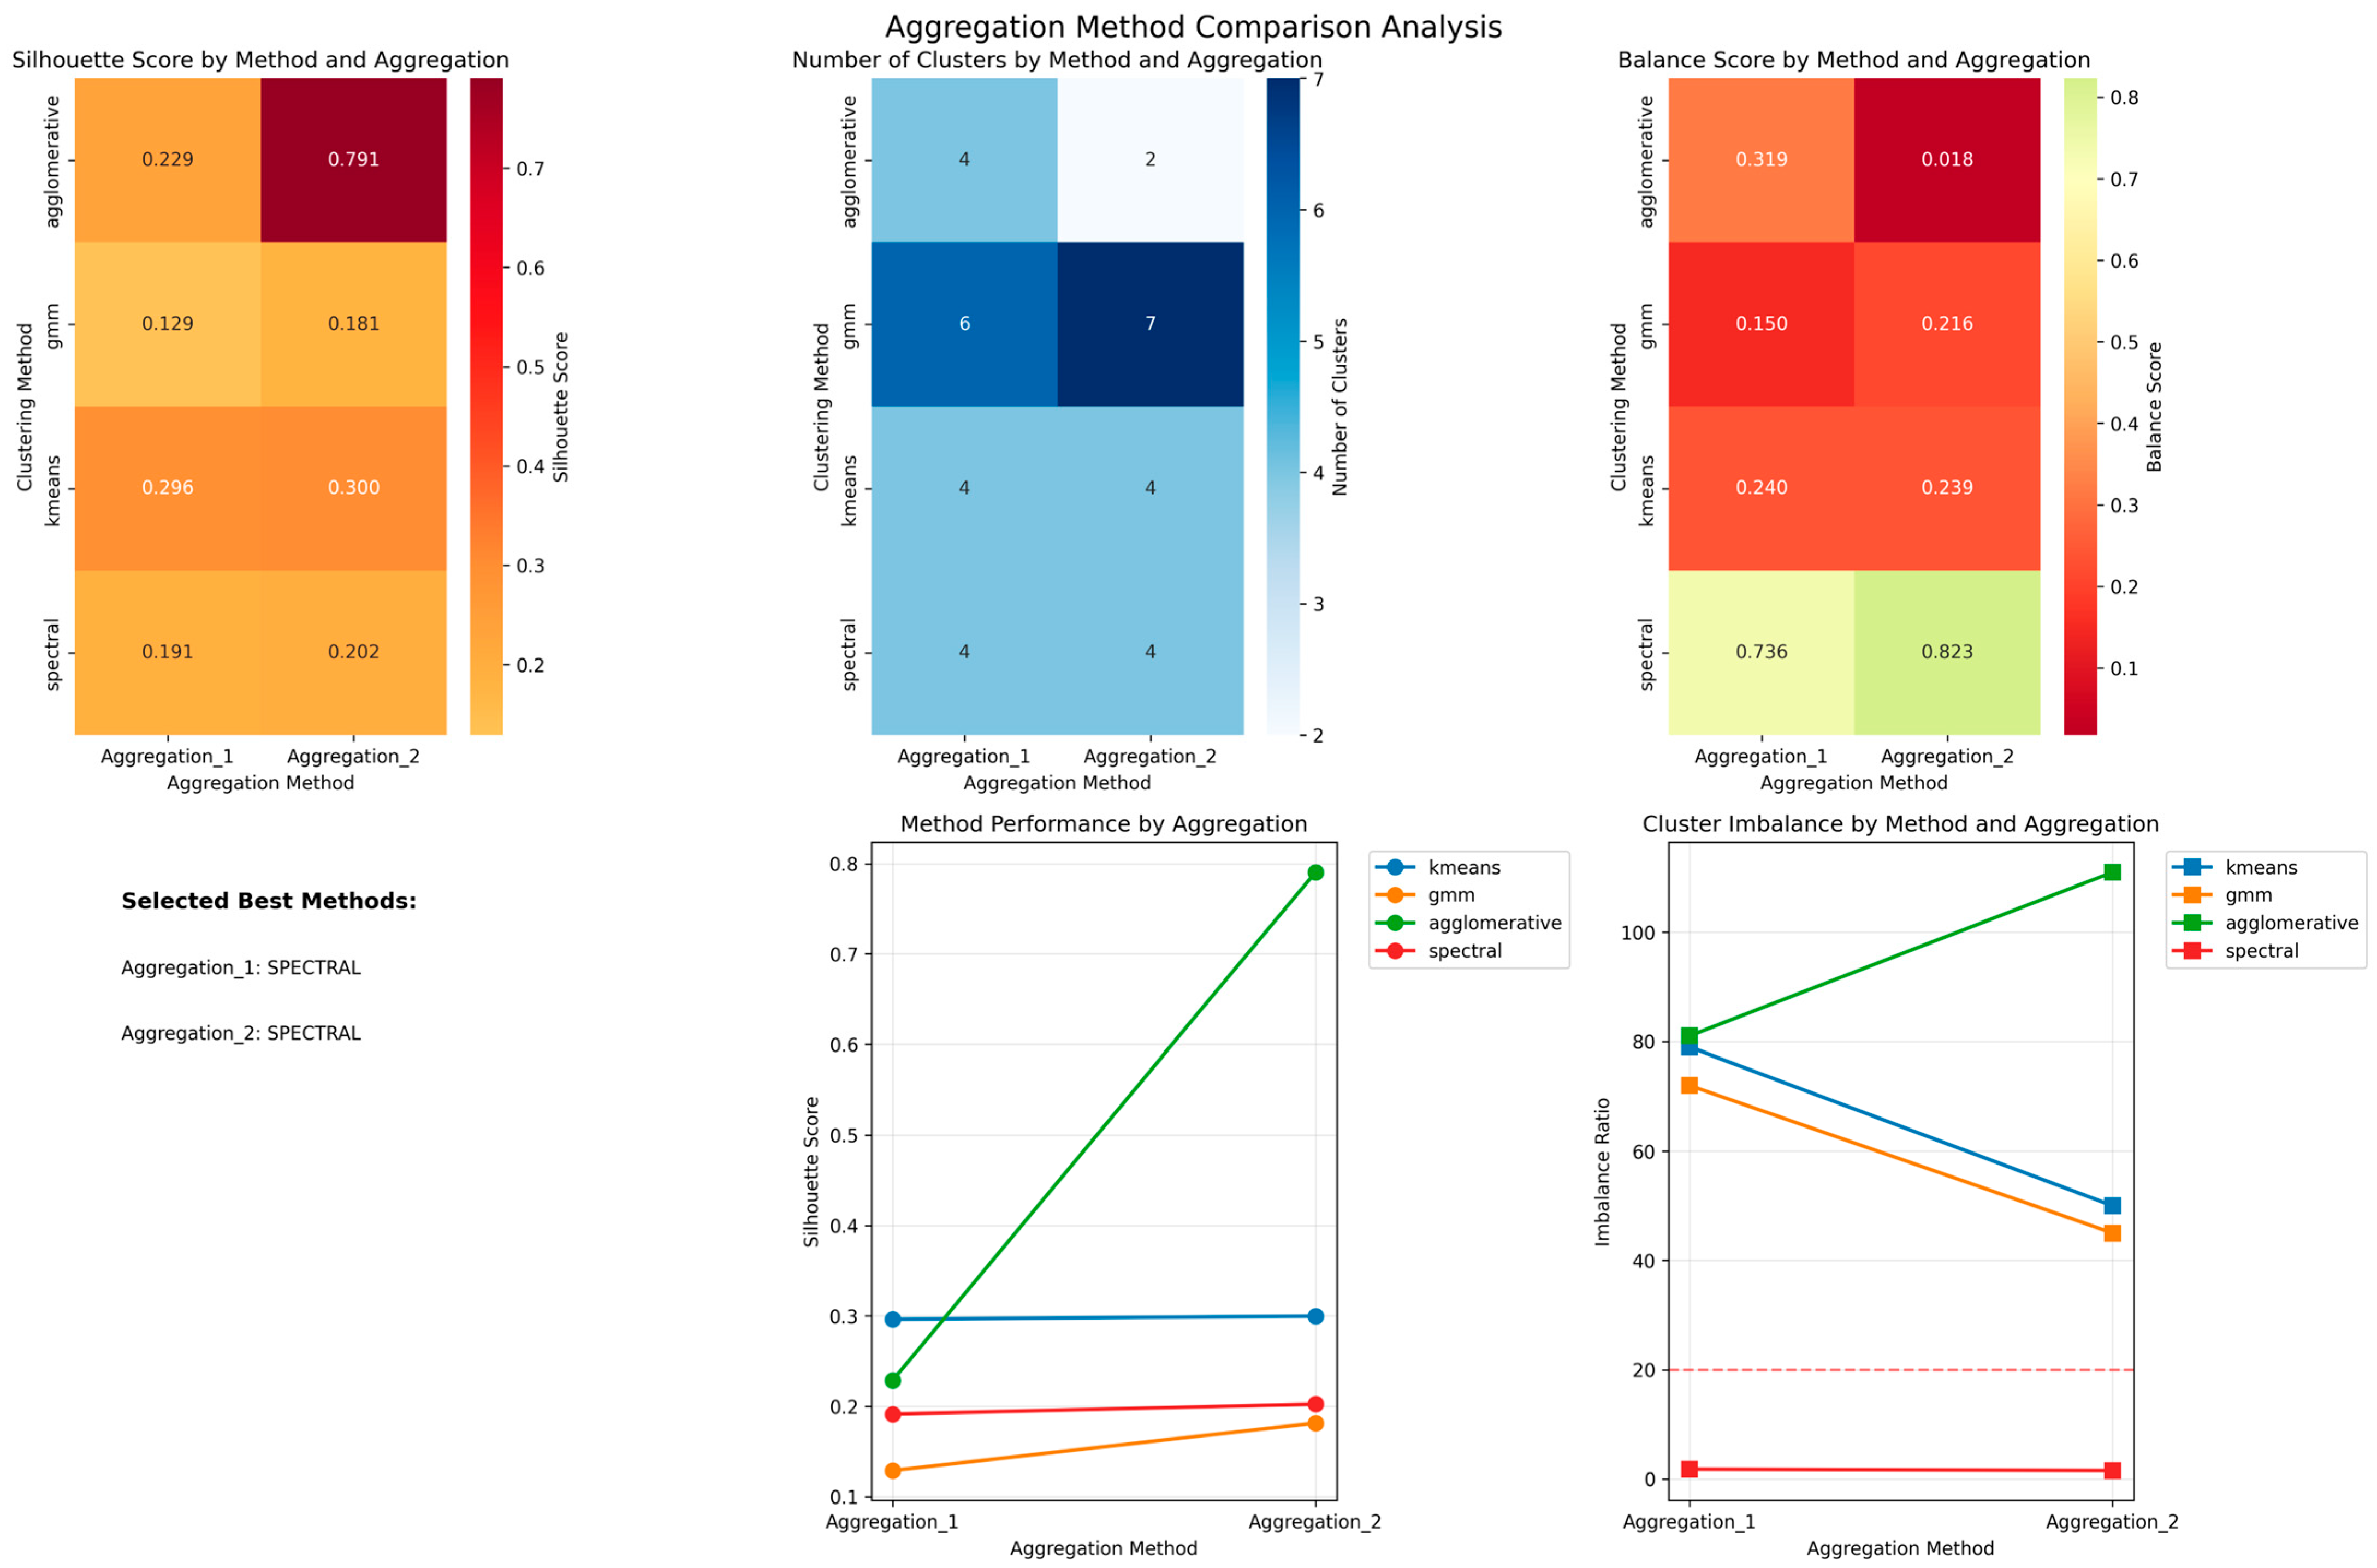
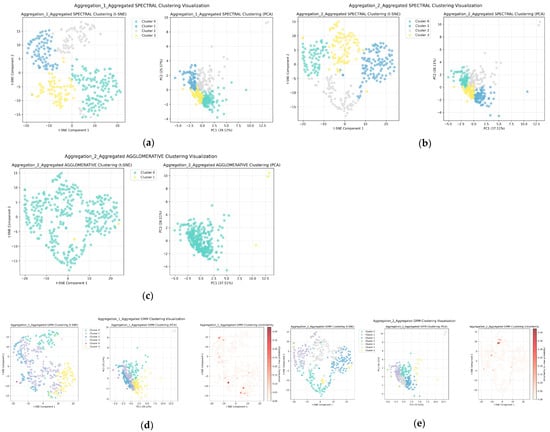
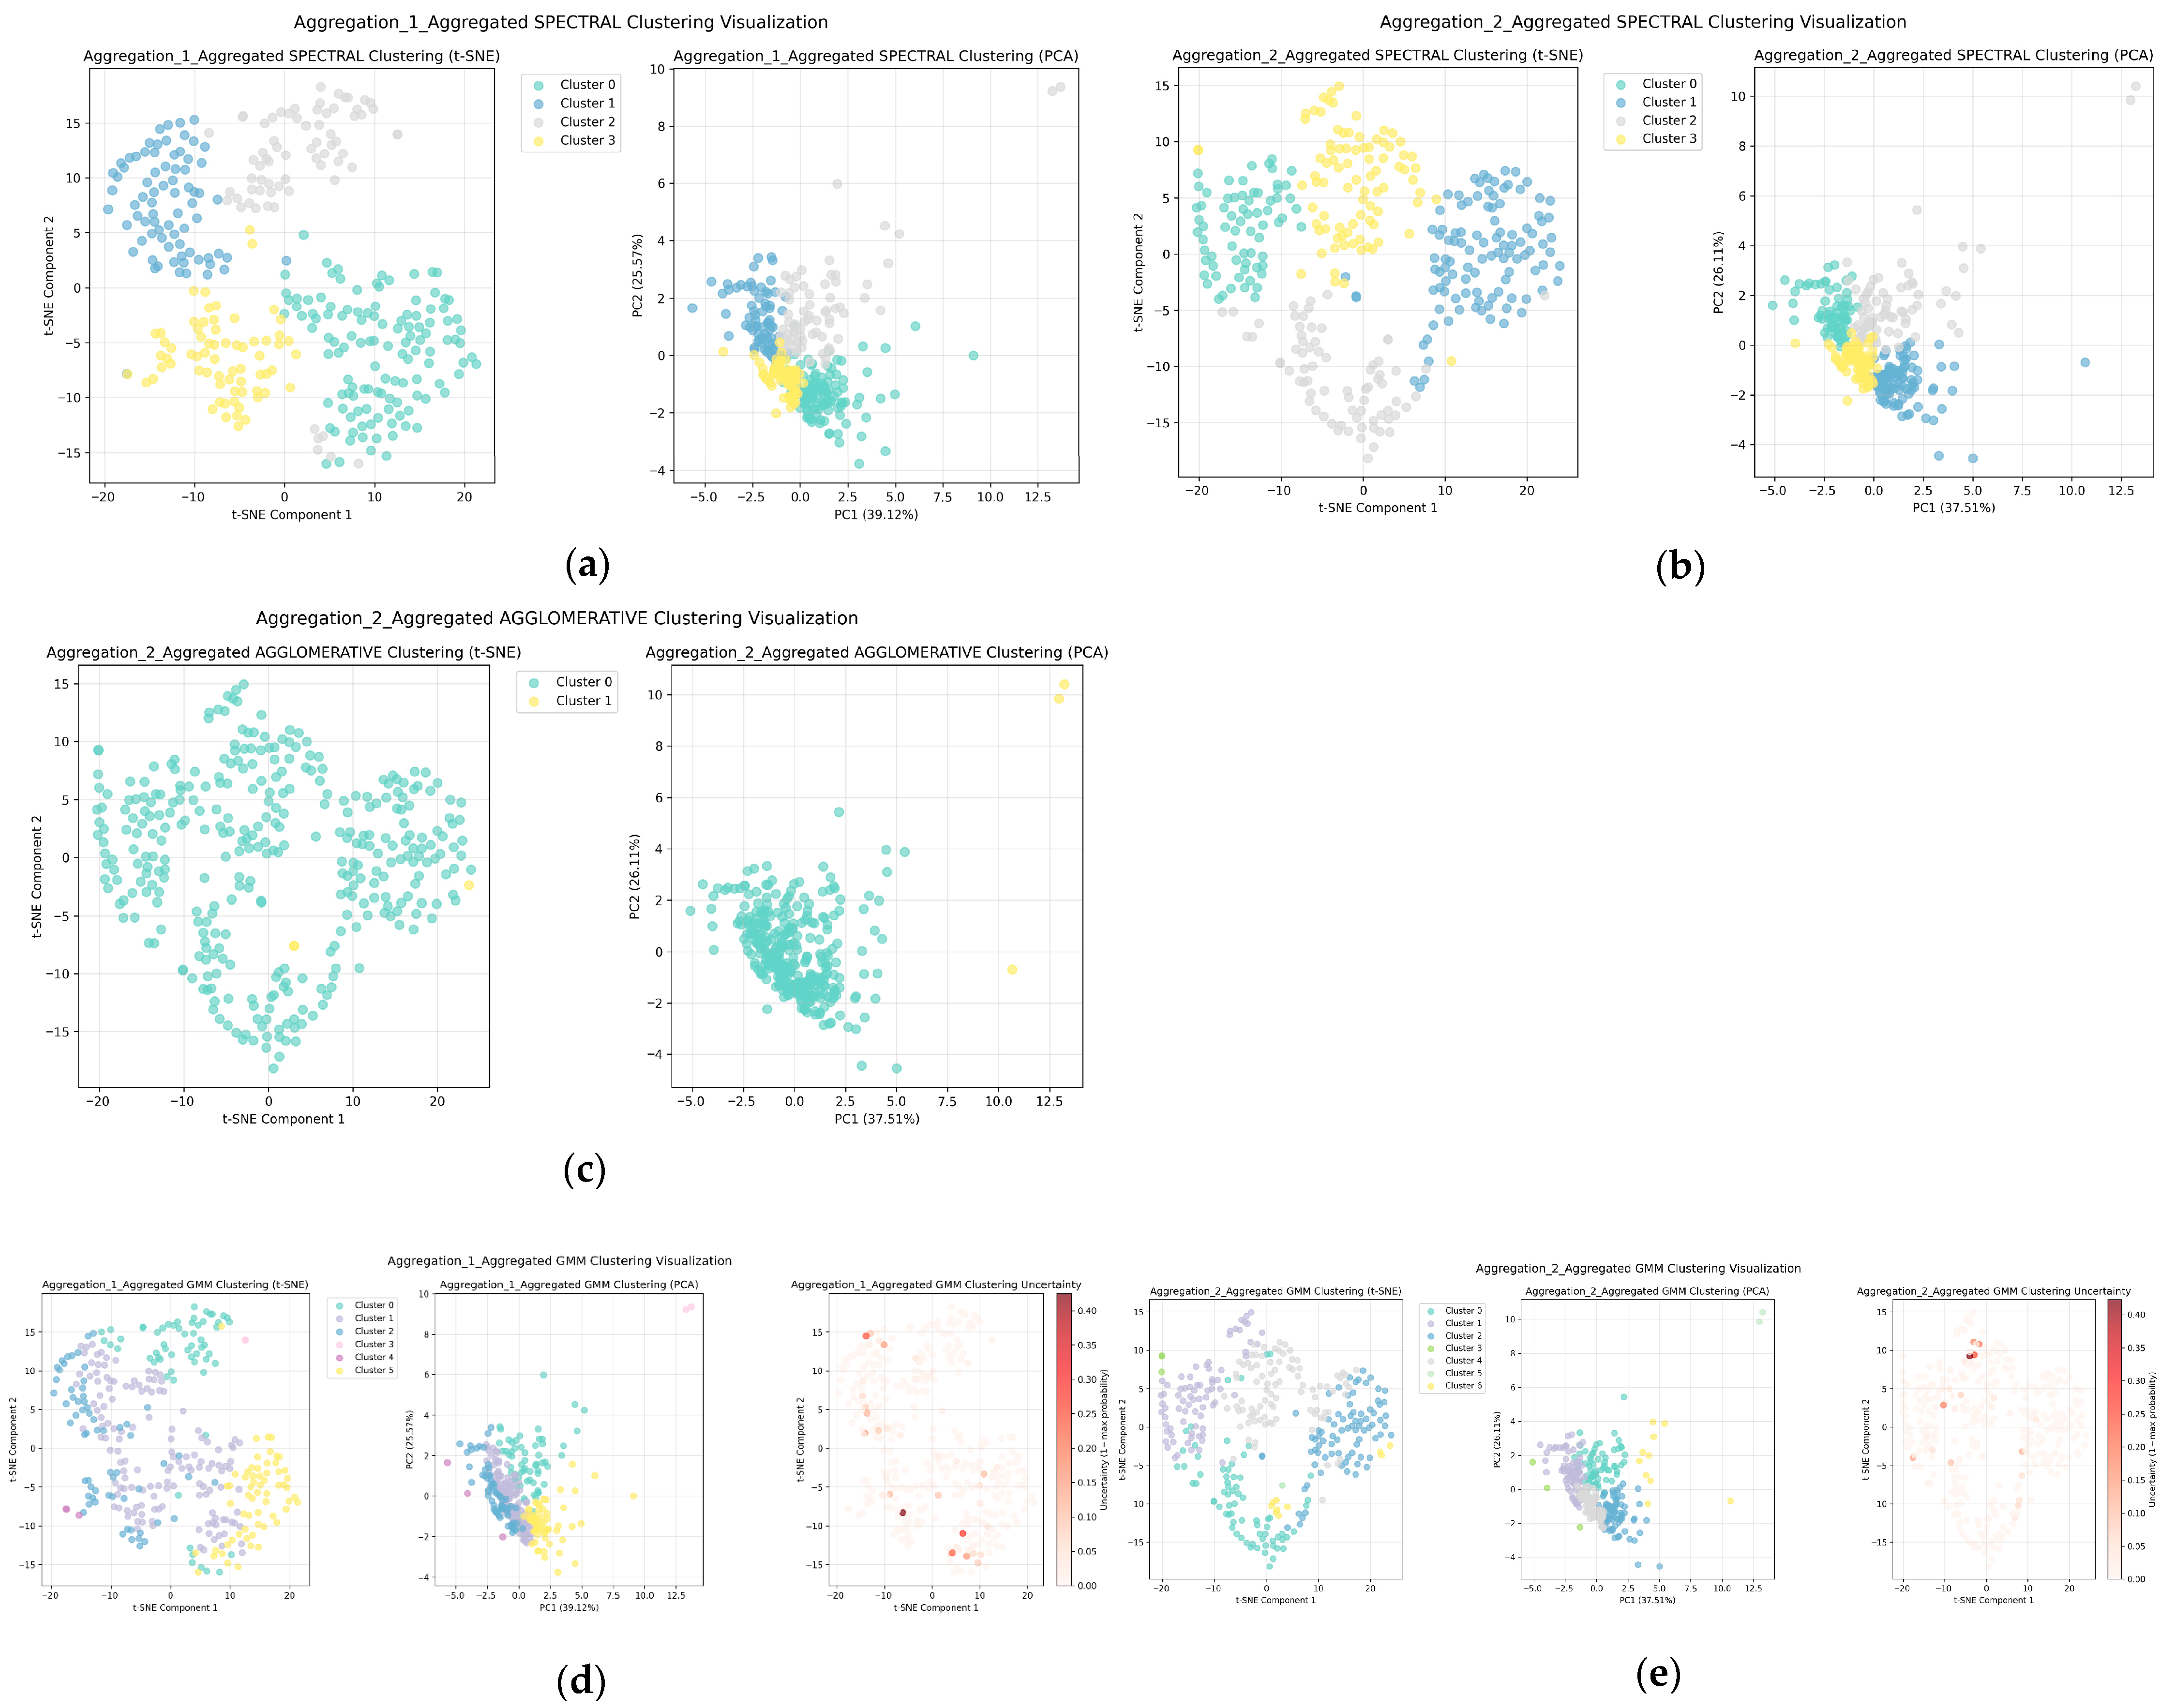
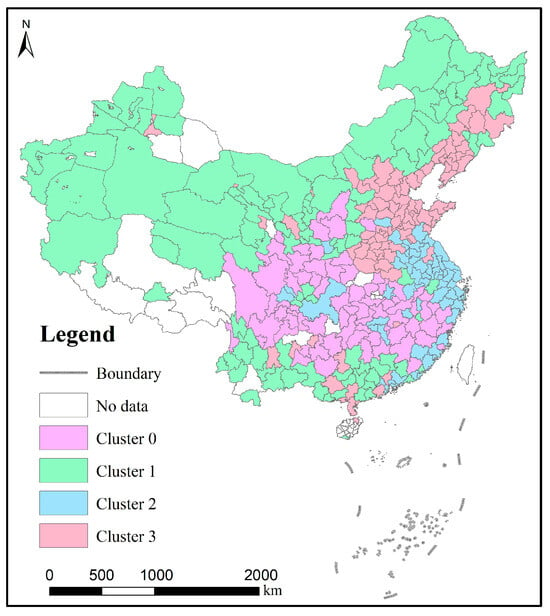
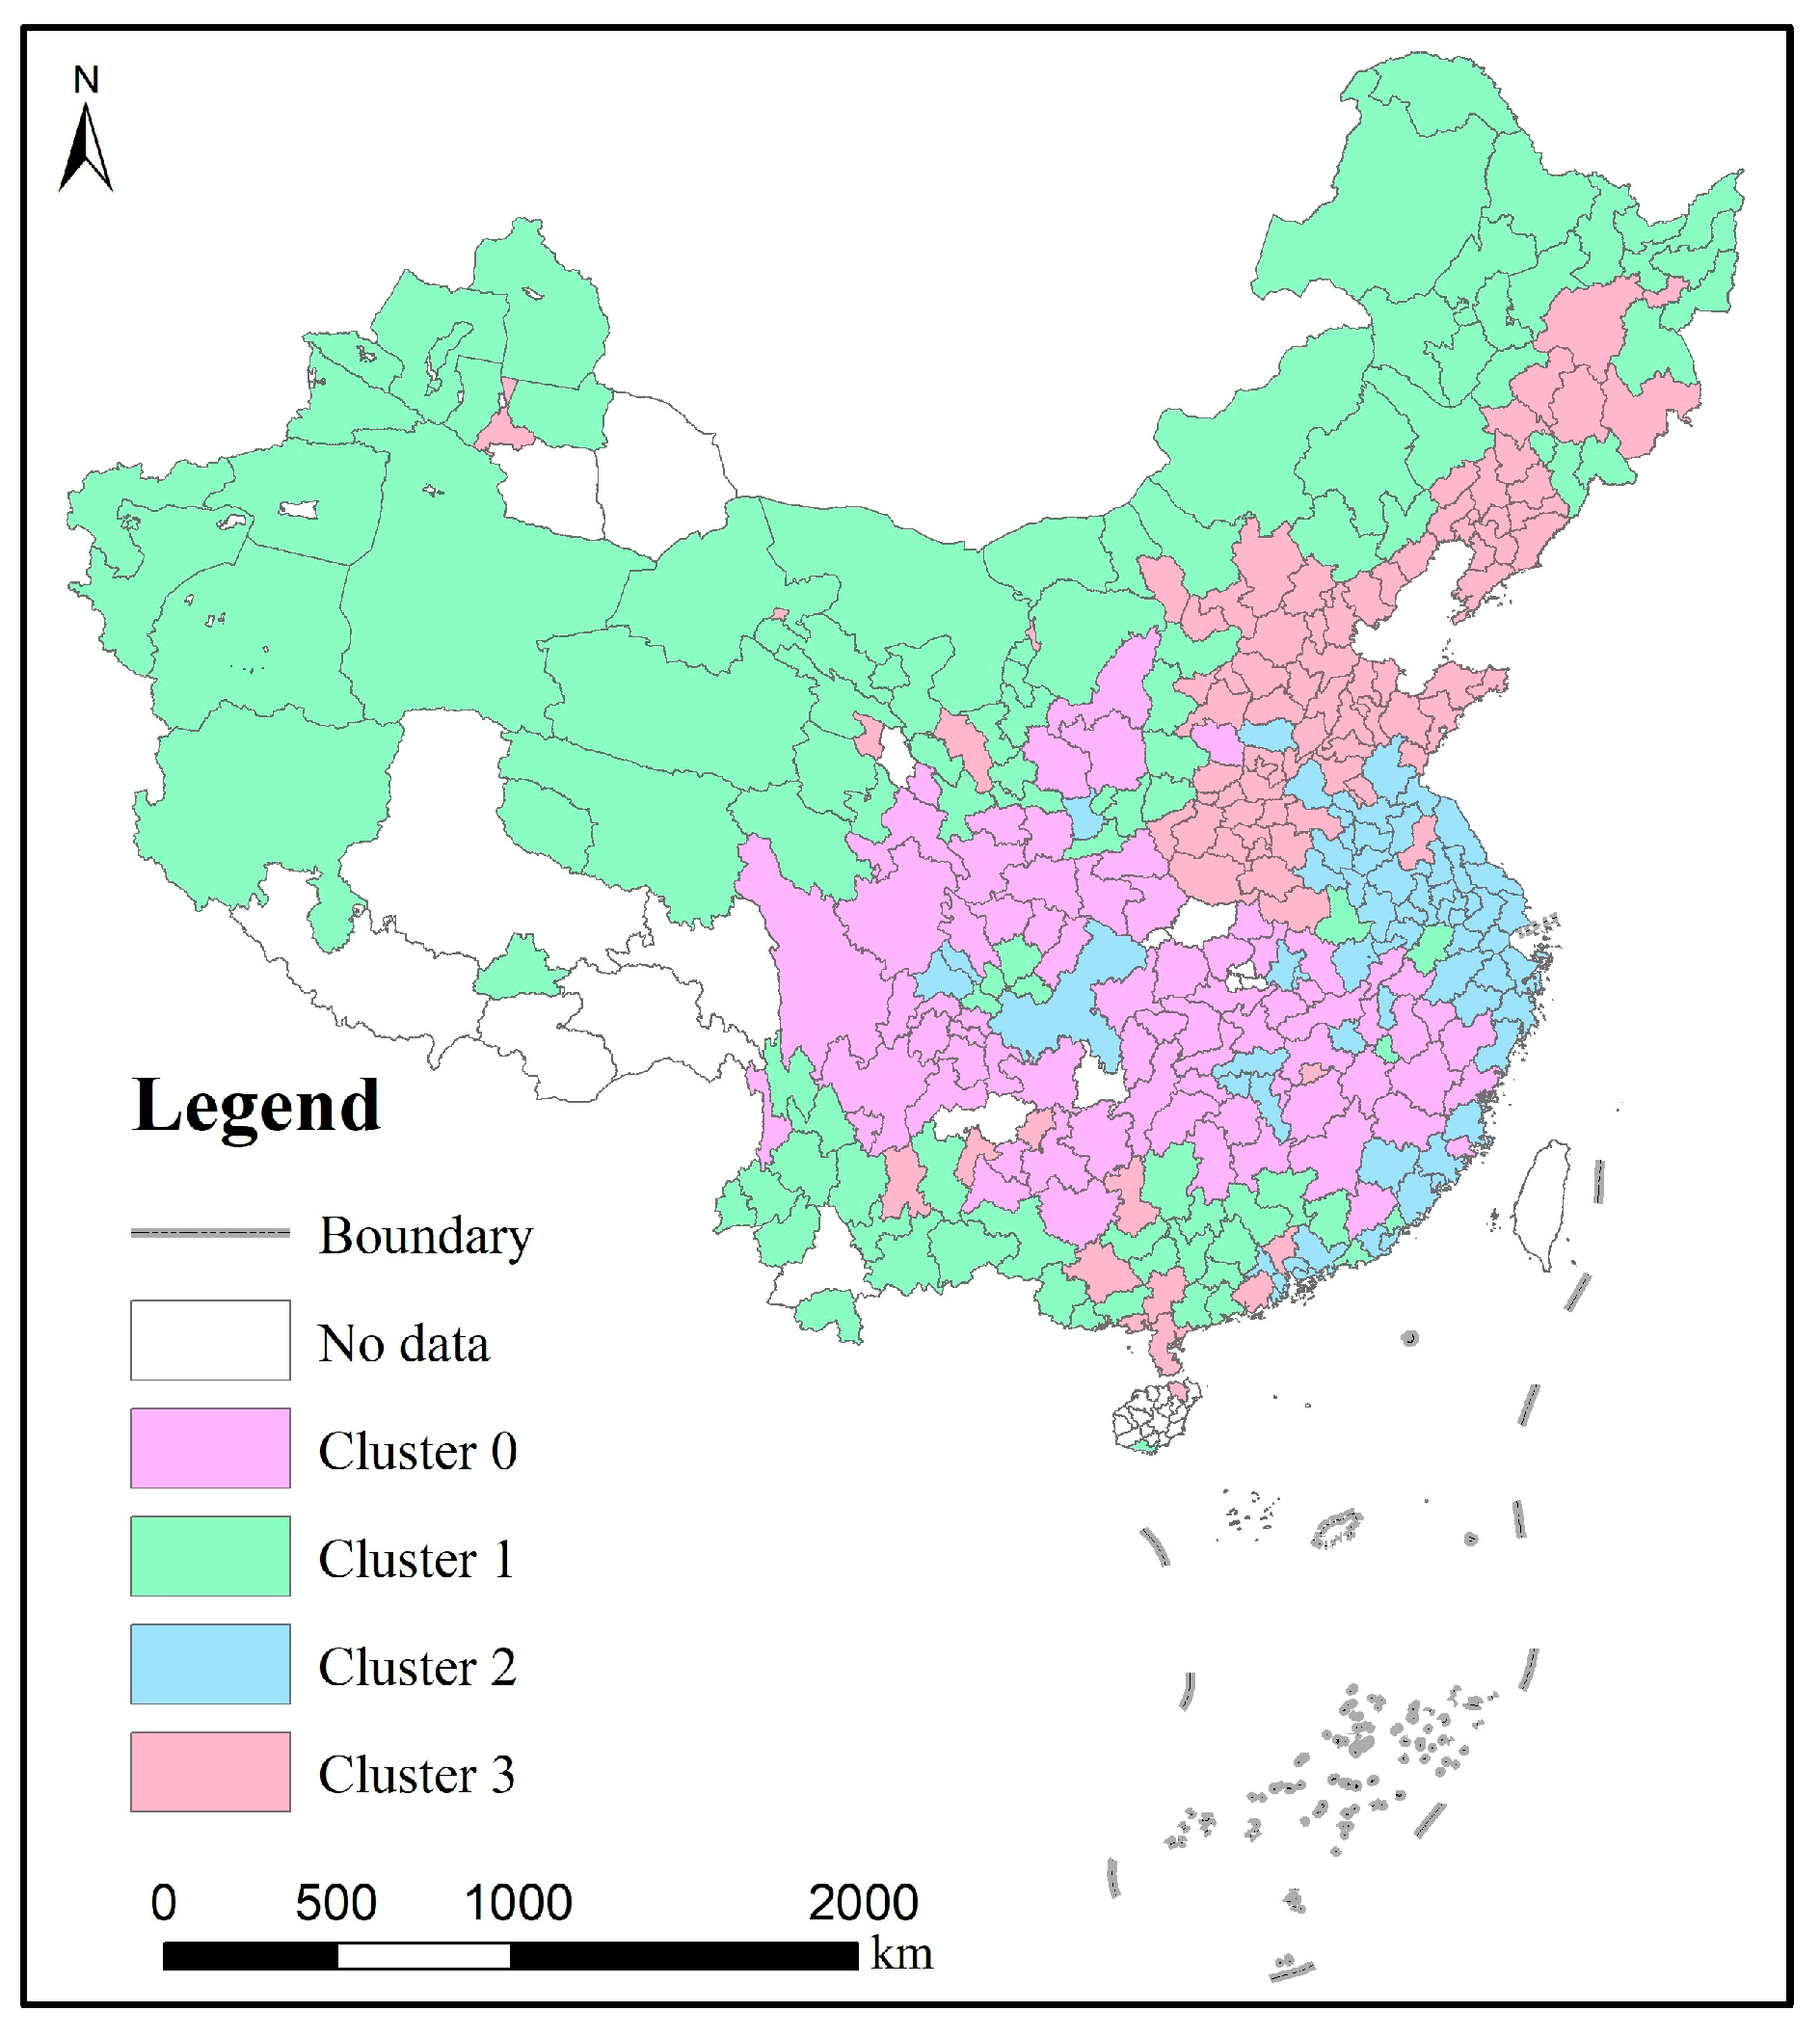
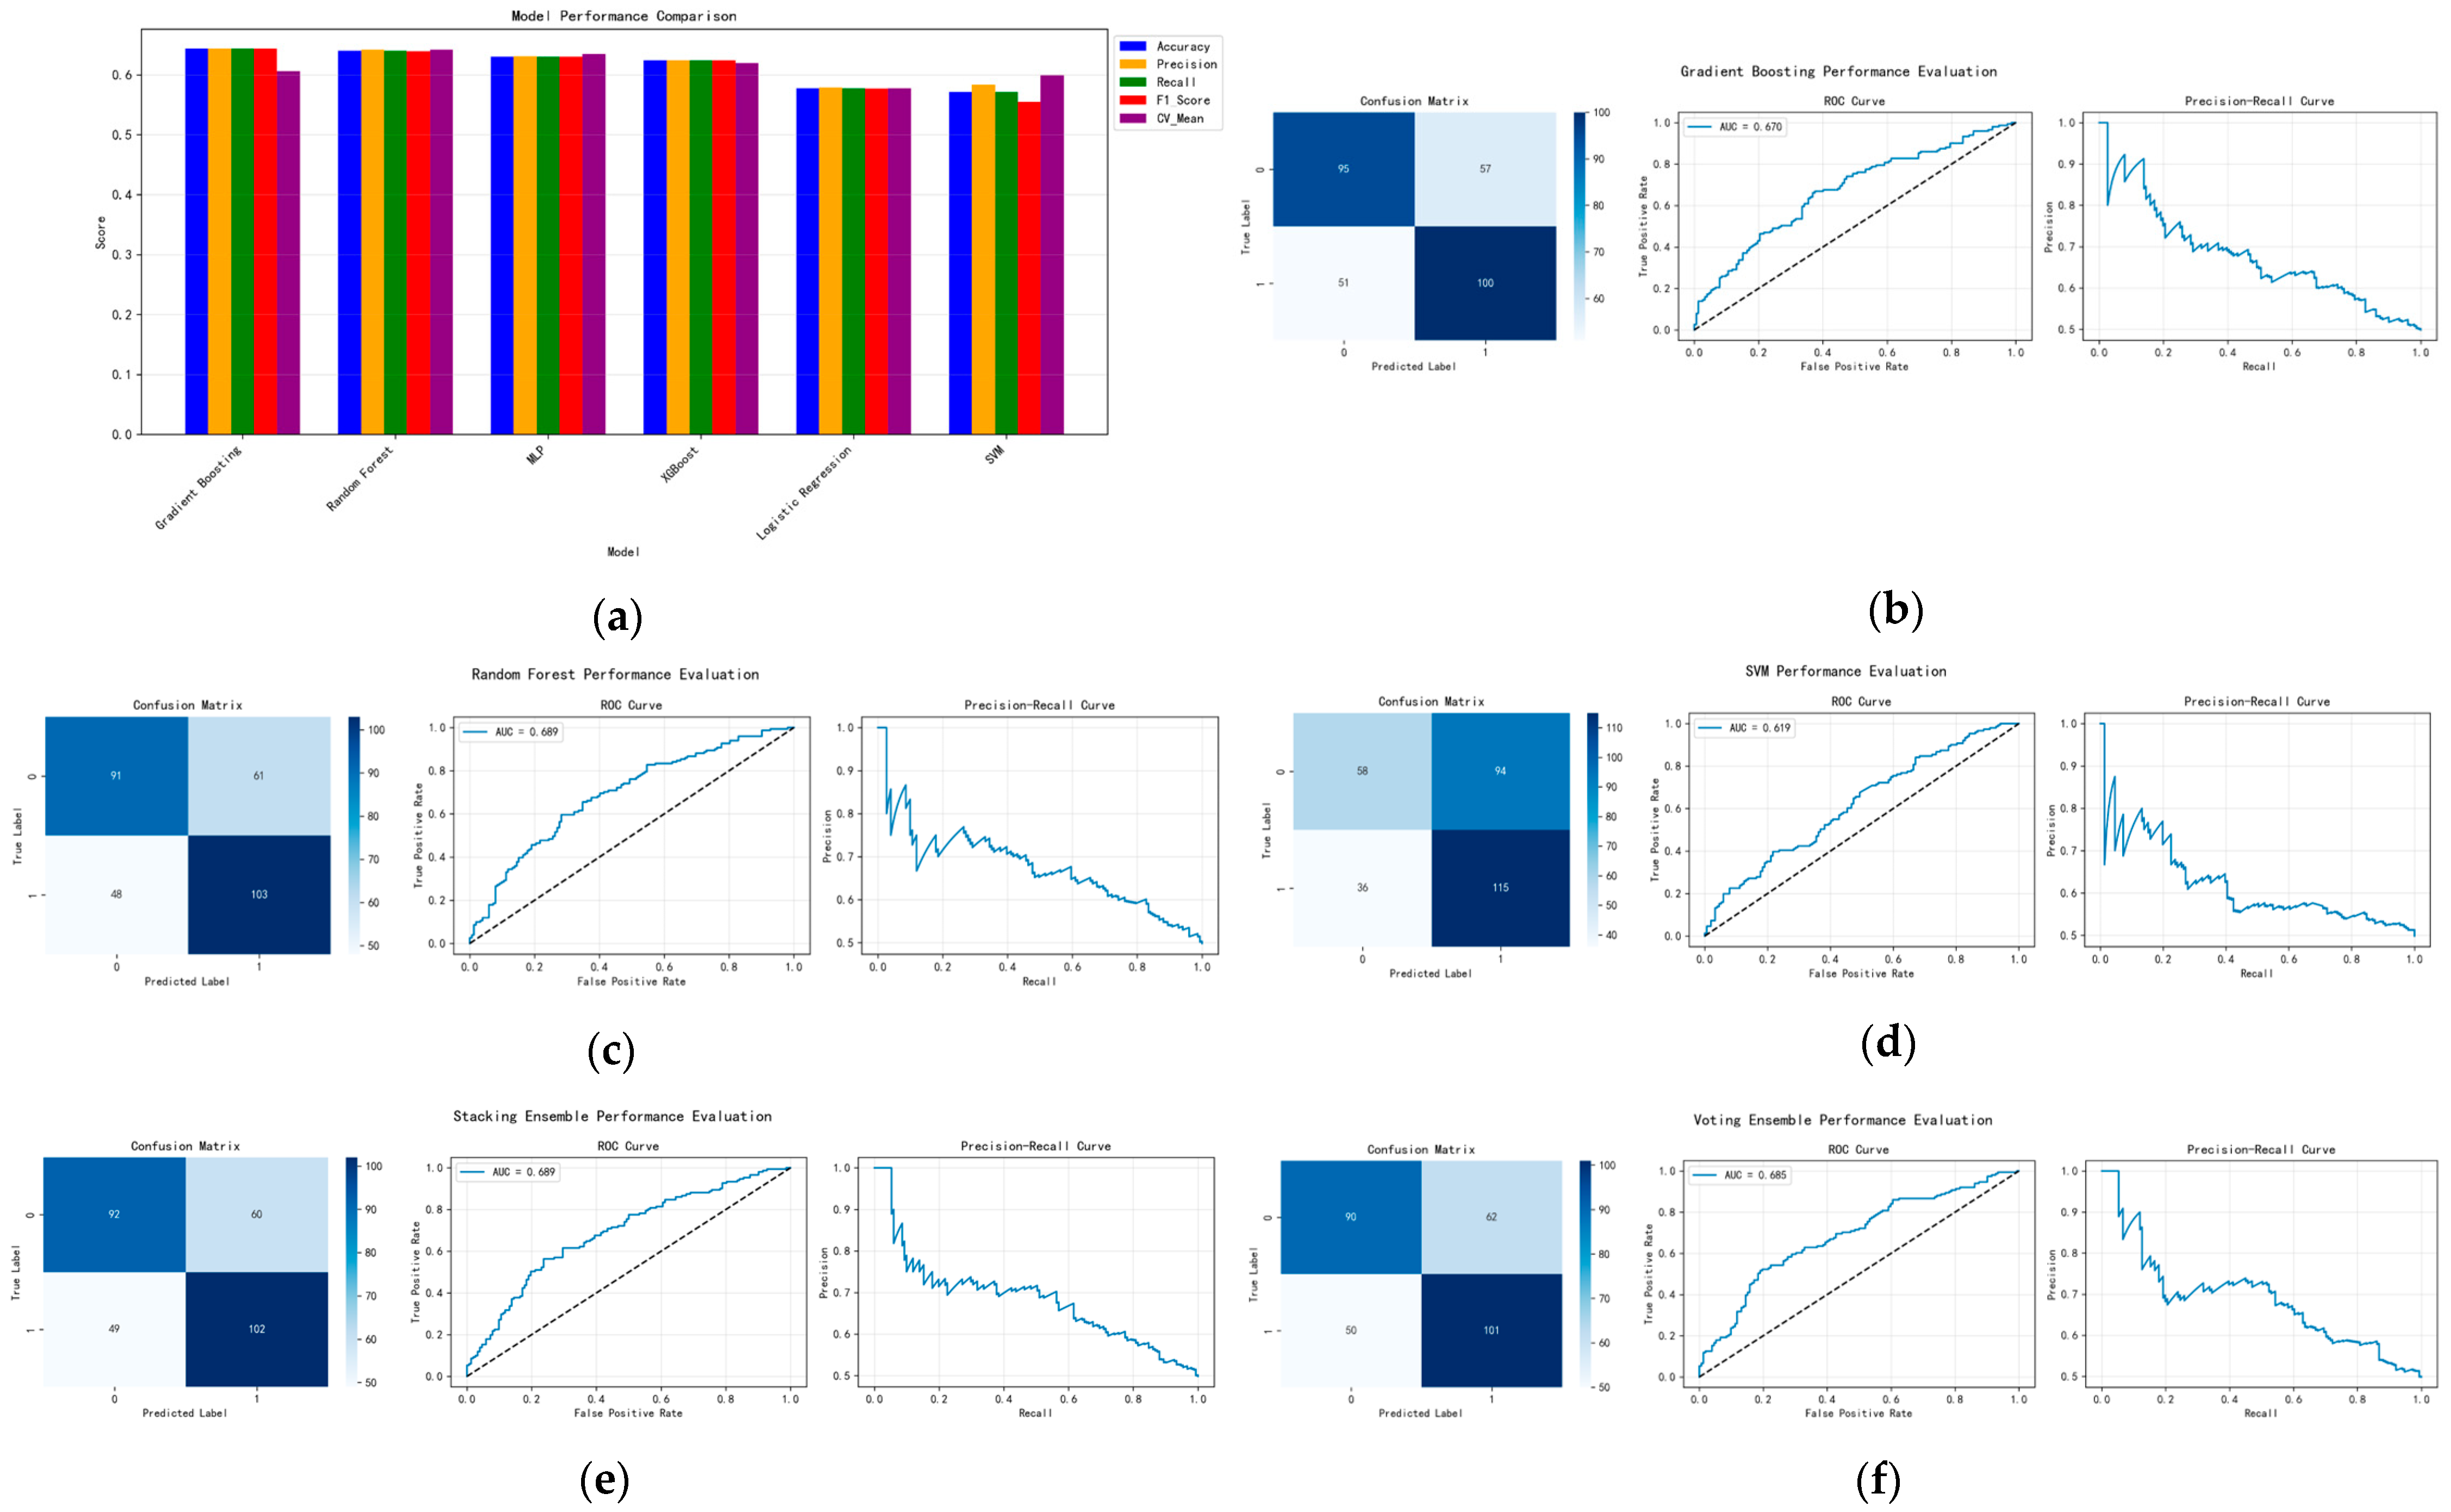
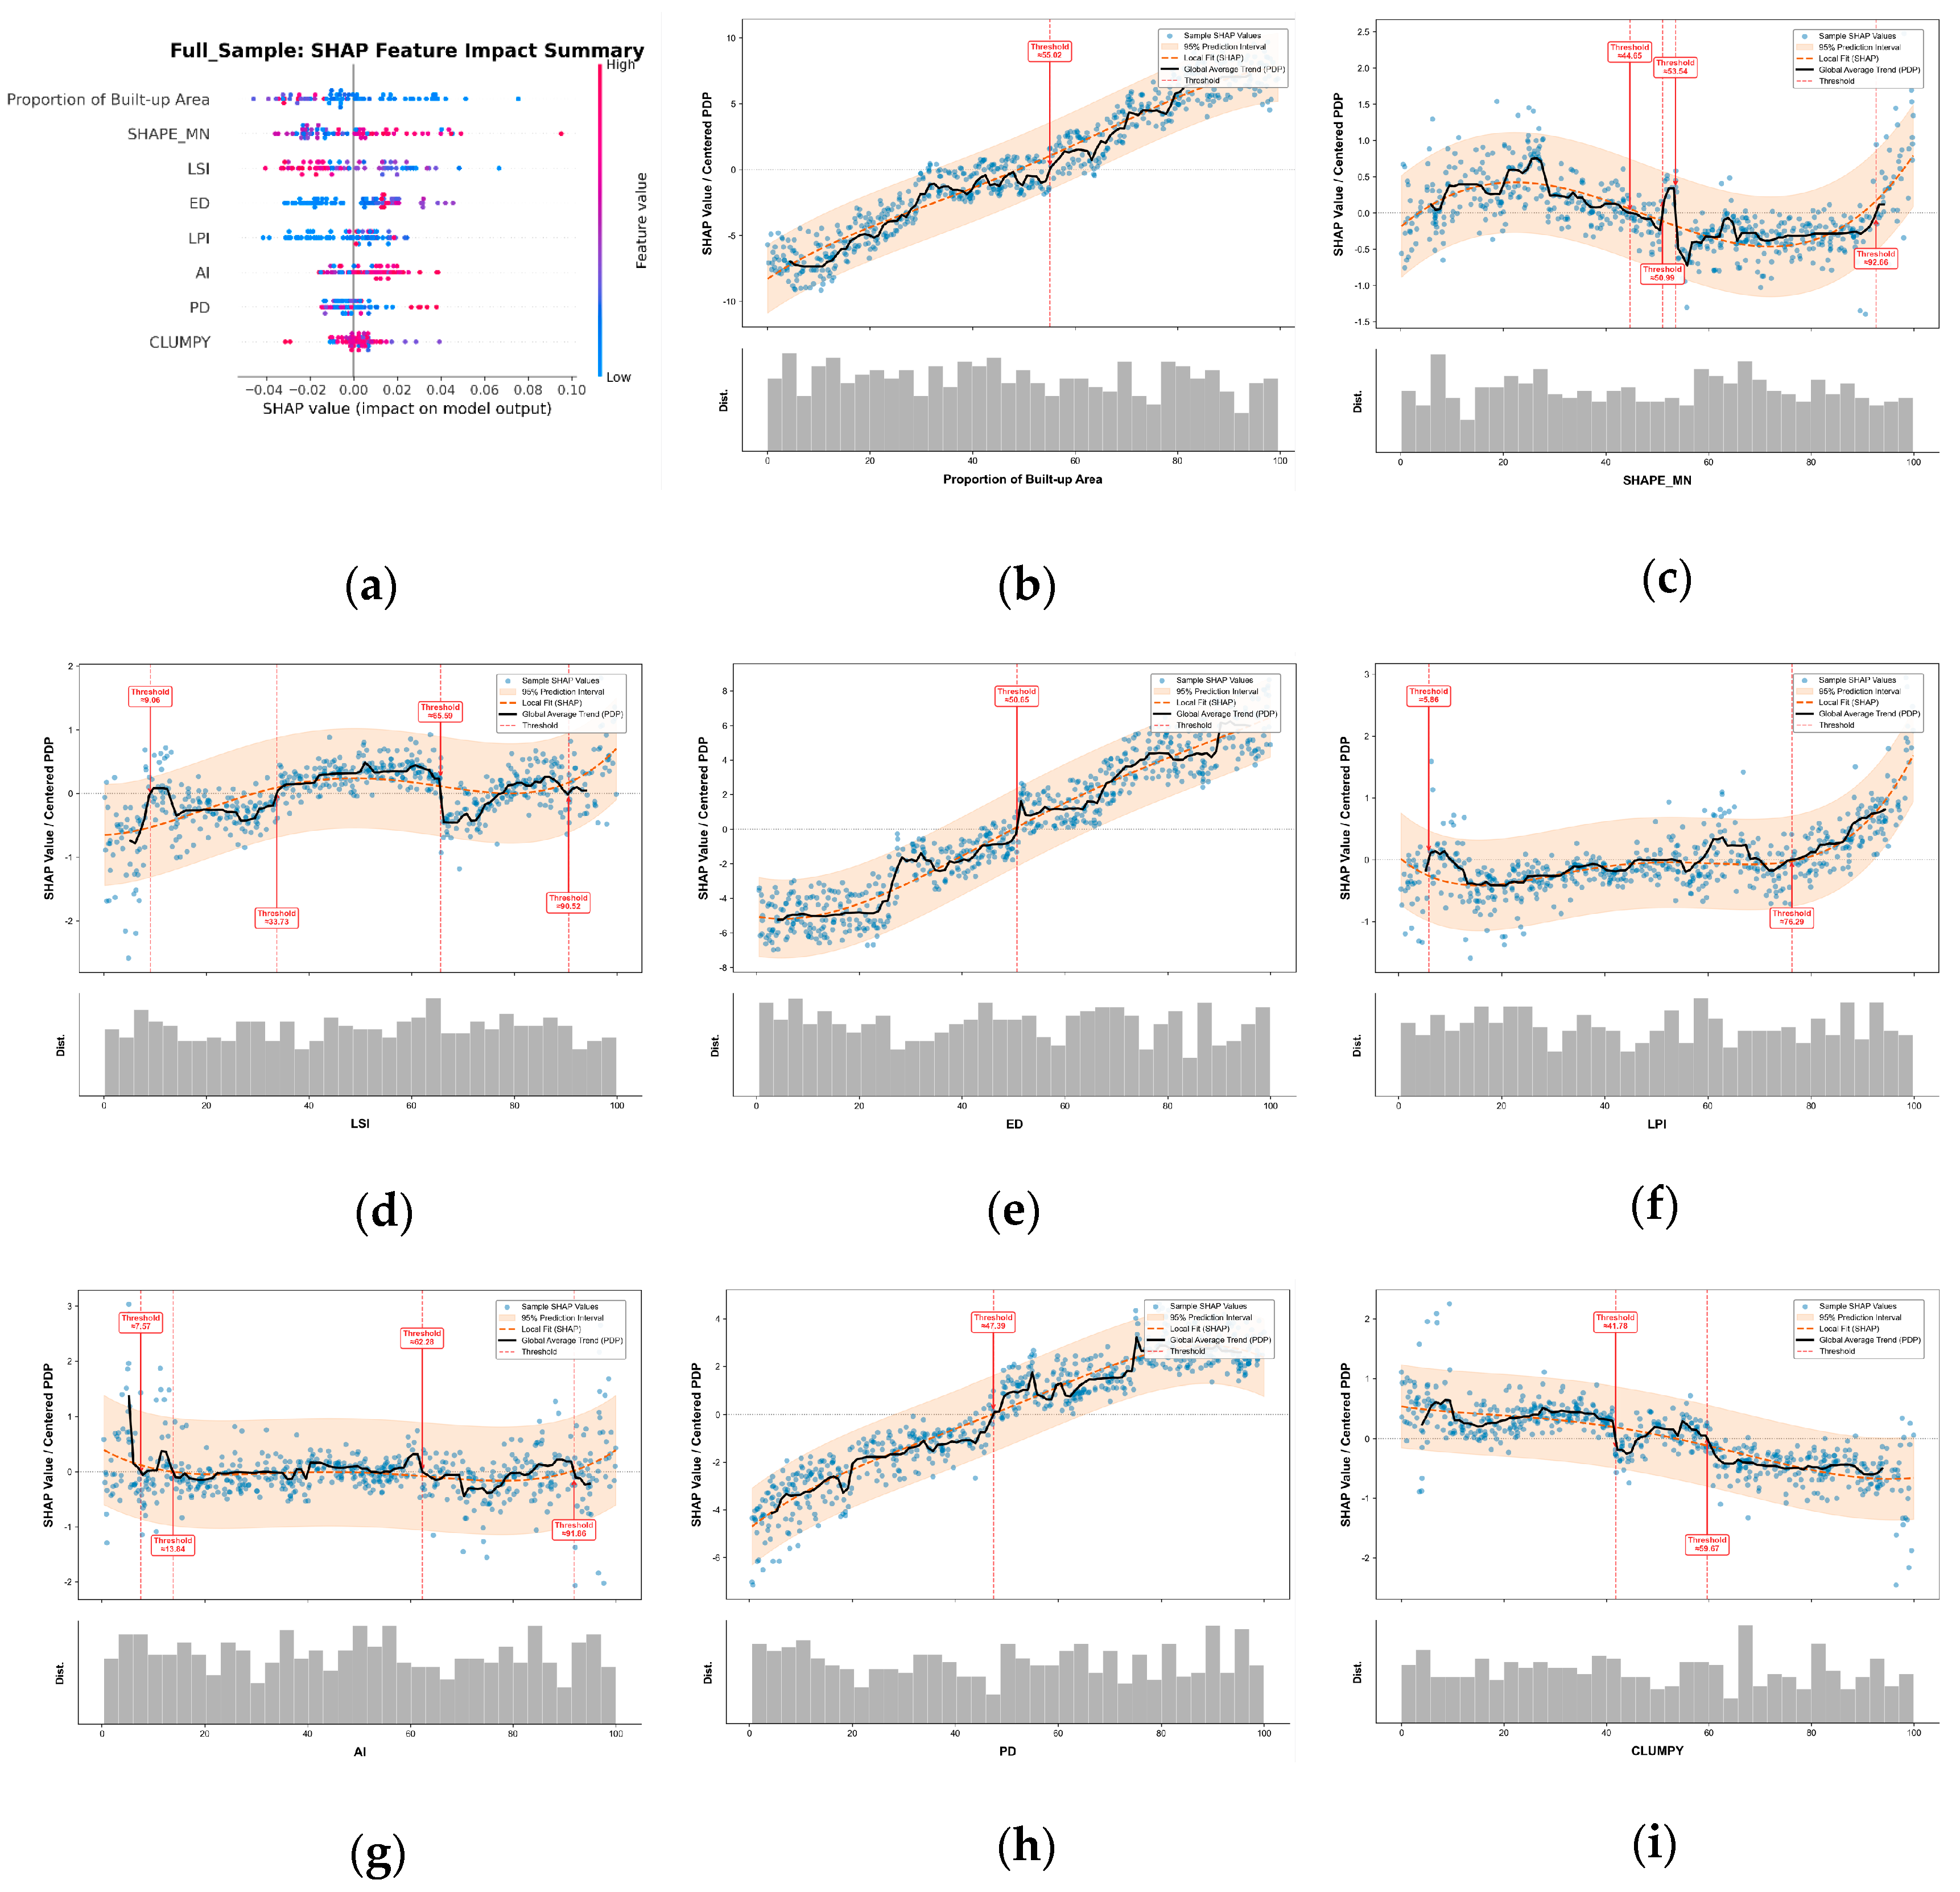
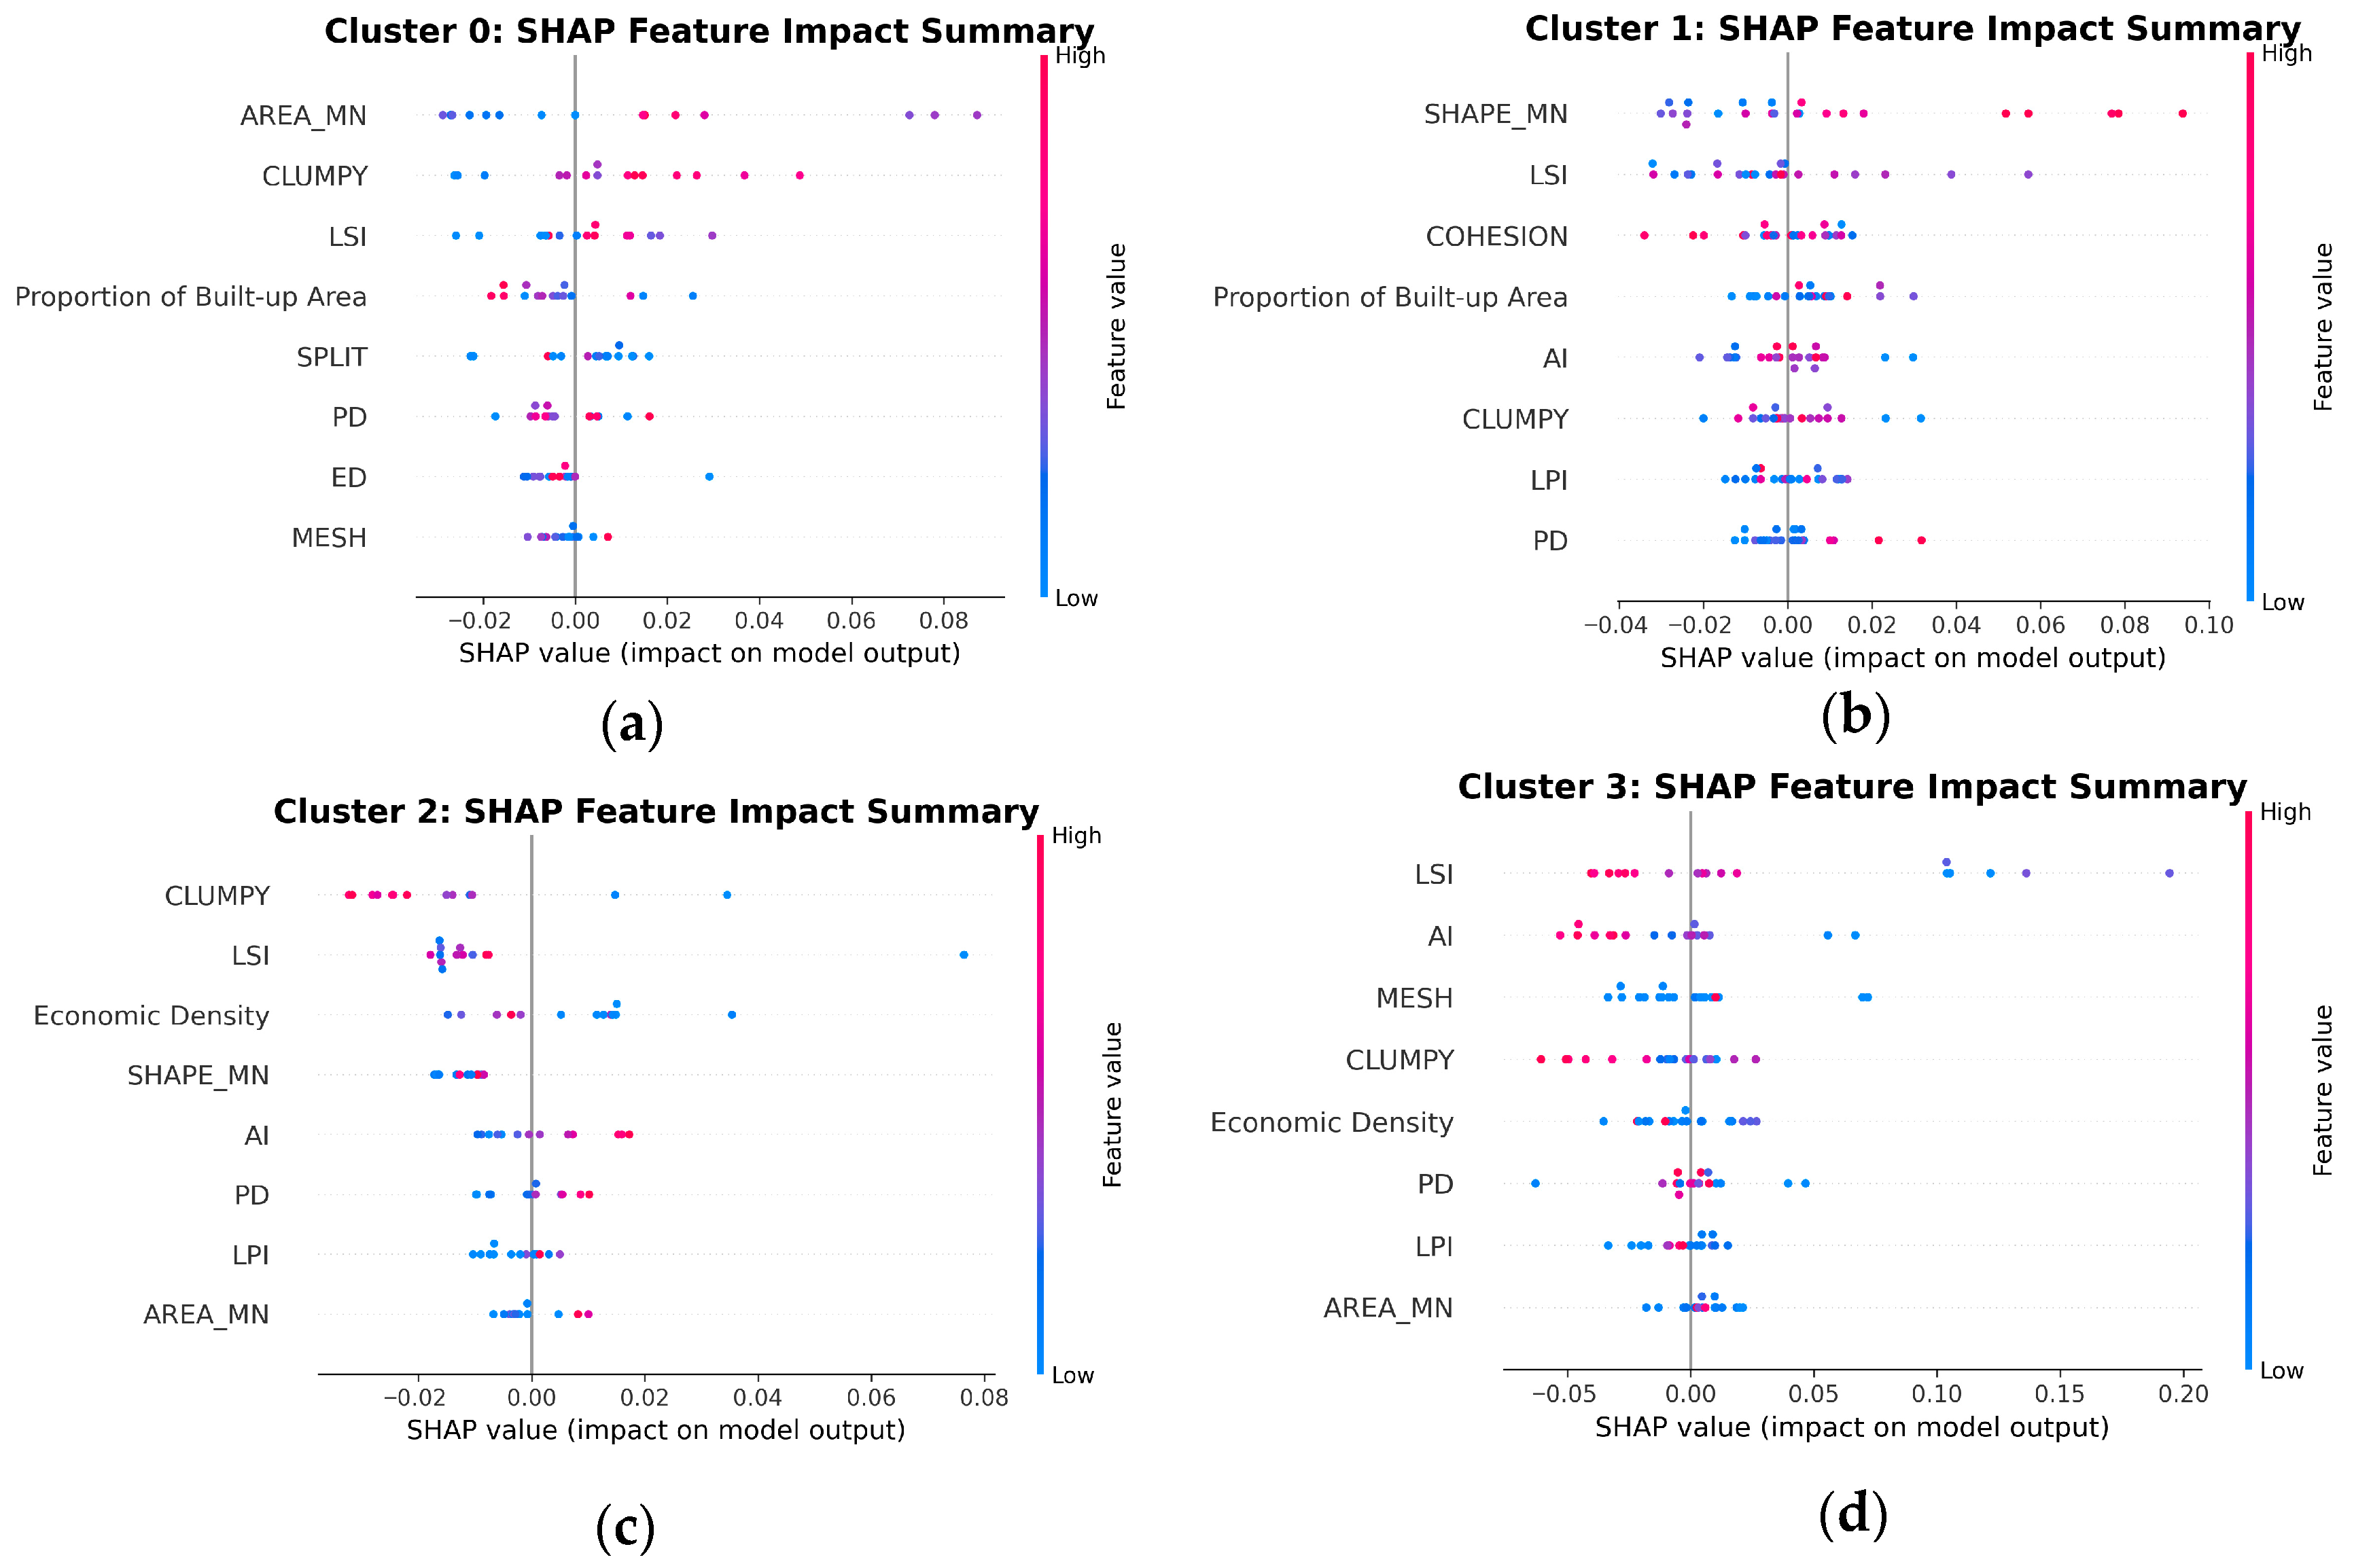
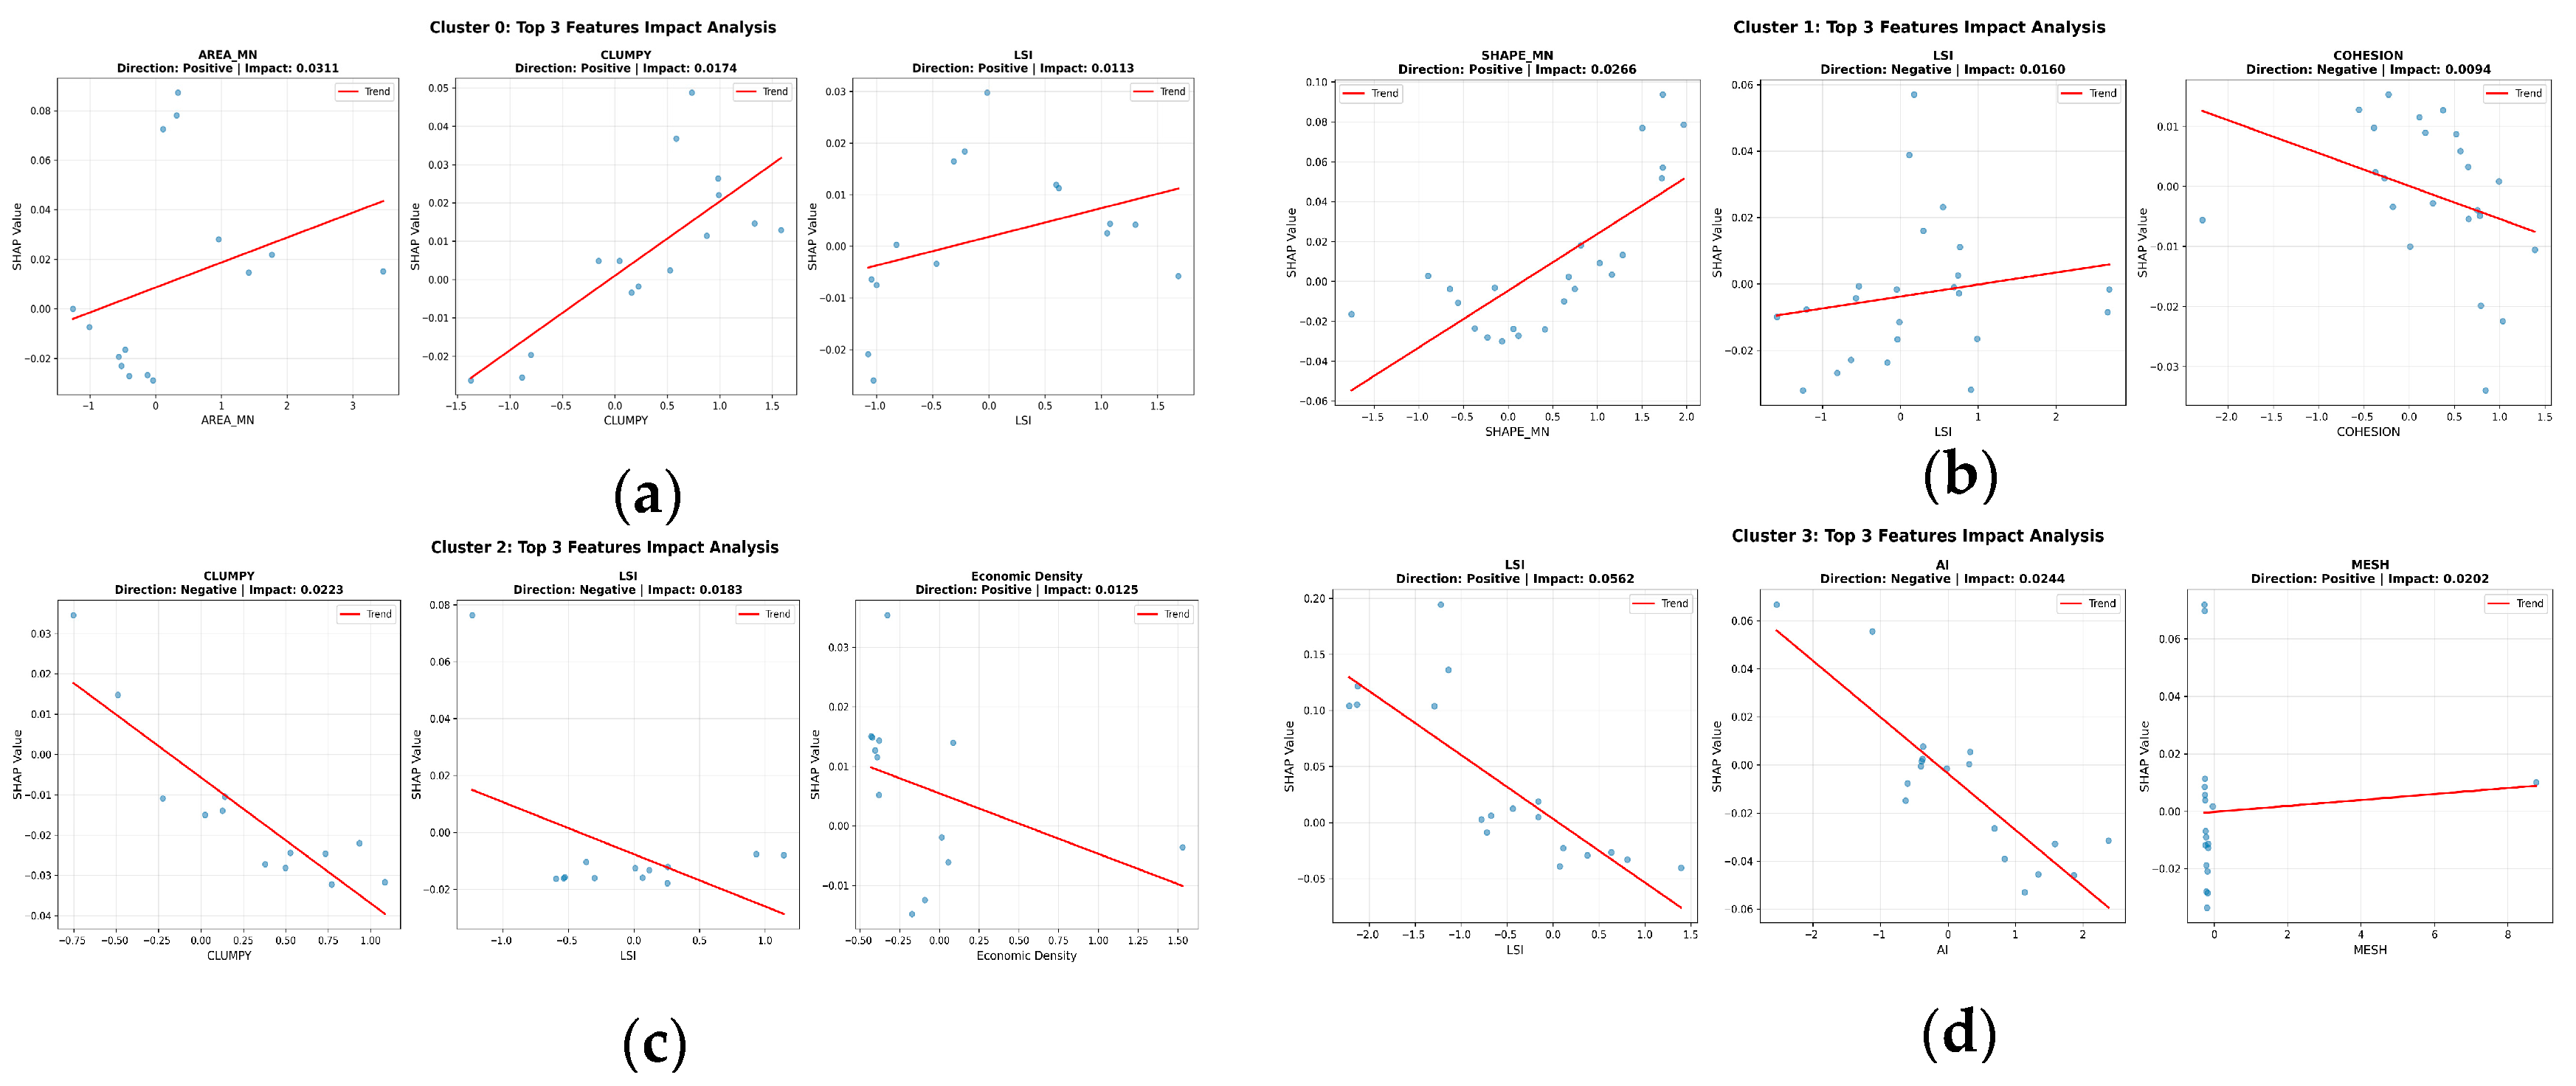
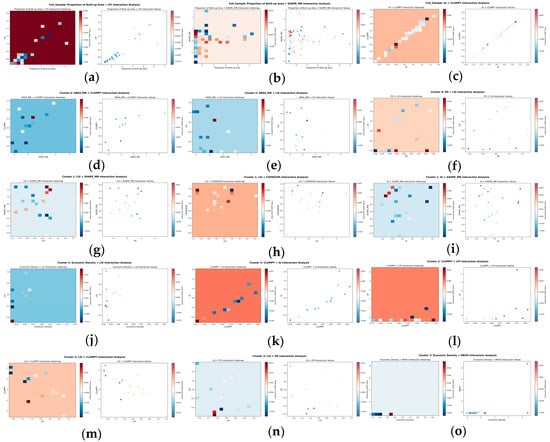
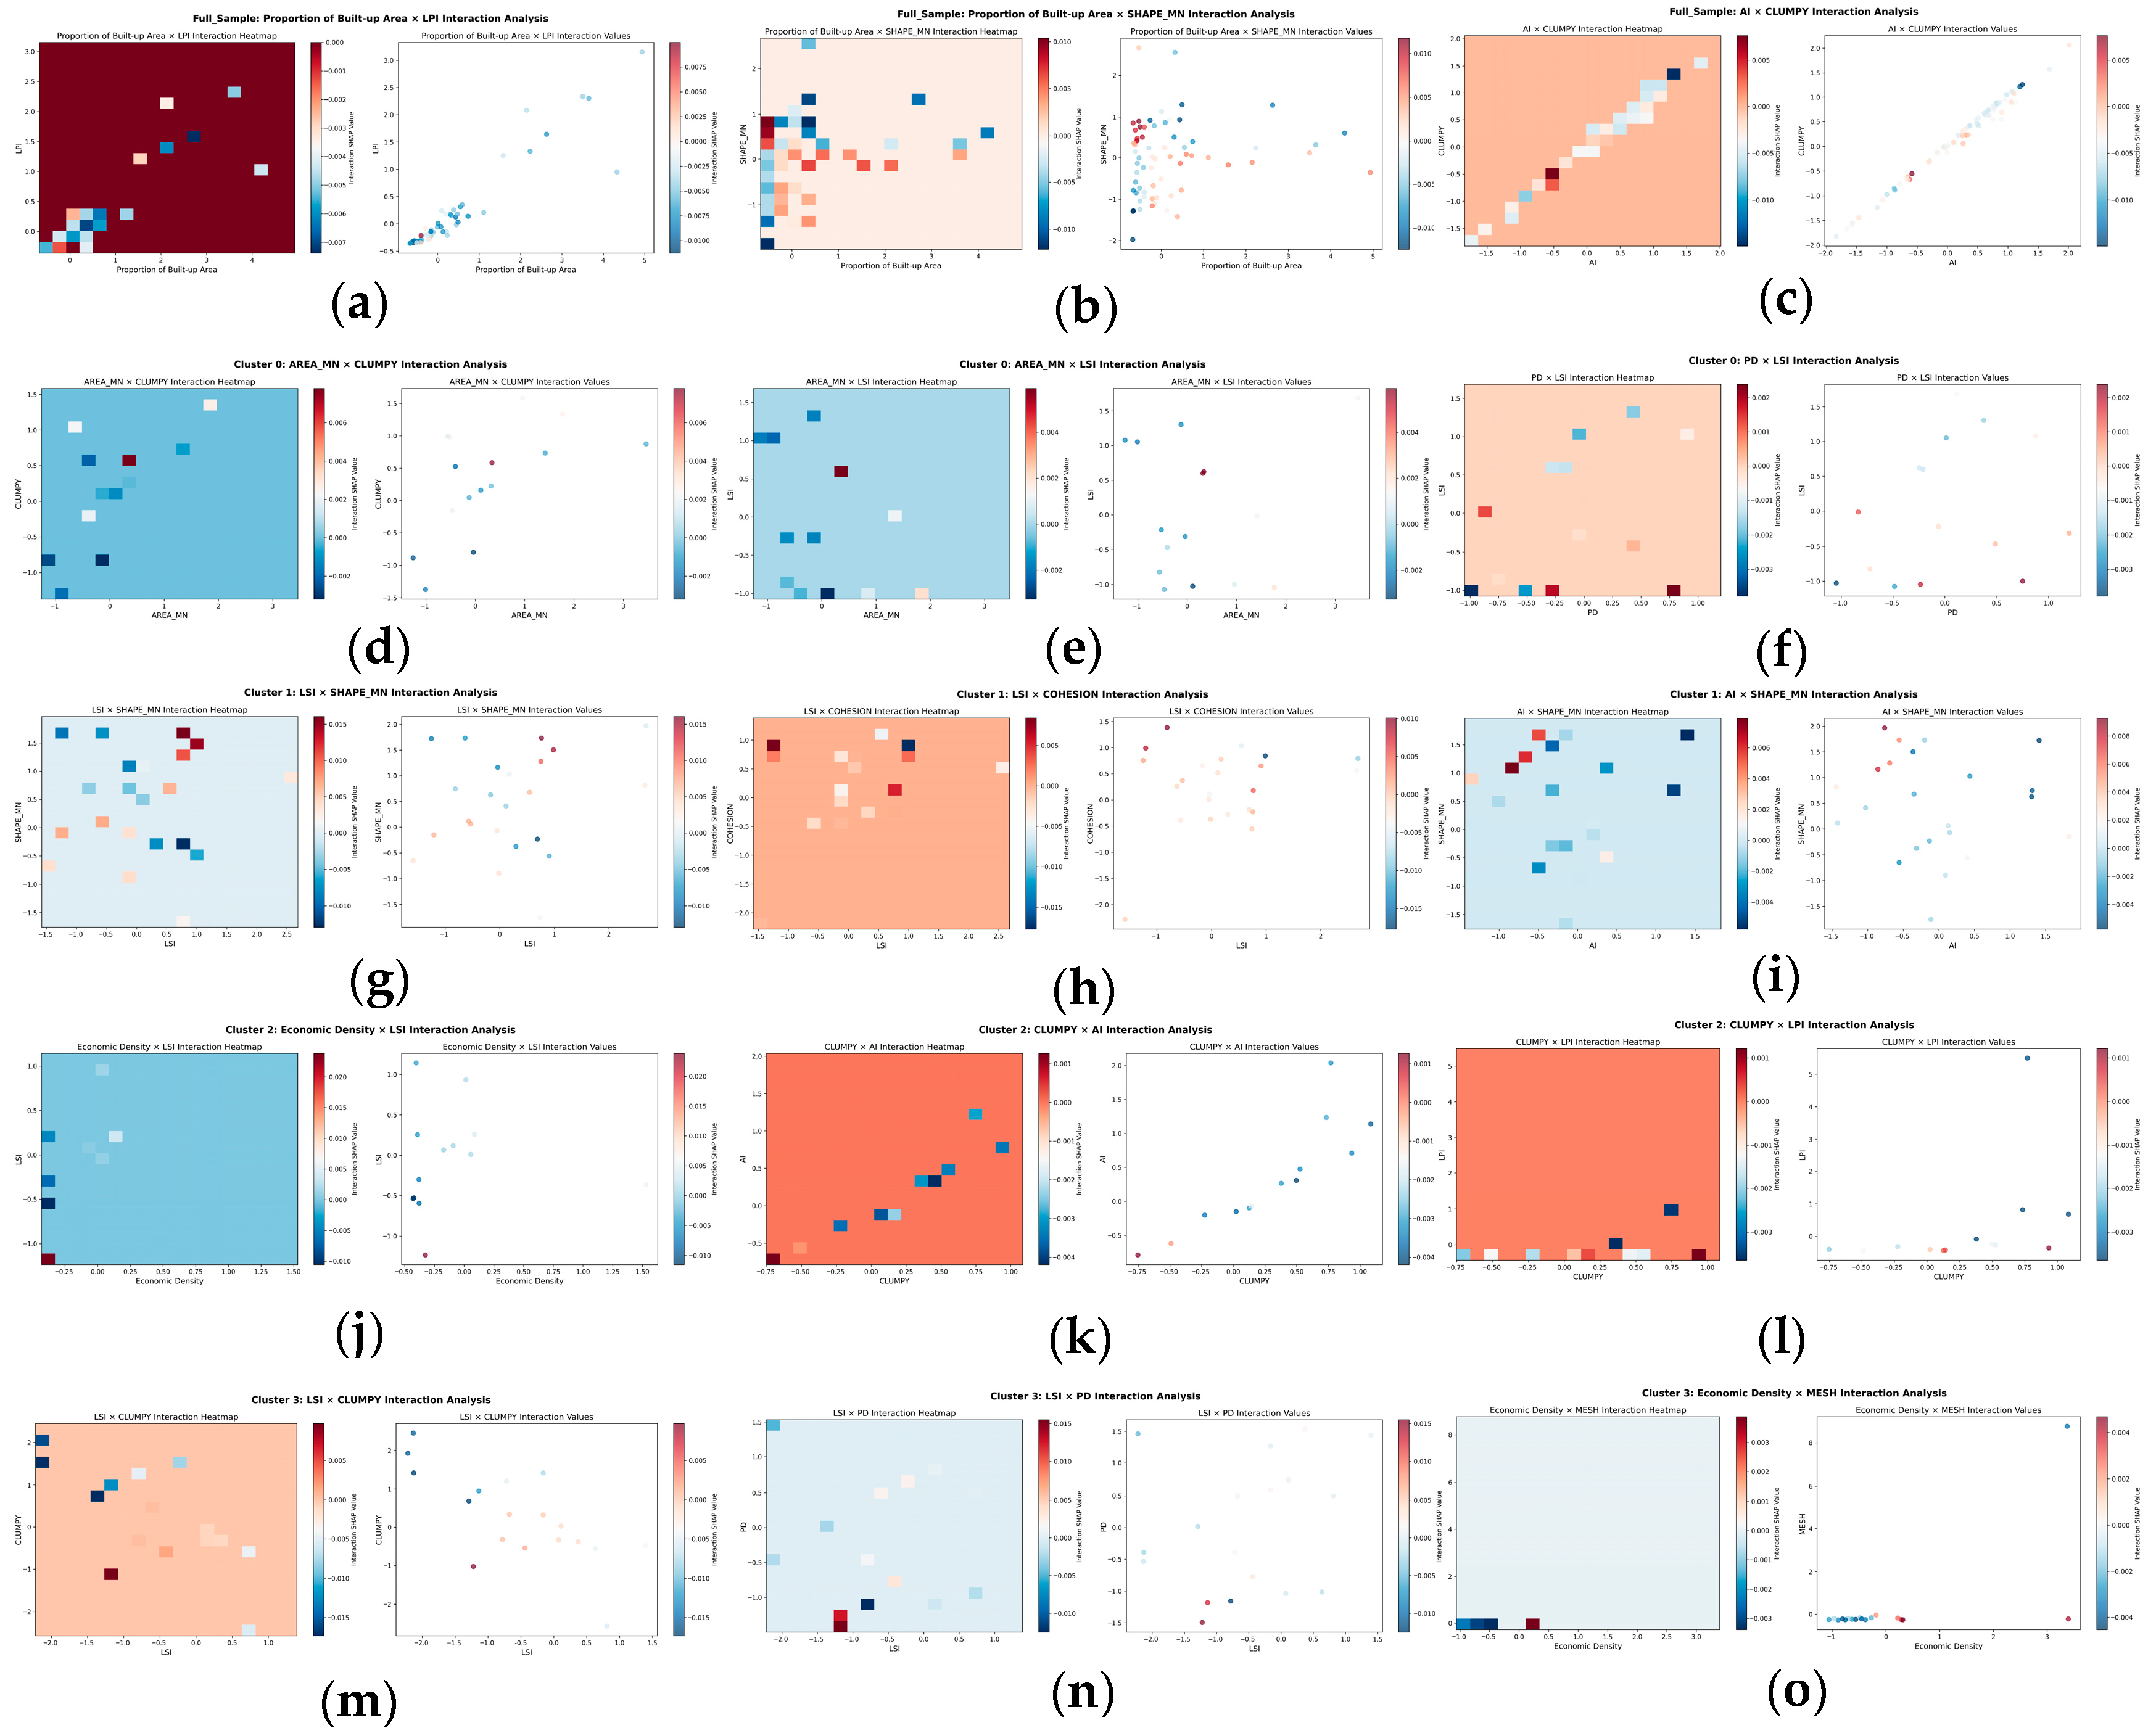

Disclaimer/Publisher’s Note: The statements, opinions and data contained in all publications are solely those of the individual author(s) and contributor(s) and not of MDPI and/or the editor(s). MDPI and/or the editor(s) disclaim responsibility for any injury to people or property resulting from any ideas, methods, instructions or products referred to in the content. |
© 2026 by the authors. Licensee MDPI, Basel, Switzerland. This article is an open access article distributed under the terms and conditions of the Creative Commons Attribution (CC BY) license.