Article

From Innovation to Resilience: How Digital Technology Boosts the Risk Resistance Capability of Cities

School of Economics, Lanzhou University, Lanzhou 730000, China
*
Author to whom correspondence should be addressed.
Land 2026, 15(4), 679; https://doi.org/10.3390/land15040679
Submission received: 18 March 2026 / Revised: 15 April 2026 / Accepted: 17 April 2026 / Published: 20 April 2026

Abstract

As a transformative techno-economic paradigm shift in the digital economy, digital technology innovation (DTI) has profoundly reshaped urban socio-economic systems. Using panel data of 264 Chinese cities from 2005 to 2020, this research empirically examined DTI’s impact on urban economic resilience (UER) and its underlying mechanisms. Results show that DTI significantly boosts UER, with heterogeneous effects related to city size, emerging industry development, R&D investment, and public attention. Mechanism analysis revealed that DTI enhances UER indirectly by promoting the development of new-type infrastructure, advancing industrial structure upgrading, and fostering the agglomeration of scientific and technological talents. Spatial analysis showed significantly positive direct effects yet negative indirect spillover effects driven by the siphoning of digital resources. These findings offer practical implications for strengthening UER and achieving high-quality economic development.

1. Introduction

Natural disasters such as geological disasters and heavy rainstorms, as well as public safety incidents, have occurred frequently in recent years. Macroeconomic development has been disturbed and impacted by many external uncertainties [1,2]. Moreover, the COVID-19 pandemic even affected almost all countries worldwide for economic and social development activities. Cities, while bearing the core responsibility of resisting external risks, have also become the primary points of impact in this international public health emergency due to their high population density and intensive economic activities [3,4]. As an emerging development concept, resilience emphasizes the resistance, recovery, and adaptability of urban economies when confronted with external shocks [5], directly responding to the demands of the current urban development stage. Accordingly, how to enhance resilience amid complex external shocks and promote sustainable urban development has become a key concern for countries worldwide [6,7]. China has undergone the largest and fastest urbanization process in the history of the world, and the Chinese government fully recognizes the importance and necessity of resilience in the healthy development of cities [8]. For the first time, the Chinese government proposed to build resilient cities through the national plan in 2020, and this task was once again emphasized as a key priority during the central city working conference in July 2025. This is of great importance to risk-susceptible China, as strong resilient cities can promote coordinated economic, social, and environmental development and lay a solid foundation for sustainable development [9].
It is widely recognized that industrial structure is one of the central driving factors of UER [10,11], while infrastructure [1,12] and labor force [13] also play important roles. However, as a systematic project, the construction of resilient cities solely by expanding traditional physical inputs leads to delays and may even heighten the sensitivity and vulnerability of urban economies to external emergencies [2]. Since the 21st century, the digital revolution has transformed the pattern of urban economic development, with digitalization and intelligent transformation emerging as major drivers of social progress and economic growth. Digital technology applications have significantly improved resource allocation and operational efficiency [14], enabling cities to adapt to a changing economic environment by enhancing their early warning, emergency response, recovery, and adaptive learning capacities [15]. Various digital scenarios such as e-commerce, remote working, and online learning have helped cushion against external shocks and accelerate economic recovery. From the perspective of the digital economy’s actual development, China, with its unique institutional advantages ranks among the world’s forefront in digital economy [16,17]. In 2023, China’s digital economy reached 53.9 trillion, accounting for 42.8% of GDP. China also accounted for 61% of the 45,000 newly published generative artificial intelligence patents worldwide in 2024 [16,18]. As such, China has emerged as the country with the greatest potential for current DTI. Thus, exploring the mechanism through which DTI enhances UER, especially in Chinese cases, helps strengthen coordination among urban subsystems and further promotes resilient city development.
While the relationship between DTI and urban economic growth has been extensively examined under stable economic conditions [19,20,21,22], research gaps remain in the literature on UER. To date, the academic community has not yet developed a comprehensive analytical framework for UER. Existing research has mostly focused on the role of traditional urban economic factors in shaping resilience, while paying little attention to new drivers for UER in the digital era. Furthermore, few scholars have adopted empirical methods to demonstrate the impact of DTI on UER or have systematically analyzed the mechanisms by which DTI empowers UER improvement. Clearly, significant room remains for further research on UER, particularly regarding how to leverage the transformative potential of DTI to effectively boost UER.
Against the above research gaps, this study makes three key contributions to the existing literature: (1) Drawing on classical economic theories including the techno-economic paradigm and Schumpeter’s theory of creative destruction, this research explored how DTI contributes to the improvement of UER. In doing so, it not only broadens the scope of research on the determinants of urban economic resilience but also provides empirical support for the theoretical proposition that technological innovation enhances UER. (2) Since the mechanism through which DTI affects UER remains unexplored and untested, this research innovatively examined the unique role of new-type infrastructure as an essential carrier for digital transformation in enhancing urban economies’ capacity to withstand diverse risks and challenges while mitigating potential economic losses. In addition, the theory of industrial structure evolution and human capital are combined to further explain how DTI impacts UER. This enriches the research framework of technological innovation and UER, providing insights for cities to leverage digital transformation for high-quality growth while facing prolonged uncertainties. (3) The difficulty in measuring DTI may account for the lack of empirical research, which is primarily due to the absence of unified measurement standards for DTI, resulting in either under-identification or over-identification. By referring to the official documents issued by the Chinese government and adopting standardized IPC codes, this research successfully distinguished digital technological innovations from non-digital ones. The identification method developed for DTI activities also facilitates subsequent research.
The remainder of this study is structured as follows: Section 2 conducts a systematic literature review and proposes theoretical hypotheses. Section 3 specifies the model design and explains the data collection. Section 4 presents the empirical results, robustness checks, and heterogeneous effects, along with a mechanism analysis. Section 4 presents the study’s results and discussion.

2. Literature Review and Theoretical Hypothesis

2.1. Literature Review

The concept of resilience was incorporated into ecological theory by Holling [23] first in the 1970s, who characterized resilience as the post-disturbance recovery capacity of ecosystems toward equilibrium. Economic resilience is an important application of resilience theory in the socio-economic field. Reggiani [24] introduced “resilience” into the field of spatial economics in 2002, arguing that resilience is a key theme in studying how economic systems respond to shocks and disturbances.
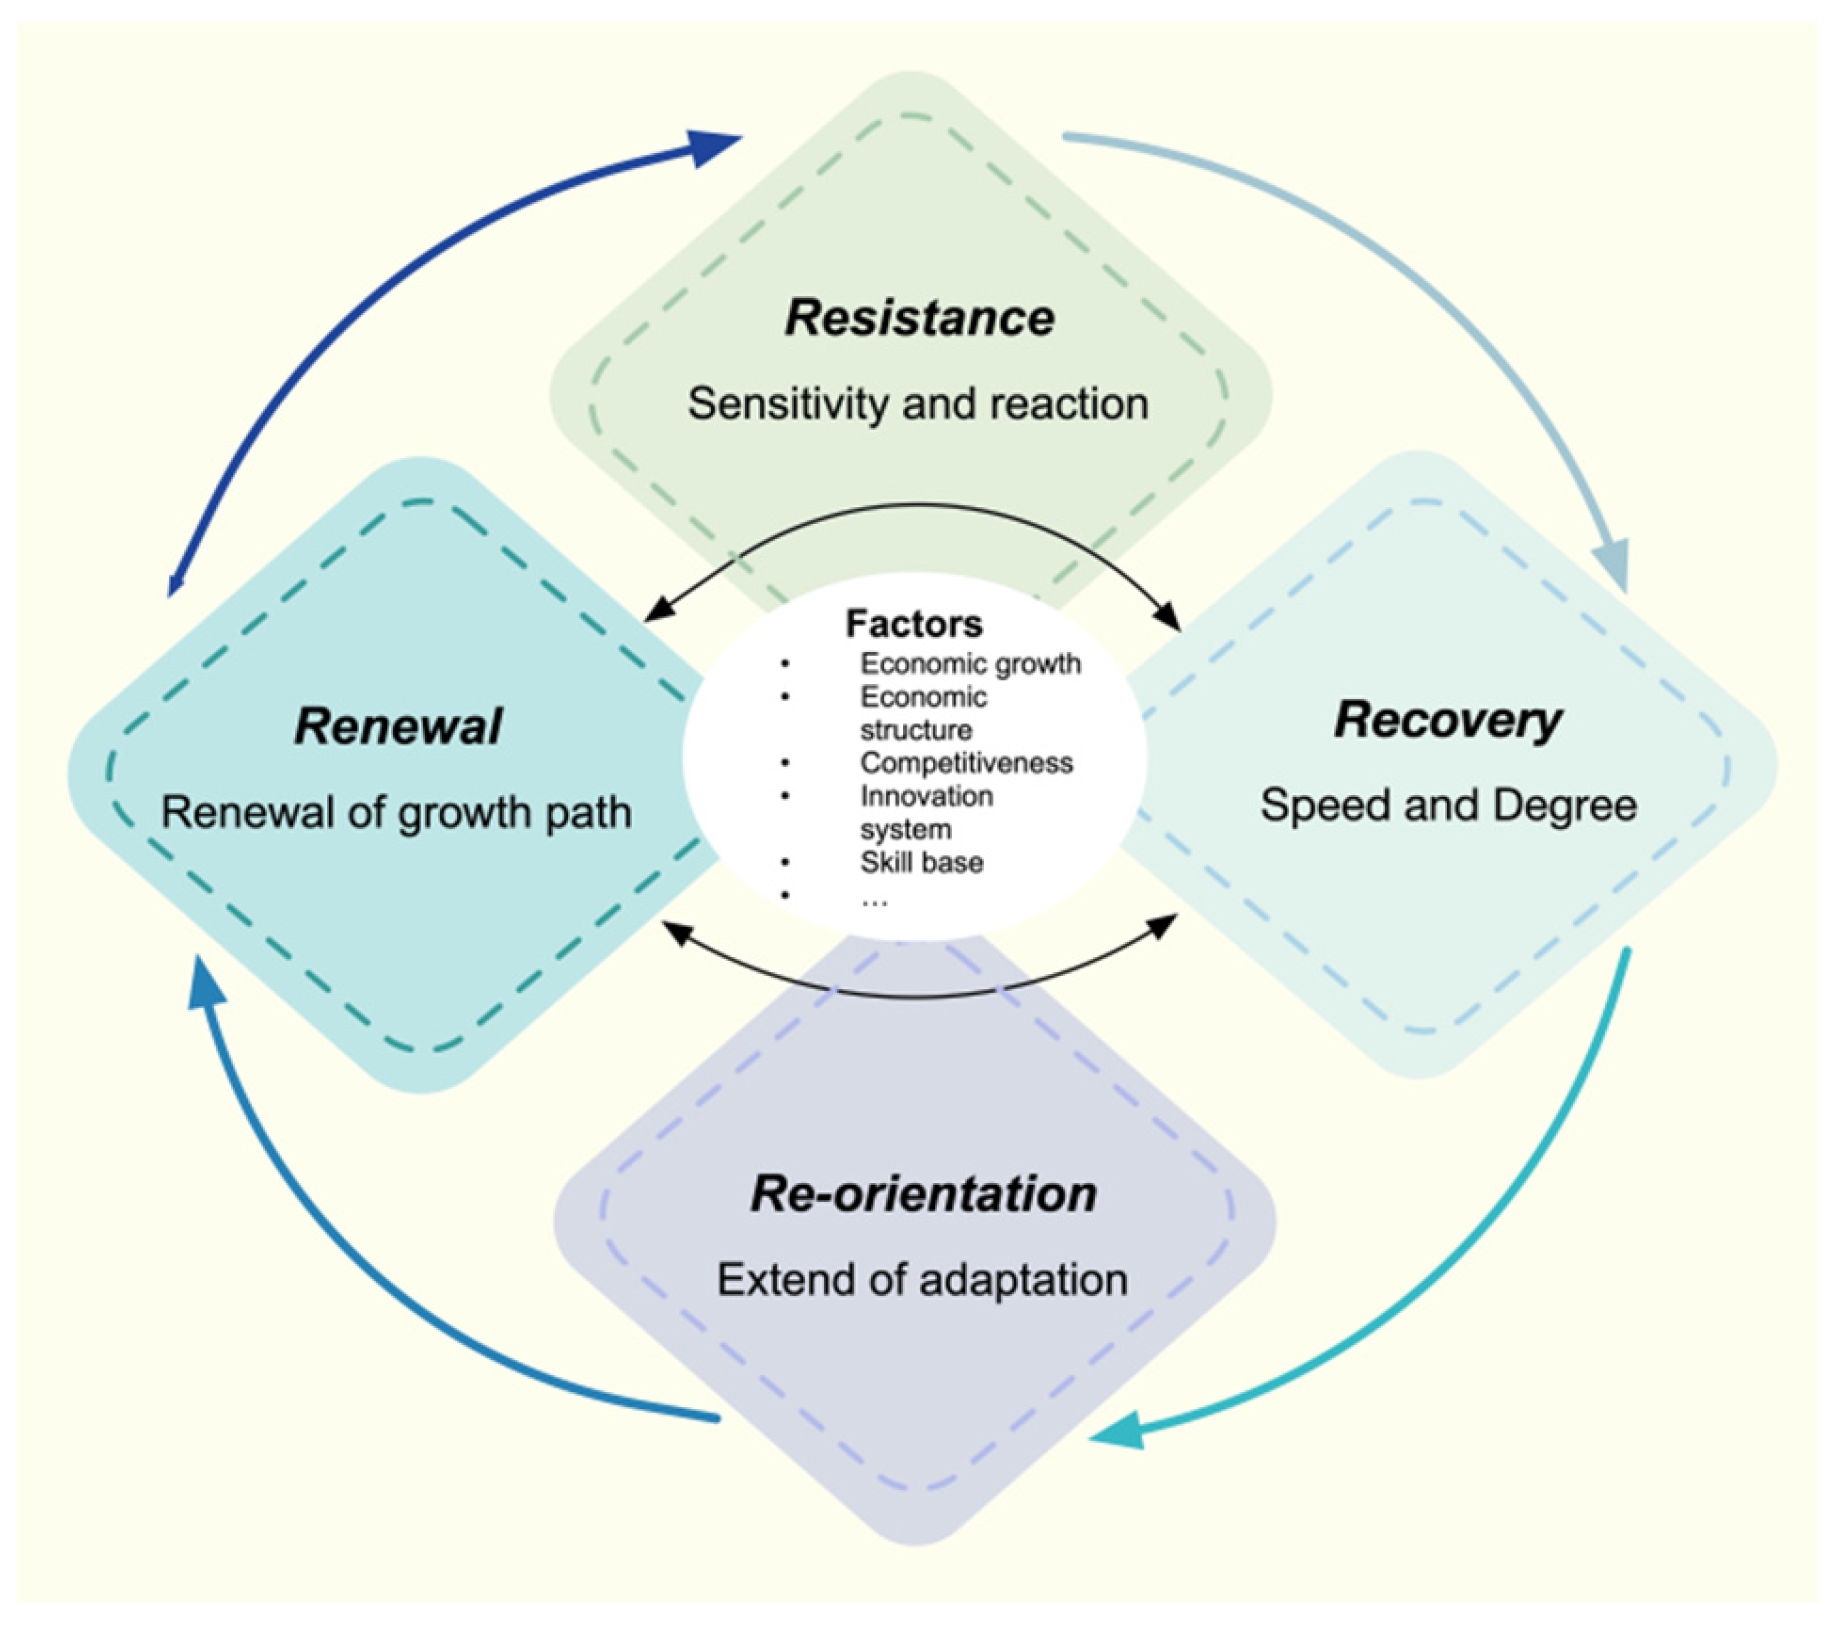
Unlike the traditional focus on simple recovery, economic resilience is described in terms of evolutionary resilience, defining the capacity of economic systems to dynamically adapt and recover from shocks in contemporary studies [25]. As Simmie and Martin [26] emphasized, adaptation and reformation are the foundation of economic resilience. Under a theoretical framework of complex adaptive systems, Martin and Sunley [27] stated that economic resilience is a continuous process involving resistance, recovery, re-orientation, and renewal [3,28]. This is also one of the most representative views [9] (Figure 1). Resistance denotes the capacity to withstand a recessionary shock, reflecting an economy’s sensitivity level or the intensity of that economy’s reactive response to disturbances. The speed and degree of an economy’s return to pre-recession conditions from the recent shocks constitute the concept of recovery. Re-orientation is defined as the capacity of an economy to reallocate resources and restructure its operational framework to align with new external environmental demands. Renewal represents the capacity of an economy to renew its growth path, exactly returning to the pre-recession growth path or even making a hysteretic shift to a new growth trend [25]. Specifically, urban economic resilience represents the capacity of a city’s economy to absorb, resist, and recover from risks [29].
Economic resilience has become a tool for studying economic recovery and sustainable development and is sought after by scholars [30]. The literature related to economic resilience has also gradually developed from qualitative research to quantitative research. In terms of qualitative research, it concerns mainly the case study of post-crisis urban resilience, using questionnaires and interviews [8,31,32]. Regarding quantitative research, studies primarily focus on evaluating the degree of economic resilience in a specific region and exploring its influencing factors [3,9,11,12]. Based on evaluation results, scholars began to study the spatial differentiation of UER while focusing on capturing the driving force behind the formation of this characteristic. In general, factors influencing the resilience of urban economies include industrial structure [10,11,33], human capital [13], infrastructure [12,34,35], institutional environment [36], knowledge networks [37], and so on.
Yoo [38] defined DTI as an innovation process integrating digital and physical components, leading to new products, services, and business models, with characteristics including combinability, self-growth [39], and convergence. Within the economics scope, Hund [40] emphasized that DTI is the process of improving or creating new, borderless and value-added products, services, and processes or business models through the integration of digital technologies. With the development of the digital economy [9], digital technology has profoundly transformed urban production, livelihood, and governance modes, and the economic effects of DTI have attracted widespread attention. Digital technology not only promotes microenterprise business model innovation [41] but also drives the continuous emergence of new technologies, products, and services [42]. Traditional industries are also upgrading and transforming with the support of DTI [11,43]. DTI also exerts a positive effect on urban economic development, such as in the circular economy [19], the digital economy [20,21], and high-quality economic development [22]. In addition, existing studies have combined digital technologies with different types of resilience, analyzing the impact of DTI on climate resilience [44], supply chain resilience [45], and business resilience. While digital technology application has redefined basic innovation processes, it has also blurred and diminished the importance of industrial, organizational, and product boundaries [46], making it difficult to define DTI’s scope. Existing studies on the measurement of DTI focus on patent text analysis [41] and survey data [42], which are prone to subjective errors in innovation identification [47].
Currently, research on the impact of DTI on UER is relatively limited, with most studies focusing on its micro-level effects on enterprises. Mainstream views suggest that DTI exerts a positive influence on UER. In the era of Industry 4.0, micro-enterprises can enhance resilience by adopting digital technologies to become more open and to transition to sustainable manufacturing. Mossberger [48] also found that digitally enabled small- and micro-enterprises played a key role in local economic recovery during the COVID-19 pandemic. From the macro perspective of industry and urban development, DTI can help reconstruct global value chains. Cities with more advanced digital technology are more likely to attract high-end producer service firms and strengthen their competitive advantages, thereby enhancing their economic recovery capacity in uncertain environments [43,49]. The application of digital technologies such as big data has also improved government efficiency in public services provision, supervision, and governance, mitigating the accumulation of systemic risks [31,50]. Several studies have also explored how the inherent features of digital technologies strengthen resilience. Countries with higher levels of information and communications technology suffer less from economic crisis shocks [12]. This may be because the integration of data factors during digital technology iteration and application generates a multiplier effect on economic growth [51]. In terms of human resource allocation, digitalization serves as an important way for talent agglomeration [52]. The fusion of scientific and technological talents can enhance R&D efficiency, increase capital accumulation for urban economic development, and help cities explore new pathways to enhance economic resilience.
While existing studies have documented the positive impacts of DTI on resilience across different agents, research focusing on UER remains relatively lacking, especially in empirical investigations into its multi-channel transmission mechanisms within the urban context. Thus, this study draws on Chinese government documents and IPC patent data to precisely identify DTI and to analyze its macro-level impact on UER, thereby providing new empirical insights into urban economic disparities.

2.2. Research Hypotheses

2.2.1. The Impact of DTI on UER

The digital techno-economic paradigm incorporates data as a key factor based on the techno-economic paradigm [53] and highlights the integration of technology and data factors to exert transformative effects on the economy. DTI accelerates the emergence of new economic rules and institutional advantages, thereby improving resource allocation, factor integration, and organizational collaboration to enhance UER [52] and exert profound impacts on social development [50]. Specifically, cities with higher DTI levels enjoy greater organizational efficiency, and some can even anticipate shocks and implement preventive measures in advance. When facing shocks, advanced information communication technology and big data analysis enable the coordination of urban sectors and the establishment of emergency mechanisms. This greatly mitigates persistent economic losses and supports dynamic adjustments across different recovery stages. In contrast to conventional economic entities that rely on past experience to recover from shocks, digital innovation entities not only identify crises in response to shocks but also develop new solutions by integrating existing resources. This means that cities leverage DTI to conduct adaptive adjustments during the post-shock recovery period to enhance economic resilience [54]. DTI also accelerates the digitalization of urban economic activities [55] and resists the pressure of economic downturn through emerging consumption patterns and new business formats. Through multiple pathways such as digital expansion and digital transformation, existing business models have been optimized while new business models continue to emerge. The overall operational efficiency of urban economic systems is improved as production, organization, and business models are upgraded. Thus, the first hypothesis (Hypothesis 1) is proposed as follows.
H1: 
DTI enhances UER.

2.2.2. DTI, New-Type Infrastructure, and UER

According to systems theory, the functional realization of any complex system depends on the dynamic synergy and efficient connection among various elements, rather than the isolated breakthrough of a single element. Systematic integration is required for the value of technologies such as 5G, big data, and AI in DTI to realize their value. Indeed, the new-type infrastructure system serves as an important carrier and platform for supporting the operation of digital city systems [27], enabling DTI to cover the entire process of economic and social operations. As an essential carrier for the integration of the digital economy and the real economy, new-type infrastructure that underpins digital society arises from the public’s direct demand for digital technology applications and the need for traditional infrastructure upgrading. By enabling the interconnection and convergence of technological resources, capital, and data, new-type infrastructure promotes open cross-regional and cross-industry data sharing to a greater extent, thereby establishing a foundational platform for a diversified economic system [56]. In the consumption field, new business formats like e-commerce livestreaming and instant retail, supported by new-type infrastructure, have broken through the spatio–temporal constraints of offline consumption. They have reduced uncertainty in product matching [57] and boosted consumption vitality. Meanwhile, given the attributes of digital technologies in providing accurate security warnings, rapid emergency responses, and strong adaptability, new-type infrastructure enhances the resilience of the economic system against external shocks [34]. Thus, the following Hypothesis 2 is proposed.
H2: 
DTI enhances UER by leading in the construction of new-type infrastructure.

2.2.3. DTI, Industrial Structure, and UER

The integrated allocation of data factors and traditional factors is now the core of resource allocation in the digital age. Through developing the digital industry and transforming traditional industries with digital technologies [16], DTI changes the direction, efficiency, and scope of resource allocation in a region. On this basis, the industrial structure is upgraded, and the urban economic system becomes more resilient to external shocks [11,43]. The essence of developing the digital industry lies in guiding resource agglomeration towards emerging digital industries through DTI, which promotes industrial upgrading by leveraging resource scale and connectivity [58]. With their characteristics of high added value and high growth potential, the market spontaneously directs factors such as capital and high-end talent towards these more efficient digital industrial fields, enhancing urban competitive advantages and improving urban productivity. When external shocks occur, the economic system can quickly resume its functions by relying on the linkage, spillover, and diffusion effects of digital industries [59]. Through breakthrough innovations in digital technology, cities can even quickly create new industrial development paths to adapt to environmental changes, embarking on new growth trajectories [11]. In the meantime, the second pathway reorganizes factors of production and reduces traditional industries’ reliance on resources by leveraging digital technologies. The in-depth integration of digital tools and other advanced technologies with traditional industrial chains promotes industrial structure upgrading. Digital transformation in traditional sectors drives the transition from legacy to innovative growth engines, thus boosting competitiveness and enhancing the economic resilience against external shocks. As the industrial structure is upgraded, the recovery speed of economic operations after external shocks is accelerated [11]. Thus, Hypothesis 3 is proposed as follows.
H3: 
DTI enhances UER by facilitating the upgrading of industrial structures.

2.2.4. DTI, Talent Gathering, and UER

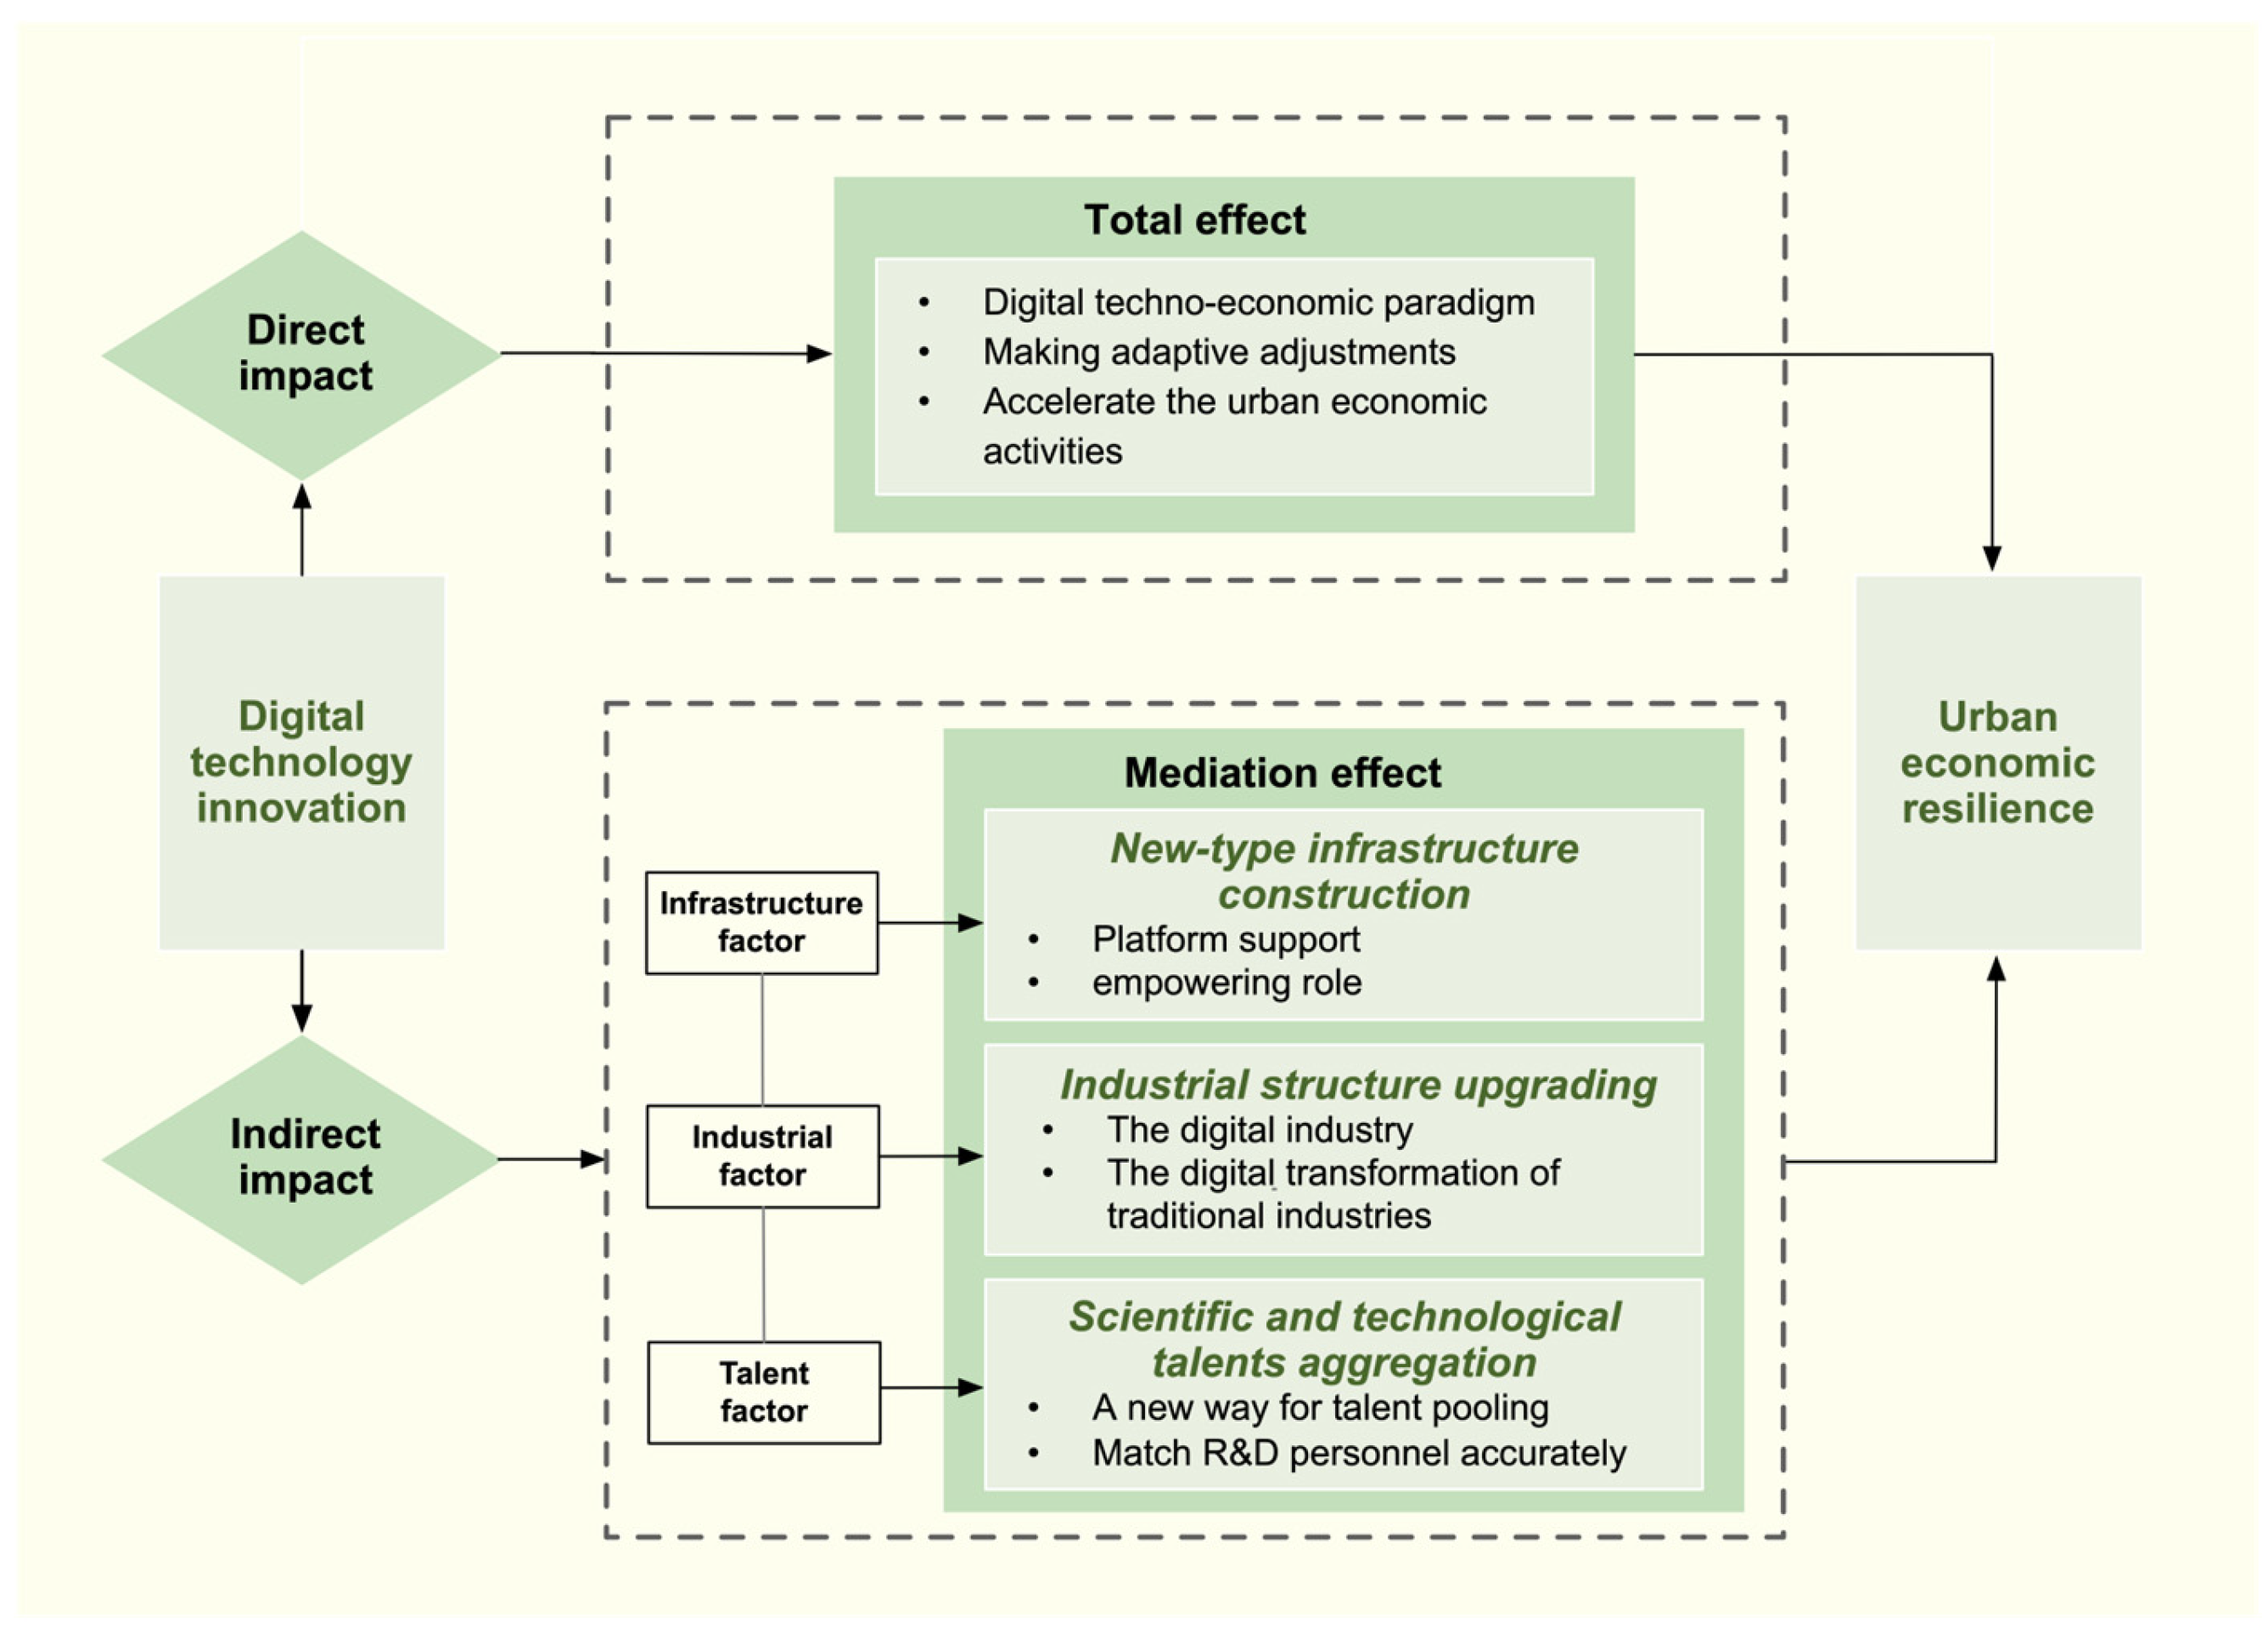
Currently, innovative applications of digital technologies including remote collaboration platforms and online R&D tools have broken spatio–temporal barriers for scientific and technological talents [13,60], creating more employment opportunities and flexible working arrangements. This reduces structural mismatches in traditional human resource allocation to a certain extent and improves the allocation efficiency of talent, capital, and other factors [61]. Cross-regional talent collaboration and interaction also allow knowledge spillover to transcend geographical limits, providing broader intellectual support for industrial development. The strong innovation externality of human capital provides sustained intellectual support for UER. In terms of talent identification and training, digitalization has become an important channel for talent agglomeration [52]. The integration of DTI with labor market data enables precise matching of talent supply and demand, coordinated development of human capital and industries, and vibrant innovation and entrepreneurship among talents. As the most creative labor group, the aggregation of scientific and technological talents also helps generate new ideas, which supports cities in exploring new development paths to strengthen economic resilience. In addition, digitalization has broadened channels for talent training and development [60,62], and improved talents’ digital literacy and development potential, thereby providing high-quality human resources for UER. Cities with abundant talent and development potential can quickly adapt to technological changes and market demand when facing external shocks. Hypothesis 4 is hereby presented. Figure 2 illustrates the theoretical analysis framework of this study.
H4: 
DTI enhances UER by driving the aggregation of scientific and technological talent.

3. Methodology

3.1. Model

3.1.1. Benchmark Model

This research adopted a two-way fixed effects (TWFE) linear model as the baseline specification to examine the impact of DTI on UER. As a standard method for panel data analysis in economics [63], this model can simultaneously control for time-invariant city-specific heterogeneity and common time-varying macroeconomic shocks, thus effectively alleviating omitted variable bias. Furthermore, it is well suited to the short panel structure of our prefecture-level city dataset, ensuring consistent and reliable estimates while addressing endogeneity arising from unobserved heterogeneity. Therefore, we utilized this econometric model to analyze how DTI influences UER. To further address potential endogeneity concerns beyond unobserved heterogeneity, we also conduct instrumental variable estimation and a series of robustness checks to ensure the reliability of our baseline results. The specific formulation of Model (1) is as follows:
R e s i l i e n c e i , t = α 0 + β 1 P a t i , t + β 2 C o n t r o l i , t + μ i + δ t + ε i , t
In this model, subscripts i and t denote cities and years, respectively. The UER, represented by the variable R e s i l i e n c e , is set as the dependent variable; P a t serves as the key independent variable DTI. This model also includes control variables ( C o n t r o l ) to account for other factors that influence UER. Fixed effects ( μ i for city fixed effect and δ t for year fixed effect) are incorporated, while ε i , t denotes the random error term. A statistically significant positive coefficient β 1 indicates that the DTI could enhance UER, which would support the theoretical expectation.

3.1.2. Mediating Effect Model

For the mediation model, the two-step method is used for mechanism testing. This approach, widely applied in economics to identify mediating effects, is supported by well-established theoretical foundations and extensive empirical evidence [47,64]. Compared with traditional methods, this approach focuses more on identifying direct effects and exhibits more robust statistical properties under the TWFE model. It can effectively mitigate estimation bias, multicollinearity, and efficiency losses associated with conventional mediation regressions. Therefore, the two-step method is employed in this study to test the underlying transmission mechanisms between DTI and UER. The mediating effect model is specified as Equation (2):
M e d i a t o r i , t = α 0 + β 3 P a t i , t + β 4 C o n t r o l i , t + μ i + δ t + ε i , t  
M e d i a t o r denotes the mechanism variables through which DTI affects UER. When the β 1 and β 3 are statistically significant, the causal relationship between the mechanism and explanatory variable is theoretically supported. This means that DTI can enhance UER through this mechanism.

3.2. Variable

3.2.1. Independent Variable

The standardization of the IPC enables a clearer definition of the technical field involved in innovative activities. The China National Intellectual Property Administration issued Digital Economy Core Industry and International Patent Classification Reference Relationships (2023), which established the first official mapping between IPC codes and digital economy industries, thus expanding the coverage of existing patents. This document distinguishes digital innovations from non-digital ones, providing a framework for measuring the scope, structural characteristics, and quality of DTI. Core industries of digital economy include digital product manufacturing (Di_manu), digital product service (Di_serv), digital technology application (Di_appl), and digital factor-driven industry (Di_driv). In all, 8 sections, 54 classes, 154 subclasses, and 266 groups of IPC are covered.
Chinese patents are obtained from the incoPat database, spanning 1985 to 2020. The records include application number, filing date, grant date, IPC code, applicant information, and inventor information. Considering the relatively weak marginal role played by individual patents, this study measures DTI by dividing the total number of patents by 1000 for clearer coefficient interpretation. As a TWFE linear model is applied, such proportional scaling only alters the variable’s numerical magnitude without changing the linear relationship or relative variation across observations. Following econometric theory, this transformation proportionally adjusts coefficient size but preserves their sign, significance, standard errors, and model goodness-of-fit [63]. Thus, it does not materially affect baseline regression results or their economic interpretation. In the following text, the Pat is used to represent DTI.

3.2.2. Dependent Variable

Following Martin [5,27], UER is conceptually defined as a city’s capacity to resist, recover from, adapt to, and renew itself in response to external shocks, rather than merely representing static economic output. This framework includes four interrelated dimensions of resistance, recovery, reorientation, and renewal that reflect the dynamic and adaptive nature of regional economic systems.
Two primary methodological approaches have been employed in the literature to quantify UER. The first relies on single sensitive indicators, such as GDP or employment changes, to measure resilience during crisis episodes [1,9,65]. While straightforward, this approach is relatively simplistic and constrained by an equilibrium perspective, focusing narrowly on post-crisis recovery and requiring the precise identification of shock events. It thus fails to capture resilience as an inherent, long-term attribute of regional economies [66]. The second approach adopts a comprehensive indicator system, which quantifies the multi-faceted nature of resilience. This approach captures not only resistance and recovery but also organizational adaptability and innovative renewal capacity [34,35,67]. Pioneered by Briguglio [68], this method has been extensively applied by academics and a range of policy institutions. It systematically reflects the adaptive features of urban economies across pre-shock, shock, and post-shock periods. As an inherent attribute, resilience evolves with the dynamic process of regional development. Therefore, the second method provides a more comprehensive representation of the long-term adaptive characteristics of urban economies amid changes.
Given the inherent correlation and difficulty in empirically distinguishing resistance and recovery, this research constructed a UER index system based on three core dimensions aligned with Martin’s [5,26,27,28] framework: (1) resistance and recovery ability; (2) organizational and adjustment ability; (3) renewal and development capacity. The specific indicators were selected in line with the established literature [34,35], as detailed in Table 1. Crucially, this system is designed to reflect the capacities that enable cities to withstand and recover from shocks, rather than focusing solely on general macroeconomic performance. For instance, the dimension of resistance and recovery ability captures economic stability and risk tolerance, the dimension of organizational and adjustment ability reflects structural adaptability, and the dimension of renewal and development capacity represents long-term growth potential. Each of these represents a fundamental attribute of urban economic resilience.
To avoid subjective weight assignment, the entropy method was employed to derive objective weights for each indicator and construct the comprehensive UER index. Furthermore, to assess the robustness of the results, we employed the single-indicator approach in our robustness checks. In this specification, UER is measured as the sensitivity of urban growth to national GDP downturns. The consistent findings across both measures further support the feasibility of the comprehensive indicator system used in the analysis.

3.2.3. Mechanism Variable

1.
New-type infrastructure construction (New_Infra)
The 14th Five-Year Plan for New Infrastructure Construction in China clearly states that the new-type infrastructure is comprised of information infrastructure, fusion infrastructure, and innovation infrastructure [34]. Specifically, seven related key sectors encompass ultra-high voltage, charging piles, 5G, data centers, AI, industrial Internet platforms, and high-speed railway. As shown in Table 2, based on the construction of the indicator system, the level of new-type infrastructure construction is evaluated by the three-stage DEA model. This approach can effectively eliminate the interference of external environmental factors and random noise, thereby yielding more accurate and robust efficiency estimates. As a nonparametric method, it does not require a predefined production function, which helps avoid model specification bias [69]. Furthermore, the three-stage DEA is capable of handling multi-input and multi-output data, whereas the traditional SFA fails to evaluate the efficiency of decision-making units with multiple outputs, making it more suitable for capturing the input–output trade-off in infrastructure development [70]. Due to the missing data in some prefecture-level cities, the period selected for this study was 2008–2020.
2.
Industrial structure upgrading (TA_Indus; TS_Indus)
Under DTI, industrial structure upgrading is characterized by the increasing servitization of the urban economy. The ratio of output between the secondary and tertiary industries (TA_Indus) is used as an indicator [11]. In addition, this research utilized the industrial structure change index (TS_Indus). Currently, labor mobility in China is still constrained by excessive administrative intervention and inefficient market mechanisms, which leads to a mismatch between employment shares and industrial output shares. Following Ando and Nassar [71], the Euclidean distance between industry shares and employment shares is defined as follows:
d i = L i k L k V A i k V A k               d = i d i 2
The d i is divergence between employment share and industry share in industry i ; V A i donates the value added of industry i , and L i denotes that industry’s total labor force. The total distance d captures the overall disparity across all k industries between employment and industrial shares.
3.
Technological talents aggregation (Peo_Aggre)
Drawing on the common practice of approximating urban technological talent aggregation through specific industries, this research calculated the proportion of employees in scientific research, technical services, and geological exploration industries, combined with those in information transmission, computer services, and software industries, to the total urban employment. Compared with other industries, these sectors employ relatively more workers with professional knowledge and skills. Therefore, when commonly used variables such as average years of education are difficult to obtain, using this indicator to measure urban talent level is reasonable and feasible. In addition, since 2020, the China City Statistical Yearbooks have no longer published specific industry-level employment data, so this variable was only calculated up to 2019.

3.2.4. Control Variable

This research also checked for other variables that may affect UER. Foreign direct investment affects economic resilience through capital accumulation, technology spillovers, and competitive demonstration effects. Accordingly, foreign direct investment (fdi) is included, measured as the share of fdi in regional GDP [9,34].
Previous studies [72] suggested that advanced transportation infrastructure strengthens interregional economic linkages and accelerates the flow of information, talent, and other factors, thereby improving urban adaptability and flexibility in response to economic shocks. Transportation infrastructure also mitigates the adverse impacts of shocks by fostering new development pathways toward resilient and sustained growth. We therefore used the road–person ratio to measure transportation accessibility (road).
Cities host productive activities, yet cities of different sizes vary in their exposure to external shocks and recovery capacity. Larger cities typically maintain more extensive external connections and face shock impacts due to more frequent economic exchanges [73]. Thus, city size (buid) is also checked for, measured by urban built-up area.
The development of urban cultural industries can promote high-quality economic growth. Cellini and Cuccia [74] investigated the relationship between economic resilience and the cultural sector, finding that expanded cultural supply reduces regional unemployment and enhances economic resilience. We therefore include city soft power (book), measured by the books per 10,000 urban residents.
The healthcare system constitutes key support for resilient city construction and provides a buffer against external shocks [2,75]. Against this background, level of city medical care (mec) is also introduced as a control variable, measured by the number of hospital and health center beds per 10,000 urban residents.

3.3. Data

Considering the time lag effect of patents and the lack of some macroeconomic data, this research utilized the panel data covering 264 Chinese cities from 2005 to 2020 to investigate how DTI influences UER. The data are mainly collected from the China City Statistical Yearbook, the China Statistical Yearbook for Regional Economy, and the statistical bulletins on national economic and social development of the corresponding cities. Chinese patents are obtained from the incoPat database. Descriptive statistics are reported in Table 3.

4. Results and Discussions

4.1. Descriptive Statistics of Related Variables

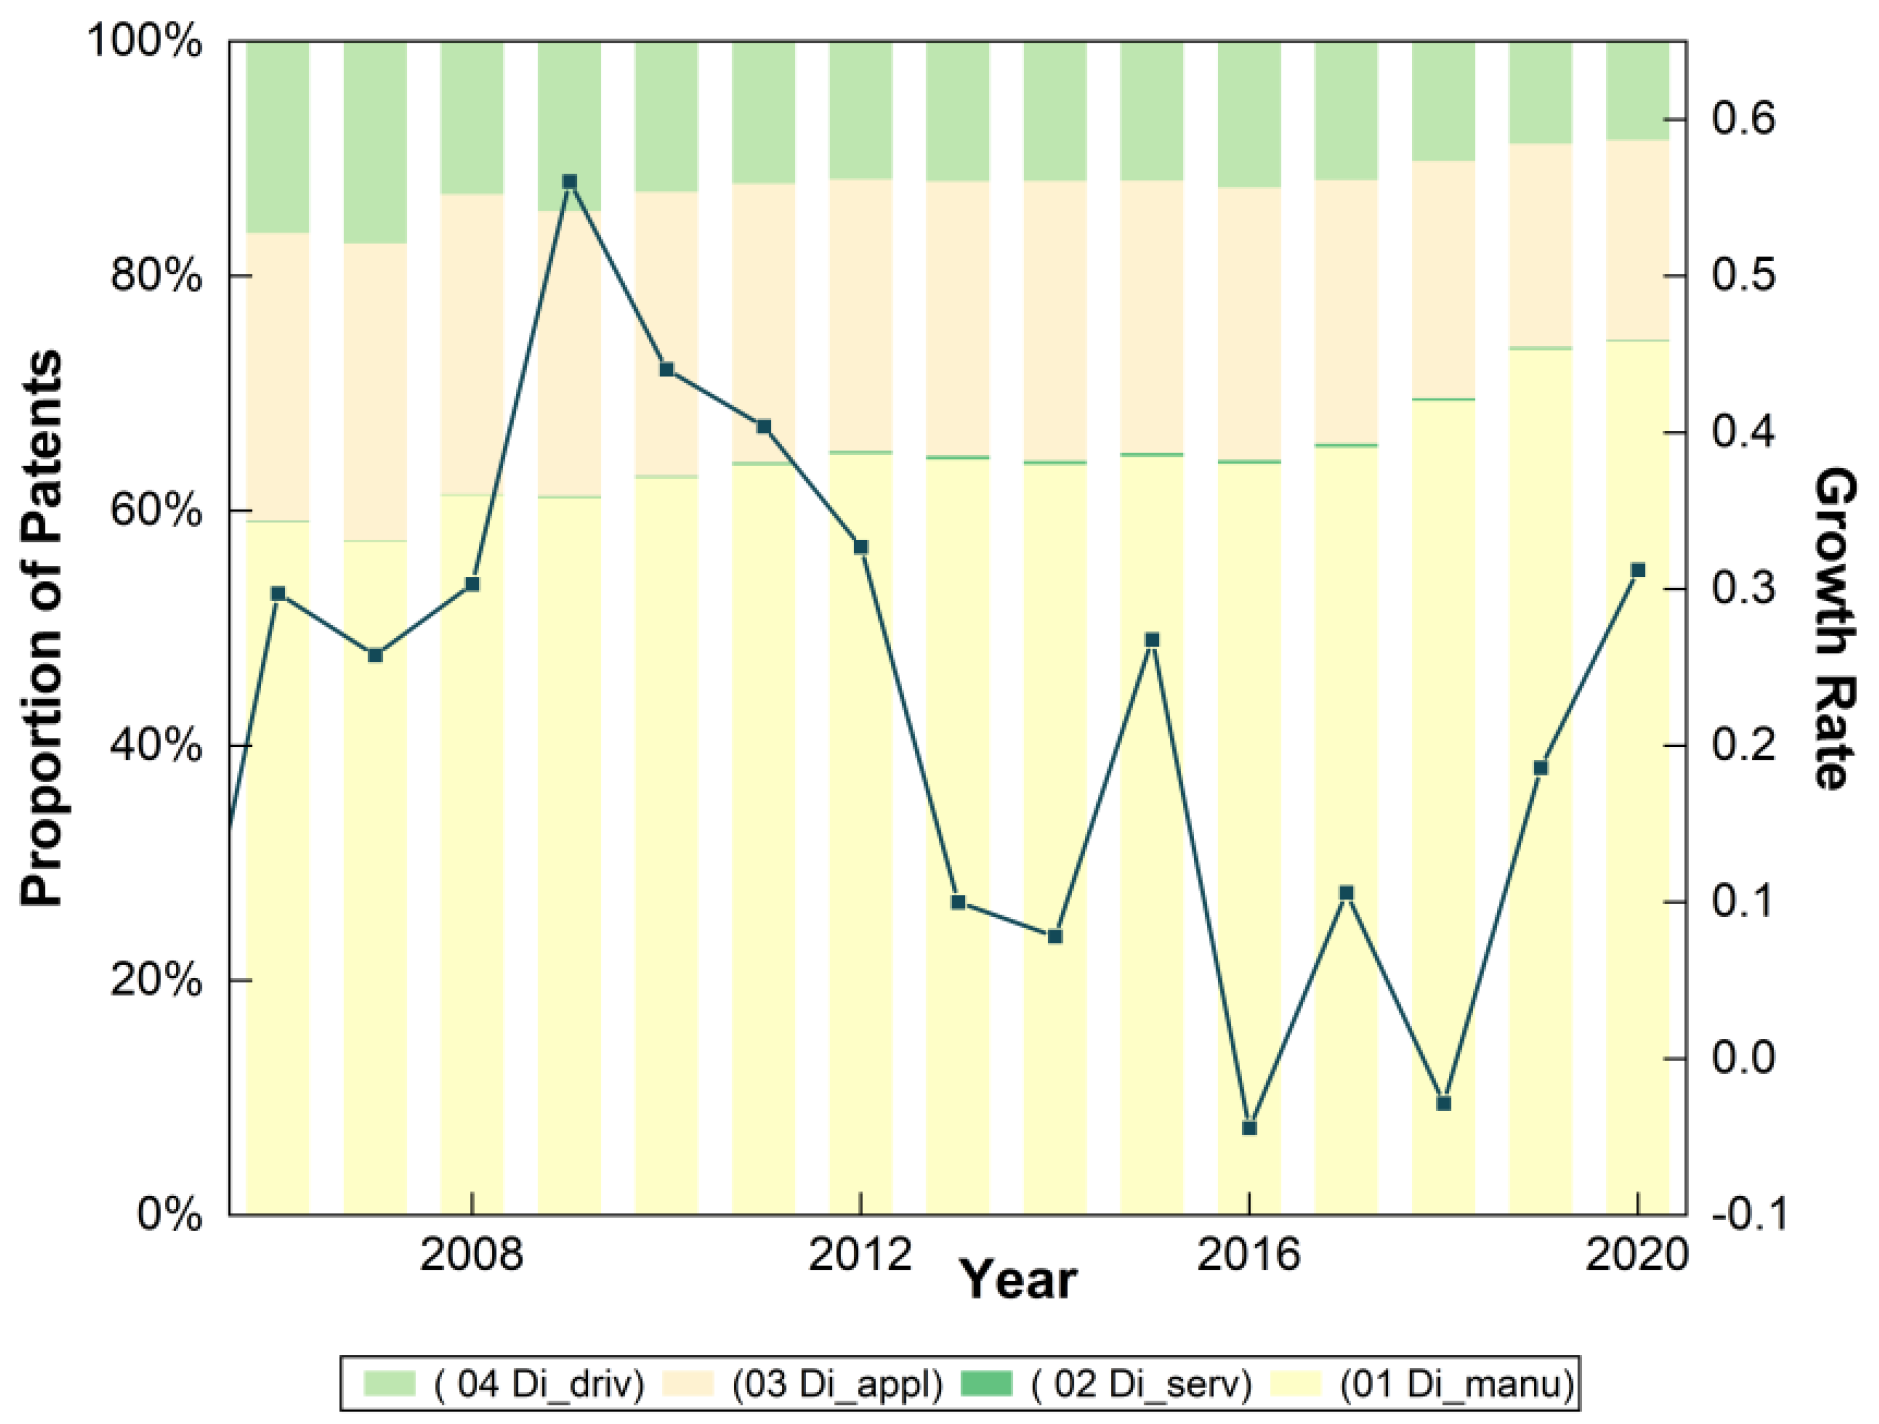
China’s digital technology patent volume has shown an overall upward trend over the past 15 years. As depicted in Figure 3, the annual growth rate shows a trend of “rising–declining–rising” pattern. Specifically, 2005–2010 was a period of rapid growth in digital technology patents, which was followed by a slowdown and decline in growth rate. Since 2018, there has been a renewed high-speed growth trend. From the perspective of internal structure, the share of patent innovations in digital product manufacturing (Di_manu) has remained stable above 50%, followed by digital technology application (Di_appl) and digital factor-driven industry (Di_driv). Meanwhile, digital product service (Di_serv) has maintained the lowest share. The patent stock of Di_manu and Di_appl reflects their scale advantage and development vitality, while the relatively low innovation level of Di_serv also indicates the current obstacles to the growth of China’s digital economy. This issue may be related to existing data security and privacy protection challenges, as well as uneven service quality.
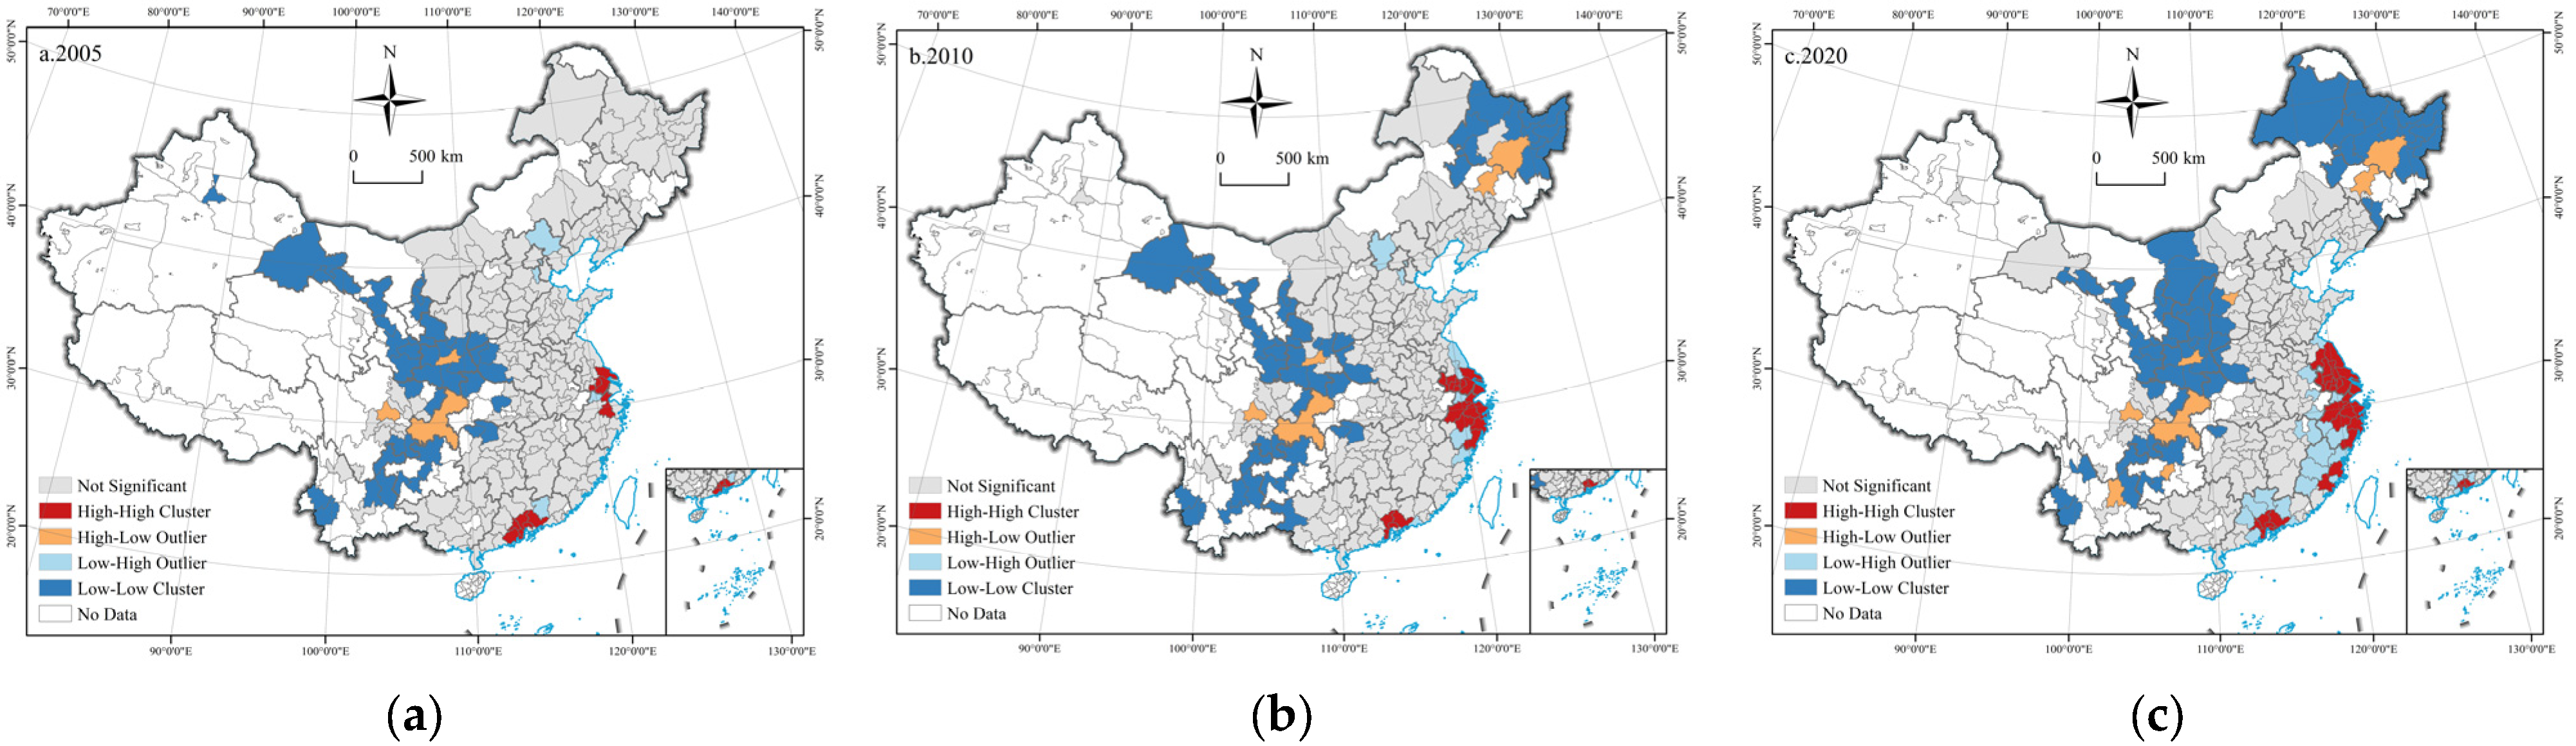
To further examine the local spatial agglomeration of DTI, this research produced LISA cluster maps for Chinese cities in 2005, 2010, and 2020, as presented in Figure 4. Overall, the maps (a)–(c) demonstrated that DTI in Chinese cities had a distinct east–west disparity, with persistent and strengthening positive spatial clustering. High-High clusters stayed concentrated along the eastern coast, especially in the Yangtze River Delta, Pearl River Delta, and Bohai Rim Region. Their coverage rose substantially over the period, as high-level DTI in eastern China became increasingly clustered and shaped a stable innovation growth pole. Low-Low clusters were focused in the central and western regions, particularly the northwest and southwest. These regions faced lasting low-level lock-in. Low-DTI cities were surrounded by comparable neighbors, leading to a clear spatial bottleneck for digital progress.
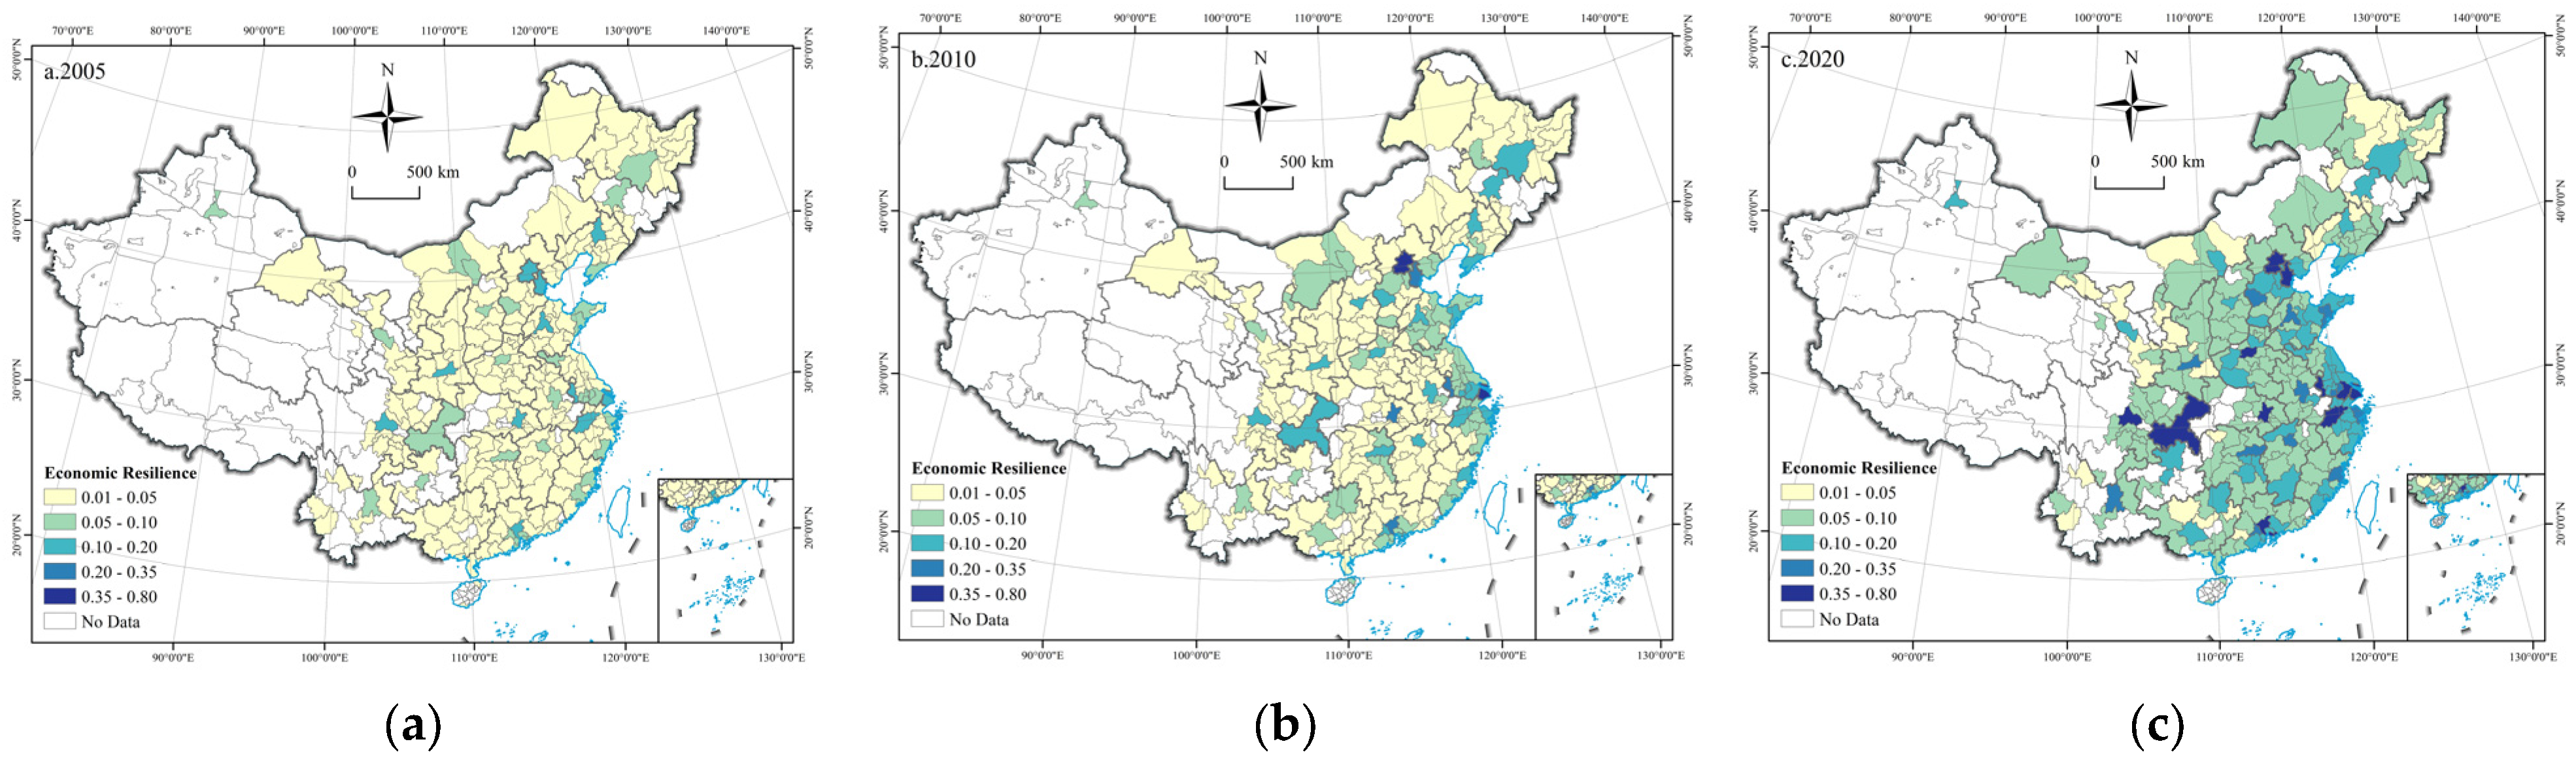
The distribution of UER in 2005, 2010, and 2020 is shown in Figure 5. Spatio–temporal disparities are evident in economic resilience outcomes across different urban areas. In 2005, nearly all cities had low levels of economic resilience (in the 0.01–0.05 range); only a few cities with high resilience were distributed in a dotted pattern in the eastern part of the country. Shanghai and Beijing stood out as clear leaders in economic resilience, with both achieving resilience scores exceeding 0.10. Compared to 2005, some cities presented enhanced economic resilience; there was a marked rise in the number of urban areas achieving resilience scores of 0.05 or higher in 2010. From a regional perspective, cities with higher resilience in the eastern region were connected to the dots, while Chongqing, Chengdu and other inland cities had strong economic resilience dynamics. Beijing and Shanghai remained as the optimum high-value region in the country in terms of economic resilience, with scores exceeding 0.35. Over the past decade, Chinese cities have experienced a significant enhancement in economic resilience. By 2020, the UER had generally reached over 0.10. However, the gap between cities further widened, which may be attributed to differences in urban economic development, technological level, and industrial structure [9,76]. Compared to the inland western region, the coastal eastern region still maintained higher economic resilience [11,34]. Inland cities with strong economic resilience were scattered, mostly concentrated in provincial capitals. This spatial pattern underscores the success of the “strong provincial capitals” strategy in driving development in central and western China, as it has maintained stable economic, social, and ecological environments [9].
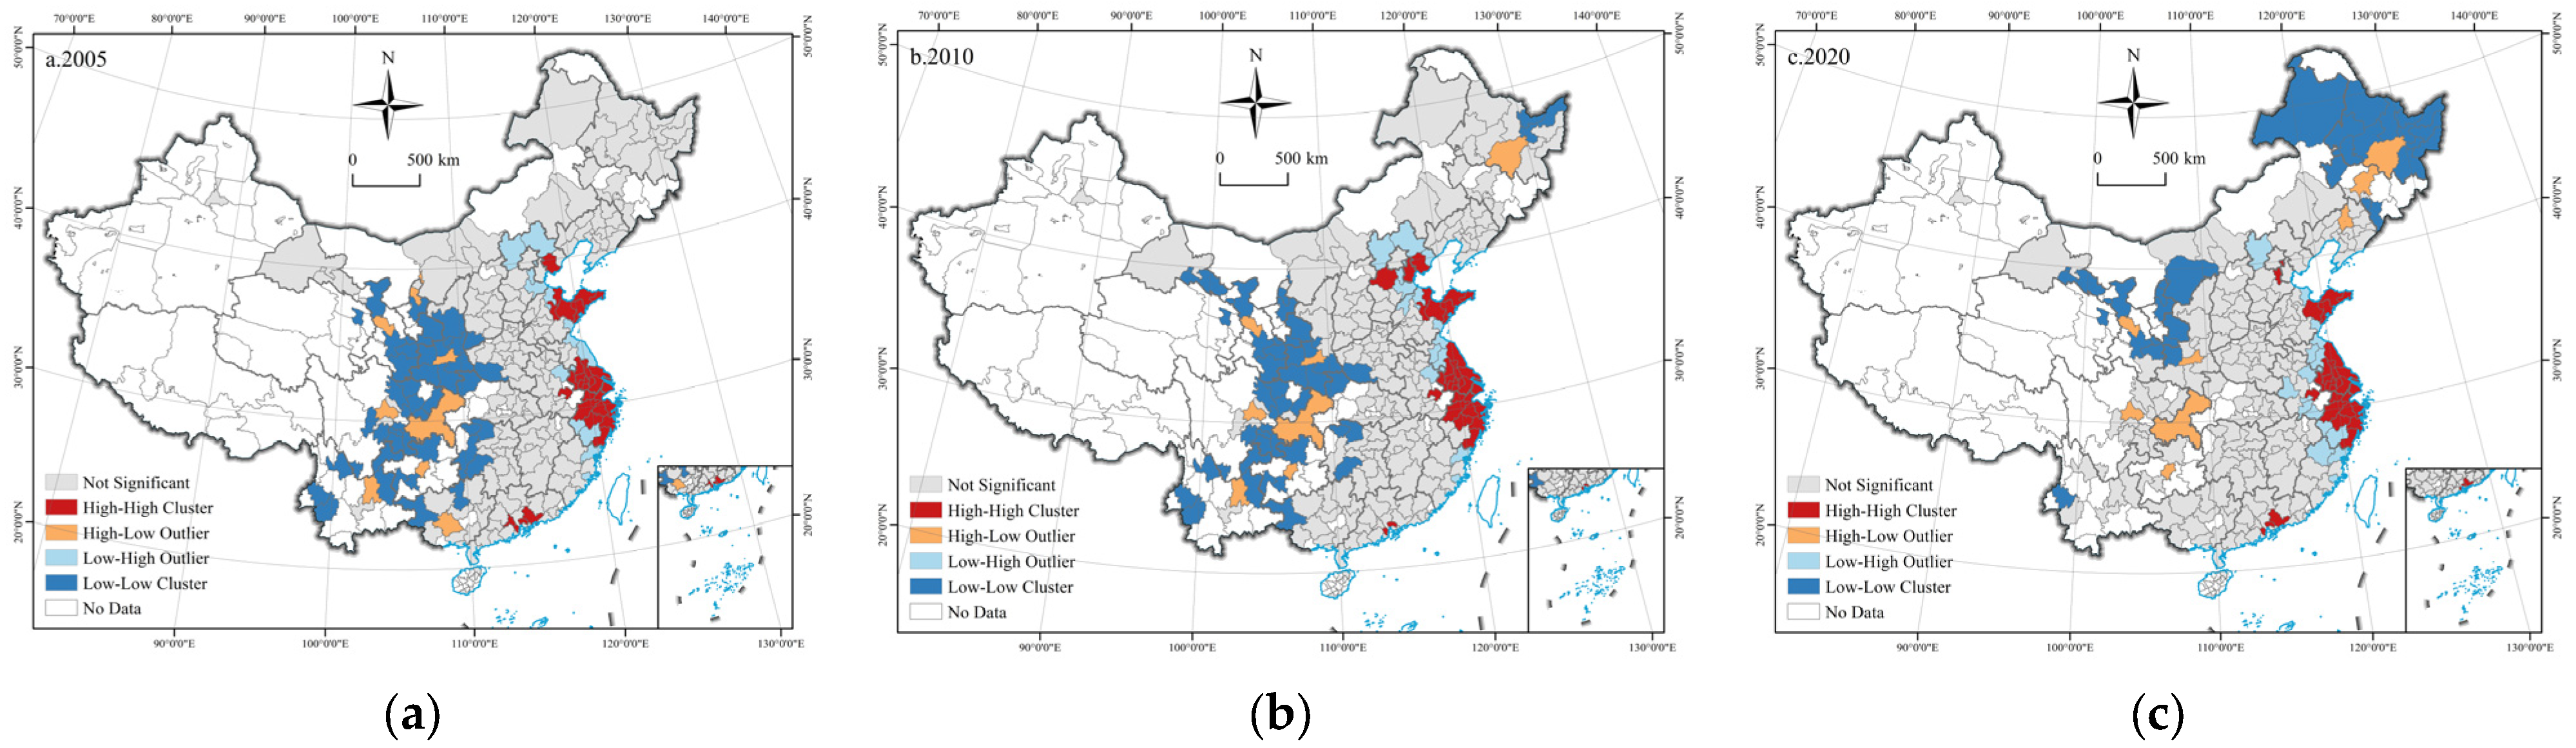
For a deeper investigation into the spatial dependence in these distribution patterns, LISA cluster maps of UER are presented in Figure 6. UER displayed clear positive spatial clustering, alongside substantial regional disparities between eastern and western cities. High-High clusters remained concentrated in the eastern coastal areas, reflecting a growing spatial concentration of high resilience cities in China’s most economically developed coastal regions. In contrast, Low-Low clusters were mainly distributed in the central and western inland areas. This spatial pattern reflects the uneven regional development between eastern and western areas, highlighting the need for regional policies to strengthen UER in inland areas and promote more balanced development across the country.
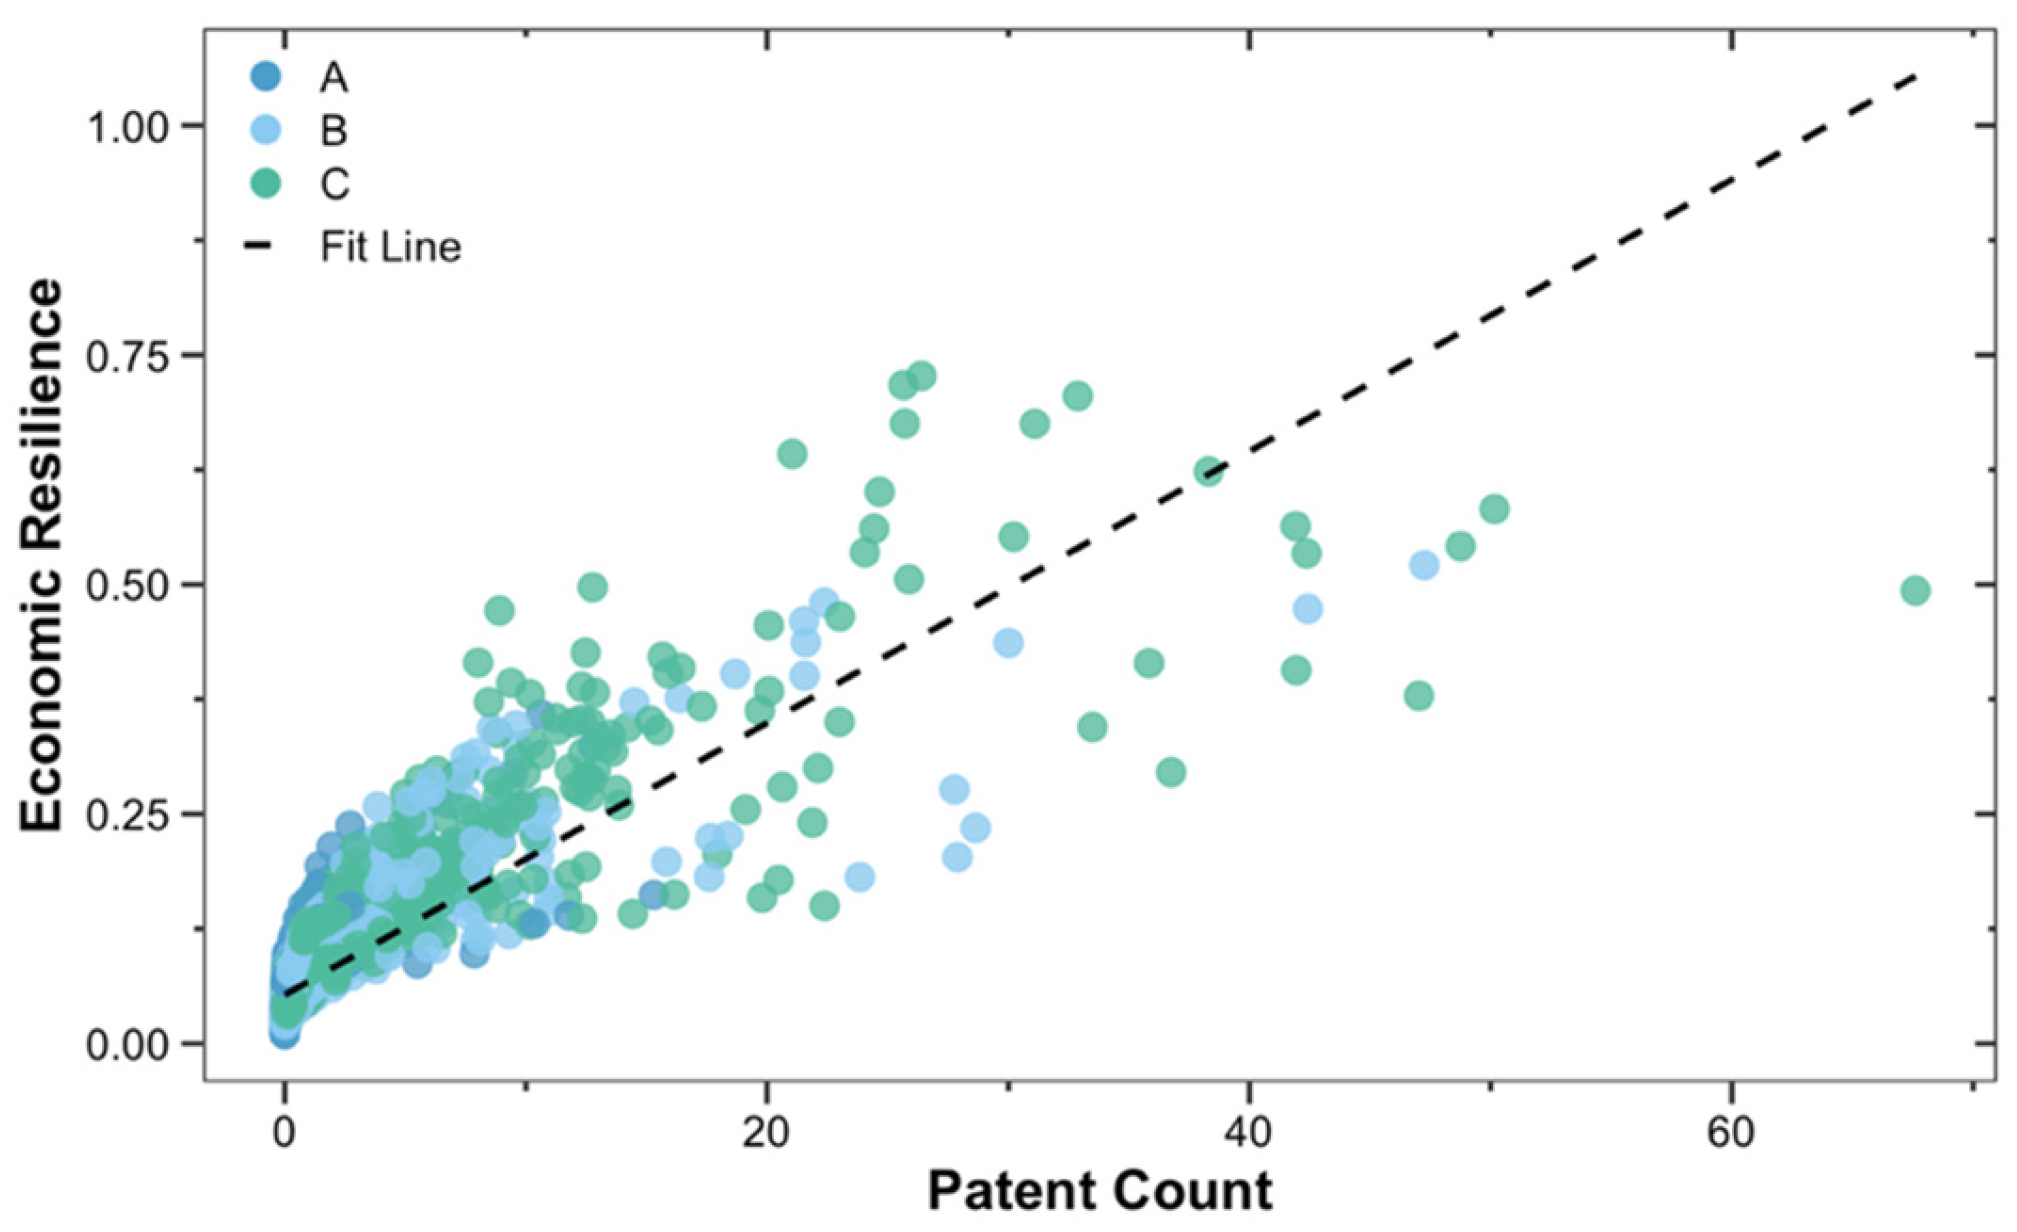
Figure 7 presents a scatter plot of DTI versus UER. Group A scatters represent city samples from 2005–2009, Group B scatters from 2010–2014, and Group C scatters from 2015–2020. It is evident that, compared to Group A, the scatter points of Groups B and C are more scattered and contain more outliers. This further confirms the significant temporal differences in UER and digital technology patents. Meanwhile, the overall scatter distribution with the fitted line shows a positive correlation between digital technology patents and UER. This initially validates Hypothesis 1, confirming a close relationship between DTI and UER and thus laying the foundation for the subsequent empirical tests.

4.2. Benchmark Regression Analysis

The estimation was conducted using the fixed effects framework specified in Model (1). The benchmark regression results in Table 4 illustrate the impact of DTI on UER. As shown in Columns (1) to (3), the regression coefficients of DTI (Pat) on UER (Resilience) are all significantly positive, regardless of whether control variables or fixed effects are included. This indicates that, on average, DTI development exerts an enhancing effect on UER. Column (4) of Table 4 shows that after incorporating both control variables and fixed effects, the coefficient of Pat is 0.009, with a robust standard error clustered at the city level that is significant at the 1% level. All the above results suggest that DTI has a significant positive impact on UER, consistent with Hypothesis 1, proposed in the theoretical analysis.
We further examined the role of DTI in different industry types in influencing UER. The regression coefficients for Di_manu, Di_serv, Di_appl, and Di_driv in Columns (1) to (4) of Table 5 are all significant at the 1% level with the control variables and fixed effects included. This finding indicates that innovations in various digital core industries all exert significant enhancing effects on UER.

4.3. Endogeneity Analysis

The relationship between DTI and UER may suffer from endogeneity issues. Cities with higher economic resilience tend to invest more in DTI, implying that improved UER could be a cause rather than a consequence of DTI. In addition, potential omitted variables may also lead to a correlation between DTI and the error term [14,15]. Therefore, this research opted to employ two approaches to address endogeneity concerns.
The endogeneity was addressed first via the instrumental variable (IV) method, which isolates exogenous variation in the model. The number of people with Internet broadband access (Inter) from 2005 to 2020 is chosen as an instrumental variable for DTI in this research [9,34]. The IV must be highly correlated with the core explanatory variable DTI. The Inter, which directly reflects the popularization of digital infrastructure, is closely related to the development of DTI, thereby meeting the relevance requirement of instrumental variables. With modern information technology as a medium, digital technology has been widely integrated into various industries, constantly driving the transformation of public lifestyles, and Inter precisely reflects the public’s acceptance and popularity of modern digital technology. Meanwhile, Inter is only related to the popularization of digital technology, and it has no direct correlation with the explained variable UER or direct impact on it, which ensures its exogeneity. The Internet, as a tool, cannot directly endow cities with risk-resistant capabilities. It can only help cities optimize resource allocation and reduce transaction costs but cannot directly change the inherent stability of the urban economy. Therefore, Inter meets the exogeneity requirement for instrumental variables. The results in Columns (1) and (2) in Table 6 are estimated by the 2SLS method. The Kleibergen–Paap Wald rk F statistic exceeds the 10% critical value for Stock–Yogo weak identification (16.38). A high correlation exists between the instrument and the endogenous variable, implying the validity of the IV approach. Concurrently, DTI and UER display a statistically significant positive relationship.
To construct the second IV, this research used spherical distances from Hangzhou to each sample city. As the hub of China’s digital economy represented by Alibaba and the emerging DeepSeek, Hangzhou is a pioneer in digital transformation. Its advancing digital development inevitably affects DTI in surrounding regions, and cities closer to Hangzhou face lower barriers in adopting digital technologies. Meanwhile, as a strictly exogenous locational variable, spherical distance is unaffected by omitted factors or reverse causality from explanatory variables. Given that geographic distance is time-invariant and unsuitable for direct regression, this research followed the Fenske [77] method and interacts the spherical distance to Hangzhou with a time trend to construct the IV Spher. The findings in Columns (3) and (4) of Table 6 indicate that the Kleibergen–Paap Wald rk F statistic exceeds the critical value of 16.38. The significant positive coefficient of Pat further confirms that DTI effectively promotes UER.
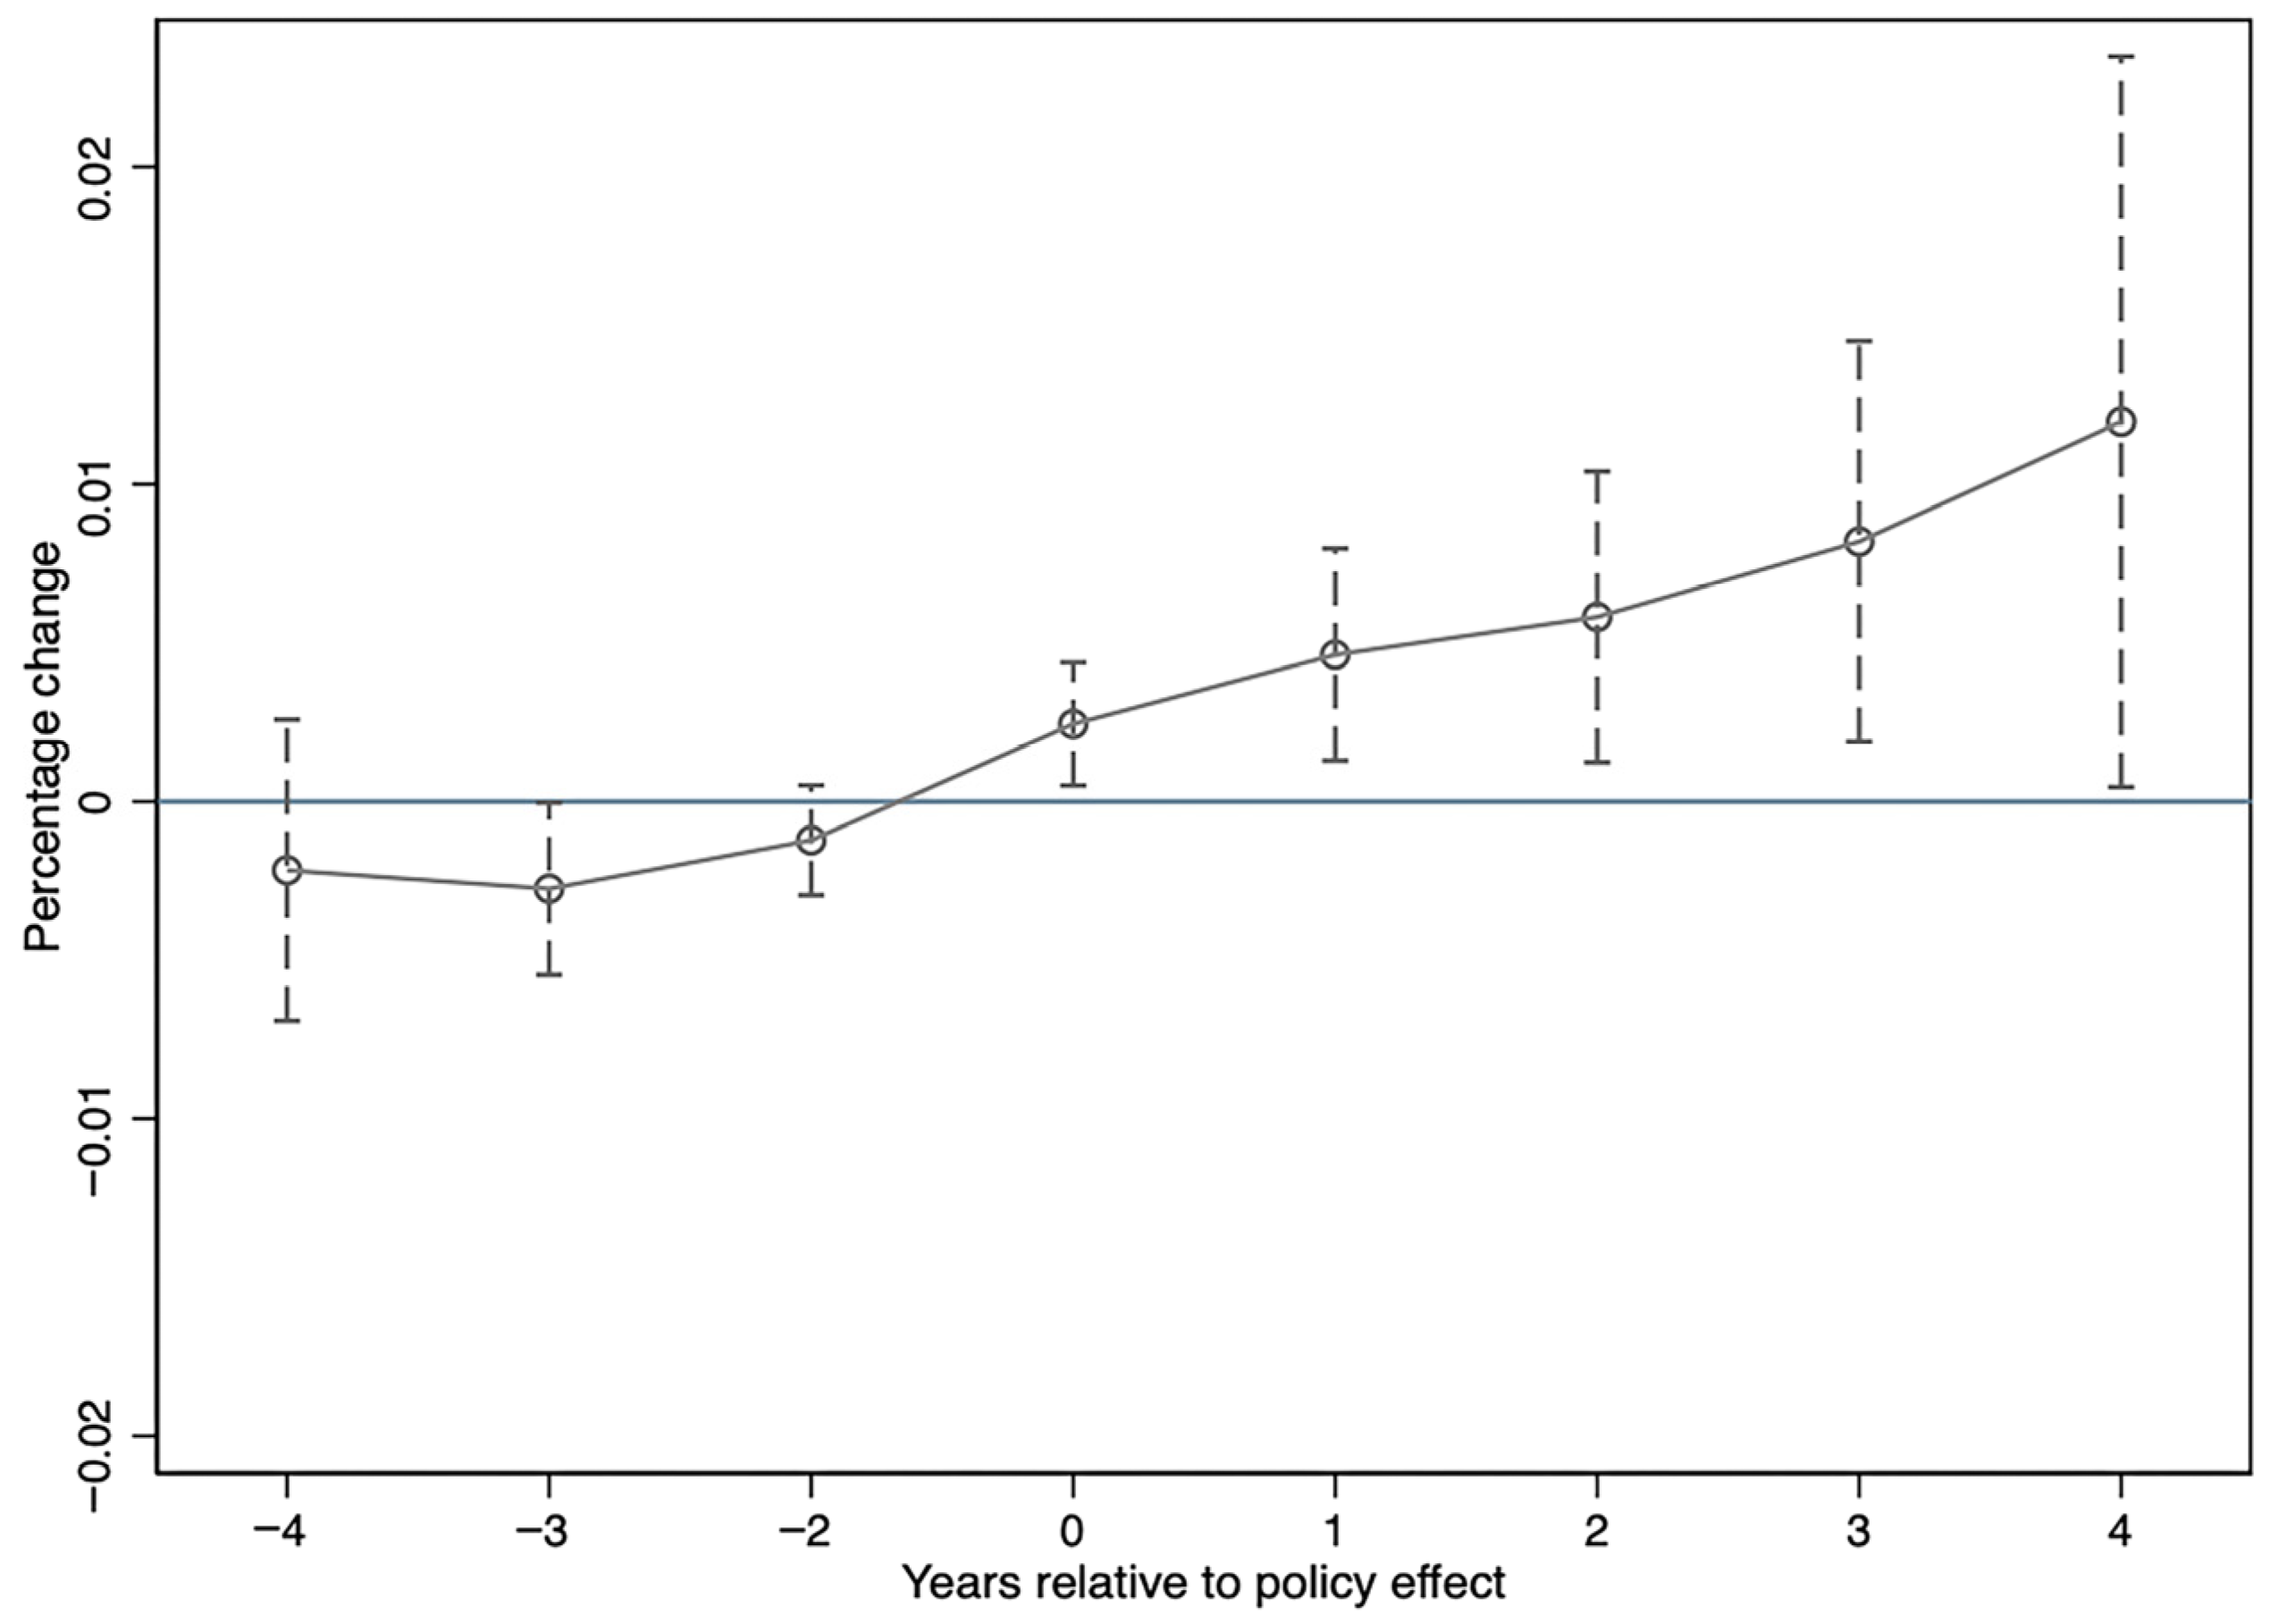
Second, we employed the difference-in-differences (DID) model as a supplementary endogeneity test to examine the impact of DTI on UER, based on China’s national smart city pilot program [43,78]. Our baseline estimation relies on the TWFE model, and this quasi-natural experiment helps alleviate endogeneity concerns arising from city-level omitted variables. China has been launching smart city pilots since 2012, which has effectively promoted the application and practice of digital technologies. These digital technology initiatives have improved the ability of various economic agents to deal with internal and external risks and have reduced the causes of risk-related losses to a certain extent. In this research, a dummy variable was constructed according to the list of national smart city pilots. Column (5) in Table 6 reports the findings, emphasizing both the positive effect of smart city pilot policies on UER and the validity of the benchmark regression analysis. This indicates that after taking into account the IV method to address endogeneity, the conclusion is robust. The parallel trend test presented in Figure A1 in the Appendix A verifies that pilot and non-pilot cities exhibit comparable trends before the policy shock, thus ensuring comparability between the treatment and control groups and supporting the reliability of causal identification.

4.4. Robustness Test

To ensure the reliability of the benchmark regression, robustness tests were conducted, and Table 7 and Table 8 show the results of those tests.
Patent authorization may suffer from inefficiency and cumbersome procedures. Compared with granted patents, patent applications feature more timely disclosure and better capture entities’ active innovation behaviors. This research thus employed Chinese urban digital technology patent applications (Pat_apply) from 2005 to 2020 for robustness tests, with results shown in Table 7 Column (1). Furthermore, instead of measuring DTI solely by annual patent counts, Popp [79] incorporated the depreciation of knowledge stocks and the diffusion of knowledge flows. Drawing on this idea, we calculated the knowledge stock (Kit) by summing up the weighted patent counts across lagged years using decay and diffusion rates, as detailed in Equation (4):
K i t = s = 0 e β 1 ( s ) ( 1 e β 2 ( s + 1 ) ) P A T i s
where K i t represents the knowledge stocks of various digital core industries in the year, s represents the year index as of year t (including the current year), and P A T i s denotes the total number of digital technology patents granted to digital industry i in s years. For the parameters, β 1 is the patent decay rate set at 0.1, and β 2 is the patent diffusion rate used to capture the lag in knowledge flows, set at 0.25. Column (2) reports the results. By comparing Columns (1) and (2) of Table 7, both patent application data and DTI knowledge stock show significantly positive effects on UER.
This research also adopted the counterfactual analysis approach of Xu [9] and Yao [3]. UER is measured as the ratio of the gap between actual GDP and predicted GDP. The specific Formula (5) is shown below:
R e s E c o = [ ( G D P t + k ) C ( G D P t + k ) E ] | ( G D P t + k ) E |
where ( G D P t + k ) E denotes the expected economic level of the city according to the national average growth rate. In the shock measurement interval (t + k), R e s E c o refers to the ratio of the change in the city’s actual economic level to the expected economic level, according to the national average growth rate. The regression result is reported in Table 7 Column (3). Considering the time-lagged effect of DTI on UER, this research employed the lagged one-period UER for the baseline regression analysis. The regression findings are reported in Column (4), Table 7. The findings in Columns (3) and (4) consistently validate the study’s core conclusions.
To address potential distortions from outliers or extreme values in the dataset, this research winsorized the full sample at the 1% and 99% levels and separately at the 2% and 98% levels. After excluding extreme values, the results in Columns (1) and (2) of Table 8, consistently show that DTI exerts a positive effect on UER, confirming the core conclusion. Furthermore, compared with ordinary cities, municipalities directly under the central government have larger economic aggregates, and there are also large gaps in the level of DTI and UER. To ensure the robustness of results, this research excluded samples of municipalities, and the regression results are presented in Table 8, Column (3). The level of DTI in China grew rapidly around 2011. We therefore restricted the sample period to 2011–2020 and re-conducted the regression test. Columns (3) and (4) indicate that the core regression results remain stable after this robustness check.

4.5. Heterogeneous Analysis

4.5.1. The City Size and Administrative Hierarchy

According to the Notice of the State Council on Adjusting the Standards for Urban Scale Classification, issued by China in 2014, we classify cities by permanent urban population. Small cities have fewer than 500,000 residents. Medium-sized cities have between 500,000 and one million residents. Large cities have more than one million residents. To avoid estimation bias caused by the small number of observations in small cities, small- and medium-sized cities are combined into a single group. This research then constructed a city-size dummy variable SizeÍPat coded 1 for large cities and 0 for small- and medium-sized cities. We also create an administrative-level dummy variable CentralÍPat coded 1 for provincial capitals, sub-provincial cities, and municipalities and 0 for other ordinary cities. The heterogeneity regression results are shown in Columns (1) and (2) of Table 9. The findings reveal that DTI generates a stronger positive effect on UER in large and central cities than in small, medium-sized, or peripheral cities. This pattern reflects an agglomeration advantage. Large central cities attract more skilled labor, advanced technologies, and larger digital markets. Thus, they achieve more active DTI and stronger shock resistance. By contrast, small, medium-sized, and peripheral cities have dispersed factor endowments, weak agglomeration effects, and inadequate innovation conditions, leading to weaker risk resistance.

4.5.2. The Level of Economic Development

The 2008 global financial crisis caused a slowdown in China’s economic growth after it reached 14.23% in 2007. Driven by a four trillion-yuan economic stimulus package, GDP growth recovered in 2010 and 2011 but fell below 8% in 2012, after which China’s economy entered a new normal stage. The sample period is therefore split into two intervals (PeriodÍPat). The first period covers 2007 to 2012 and is marked as the resistance stage with a value of 0. The second period covers 2013 to 2019 and is marked as the recovery stage with a value of 1. Moreover, the 2020 sample is excluded because of the GDP decline caused by the COVID-19 pandemic. In Column (3) of Table 9, DTI is more effective at improving UER during the economic recovery stage. In brief, DTI supports the recovery process by easing economic fluctuations from external shocks and enables cities to adapt more rapidly to sudden disruptions. It also renews economic vitality through structural adjustments and further strengthens overall economic resilience.

4.5.3. The Degree of Industrial Development

As knowledge-intensive industries with new technologies, emerging industries feature strong growth potential and positive external effects. These industries serve as a key engine for DTI and a major platform for the application and transformation of digital technologies. Therefore, they contribute to higher UER. With the National Economic Industry Classification in China, the number of new business registrations in the scientific research and technical services industry and the information transmission, software, and information technology services industry, from 2005 to 2020, is used to characterize the development of emerging industries (Newfirm × Pat). The development of emerging industries is measured by the number of new firm registrations in scientific research technical services and in information transmission, software, and information technology services from 2005 to 2020. Cities are then grouped according to the average level of new firm registrations. The regression result is reported in Column (4) of Table 9. It shows that the positive effect of DTI on UER is stronger in cities with more advanced and dynamic emerging industries.

4.5.4. The Extent of R&D Investment

R&D investment provides the material basis for technological innovation. Inputs can be divided into R&D expenses (RD_expÍPat) and R&D talent (RD_talÍPat). Thus, this research used the median values of R&D expenses and R&D talent to classify cities into different groups. According to Columns (5) and (6) of Table 9, the positive influence of DTI on UER is stronger in cities with higher R&D expenses and greater talent input. Higher R&D expenses and talent inputs allow cities to undertake broader and more intensive R&D activities. They also enable larger-scale and more diverse DTI, which more effectively strengthens UER.

4.5.5. Public Attention

Escalating market demand serves as the primary driving force for scientific and technological progress. Meeting people’s daily needs represents the core goal of DTI and the final step in realizing innovation value. In the digital era, the public releases demand signals through online keyword searches, forming an external driving force for DTI and practical application. Growing numbers of people follow urban construction and development through the Internet. This new way of delivering and supervising government services through DTI features spontaneity, relevance, convenience, and universality. DTI can therefore effectively improve governance efficiency and public service quality, which in turn influences UER. This research used the search frequency of keywords including digitalization and digital economy on China’s mainstream search engine Baidu and grouped cities by the median value (AttentionÍPat). Column (7) of Table 9 shows that DTI’s positive impact on UER is stronger in cities where the public pays greater attention to digital development.

4.6. Mechanism Analysis

Building on the verified causal effect of DTI on UER in earlier sections, this part further explores the underlying impact channels. It focuses on the mediating roles of new-type infrastructure construction, industrial structure upgrading, and scientific and technological talent agglomeration in the link between DTI and UER.
In Table 10, Column (1) presents the results of new-type infrastructure construction (New_Infra) as a mechanism variable. The Pat coefficient of 0.0147 is statistically significant at the 1% level, proving that DTI helps accelerate the development of new-type infrastructure. As a carrier for DTI transformation, new-type infrastructure is a service-oriented system that supports digital transformation, intelligent upgrading, and integrated innovation through information networks. It can improve efficiency and reduce costs by helping traditional industries realize intelligent production and can also provide the necessary conditions for the development of new industries. By identifying risks and challenges in urban economic operations, the improvement of urban intelligence enhances the ability to cope with these risks and reduces potential economic losses.
Columns (2) and (3) in the same table present the test results for industrial structure upgrading (TA_Indus & TS_Indus). The coefficients of Pat are 0.0127 and 0.9406 respectively, both significant at the 1% level. This finding suggests that DTI plays a significant role in promoting the optimization and upgrading of urban industrial structure. Industrial structure has long been recognized as an important factor affecting resilience [11]. The dual progress of digital industry expansion and traditional sector digitization work together to drive the industrial structure toward higher value configurations. The shift of the industrial structure towards the tertiary industry brings about development dividends, and this promotes the continuous flow of resources into the urban economy, helps form economies of scale, and fosters new growth drivers [16]. Furthermore, the rationalization of the industrial structure strengthens UER by improving inter-sectoral coordination and refining the division of labor.
The results of the technology talents aggregation (Peo_Aggre) mechanism are listed in Column (4), Table 10. The positive Pat coefficient confirms that DTI encourages the gathering of scientific and technological talents [62]. Highly skilled, innovative, and adaptable human capital forms the foundation of modern economic systems. It speeds up the spread and application of advanced knowledge and technologies. Knowledge spillovers from talent agglomeration foster broader urban innovation, advance industrial evolution, draw in more external investment and high-quality resources, and further elevate UER [13].

4.7. Spatial Spillover Effects Analysis

Cities with similar levels of UER in China tend to present spatial agglomeration [13]. Industrial diversification, industrial agglomeration, the digital economy, and other factors exert significant spatial spillover effects on economic resilience [3]. In fact, the free flow of production factors including labor, capital, and technology brings about cross-regional knowledge and technology spillovers, which further strengthens the spatial correlation of innovation activities across regions. Regions with advanced DTI can play a demonstration and leading role, driving neighboring regions to improve production efficiency via technological progress and further promoting imitative innovation in adjacent areas. Accordingly, whether the boosting effect of DTI on UER also has spatial spillover effects deserves further exploration.
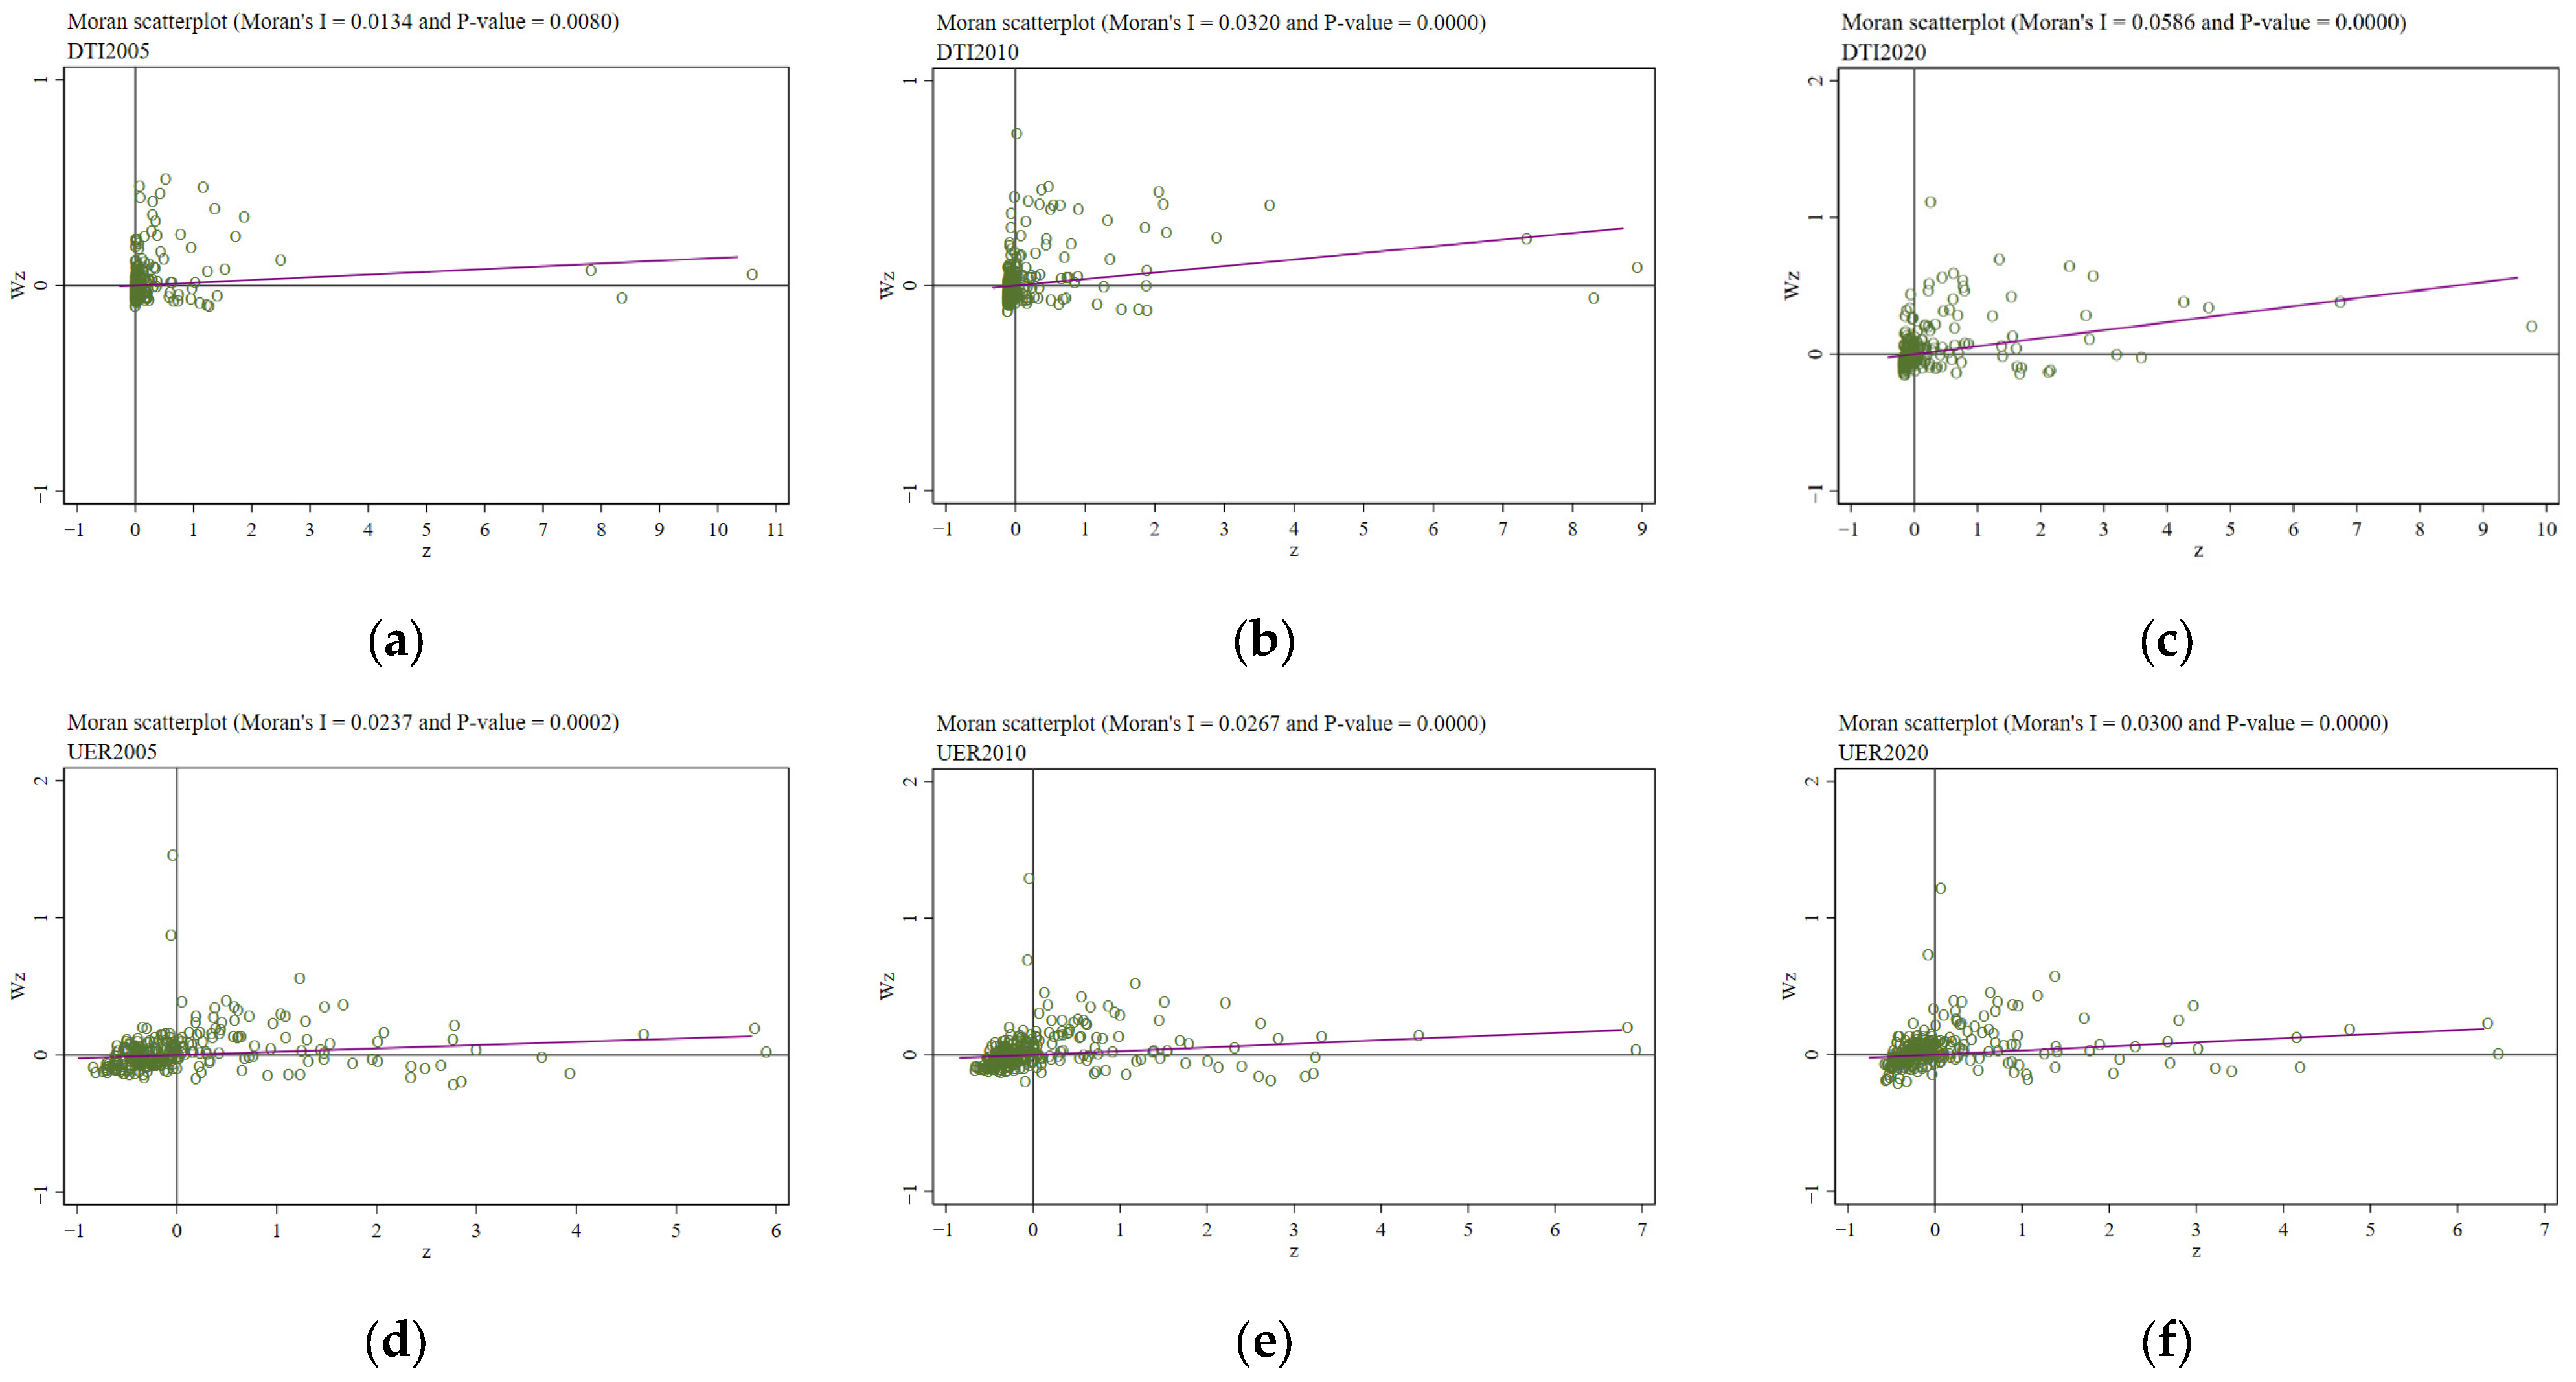
We first conducted the global Moran’s I test for DTI (Pat) and UER (Resilience) across sample cities from 2005 to 2020 to examine their spatial autocorrelation, with results reported in Table 11. The analysis uses an inverse geographic distance matrix, where each element equals the reciprocal of the geographic distance between two spatial units. The results show that the Moran’s I indices of Pat and Resilience are all significant at the 1% level, verifying the presence of spatial dependence for both variables. The positive indices further indicate a significant positive spatial correlation between DTI and UER. Figure 8 presents the Local Moran scatter plots for DTI and UER in 2005, 2010, and 2020. All significantly positive Moran’s I statistics confirm that both variables exhibit stable and intensifying positive spatial agglomeration across Chinese cities, with the clustering effect strengthening over the sample period.
Following the confirmation of spatial autocorrelation, this research conducted a series of model selection tests to investigate the spatial effects between variables more rigorously, with the results presented in Table 12. Based on the LM test, LR test, Hausman test, and other criteria, the optimal model is determined to be the spatial Durbin model (SDM) with both individual and time fixed effects. The SDM is specified as follows:
R e s i l i e n c e i , t = α 0 + ρ W × R e s i l i e n c e i , t + φ 1 W × P a t i , t + β 1 P a t i , t + φ 2 W × C o n t r o l i , t + β 2 C o n t r o l i , t + μ i + δ t + ε i , t    
where ρ denotes the regression coefficient of the spatial lag term of UER, and W represents the inverse geographic distance matrix. φ 1 and φ 2 are the coefficients of the spatial interaction terms for DTI and the control variables, respectively.
As shown in Table 13, the spatial autocorrelation coefficient (Spatial rho) of the SDM is significantly positive at the 1% level, indicating a positive spatial autoregressive effect. This implies that cities with higher UER can enhance the resilience of neighboring regions through spatial spillover effects, supporting the existence of resilience agglomeration.
In spatial econometric models, the impact of the core explanatory variable on the dependent variable can be decomposed into direct and indirect effects. The direct effect reflects the influence of DTI on local UER, while the indirect effect captures the spillover impact of DTI from one city on the UER of others. The estimation results demonstrate that the direct effect of DTI is significantly positive at the 1% level, indicating that local DTI effectively strengthens local UER. In contrast, the indirect effect is significantly negative and suggests a pronounced siphon effect of DTI. Digital related talent equipment and resources tend to flow toward cities with more advanced digital economies. Such flows suppress economic resilience in neighboring regions.

4.8. Discussion of Results

In this research, we innovatively introduced patent-based measurement for DTI and empirically examined its impact on UER. The results confirm that DTI significantly promotes UER, with considerable heterogeneity across cities. These findings support and extend existing theoretical discussions on how technological innovation shapes economic resilience [80,81,82]. They are also in line with the digital transformation-based pathways for high-quality urban economic development and resilience enhancement, identified by Xu [43], Yao [3], and Yin [76], and further enrich empirical literature on DTI and UER. It also provides a basis for formulating differentiated digital development policies for cities at different development levels.
New-type infrastructure construction serves as an important mechanism through which DTI influences UER, a finding supported by Abrardi and Sabatino [1] and Wen [34], who emphasize that developing new-type infrastructure is critical in the digital economy era. Industrial structure upgrading helps strengthen cities’ ability to resist external shocks, as documented in existing studies [11,83]. Our findings corroborate this view and suggest that industrial structure upgrading constitutes another key mechanism through which DTI enhances UER. Furthermore, our results confirm that the talent agglomeration effect fosters a virtuous development cycle via tacit knowledge spillovers, thus improving urban economic stability, a result consistent with previous research [60]. Future research could further explore other potential mechanisms underlying the relationship between DTI and UER. However, regarding the spatial spillover effect of DTI on UER, this research found that DTI tends to exert a siphon effect on neighboring regions, whereas Yao [3] research argues that it also helps improve the UER of surrounding areas. This discrepancy may arise from differences in spatial weight matrix specification and sample coverage, leading to different conclusions on spatial spillover. This not only provides fresh perspectives for future spatial mechanism research but also carries important policy implications for promoting the coordinated regional development of both DTI and UER.

5. Implications

5.1. Practical Implications

DTI has emerged as a pivotal engine for enhancing UER, with substantial untapped potential for further growth. To fully leverage its empowering effect, governments could systematically formulate digital economy development strategies, accelerate the digital transformation of urban economies, and prioritize the deep integration of digital technologies with traditional industries. The sustained investment in R&D for digital technologies could be increased, with a focus on tackling key core technologies and enhancing independent innovation capabilities. Also, the policy environment for digital technology innovation should be improved. Governments can stimulate the innovation vitality of market players with targeted incentives and complete the intellectual property protection system to build a healthy innovation ecosystem. Policy efforts may cultivate an innovation-friendly atmosphere that encourages exploration and tolerates failures. Furthermore, the level of digital technology standards should be comprehensively elevated. Governments could align domestic standards with international norms, which will not only strengthen cities’ core digital competitiveness but also lay a solid technical foundation for UER improvement and provide steady technological momentum to address external uncertainties.
DTI empowers UER through three core channels including new-type infrastructure construction, industrial structure upgrading, and talent agglomeration. The construction of digital infrastructure and platforms could be accelerated. A comprehensive and efficient new-type infrastructure network including 5G, optical fiber, and data centers will be established to consolidate the urban digital foundation and provide stable hardware support for resilience improvement. Digital transformation in the service sector helps deepen integration between manufacturing and modern services. New business models such as platform economy intelligent manufacturing and digital services may be nurtured to bring new impetus for integrated development. In this way the industrial structure could be further optimized and upgraded. Support may also be enhanced for basic research and talent development related to DTI with increased research investment. Closer industry-university-research cooperation led by enterprises may help accelerate the application of digital technology innovations. These efforts may provide steady intellectual support for improving UER.
Given the significant spatial spillover effect of DTI, appropriate differentiated strategies could be designed to fit local conditions. Cities with better digital infrastructure and larger digital economy markets may further leverage their innovation advantages. They could set up regional cooperation mechanisms and strengthen connections with less developed areas. This would help release the technology and knowledge spillover effects of innovation. It may also reduce gaps in UER across regions and support the coordinated improvement of regional resilience. Over time, such coordinated development can foster more integrated urban clusters and enable regions to share digital dividends more evenly. Stable and balanced regional growth will in turn enhance the overall ability to resist external risks and maintain long-term economic stability.

5.2. Theoretical Implications

From a theoretical perspective, this research further validated the explanatory power of Schumpeterian innovation theory, complex adaptive systems theory, and evolutionary resilience theory within the digital economy context. DTI facilitates urban economic systems to adapt to external shocks, reorganize resources, and realize dynamic renewal via creative destruction, thereby offering new theoretical evidence for interpreting the formation of economic resilience. Future research is encouraged to deepen the integration of innovation theory, evolutionary economic geography, and resilience theory, so as to establish a more cohesive and unified analytical paradigm for DTI and UER. Meanwhile, this research identified three interactive transmission channels and further research could explore more potential mechanisms including digital governance, factor allocation efficiency, and industrial chain coordination to build a more systematic and comprehensive analytical framework. In addition, the heterogeneous impacts of DTI on UER demonstrate that the innovation–resilience nexus is context-dependent rather than applicable, which suggests that subsequent studies ought to highlight moderating effects and conditions, and carry out cross-regional and cross-temporal comparative analyses to improve theoretical precision and applicability. Finally, the significant spatial spillover effect of DTI indicates that UER is a spatially interconnected and regionally linked system. Hence, follow-up research should extend the analytical perspective from individual cities to urban agglomerations and national networks and adopt spatial econometric methods to explore the spatial linkage and collaborative mechanisms through which DTI promotes UER.

6. Conclusions

Against the backdrop of the ongoing technological revolution and industrial transformation, digital technology enables cities to better perceive and analyze the structure and dynamics of urban economic systems. Empowered by DTI, cities gain greater proactive adaptation and risk response capabilities, which helps stabilize urban economic operations. Based on this, we examined the impact of DTI on UER and identified the specific mechanisms. The main conclusions are as follows:
Empirical evidence from Chinese cities shows that every 1000 additional digital technology patents increase UER by 0.009, and this conclusion remains robust after a series of tests. Meanwhile, the impact of DTI on UER shows heterogeneity. DTI effectively cushions external shocks and strengthens resilience, especially during the post-2008 financial crisis recovery. The positive effect is stronger in large and central cities, as well as cities with more developed emerging industries, greater R&D investment, and higher public attention to digital development, where faster DTI application further promotes UER.
Regarding the impact mechanism, new-type infrastructure facilitates the integrated development of digital technology and the real economy, which in turn improves the urban economic system’s ability to resist external shocks. Industrial upgrading driven by digital industrialization and the digital transformation of traditional industries optimizes industrial chains and strengthens industrial linkages, helping the economy form a sustainable long-term growth path. Meanwhile, DTI lowers the marginal cost of information transmission, attracts high-quality talent, and provides sustained intellectual support for urban economic development and resilience improvement. Spatial analysis further indicates that DTI improves local UER but generates a siphon effect on neighboring regions.

7. Limitations and Future Work

7.1. Limitations

While this study refined and complemented the research framework of UER from the perspective of technological innovation, it still has limitations. As a dynamic multi-dimensional concept, UER has no authoritative and unified measurement method in academia. The comprehensive index constructed in this research reflects the overall level of UER but fails to distinguish the heterogeneous impacts of DTI on different sub-dimensions of UER and to fully capture its phased dynamic characteristics amid external shocks. Although we identified the spatial spillover effects of DTI on UER, we did not explore in depth the formation mechanism and conditions of these spillover effects from the perspective of knowledge flow, a core feature of DTI. Finally, constrained by data availability, we only empirically tested part of the impact mechanisms of DTI on UER, leaving many potential transmission paths unexplored.

7.2. Future Work

These limitations point to directions for future research. Future studies may further refine the measurement framework of UER and conduct a more in-depth investigation into how DTI shapes UER and its dynamic evolutionary characteristics. Subsequent research can also extend the analysis to the underlying factors, dynamic patterns, and conditions of spatial spillovers linked to DTI. Moreover, future work can explore more potential transmission channels through which digital technology innovation influences urban economic resilience, adopts multi-scale data to gain a clearer understanding of its underlying mechanism, and examines heterogeneity across different city types and development stages.

Author Contributions

Conceptualization, P.W. and D.C.; Data curation, P.W.; Formal analysis, C.W.; Investigation, D.C.; Methodology, P.W.; Project administration, D.C. and C.W.; Resources, P.W.; Software, P.W. and C.W.; Supervision, D.C.; Validation, P.W. and D.C.; Visualization, C.W.; Writing—original draft, P.W.; Writing—review and editing, P.W. and D.C. All authors have read and agreed to the published version of the manuscript.

Funding

The research is supported by the Western Program of the National Social Science Fund of China: Risk Prevention Mechanism and Policy Coordination Research on Urban Energy System Transformation from the Perspective of Digital Technology Innovation (Grant No. 23XGL014).

Data Availability Statement

The data presented in this study are available on request from the corresponding author due to privacy restrictions.

Conflicts of Interest

The authors declare no conflicts of interest.

Abbreviations

The following abbreviations are used in this manuscript:
UERUrban Economic Resilience
DTIDigital Technology Innovation
ICTInformation and Communication Technology

Appendix A

The parallel trend assumption that the treatment group and the control group are in line is the prerequisite for the application of the difference-in-differences (DID) method. That is, before the implementation of the smart city pilot policy, the economic resilience of the pilot cities and that of the non-pilot cities remained relatively stable, and there was no significant difference. As shown in Figure A1, the “0” on the vertical axis represents the period when the policy was implemented, and the periods before the implementation are represented by negative numbers, while the periods after the implementation are represented by positive numbers. It can be seen that before the implementation of the policy, there was no significant difference in economic resilience between the treatment group and the control group, and the research sample passed the parallel trend test. In addition, after the policy was implemented, the policy effect showed an upward trend and the estimated coefficient was significant, indicating that the smart city pilot policy had a positive effect on the economic resilience of cities.
Figure A1. Parallel trend test of China’s smart city pilot policy.
Land 15 00679 g0a1

References

  1. Abrardi, L.; Sabatino, L. Ultra-broadband investment and economic resilience: Evidence from the Covid-19 pandemic. Telecommun. Policy 2023, 47, 102480. [Google Scholar] [CrossRef] [Scilit] [PubMed]
  2. Zhang, Y.; Liu, Q.; Li, X.; Zhang, X.; Qiu, Z. Spatial-temporal evolution characteristics and critical factors identification of urban resilience under public health emergencies. Sustain. Cities Soc. 2024, 102, 105221. [Google Scholar] [CrossRef] [Scilit]
  3. Yao, J.; Fu, Y.; Wu, J. How cities navigate crisis: A process model for urban resilience development during pandemic. Cities 2025, 167, 106374. [Google Scholar] [CrossRef] [Scilit]
  4. Yuan, Z.; Hu, W. Urban resilience to socioeconomic disruptions during the COVID-19 pandemic: Evidence from China. Int. J. Disaster Risk Reduct. 2023, 91, 103670. [Google Scholar] [CrossRef] [Scilit]
  5. Martin, R. Regional economic resilience, hysteresis and recessionary shocks. J. Econ. Geogr. 2012, 12, 1–32. [Google Scholar] [CrossRef] [Scilit]
  6. Kimhi, S.; Marciano, H.; Eshel, Y.; Adini, B. Community and national resilience and their predictors in face of terror. Int. J. Disaster Risk Reduct. 2020, 50, 101746. [Google Scholar] [CrossRef] [Scilit]
  7. Zamfir, E.M.; Balaban, G.; Marinescu, C. Economic resilience in Central and Eastern European countries. Theor. Appl. Econ. 2022, 29, 5–26. Available online: https://doaj.org/article/ab5d9206f3d64bc199fbfae5ee1cc008 (accessed on 18 March 2026).
  8. Gafter, L.; Tchetchik, A.; Shilo, S. Urban resilience as a mitigating factor against economically driven out-migration during COVID-19: The case of Eilat, a tourism-based city. Cities 2022, 125, 103636. [Google Scholar] [CrossRef] [Scilit]
  9. Xu, Q.; Zhong, M.; Dong, Y. Digital economy and risk response: How the digital economy affects urban resilience. Cities 2024, 155, 105397. [Google Scholar] [CrossRef] [Scilit]
  10. Holm, J.R.; Østergaard, C.R. Regional Employment Growth, Shocks and Regional Industrial Resilience: A Quantitative Analysis of the Danish ICT Sector. Reg. Stud. 2015, 49, 95–112. [Google Scholar] [CrossRef] [Scilit]
  11. Tan, J.; Hu, X.; Hassink, R.; Ni, J. Industrial structure or agency: What affects regional economic resilience? Evidence from resource-based cities in China. Cities 2020, 106, 102906. [Google Scholar] [CrossRef] [Scilit]
  12. Papaioannou, S.K. ICT and economic resilience: Evidence from the COVID-19 pandemic. Econ. Model. 2023, 128, 106500. [Google Scholar] [CrossRef] [Scilit]
  13. Zhou, Q.; Qi, P. Urban economic resilience and human capital: An exploration of heterogeneity and mechanism in the context of spatial population mobility. Sustain. Cities Soc. 2023, 99, 104983. [Google Scholar] [CrossRef] [Scilit]
  14. Ma, D.; Zhu, Q. Innovation in emerging economies: Research on the digital economy driving high-quality green development. J. Bus. Res. 2022, 145, 801–813. [Google Scholar] [CrossRef] [Scilit]
  15. Gu, J. Sharing economy, technological innovation and carbon emissions: Evidence from Chinese cities. J. Innov. Knowl. 2022, 7, 100228. [Google Scholar] [CrossRef] [Scilit]
  16. CAICT (China Academy of Information and Communications Technology). Research Report on the Development of China’s Digital Economy 2024. Available online: https://www.caict.ac.cn/english/research/whitepapers/202411/t20241129_645879.html (accessed on 18 March 2026).
  17. You, M.; Wang, B.; Zhao, J.; Huang, H. Pathway to carbon reduction in China: The role of coupling synergies of the digital economy and green finance. Econ. Anal. Policy 2025, 86, 258–273. [Google Scholar] [CrossRef] [Scilit]
  18. NDA (National Data Administration of China). Digital China Development Report 2024. Available online: https://www.nda.gov.cn/sjj/ywpd/sjzg/0530/20250530151342718164521_pc.html (accessed on 18 March 2026).
  19. Zheng, J.; Guo, M.; Lo, K. Shaping sustainability: Circular economy development through digital technology innovation. J. Innov. Knowl. 2025, 10, 100784. [Google Scholar] [CrossRef] [Scilit]
  20. Ghimire, A.; Ali, S.; Long, X.; Chen, L.; Sun, J. Effect of Digital Silk Road and innovation heterogeneity on digital economy growth across 29 countries: New evidence from PSM-DID. Technol. Forecast. Soc. Change 2024, 198, 122987. [Google Scholar] [CrossRef] [Scilit]
  21. Chen, K.; Zhao, S.; Jiang, G.; He, Y.; Li, H. The green innovation effect of the digital economy. Int. Rev. Econ. Financ. 2025, 99, 103970. [Google Scholar] [CrossRef] [Scilit]
  22. Chen, Z.; Xing, R. Digital economy, green innovation and high-quality economic development. Int. Rev. Econ. Financ. 2025, 99, 104029. [Google Scholar] [CrossRef] [Scilit]
  23. Holling, C.S. Resilience and Stability of Ecological Systems. Annu. Rev. Ecol. Syst. 1973, 4, 1–23. [Google Scholar] [CrossRef] [Scilit]
  24. Reggiani, A.; De Graaff, T.; Nijkamp, P. Resilience: An Evolutionary Approach to Spatial Economic Systems. Netw. Spat. Econ. 2002, 2, 211–229. [Google Scholar] [CrossRef] [Scilit]
  25. Sutton, J.; Arcidiacono, A.; Torrisi, G.; Arku, R. Regional economic resilience: A scoping review. Prog. Hum. Geogr. 2023, 47, 500–532. [Google Scholar] [CrossRef] [Scilit]
  26. Simmie, J.; Martin, R. The economic resilience of regions: Towards an evolutionary approach. Camb. J. Reg. Econ. Soc. 2010, 3, 27–43. [Google Scholar] [CrossRef] [Scilit]
  27. Martin, R.; Sunley, P. On the notion of regional economic resilience: Conceptualization and explanation. J. Econ. Geogr. 2015, 15, 1–42. [Google Scholar] [CrossRef] [Scilit]
  28. Martin, R.; Sunley, P. Path dependence and regional economic evolution. J. Econ. Geogr. 2006, 6, 395–437. [Google Scholar] [CrossRef] [Scilit]
  29. Xu, J.; Yang, B.; Yuan, C. The impact of supply chain digitalization on urban resilience: Do industrial chain resilience, green total factor productivity and innovation matter? Energy Econ. 2025, 145, 108443. [Google Scholar] [CrossRef] [Scilit]
  30. Pendall, R.; Foster, K.A.; Cowell, M. Resilience and regions: Building understanding of the metaphor. Camb. J. Reg. Econ. Soc. 2010, 3, 71–84. [Google Scholar] [CrossRef] [Scilit]
  31. Corodescu-Roșca, E.; Hamdouch, A.; Iațu, C. Innovation in urban governance and economic resilience. The case of two Romanian regional metropolises: Timișoara and Cluj Napoca. Cities 2023, 132, 104090. [Google Scholar] [CrossRef] [Scilit]
  32. Pal, S.; Bandyopadhyay, S. Assessing vulnerabilities and resilience in the Indian Sundarbans: A case study of gosaba C.D block, West Bengal, India. Int. J. Disaster Risk Reduct. 2024, 111, 104699. [Google Scholar] [CrossRef] [Scilit]
  33. Wang, K.; Jiang, W.; Miao, Z. Impact of high-speed railway on urban resilience in China: Does urban innovation matter? Socio-Econ. Plan. Sci. 2023, 87, 101607. [Google Scholar] [CrossRef] [Scilit]
  34. Wen, H.; Liu, Y.; Zhou, F. New-type infrastructure and urban economic resilience: Evidence from China. Int. Rev. Econ. Financ. 2024, 96, 103560. [Google Scholar] [CrossRef] [Scilit]
  35. Li, R.; Xu, M.; Zhou, H. Impact of high-speed rail operation on urban economic resilience: Evidence from local and spillover perspectives in China. Cities 2023, 141, 104498. [Google Scholar] [CrossRef] [Scilit]
  36. Kakderi, C.; Tasopoulou, A. Regional economic resilience: The role of national and regional policies. Eur. Plan. Stud. 2017, 25, 1435–1453. [Google Scholar] [CrossRef] [Scilit]
  37. Tóth, G.; Elekes, Z.; Whittle, A.; Lee, C.; Kogler, D.F. Technology Network Structure Conditions the Economic Resilience of Regions. Econ. Geogr. 2022, 98, 355–378. [Google Scholar] [CrossRef] [Scilit]
  38. Yoo, Y.; Boland, R.J.; Lyytinen, K.; Majchrzak, A. Organizing for Innovation in the Digitized World. Organ. Sci. 2012, 23, 1398–1408. [Google Scholar] [CrossRef] [Scilit]
  39. Holmström, J. Recombination in digital innovation: Challenges, opportunities, and the importance of a theoretical framework. Inf. Organ. 2018, 28, 107–110. [Google Scholar] [CrossRef] [Scilit]
  40. Hund, A.; Wagner, H.Z.; Beimborn, D.; Weitzel, T. Digital innovation: Review and novel perspective. J. Strateg. Inf. Syst. 2021, 30, 101695. [Google Scholar] [CrossRef] [Scilit]
  41. Liu, Y.; Dong, J.; Mei, L.; Shen, R. Digital innovation and performance of manufacturing firms: An affordance perspective. Technovation 2023, 119, 102458. [Google Scholar] [CrossRef] [Scilit]
  42. Tsou, H.T.; Chen, J.S. How does digital technology usage benefit firm performance? Digital transformation strategy and organisational innovation as mediators. Technol. Anal. Strateg. Manag. 2021, 35, 1114–1127. [Google Scholar] [CrossRef] [Scilit]
  43. Xu, S.; Zhong, M.; Wang, Y. Can innovative industrial clusters enhance urban economic resilience? A quasi-natural experiment based on an innovative pilot policy. Energy Econ. 2024, 134, 107544. [Google Scholar] [CrossRef] [Scilit]
  44. Argyroudis, S.A.; Mitoulis, S.A.; Chatzi, E.; Baker, J.W.; Brilakis, I.; Gkoumas, K.; Vousdoukas, M.; Hynes, W.; Carluccio, S.; Keou, O.; et al. Digital technologies can enhance climate resilience of critical infrastructure. Clim. Risk Manag. 2021, 35, 100387. [Google Scholar] [CrossRef] [Scilit]
  45. Birkel, H.; Hohenstein, N.; Hähner, S. How have digital technologies facilitated supply chain resilience in the COVID-19 pandemic? An exploratory case study. Comput. Ind. Eng. 2023, 183, 109538. [Google Scholar] [CrossRef] [Scilit]
  46. Nambisan, S.; Lyytinen, K.; Majchrzak, A.; Song, M. Digital innovation management: Reinventing innovation management research in a digital world. MIS Q. 2017, 41, 223–238. [Google Scholar] [CrossRef] [Scilit]
  47. Tao, F.; Zhu, P.; Qiu, C.; Wang, X. The Impact of DTI on Enterprise Market Value. J. Quant. Technol. Econ. 2023, 40, 68–91. [Google Scholar]
  48. Mossberger, K.; Martini, N.F.; McCullough, M.; Tolbert, C. Digital economic activity and resilience for metros and small businesses during Covid-19. Small Bus. Econ. 2023, 60, 1699–1717. [Google Scholar] [CrossRef] [Scilit]
  49. Wu, S.; Li, J. The future of cities in the digital economy era: A study on the impact of internet on the agglomeration of producer services in Chinese Cities. China Econ. Q. Int. 2024, 4, 107–118. [Google Scholar] [CrossRef] [Scilit]
  50. Abuljadail, M.; Khalil, A.; Talwar, S.; Kaur, P. Big data analytics and e-governance: Actors, opportunities, tensions, and applications. Technol. Forecast. Soc. Change 2023, 193, 122612. [Google Scholar] [CrossRef] [Scilit]
  51. Cong, L.W.; Xie, D.; Zhang, L. Knowledge Accumulation, Privacy, and Growth in a Data Economy. Manag. Sci. 2021, 67, 6480–6492. [Google Scholar] [CrossRef] [Scilit]
  52. Grabner, S.M.; Tsvetkova, A. Urban labour market resilience during the Covid-19 pandemic: What is the promise of teleworking? Reg. Stud. 2022, 57, 2521–2536. [Google Scholar] [CrossRef] [Scilit]
  53. Freeman, C.; Perez, C. Structural Crises of Adjustment: Business Cycles and Investment Behaviour. In Technical Change and Economic Theory; Pinter Publishers: London, UK; New York, NY, USA, 1988. [Google Scholar]
  54. Boschma, R. Towards an Evolutionary Perspective on Regional Resilience. Reg. Stud. 2014, 49, 733–751. [Google Scholar] [CrossRef] [Scilit]
  55. Zhang, J.; Gong, X.; Cheng, M. Broadband cities: Bridging urban-rural consumption gap with digital innovation. Cities 2025, 167, 106315. [Google Scholar] [CrossRef] [Scilit]
  56. Ma, R.; Lin, Y.; Lin, B. Does digitalization support green transition in Chinese cities? Perspective from Metcalfe’s Law. J. Clean. Prod. 2023, 425, 138769. [Google Scholar] [CrossRef] [Scilit]
  57. Cui, X.; Li, Y.; Li, X.; Fang, S. Livestream e-commerce in a platform supply chain: A product-fit uncertainty reduction perspective. Int. J. Prod. Econ. 2023, 258, 108796. [Google Scholar] [CrossRef] [Scilit]
  58. Mallick, S.K.; Das, P.; Maity, B.; Rudra, S.; Pramanik, M.; Pradhan, B.; Sahana, M. Understanding future urban growth, urban resilience and sustainable development of small cities using prediction-adaptation-resilience (PAR) approach. Sustain. Cities Soc. 2021, 74, 103196. [Google Scholar] [CrossRef] [Scilit]
  59. Heo, P.S.; Lee, D.H. Evolution of the linkage structure of ICT industry and its role in the economic system: The case of Korea. Inf. Technol. Dev. 2018, 25, 424–454. [Google Scholar] [CrossRef] [Scilit]
  60. Xu, Q.; Zhong, M.; Li, X. How does digitalization affect energy? International evidence. Energy Econ. 2022, 107, 105879. [Google Scholar] [CrossRef] [Scilit]
  61. Acemoglu, D.; Restrepo, P. The Race between Man and Machine: Implications of Technology for Growth, Factor Shares, and Employment. Am. Econ. Rev. 2018, 108, 1488–1542. [Google Scholar] [CrossRef] [Scilit]
  62. Wu, B.; Yang, W. Empirical test of the impact of the digital economy on China’s employment structure. Financ. Res. Lett. 2022, 49, 103047. [Google Scholar] [CrossRef] [Scilit]
  63. Wooldridge, J.M. Introductory Econometrics: A Modern Approach, 6th ed.; Cengage Learning: Boston, MA, USA, 2016. [Google Scholar]
  64. Yi, C.; Fan, Z.; Gu, X.; Zhou, L. Arrival of Young Talent: The Send-Down Movement and Rural Education in China. Am. Econ. Rev. 2020, 110, 3393–3430. [Google Scholar] [CrossRef] [Scilit]
  65. Doran, J.; Fingleton, B. US Metropolitan Area Resilience: Insights from dynamic spatial panel estimation. Environ. Plan. A Econ. Space 2017, 50, 111–132. [Google Scholar] [CrossRef] [Scilit]
  66. Chen, M. An international literature review of regional economic resilience: Theories and practices based on the evolutionary perspective. Prog. Geogr. 2017, 36, 1435–1444. [Google Scholar]
  67. Gao, Q.; Sun, M.; Chen, L. The impact of digital inclusive finance on agricultural economic resilience. Financ. Res. Lett. 2024, 66, 105679. [Google Scholar] [CrossRef] [Scilit]
  68. Briguglio, L.; Cordina, G.; Bugeja, S.; Farrugia, N. Conceptualizing And Measuring Economic Resilience. In Pacific Islands Regional Integration and Governance; Building the Economic Resilience of Small States; ANU Press: Canberra, Australia, 2005; pp. 265–288. [Google Scholar]
  69. Huang, H.; Mbanyele, W.; Zhang, L.; Chen, X.; Song, M. Nonnegligible transition risks towards net-zero economy: Lessons from green finance initiatives in China. J. Environ. Manag. 2025, 375, 124132. [Google Scholar] [CrossRef] [Scilit]
  70. Song, M.; Peng, J.; Wang, J.; Zhao, J. Environmental efficiency and economic growth of China: A Ray slack-based model analysis. Eur. J. Oper. Res. 2018, 269, 51–63. [Google Scholar] [CrossRef] [Scilit]
  71. Ando, S.; Nassar, K.B. Indexing Structural Distortion: Sectoral Productivity Structural Change and Growth; International Monetary Fund Research Paper Series; International Monetary Fund: Washington, DC, USA, 2017. [Google Scholar]
  72. Zhou, R.; Wu, Y.; Ma, X. The Impact of External Transportation Infrastructure Improvements on the Urban Economic Resilience: Empirical Evidence from China’s High-speed Rail. Urban Dev. Stud. 2024, 31, 64–71. [Google Scholar]
  73. Holl, A. Local employment growth patterns and the Great Recession: The case of Spain. J. Reg. Sci. 2018, 58, 837–863. [Google Scholar] [CrossRef] [Scilit]
  74. Cellini, R.; Cuccia, T. Do behaviours in cultural markets affect economic resilience? An analysis of Italian regions. Eur. Plan. Stud. 2019, 27, 784–801. [Google Scholar] [CrossRef] [Scilit]
  75. Kou, L.; Zhao, H.; Yang, Z.; Li, X.; Zhang, Y.; Liang, J.; Qiu, H.; Zhang, Y. Regional medical resource synergistic security resilience assessment based on city network: A case study of YRD, PRD, and BTH. Cities 2024, 153, 105277. [Google Scholar] [CrossRef] [Scilit]
  76. Yin, S.; Shi, R.; Wu, N.; Yang, J. Measuring the impact of technological innovation on urban resilience through explainable machine learning: A case study of the Yangtze River Delta region, China. Sustain. Cities Soc. 2025, 127, 106457. [Google Scholar] [CrossRef] [Scilit]
  77. Fenske, J.; Kala, N.; Wei, J. Railways and cities in India. J. Dev. Econ. 2023, 161, 103038. [Google Scholar] [CrossRef] [Scilit]
  78. Wang, Z.; Hao, Y. Can smart cities improve energy resilience? Evidence from 229 cities in China. Sustain. Cities Soc. 2024, 117, 105971. [Google Scholar] [CrossRef] [Scilit]
  79. Popp, D. Lessons from patents: Using patents to measure technological change in environmental models. Ecol. Econ. 2005, 54, 209–226. [Google Scholar] [CrossRef] [Scilit]
  80. Schumpeter, J.A. Business Cycles: A Theoretical, Historical and Statistical Analysis of the Capitalist Process; McGraw-Hill: New York, NY, USA, 1939. [Google Scholar]
  81. Liu, Z.; Fang, C.; Liao, X.; Fan, R.; Sun, B.; Mu, X. Adaptation and adaptability: Deciphering urban resilience from the evolutionary perspective. Environ. Impact Assess. Rev. 2023, 103, 107266. [Google Scholar] [CrossRef] [Scilit]
  82. Christopherson, S.; Michie, J.; Tyler, P. Regional resilience: Theoretical and empirical perspectives. Camb. J. Reg. Econ. Soc. 2010, 3, 3–10. [Google Scholar] [CrossRef] [Scilit]
  83. Tang, D.; Li, J.; Zhao, Z.; Boamah, V.; Lansana, D. The influence of industrial structure transformation on urban resilience based on 110 prefecture-level cities in the Yangtze River. Sustain. Cities Soc. 2023, 96, 104621. [Google Scholar] [CrossRef] [Scilit]
Figure 1. The four dimensions of economic resilience to shocks.
Land 15 00679 g001
Figure 2. Analysis Framework.
Land 15 00679 g002
Figure 3. The internal structure and total growth rate of DTI in China, 2005–2020.
Land 15 00679 g003
Figure 4. LISA cluster maps for DTI across Chinese cities in 2005 (a), 2010 (b) and 2020 (c).
Land 15 00679 g004
Figure 5. Spatial distribution of UER across Chinese cities in 2005 (a), 2010 (b), and 2020 (c).
Land 15 00679 g005
Figure 6. LISA cluster maps for UER across Chinese cities in 2005 (a), 2010 (b), and 2020 (c).
Land 15 00679 g006
Figure 7. The scatterplot of digital technology patents and UER.
Land 15 00679 g007
Figure 8. Local Moran scatter plots for DTI and UER in 2005, 2010, and 2020. Among them, the local Moran scatter plots of DTI cover 2005 (a), 2010 (b) and 2020 (c), while those of UER include 2005 (d), 2010 (e) and 2020 (f).
Land 15 00679 g008
Table 1. The index system for measuring UER.
IndexSub IndexSpecific IndicatorUnitProperties
UERResistance and recovery abilityGDP per capitaYuan/person+
Per capita disposable income of residentYuan+
Total savings of the resident108 Yuan+
Unemployment104 Person
The import/export trade volume proportion%
Organizational and adjustment abilityThe fiscal revenue-to-expenditure ratio%+
Total retail sales of consumer goods104 Yuan+
The proportion of the tertiary industry%+
Deposit-to-loan ratio of financial institution%+
Fixed assets investment104 Yuan+
Renewal and development capacityUrbanization rate%+
The student population in higher education institutionsPerson+
Science and technology expenditure104 Yuan+
Education expenditure104 Yuan+
Table 2. The index system for measuring new-type infrastructure construction.
IndexSub IndexSpecific Indicator
InputCapital stock for new-type infrastructureInformation infrastructure: investment in information transmission software and information technology services
Fusion infrastructure: investment in electricity, heat production and supply and transportation, storage and postal services multiplied by the integration factor
Innovation infrastructure: investment in scientific research and technological services
Labor for new-type infrastructureInformation infrastructure: employees in information transmission software and information technology services
Fusion infrastructure: employees in electricity, heat production and supply and transportation, storage and postal services multiplied by the integration factor
Innovation infrastructure: employees in scientific research and technological services
Technical for new-type infrastructurePatents grantedNew generation communication technology; Extra-high voltage; rail transportation; industrial Internet; charging pile; data center; AI
OutputAIIndustrial robots
Data centerInternet broadband subscriptions; rack standards
Mobile communications3G, 4G/5G mobile users; telecom services revenue
Rail transportationMileage of rail transportation
Energy transmissionTotal electricity consumption multiplied by the power transmission loss rate
Environment variableFinanceDeposit-to-loan ratio of financial institution
TalentRatio of the university students to the resident population
GovernmentUrban investment bonds
EconomyGDP
Table 3. Summary statistics for key variables.
VariableObsMeanStd. DevMinMax
Resilience42240.07060.06780.00990.7272
Pat42241.18773.80070.000067.6100
New_Infra34190.72360.19400.12271.0000
TA_Indus42240.96480.53880.12865.3500
TS_Indus42240.23740.12900.00530.9307
Peo_Aggre39600.02840.02180.00080.7424
fdi42240.87400.58890.00023.0341
road42242.71970.42600.32934.1120
buid42244.47120.85871.94597.3563
book42243.61860.88060.69319.1545
mec42249.53150.72406.846912.0862
Table 4. The results of DTI affecting UER.
VariableDep. Var: Resilience
(1)(2)(3)(4)
Pat0.0148 ***0.0091 ***0.0093 ***0.0090 ***
(7.042)(9.780)(6.174)(9.826)
fdi 0.0050 ***0.0034 ***
(3.330)(2.995)
road −0.0007−0.0057 **
(−0.206)(−1.991)
buid 0.0168 ***0.0021
(6.696)(0.383)
book 0.0099 ***−0.0019
(5.840)(−1.363)
mec 0.0231 ***0.0115 ***
(6.458)(2.783)
Constant0.0530 ***0.0597 ***−0.2746 ***−0.0398
(26.061)(53.868)(−9.279)(−0.902)
Observations4224422442244224
R-squared0.6880.9540.8600.955
ControlsNoNoYesYes
City FENoYesNoYes
Year FENoYesNoYes
All regressions were clustered by city; Robust t-statistics in parentheses; * p < 0.1, ** p < 0.05, *** p < 0.01. The same applies below.
Table 5. The regression results of different types of DTI affecting UER.
VariableDep. Var: Resilience
(1)(2)(3)(4)
Di_manu0.0124 ***
(8.910)
Di_serv 1.0892 ***
(3.978)
Di_appl 0.0235 ***
(4.054)
Di_driv 0.0358 ***
(3.660)
Observations4224422442244224
R-squared0.9550.9160.9250.917
ControlsYesYesYesYes
City FEYesYesYesYes
Year FEYesYesYesYes
Table 6. Estimation results of dealing with endogeneity issues.
VariableIVDID
(1)(2)(3)(4)(5)
PatResiliencePatResilienceResilience
Inter0.0019 ***
(4.462)
Spher −0.1190 ***
(−4.440)
Pat 0.0164 *** 0.0132 ***
(6.587) (8.149)
TreatxPost 0.0100 *
(1.969)
Observations42244224422442244224
ControlsYesYesYesYesYes
City FEYesYesYesYesYes
Year FEYesYesYesYesYes
Kleibergen–Paap Wald rk F statistic19.91
[16.38]
19.71
[16.38]
Table 7. Estimation results with replacement of core variables.
VariableIndependent Variable SubstitutionDependent Variable Substitution
(1)(2)(3)(4)
ResilienceResilienceRes_EcoL.Resilience
Pat_apply0.0102 ***
(7.244)
Kit 0.0109 ***
(3.239)
Pat 0.1165 *0.0087 ***
(1.809)(9.558)
Observations4224422439603960
R-squared0.9640.8880.0610.956
ControlsYesYesYesYes
City FEYesYesYesYes
Year FEYesYesYesYes
Table 8. Estimation results with the sample range adjustment.
VariableWinsorizationShorten the Sample Period
(1)(2)(3)(4)
1%_Resilience2%_ResilienceResilienceResilience
Pat0.0102 ***0.0105 ***0.0087 ***0.0064 ***
(11.623)(15.856)(9.074)(4.043)
Observations4224422441602640
R-squared0.9660.9700.9610.968
ControlsYesYesYesYes
City FEYesYesYesYes
Year FEYesYesYesYes
Table 9. Estimation results with heterogeneity.
VariableDep. Var: Resilience
(1)(2)(3)(4)(5)(6)(7)
Size × Pat0.0393 ***
(3.512)
Central × Pat 0.0047 ***
(3.717)
Period × Pat 0.0030 ***
(7.386)
Newfirm × Pat 0.0150 ***
(3.851)
RD_tal × Pat 0.0144 **
(2.158)
RD_exp × Pat 0.0200 ***
(3.231)
Attention × Pat 0.0238 ***
(4.333)
Observations4224422434324224422442244224
R-squared0.9550.9580.9670.9550.9450.9460.955
ControlsYesYesYesYesYesYesYes
City FEYesYesYesYesYesYesYes
Year FEYesYesYesYesYesYesYes
Table 10. Estimation results in mechanism analysis.
Variable(1)(2)(3)(4)
New_InfraTA_IndusTS_IndusPeo_Aggre
Pat0.0147 ***0.0127 **0.9406 ***0.0672 ***
(5.588)(2.485)(5.476)(4.902)
Observations3419422442243960
R-squared0.7900.8460.7640.610
ControlsYesYesYesYes
City FEYesYesYesYes
Year FEYesYesYesYes
Table 11. Moran’s I indices for DTI and UER.
YearPatResilienceYearPatResilience
20050.0134 ***
(2.6522)
0.0237 ***
(3.6881)
20130.0268
(4.5492)
0.0268
(4.3577)
20060.0138***
(2.7713)
0.0289 ***
(4.3904)
20140.0244
(4.2497)
0.0244
(4.0998)
20070.0133 ***
(2.7288)
0.0299 ***
(4.5650)
20150.0309
(5.0249)
0.0309
(4.2183)
20080.0152 ***
(2.9383)
0.0297 ***
(4.5359)
20160.0363
(5.7183)
0.0363
(4.4041)
20090.0218 ***
(3.8284)
0.0292 ***
(4.4879)
20170.0474
(7.2145)
0.0474
(4.5735)
20100.0320 ***
(5.2057)
0.0267 ***
(4.1555)
20180.0552
(8.3209)
0.0552
(4.5215)
20110.0341 ***
(5.4646)
0.0286 ***
(4.4018)
20190.0585
(8.8205)
0.0585
(4.4415)
20120.0355 ***
(5.6224)
0.0271 ***
(4.2049)
20200.0586
(8.9182)
0.0586
(4.5882)
Z-statistics are reported in parentheses.
Table 12. Spatial econometric model selection results.
Testp-ValueStatistic
LM_Spatial error0.00037.252
Robust_LM_Spatial error0.000970.985
LM_Spatial lag0.000694.949
Robust_LM_Spatial lag0.000348.387
Hausman test0.00071.77
LR test for individual fixed effects0.00022.73
LR test for time fixed effects0.0003892.54
Table 13. Spatial spillover effects of DTI on UER.
VariableDep. Var: Resilience
The Inverse Geographic Distance Matrix
Pat0.0075 ***
(60.53)
W × Pat−0.0055 ***
(−4.17)
Observations4224
ControlsYes
Direct0.0075 ***
(61.07)
Indirect−0.0046 ***
(−2.61)
Total0.0030 *
(1.72)
Spatial rho0.3099 ***
(3.27)
Log-likelihood1.2 × 104
R-squared0.7927
Disclaimer/Publisher’s Note: The statements, opinions and data contained in all publications are solely those of the individual author(s) and contributor(s) and not of MDPI and/or the editor(s). MDPI and/or the editor(s) disclaim responsibility for any injury to people or property resulting from any ideas, methods, instructions or products referred to in the content.