Article

Research on Urban Functional Zone Identification and Spatial Interaction Characteristics in Lhasa Based on Ride-Hailing Trajectory Data

1
School of Ecology and Environment, Xizang University, Lhasa 850000, China
2
School of Engineering, Xizang University, Lhasa 850000, China
3
School of Science, Xizang University, Lhasa 850000, China
4
School of Economics and Management, Xizang University, Lhasa 850000, China
*
Author to whom correspondence should be addressed.
Land 2026, 15(4), 677; https://doi.org/10.3390/land15040677
Submission received: 20 March 2026 / Revised: 16 April 2026 / Accepted: 17 April 2026 / Published: 20 April 2026

Abstract

Accurately identifying urban functional zones and revealing their spatial interaction characteristics is crucial for understanding urban operational mechanisms and optimizing spatial layouts. Addressing the limitations of traditional research in simultaneously capturing static functional attributes and dynamic resident travel behaviors, this study takes the central urban area of Lhasa as the research object, integrating ride-hailing trajectory data with Point of Interest (POI) data to conduct research on urban functional zone identification and spatial interaction characteristics. First, Thiessen polygons were used to quantify the spatial influence range of POIs, and an address matching algorithm was employed to associate ride-hailing origins and destinations (ODs) with POIs. A weighted land use intensity index was constructed, and functional zones were precisely identified using information entropy and K-Means clustering. Secondly, with basic research units as nodes and OD flows as edges, a directed weighted spatial interaction network was constructed. Complex-network indicators and the Infomap community detection algorithm were utilized to analyze network characteristics, node importance, and community interaction patterns. The results show that: (1) The functional mixing degree in the study area exhibits a pattern of “highly composite core, relatively differentiated periphery.” Eight functional zone types, including commercial–residential mixed, science–education–culture, and transportation service zones, were ultimately identified. Residential areas form the base, while the core area features multi-functional agglomeration. (2) The spatial interaction network exhibits typical small-world effects, while its degree distribution is better characterized by a lognormal distribution rather than a power law. Node importance is dominated by betweenness centrality, with Lhasa Station, the Potala Palace, and core commercial areas constituting key hubs. (3) The network can be divided into four functionally coupled communities: the core multi-functional area, the western industry–residence integrated area, the eastern science–education-dominated area, and the southern transportation hub area, forming a “core leading, two wings supporting” center–subcenter spatial organization pattern. This study verifies the effectiveness of integrating trajectory and POI data for identifying urban functional zones and provides a new perspective for understanding the spatial structure and planning of plateau cities.

1. Introduction

Urban spatial structure is the projection of a city’s economic and social activities onto the land, and urban functional zones are the basic units carrying these activities. Accurately identifying urban functional zones and revealing their dynamic spatial interaction characteristics holds significant theoretical and practical importance for understanding urban operational mechanisms, optimizing territorial spatial patterns, and enhancing refined management levels [1,2]. Traditional urban spatial research often relies on static land use surveys or macro-level statistical yearbook data, making it difficult to capture the dynamic usage of urban space over time and especially challenging to depict the complex connections between functional zones caused by the flow of people and goods [3,4,5]. In recent years, with the development of mobile positioning technologies, various multi-source geospatial data have emerged, including Points of Interest (POIs), mobile phone signaling data, social media check-in data, urban meteorological data, bus smart card data, and ride-hailing trajectory data [6,7,8,9,10,11]. POI (Point of Interest) data not only records the spatial locations of urban entities but also implies their functional categories and service scopes, enabling the identification of functional attributes of urban space at a micro-scale [12,13,14]. Ride-hailing trajectory data offers a new perspective for urban spatial research, characterized by wide coverage, high sampling frequency, strong real-time capability, and rich semantic information [15,16]. The origins and destinations (ODs) recorded in each trip reflect residents’ actual needs for transitioning between different functional spaces such as residence, work, and leisure, revealing areas of human activity and the actual usage status of urban space [17,18,19].
Lhasa City, located in the central part of the Qinghai–Tibet Plateau, is the capital of the Tibet Autonomous Region. It governs three municipal districts: Chengguan District, Doilungdêqên District, and Dagzê District. According to the “2025 Annual Monitoring Report on Road Network Density and Operation Status in Major Chinese Cities (https://www.rmgjzz.com.cn/newsinfo/10761988.html (accessed on 3 April 2026))” the peak-hour traffic congestion index in Lhasa’s commuting period is as high as 1.278, with an average speed of only 20.60 km/h, indicating moderate congestion levels. Traffic congestion not only reduces the efficiency of the transportation system but also affects residents’ travel efficiency and quality of life [20,21]. Against the backdrop of urban expansion and increased population mobility, deeply exploring the characteristics of residents’ travel behavior and their intrinsic relationship with land use and urban spatial structure has become a key prerequisite for optimizing transportation planning and enhancing urban operational efficiency.
This study selects ride-hailing trajectory data as the primary data source, supplemented by POI data. By matching the origins and destinations of ride-hailing trips with POI address information, access weights are assigned to POIs, thereby identifying functional attributes within the study area. On this basis, an urban spatial interaction network is further constructed to analyze the spatial connections and interaction characteristics between different functional zones, exploring the intrinsic relationship between urban functional structure and residents’ travel behavior.
The remainder of this paper is organized as follows. Section 2 reviews the related literature on urban functional zone identification and spatial interaction networks. Section 3 describes the study area, data sources, and the proposed methodology, including the functional zone identification approach and the spatial interaction network construction. Section 4 presents the results of the functional zone mapping, network complexity analysis, and community detection. Section 5 discusses the implications of the findings and the coupling relationship between community structure and urban functions. Finally, Section 6 concludes the study and outlines its limitations and future research directions.

2. Literature Review

The identification and delineation of urban functional zones are fundamental to understanding urban spatial structure and its operational mechanisms. Early research primarily relied on social surveys and census data [22,23]. With the development of remote sensing technology, satellite imagery has been used for land use classification [24,25], but it struggles to reveal the socio-economic activity characteristics within regions. In the era of geographic information big data, POI data has become a mainstream data source for functional zone identification due to its rich socio-economic attributes [26,27,28]. However, POI data suffers from issues like data redundancy and difficulty in distinguishing importance. To address this, researchers have begun integrating multi-source geographic big data. For example, Chang et al. combined static POI features with bike-sharing flow patterns, proposing a two-stage data mining method [29]; Chang et al. integrated building vector data with POI data to achieve functional zone classification at the block scale [30]. Some studies further incorporate resident travel data to improve accuracy. Liu et al. used POI area-weighted proportions and taxi trajectory data to construct a hierarchical fusion method for identifying urban functional zones [31]. Despite these advances, there remains room for improvement in effectively quantifying the importance differences in various POIs in real urban activities.
Trajectory data can accurately depict residents’ spatiotemporal activity characteristics and is widely used in urban spatial structure analysis. Early research focused on the spatial agglomeration characteristics of travel hotspots, identifying urban travel hotspot areas through taxi trajectory density clustering [32]. Subsequently, research gradually deepened towards analyzing functional structure combined with POI data. Retail functional zones were identified by performing kernel density estimation on POIs based on the road network [33]. Urban traffic zones were delineated by spatially clustering resident travel OD data with residential and office POI categories [34,35]. In recent years, the research focus has expanded from simple spatial distribution analysis to studying connection structures between regions. For instance, resident travel networks were constructed based on bike-sharing and bus IC card data, using the Infomap algorithm to identify traffic functional zones [36]. Urban work and living zones were classified from an activity pattern perspective using takeout delivery data to construct OD time series [37]. Taxi GPS data, due to its large scale and wide coverage, is widely used in urban travel behavior and spatial structure research. Urban traffic networks have been constructed using taxi trajectories to identify community structures, and clustering methods have been used to identify traffic hotspots and analyze their spatial interactions [38,39,40,41]. These studies reveal the significant potential of trajectory data in depicting dynamic urban spatial structures.
With the enrichment of spatial interaction data, cities are abstracted into complex networks composed of nodes (urban functional units) and edges (connections like population and transportation). In this framework, community structure becomes a key tool for revealing internal network organization characteristics, where regions with close connections are grouped into the same community. Early community detection methods were largely based on node connection relationships, such as the GN algorithm, which divides networks by iteratively removing edges with high betweenness [42,43]. The modularity function proposed by Newman and Girvan provided an important evaluation criterion for community division [44]. With the development of network analysis methods, algorithms based on information propagation and dynamic processes have emerged, such as the Label Propagation Algorithm [45,46]. Among methods based on random walks, approaches that identify community boundaries by simulating random walk processes between nodes and achieve community division by minimizing information flow encoding length [47,48] are widely used in urban spatial interaction research due to their efficiency, accuracy, and suitability for large-scale directed weighted networks [49].
In summary, existing research has achieved fruitful results in urban functional zone identification, trajectory data application, and spatial interaction network analysis. Data sources have expanded from traditional static data to multi-source geospatial big data, and analytical methods have evolved from simple spatial statistics to complex-network modeling. However, certain limitations remain. Firstly, in functional zone identification, a single data source often fails to simultaneously reflect the static functional attributes of space and residents’ dynamic travel behavior, and the quantification of POI importance is not sufficiently refined. Secondly, in urban spatial interaction research, there is insufficient exploration of the functional attributes underlying interaction relationships, and the spatial structure of “flows” has not been deeply integrated with the functional characteristics of “points.” Therefore, this study integrates ride-hailing trajectory and POI data. From the perspective of resident travel behavior, it constructs an indicator system that balances static functions and dynamic behaviors to achieve refined identification of urban functional zones. This is combined with spatial interaction network analysis to more comprehensively reveal urban spatial structure and its operational laws.

3. Research Design

3.1. Study Area

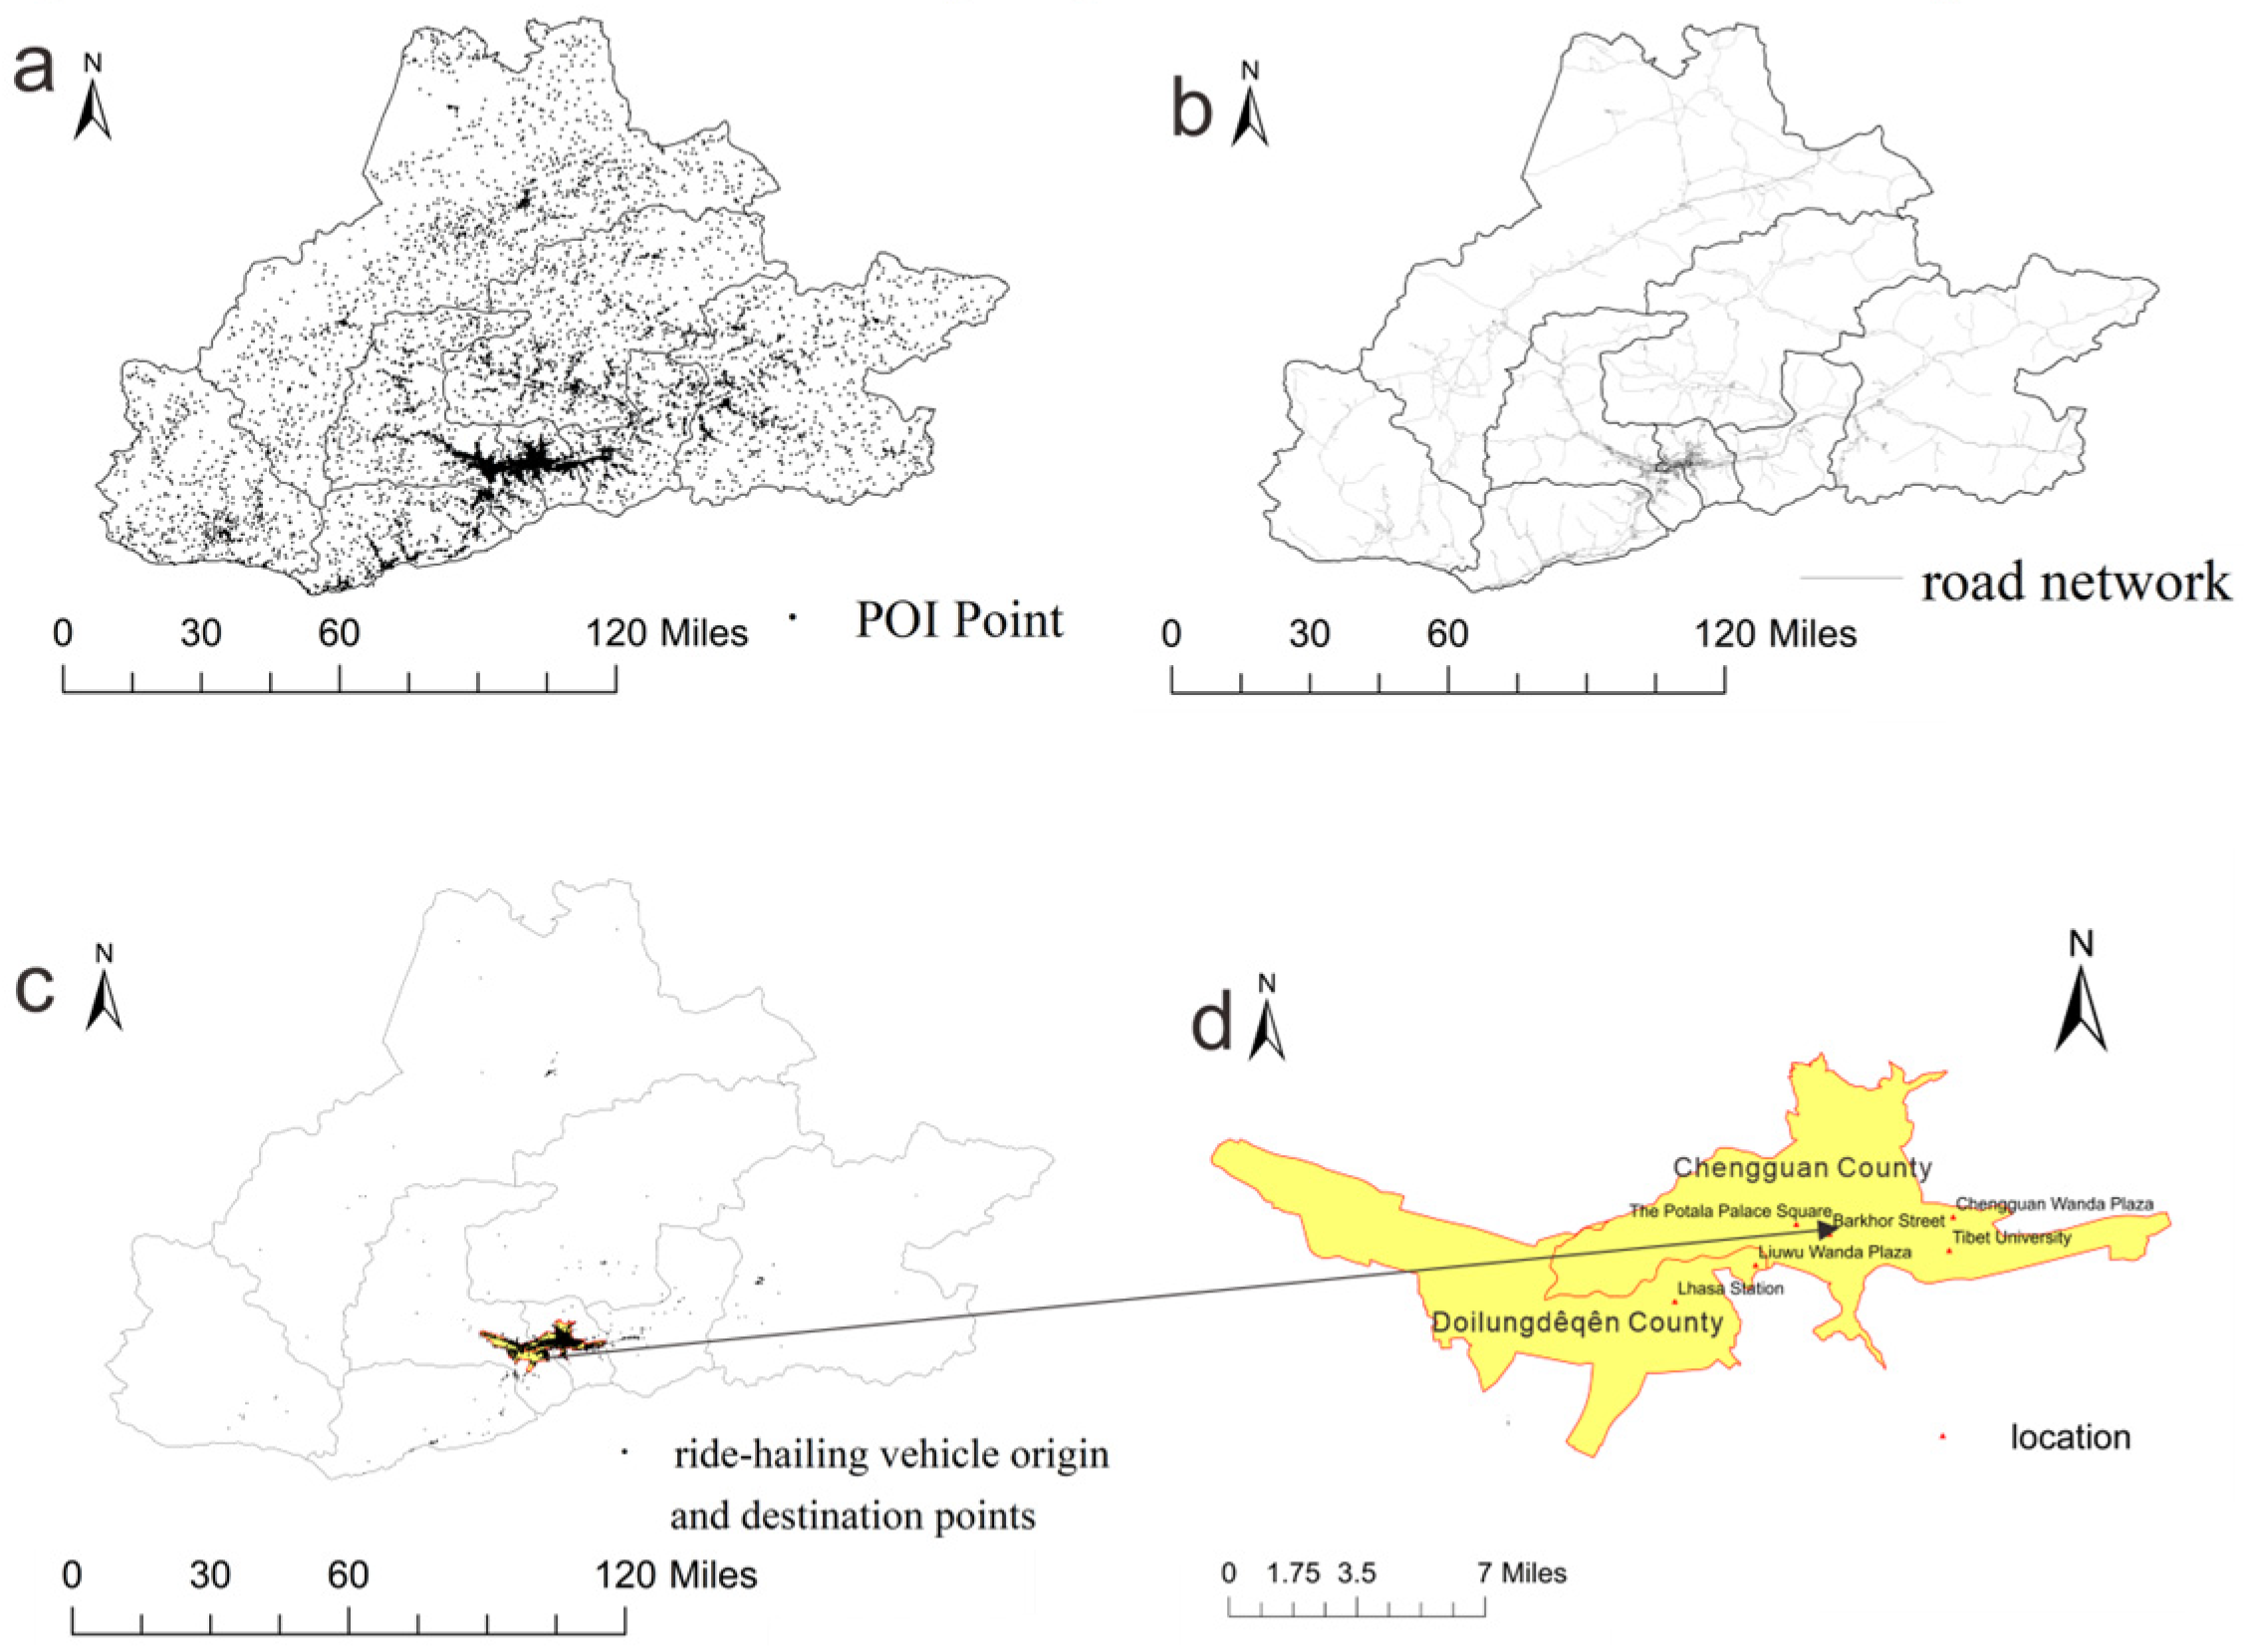
This study focuses on the central urban area of Lhasa City, specifically covering the built-up areas of Chengguan District and Doilungdêqên District. Lhasa, the capital of the Tibet Autonomous Region, is situated in the central part of the Qinghai–Tibet Plateau. Constrained by the Lhasa River valley topography and the north–south mountains, the urban space exhibits a typical east–west strip-like extension pattern. According to the “2025 China Urban Road Network Density and Operation Status Monitoring Report,” the overall road network density in Lhasa is approximately 4.1 km/km2, significantly lower than the average level of major cities nationwide. The combined built-up area of Chengguan District and Doilungdêqên District is approximately 1298 km2, accounting for 4.3% of the city’s total land area. However, this area concentrates over 95% of taxi trip origins and destinations, with high population and travel activity agglomeration, making it an ideal area for studying urban functions and spatial interactions (Figure 1).

3.2. Data Sources and Preprocessing

The data used in this study mainly includes three types: (1) Road network data: Obtained from the AutoNavi Map Open Platform, containing multi-level road information such as urban expressways, arterial roads, secondary roads, and important branch roads, used for constructing basic research units. (2) Point of Interest (POI) data: Acquired through the AutoNavi Map API, covering over 60,000 POI records within the study area, including attributes such as name, address, coordinates, and industry classification under 20 major categories. After data cleaning, coordinate system conversion (GCJ-02 to WGS-1984), and functional reclassification, the data was integrated into 10 functional attribute categories, including residential living, commercial services, and science–education–culture. (3) Ride-hailing trajectory data: Sourced from a ride-hailing platform company in Lhasa, covering the period from 1 to 31 July 2024. A total of 455,136 order records were obtained, containing information such as origin and destination addresses, coordinates, boarding and alighting times, and travel distance. After missing value removal, outlier identification, coordinate system conversion, and clipping to the study area, 411,418 valid records were retained, achieving an effective rate of over 90%.
To address the issue of traditional regular grids potentially fragmenting urban functional space, this study adopts a research unit division method based on the road network. Firstly, based on the AutoNavi road classification system, urban expressways, arterial roads, secondary roads, and important branch roads were selected as the basic road network elements to ensure spatial integrity and functional representation. Secondly, the original road network was structurally simplified by converting bidirectional roads to single lines, and topological consistency checks were performed to ensure the continuity and rationality of the road network structure. Finally, the study area was spatially partitioned using the “Polygon to Line” tool in ArcGIS(10.8). After manual correction, a total of 750 basic analysis units were obtained, serving as the fundamental spatial scale for subsequent functional zone identification and spatial interaction analysis.

3.3. Urban Functional Zone Identification Method

First, spatial area characteristics of POIs were constructed. To address the issue that traditional methods relying solely on POI counts struggle to reflect actual spatial scale, this study employs Thiessen polygons (Voronoi diagrams) to estimate the planar spatial influence range of each POI [50,51]. The specific process includes: importing POI point data into ArcMap(10.8) and converting to a projected coordinate system; constructing Thiessen polygons based on POI points to delineate spatial influence ranges; clipping to the study area boundary; and calculating the area of each polygon and associating it with the corresponding POI point. This method can approximately depict the actual land footprint of POIs in planar space, effectively mitigating the POI data redundancy issue.
To characterize the importance differences in POIs from the perspective of residents’ actual travel behavior, this study associates ride-hailing origins and destinations with POIs through an address spatial-matching algorithm [52,53]. The address matching algorithm consists of three main steps: (1) address text normalization, which removes special characters, unifies letter cases, and standardizes multilingual transliterations; (2) hierarchical address database construction, which organizes POI addresses into a multi-way tree structure following the administrative hierarchy (city → district → subdistrict → street/lane → landmark); (3) backtracking fuzzy matching, which searches for the best-matching POI by traversing the tree from leaf to root and applying cosine similarity when an exact match fails. This approach is inspired by common geocoding techniques for Chinese addresses [54], and has been adapted to handle the specific characteristics of ride-hailing OD texts. First, address texts were normalized, including cleaning special characters, unifying English letters to uppercase, converting numbers to Arabic numerals, and standardizing multilingual transliterations. Secondly, a normalized address database was constructed based on a multi-way tree structure, using “Lhasa City” as the root node and organizing POI address information hierarchically by city–district–subdistrict–street/lane–landmark. The address matching algorithm consists of three main steps: address text normalization, hierarchical address database construction, and a backtracking fuzzy matching strategy. The hierarchical structure contains five levels: Level 0 (city, e.g., “Lhasa City”), Level 1 (district), Level 2 (subdistrict), Level 3 (street/lane), and Level 4 (specific landmark or POI name). Given a ride-hailing OD address, the algorithm first attempts to match at Level 4. If no match is found (e.g., due to spelling errors or omitted details), it backtracks to Level 3 and searches among all POIs under that parent node. If still no match, it continues backtracking up to Level 0. At each backtracking level, the algorithm performs fuzzy matching using cosine similarity between the normalized query text and the candidate address strings. The similarity threshold is set to 0.75 (empirically determined from a pilot test on 200 manually labeled addresses). The candidate with the highest similarity above the threshold is selected as the match. If no candidate exceeds the threshold, the address is marked as unmatchable. Through manual verification on 5 rounds of 2000 samples each, the matching rate of this method reached 95.65%, with an accuracy of 92.32%, effectively establishing the association between ride-hailing OD and POIs, thereby assigning access weights to each POI. Based on the obtained POI area attributes and access weights, a weighted land use intensity index for basic research units was constructed. The calculation formula is as follows:
A i , j = k = 1 P i , j ( Q i , j , k × S i , j , k ) j = 1 m k = 1 P i , j ( Q i , j , k × S i , j , k )
Here, A i , j , Q i , j , and S i , j represent the weighted land use intensity, access weight, and total area of function type   j in plot i , respectively. Q i , j , k and S i , j , k denote the weight and area of the k -th POI point with function type j in plot i . The access weight Q i , j , k is defined as the number of ride-hailing trips whose destination address is matched to the k -th POI of function type j in plot i . m is the total number of function types, and P i , j is the total number of POI points with function type k in plot i . To objectively measure the degree of functional mixing in an area, the information entropy method was introduced:
H ( x ) = i = 1 n P i l o g P i
where H ( x ) is the information entropy of random variable x . The random variable x has n possible values, x 1 , x 2 , x 3 x n , and the probability of each value is P 1 , P 2 , P 3 P n .
The natural-breaks method was used to divide the mixing degree into three levels: single-function zone (mixing degree 0–0.5004), uncertain functional zone (0.5005–1.4402), and mixed-function zone (1.4403–2.4407). For the identified mixed-function zones, the weighted land use intensity feature vectors were used as input, and the K-Means clustering method was employed for subdivision. The dominant function type was determined by combining the average weighted land use intensity ratio (MWI) and functional importance ranking (FRI).

3.4. Urban Spatial Interaction Network Construction and Analysis Method

Firstly, a spatial interaction network was constructed. The origins and destinations of ride-hailing trips were matched to their respective basic research units, and the direction of spatial connection was established from origin to destination. Using the basic research units as network nodes and the number of ride-hailing orders between units as edge weights, a directed weighted spatial interaction network was constructed. The network comprised 750 nodes and 103,534 edges. To verify the complexity characteristics of the network, indicators such as average degree, average path length, average clustering coefficient, and network density were measured, and the scale-free property was tested through degree distribution fitting.
Degree centrality, betweenness centrality, and closeness centrality were used to evaluate the importance of network nodes. Degree centrality reflects the number of connections a node establishes with other nodes. In the directed weighted network constructed in this paper, the weighted degree of the node is used, which comprehensively considers both the number of connections and edge weights. The calculation method is as follows:
C D n i = j = 1 k X i j , X i j = 1 ,   N o d e   i   i s   c o n n e c t e d   t o   n o d e   j 0 ,   N o d e   i   i s   n o t   c o n n e c t e d   t o   n o d e   j
Betweenness centrality measures the extent to which a node lies on the shortest paths between other nodes, reflecting its intermediary bridging role. The calculation method is as follows:
C B ( n i ) = j < k k g i k ( n i ) g i k
where C B ( n i ) represents the betweenness centrality of node i , g i k is the total number of shortest paths between node j and node k , and g i k ( n i ) is the number of shortest paths between node j and node k that pass through node i . To eliminate the impact of network size on the calculation results of betweenness centrality, a standardization method was applied to the node betweenness centrality. The standardization formula is to divide the original betweenness centrality of the node by ( n − 1) ( n − 2), where n is the number of nodes in the network.
Closeness centrality describes the average shortest path length from a node to all other nodes, reflecting overall accessibility. The calculation method is as follows:
C C ( n i ) = n 1 j = 1 , j i n d i j
where C C ( n i ) represents the closeness centrality of node i ; n is the total number of nodes in the network; and d i j is the shortest path length between node i and node j .
The entropy weight method was used to objectively assign weights to the three centrality indicators, constructing a comprehensive node importance evaluation index:
C ( i ) = λ 1 × C D ( n i ) + λ 2 × C B ( n i ) + λ 3 × C C ( n i )
where λ 1 ,   λ 2 ,   λ 3 are the weights determined by the entropy weight method, and C D ( n i ) , C B ( n i ) , and C C ( n i ) represent the degree centrality, betweenness centrality, and closeness centrality of node i , respectively.
We used the Infomap community detection algorithm to partition the spatial interaction network. This algorithm is based on information theory and identifies modular structures in networks by simulating random walks and minimizing the length of the information flow code. Modularity was selected as the evaluation metric for the community division results. The modularity is calculated as follows:
Q = 1 2 v i , j A i j k i k j 2 v δ C i , C j
where A i j represents the weight of the edge between node i and node j ; k i represents the sum of weights of edges connecting node i to all other nodes in the network; C i denotes the community to which node i belongs; A i j represents the total sum of all edge weights in the network; δ C i , C j is the Kronecker delta function, used to determine whether node i and node j belong to the same community. It takes the value 1 if they are in the same community, and 0 otherwise.
Generally, when the modularity value is greater than 0, it indicates that some community structure has begun to emerge in the network. When the modularity value exceeds 0.3, the community structure is usually considered significant. A higher modularity value indicates tighter connections between nodes within the community and better community division results. Typically, modularity values range between 0.3 and 0.7 [55]. In the experimental analysis, to visually display the community division results, basic research units belonging to the same community were assigned the same color for spatial visualization. When a region exhibits a consistent and contiguous color, it can be considered a relatively complete community; if the colors of basic research units are mixed, it indicates that the community structure in that region is less distinct and the community division result is relatively ambiguous. A modularity value closer to 1 indicates tighter internal connections within the community. Based on the community division, further analysis was conducted on the functional composition within communities, interaction intensity between communities, and sub-network structure characteristics within communities, revealing the spatial connection patterns between different functional zones.

3.5. Verification of Spatial Interaction Network Complexity

Network complexity characteristics are crucial for revealing the network’s hierarchical structure and connection patterns, playing a key role in understanding the overall organizational form of the network. Generally, complexity can be described from aspects such as network clustering, node strength distribution characteristics, and path structure characteristics. Based on the flow relationships formed by residents’ ride-hailing travel, a directed weighted network was constructed, using edge weights to reflect the strength of connections between urban grid nodes. On this basis, representative complex-network indicators were selected to quantitatively analyze the constructed directed weighted network. The calculation methods and meanings of each indicator are shown in Table 1.
To verify whether the constructed urban spatial interaction network possesses the typical characteristics of complex networks, verification was conducted from two aspects: “small-world effect” and “degree distribution pattern.” The small-world characteristic requires the network to have both a short average path length and a large clustering coefficient. This study calculates the average clustering coefficient ( C a v g ) and average path length ( L a v g ) of the actual network, compares them with the corresponding indicators ( C r a n d , L r a n d ) of a random network of the same scale (750 nodes, 103,534 edges), and then calculates the small-world index s = ( C a v g / C r a n d ) / ( L a v g / L r a n d ) for determination [44]. The degree distribution was examined by fitting whether the node degree distribution conforms to a power-law form P ( d ) d γ , which would indicate the presence of scale-free properties if the fit is statistically supported. Additionally, indicators such as network density (ratio of actual edges to maximum possible edges M(M − 1)) were selected to assist in characterizing the overall structure of the network.
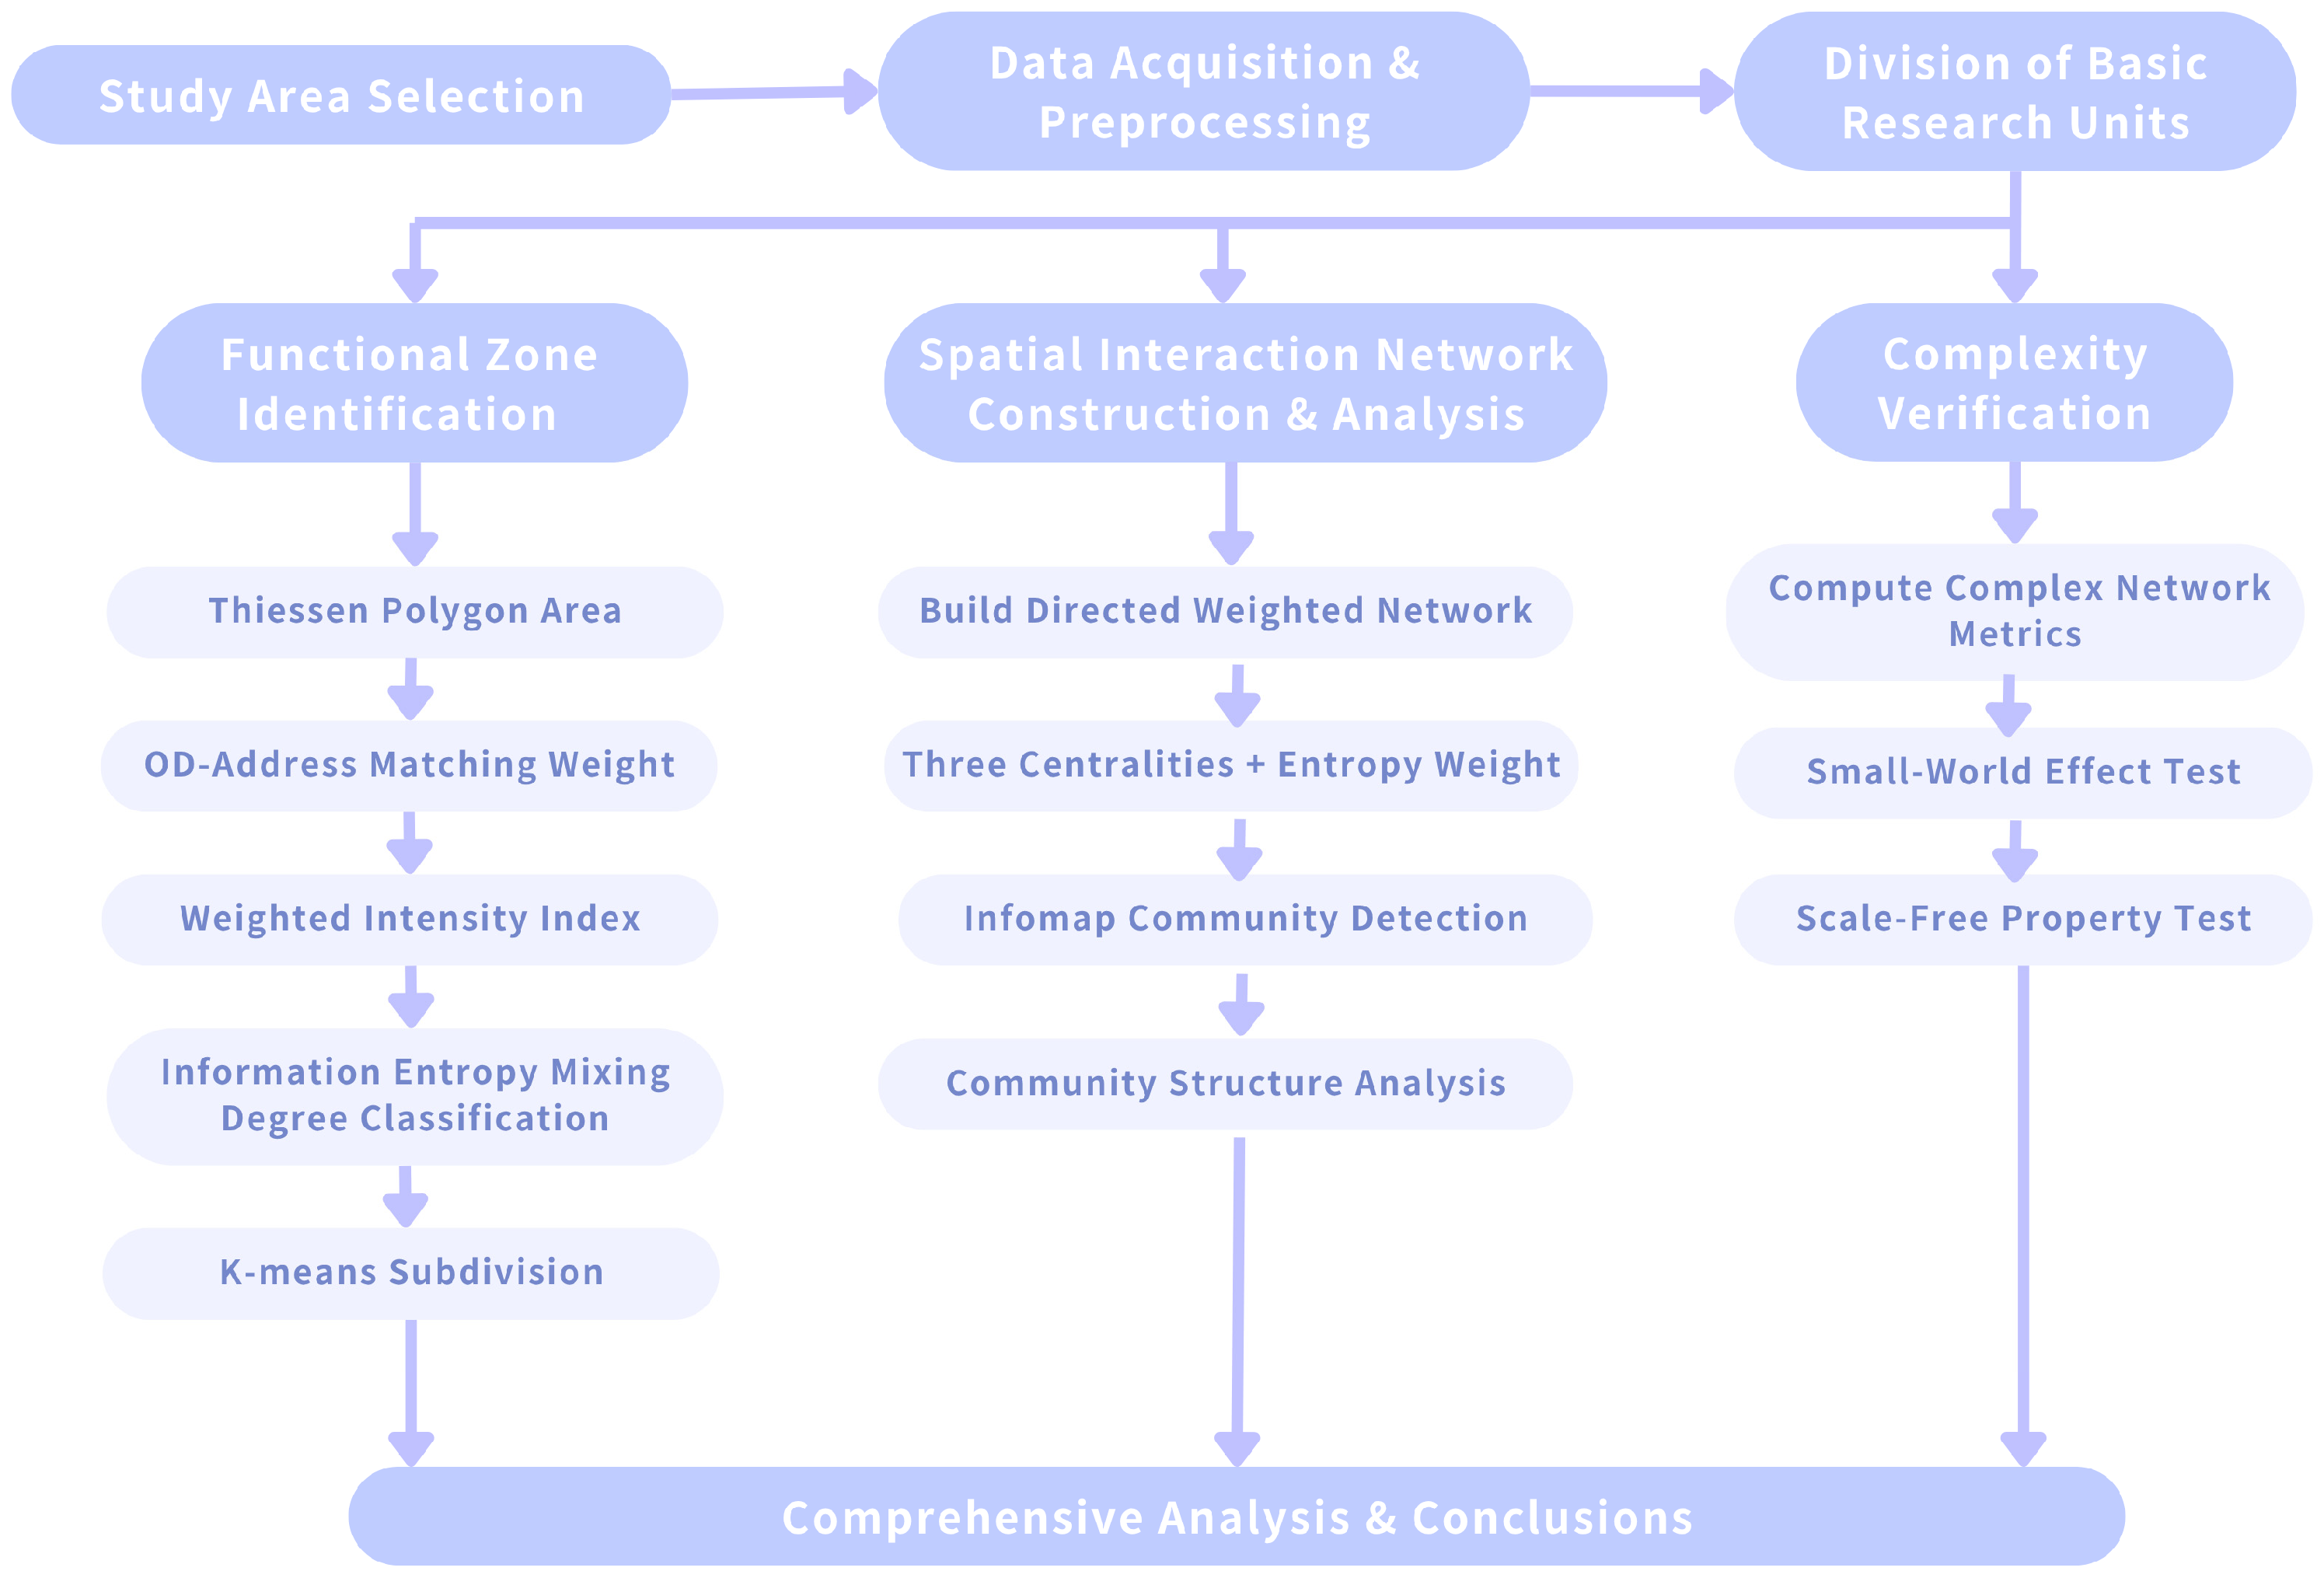
The calculation process is shown in Figure 2.

4. Results

4.1. Results of Urban Functional Zone Identification

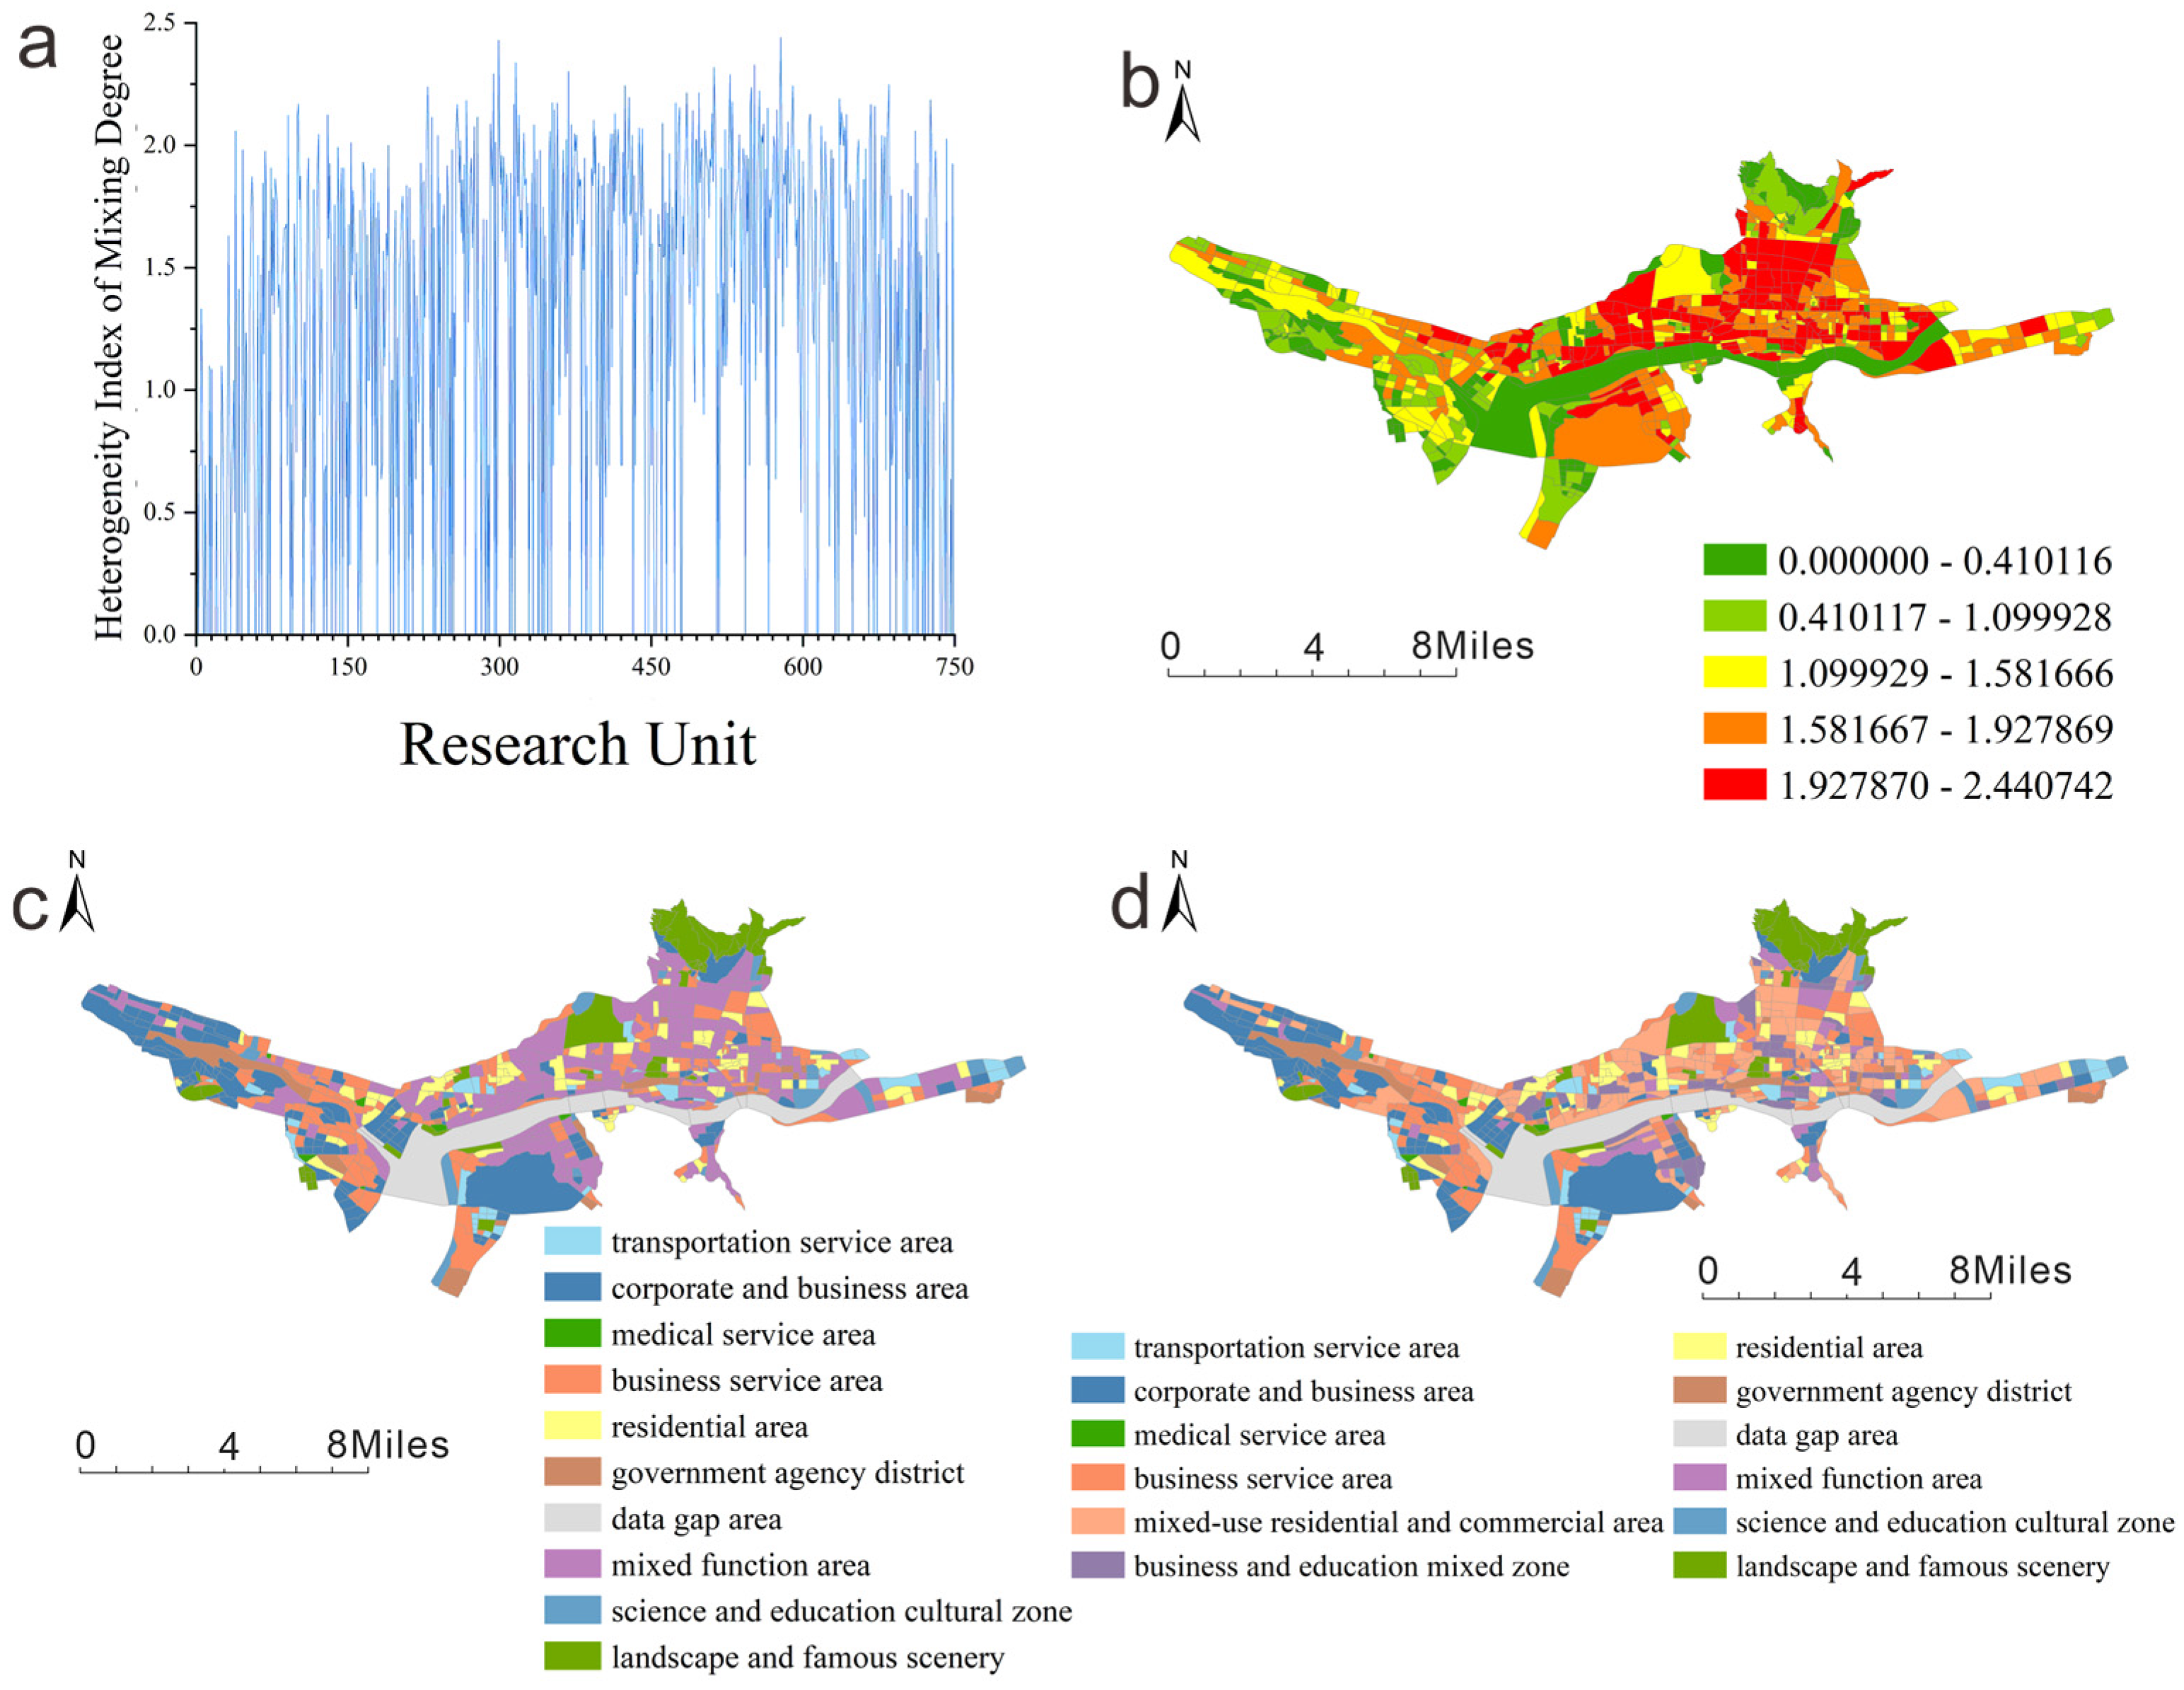
Based on the information entropy method, the functional mixing degree of 750 basic research units was calculated. The results (Figure 3a) show that the average functional mixing degree in the study area is 1.26, with 59.86% of the areas above the average level. Using the natural-breaks method, the mixing degree was divided into five levels. The spatial distribution exhibits a significant pattern of “highly composite core, relatively differentiated periphery” (Figure 3b). High-mixing-degree areas (>1.8) are mainly concentrated in the old town around the Potala Palace–Barkhor Street area and the core built-up area along Beijing Road. Multiple functions such as tourism services, commercial shopping, residential living, and daily life services are highly overlapped here. Medium-mixing-degree areas (1.2–1.8) extend radially outward along the main traffic arteries, with a functional structure dominated by commercial–residential mixing. Low-mixing-degree areas (<0.8) are distributed on the urban fringe and newly developed areas, with relatively single functional types. Through the address spatial-matching algorithm, ride-hailing origins and destinations were successfully associated with POIs. The matching results indicate that core functional nodes such as the Potala Palace, Barkhor Street, Lhasa Station, and Wanda Plaza have high access weights, highly consistent with residents’ actual travel hotspots.
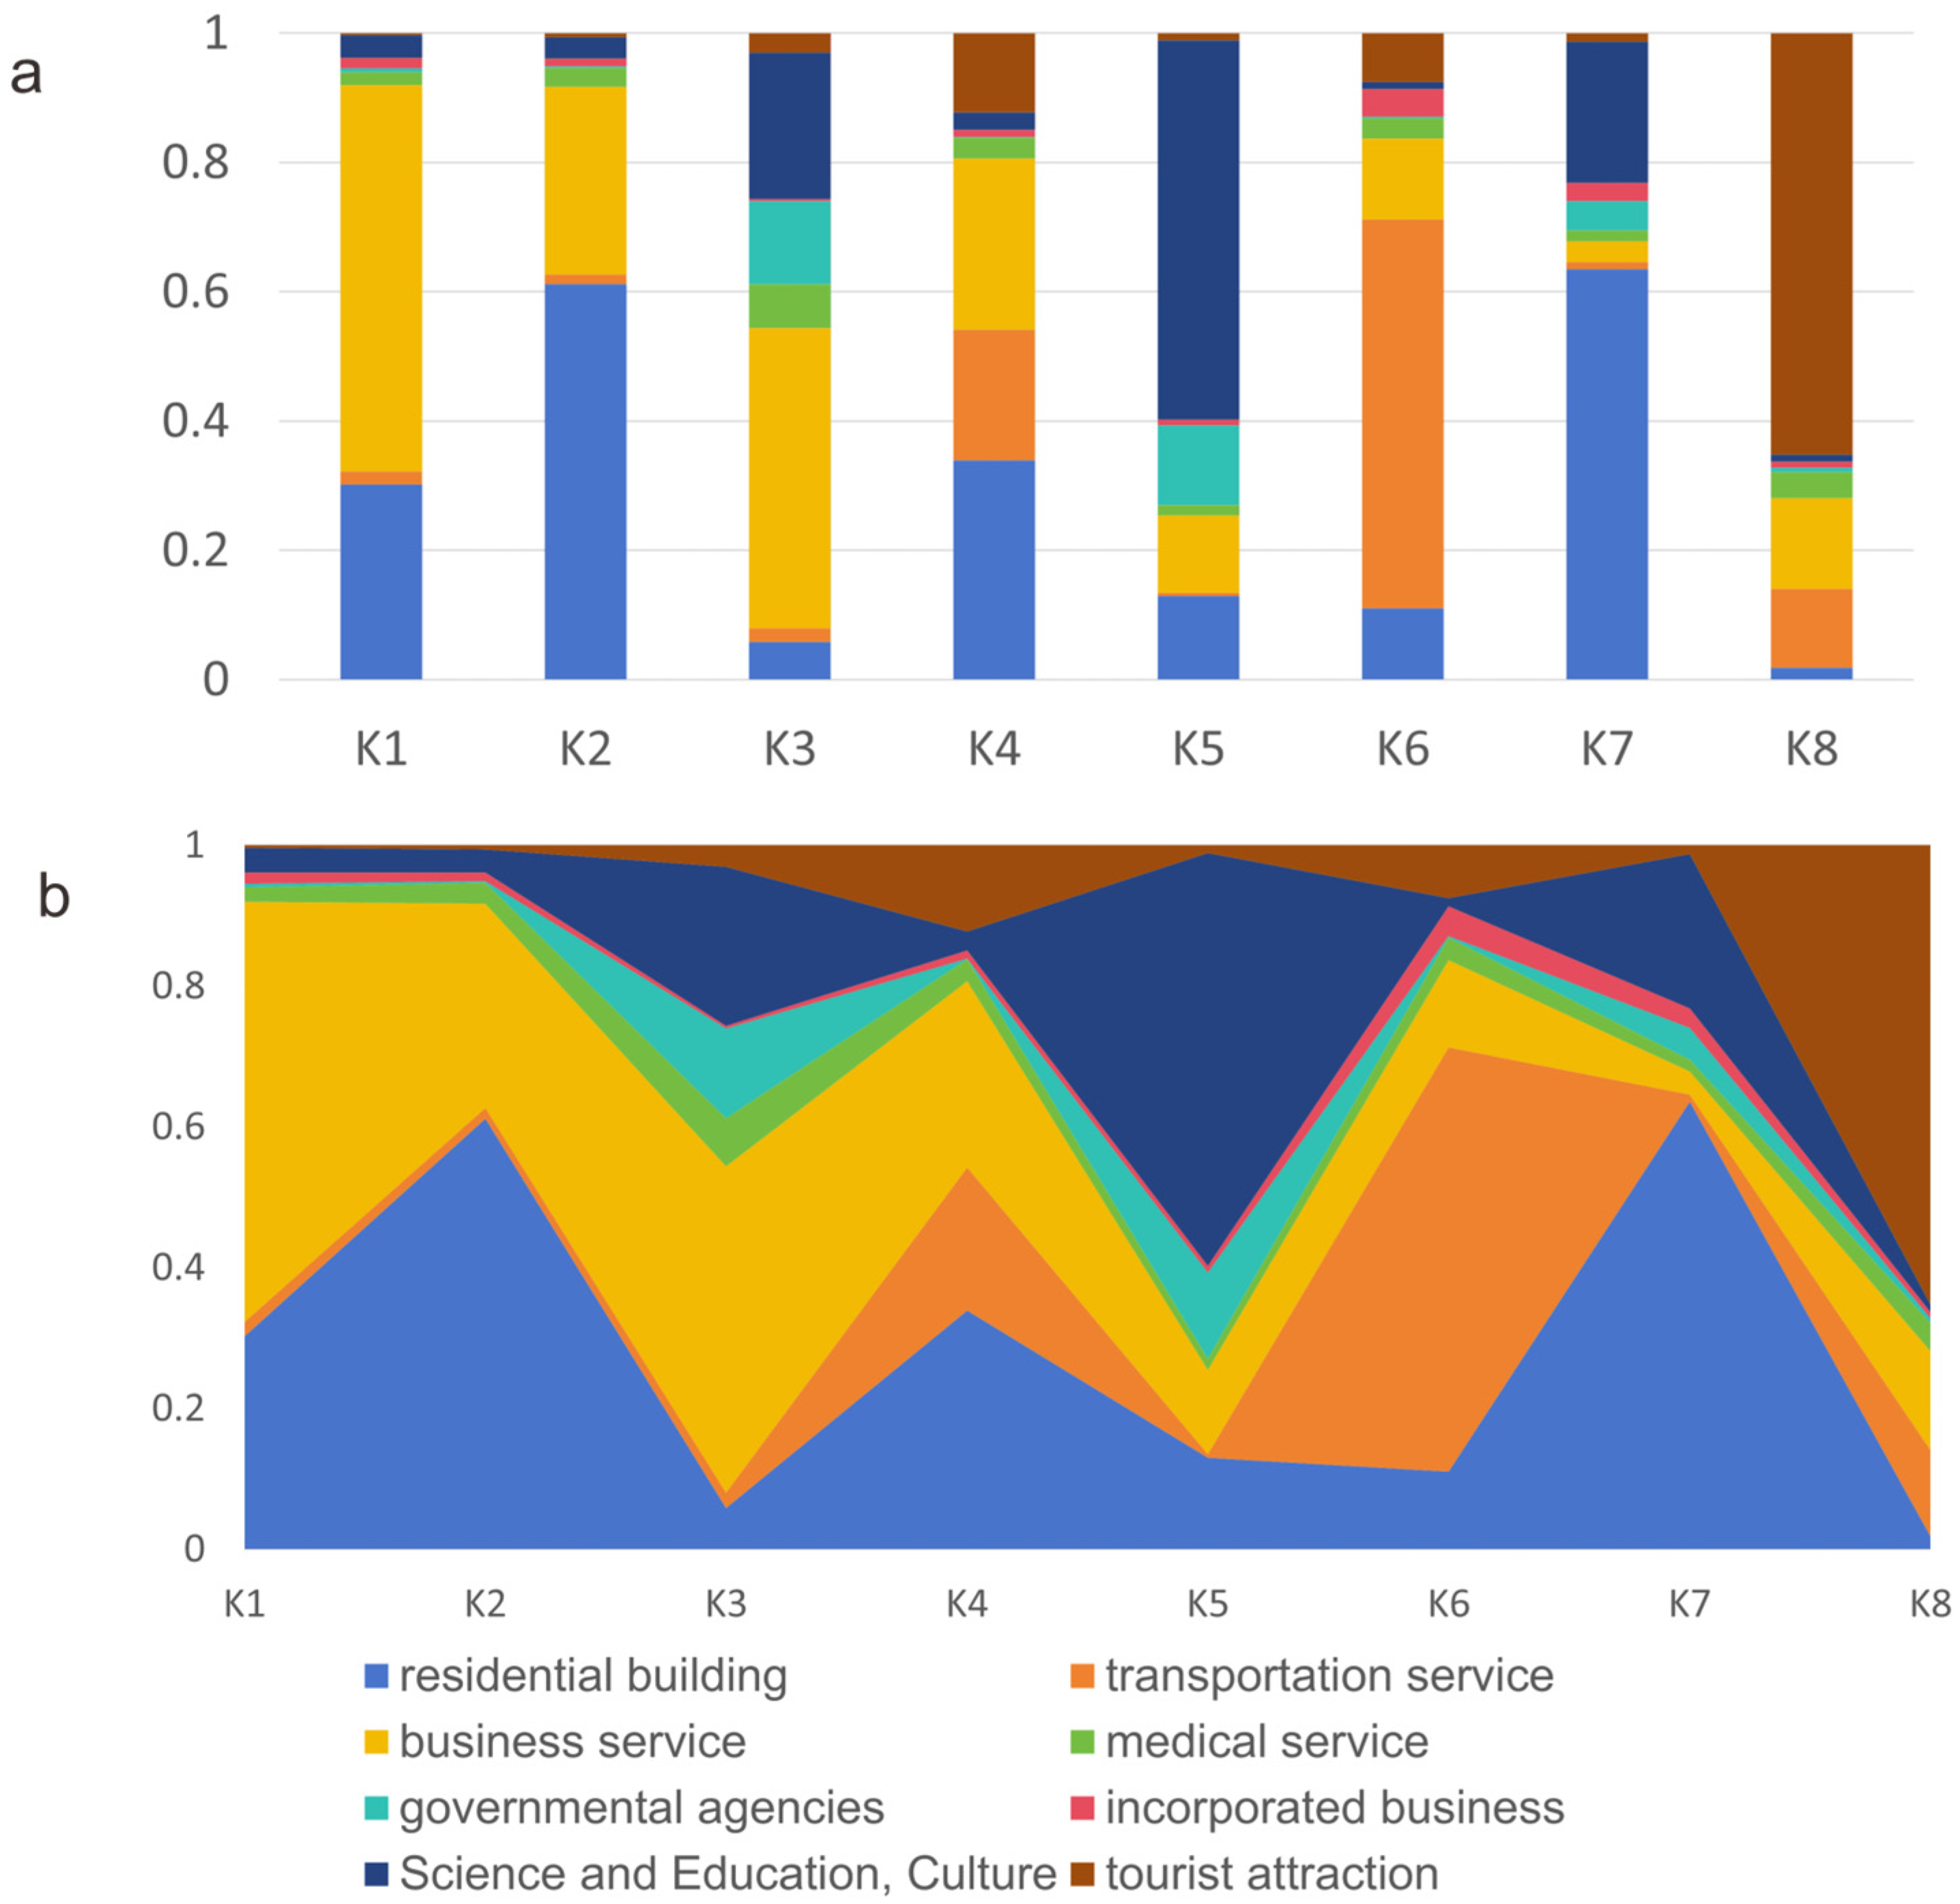
Based on the weighted land use intensity index and mixing degree classification, eight types of single-function zones and preliminary identification results for mixed-function zones (Figure 3c) and final identification results (Figure 3d) in the study area were identified. To determine the optimal number of subdivisions for mixed-functional zones, we calculated the Silhouette Coefficient for K values ranging from 2 to 15. The Silhouette Coefficient evaluates intra-cluster compactness and inter-cluster separation. The results show that the average Silhouette Coefficient reaches its maximum value of 0.76 when K = 8. Therefore, we selected K = 8 as the final parameter for K-Means clustering. Combining the average weighted land use intensity ratio (MWI) and functional importance ranking (FRI), the following functional zone types were ultimately identified (Figure 4):
(1) Commercial–residential mixed zone (K1, K2): The combined weighted intensity of commercial services and residential living functions exceeds 90%, forming an obvious “dual-dominant” feature. It is mainly distributed along Beijing Road, Jiangsu Road, and mature residential areas.
(2) Commercial–educational mixed zone (K3): Commercial services dominate, with science–education–culture and government institutions as secondary components. It is mainly distributed around university campuses and educational facility clusters, such as the area around Tibet University.
(3) Mixed-function zone (K4): The weighted intensities of multiple functions, such as residential living, transportation services, medical services, and scenic spots, are relatively balanced, with no clear dominant function and well-developed supporting facilities. It is mainly distributed in the urban core area and comprehensive service nodes.
(4) Science–education–culture zone (K5): The weighted intensity of science–education–culture functions accounts for 58.68%, significantly higher than other types. It mainly corresponds to universities, research institutions, and cultural facility clusters, such as Tibet University (Nanjin Campus), Tibet Tibetan Medical University, etc.
(5) Transportation service zone (K6): The weighted intensity of transportation service POIs exceeds 60%, showing a clear single-dominant characteristic. It mainly corresponds to Lhasa Railway Station, Liuwu Bus Station, and major transportation nodes.
(6) Residential area (K7): The weighted intensity of residential living functions accounts for 63.52%, showing a residential-dominant characteristic. Science–education–culture POIs are mainly community-affiliated schools with limited impact on the functional attributes of the area.
(7) Scenic spot zone (K8): The weighted intensity of scenic spot functions exceeds 65%, accompanied by a certain proportion of transportation, commercial, and accommodation/catering functions, forming a functional structure oriented towards tourism activities. It is mainly distributed around the Potala Palace, Jokhang Temple, Barkhor Street, and Norbulingka.
After introducing access weights for land use intensity and completing importance weighting, the relative importance of the dominant function within each basic research unit was further strengthened. Compared with functional identification methods based solely on POI quantity characteristics, this weighting process somewhat compresses the representation of functional coexistence, resulting in a slight decrease in the overall mixing degree of the area. Based on the identification of actual functions of the clusters in Figure 3d, the urban functional zones of Lhasa generally show significant functional composite characteristics. Residential areas are the most prevalent and widely distributed functional type, presenting a pattern combining strip-like and patchy distributions. Corporate enterprise areas are often located adjacent to major urban arterial roads, important transportation nodes, and newly developed areas. Science–education–culture areas exhibit a spatial characteristic combining point-like and dispersed patterns. Transportation service areas mainly correspond to important transportation hubs within the city and their surrounding areas. Scenic spot zones are concentrated around the Potala Palace, important religious and cultural heritage sites, and large urban parks.

4.2. Analysis of Spatial Interaction Network Characteristics

4.2.1. Topological Properties and Complexity Verification of the Network

First, the correspondence between ride-hailing order origins/destinations and basic research units was established. Next, within each basic research unit, the weighted land use intensity of the POIs contained within it was calculated, and the POI point with the highest weight was selected. The coordinates of this point were used as the representative location for the unit to mark the spatial location of the network node. This processing can, to some extent, reflect the location characteristics of the most concentrated functional activities within the grid. Simultaneously, during the summary statistics of weighted land use intensity for each unit, it was found that some grids had a total access weight of zero, indicating that no valid POI weight information was matched within them. For such units, this study used the coordinates of their geometric center as the alternative location to ensure that all basic research units possess clear spatial coordinate attributes during network construction. After the above processing, a complete system for representing network node locations was formed. After completing the spatial matching between nodes and basic research units, based on the correspondence between origin and destination grid IDs in the order data, each order record was treated as a directed vector from origin to destination. By aggregating the travel counts between grids, an OD matrix reflecting travel intensity between grids was constructed. In this matrix, the displacement relationship between grids is abstracted as network edges, with travel frequency serving as edge weight. If there is no order record between a pair of grids, the corresponding element is recorded as 0, indicating no connection. Considering potential differences in round-trip flows, the network has obvious directional characteristics. Ultimately, a directed weighted spatial interaction network containing 750 nodes and 103,534 edges was constructed. To enhance the visualization effect, the natural-breaks method was used to divide edge weights into four levels, showing only connections with weights greater than or equal to 3. Color gradients and line width variations were used to represent the magnitude of edge weights, intuitively presenting the spatial interaction pattern within the city.
The directed weighted spatial interaction network constructed based on ride-hailing OD data comprises 750 nodes and 103,534 edges. Network characteristic indicators show: the average degree is 276.29, the average path length is 2.329, the average clustering coefficient is 0.350, and the network density is 0.058. Compared with a random network of the same scale, the small-world index s > 1, indicating that the network simultaneously possesses high clustering and short path lengths, displaying typical small-world characteristics. The node degree distribution fitting results show a power-law exponent γ = 0.609 and a goodness-of-fit R2 = 0.8921. Therefore, the network does not exhibit a statistically significant scale-free property. Instead, the degree distribution is better described by a lognormal or exponential decay, indicating that while a few nodes (e.g., Lhasa Station, Potala Square) have high connectivity, the overall network lacks a heavy-tailed power-law structure.

4.2.2. Node Centrality, Importance Evaluation, and Community Structure Analysis

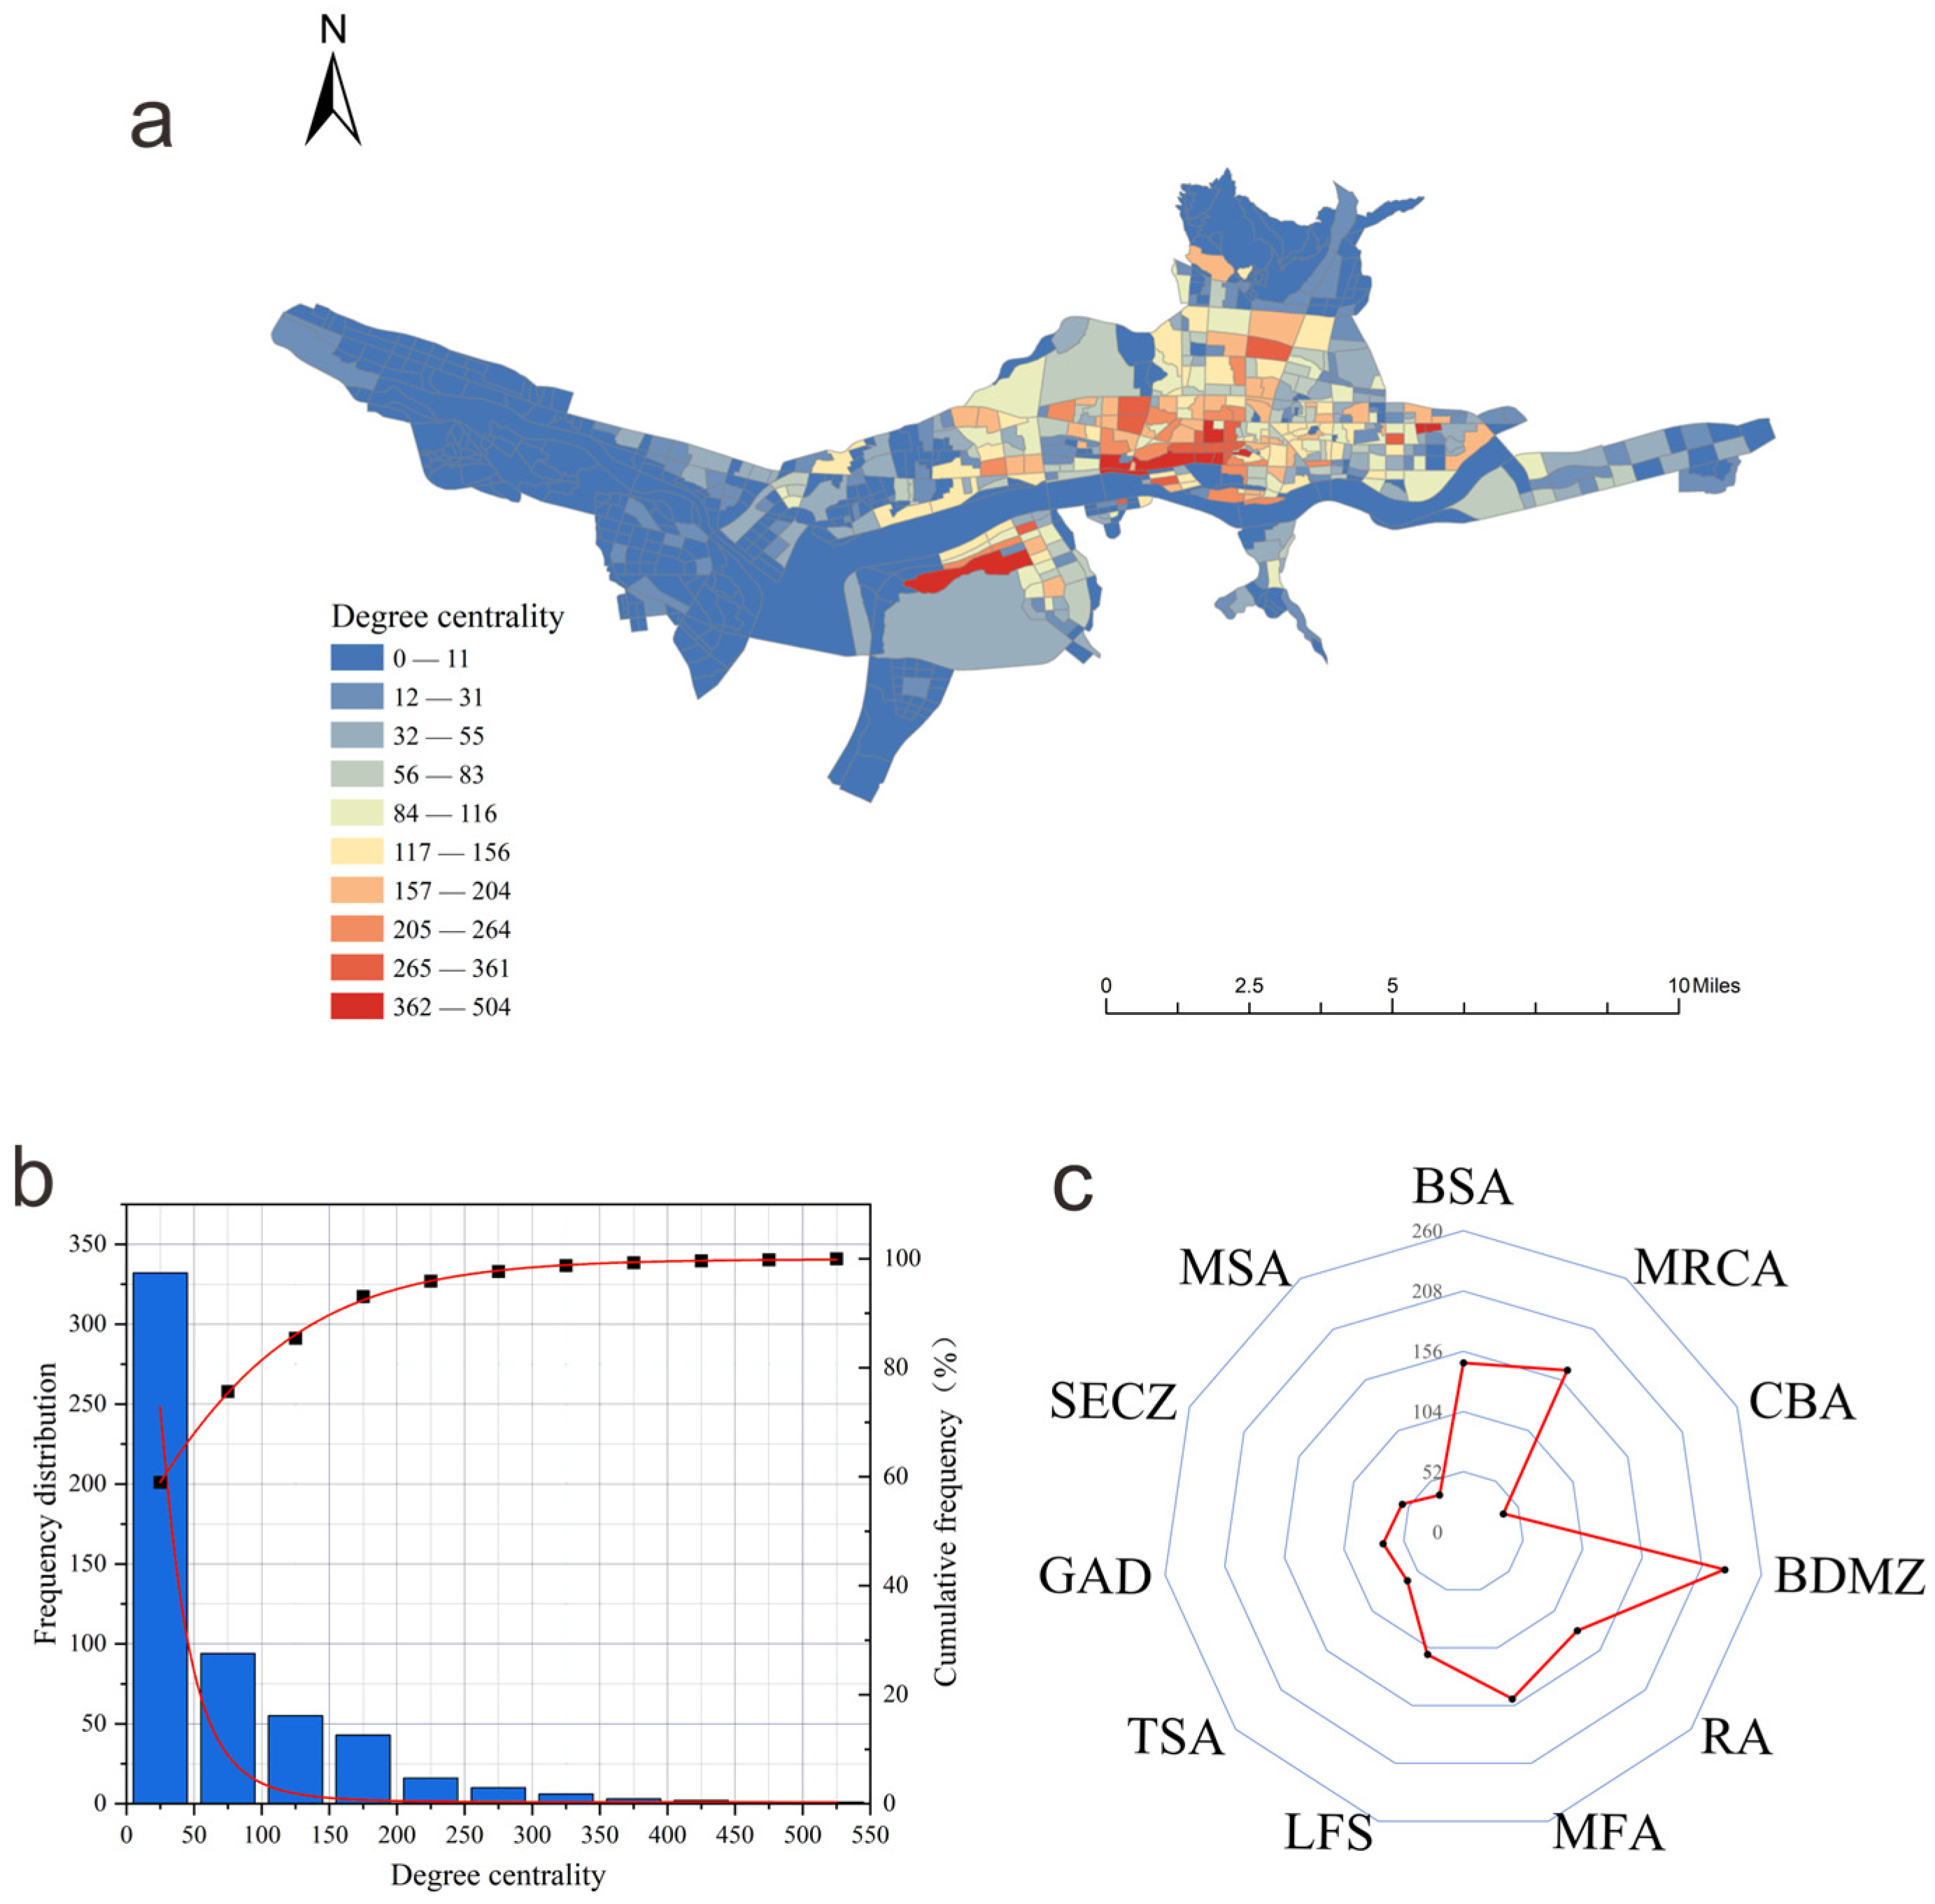
The spatial distribution of degree centrality (Figure 5a) shows that high-value areas are centered around the Potala Palace–Jokhang Temple–Barkhor Street area, extending outward along urban arterial roads such as Beijing Road, Jiangsu Road, and Zangre Road, generally showing a decreasing trend from the center to the periphery. Typical high-value areas include the core tourist area around the Potala Palace and Jokhang Temple, the Barkhor Street commercial district, the concentrated area of commercial service facilities along Beijing Road, medical service areas like the Tibet Autonomous Region People’s Hospital, and the areas around Lhasa Railway Station and Liuwu New District. The degree centrality distribution shows a significant long-tail characteristic (Figure 5b), with the vast majority of node degree values at a lower level. A comparison of average degree centrality across different functional zone types (Figure 5c) shows that the commercial–educational mixed zone has the highest, followed by the commercial–residential mixed zone and mixed-function zone, with commercial service zones and residential areas also at relatively high levels.
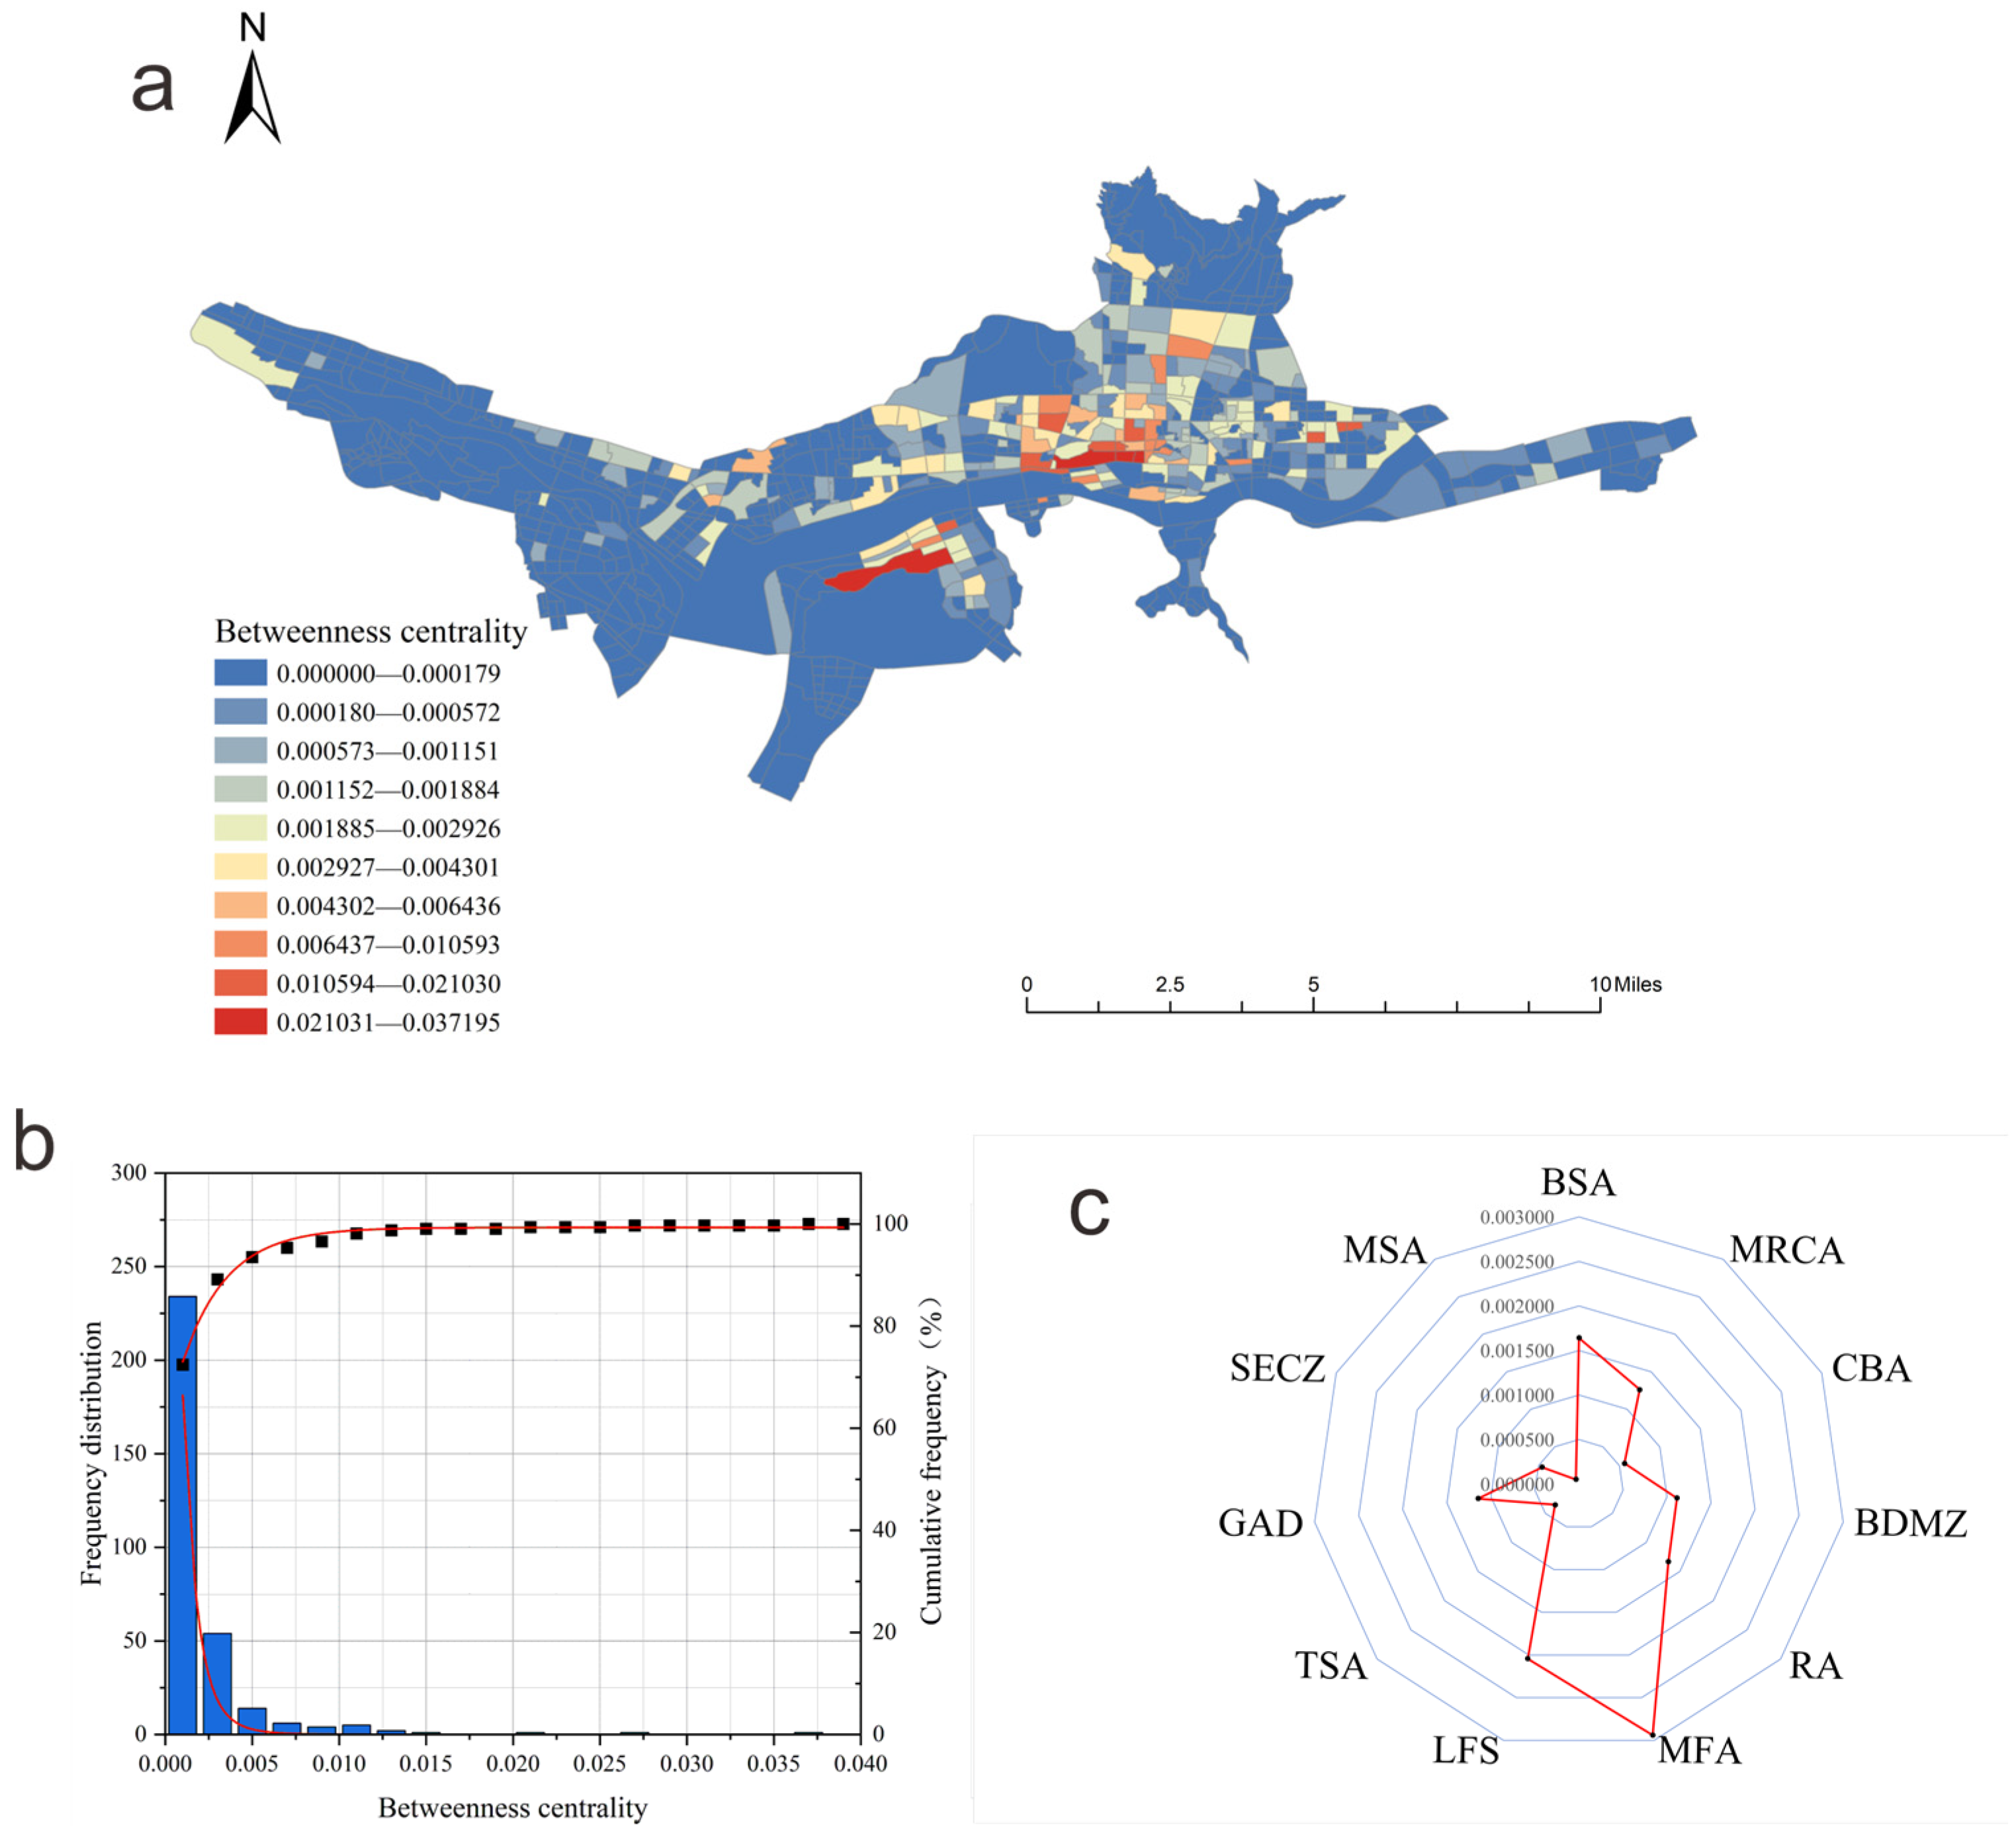
The spatial distribution of betweenness centrality (Figure 6a) exhibits a distinct “core–periphery” pattern, with high-value areas mainly concentrated in the central urban area and its surrounding core transportation nodes. The betweenness centrality near Lhasa Station approaches 0.037, significantly higher than in other areas, forming a localized high-value agglomeration. Analysis of the average betweenness centrality across different functional zones (Figure 6c) shows that high-value areas are mainly concentrated in regions containing important transportation hubs (Lhasa Railway Station, Liuwu Bus Station, Lhasa North Coach Station) and their adjacent areas. Some scenic spot zones (Potala Palace, Jokhang Temple, Barkhor Street) also exhibit relatively high levels of betweenness centrality.
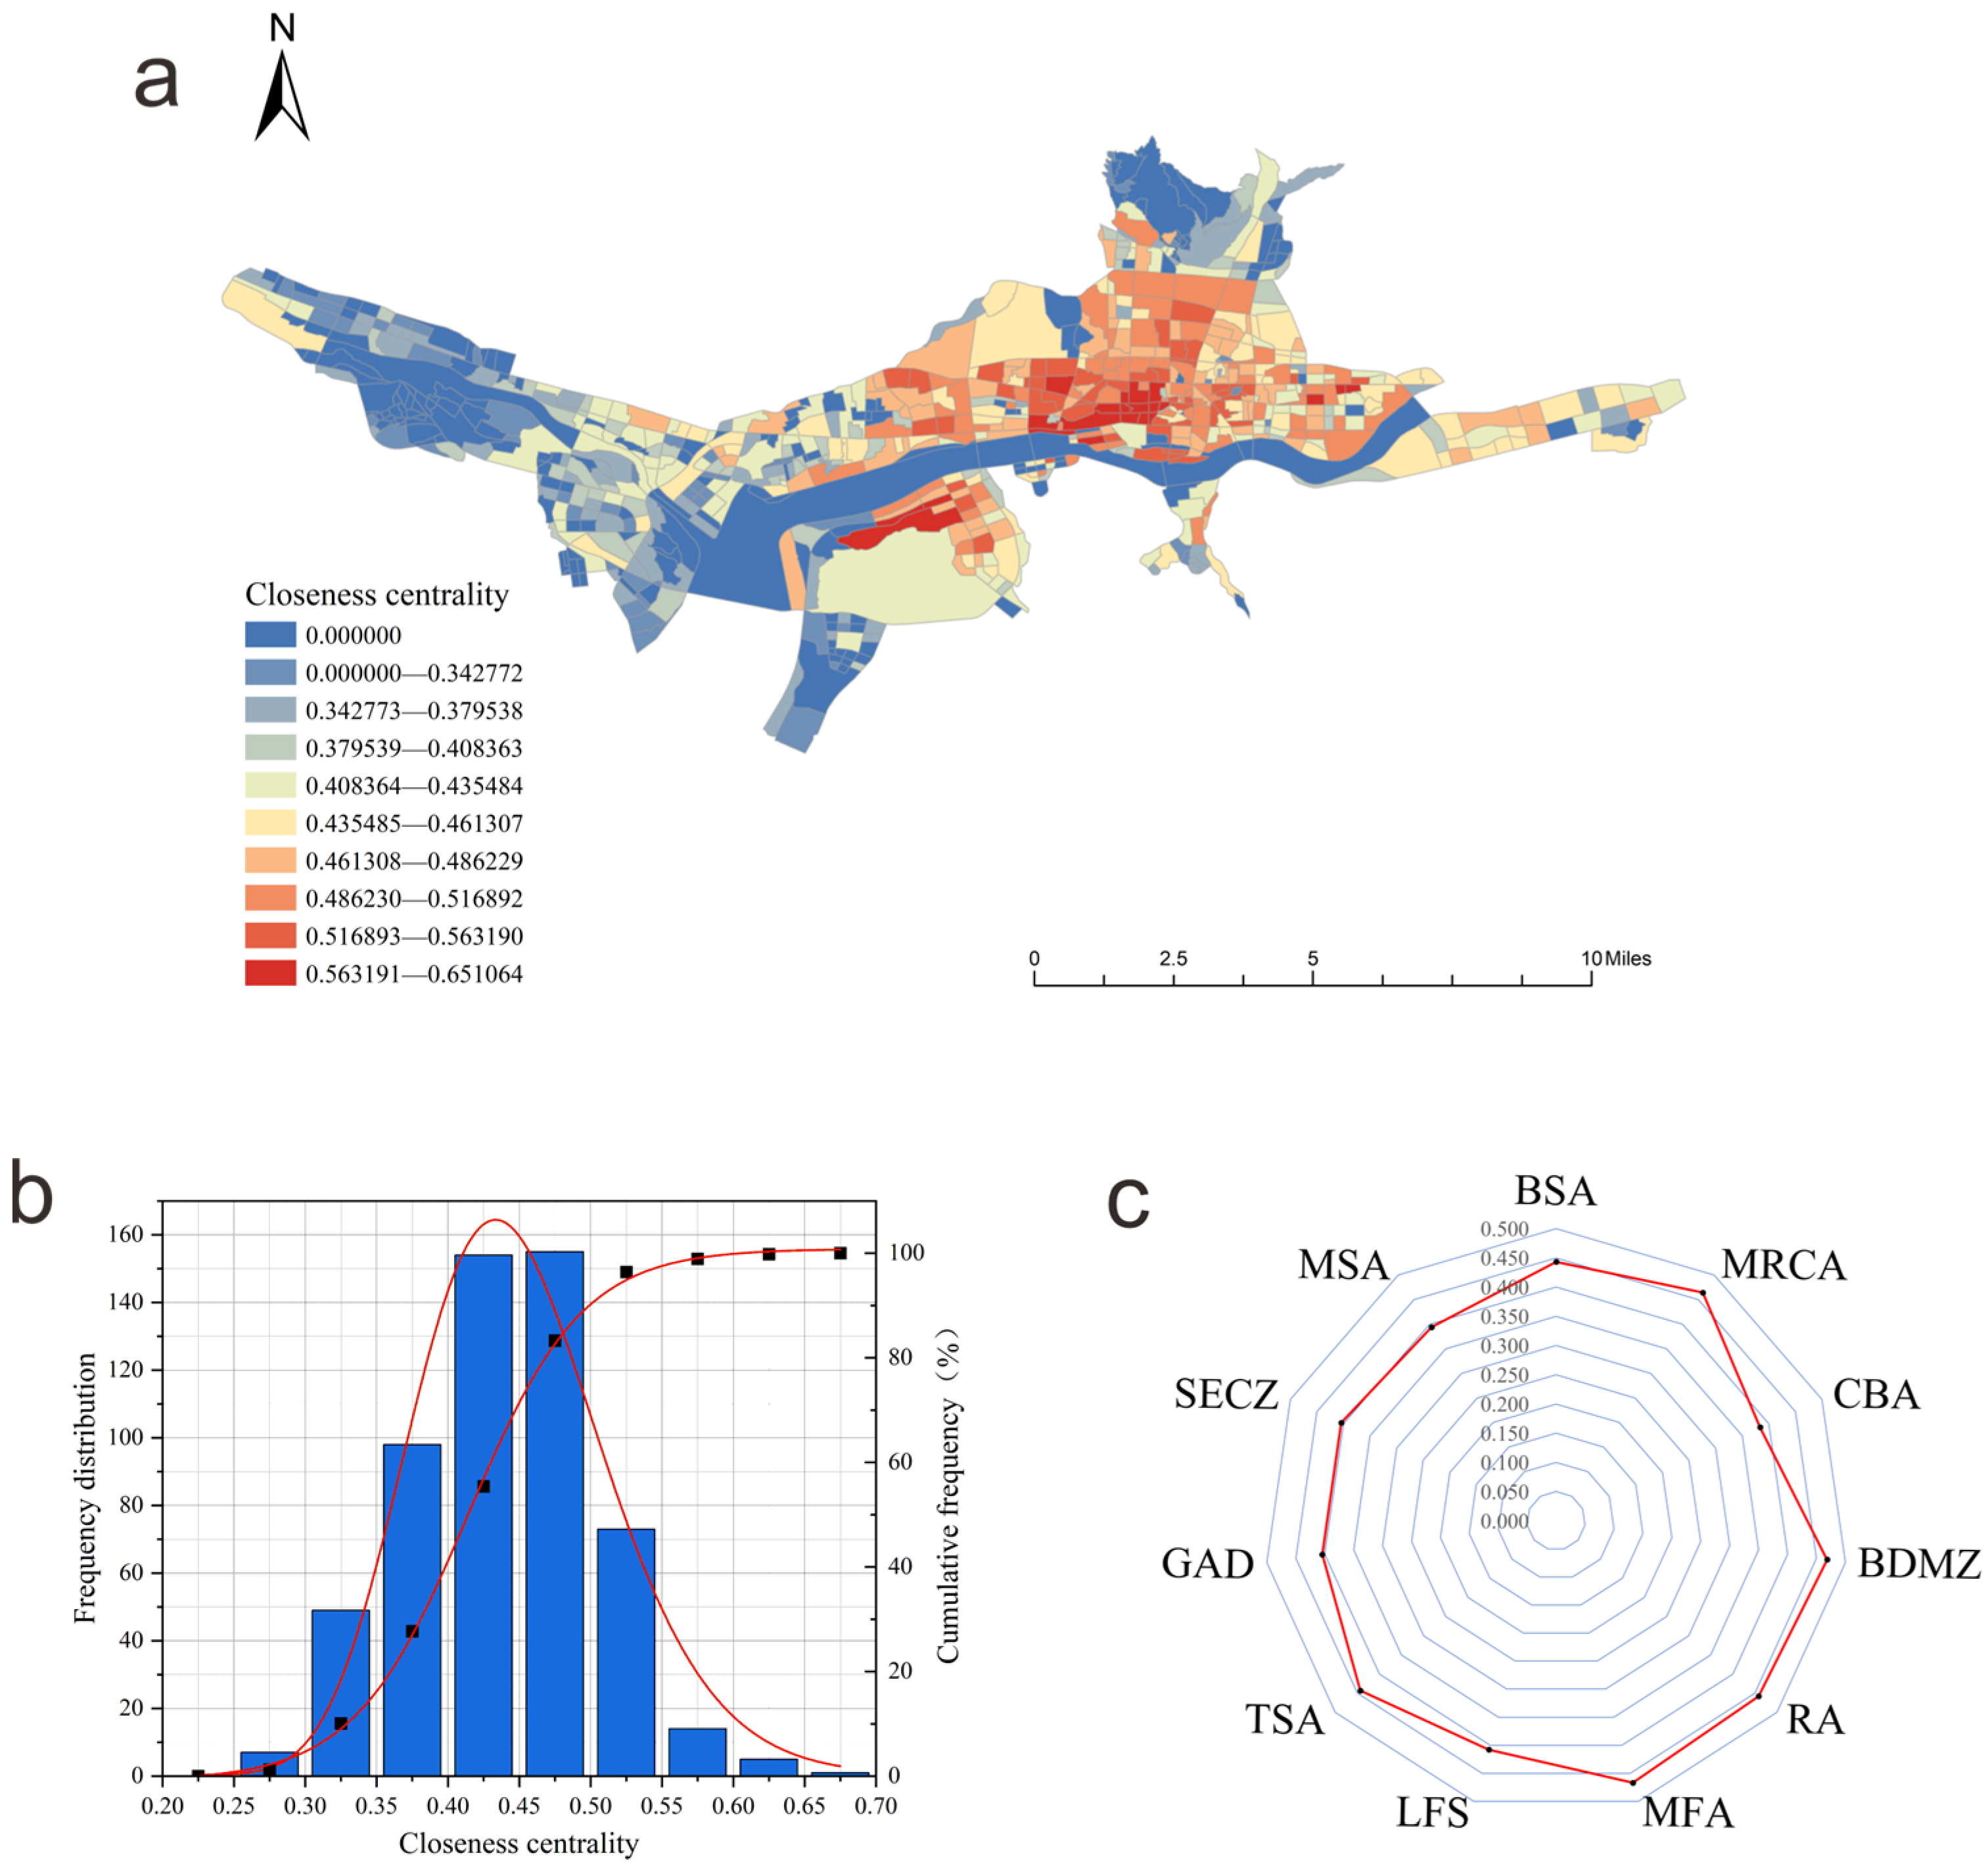
The spatial distribution of the closeness centrality indicator (Figure 7a) shows a significant core agglomeration characteristic and a gradient decreasing trend, with high-value areas concentrated in the central and eastern parts of the central urban area, forming a continuous high-value agglomeration belt. From the comparison of average closeness centrality across different functional types (Figure 7c), the differences in values between various functional zone types are not significant. The closeness centrality values of most areas are concentrated in the range of 0.3–0.6, indicating that the average shortest path lengths between nodes in the network are relatively close, and the overall accessibility efficiency is high.
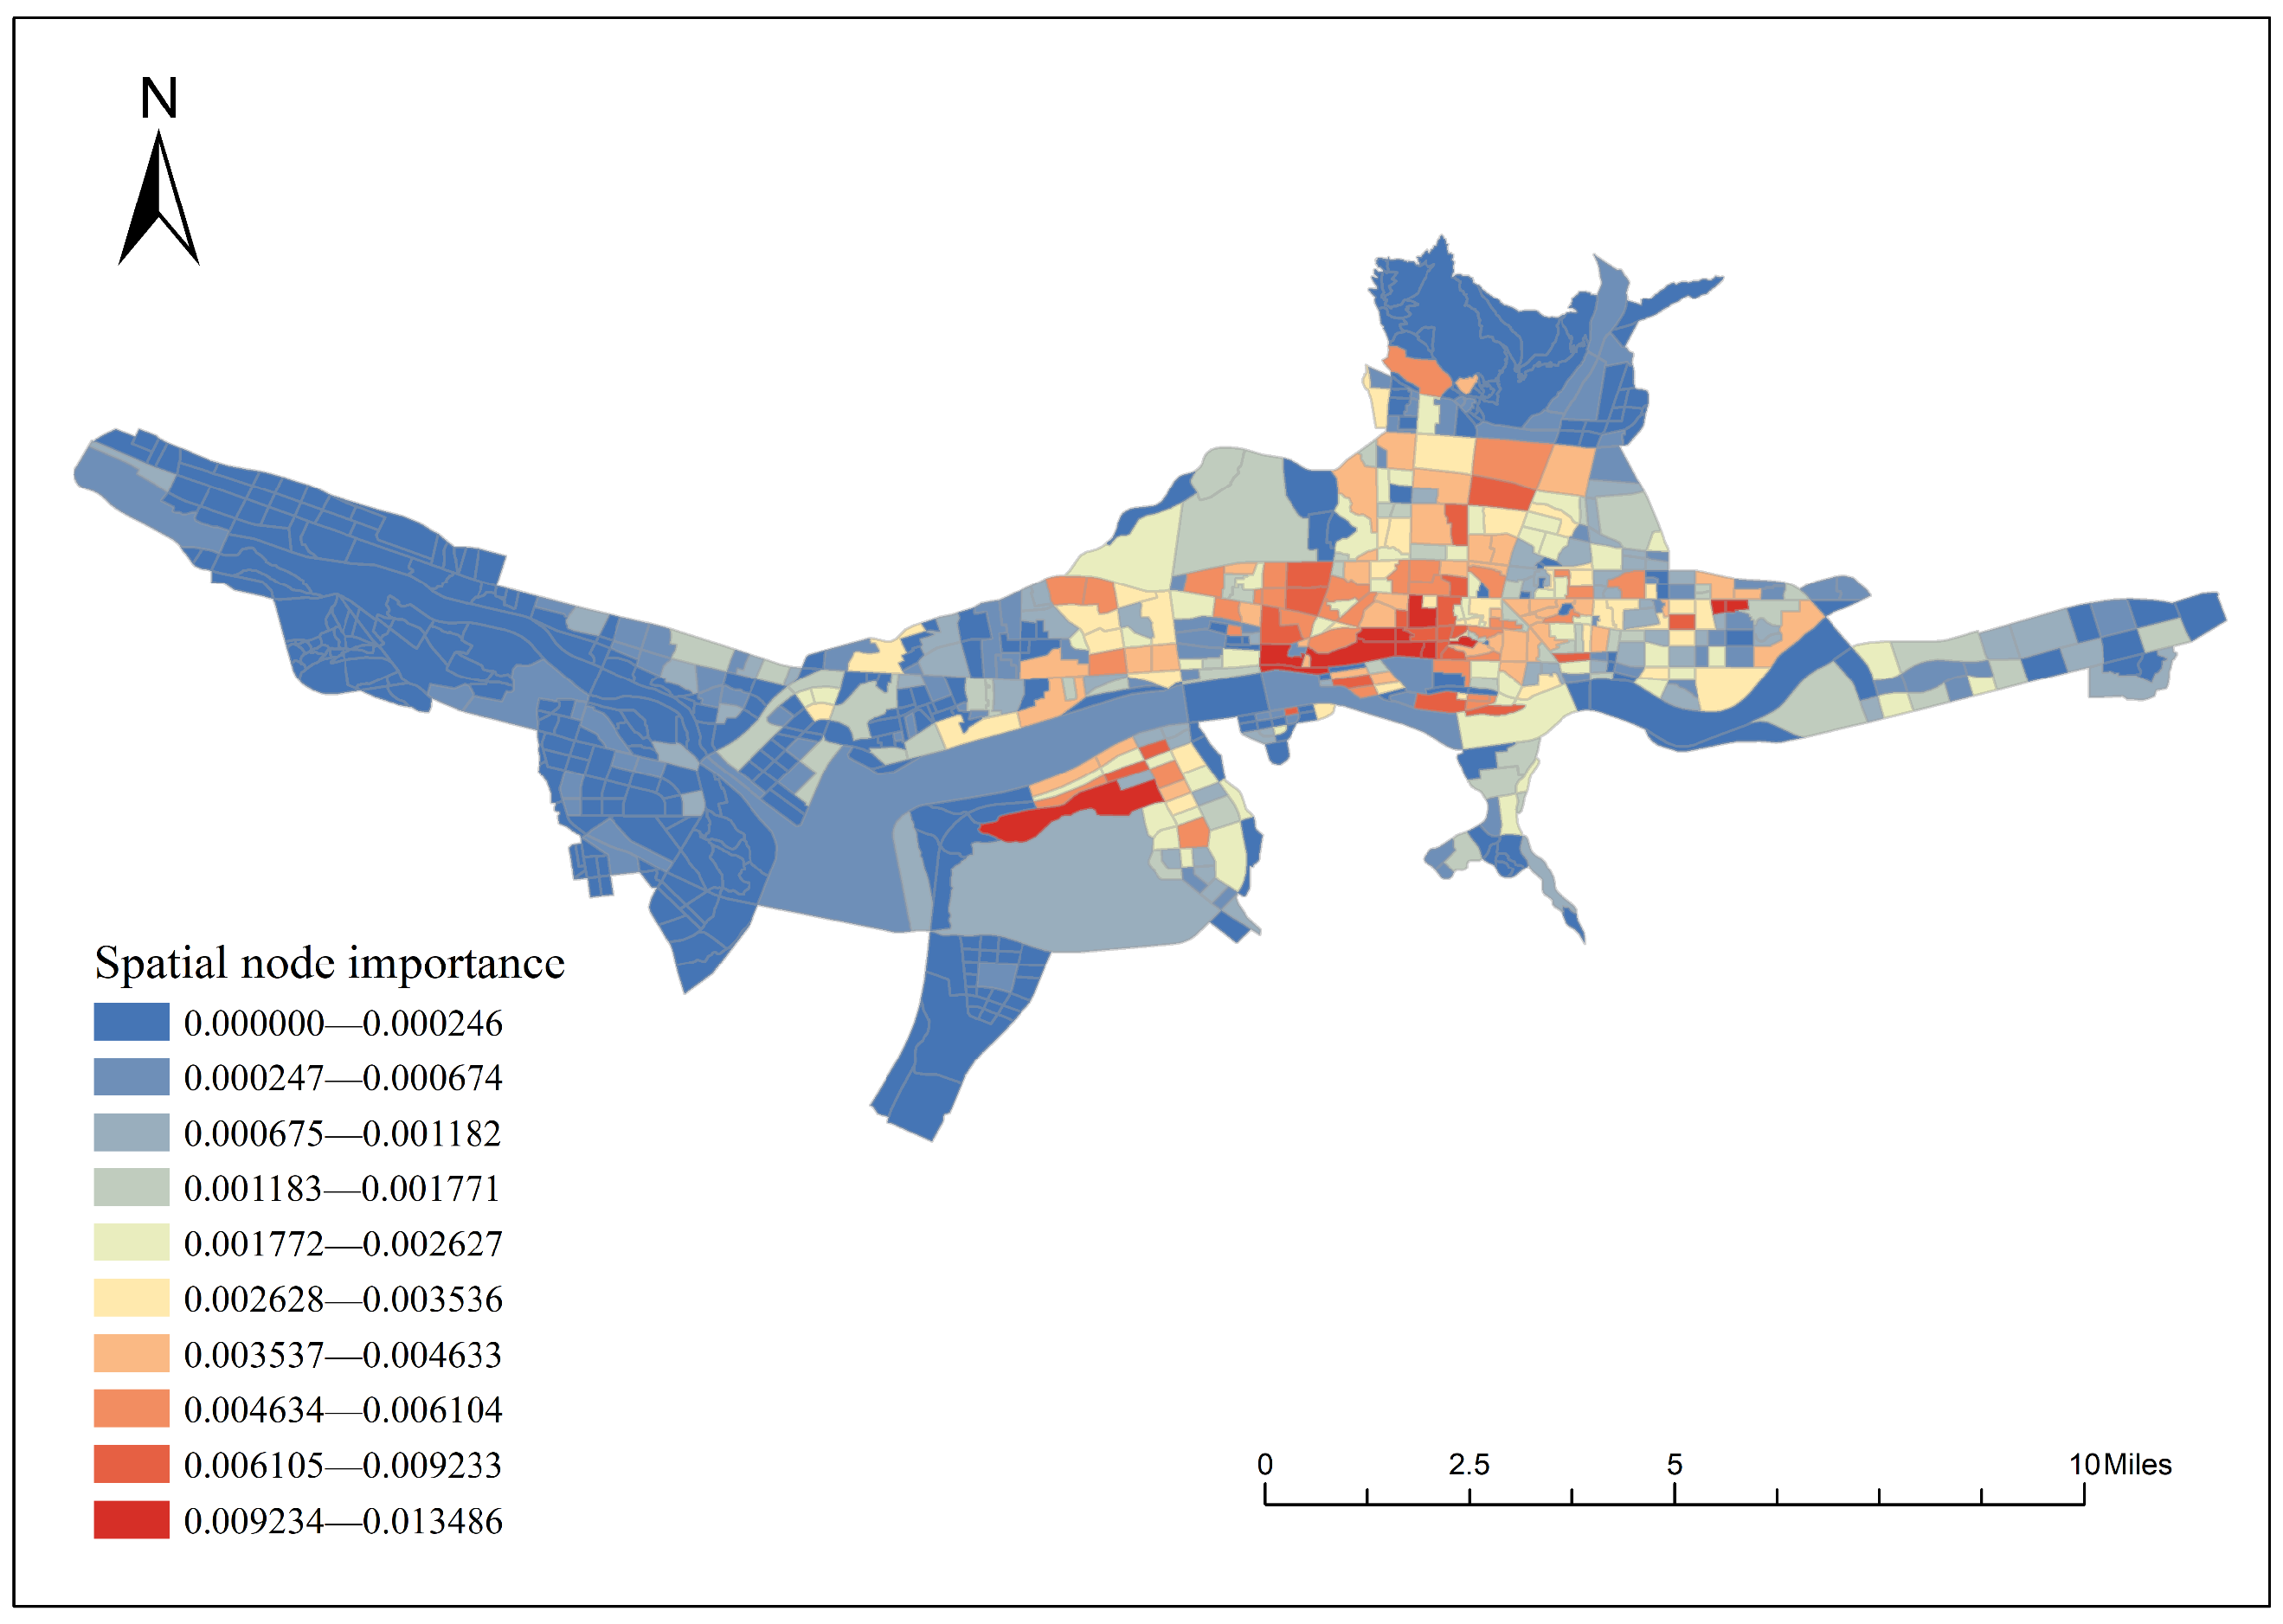
The entropy weight method was used to assign weights to the three centrality indicators, with the calculation results shown in Table 2. Subsequently, the comprehensive node importance evaluation index was calculated, obtaining the comprehensive importance value for each node. The spatial distribution characteristics are shown in Figure 8. Simultaneously, node importance was ranked and analyzed, and the top ten key areas were selected and statistically organized, with the specific results presented in Table 3.
According to the comprehensive node importance calculation results and ranking, important nodes in the Lhasa ride-hailing spatial interaction network exhibit obvious functional agglomeration characteristics and a trend of concentrated distribution in core areas. The spatial distribution of node importance presents a significant “core–periphery” pattern. High-importance nodes are mainly concentrated in three major types of areas: (1) a transportation hub area, centered around Lhasa Station, handling cross-regional passenger flow distribution; (2) core commercial areas, including Chengguan Wanda Plaza, Liuwu Wanda Plaza, Lhasa Department Store, etc., generating sustained and stable travel demand; (3) historical and cultural tourism areas, represented by the Potala Palace, Barkhor Street, and Jokhang Temple, relying on strong tourist appeal to form high-frequency passenger flow agglomerations.
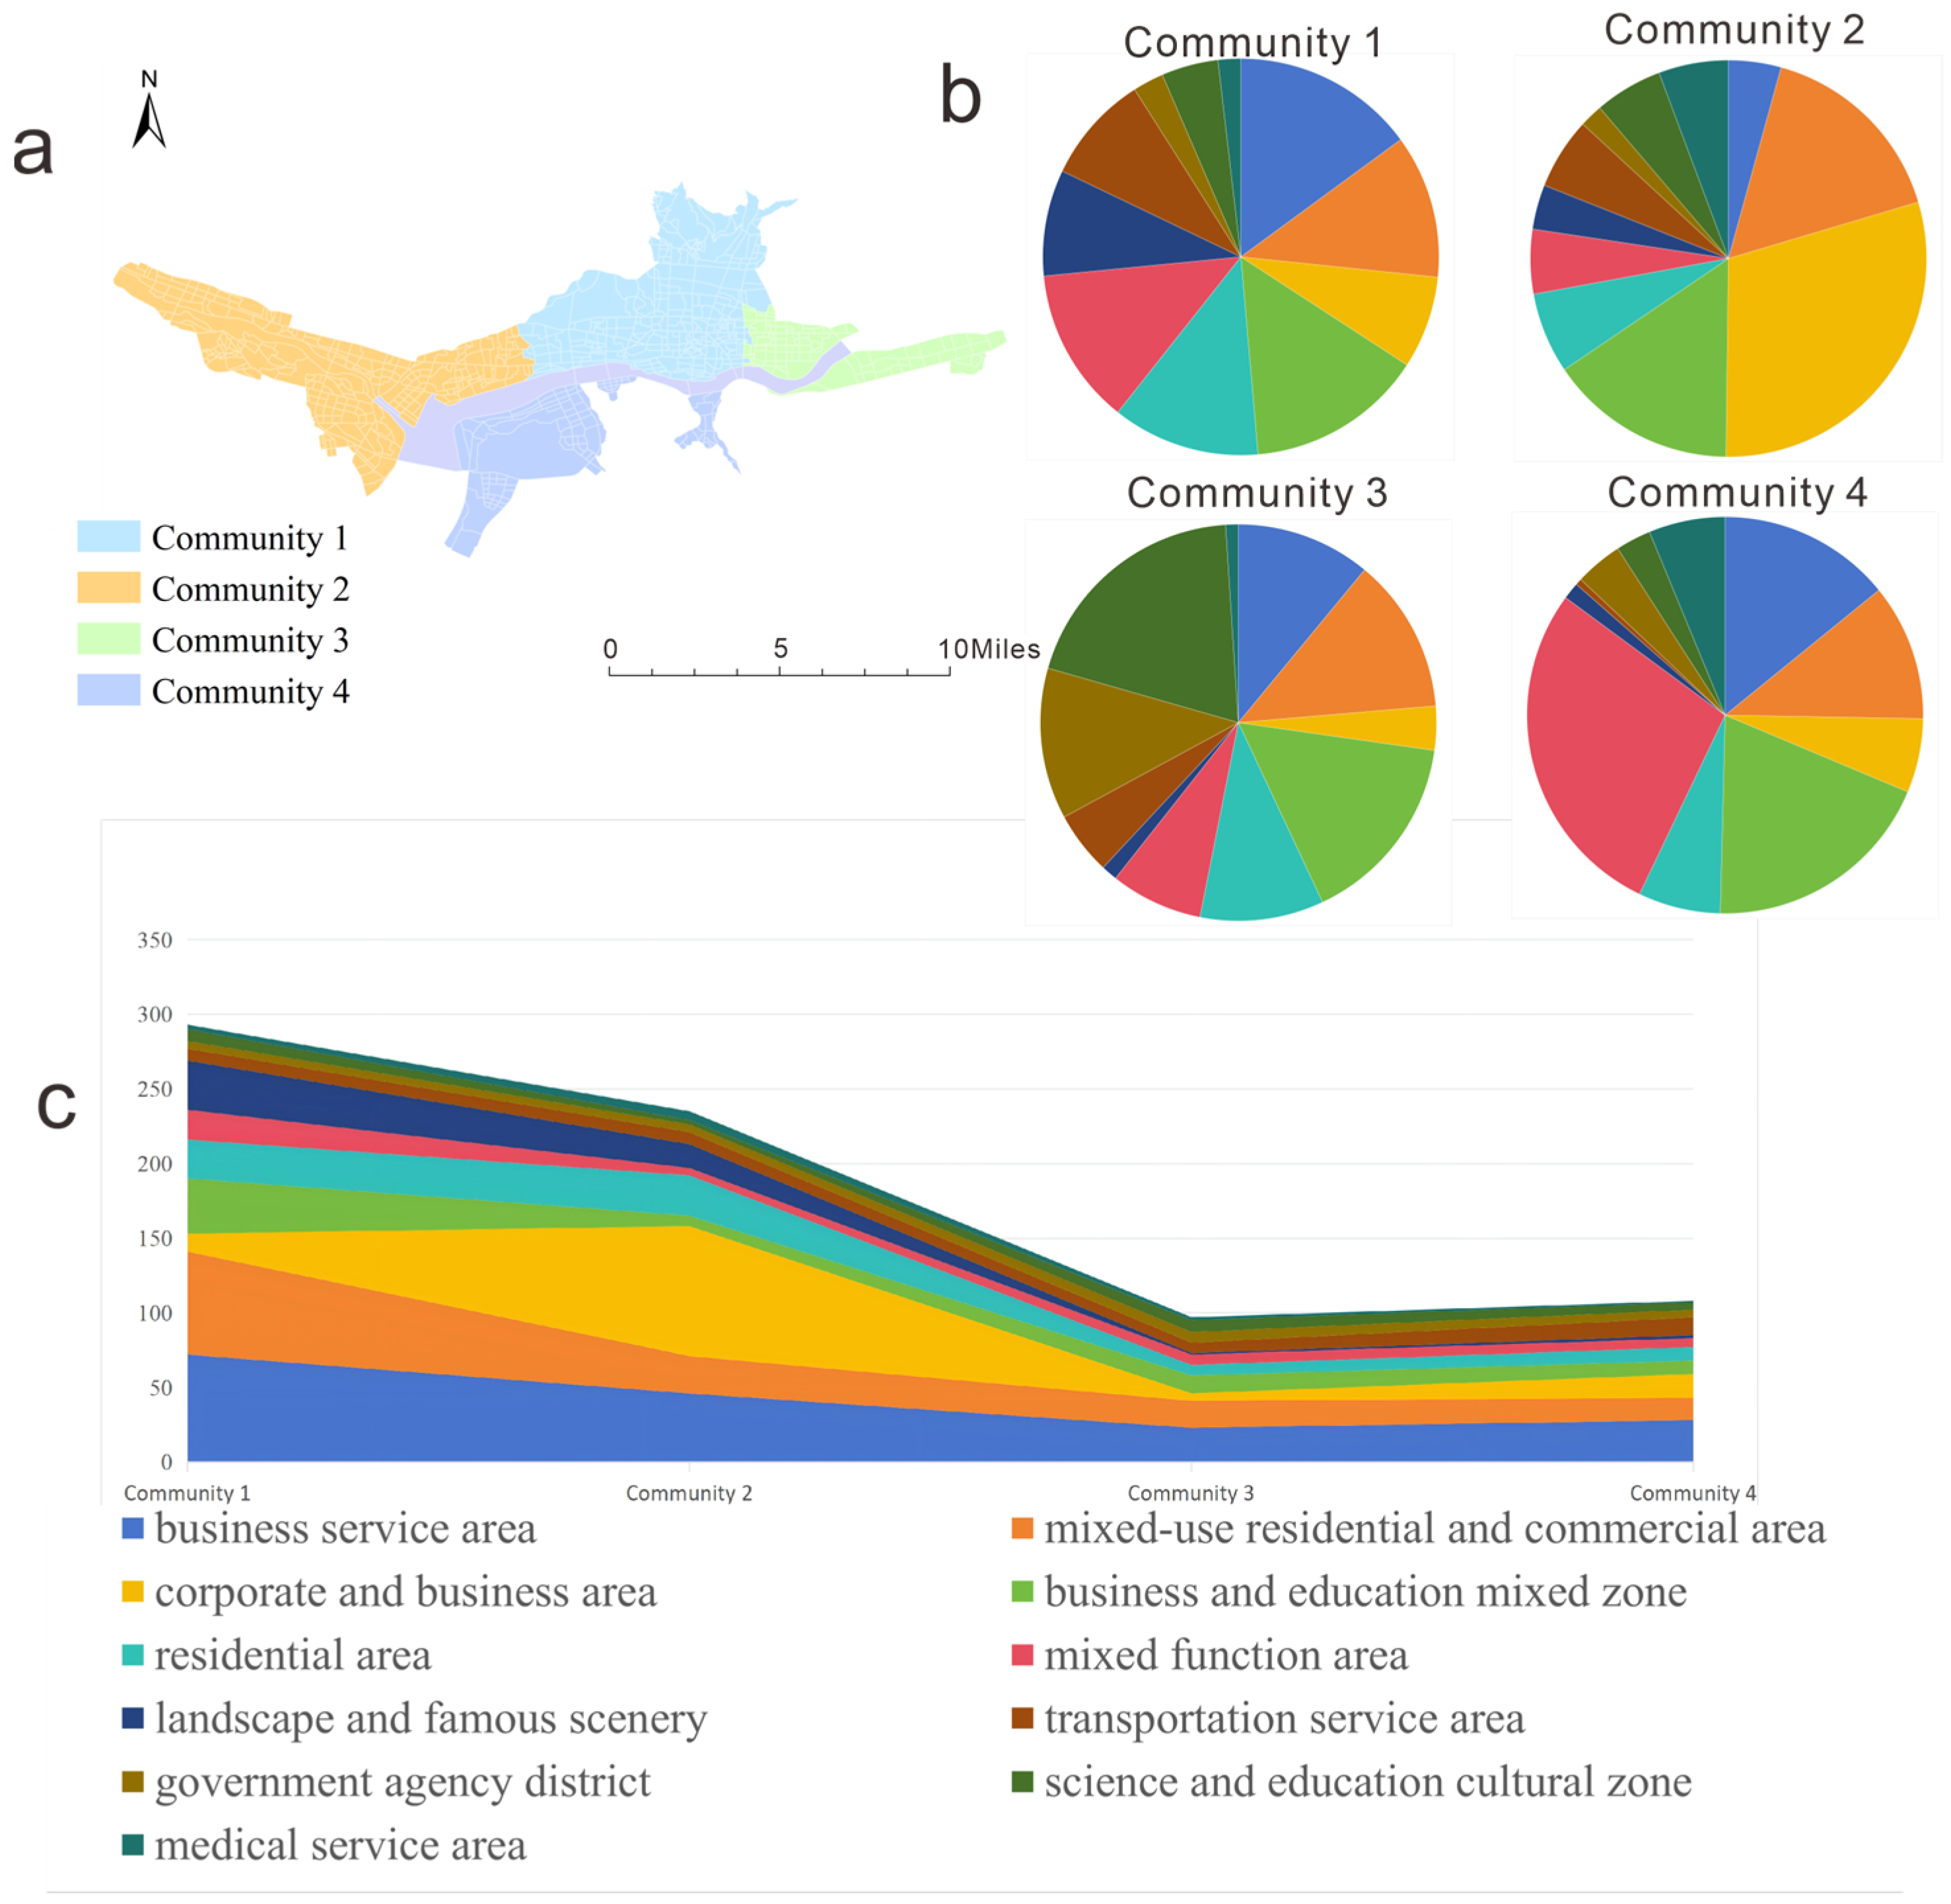
The Infomap algorithm was used to partition the spatial interaction network, identifying four relatively independent communities with high internal connectivity (Figure 9a). The modularity value is 0.412, indicating good community division results. From a spatial distribution perspective, Community 1 covers the core central urban area of Lhasa, centered on the Potala Palace–Barkhor Street area and extending east–west along Beijing Road and Jiangsu Road. It is the area with high multi-functional agglomeration in the city. Community 2 is distributed in the western part of the city, mainly in Doilungdêqên District, exhibiting characteristics of industry–residence integration. Community 3 is located in the eastern part of the city, dominated by science–education–culture functions, encompassing clusters of science, education, and cultural resources such as Tibet University (Nanjin Campus), Tibet Tibetan Medical University, and Lhasa Education City. Community 4 is distributed on the south side of the Lhasa River, centered around Lhasa Station and Liuwu New District, presenting a mixed-function area dominated by the transportation hub.
To clarify the functional positioning of each community within the overall urban development pattern of Lhasa, we conducted an analysis across two dimensions: regional functional composition and spatial interaction network characteristics. To further reveal the dominant functional characteristics of the community’s internal structure, this paper uses the average importance value of nodes of various functional zones within the same community as a measurement standard to identify the dominant functional type of the community, as shown in Figure 9b,c. The community division results show: Community 1 is dominated by commercial services and commercial–residential mixing, with prominent commercial–educational mixing and scenic spot functions. Its functional structure is balanced and has a high level of influence in the spatial interaction network, identified as the core area with multi-functional agglomeration. Community 2 has a significantly higher number of corporate enterprise areas compared to other communities, along with commercial–residential mixing and residential functions. It exhibits obvious industrial agglomeration characteristics, and enterprise nodes have strong connectivity functions within the network, identified as a comprehensive area dominated by corporate enterprise zones and commercial–residential mixed zones. Community 3 is smaller in overall scale but has a complete range of functional types. The importance of nodes in science–education–culture and government institution zones is prominent, presenting a functional support structure characterized by “limited quantity but strong influence,” defined as a comprehensive area dominated by science–education–culture zones and government institution zones. Community 4 is based on commercial services, corporate enterprises, and commercial–educational mixing functions. The number of transportation service zones is relatively prominent, with a high proportion of mixed-function zones and an obvious trend of functional integration, identified as a multi-functional mixed area dominated by commercial–educational mixed zones.

4.3. Characteristics of Community Interaction Networks

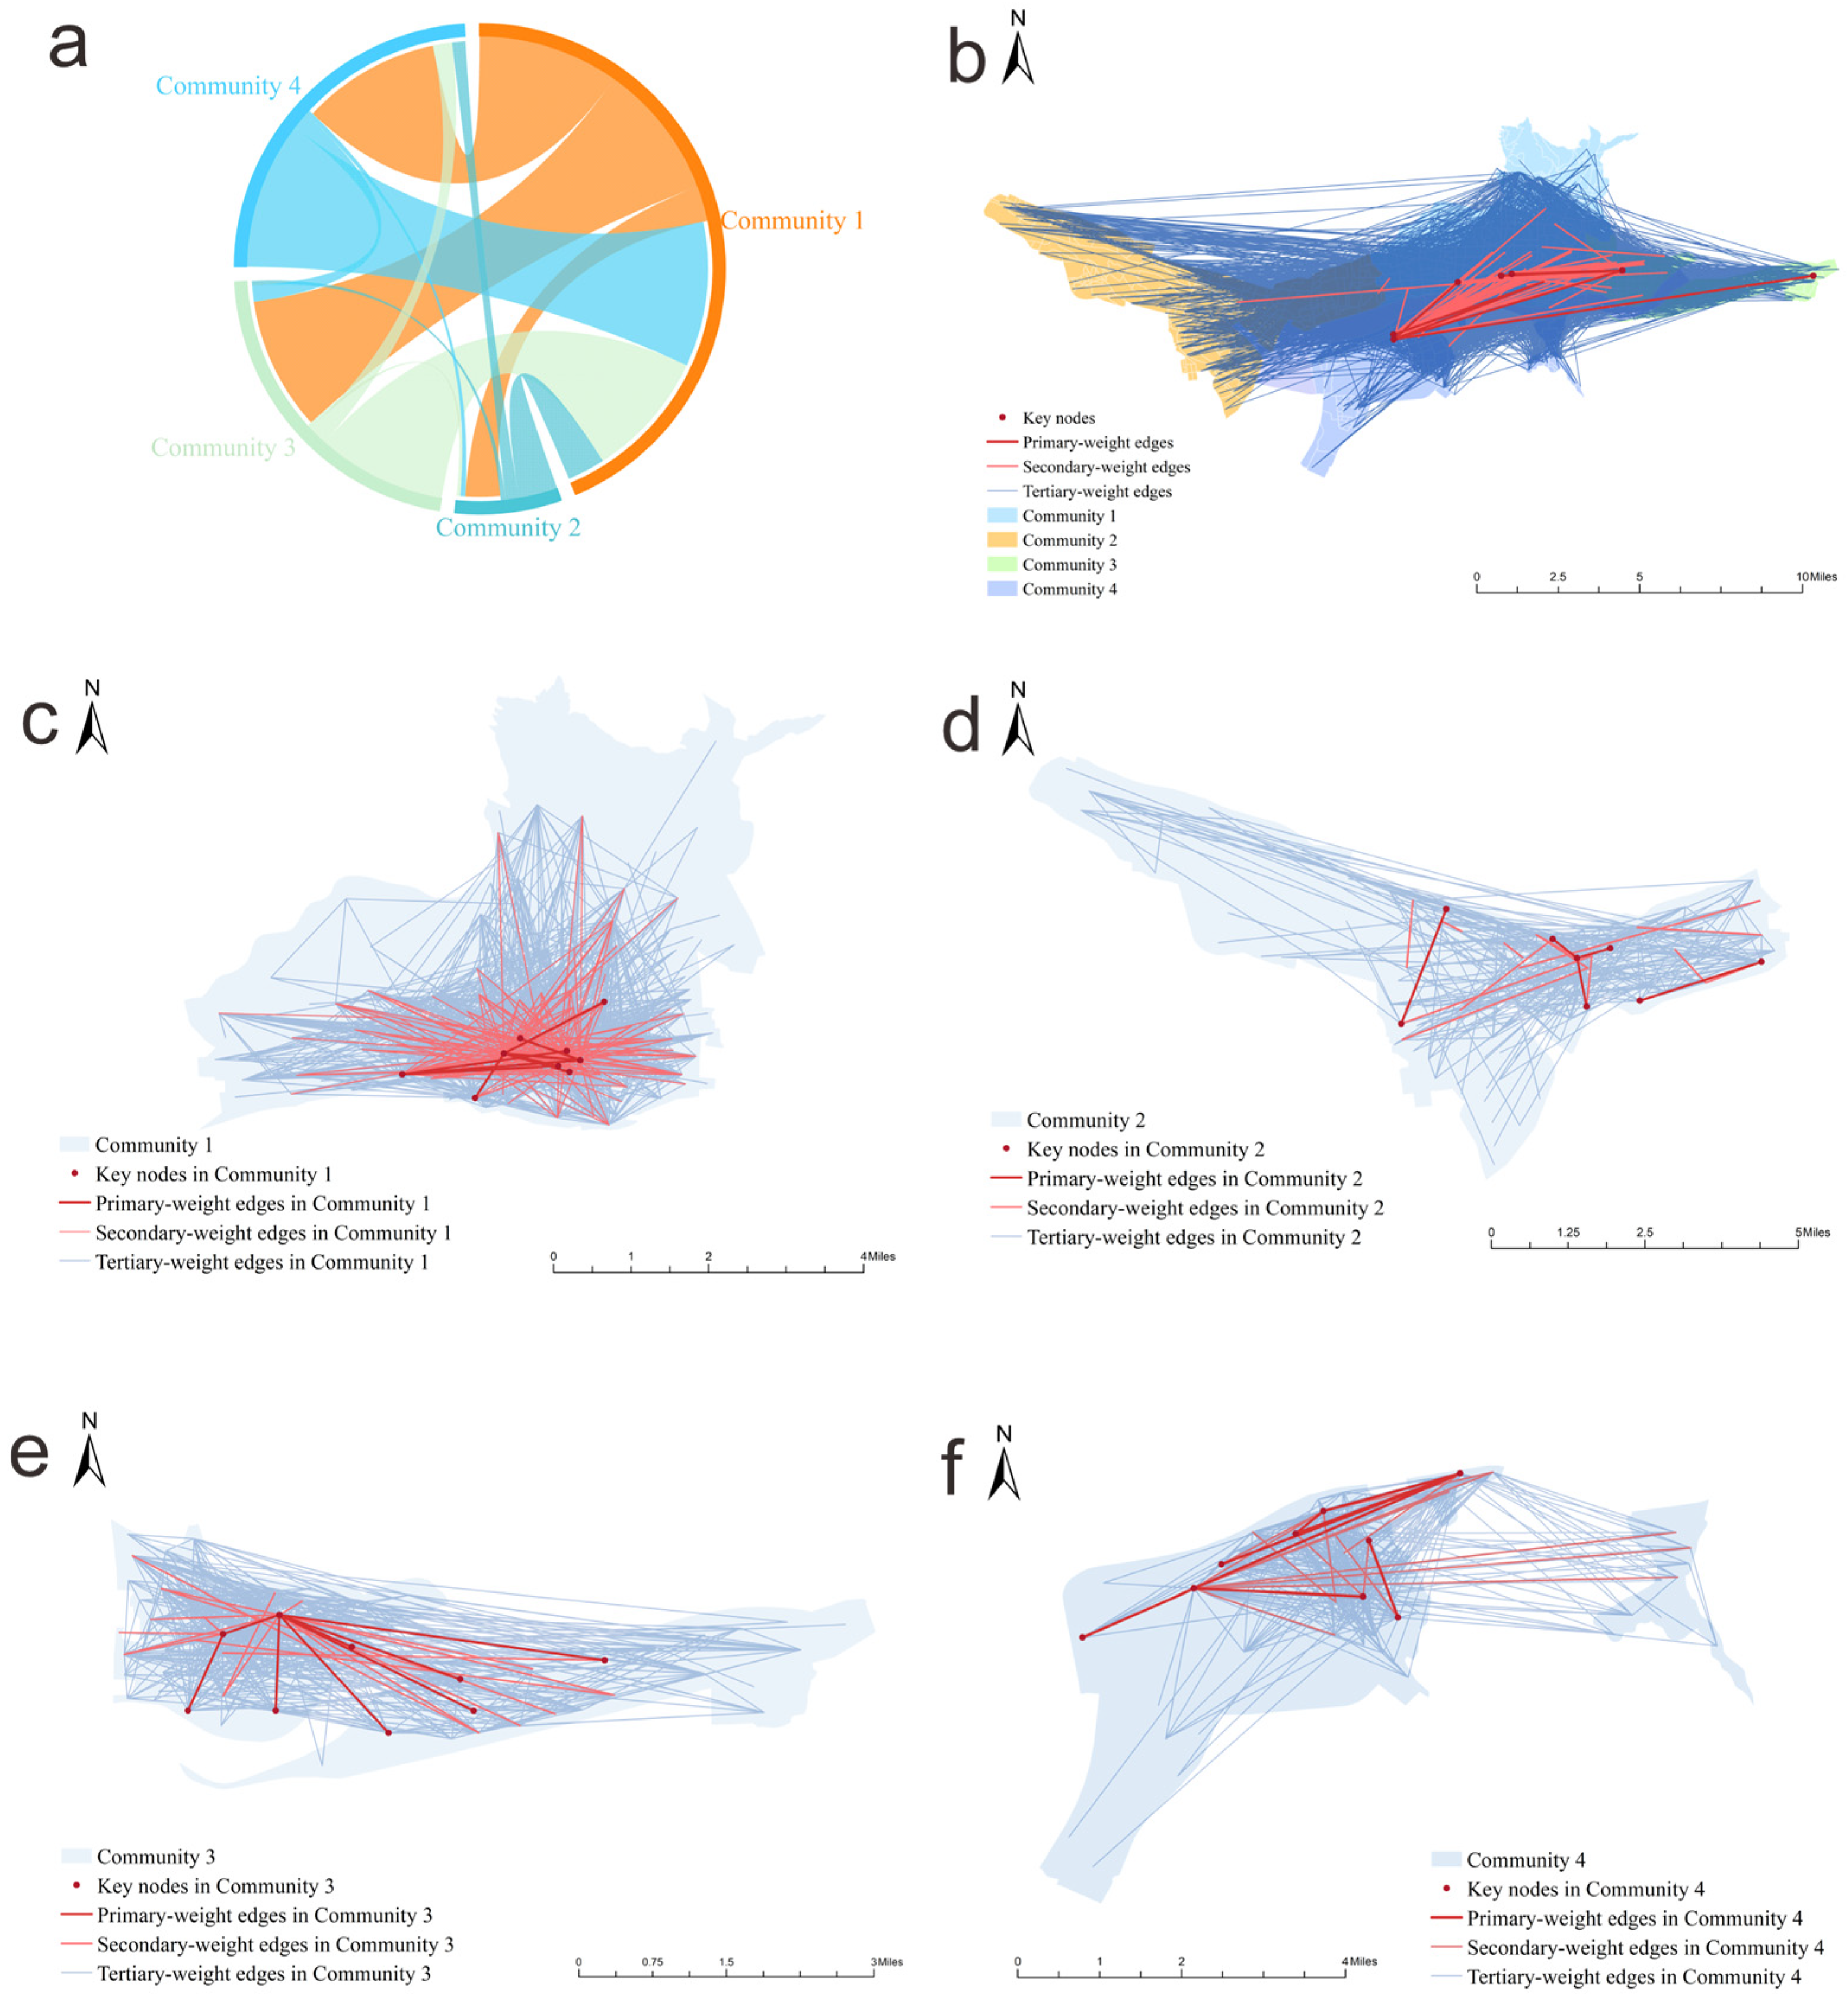
The inter-community interaction diagram (Figure 10a,b) shows that Community 1 dominates overall spatial connections, accounting for 45.18% of the total inter-community interaction volume. Connections between Community 1 and Community 3 and Community 4 are the most frequent, forming significant cross-community interaction channels, while interactions with Community 2 are relatively limited. From the perspective of the interaction network structure, trips where either the origin or destination is in Community 1 account for 65.38% of the total trajectory volume, exhibiting a significant core agglomeration effect. Potala Palace Square and Barkhor Street constitute important nodes for external connections, while Norbulingka, Tianhai International Plaza, and Gongdelin Tianjie serve as secondary nodes. Community 2 accounts for only 8.23% of the total inter-community interaction volume, indicating relatively limited external connections. Community 3 accounts for over 20% of inter-community interaction volume, with Tibet University (Nanjin Campus), Chengguan Wanda Plaza, and Lhasa Municipal People’s Government as its core nodes, presenting an interaction characteristic dominated by science–education with multi-functional coordination. Community 4 accounts for over 20% of inter-community interaction volume, with Lhasa Station as its core node. External connections primarily revolve around the transportation hub, reflecting a traffic-dominant spatial organization characteristic. The overall pattern is a center–subcenter spatial organization with “Community 1 as the core, Communities 3 and 4 as important supports, and Community 2 with weaker connections.”
The intra-community interaction sub-network characteristic diagram (Figure 10c–f) shows that the Community 1 interaction sub-network presents a dual-center network structure centered around the area near the Potala Palace and the area near Barkhor Street. High-weight connections are mainly distributed between commercial complexes and residential areas, such as Jixiang Garden–Tianhai International Plaza, Xianzu Island Garden Community–Lalu Wetland. Over 55% of trips are concentrated during the evening peak hours and weekends, inferred to be primarily for shopping, leisure, and entertainment purposes, belonging to a shopping- and leisure-dominated interaction hotspot area. The Community 2 interaction sub-network presents a multi-center sub-network structure formed on the east side, with high-weight connections distributed around residential areas and enterprise parks. Residential areas like Shibang Oujun and Shitong Yangguang Xincheng and enterprise clusters like Zhongxing International Comprehensive Industrial Park and Innovation and Entrepreneurship Park constitute the core supporting nodes. Corporate enterprise zones are spatially close to their supporting residential areas, showing strong job–housing spatial coupling characteristics, belonging to a job–housing interaction community. The Community 3 interaction sub-network has slightly higher node importance and interaction intensity on the west side compared to the east. The western sub-network has Tibet University (Nanjin Campus), Chengguan Wanda Plaza, and Lhasa Municipal People’s Government as its core nodes. The eastern sub-network has Lhasa Normal College, Tibet Tibetan Medical University, and Lhasa Education City as its core nodes. Functional types include administrative offices, medical services, higher education, commercial services, and residential living, belonging to an interaction hotspot area mainly characterized by the daily travel of residents and enrolled students. The Community 4 interaction sub-network presents a triangular network structure with Lhasa Station as the main node. Secondary nodes include corporate enterprise zones like International Headquarters City and Zheshang Tower, commercial areas like Liuwu Wanda Plaza and Wangfujing Shopping Center, and residential areas like Tianzhi Yapu Yangguang Huayuan and Hailiang Century Xincheng. High-weight connections are mainly distributed between Lhasa Station and the secondary nodes, belonging to a comprehensive commercial–residential-employment interaction area centered around Lhasa Station.
In summary, the spatial interaction network of Lhasa exhibits a clear hierarchical and multi-center characteristic. Due to differences in location conditions, functional positioning, and development paths, different communities have formed their unique interaction patterns. The functional differentiation among core hub nodes, secondary support nodes, and peripheral nodes together constitutes the complete organizational system of urban spatial interaction. These findings confirm that the network is temporally sensitive. The static network presented in Section 4.2.1 and Section 4.2.2 effectively captures the aggregated pattern over the entire month, but the weekday–weekend comparison reveals that functional roles of certain zones are time-dependent.
Table 4 lists the top 10 destinations (by average daily ride-hailing arrivals) on weekdays and weekends, further illustrating the temporal shift in travel patterns. On weekends, scenic and commercial nodes such as the Tibet Museum, Potala Palace, and Jokhang Temple dominate the ranking, with notably higher arrival frequencies than on weekdays. Conversely, some entertainment venues (e.g., Lhasa Zhi Ge BAR) appear among the top 10 only on weekdays, suggesting a different travel purpose pattern.

5. Discussion

5.1. Complexity Characteristics of the Spatial Interaction Network and Their Urban Implications

The urban spatial interaction network constructed in this study exhibits typical small-world effects (s > 1) and a heterogeneous degree distribution, where a small fraction of nodes (e.g., Lhasa Station, Wanda Plaza) carry a large share of connections. The small-world characteristic indicates that resident travel in Lhasa has high connectivity efficiency at the network level. On average, any two areas require only 2.329 intermediate nodes to connect, suggesting that despite the strip-like urban form constrained by the plateau river valley, the transportation system can still effectively support cross-regional travel demand. The heterogeneous structure revealed by the scale-free property, where “a few nodes carry a large number of connections,” manifests in Lhasa as transportation hubs (Lhasa Station), core commercial areas (Wanda Plaza, Department Store), and historical–cultural landmarks (Potala Palace, Barkhor Street) occupying core positions in the network. This finding corroborates the basic judgment of the “central flow” theory in urban networks [41]. From a planning practice perspective, these high-importance nodes should be prioritized for urban public service allocation, transportation hub optimization, and emergency management.
In the node importance evaluation, the weight of betweenness centrality (0.5849) significantly exceeds that of degree centrality (0.3102) and closeness centrality (0.1049), indicating that the intermediary bridging role contributes most prominently to the comprehensive importance of nodes. Lhasa Station, as the top-ranked key node, exemplifies this characteristic with its high betweenness centrality of 0.037—it not only serves travel demand in its own area but also undertakes the hub function connecting various parts of the city, such as the north–south and east–west zones.

5.2. Coupling Relationship Between Community Structure and Urban Functional Space

The four spatial interaction communities identified by the Infomap algorithm are highly consistent with the actual urban functional zoning and spatial evolution patterns of Lhasa. Community 1, as the core area with multi-functional agglomeration, exhibits a high degree of functional mixing in commercial services, commercial–residential areas, and scenic spots, accounting for 45.18% of inter-community interaction volume, presenting a typical center-radiation structure. This aligns with the overall urban planning pattern of Lhasa, where the old town serves as the tourism service center and commercial core, undertaking the central function of organizing the city’s spatial interactions. The high-frequency shopping and leisure trips during evening peak hours and weekends within Community 1 reflect its functional positioning as the city’s consumption center. The industry–residence integration characteristics of Community 2 and the prominent position of corporate enterprise areas reveal the agglomeration trend of industrial space in western Lhasa. The spatial proximity between corporate enterprise zones and their supporting residential areas within this community, with obvious job–housing interaction characteristics, is consistent with conclusions from existing research on job–housing spatial relationships identified through commuting [35]. This spatial coupling helps shorten commuting distances and alleviate traffic pressure, representing an important direction for urban spatial optimization. Notably, Community 2 has a relatively low level of interaction with other communities (8.23%), suggesting a degree of functional self-sufficiency, consistent with the planning positioning of Doilungdêqên District as a sub-center of the city. The characteristic of Community 3, “dominated by science–education with limited quantity but strong node influence,” reflects the special role of science–education–culture facilities in spatial organization. Higher education institutions like Tibet University and Tibet Tibetan Medical University are not only the city’s knowledge innovation centers but also important nodes for inter-regional pedestrian flow. This finding expands the perspective of previous urban network studies that often focused on commercial and transportation nodes [36,39], suggesting that the function of science–education–culture facilities in urban spatial interaction deserves further attention. The transportation hub-type interaction network formed by Community 4 around Lhasa Station reflects the significant role of gateway nodes in shaping urban spatial structure. As an important node of the Qinghai–Tibet Railway, Lhasa Station undertakes the crucial function of connecting out-of-region passenger flow with intra-city travel. The surrounding mixed area of commerce, residence, and office is a practical manifestation of the TOD (Transit-Oriented Development) model in a plateau city. The distribution of high-weight connections mainly between Lhasa Station and secondary nodes within Community 4 validates the driving effect of transportation hubs as urban spatial growth poles. This study used ride-hailing trajectory data collected exclusively in July 2024. July is the peak tourist season in Lhasa, which may have systematically biased our findings. Specifically, the high importance assigned to scenic nodes such as the Potala Palace, Barkhor Street, and Jokhang Temple, as well as the dominant position of Community 1 (the core multi-functional area), is likely inflated compared to a year-round average. We acknowledge that during the peak tourist season, the demand for travel to and from scenic spots, hotels, and transportation hubs (e.g., Lhasa Station) increases substantially. This temporal concentration of tourist flows could amplify the observed betweenness centrality and degree centrality of these nodes. Consequently, the functional mixing degree of core areas may be overestimated, while the relative importance of residential zones and local service facilities in non-tourist seasons may be underrepresented.

6. Conclusions and Limitations

6.1. Conclusions

This study takes the central urban area of Lhasa as the research object, integrates ride-hailing trajectory data and Point of Interest (POI) data, proposes an urban functional zone identification method that balances static functional attributes and dynamic travel behavior, and constructs a directed weighted urban spatial interaction network. Using complex-network analysis and community detection algorithms, it deeply explores the functional spatial structure and regional interaction characteristics of Lhasa. The main conclusions are as follows:
(1) In terms of functional zone identification, this study quantified the spatial influence range of POIs using Thiessen polygons and innovatively employed an address matching algorithm to associate ride-hailing OD points with POIs, assigning access weights to POIs that reflect the actual intensity of resident activities. The land use intensity index calculated based on this effectively identified the functional mixing degree in the study area, with its spatial distribution showing a pattern of “highly composite core, relatively differentiated periphery.” By subdividing the mixed-function zones accounting for 30.60% using K-Means clustering, eight refined functional zone types were ultimately identified, including commercial–residential mixed, commercial–educational mixed, science–education–culture, transportation service, and scenic spot zones. This revealed the spatial pattern of Lhasa, characterized by a base of residential areas, high multi-functional mixing in the core area, industrial agglomeration in the west, and a point-like distribution of science–education–culture areas.
(2) Regarding the characteristics of the spatial interaction network, the network constructed based on ride-hailing OD (750 nodes, 103,534 edges) exhibits typical small-world effects (average path length 2.329, average clustering coefficient 0.350). Although the degree distribution shows a certain degree of heterogeneity, it does not follow a power law; instead, it is better characterized by a lognormal distribution. In the node importance evaluation, betweenness centrality had the highest weight (0.5849), revealing that nodes such as Lhasa Station, the Potala Palace, and core commercial areas are not only active themselves but also serve as key intermediaries connecting different urban sections, forming the backbone of urban spatial interaction.
(3) In terms of community structure and interaction patterns, the Infomap algorithm identified four spatial interaction communities highly coupled with urban functional divisions (modularity Q = 0.412). Community 1 is the core area with multi-functional agglomeration, dominating city-wide connections with 45.18% of inter-community interaction volume, and internally forms a dual-center sub-network for shopping and leisure purposes. Community 2 is an industry–residence integrated area, exhibiting strong job–housing spatial coupling but weaker external connections. Community 3 is a science–education–culture dominated area, whose nodes, though limited in number, have prominent influence within the network. Community 4 is a transportation hub-dominated area, forming a TOD pattern interaction network centered on Lhasa Station. The overall pattern is a center–subcenter spatial organization with “a single core leading, two wings supporting, and weaker periphery.”

6.2. Research Limitations and Future Prospects

Although this study has made some progress, it still has the following limitations: Firstly, there is a tension between the static attributes of POI data and the dynamic changes in urban activities. Although this study introduced some dynamic information through access weights, it did not consider the temporal rhythm characteristics of POI functions (e.g., catering POIs have high activity at night, office POIs have high activity during the day). Future research could incorporate time-series POI activity data to characterize the dynamic evolution of urban functions from a temporal dimension. Secondly, this study uses Thiessen polygons to approximate the planar spatial influence range of POIs, and we acknowledge certain inherent limitations of this method. First, it assumes that the influence of POIs is continuous and isotropic in planar space, failing to reflect the cutting effect of physical barriers such as roads and rivers on service areas. Second, for vertically distributed POIs within high-rise buildings (e.g., companies in office towers), Thiessen polygons erroneously divide them into mutually independent areas on the plane, thereby underestimating the vertical compounding of these functions. Future research could consider integrating building footprint and floor-level data, or adopt network Voronoi diagrams based on road networks, to more accurately delineate the actual service hinterlands of POIs. Nevertheless, in large-scale study areas lacking fine-grained three-dimensional urban models, Thiessen polygons remain a widely accepted and computationally efficient approximation, and their limitations do not substantially affect this study’s ability to reveal the spatial pattern of “core compounding and peripheral differentiation” in Lhasa at the macro level. Third, there is the limitation of using a single data source. This study only used ride-hailing trajectory data to characterize resident travel, failing to cover other travel modes such as buses, private cars, and bike-sharing. Future research could integrate multi-source transportation data (e.g., bus IC card data, bike-sharing trajectories) to construct a more comprehensive urban resident travel network. Fourth, this study constructed a static network based on one month’s data, making it difficult to reflect the impact of seasonal changes, holiday effects, etc., on urban spatial interactions. As a tourist city, Lhasa has significant differences in visitor flow between peak and off-peak seasons. Subsequent research could conduct multi-period comparative studies to reveal the dynamic evolution patterns of urban spatial interaction. Fifthly, we were unable to provide a direct quantitative comparison with simple baseline methods based on POI density or area weighting. Although from a theoretical perspective, integrating ride-hailing travel weights can more accurately reflect residents’ actual intensity of urban function usage, the lack of quantitative comparison indeed weakens the evidence for the effectiveness of the proposed method. Future research will be specifically designed as a controlled experiment, employing multiple baseline methods (e.g., POI count only, Thiessen polygon area only, POI + kernel density) and using a unified validation set (e.g., manually interpreted samples) and quantitative metrics (e.g., overall accuracy, Kappa coefficient) to rigorously evaluate the performance gains of our framework. This will provide more solid support for the application value of the method.

Author Contributions

Conceptualization, X.W.; Methodology, J.T. and J.L.; Software, J.T. and J.L.; Validation, X.W., L.Y., J.L. and C.L.; Formal analysis, S.L. and X.W.; Investigation, L.Y. and H.Z.; Resources, S.L., X.W., L.Y. and H.Z.; Data curation, J.C., L.Y. and H.Z.; Writing—original draft, J.T.; Writing—review & editing, S.L. and W.X.; Visualization, J.C. and C.L.; Project administration, J.Z.; Funding acquisition, J.Z. All authors have read and agreed to the published version of the manuscript.

Funding

This research is funded by Key Projects of National Natural Science Foundation of China [grant number 42230307]; Xizang Natural Science Foundation Project [grant number XZ202501ZR0098]; Ecology Innovation and Entrepreneurship Category B Project [grant number 2025-CX-B007].

Data Availability Statement

The data presented in this study are available on request from the corresponding author.

Conflicts of Interest

The authors declare no conflict of interest.

References

  1. Du, Z.H.; Zhang, X.Y.; Li, W.W.; Zhang, F.; Liu, R.Y. A multi-modal transportation data-driven approach to identify urban functional zones: An exploration based on Hangzhou City, China. Trans. Gis 2020, 24, 123–141. [Google Scholar] [CrossRef]
  2. Wang, Y.X.; Yang, S.W. Identification of surface thermal environment differentiation and driving factors in urban functional zones based on multisource data: A case study of Lanzhou, China. Front. Environ. Sci. 2024, 12, 1466542. [Google Scholar] [CrossRef]
  3. He, L.; Song, Y.; Dai, S.Z.; Durbak, K. Quantitative research on the capacity of urban underground space—The case of Shanghai, China. Tunn. Undergr. Space Technol. 2012, 32, 168–179. [Google Scholar] [CrossRef]
  4. Meng, C.H.; Yang, Y.C.; Zhang, C.G. Research on imago space of valley city—A Case Study of Lanzhou City. Chin. Geogr. Sci. 2004, 14, 283–288. [Google Scholar] [CrossRef]
  5. Yang, X.M.; Yuan, J.S.; Yuan, J.Y.; Gao, X. Research on spatial morphology of urban land expansion based on space syntax. Dyn. Contin. Discret. Impuls. Syst. Ser. A Math. Anal. 2006, 13, 1418–1422. [Google Scholar]
  6. Santos, F.; Almeida, A.; Martins, C.; Gonçalves, R.; Martins, J. Using POI functionality and accessibility levels for delivering personalized tourism recommendations. Comput. Environ. Urban Syst. 2019, 77, 101173. [Google Scholar] [CrossRef]
  7. Xie, X.J.; Xu, Y.Y.; Feng, B.; Wu, W.J. Multiscale Urban Functional Zone Recognition Based on Landmark Semantic Constraints. Isprs Int. J. Geo-Inf. 2024, 13, 95. [Google Scholar] [CrossRef]
  8. Jin, P.; Chen, M.; Sun, Z. Research on the Method of Identifying Urban Land Functional Areas Based on Mobile Phone Signaling Data. Inf. Commun. 2018, 268–270. [Google Scholar]
  9. Niu, Y.Y.; Yang, Y.C.; Yu, J.; Wang, C.Y.; Sun, H.Q. Identification of urban functional areas based on social media location data: A case study of Shanghai. J. Shanghai Norm. Univ. (Nat. Sci.) 2022, 51, 531–538. [Google Scholar]
  10. Huo, H.; Geng, X.; Zhang, W.; Guo, L.; Leng, P.; Li, Z.L. Simulation of urban functional zone air temperature based on urban weather generator (UWG): A case study of Beijing, China. Int. J. Remote Sens. 2024, 45, 7095–7118. [Google Scholar] [CrossRef]
  11. Wang, N.; Zheng, L.; Shen, H.T.; Li, S.K. Ride-hailing origin-destination demand prediction with spatiotemporal information fusion. Transp. Saf. Environ. 2024, 6, tdad026. [Google Scholar] [CrossRef]
  12. Lin, X.H.; Yang, T.; Law, S. From points to patterns: An explorative POI network study on urban functional distribution. Comput. Environ. Urban Syst. 2025, 117, 102246. [Google Scholar] [CrossRef]
  13. Xia, J.N.; Yang, Y.; Wang, S.Z.; Yin, H.Z.; Cao, J.N.; Yu, P.S. Bayes-Enhanced Multi-View Attention Networks for Robust POI Recommendation. Ieee Trans. Knowl. Data Eng. 2024, 36, 2895–2909. [Google Scholar] [CrossRef]
  14. Ye, M.; Yin, P.F.; Lee, W.C.; Lee, D.L.; Acm. Exploiting Geographical Influence for Collaborative Point-of-Interest Recommendation. In Proceedings of the 34th International ACM SIGIR Conference on Research and Development in Information Retrieval (SIGIR), Beijing, China, 24–28 July 2011; pp. 325–334. [Google Scholar]
  15. Liang, Z.J.; Kong, W.; Zhan, X.J.; Xiao, Y. Analysis of the Impact of Ride-Hailing on Urban Road Network Traffic by Using Vehicle Trajectory Data. J. Adv. Transp. 2022, 2022, 6940850. [Google Scholar] [CrossRef]
  16. Xie, Y.Z.; Ni, Q.C.; Alfarraj, O.; Gao, H.R.; Shen, G.J.; Kong, X.J.; Tolba, A. DeepCF: A Deep Feature Learning-Based Car-Following Model Using Online Ride-Hailing Trajectory Data. Wirel. Commun. Mob. Comput. 2020, 2020, 8816681. [Google Scholar] [CrossRef]
  17. Xu, S.Y.; Alsaleh, N.; Hamzaev, T.; Miller, E.J. Understanding the spatiotemporal dynamics of ride-hailing services: A study of demand and supply patterns using a large-scale driver activity dataset. Case Stud. Transp. Policy 2025, 21, 101533. [Google Scholar] [CrossRef]
  18. Yang, M.; Yuan, Y.H.; Zhan, F.B. Explore urban interactions based on floating car data—A case study of Chengdu, China. Ann. Gis 2023, 29, 37–53. [Google Scholar] [CrossRef]
  19. Gehrke, S.R.; Felix, A.; Reardon, T.G. Substitution of Ride-Hailing Services for More Sustainable Travel Options in the Greater Boston Region. Transp. Res. Rec. 2019, 2673, 438–446. [Google Scholar] [CrossRef]
  20. Larsen, M.; Tawfik, A.M. What Causes Traffic Congestion? An Exploratory Analysis of Possible Main Attributes Contributing to Urban Traffic Congestion in California. In Proceedings of the ASCE International Conference on Transportation and Development (ICTD)—Traffic Operations and Engineering, Seattle, WA, USA, 31 May–3 June 2022; pp. 136–146. [Google Scholar]
  21. Xu, S.X.; Liu, T.L.; Jia, N.; Wang, P.F.; Liu, P.; Ma, S.F. The effects of transportation system improvements on urban performances with heterogeneous residents. J. Manag. Sci. Eng. 2020, 5, 287–302. [Google Scholar] [CrossRef]
  22. Marinescu, I.E.; Avram, S. Evaluation of urban fragmentation in Craiova city, Romania. In Proceedings of the International Conference of Environment, Landscape, European Identity/Annual Scientific Meeting of the Faculty-of-Geography, Bucharest, Romania, 4–6 November 2012; pp. 207–215. [Google Scholar]
  23. Shi, Y.S.; Huang, Y.C. Relationship between Morphological Characteristics and Land-Use Intensity: Empirical Analysis of Shanghai Development Zones. J. Urban Plan. Dev. 2013, 139, 49–61. [Google Scholar] [CrossRef]
  24. Xie, L.J.; Feng, X.L.; Zhang, C.; Dong, Y.Y.; Huang, J.J.; Liu, K.K. Identification of Urban Functional Areas Based on the Multimodal Deep Learning Fusion of High-Resolution Remote Sensing Images and Social Perception Data. Buildings 2022, 12, 556. [Google Scholar] [CrossRef]
  25. Wu, J.J.; Zhang, J.; Zhang, H.X. Urban Functional Area Recognition Based on Unbalanced Clustering. Math. Probl. Eng. 2022, 2022, 7245407. [Google Scholar] [CrossRef]
  26. Wang, Z.Y.; Ma, D.B.; Sun, D.Q.; Zhang, J.X. Identification and analysis of urban functional area in Hangzhou based on OSM and POI data. PLoS ONE 2021, 16, e0251988. [Google Scholar] [CrossRef] [PubMed]
  27. Wang, Y.; Li, C.L.; Zhang, H.J.; Lu, Y.H.; Guo, B.Y.; Wei, X.L.; Hai, Z. Research on Multi-Source Data Fusion Urban Functional Area Identification Method Based on Random Forest Model. Sustainability 2025, 17, 515. [Google Scholar] [CrossRef]
  28. Chen, Y.; Qian, H.Z.; Wang, X.; Wang, D.; Han, L.J. A GloVe Model for Urban Functional Area Identification Considering Nonlinear Spatial Relationships between Points of Interest. Isprs Int. J. Geo-Inf. 2022, 11, 498. [Google Scholar] [CrossRef]
  29. Chang, X.; Wu, J.; He, Z.; Li, D.; Sun, H.; Wang, W. Understanding user’s travel behavior and city region functions from station-free shared bike usage data. Transp. Res. Part F Traffic Psychol. Behav. 2020, 72, 81–95. [Google Scholar] [CrossRef]
  30. Yang, M.; Kong, B.; Dang, R.; Yan, X. Classifying urban functional regions by integrating buildings and points-of-interest using a stacking ensemble method. Int. J. Appl. Earth Obs. Geoinf. 2022, 108, 102753. [Google Scholar] [CrossRef]
  31. Liu, H.; Xu, Y.; Tang, J.; Deng, M.; Huang, J.; Yang, W.; Wu, F. Recognizing urban functional zones by a hierarchical fusion method considering landscape features and human activities. Trans. GIS 2020, 24, 1359–1381. [Google Scholar] [CrossRef]
  32. Zheng, L.; Xia, D.; Zhao, X. Spatial–temporal travel pattern mining using massive taxi trajectory data. Phys. A Stat. Mech. Its Appl. 2018, 501, 24–41. [Google Scholar] [CrossRef]
  33. Han, Z.G.; Cui, C.H.; Miao, C.H. Identifying Spatial Patterns of Retail Stores in Road Network Structure. Sustainability 2019, 11, 4539. [Google Scholar] [CrossRef]
  34. Zhang, Y.; Liu, J.P.; Wang, Y. Research on the method of urban jobs-housing space recognition combining trajectory and POI Data. ISPRS Int. J. Geo-Inf. 2021, 10, 71. [Google Scholar] [CrossRef]
  35. Chen, W.L.; Du, J.S. Extracting the temporal and spatial distribution characteristics of urban residents by using trajectory data. GNSS World China 2022, 47, 103–110. [Google Scholar]
  36. Lin, P.; Weng, J.; Hu, S. Revealing Spatio-Temporal Patterns and Influencing Factors of Dockless Bike Sharing Demand. IEEE Access 2020, 8, 66139–66149. [Google Scholar] [CrossRef]
  37. Yan, Y.; Wang, Y.; Du, Z. Where Urban Youth Work and Live: A Data-Driven Approach to Identify Urban Functional Areas at a Fine Scale. ISPRS Int. J. Geo-Inf. 2020, 9, 42. [Google Scholar] [CrossRef]
  38. Gao, M.X.; Guo, H.J.; Liu, L.W.; Zeng, Y.Y.; Liu, W.K.; Liu, Y.F.; Xing, H.F. Integrating street view imagery and taxi trajectory for identifying urban function of street space. Geo-Spat. Inf. Sci. 2025, 28, 1085–1107. [Google Scholar] [CrossRef]
  39. Liu, X.D.; Tian, Y.Z.; Zhang, X.Q.; Wan, Z.Y. Identification of Urban Functional Regions in Chengdu Based on Taxi Trajectory Time Series Data. Isprs Int. J. Geo-Inf. 2020, 9, 158. [Google Scholar] [CrossRef]
  40. Myrovali, G.; Karakasidis, T.; Morfoulaki, M.; Ayfantopoulou, G. Representativeness of Taxi GPS-Enabled Travel Time Data Using Gamma Generalized Linear Model. Int. J. Decis. Support Syst. Technol. 2021, 13, 18. [Google Scholar] [CrossRef]
  41. Laha, A.K.; Putatunda, S. Real time location prediction with taxi-GPS data streams. Transp. Res. Part C Emerg. Technol. 2018, 92, 298–322. [Google Scholar] [CrossRef]
  42. Girvan, M.; Newman, M.E.J. Community structure in social and biological networks. Proc. Natl. Acad. Sci. USA 2002, 99, 7821–7826. [Google Scholar] [CrossRef]
  43. Radicchi, F.; Castellano, C.; Cecconi, F.; Loreto, V.; Parisi, D. Defining and identifying communities in networks. Proc. Natl. Acad. Sci. USA 2004, 101, 2658–2663. [Google Scholar] [CrossRef]
  44. Newman, M.E.J.; Girvan, M. Finding and evaluating community structure in networks. Phys. Rev. E Stat. Nonlinear Soft Matter Phys. 2004, 69, 26113. [Google Scholar] [CrossRef]
  45. Raghavan, U.N.; Albert, R.; Kumara, S. Near linear time algorithm to detect community structures in large-scale networks. Phys. Rev. E 2007, 76, 36106. [Google Scholar] [CrossRef]
  46. Leung, I.X.; Hui, P.; Lio, P.; Crowcroft, J. Towards real-time community detection in large networks. Phys. Rev. E 2009, 79, 66107. [Google Scholar] [CrossRef]
  47. Yang, B.; Cheng, W.; Liu, J. Community Mining from Signed Social Networks. IEEE Trans. Knowl. Data Eng. 2007, 19, 1333–1348. [Google Scholar] [CrossRef]
  48. Rosvall, M.; Bergstrom, C.T. Maps of Random Walks on Complex Networks Reveal Community Structure. Proc. Natl. Acad. Sci. USA 2008, 105, 1118–1123. [Google Scholar] [CrossRef] [PubMed]
  49. Fu, Y.D.; Lu, X.Y.; Yu, C.X.; Li, J.C.; Li, X.; Huangpeng, Q. Quantifying the Complexity of Nodes in Higher-Order Networks Using the Infomap Algorithm. Systems 2024, 12, 347. [Google Scholar] [CrossRef]
  50. McKenzie, G.; Janowicz, K.; Gao, S.; Gong, L. How where is when? On the regional variability and resolution of geosocial temporal signatures for points of interest. Comput. Environ. Urban Syst. 2015, 54, 336–346. [Google Scholar] [CrossRef]
  51. Jiang, S.; Alves, A.; Rodrigues, F.; Ferreira, J.; Pereira, F.C. Mining point-of-interest data from social networks for urban land use classification and disaggregation. Comput. Environ. Urban Syst. 2015, 53, 36–46. [Google Scholar] [CrossRef]
  52. Hu, X.; Elßner, T.; Zheng, S.; Serere, H.N.; Kersten, J.; Klan, F.; Qiu, Q. DLRGeoTweet: A comprehensive social media geocoding corpus featuring fine-grained places. Inf. Process. Manag. 2024, 61, 103742. [Google Scholar] [CrossRef]
  53. Hou, S.; Shen, Z.; Zhao, A.; Liang, J.; Gui, Z.; Guan, X.; Li, R.; Wu, H. GeoCode-GPT: A large language model for geospatial code generation. Int. J. Appl. Earth Obs. Geoinf. 2025, 138, 104456. [Google Scholar] [CrossRef]
  54. Zhang, C.; Guo, R.; Ma, X.; Kuai, X.; He, B. W-TextCNN: A TextCNN model with weighted word embeddings for Chinese address pattern classification. Comput. Environ. Urban Syst. 2022, 95, 101819. [Google Scholar] [CrossRef]
  55. Zou, Z.H.; Yi, Y.; Sun, J.N. Entropy method for determination of weight of evaluating indicators in fuzzy synthetic evaluation for water quality assessment. J. Environ. Sci. 2006, 18, 1020–1023. [Google Scholar] [CrossRef]
Figure 1. Study area and data distribution in Lhasa. (a) POI locations in Lhasa; (b) Road network of Lhasa; (c) OD locations in Lhasa. (d) The map shows the study area, with the points representing the most important hotspot locations in the paper.
Land 15 00677 g001
Figure 2. Methodological framework of the study.
Land 15 00677 g002
Figure 3. Urban functional zone identification results. (a) Distribution curve of functional mixing degree; (b) spatial distribution of mixing degree; (c) preliminary identification of functional zones; (d) final identification of functional zones.
Land 15 00677 g003
Figure 4. Cluster MWI and FRI distribution. (a) MWI per cluster; (b) FRI distribution.
Land 15 00677 g004
Figure 5. Analysis of degree centrality: (a) Spatial distribution characteristics of degree centrality, (b) average degree centrality of various functional zone types, The red line represents the cumulative distribution frequency. (c) frequency distribution of degree centrality. Note: BSA (business service area), MRCA (mixed-use residential and commercial area), CBA (corporate business area), BDMZ (business and education mixed zone), RA (residential area), MFA (mixed-function area), LFS (landscape and famous scenery), TSA (transportation service area), GAD (government agency district), SECZ (science and education cultural zone), MSA (medical service area).
Land 15 00677 g005
Figure 6. Analysis of betweenness centrality: (a) Spatial distribution characteristics of betweenness centrality, (b) average betweenness centrality of various functional zone types, The red line represents the cumulative distribution frequency. (c) frequency distribution of betweenness centrality. Related explanation: Same as Figure 5c note.
Land 15 00677 g006
Figure 7. Analysis of closeness centrality: (a) Spatial distribution characteristics of closeness centrality, (b) average closeness centrality of various functional zone types, The black points and red line represent the cumulative distribution frequency, while the red line alone indicates the normal distribution frequency. (c) frequency distribution of closeness centrality. Related explanation: Same as Figure 5c note.
Land 15 00677 g007
Figure 8. Spatial distribution characteristics of network node importance.
Land 15 00677 g008
Figure 9. Community structure and functional composition: (a) Community division results, (b) distribution of functional zone importance proportion within each community, (c) distribution of functional zone importance within each community.
Land 15 00677 g009
Figure 10. Structure of community interaction networks: (a) Inter-community spatial interaction relationships, (b) schematic diagram of inter-community interaction network structure, (c) Community 1 interaction sub-network, (d) Community 2 interaction sub-network, (e) Community 3 interaction sub-network, (f) Community 4 interaction sub-network.
Land 15 00677 g010
Table 1. Evaluation system of directed weighted complex-network indicators.
IndicatorCalculation MethodIndicator Meaning
Average Degree K = i = 1 n k i n k i is the degree of node i ; a larger k value indicates more connections (edges) involving nodes in the network.
Network Clustering Coefficient C = 1 n i = 1 n c i c i is the weighted clustering coefficient of node i ; a larger C indicates a more pronounced clustering effect among nodes in the network.
Network Density (Directed) W = T n ( n 1 ) T is the number of edges in the network; a larger W indicates closer connections between nodes in the network.
Average Path Length D = i j d i j n ( n 1 ) d is the shortest path length from node i to node j ; a larger D value indicates lower transmission efficiency between nodes in the network.
K-Core Size S i = j = 1 n C i j c i j is the set of nodes directly adjacent to node i ; a larger S i value indicates greater cohesion of the corresponding grid node within the network.
Table 2. Results of indicator weights calculated based on entropy weight method.
IndicatorEntropy ValueDifference CoefficientWeight
Degree Centrality0.8614460.1385540.310197
Betweenness Centrality0.7387650.2612350.584858
Closeness Centrality0.9531250.0468750.104945
Table 3. Top ten areas ranked by network node importance.
RankResearch UnitFunctional Zone AttributeImportant Landmarks
1111Mixed-Function ZoneLhasa Railway Station, Liuwu Bus Station, Lhasa Window, Lhasa Wan Yu Cheng
2393Commercial Service ZoneLhasa Department Store, Baiyi Department Store, Folk Culture Tourism Shopping Plaza
3519Scenic Spot ZonePotala Palace, Religious Lukang Park
4368Commercial–Residential Mixed ZoneLiuwu Wanda Plaza, Jixiangyuan, Yapu Yangguang Huayuan
5496Commercial Service ZoneChengguan Wanda Plaza
6397Scenic Spot ZoneBarkhor Street Pedestrian Street, Chongsaikang Market, Jokhang Temple
7423Commercial–Educational Mixed ZoneLhasa Middle School, Gongdelin Tianjie, Jinzhu Square
8555Mixed-Function ZoneOutlets City Plaza, Tibet Autonomous Region Women and Children’s Hospital, Lhasa Mass Culture and Sports Center, Liuwu Senior High School
9430Government Institution ZoneLhasa Municipal People’s Government, Lhasa Municipal Economy and Information Bureau, Tibet Autonomous Region Public Resource Trading Center, Lhasa Municipal Commerce Bureau
10382Mixed-Function ZoneTibet Judicial Police Hospital, Zhaji Temple, Hongsheng Xiaoqu, Tibet Daily News Garden
Table 4. Top 10 destinations by average daily ride-hailing arrivals on weekdays and weekends.
RankWeekend DestinationWeekend Avg. ArrivalsWeekday DestinationWeekday Avg. Arrivals
1Tibet Museum118.4Jokhang Temple89.1
2Potala Palace104.3Potala Palace87.0
3Jokhang Temple99.4Lhasa Station76.3
4Lhasa Station85.3Tibet Museum76.0
5Barkhor Street65.8Barkhor Street60.3
6Chengguan Wanda Plaza56.6Potala Palace Square49.9
7Lhasa Station (entrance)54.5Lhasa Station (entrance)42.3
8Potala Palace Square51.3Lhasa Zhi Ge BAR38.7
9Tianhai Night Market39.0Zhaji Temple36.1
10Zhaji Temple38.5Tianhai Night Market35.0
Disclaimer/Publisher’s Note: The statements, opinions and data contained in all publications are solely those of the individual author(s) and contributor(s) and not of MDPI and/or the editor(s). MDPI and/or the editor(s) disclaim responsibility for any injury to people or property resulting from any ideas, methods, instructions or products referred to in the content.