Article

Long-Term Assessment of Urban Flood Resilience and Identification of Obstacles: A Case Study of Sichuan, China (2011–2023)


1
Institute for Disaster Management and Reconstruction, Sichuan University-The Hong Kong Polytechnic University, Chengdu 610207, China
2
Research Center for Social Development and Social Risk Control, Sichuan University, Chengdu 610065, China
3
Department of Civil Engineering, Pulchowk Campus, Institute of Engineering, Tribhuvan University, Lalitpur 44600, Nepal
4
Sichuan Institute of Urban and Rural Construction, Chengdu 610041, China
*
Author to whom correspondence should be addressed.
These authors contributed equally to this work.
Land 2026, 15(4), 614; https://doi.org/10.3390/land15040614
Submission received: 8 March 2026 / Revised: 30 March 2026 / Accepted: 5 April 2026 / Published: 9 April 2026
(This article belongs to the Topic Advances in Urban Resilience for Sustainable Futures)

Abstract

Urban floods have become a major systemic risk to sustainable urban development under climate change and increasingly frequent extreme hydro-meteorological events. Yet evidence on the long-term evolution of urban flood resilience (UFR) and its structural constraints at the provincial scale remains limited. This study develops a PSR-based framework to assess UFR and diagnose its dominant obstacles using data for 21 prefecture-level cities in Sichuan Province from 2011 to 2023, including meteorological, geomorphological, socioeconomic, infrastructure, environmental, and public service indicators. A combined AHP–EWM is used to integrate subjective and objective information, TOPSIS is applied to derive a composite UFR index and subsystem scores, and an obstacle degree model is employed to identify key constraints and their temporal evolution. Results show that: (1) UFR in Sichuan Province fluctuated but increased overall during 2011–2023, reaching its highest level in 2023; (2) resilience improvement was driven mainly by the response subsystem, while the pressure subsystem showed the greatest interannual variability; and (3) the annual top five obstacles were highly persistent and insufficient response capacity was the dominant long-term constraint on resilience enhancement. These findings underscore that improving the adequacy, institutional robustness, and operational stability of response systems is central to enhancing UFR. This study provides empirical support for the assessment of provincial-scale resilience and policy-oriented flood risk governance.

1. Introduction

In recent years, the intensifying global climate change has markedly increased urban flood risk, posing substantial challenges to socio-economic development and the environment [1,2]. Cities, as spatial units characterized by high concentrations of population and economic activities, tend to exhibit elevated exposure levels and greater potential for disaster-related losses [3,4]. The increasing frequency and intensity of flood events continue to exert persistent pressure on urban population safety, infrastructure performance, and socio-economic functioning [5,6,7]. Urban flooding has become an increasingly critical challenge under the combined pressure of rapid urbanization and intensifying climate change. In response, the global Sustainable Development Goals (SDGs) consistently emphasized the need to enhance urban capacities to adapt to and withstand disaster risks [8,9]. As flood hazards increasingly generate systemic impacts on urban infrastructure, economies and social systems, the need to enhance urban resilience has become a central priority within contemporary urban governance [10,11]. The concept of resilience, originally developed in ecological research, has progressively evolved into a key analytical framework within social–ecological systems and disaster risk governance.
Within the field of urban studies, urban flood resilience (UFR) is commonly conceptualized as a system-level capacity jointly supported by the built environment, social structures and institutional capabilities. It is manifested as a dynamic, process-oriented ability to resist shocks, absorb disturbances, restore critical functions, and adapt to changing risk conditions [12,13,14]. To operationalize and diagnose this composite capacity, existing studies have sought to decompose UFR into interpretable structural dimensions and, on this basis, identify key mechanisms that constrain resilience improvement [13,14,15]. Accordingly, scholars have increasingly adopted multidimensional analytical frameworks such as the Pressure–State–Response (PSR) model to capture the structural drivers of resilience and enhance the interpretability of evaluation outcomes [4,16,17]. A major strength of the PSR framework lies in its ability to distinguish the respective contributions of external pressures and internal system capacities to resilience dynamics, thereby facilitating targeted intervention pathways [14,18] and providing a structured basis for identifying the sources of resilience gains and the migration of bottlenecks over multi-year periods.
Despite these advances, empirical evidence remains limited in answering under what effective and measurement framework the resilience gains originate and how dominant bottlenecks evolve over an extended period [19]. Because resilience improvement is inherently cumulative, the constraints limiting resilience may shift at different stages of development. Without long-term monitoring, it is quite difficult to determine whether resilience gains are primarily driven by reductions in external pressures, improvements in system state, or the accumulation of response capacity [16]. Furthermore, although existing studies have identified resilience deficiencies, most analyses remain confined to simple rankings of influencing factors. Few studies have systematically examined which constraints persist over long periods, how these constraints vary among cities with different resilience levels, or whether dominant bottlenecks are replaced as cities transition from lower to higher resilience stages [20,21].
In response to these research gaps, this study aims to provide a systematic examination of long-term evolution and structural constraints of urban flood resilience. Unlike previous studies, this study focuses on long-term, province-scale assessment of urban flood resilience and the structural evolution of obstacle patterns [22,23]. It moves beyond the single-year or short-term cross-sectional focus, which is common in existing research and enables continuous identification of the long-term trajectory of urban flood resilience at the provincial scale [24]. It also distinguishes persistent obstacles from stage-dependent substitutive obstacles and examines how dominant bottlenecks shift across resilience stages. Specifically, three sequential research questions are addressed: (1) How did UFR in Sichuan province, China, evolve from 2011 to 2023, and which subsystem contributed most to resilience gains? (2) Which factors constitute the major obstacles over the multi-year horizon, and are these obstacles concentrated within a limited set of core constraints? (3) Do obstacle structures vary systematically across resilience levels, and do dominant bottlenecks exhibit substitution or migration as cities transition across resilience stages? To answer these questions, this study develops a long-term assessment and bottleneck diagnostic framework for UFR using panel data from 21 prefecture-level cities in Sichuan Province for the period 2011–2023. The analysis proceeds in three stages. First, an indicator system is constructed along the PSR dimensions to conduct an integrated evaluation of overall resilience and the trajectories of the three PSR subsystems. Second, an obstacle-degree model is employed to identify the key factors constraining resilience improvement and to distinguish persistent structural constraints from stage-dependent substitutive constraints. Third, the configuration of constraints is compared across cities with different resilience levels to derive staged priority judgments, thereby shifting governance strategies from descriptive trend analysis toward constraint-oriented intervention (Figure 1). Finally, the assessment and diagnostic results are translated into staged policy priorities, providing actionable references for differentiated flood protection capacity building and resilience governance at the provincial scale.

2. Materials and Methods

2.1. Study Area

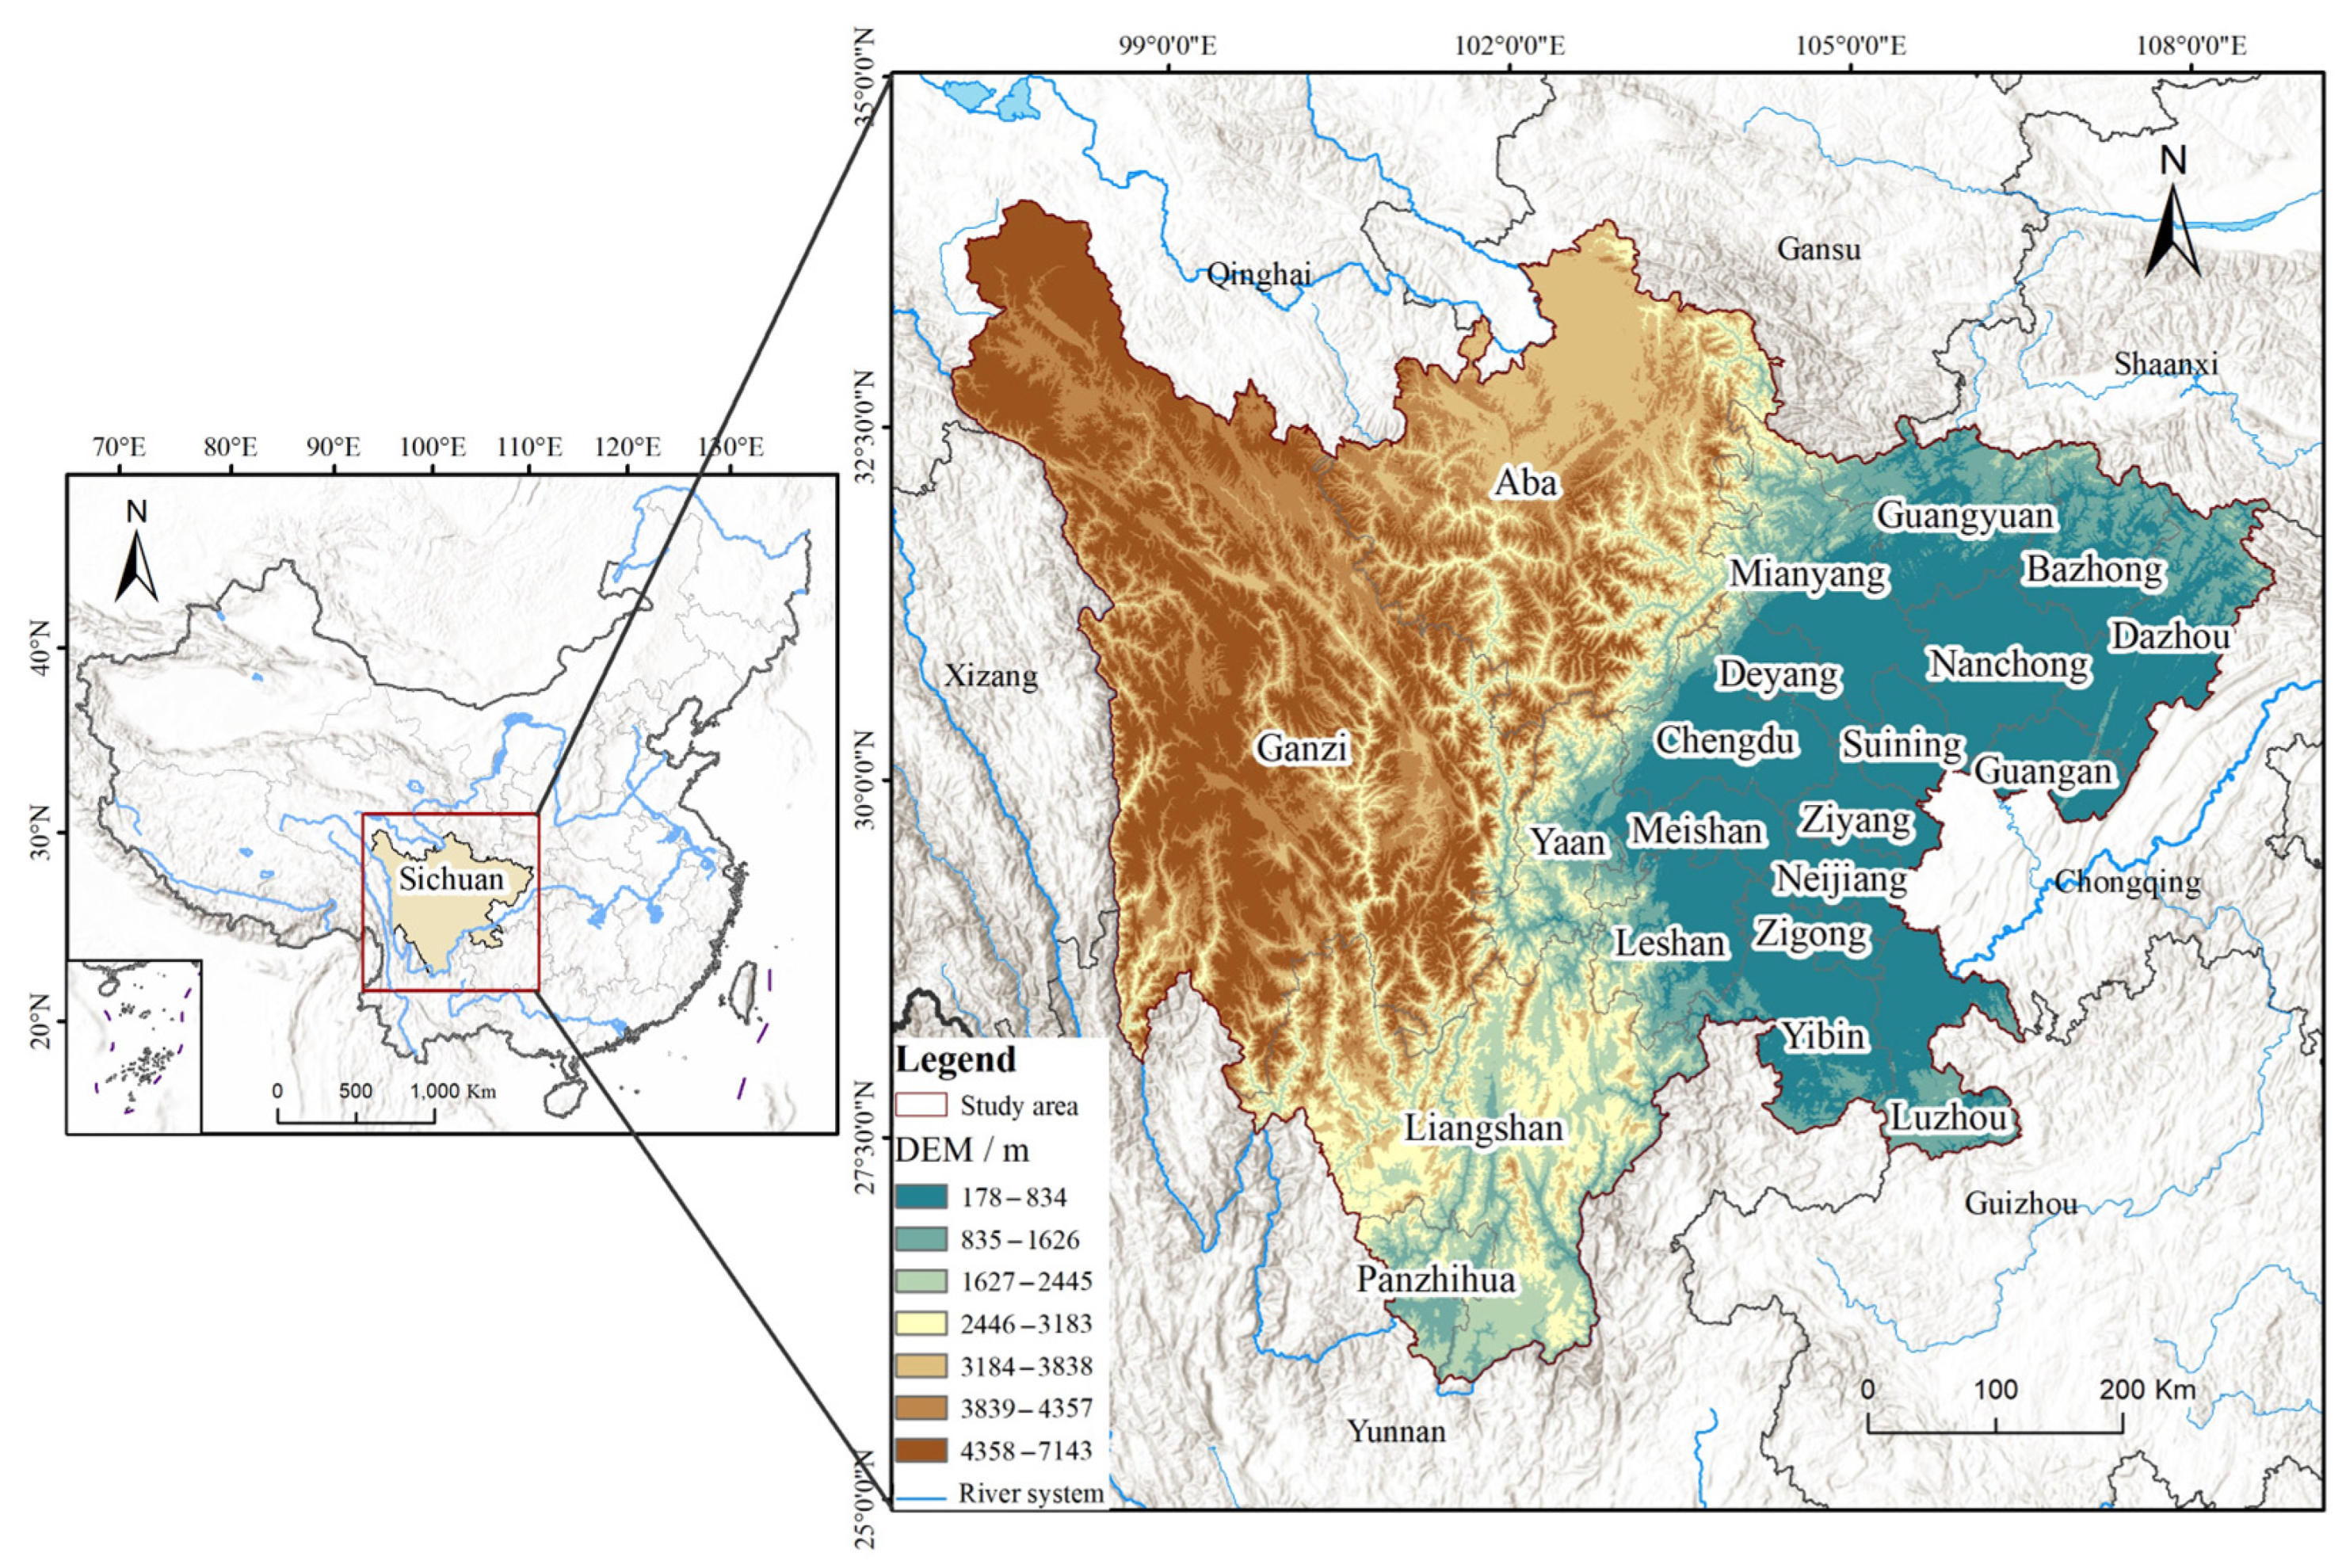
Sichuan Province, located in southwest China, is characterized by significant topographic gradients and pronounced hydroclimatic variability. Extending from the eastern margin of the Tibetan Plateau toward the Sichuan Basin, the province exhibits substantial spatial heterogeneity in terrain, drainage patterns, and precipitation regimes across its prefecture-level jurisdictions (Figure 2). Geologically, Sichuan spans tectonically active and relatively stable units, including the plateau-margin zone in the west and the sedimentary basin region in the east. Geomorphologically, the province presents a marked transition from high mountains and deeply incised valleys to hilly basin margins and low-relief plains, resulting in the strong spatial contrasts in slope, relief and runoff concentration. Structurally, complex crustal deformation in the western part of the province has shaped the regional landform pattern and river systems, while the basin area is characterized by comparatively gentler terrain and more continuous urban development. Sichuan encompasses high-density metropolitan centers such as Chengdu as well as mountain, basin-margin, and basin cities that exhibit substantial differences in spatial morphology and development trajectories, providing a valuable empirical context for examining the interactions among capacity accumulation, external shocks, and spatial transformation [7,16]. Provincial-level governance also required operational guidance on strategic resource allocation, the development of coordination mechanisms to address capacity gaps, and the formulation of phased improvement pathways for cities at different levels [6].

2.2. Data Sources and Preprocessing

This study examines 21 prefecture-level cities in Sichuan Province over the period 2011–2023 (N = 273 city–year observations), forming a balanced panel dataset that facilitates interannual comparability and province-wide identification of obstacles (Table 1). To support the assessment of urban flood resilience, multi-source datasets were collected and systematically harmonized into a unified prefecture-level database. The data used in this study can be grouped into five categories based on their sources and characteristics.

2.3. Indicator System Construction

The indicator system is structured according to the Pressure–State–response (PSR) framework to maintain a clear causal structure and ensure policy relevance [25,26]. This conceptualizes the relationships among external stressors, the underlying condition and sensitivity of the system, and the societal capacity for coping, response, and adaptation. In the context of urban flood resilience research, recent empirical studies have shown that the PSR framework provides an effective basis for constructing interpretable composite indices and for systematically distinguishing the “pressure–state–capacity” dimensions in resilience assessments [8,27].
The final indicator system consists of 24 indicators classified according to the PSR dimensions (Table 2). For several indicators with potentially ambiguous classification, the assignment followed their primary functional role in the resilience formation process. Specifically, P8 was classified under the pressure dimension because it reflects transport activity intensity and mobility-related exposure, which can amplify operational stress under flood conditions [15,28,29]. S7 and S8 were assigned to the state dimension because they characterize the socioeconomic stability and social vulnerability of the urban system. In the resilience and vulnerability literature, unemployment is commonly associated with weaker household coping capacity, while minimum-living-allowance populations represent an important component of socially vulnerable groups. These indicators therefore better reflect the underlying resilience state than external hazard pressure or formal response capacity [30,31,32].
To ensure transparency and reproducibility, each indicator is assigned a clear directional attribute (positive or negative) based on whether an increase in its value is expected to enhance or diminish flood resilience (Table 2). In addition, the indicator framework adopts a hybrid weighting strategy that integrates both subjective and objective approaches, which allows expert judgment and data-driven variability to jointly inform the aggregation of the composite index. This integrated weighting approach is widely applied in urban flood resilience assessments, as it helps mitigate the limitations associated with relying solely on judgment-based or purely statistical weighting methods.

2.4. Construction of the Flood Resilience Index Based on the PSR Framework

This study adopts an integrated weighting and evaluation framework combining the Analytic Hierarchy Process (AHP), entropy weight method (EWM) and the Technique for Order Preference by Similarity to Ideal Solution (TOPSIS) to construct a composite index of urban flood resilience (UFR) under the Pressure–State–Response (PSR) analytical framework. To ensure the reliability and objectivity of indicator weights, both subjective and objective weighting approaches are incorporated. Specifically, the AHP is employed to capture expert judgments regarding the relative importance of indicators, while the EWM utilizes the intrinsic variability of the dataset to determine indicator significance based on information entropy, thereby reducing potential subjective bias [33]. To balance the advantages of these two approaches, the weights obtained from AHP and EWM are linearly combined using an equal weighting coefficient (α = 0.5), producing a set of comprehensive indicator weights that integrate expert knowledge with data-driven information. This equal-weight setting is consistent with recent urban flood resilience research, in which a coefficient of 0.5 was adopted to balance subjective and objective contributions and avoid disproportionate dominance of either component [34]. Such a hybrid weighting strategy enhances the robustness and stability of the resulting index by mitigating the potential dominance of either expert judgment or statistical variability. Using the integrated weights, the TOPSIS method is subsequently applied to evaluate urban flood resilience across cities and over time. TOPSIS is particularly suitable for multi-criteria evaluation problems due to its compatibility with various weighting schemes and its ability to assess the relative performance of decision units by calculating their distances from positive and negative ideal solutions [35,36]. Through this approach, each city’s resilience level is determined according to its proximity to the optimal resilience state and its deviation from the worst-case scenario. The detailed calculation procedures are presented as follows.

2.4.1. Indicator Direction Adjustment and Normalization

Let i = 1, …, n index prefecture-level units, t = 1, …, T index years (2011–2023), and k = 1, …, K index indicators. Raw values x i , t , k   are coded as benefit-type (+) or cost-type (−) and normalized to y i , t , k     [ 0 ,   1 ] using pooled extrema over all city–years to ensure interannual comparability:
y i , t , k   =   ( x i , t , k x k min ) / ( x k max x k min ) ,   for   benefit - type   ( + )
y i , t , k = ( x k max x i ,   t ,   k ) / ( x k max x k min ) ,   for   cost - type   ( )
where x k min   =   min i , t ( x i , t , k ) and x k max   =   max i , t ( x i , t , k ) .

2.4.2. Combined Weighting Method Based on AHP and Entropy

Subjective weights were obtained through AHP. Pairwise comparisons were completed by eight experts from the fields of hydrology and climate, disaster studies, urban planning, transport infrastructure, emergency management, social governance, public service, and comprehensive assessment. The judgment matrices were constructed using the Saaty 1–9 scale and the corresponding reciprocal values, where higher scores indicate greater relative importance. The consistency of each matrix was examined using the consistency ratio (CR), and all matrices satisfied the accepted threshold of CR < 0.10 (Table 3).
To complement the expert-based weights, objective weights were calculated using the entropy weight method based on the normalized indicator matrix. Let N = n T denote the total number of city-year observations. The proportion of the indicator k for observation ( i ,   t ) is defined as:
Then, subjective and objective weights are combined by linear integration (α = 0.5):
p i , t , k = y i , t , k a = 1 n b = 1 T y a , b , k
The entropy value of indicator k is calculated as:
e k = 1 ln N i = 1 n t = 1 T p i , t , k l n   p i , t , k
When p i , t , k = 0 , the term p i , t , k l n   p i , t , k is defined as 0.
Accordingly
d k = 1 e k
w k E = d k k = 1 K d k
The final weight of indicator k was obtained by linearly combining the subjective and objective weights:
w k = α w k A + ( 1 α ) w k E , α = 0.5
The combined weights were normalized such that k = 1 K w k = 1 .

2.4.3. TOPSIS Aggregation

Based on the normalized indicator matrix and the combined weights, TOPSIS was used to evaluate urban flood resilience. The weighted normalized value of the indicator k for a city i in the year t is:
v i , t , k = w k y i , t , k
The positive and negative ideal solutions for indicator k over the pooled sample are defined as:
A k + = m a x i , t ( v i , t , k )
A k = m i n i , t ( v i , t , k )
The Euclidean distances from the positive and negative ideal solutions are respectively calculated as:
D i , t + = k = 1 K v i , t , k A k + 2
D i , t = k = 1 K v i , t , k A k 2
The TOPSIS closeness coefficient was used as the flood resilience index, with the notation unified as F R I i , t :
F R I i , t   =   D i , t D i , t + + D i , t
Subsystem indices for Pressure, State, and Response were calculated in the same manner by restricting k to the corresponding subsystem indicator set and re-normalizing the weights within each subsystem.

2.5. Obstacle Degree Model for Constraint Identification

This model is well-suited for diagnosing constraint structures within complex systems, as it quantitatively evaluates the extent to which each indicator contributes to the overall resilience deficit. By decomposing the influence of individual indicators, the approach enables the identification of dominant bottlenecks that hinder resilience enhancement and provides a basis for targeted policy interventions [37]. A higher obstacle degree value indicates a stronger constraining effect on UFR.
Since all indicators were transformed into benefit-oriented variables, the shortfall of the indicator k for a city i in the year t is expressed as:
g i , t , k = 1 y i , t , k
The obstacle degree of indicator k is then calculated as:
O i , t , k = w k g i , t , k j = 1 K w j g i , t , j × 100 %
A larger O i , t , k indicates a stronger constraining effect on urban flood resilience. PSR-level obstacle shares were further obtained by summing O i , t , k within each subsystem.

3. Results

3.1. Interannual Evolution of Overall Flood Resilience and PSR Sub-Indices

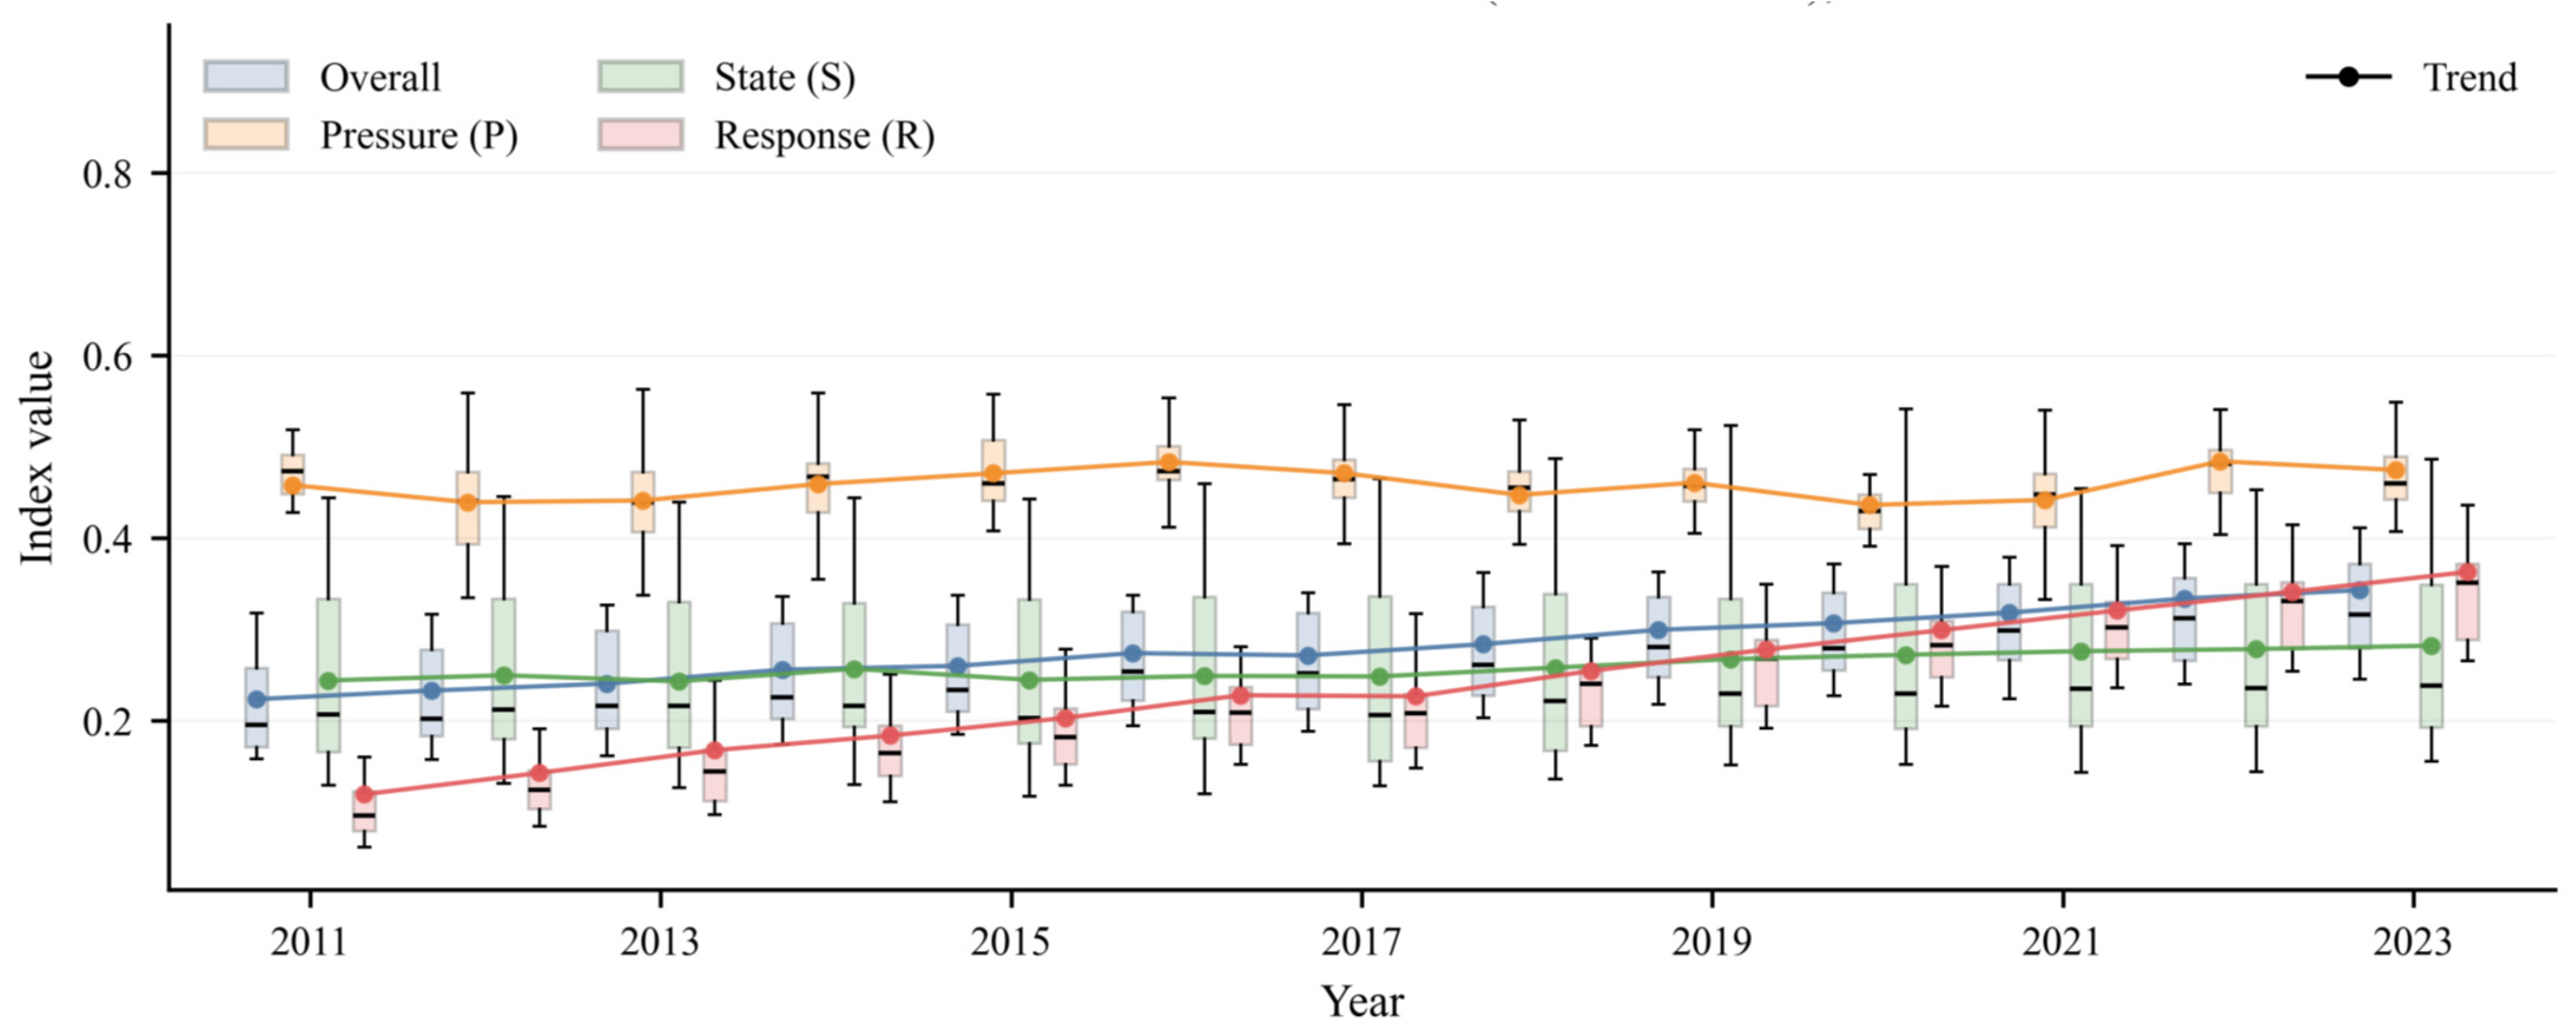
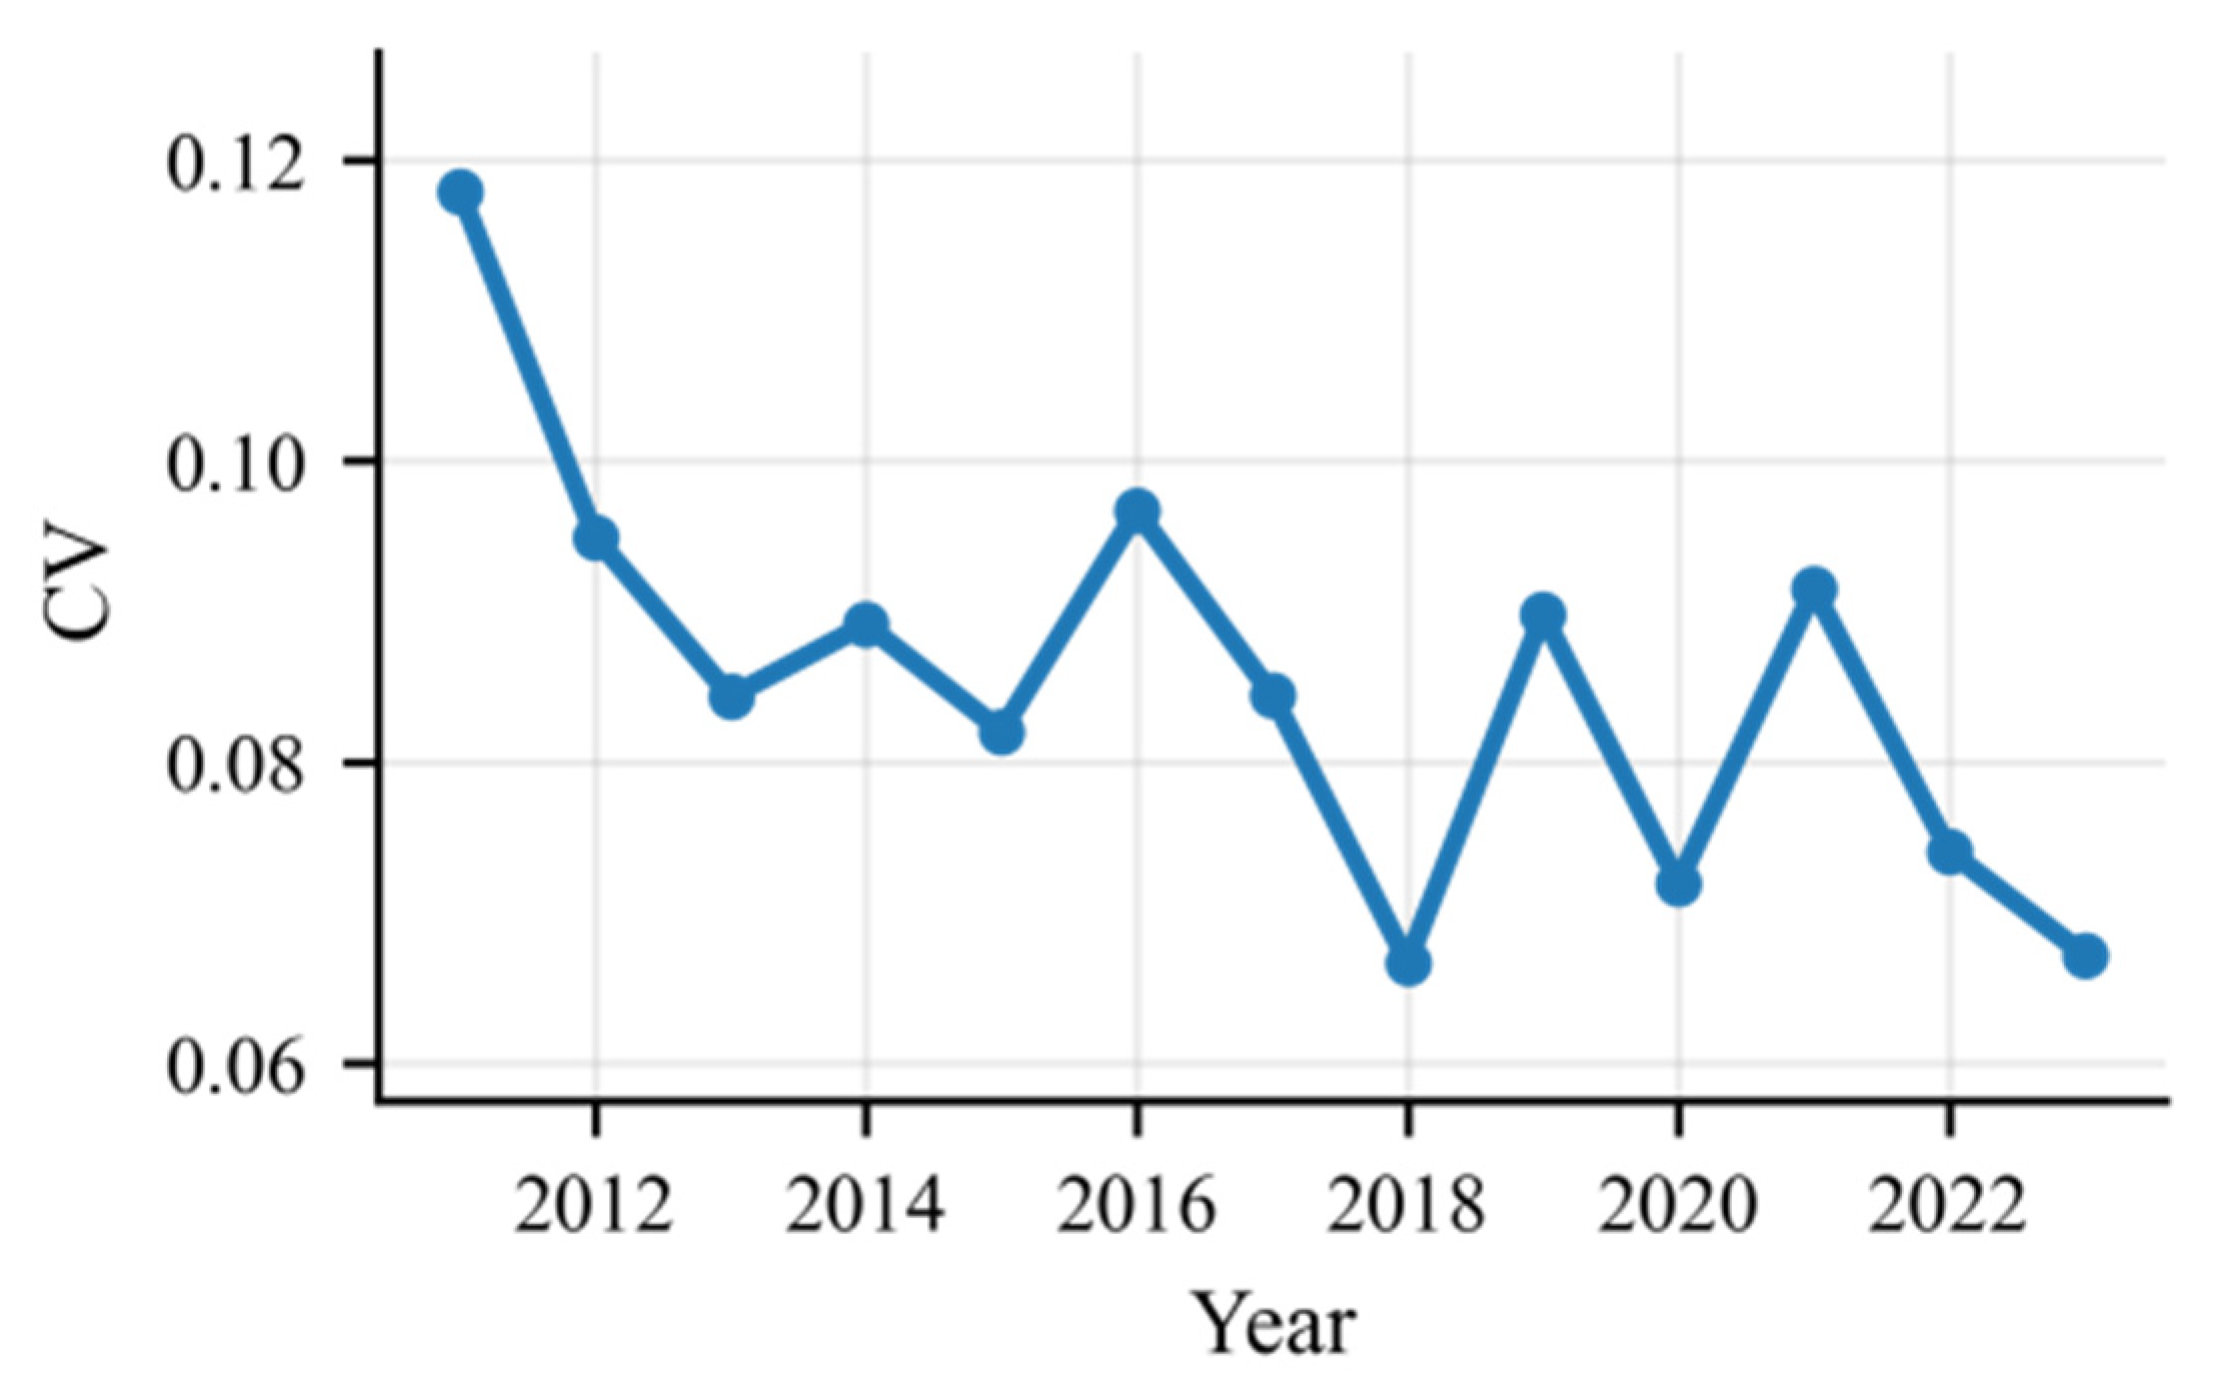
Through an integrated subjective–objective weighting scheme and the TOPSIS evaluation method, annual Flood Resilience Index (FRI) scores were calculated for 21 prefecture-level cities in Sichuan Province for the period 2011–2023 based on the PSR-based indicator framework. Over the study period, the provincial average FRI increased from 0.407 in 2011 to 0.440 in 2023, representing an overall growth of 8.08%. However, the improvement process was not linear. The index reached an early low point in 2013 (0.372), followed by a fluctuating upward trend and a new peak during 2022–2023, suggesting a pattern of resilience enhancement characterized by volatility rather than steady progression (Figure 3). At the same time, the level of inter-city disparity gradually decreased. The coefficient of variation declined from 0.124 to 0.108. Although short-term fluctuations in dispersion were observed in certain years (Figure 4), the overall improvement in resilience was accompanied by a trend toward convergence rather than increasing divergence among cities.
The three PSR subsystems exhibited distinct temporal dynamics over the study period. The response subsystem demonstrated the most pronounced and sustained improvement, with the provincial average increasing from 0.211 in 2011 to 0.276 in 2023, representing an overall growth of 30.56%. In comparison, the state subsystem showed a more moderate increase, rising from 0.405 to 0.429, equivalent to a gain of 6.04%. Its trajectory, however, was not entirely smooth; the index experienced a notable decline in 2013 to 0.355 before gradually recovering and maintaining an upward trend, thereafter, suggesting a temporary deterioration in state-related conditions followed by gradual improvement. By contrast, the pressure subsystem exhibited the highest level of interannual variability while remaining largely stable overall and declining slightly from 0.6968 to 0.6961, a marginal change of −0.11%. Provincial mean pressure levels were relatively lower in 2013 and again during 2018–2021, with the lowest values recorded in 2020 and 2021. This pattern is consistent with the greater temporal variability of precipitation- and hazard-related indicators within the pressure dimension.

3.2. Temporal Evolution of Resilience-Class Composition

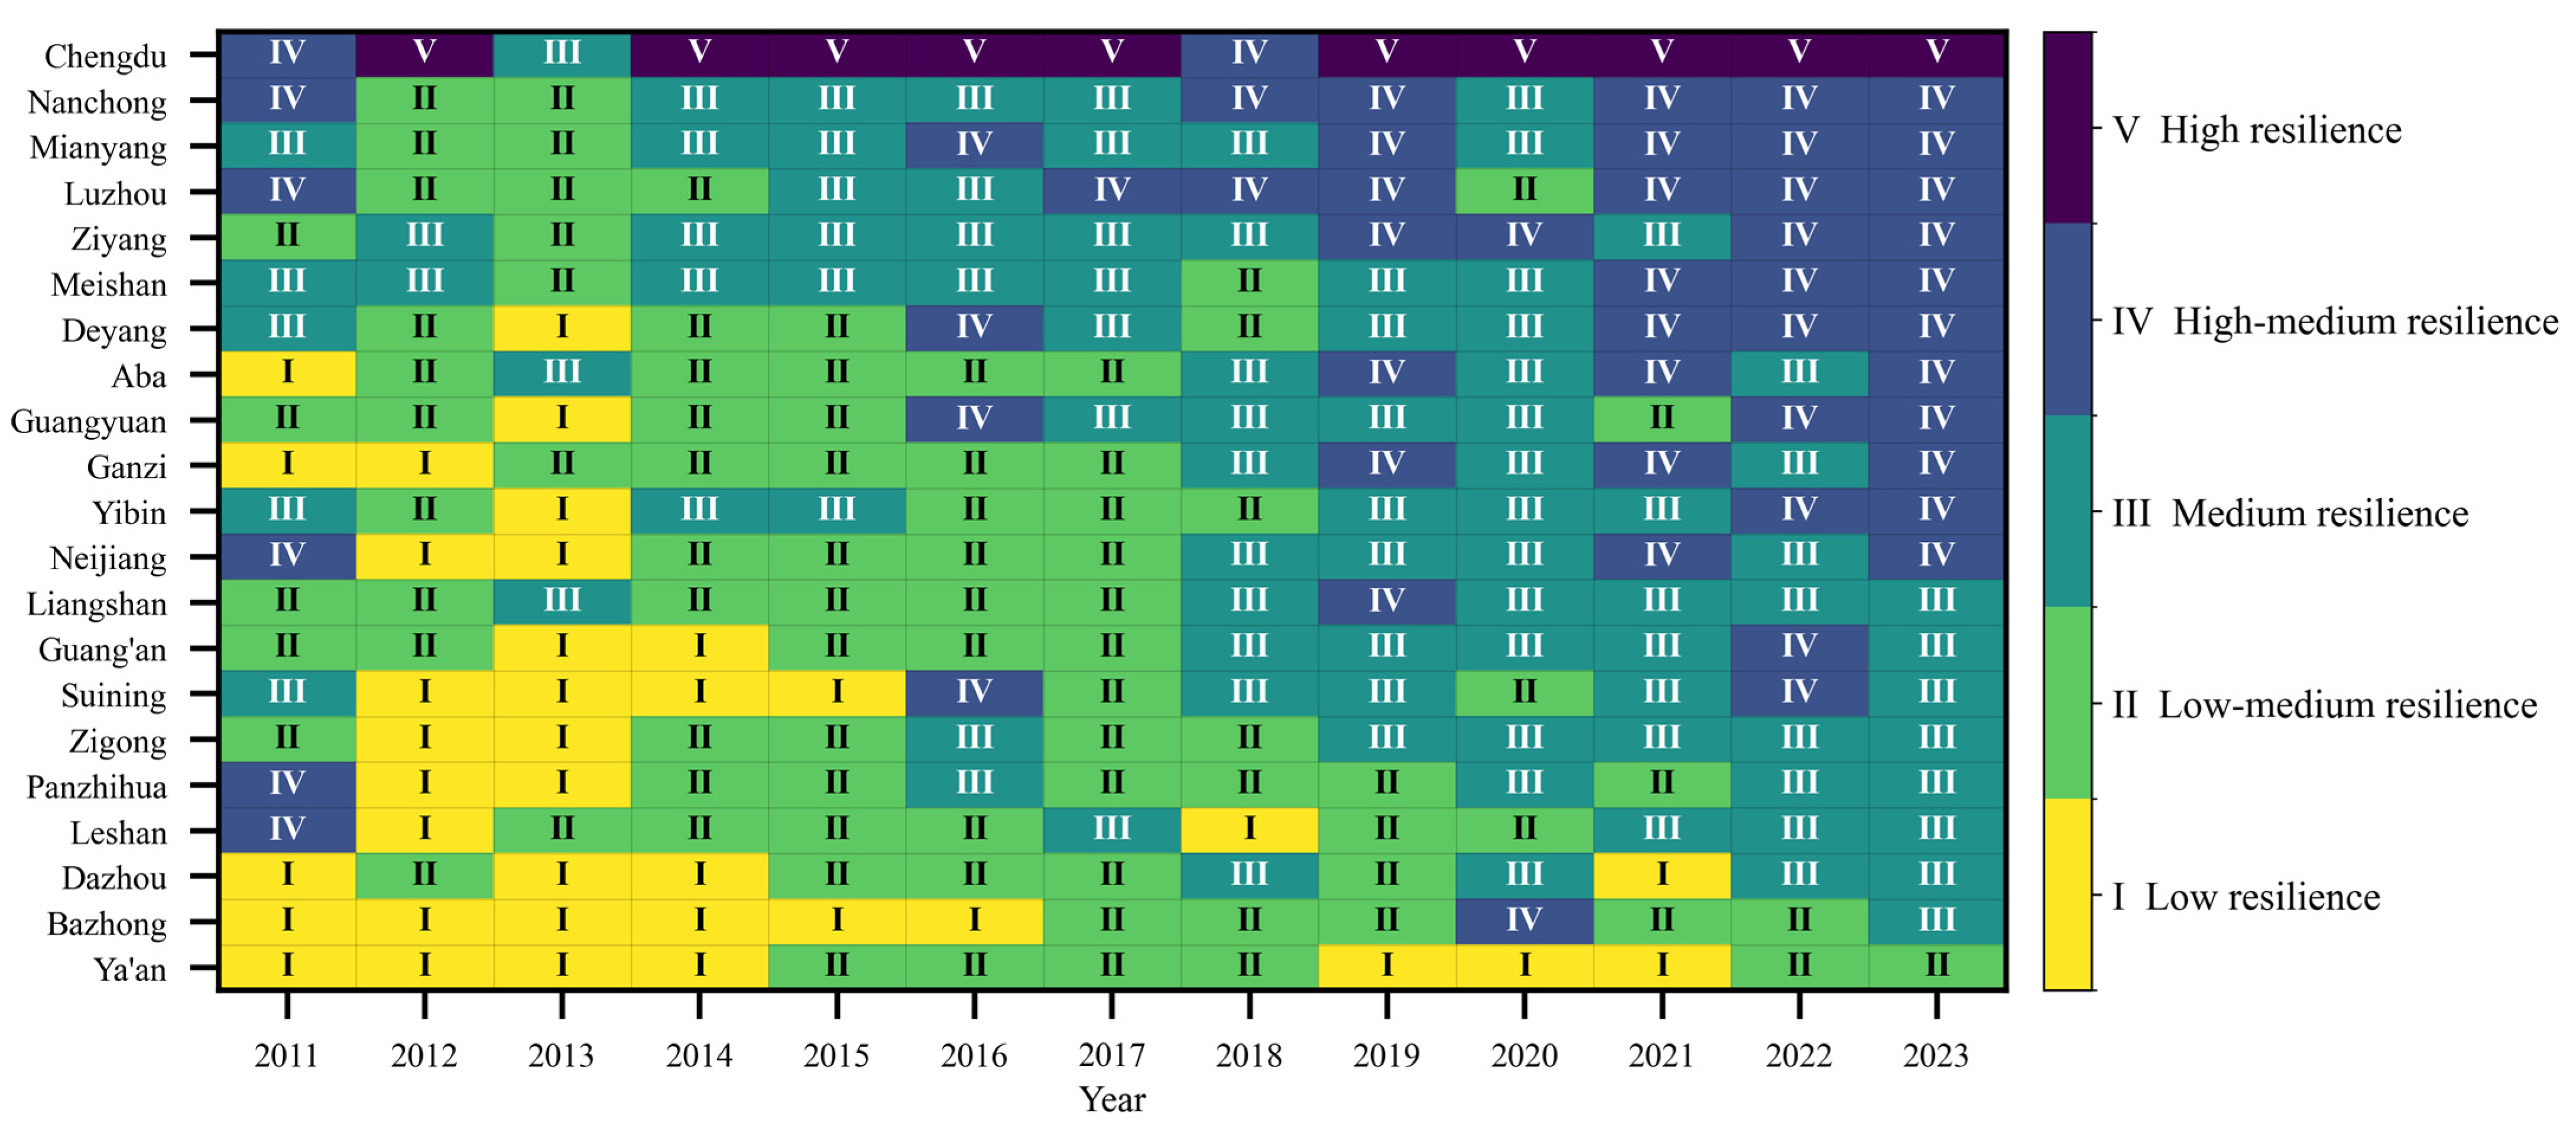
Annual Flood Resilience Index (FRI) values were classified into five resilience categories using the Jenks natural breaks method (k = 5) to examine temporal shifts in the distribution of resilience levels (Figure 5 and Figure 6). The classification results reveal a clear upward transition in resilience regimes over time. In the low point year of 2013, low-resilience cities predominated, with Class 1 accounting for 11 of the 21 cities. By contrast, in 2023, the lowest resilience category had disappeared entirely (0/21), while medium-to-high resilience levels became dominant, with Class 4 and 3 consisting of 11 and 8 cities, respectively. Notably, throughout the study period, the highest resilience category (Class 5) was occupied exclusively by Chengdu. This pattern suggests that although the overall resilience of the provincial system improved, the highest resilience tier remained characterized by a stable mono-centric structure, with limited convergence of other cities toward the top resilience regime.
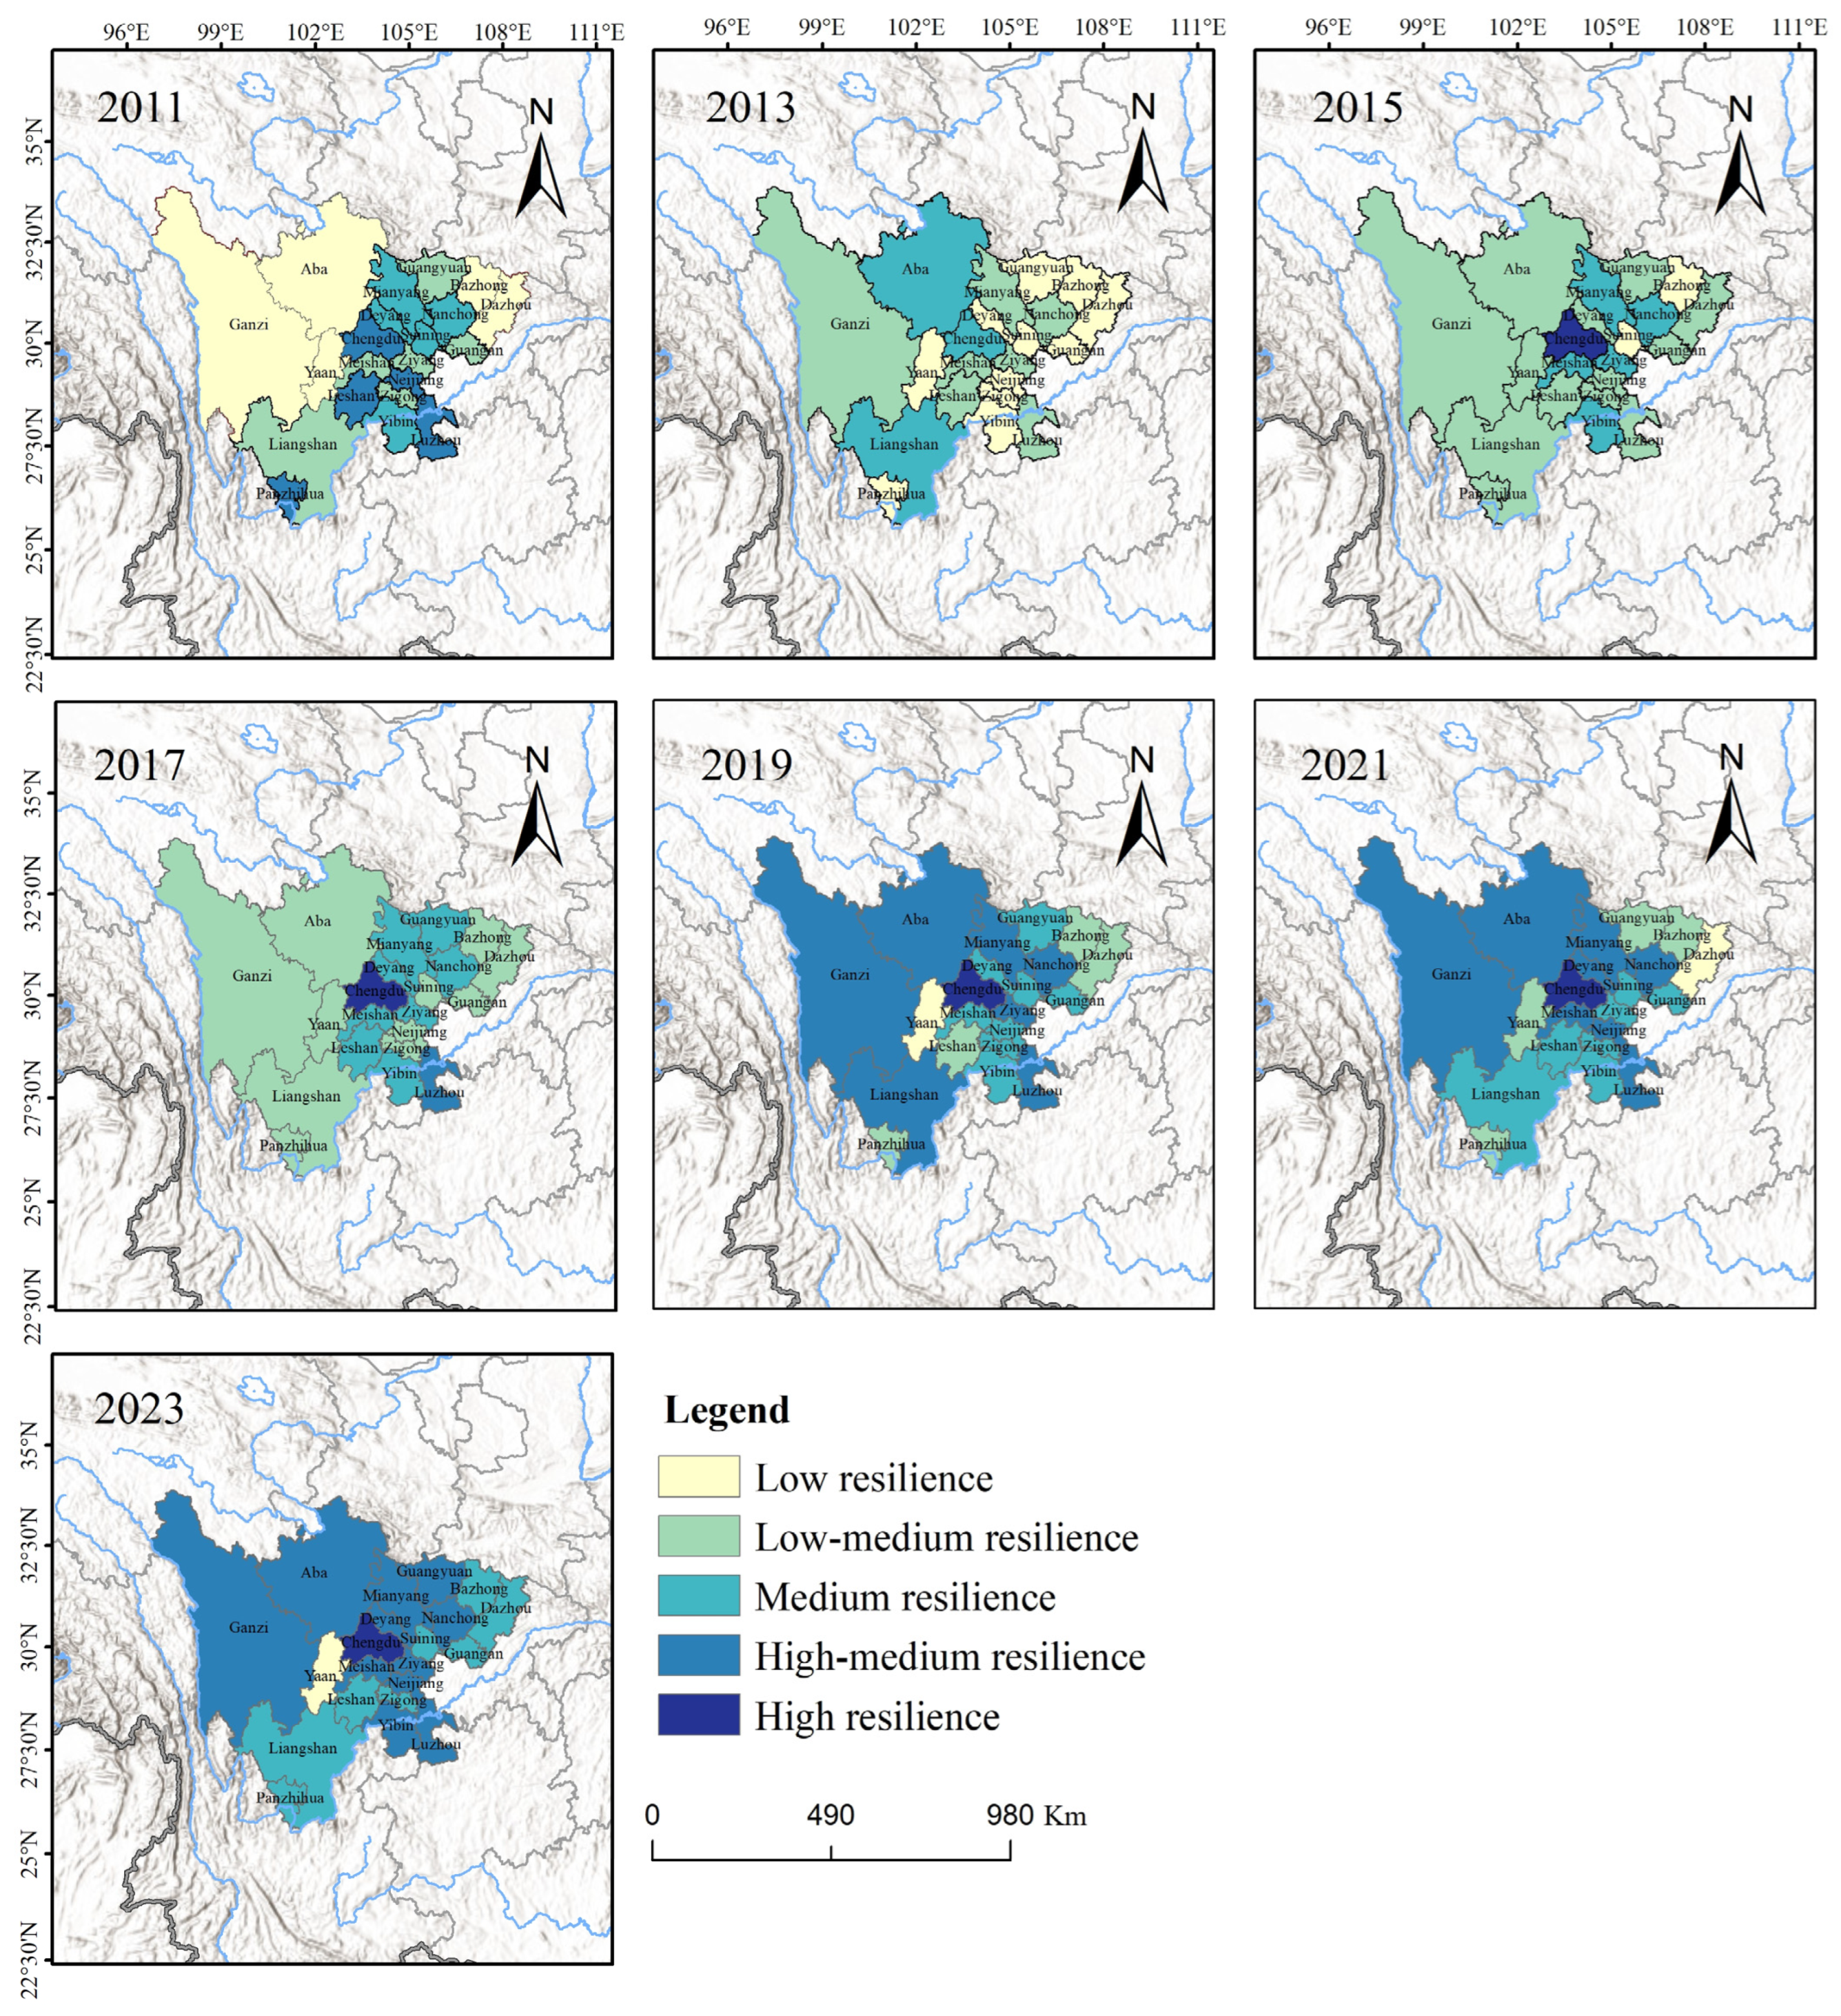
The resilience regimes exhibit strong persistence at the city level beyond the overall upward shift (Figure 6). Cities that consistently remained in the medium–high to high resilience categories include Ganzi Tibetan Autonomous Prefecture, Aba Tibetan and Qiang Autonomous Prefecture, Liangshan Yi Autonomous Prefecture, and Ya’an, whereas cities such as Ziyang, Neijiang, Suining, and Zigong persistently occupied the lower resilience categories. From a physiographic perspective, the stable high-resilience cluster is primarily located in the western mountainous–plateau transition zone, while the stable low-resilience cluster is concentrated within the Sichuan Basin, which is dominated by plains and hilly terrain. Chengdu represents a notable exception within the basin, maintaining a high level of resilience. This spatial configuration suggests that the distribution of flood resilience across the province is closely associated with major topographic units rather than occurring randomly.

3.3. Interannual Evolution of Dominant Obstacles

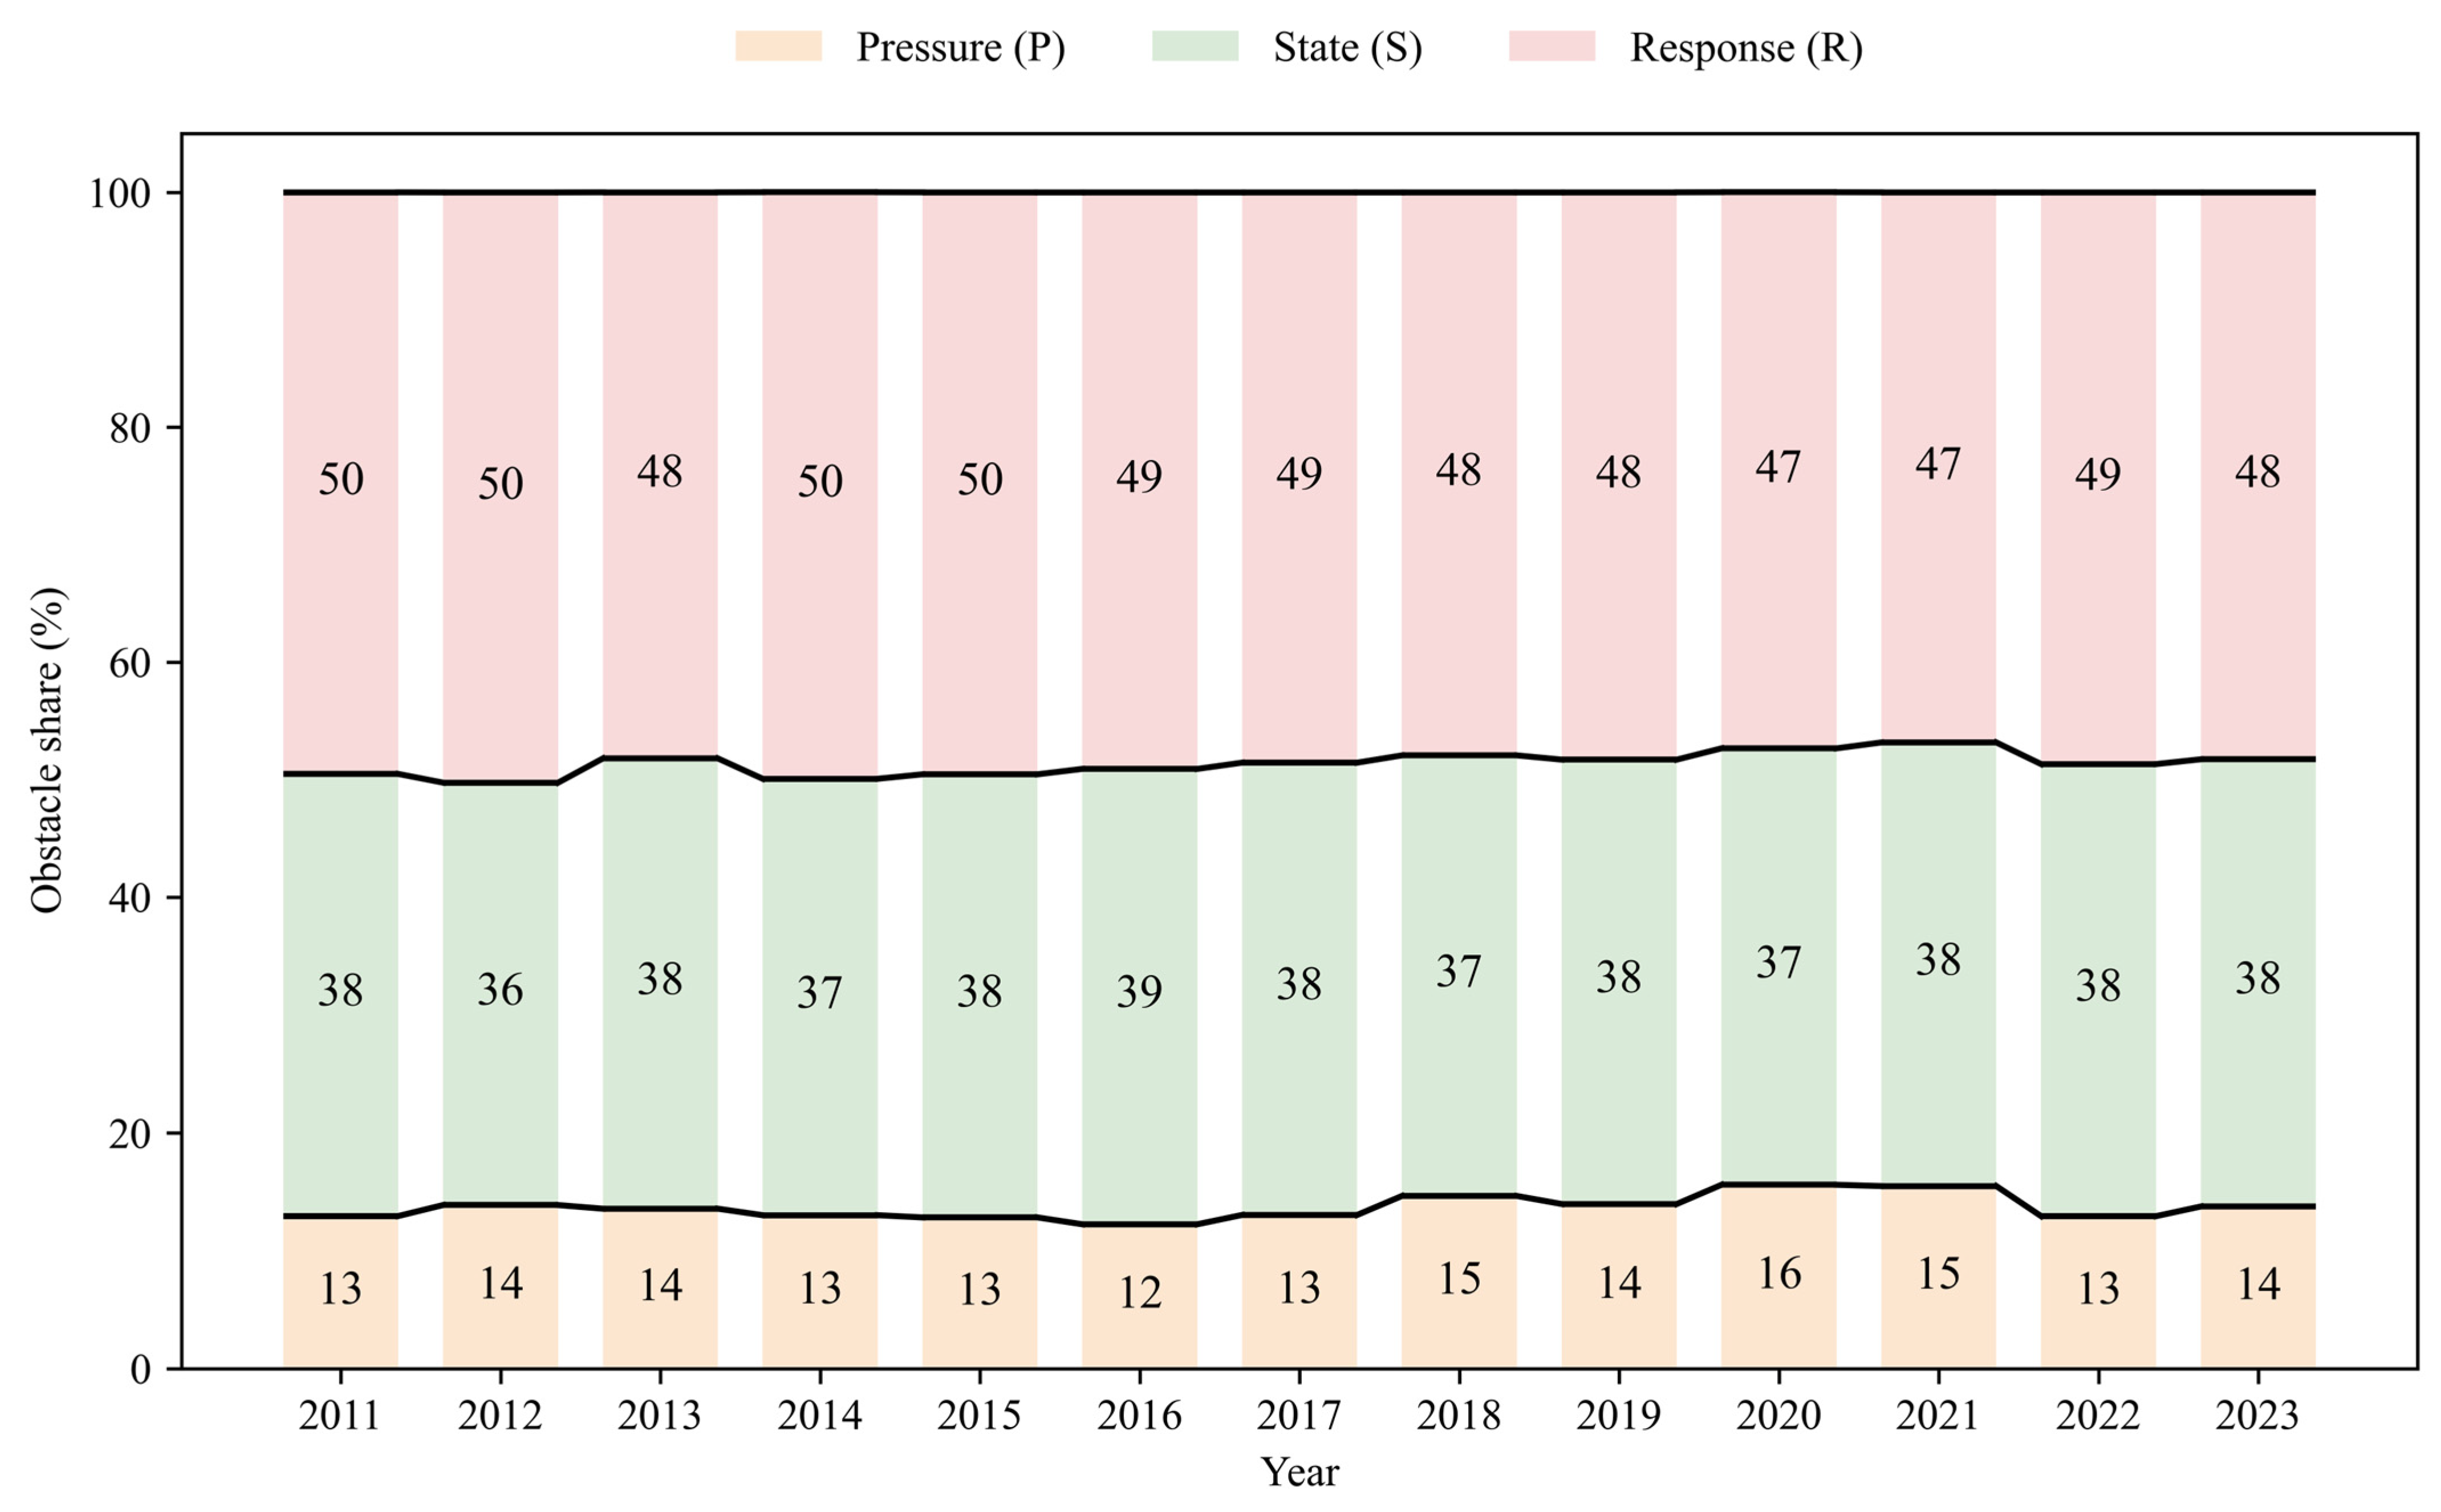
Although provincial-scale aggregation smooths local fluctuations, the interannual evolution of obstacle contributions still exhibits a clear and consistent hierarchy at the subsystem level, with the response subsystem contributing the most, followed by the state subsystem, and the pressure subsystem contributing the least (Figure 7). This pattern suggests that annual variations in binding constraints are primarily driven by deficiencies in response capacity, while the state-related conditions play a secondary role and pressure-related factors contribute comparatively less on average. Overall, the structure of subsystem obstacles remains relatively stable throughout the study period, with the state dimension demonstrating particularly strong temporal consistency. In contrast, the pressure subsystem displays more pronounced year-to-year variability, which is consistent with the greater temporal fluctuation of precipitation- and hazard-related indicators within this dimension.
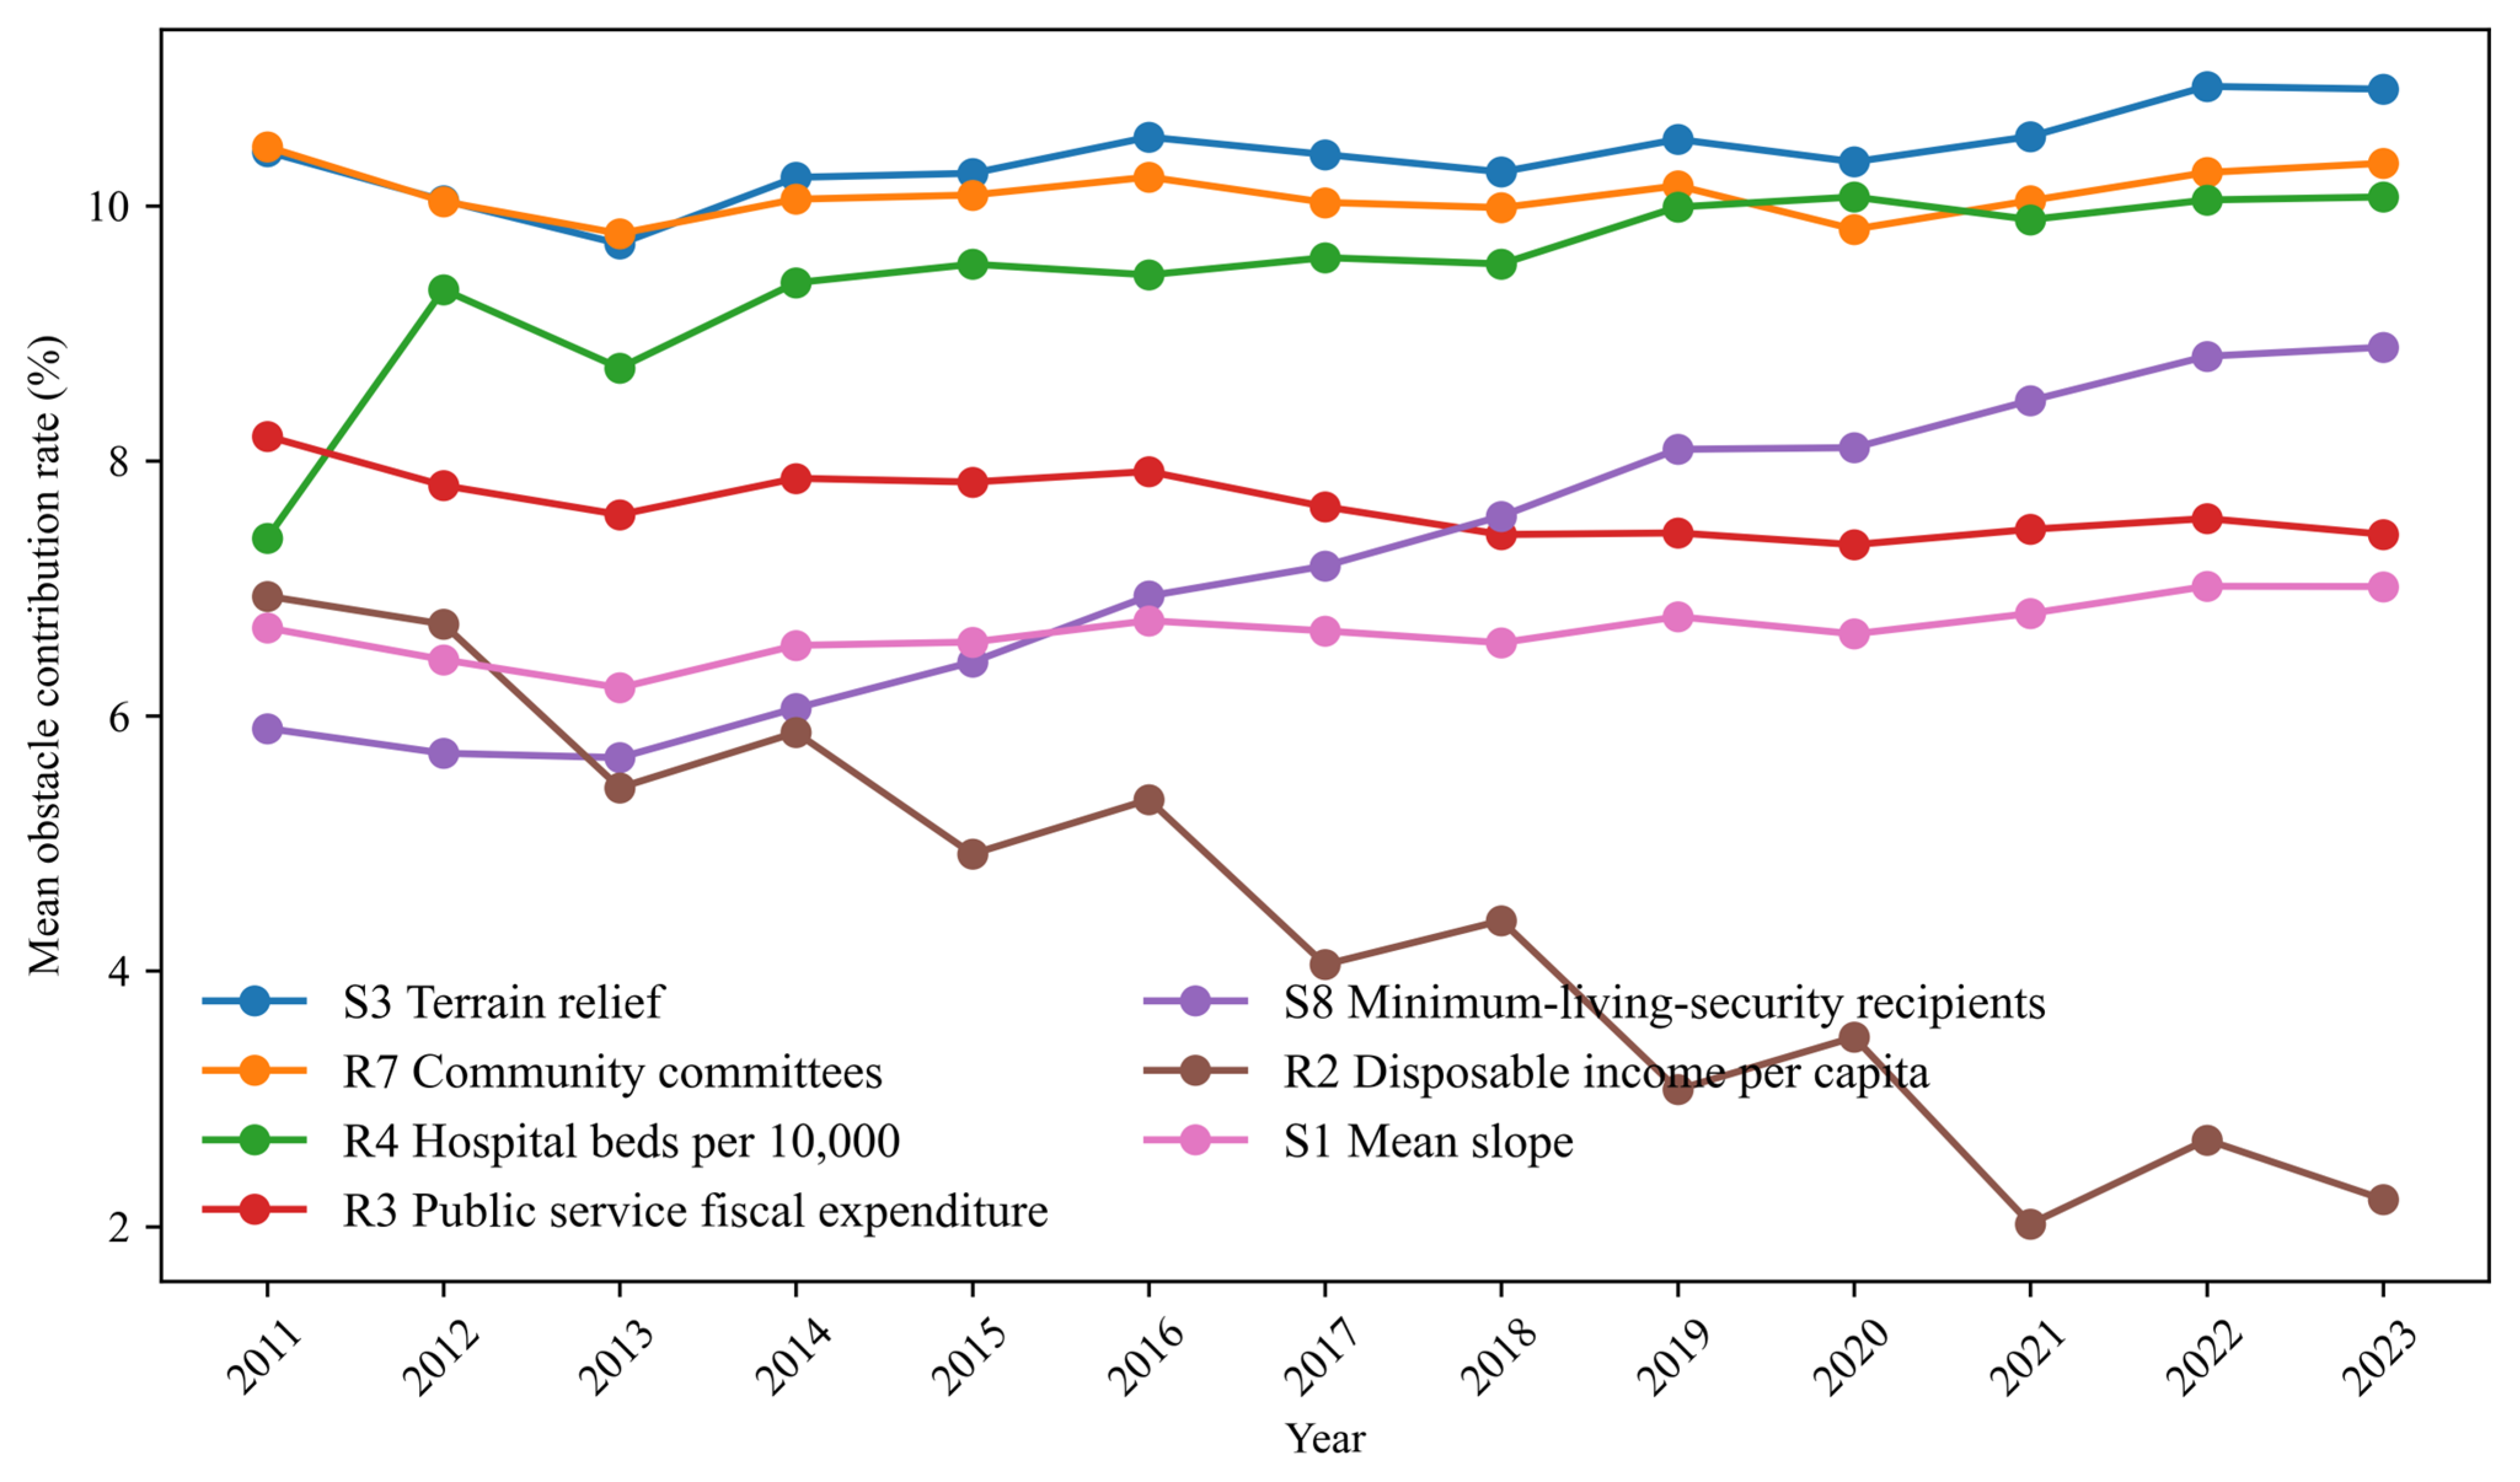
The annual top-5 obstacle, calculated as the mean obstacle contribution rate averaged across 21 cities, and the temporal evolution of key constraints from 2011 to 2023 are presented in Figure 8. The results reveal that the obstacle structure is both highly persistent and strongly concentrated. A stable “core group” of factors repeatedly dominates the annual Top-5 rankings, including S3 (terrain relief) and three response-related indicators—R7 (number of community committees), R4 (hospital beds per 10,000 persons), and R3 (public service fiscal expenditure). The recurrent appearance of these indicators suggests that province-wide improvements in urban flood resilience are consistently constrained by terrain-related sensitivity and the foundational capacity of grassroots governance and essential public service provision, rather than by a broadly distributed set of factors.
Beyond this stable core, a phased substitution pattern is evident among lower-ranked constraints, particularly for the fifth-ranked factor. This position shifts from R2 in the early period to S1 in the middle years, and subsequently to S8 from 2016 onward. Such replacement dynamics indicate that, as the resilience system evolves, the dominant constraints gradually extend beyond general socio-economic capacity and terrain-related sensitivity toward issues related to social vulnerability and welfare-related pressure. Consistent with this transition, Figure 8 shows a noticeable increase in the obstacle contributions of R4 and S8 in the later years, while the relative contribution of R3 becomes comparatively weaker. This pattern suggests that the marginal constraints on resilience improvement have increasingly shifted toward healthcare service capacity and social vulnerability, rather than fiscal investment alone.

3.4. Cross-City Heterogeneity in Obstacle Structures

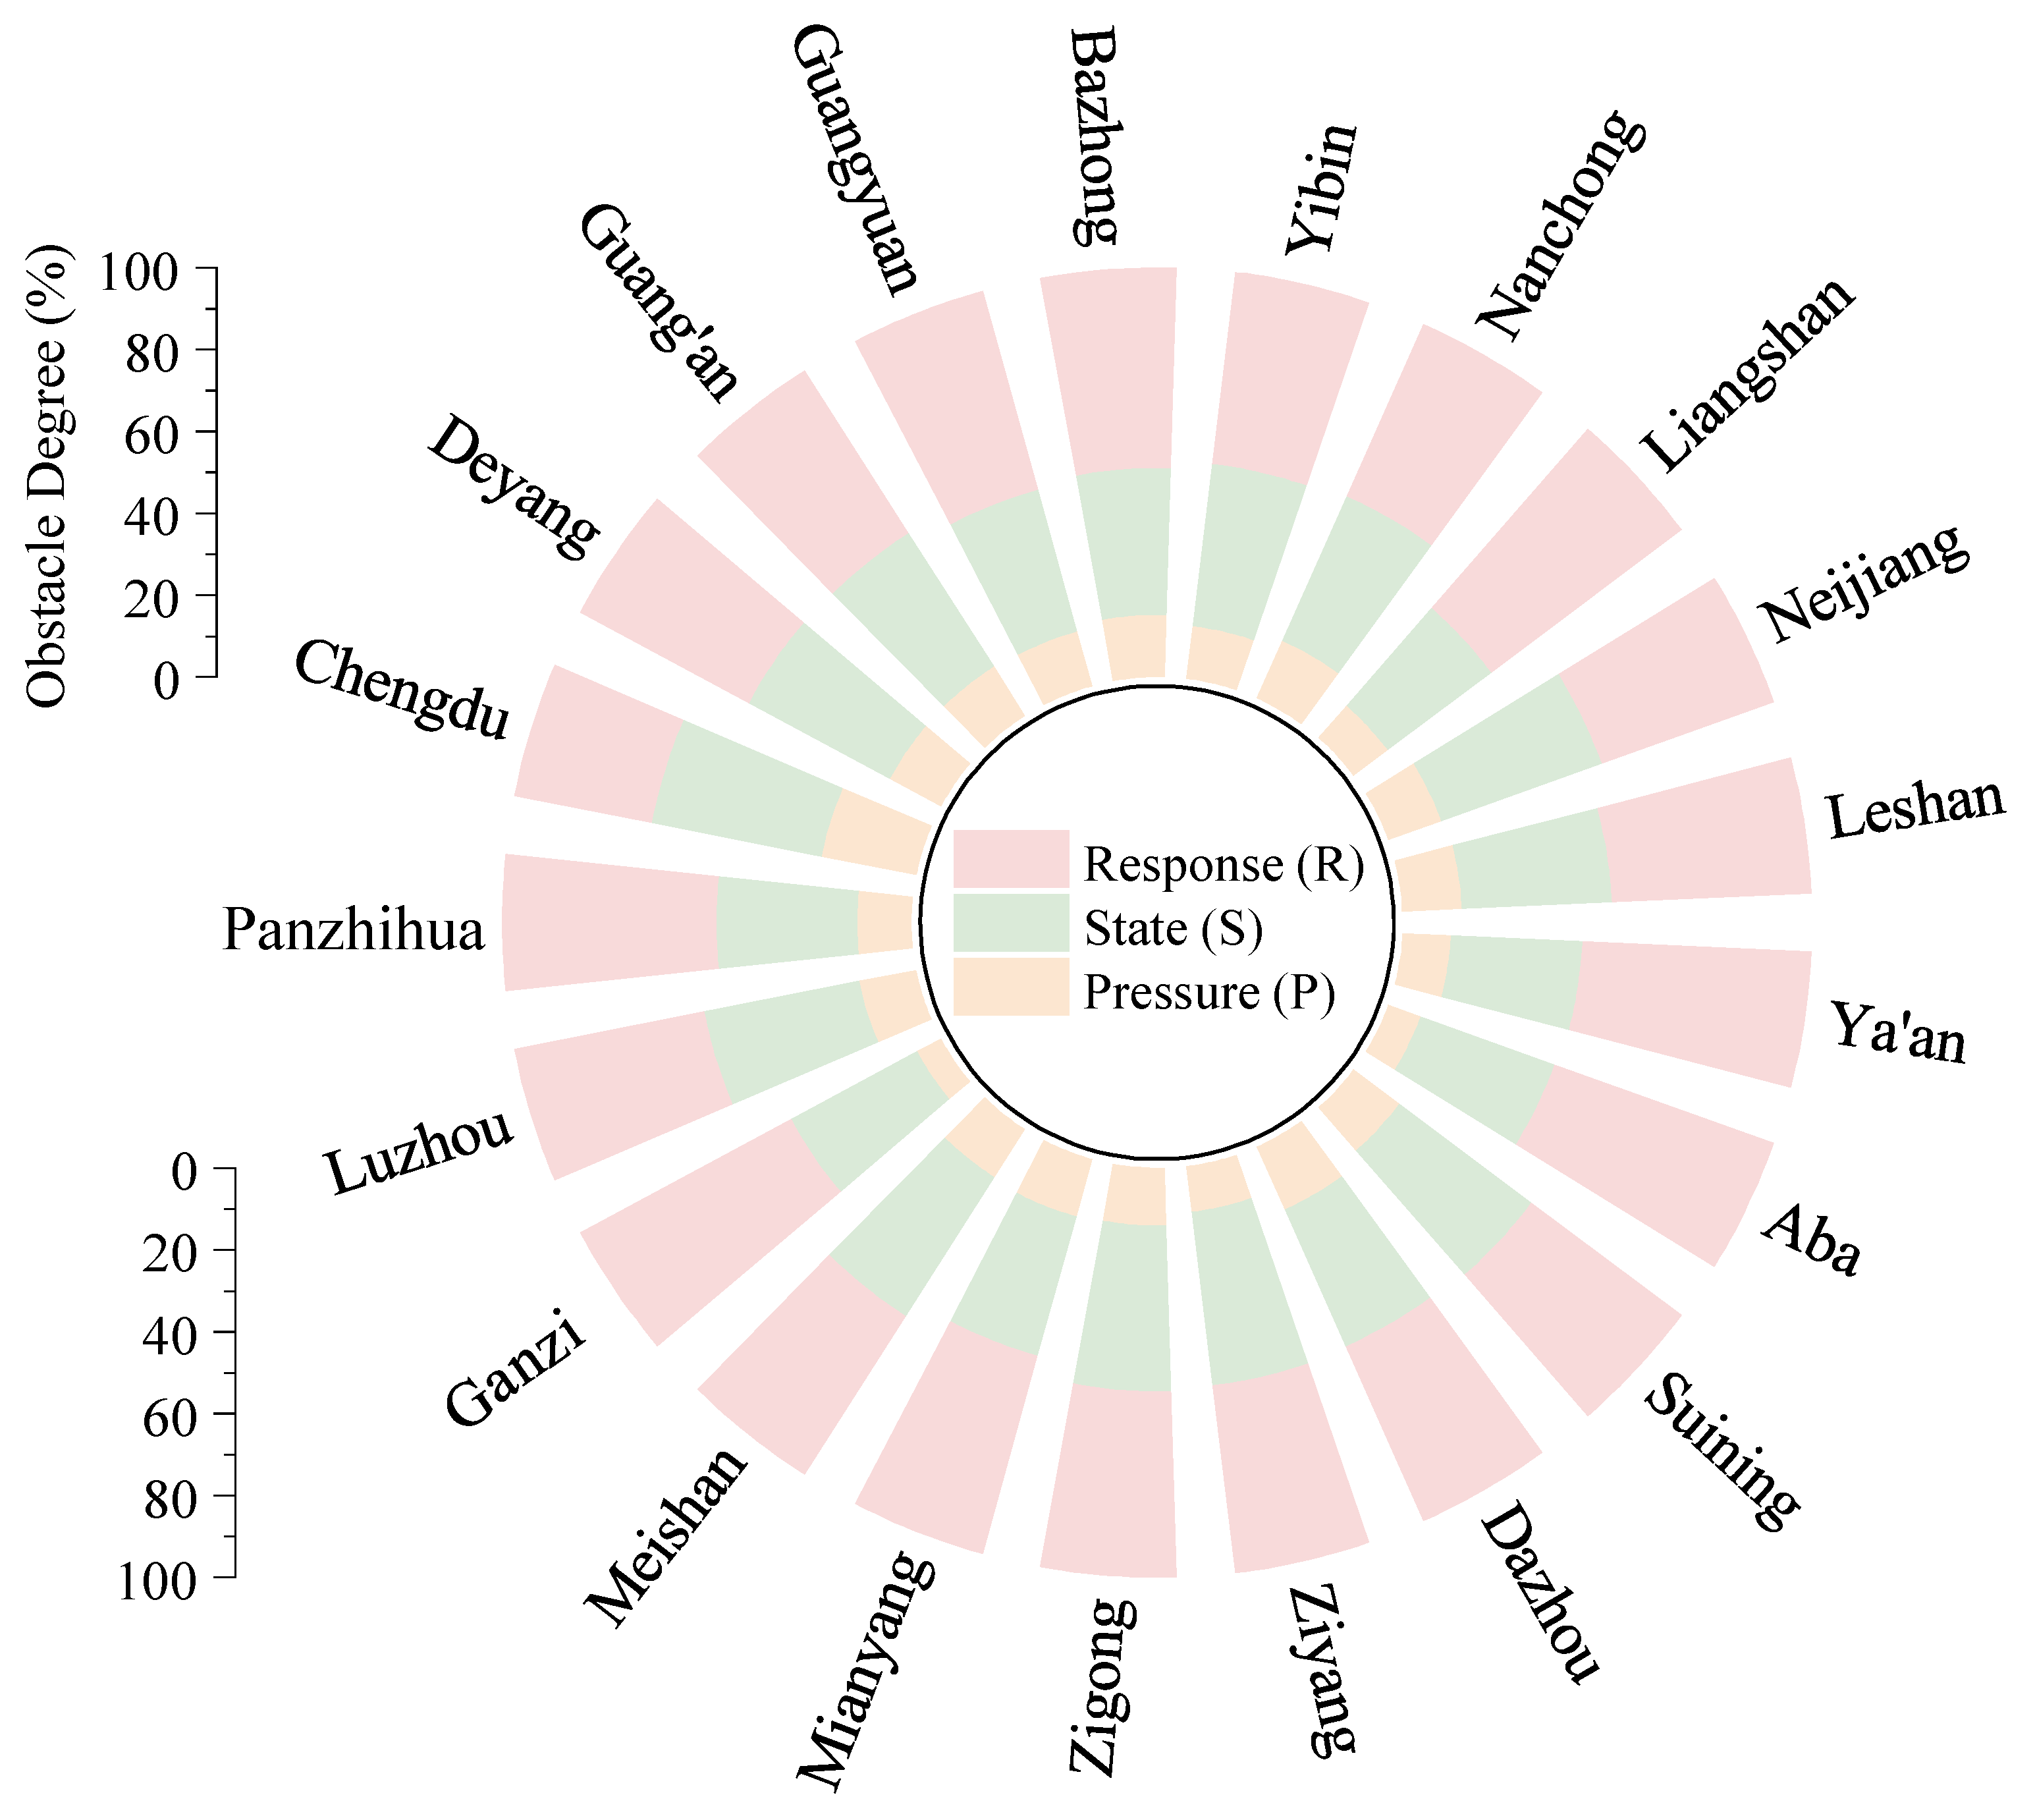
The obstacle structure exhibits notable variation across cities in terms of subsystem-level contributions. The cities with relatively high pressure-side obstacle shares (mean P_share) are led by Chengdu at 23.66%, a value substantially higher than that of all other cities. Dazhou, Nanchong, Bazhong, and Leshan also display comparatively elevated pressure-side shares. Cities characterized by relatively high state-side obstacle shares (mean S_share) include Ziyang, Chengdu, Neijiang, Zigong, and Suining. In contrast, cities with relatively high response-side obstacle shares (mean R_share) are primarily Ganzi, Liangshan, Aba Ya’an, and Panzhihua (Figure 9). Notably, Chengdu combines the highest pressure-side share, approximately 23.66%, with a relatively high state-side share of about 42.26%, resulting in a comparatively lower response-side share of roughly 34.08%. This distribution indicates that Chengdu’s binding constraints are strongly associated with pressure and state conditions within the obstacle decomposition, differing from the response-dominated constraint pattern observed in most other cities.
For western prefectures such as Ganzi, Liangshan, Aba and Ya’an, the obstacle profiles reveal relatively lower pressure-side constraints but more pronounced response-side constraints (Figure 9). In the dataset, this pattern is reflected by higher values of R_share coupled with comparatively smaller P_share. Although these cities generally exhibit higher levels of flood resilience, their constraint structures remain primarily shaped by limitations in response capacity, particularly in indicators associated with public service provision and grassroots governance. This pattern suggests that even when pressure-related constraints are relatively limited, further improvements in resilience still depend on addressing deficiencies in response capacity.

3.5. Obstacle Patterns Across Resilience Class

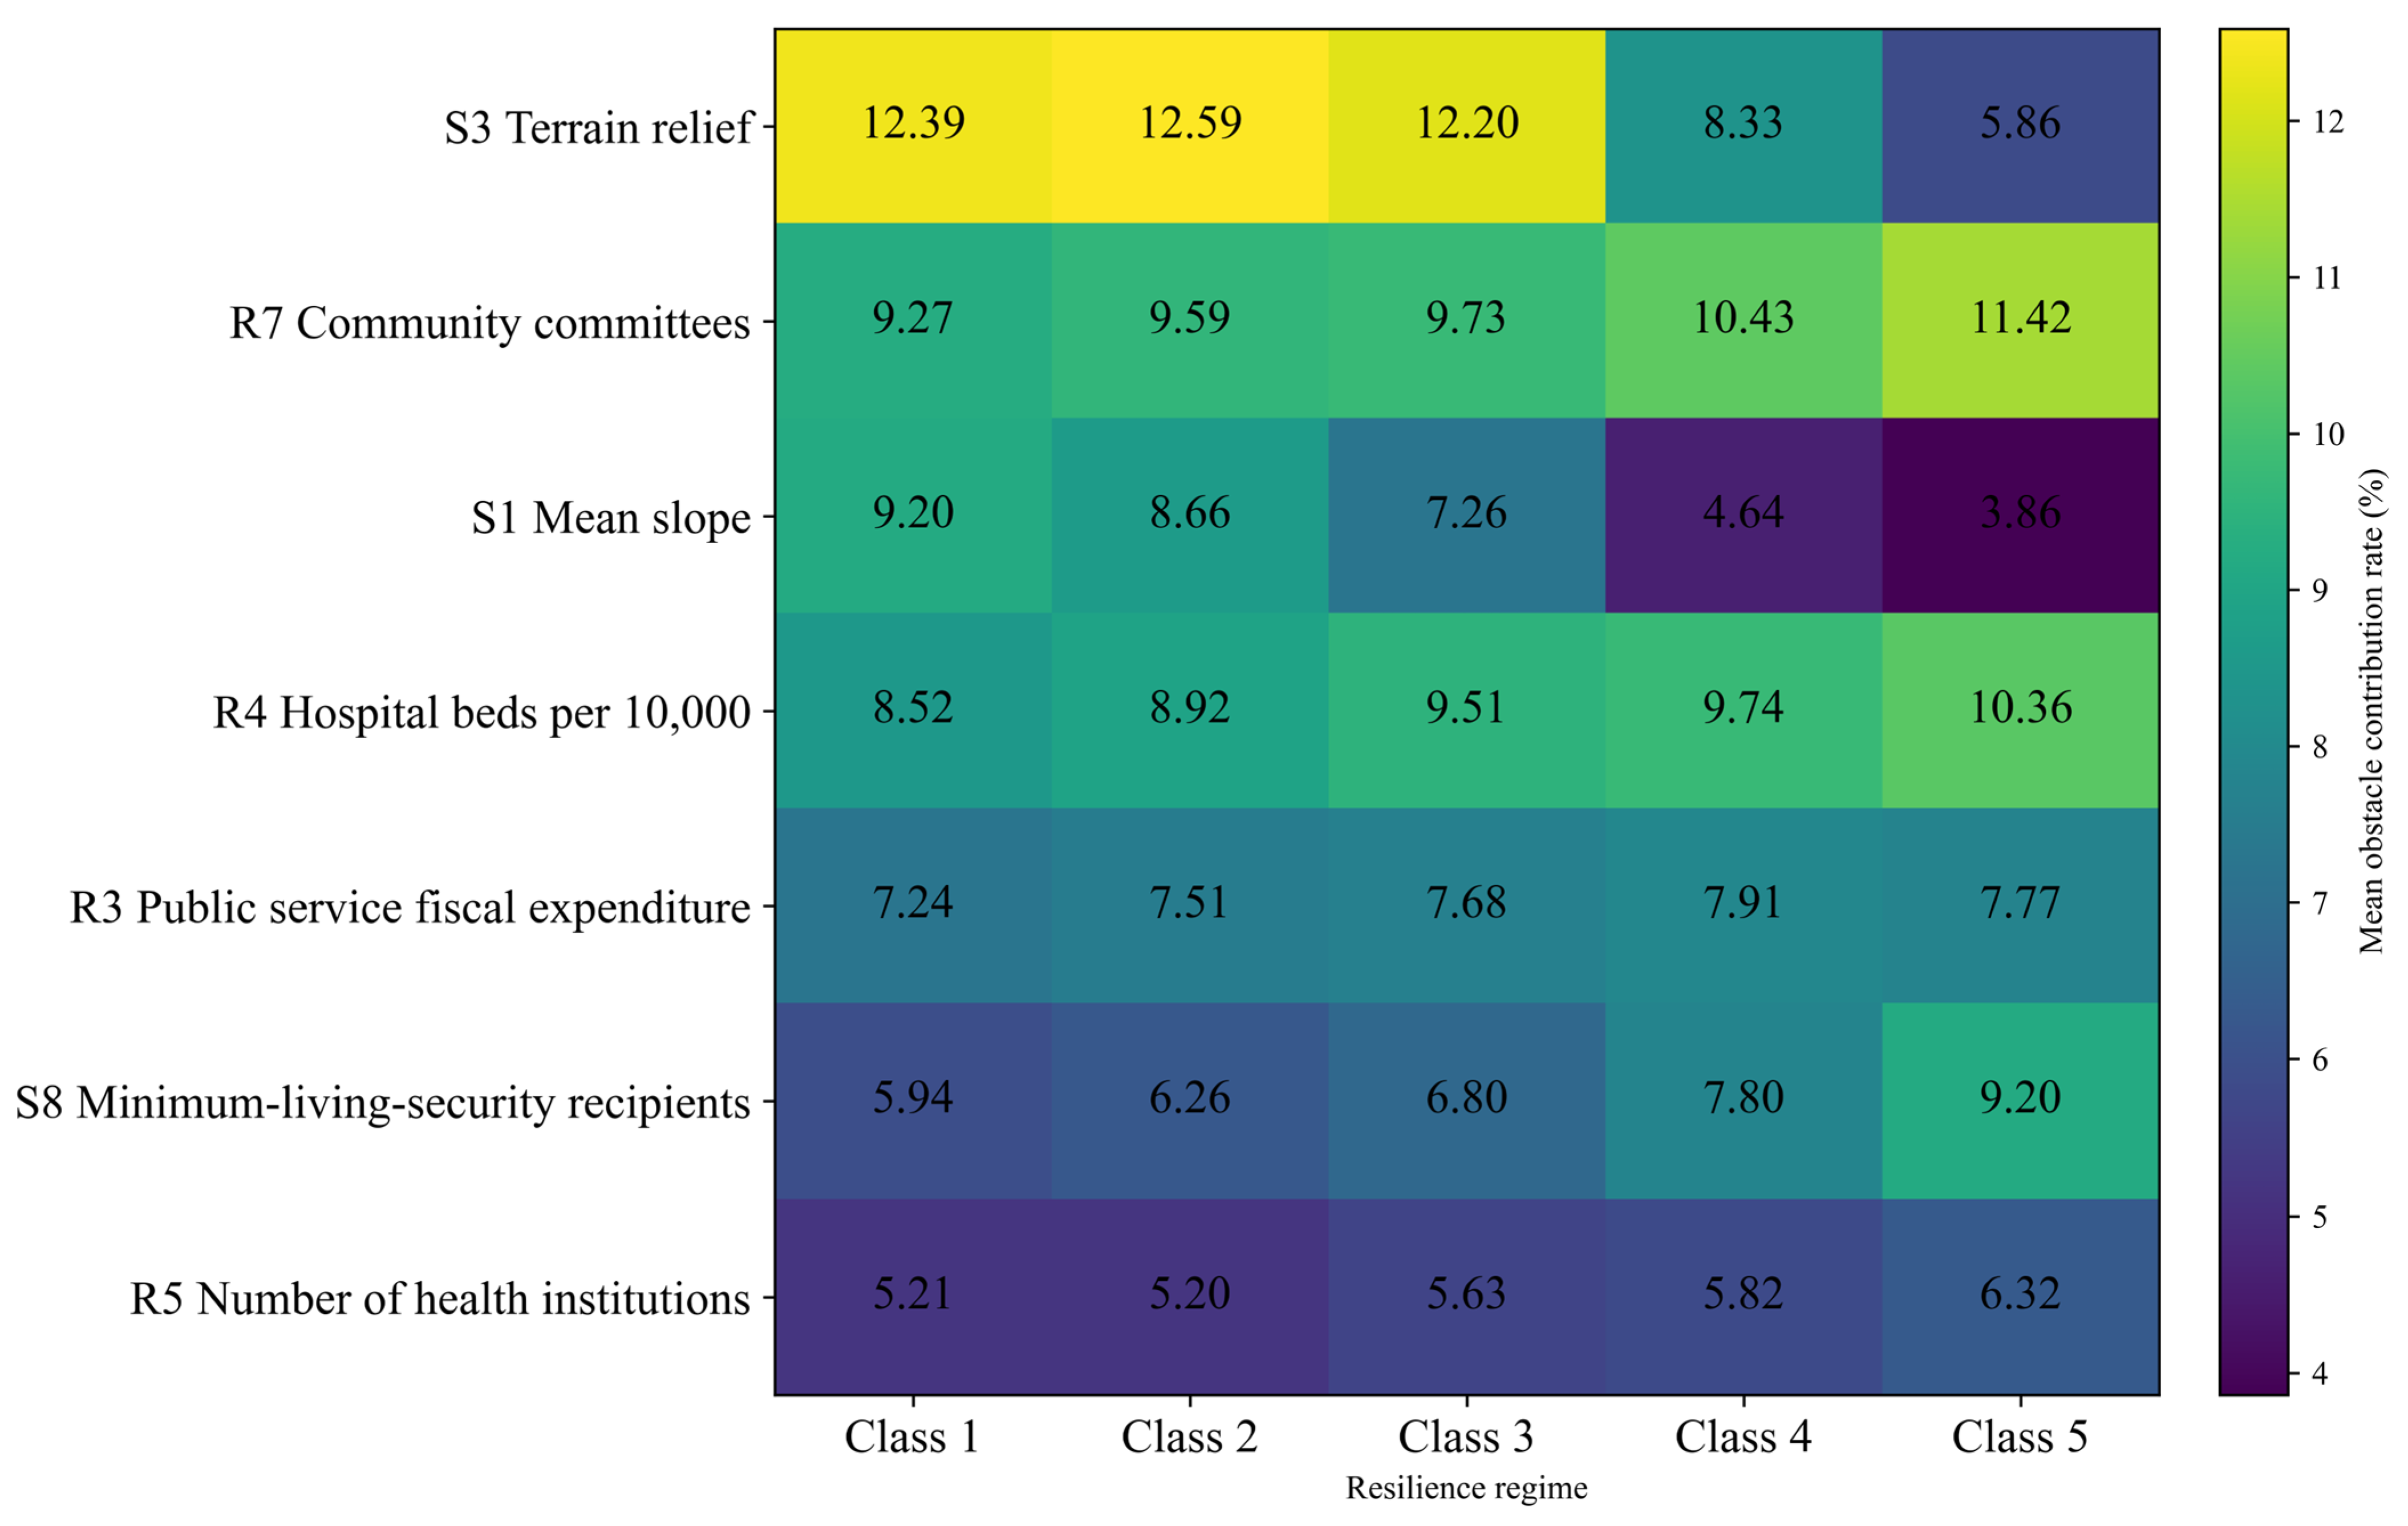
When stratified by resilience class, the regime-specific distribution of dominant obstacles is illustrated in Figure 10. The results reveal a clear regime dependence in the composition of binding constraints. In the lower resilience regimes (Classes 1–2), the principal obstacles are jointly associated with terrain-related sensitivity and limited foundational response capacity. As resilience levels advance to intermediate regimes (Classes 3–4), response-related constraints become increasingly prominent, and the dominant obstacle structure gradually concentrates on indicators linked to grassroots governance capacity and the provision of essential public services. In the highest resilience regime (Class 5), the primary constraints remain centered on response-side service capacity, indicating that further marginal improvements in resilience at advanced stages depend more on strengthening service reliability and systemic operational capacity rather than expanding pressure-side buffers.
The contribution of the Response (R) subsystem increases steadily with resilience class, rising from 45.62% in Class 1 to 52.66% in Class 5. At the same time, the share of the Pressure (P) subsystem declines from 14.48% to 11.68%, while the State (S) subsystem decreases from 39.89% to 35.66% (Table 4). This pattern suggests that as cities transition from lower to higher resilience regimes, the relative bottleneck increasingly concentrates within the response subsystem. Consequently, cities with higher resilience levels tend to be more constrained by the adequacy and stability of governance capacity and public service provision, whereas pressure-related variability accounts for a comparatively smaller share of the overall obstacle structure.

4. Discussion

The temporal dynamics, spatial patterns and structural constraints of urban flood resilience across the prefecture levels of cities in Sichuan Province indicate that, although the overall resilience level remains moderate, UFR has experienced a gradual upward trajectory over time (Figure 5 and Figure 6). This pattern supports the validity of the system synergy perspective for megacities and is likely associated with synergy effects and economies of scale generated by factor agglomeration [37]. This improvement is supported by a modest reduction in disparities across cities. At the same time, resilience regimes display strong temporal persistence, with cities in both lower and higher resilience categories maintaining relatively stable positions within the overall resilience structure throughout the study period. The spatial pattern of resilience also demonstrates clear heterogeneity. Cities consistently occupying medium–high to high resilience regimes are primarily located in the western mountainous–plateau transition zones, where lower population density and distinct terrain conditions shape a different exposure and capacity structure. In contrast, cities that persistently remain in lower resilience regimes are largely concentrated in the Sichuan Basin, characterized by plains and hilly terrain where higher population density and stronger precipitation-related hazards tend to increase systemic vulnerability [25]. Chengdu specifically represents a notable exception within the basin region. Despite sharing similar physiographic conditions with other basin cities, it consistently remains in the highest resilience regime. This divergence likely reflects the structural advantages associated with megacity systems, including stronger institutional capacity, more developed public service provision, and greater governance resources linked to its role as the provincial capital [37]. The stability of these spatial patterns suggests that flood resilience across the province is shaped jointly by physiographic conditions and urban governance capacity. Consequently, enhancing provincial resilience requires differentiated governance strategies that account for regional terrain characteristics and varying institutional capacities, particularly to accelerate resilience improvements in cities that remain in persistently low-resilience regimes.
In addition to these spatial differences, the subsystem analysis shows that distinct interannual dynamics across the PSR dimensions (Figure 3 and Figure 7). The state subsystem shows a relatively stable and gradual improvement over time, while the response subsystem exhibits a consistent and comparatively rapid upward trend. By contrast, the pressure subsystem demonstrates pronounced year-to-year fluctuations and falls slightly below its 2011 level by 2023. This pattern aligns with previous findings suggesting that long-term resilience enhancement is primarily driven by the accumulation of response capacity, whereas external pressures tend to shape short-term variability [7,25,38]. Notably, the sharp changes observed in 2013 and 2018 correspond with years when Sichuan experienced substantial flood pressure according to regional reports. The marked fluctuations in 2020 and 2021 may also be linked to the impacts of the COVID-19 pandemic, consistent with previous studies that identify resilience variations using night-time light data or epidemiological modeling approaches [37].
The results show that the overall obstacle structure across the PSR subsystems remains relatively stable during the study period (Figure 7), while the dominant obstacles at the city level also exhibit strong persistence (Figure 8). Terrain conditions, community governance capacity, healthcare resources, and public fiscal expenditure consistently rank among the top obstacles, highlighting the importance of macro-level public governance capacity in shaping resilience outcomes, a finding consistent with previous studies [6,39]. In addition to this stable core set of constraints, the fifth-ranked obstacles demonstrate a stage-dependent transition. Per capita income represents a major constraint in the early period, but its marginal influence gradually weakens after reaching a certain threshold, suggesting diminishing marginal effects of economic capacity on resilience improvement. This observation is consistent with studies reporting nonlinear temporal dynamics in resilience drivers [40]. In contrast, the obstacle effects associated with socially vulnerable groups, particularly the number of recipients with minimum living allowance, increase over time and emerge as more prominent constraints. This shift indicates that, as urban flood resilience continues to evolve, greater attention should be directed toward social policies and grassroots service provision targeting vulnerable populations.
Within this broader provincial context, Chengdu stands out as a distinctive case (Figure 5, Figure 6 and Figure 9). Compared with other cities, Chengdu substantially outperforms the sampled cities in terms of UFR, reflected not only in its persistently high resilience level but also in its relatively alleviated structural constraints. Higher levels of urban resilience are consistently associated with stronger flood risk mitigation outcomes under both routine and extreme conditions, which corresponds with findings from studies on flood resilience within urban agglomerations [37]. In Chengdu in particular, the degree of obstacles associated with the response subsystem shows a declining trend, suggesting that the primary constraints on resilience may be shifting from insufficient response and recovery capacity toward deeper systemic challenges. This observation is consistent with a process-oriented understanding of resilience, which conceptualizes resilience not as a static capability but as a dynamic process shaped by cycles of disturbance, adaptation, and learning, during which key bottlenecks may evolve as capacity accumulates [41]. Resilience development from the perspective of evolutionary resilience, typically follows a staged progression from engineering resilience to management resilience and ultimately to governance-based resilience [26]. Accordingly, the continued decline in response-side obstacle contributions in Chengdu should not be interpreted as the complete resolution of constraints. Rather, it may signal a transition in resilience priorities, shifting from strengthening response and recovery capacity toward reducing exposure and vulnerability within the pressure subsystem, enhancing carrying capacity and spatial structure within the state subsystem, and gradually advancing toward a higher-order form of resilience governance.
From a policy perspective, the persistence of core obstacle factors (Figure 8), the heterogeneity of subsystem obstacle structures across cities (Figure 9), and the shift in obstacle composition across resilience classes (Figure 10; Table 4) all point to the need for stage-oriented and regionally differentiated governance. Persistent obstacles indicate that fiscal investment should be directed more strategically toward high-risk flood-prone areas, with priority given to flood-response infrastructure, healthcare provision, public services, and community governance. Greater attention should also be paid to the growing constraint effects associated with vulnerable groups. Policy priorities should nevertheless vary by city typology. In this case, western plateau cities should focus on consolidating resilience advantages under complex terrain by improving emergency accessibility, infrastructure redundancy, and essential public services. Basin cities should prioritize the reinforcement of response capacity, especially grassroots governance, healthcare provision, and public service support. Chengdu, by contrast, should shift from basic capacity expansion towards managing the terrain-related exposure and sensitivity through refined spatial planning and intelligent risk management.
This study has several limitations. First, constrained by data availability and consistency in statistical definitions, the data used here support long-term comparison from 2011 to 2023, although they cannot fully capture intra-urban heterogeneity or short-term dynamic processes. Second, although the PSR framework and composite-index approach provide a clear and operational pathway for assessing urban flood resilience, they inevitably simplify the complex interactions among multiple dimensions of resilience formation, as well as some key capacities still have to be represented by proxy indicators, leaving room to improve the completeness of the indicator system. Third, while the combined weighting approach, TOPSIS, and the obstacle degree model enhance the operability of assessment and diagnosis, the results may still be influenced by indicator selection, weighting design, and the inherent subjectivity of the Jenks natural breaks classification. Future research could address these limitations by integrating finer-scale, multi-source, and more process-oriented spatiotemporal data, incorporating higher-resolution information on hazard processes and infrastructure operation, and strengthening robustness tests for weighting, classification, and composite evaluation results, thereby improving both the accuracy and policy relevance of urban flood resilience assessment.

5. Conclusions

The integrated framework combines the PSR model, TOPSIS evaluation, and obstacle-degree analysis to examine urban flood resilience (UFR) across 21 prefecture-level cities in Sichuan Province from 2011 to 2023. The results show that UFR increased overall by 8.08%, although with noticeable fluctuations. Short-term variations were mainly driven by pressure-side shocks such as precipitation and flood events, whereas long-term improvements were primarily supported by the accumulation of response capacity. At the city level, Chengdu consistently maintained the highest resilience level throughout the study period, whereas Ziyang had the lowest overall resilience level and ranked last over the nine years. Across the entire study period, the highest UFR was recorded in Chengdu in 2023, while the lowest was observed in Suining in 2012.
The obstacle analysis reveals a highly stable constraint structure, with response-side factors consistently contributing the largest share of obstacles. Terrain conditions, community governance capacity, healthcare resources, and public service expenditure remain the most persistent constraints. At the same time, the fifth-ranked obstacle gradually shifts from per capita income to the number of recipients with minimum-living allowance, indicating a transition in resilience bottlenecks from economic capacity toward social vulnerability. As resilience levels increase, the share of response-side constraints also rises, suggesting that further improvements increasingly depend on the stability and effectiveness of governance and public service systems. Chengdu stands out as a distinctive case, where resilience constraints have shifted from response capacity toward exposure and sensitivity. These findings highlight the importance of stage-oriented and regionally differentiated governance strategies for strengthening urban flood resilience. These insights into bottleneck transformation and stage-based evolution patterns are of significant reference value for cities worldwide, particularly those facing increasingly severe urban flooding challenges.
This study has several limitations. While the data and framework used here can allow long-term provincial comparison, they cannot fully reflect intra-urban heterogeneity, short-term dynamics, or all dimensions of resilience formation. Future research should incorporate finer-scale, more process-oriented data and strengthen robustness testing to support improved UFR assessment.

Author Contributions

B.T. designed the research; R.T., B.T., X.L., W.X. and L.W. collected, collated, and summarized the literature and wrote the first draft of the article. and R.T., B.T.,S.L., B.R.A., W.X., X.L., L.W. and J.K.B. reviewed and proofread the first draft. B.T. provided the funding and managed and supervised the operation of the project. All authors have read and agreed to the published version of the manuscript.

Funding

This work was supported by the National Natural Science Foundation of China (No.42361144880, 52478071), Sichuan Provincial Key Research Base for Philosophy and Social Sciences: Research Center for Social Development and Social Risk Control (SR23A09), the Natural Science Foundation of Sichuan Province of China (No. 2024NSFSC1073), and “the Fundamental Research Funds for the Central Universities”.

Data Availability Statement

The original contributions presented in the study are included in the article. Further inquiries can be directed to the corresponding author.

Acknowledgments

We would like to express our sincere gratitude to the reviewers for their insightful comments and constructive feedback, which have greatly contributed to improving the quality of this paper. We also extend our thanks to all colleagues who supported us during the research process. Without their assistance, this work would not have been possible.

Conflicts of Interest

The authors declare no conflicts of interest.

Abbreviations

The following abbreviations are used in this manuscript:
UFRUrban flood resilience
PSRPressure–State–Response
AHPAnalytical Hierarchical Process
EWMEntropy Weight Method

References

  1. Fischer, E.M.; Sippel, S.; Knutti, R. Increasing Probability of Record-Shattering Climate Extremes. Nat. Clim. Change 2021, 11, 689–695. [Google Scholar] [CrossRef] [Scilit]
  2. Thackeray, C.W.; Hall, A.; Norris, J.; Chen, D. Constraining the Increased Frequency of Global Precipitation Extremes under Warming. Nat. Clim. Change 2022, 12, 441–448. [Google Scholar] [CrossRef] [Scilit]
  3. Wing, O.E.J.; Lehman, W.; Bates, P.D.; Sampson, C.C.; Quinn, N.; Smith, A.M.; Neal, J.C.; Porter, J.R.; Kousky, C. Inequitable Patterns of US Flood Risk in the Anthropocene. Nat. Clim. Change 2022, 12, 156–162. [Google Scholar] [CrossRef] [Scilit]
  4. Zhu, S.; Feng, H.; Arashpour, M.; Zhang, F. Enhancing Urban Flood Resilience: A Coupling Coordinated Evaluation and Geographical Factor Analysis under SES-PSR Framework. Int. J. Disaster Risk Reduct. 2024, 101, 104243. [Google Scholar] [CrossRef] [Scilit]
  5. Ji, J.; Fang, L.; Chen, J.; Ding, T. A Novel Framework for Urban Flood Resilience Assessment at the Urban Agglomeration Scale. Int. J. Disaster Risk Reduct. 2024, 108, 104519. [Google Scholar] [CrossRef] [Scilit]
  6. Sun, H.; Mao, W.; Luo, D. Paving the Path to Urban Flood Resilience by Overcoming Barriers: A Novel Grey Structure Analysis Approach. Sustain. Cities Soc. 2025, 121, 106187. [Google Scholar] [CrossRef] [Scilit]
  7. Wei, Y.; Kidokoro, T.; Seta, F.; Shu, B. Spatial-Temporal Assessment of Urban Resilience to Disasters: A Case Study in Chengdu, China. Land 2024, 13, 506. [Google Scholar] [CrossRef] [Scilit]
  8. Li, W.; Jiang, R.; Wu, H.; Xie, J.; Zhao, Y.; Song, Y.; Li, F. A System Dynamics Model of Urban Rainstorm and Flood Resilience to Achieve the Sustainable Development Goals. Sustain. Cities Soc. 2023, 96, 104631. [Google Scholar] [CrossRef] [Scilit]
  9. Li, H.; Hu, C.; Zhu, M.; Hong, J.; Wang, Z.; Fu, F.; Zhao, J. Study on the Coupled and Coordinated Development of Urban Resilience and Urbanization Level in the Yellow River Basin. Environ. Dev. Sustain. 2024, 27, 19675–19705. [Google Scholar] [CrossRef] [Scilit]
  10. Ge, Y.; Jia, W.; Zhao, H.; Xiang, P. A Framework for Urban Resilience Measurement and Enhancement Strategies: A Case Study in Qingdao, China. J. Environ. Manag. 2024, 367, 122047. [Google Scholar] [CrossRef] [Scilit]
  11. Neves, J.L.; Espling, M. The Role of Communities in Building Urban Flood Resilience in Matola, Mozambique. Int. J. Disaster Risk Reduct. 2025, 118, 105262. [Google Scholar] [CrossRef] [Scilit]
  12. Meerow, S.; Newell, J.P.; Stults, M. Defining Urban Resilience: A Review. Landsc. Urban Plan. 2016, 147, 38–49. [Google Scholar] [CrossRef] [Scilit]
  13. Pan, W.; Yan, M.; Zhao, Z.; Gulzar, M.A. Flood Risk Assessment and Management in Urban Communities: The Case of Communities in Wuhan. Land 2023, 12, 112. [Google Scholar] [CrossRef] [Scilit]
  14. Liu, Y.; She, J.; Wang, L.; Li, Z.; Guo, Z. Decoding Urban Flood Resilience in the Henan Section of the Yellow River Basin: Insights from an XGBoost-SHAP Analysis. J. Environ. Manag. 2025, 394, 127632. [Google Scholar] [CrossRef] [Scilit]
  15. Chen, Z.; Zhu, S.; Feng, H.; Zhang, H.; Li, D. Coupling Dynamics of Urban Flood Resilience in China from 2012 to 2022: A Network-Based Approach. Sustain. Cities Soc. 2025, 118, 105996. [Google Scholar] [CrossRef] [Scilit]
  16. Xiao, S.; Zou, L.; Xia, J.; Dong, Y.; Yang, Z.; Yao, T. Assessment of the Urban Waterlogging Resilience and Identification of Its Driving Factors: A Case Study of Wuhan City, China. Sci. Total Environ. 2023, 866, 161321. [Google Scholar] [CrossRef] [Scilit]
  17. Liu, M.; Zhao, Y.; Xu, X.; Zhang, H. Differentiated Strategy Is a Crucial Approach to Improve Urban Flood Resilience. J. Environ. Manag. 2025, 392, 126691. [Google Scholar] [CrossRef] [Scilit]
  18. Zhao, Z.; Liu, C.; Chang, W.; Ren, Y. Comprehensive Resilience Assessment and Obstacle Analysis of Cities Based on the PSR-TOPSIS Model: A Case Study of Jiangsu Cities. Land 2025, 14, 1437. [Google Scholar] [CrossRef] [Scilit]
  19. Zhang, R.; Li, Y.; Li, C.; Chen, T. A Complex Network Approach to Quantifying Flood Resilience in High-Density Coastal Urban Areas: A Case Study of Macau. Int. J. Disaster Risk Reduct. 2025, 119, 105335. [Google Scholar] [CrossRef] [Scilit]
  20. Xu, W.; Han, P.; Proverbs, D.G.; Guo, X. A Study of the Temporal and Spatial Evolution Trends of Urban Flood Resilience in the Pearl River Delta, China. Int. J. Build. Pathol. Adapt. 2025, 44, 720–739. [Google Scholar] [CrossRef] [Scilit]
  21. Tao, Y.; Tian, B.; Adhikari, B.R.; Zuo, Q.; Luo, X.; Di, B. A Review of Cutting-Edge Sensor Technologies for Improved Flood Monitoring and Damage Assessment. Sensors 2024, 24, 7090. [Google Scholar] [CrossRef] [Scilit] [PubMed]
  22. Xie, X.; Fang, B.; He, S. Is China’s Urbanization Quality and Ecosystem Health Developing Harmoniously? An Empirical Analysis from Jiangsu, China. Land 2022, 11, 530. [Google Scholar] [CrossRef] [Scilit]
  23. Liu, S.; Feng, L.; Xie, J.; Ke, Y. Assessing Urban Flood Resilience with Unascertained Measurement Theory: A Case Study of Jiangxi Province, China. Sustainability 2025, 18, 49. [Google Scholar] [CrossRef] [Scilit]
  24. Gu, T.; Yan, H.; Zhu, M.; Kang, Z.; Cui, P. Spatiotemporal Evolution Characteristics and Influencing Factors of Urban Flood Resilience: The Case of Yangtze River Delta, East China. Appl. Sci. 2025, 15, 10793. [Google Scholar] [CrossRef] [Scilit]
  25. Yin, H.; Zhang, F.; Tan, W.; Huang, C.; Xiao, R. Urban Flood Resilience Assessment and Driving Effects Exploration: A Case Study of the Beijing–Tianjin–Hebei Urban Agglomeration. Int. J. Disaster Risk Reduct. 2025, 126, 105608. [Google Scholar] [CrossRef] [Scilit]
  26. Liu, Y.; Jiang, Y.; Deng, Y. A Framework for Urban Flood Resilience Assessment: Integrating Multidimensional Indicators and Dynamic Adaptation Strategies. J. Environ. Manag. 2025, 392, 126841. [Google Scholar] [CrossRef] [Scilit]
  27. Deng, Z.; Xie, Z.; Jiang, F.; Xu, J.; Yang, S.; Xu, T.; Zhao, L.; Chen, Y.; He, J.; Hou, Z. Research on the Coupling Coordination of Land Use and Eco-Resilience Based on Entropy Weight Method: A Case Study on Dianchi Lake Basin. Landsc. Ecol. Eng. 2024, 20, 129–145. [Google Scholar] [CrossRef] [Scilit]
  28. Papilloud, T.; Röthlisberger, V.; Loreti, S.; Keiler, M. Flood Exposure Analysis of Road Infrastructure—Comparison of Different Methods at National Level. Int. J. Disaster Risk Reduct. 2020, 47, 101548. [Google Scholar] [CrossRef] [Scilit]
  29. Intini, P.; Blasi, G.; Fracella, F.; Francone, A.; Vergallo, R.; Perrone, D. Predicting Traffic Volumes on Road Infrastructures in the Context of Multi-Risk Assessment Frameworks. Int. J. Disaster Risk Reduct. 2025, 117, 105139. [Google Scholar] [CrossRef] [Scilit]
  30. Song, Y.; Cheng, Z. The Impact of Welfare Design on Consumption Patterns of the Poor: Evidence from the Recent Dibao Reform in Rural China. China Econ. Rev. 2024, 87, 102235. [Google Scholar] [CrossRef] [Scilit]
  31. Yang, T.; Wang, L. Did Urban Resilience Improve during 2005–2021? Evidence from 31 Chinese Provinces. Land 2024, 13, 397. [Google Scholar] [CrossRef] [Scilit]
  32. Yuan, Z.; Cai, L.; Xie, Z.; Zhao, X.; Zhang, H.; Zhao, S.; Zhao, X. Dynamic Evolution and Scenario-Based Prediction of Urban Flood Resilience: A System Dynamics Modeling Approach in Kunming, China. J. Environ. Manag. 2025, 395, 127740. [Google Scholar] [CrossRef] [Scilit]
  33. Wu, J.; Chen, X.; Lu, J. Assessment of Long and Short-Term Flood Risk Using the Multi-Criteria Analysis Model with the AHP-Entropy Method in Poyang Lake Basin. Int. J. Disaster Risk Reduct. 2022, 75, 102968. [Google Scholar] [CrossRef] [Scilit]
  34. Huang, Z.; Feng, C. Comprehensive Evaluation of Urban Storm Flooding Resilience by Integrating AHP–Entropy Weight Method and Cloud Model. Water 2025, 17, 2576. [Google Scholar] [CrossRef] [Scilit]
  35. Zhang, J.; Wang, T.; Goh, Y.M.; He, P.; Hua, L. The Effects of Long-Term Policies on Urban Resilience: A Dynamic Assessment Framework. Cities 2024, 153, 105294. [Google Scholar] [CrossRef] [Scilit]
  36. Xun, X.; Yuan, Y. Research on the Urban Resilience Evaluation with Hybrid Multiple Attribute TOPSIS Method: An Example in China. Nat Hazards 2020, 103, 557–577. [Google Scholar] [CrossRef] [Scilit]
  37. Xiao, Y.; Rao, X.; Chang, M.; Chen, L.; Huang, H. Assessment of Urban Flood Resilience and Obstacle Factors Identification: A Case Study of Three Major Urban Agglomerations in China. Ecol. Indic. 2025, 176, 113659. [Google Scholar] [CrossRef] [Scilit]
  38. Cao, F.; Xu, X.; Zhang, C.; Kong, W. Evaluation of Urban Flood Resilience and Its Space-Time Evolution: A Case Study of Zhejiang Province, China. Ecol. Indic. 2023, 154, 110643. [Google Scholar] [CrossRef] [Scilit]
  39. Campbell, K.A.; Laurien, F.; Czajkowski, J.; Keating, A.; Hochrainer-Stigler, S.; Montgomery, M. First Insights from the Flood Resilience Measurement Tool: A Large-Scale Community Flood Resilience Analysis. Int. J. Disaster Risk Reduct. 2019, 40, e101257. [Google Scholar] [CrossRef] [Scilit]
  40. Qian, J.; Du, Y.; Liang, F.; Yi, J.; Zhang, X.; Jiang, J.; Wang, N.; Tu, W.; Huang, S.; Pei, T.; et al. Measuring Community Resilience Inequality to Inland Flooding Using Location Aware Big Data. Cities 2024, 149, 104915. [Google Scholar] [CrossRef] [Scilit]
  41. Meerow, S.; Hannibal, B.; Woodruff, S.C.; Roy, M.; Matos, M.; Gilbertson, P.C. Urban Flood Resilience Networks: Exploring the Relationship between Governance Networks, Networks of Plans, and Spatial Flood Resilience Policies in Four Coastal Cities. Ann. Am. Assoc. Geogr. 2024, 114, 1866–1876. [Google Scholar] [CrossRef] [Scilit]
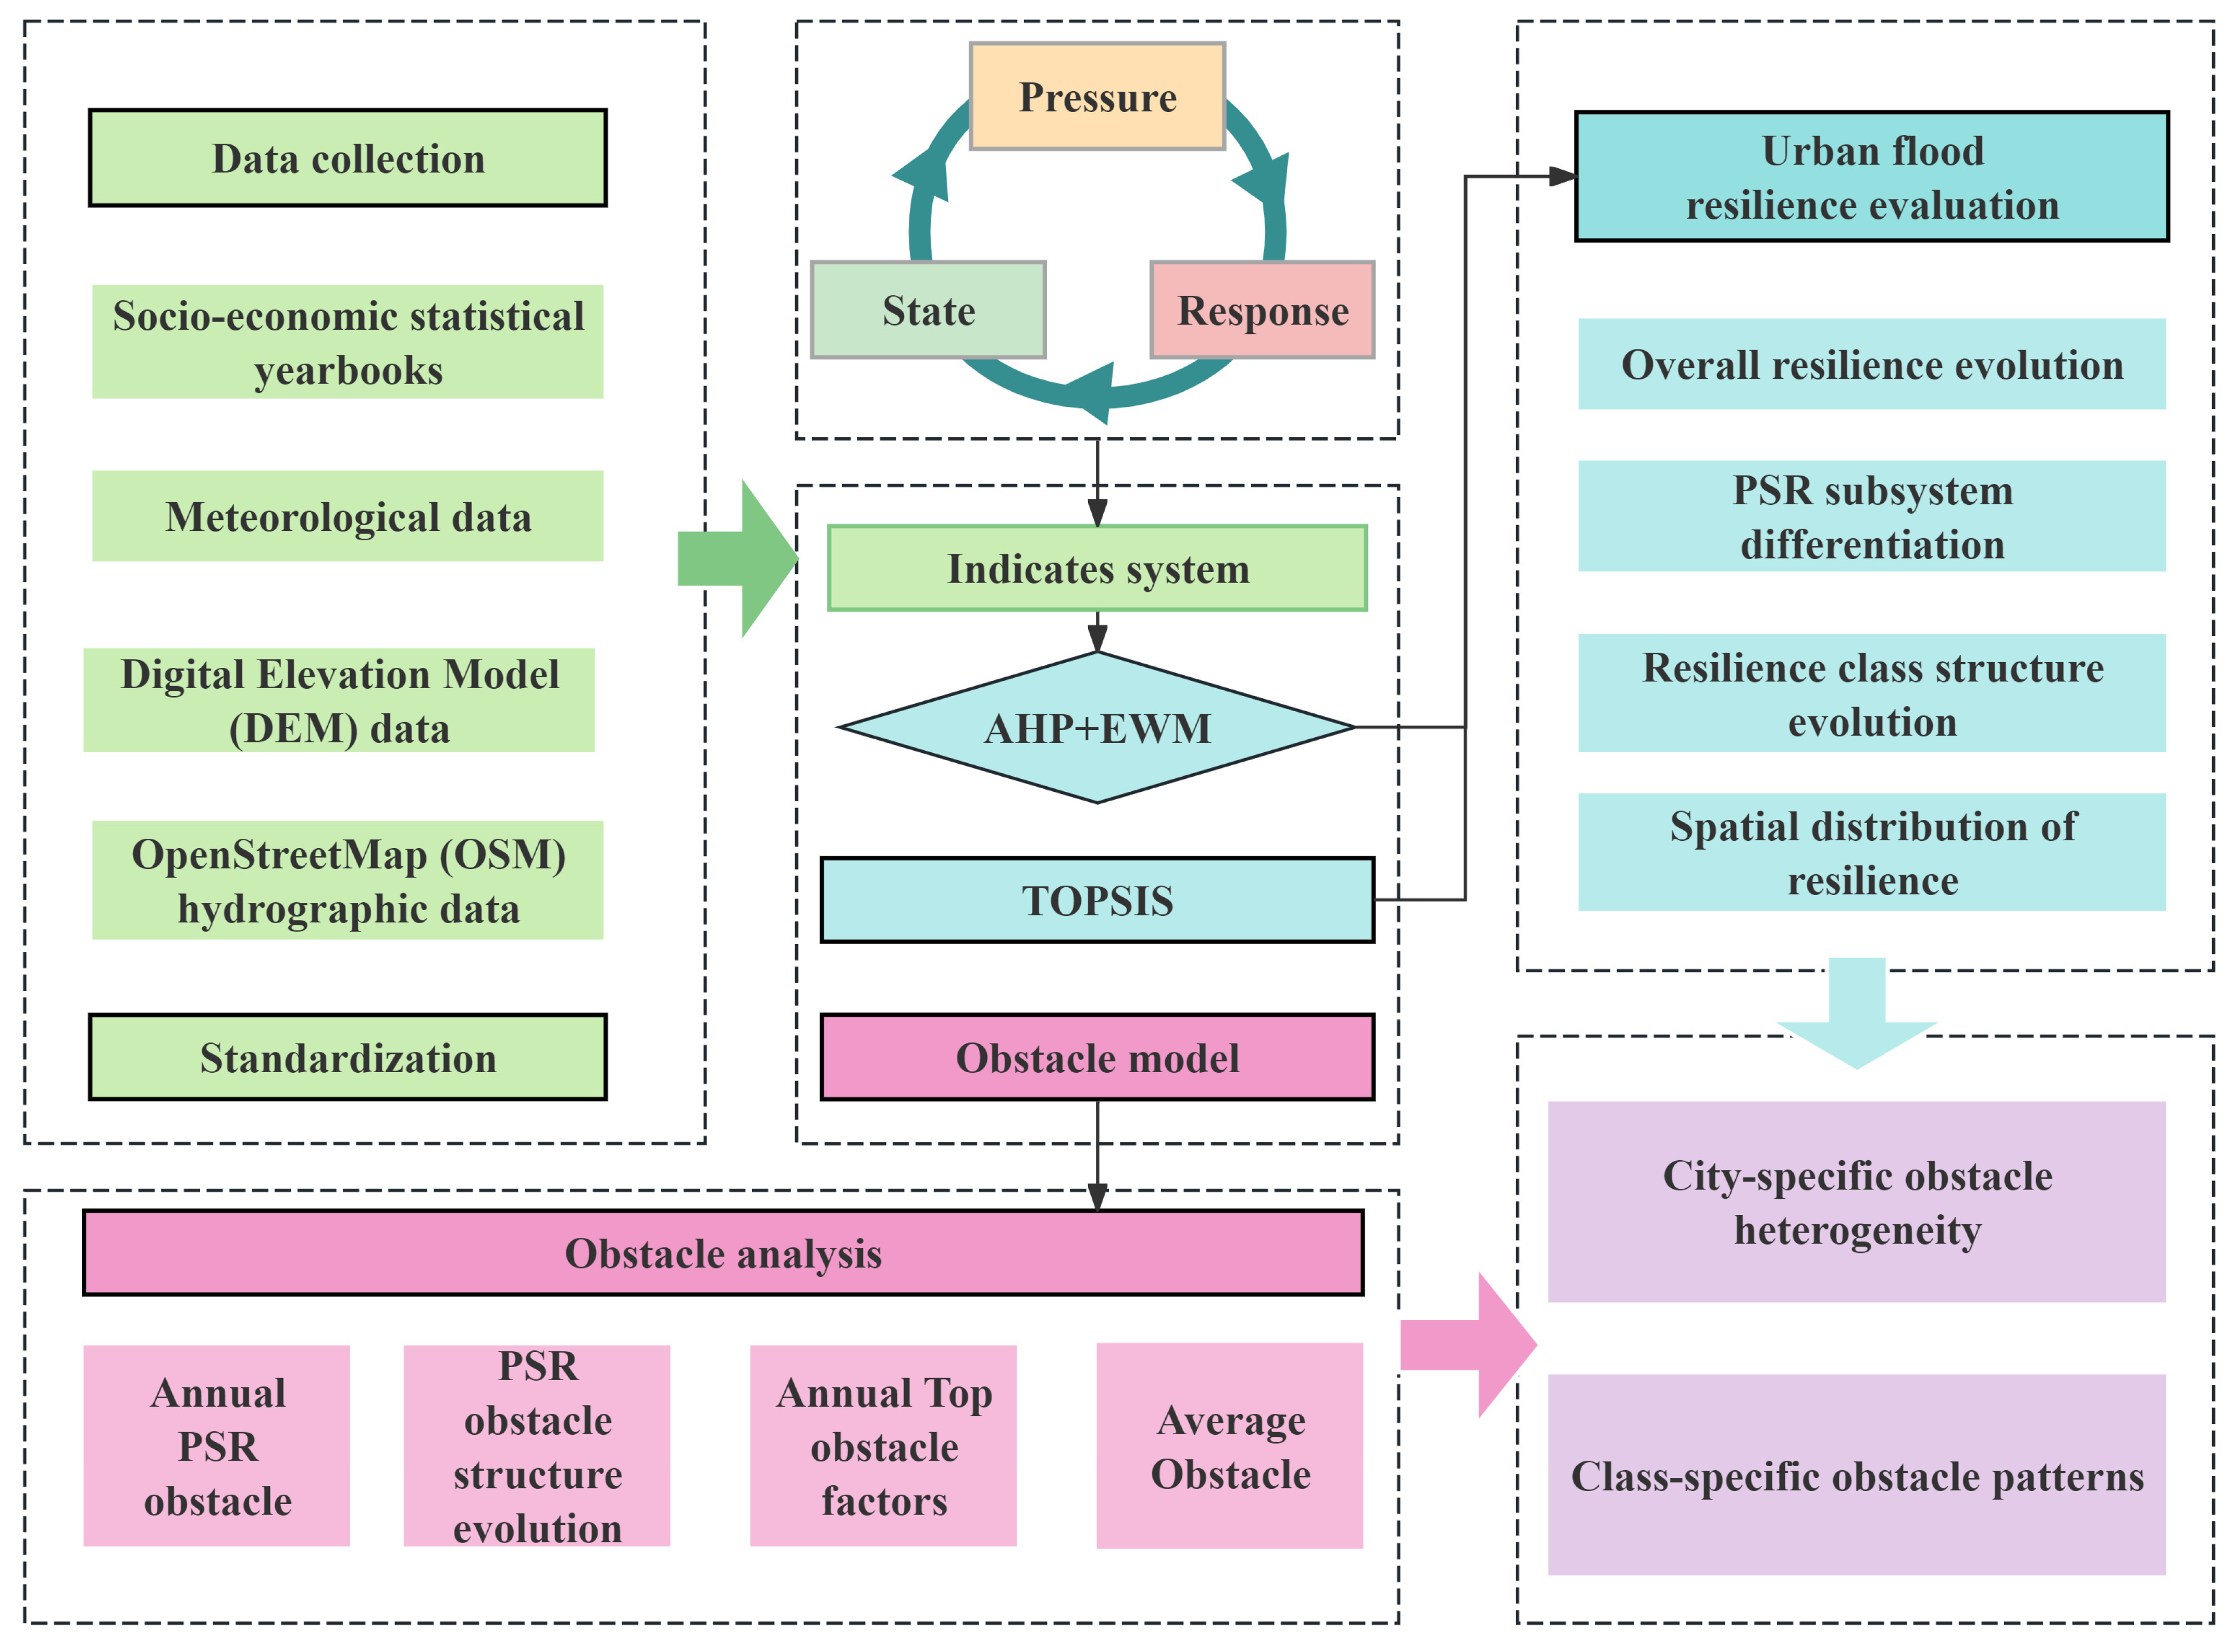
Figure 1. Framework for Urban Flood Resilience Assessment and Obstacle Factor Identification. AHP: Analytical Hierarchical Process. EWM: Entropy Weight Method.
Land 15 00614 g001
Figure 2. Geographical location and topographic characteristics of the study area.
Land 15 00614 g002
Figure 3. Annual Distribution of Flood Resilience (Overall & PSR). (Source: Authors’ calculation based on the compiled dataset).
Land 15 00614 g003
Figure 4. Annual changes in the coefficient of variation in urban flood resilience. (Source: Authors’ calculation based on the compiled dataset).
Land 15 00614 g004
Figure 5. Changes in resilience levels of each city over time (2011–2023). (Source: Authors’ calculation based on the compiled dataset).
Land 15 00614 g005
Figure 6. Spatio-temporal evolution of urban flood resilience classes in Sichuan Province (2011–2023). (Source: Authors’ calculation based on the compiled dataset).
Land 15 00614 g006
Figure 7. Interannual distribution of obstacle contributions across the Pressure–State–Response (PSR) subsystems (2011–2023). (Source: Authors’ calculation based on the compiled dataset).
Land 15 00614 g007
Figure 8. Temporal evolution of mean obstacle contribution rates for major constraints indicators (2011–2023). (Source: Authors’ calculation based on the compiled dataset).
Land 15 00614 g008
Figure 9. Subsystem obstacle structure across prefecture-level cities in Sichuan Province (2011–2023). (Source: Authors’ calculation based on the compiled dataset).
Land 15 00614 g009
Figure 10. The heatmap shows the regime-specific distribution of dominant obstacles across urban flood resilience classes. (Source: Authors’ calculation based on the compiled dataset).
Land 15 00614 g010
Table 1. Data categories, indicators and corresponding sources used in the urban flood resilience assessment.
Data CategoryIndicatorsData Sources
Socio-economic & GovernanceUrbanization, population, economic capacity, welfare.China City Statistical Yearbook, Sichuan Statistical Yearbook, NBS, local statistical bureaus.
Precipitation-related HazardAnnual precipitation, max daily precipitation, heavy rain.WheatA meteorological data tool.
Topographic & TerrainElevation, slope, relief measures.ASTER GDEM (30 m), processed in ArcGIS 10.5.
Boundaries & HydrographicBoundaries, river length, network density.Tianditu (GS(2024)0650), OpenStreetMap (OSM).
Data HarmonizationStandardized units (monetary, counts, rates).Prefecture-level unit system, year alignment.
Table 2. Indicator system and weights for urban flood resilience assessment under the PSR.
CriteriaIndicator CodeIndicatorDirectionAHP WeightEntropy WeightCombined Weight
Pressure (P)P1Annual precipitation0.04830.01150.0299
P2Maximum 1-day precipitation in flood season0.07640.01170.0441
P3Number of heavy-rain days (≥50 mm)0.06630.01040.0384
P4Number of flood events0.05700.00530.0312
P5Urbanization rate0.04790.01870.0333
P6Population density in built-up areas0.05330.01280.0331
P7Road area per capita+0.03530.00920.0222
P8Road freight transport intensity0.03280.00640.0196
State (S)S1Mean slope+0.05180.05390.0529
S2River network density+0.05180.06270.0573
S3Topographic relief+0.03800.03960.0388
S4Green coverage rate+0.06370.01840.0411
S5Park green space area+0.04030.03940.0398
S6Drainage pipe density+0.02000.00750.0138
S7Unemployment rate0.03090.05010.0405
S8Number of minimum-living-allowance recipients0.02730.01230.0198
Response (R)R1GDP per capita+0.02120.06130.0413
R2Per capita disposable income+0.04250.05900.0507
R3General public service fiscal expenditure+0.02660.10240.0645
R4Hospital beds per 10,000 persons+0.03370.11830.0760
R5Number of health institutions+0.02120.08380.0525
R6Mobile phone penetration rate+0.03530.04820.0417
R7Number of neighborhood committees+0.04500.12910.0871
R8Housing area per capita+0.03300.02790.0305
Table 3. Expert panel and consistency test results for the AHP judgment matrices.
Expert CodeProfessional BackgroundCriterion Layer
(CR)
Pressure Subsystem
(CR)
State Subsystem
(CR)
Response Subsystem
(CR)
E1Hydrology and climate0.0000.0070.0110.009
E2Disaster studies0.0000.0090.0070.010
E3Urban planning0.0000.0130.0120.006
E4Transport infrastructure0.0000.0150.0050.006
E5Emergency management0.0460.0080.0100.010
E6Social governance0.0000.0110.0090.011
E7Public service0.0030.0050.0100.010
E8Comprehensive assessment0.0080.0120.0100.007
Table 4. Distribution of PSR subsystem obstacle shares across resilience classes.
Resilience ClassPressure (P) Share (%)State (S) Share (%)Response (R) Share (%)
114.4839.8945.62
214.5139.1646.34
314.1438.2247.64
413.5235.6550.83
511.6835.6652.66
Disclaimer/Publisher’s Note: The statements, opinions and data contained in all publications are solely those of the individual author(s) and contributor(s) and not of MDPI and/or the editor(s). MDPI and/or the editor(s) disclaim responsibility for any injury to people or property resulting from any ideas, methods, instructions or products referred to in the content.