Article

Analysis of Spatial and Temporal Evolution Characteristics and Driving Forces of NDVI in Gansu Province from 2000 to 2022

1
College of Forestry, Gansu Agricultural University, Lanzhou 730070, China
2
Gansu Province Ecological Resources Monitoring Center, Lanzhou 730070, China
*
Author to whom correspondence should be addressed.
Land 2025, 14(11), 2184; https://doi.org/10.3390/land14112184
Submission received: 30 September 2025 / Revised: 26 October 2025 / Accepted: 28 October 2025 / Published: 3 November 2025

Abstract

The synergistic effects of climate change and human activities have profoundly influenced the spatiotemporal dynamics of vegetation in arid and semi-arid regions. In this study, MODIS NDVI data and an integrated methodological approach, including trend analysis, partial correlation, residual regression, and geographical detector modeling, were used to analyze the variations in NDVI in Gansu Province from 2000 to 2022. The results showed the following: (1) The growing-season NDVI in Gansu Province exhibited a significant increasing trend overall (0.0029 per year, p < 0.05). (2) Both the NDVI values and their increasing rates presented a spatial pattern of “higher in the southeast and lower in the northwest”; although low vegetation coverage dominated the entire province, 49.47% of the area showed an extremely significant increasing trend in NDVI (p < 0.01). (3) In the future, the area ratio of regions with improved NDVI to those with degraded NDVI in Gansu Province will be approximately 45.5%:54.5%. (4) The contribution rate of human activities to the spatiotemporal variations in NDVI was higher than that of climate change; however, the synergistic effect of the two factors was greater than their individual effects. (5) Precipitation and solar radiation were the two primary climatic factors affecting NDVI variations in Gansu Province, while human activities played a regulatory role in mediating climate–vegetation interactions. Therefore, we suggest implementing more proactive ecological management and restoration measures to mitigate the impacts of future climate change, particularly in regions where NDVI may degrade in the future.

1. Introduction

As a critical link between soil, water, and the atmosphere, vegetation plays a vital role in regulating the water-carbon balance [1,2], facilitating material and energy exchange [3], mitigating climate change [4], and maintaining ecosystem stability. It is a fundamental component of ecosystems and significantly influences global climate dynamics. This is especially evident in arid regions, where vegetation is essential for combating desertification, sustaining oasis ecosystems, and preserving regional ecological stability. Vegetation growth is highly sensitive to local temperature, humidity, and solar radiation conditions [5], with extreme climate events such as high temperatures, drought, and low precipitation acting as key limiting factors [6].
Advances in remote sensing technology have enabled the use of high-resolution, long-term datasets to analyze vegetation dynamics [7,8]. The Normalized Difference Vegetation Index (NDVI), a quantitative measure of vegetation growth and coverage, has become an essential tool for reconstructing historical vegetation trends, monitoring current conditions, and forecasting future changes [9,10]. Consequently, remote sensing-based monitoring and analysis of regional NDVIs have emerged as mainstream methodologies.
Researchers worldwide have extensively investigated spatiotemporal vegetation patterns and their drivers using NDVI across multiple scales. Common approaches include unidirectional linear regression [11], Sen + Mann–Kendall trend analysis [12], and the Hurst index [13] to characterize temporal and spatial variations. To explore underlying mechanisms, studies often employ partial correlation analysis [14], geodetector modeling [15], and multiple regression residual analysis [16] based on climatic, topographic, and anthropogenic datasets. NDVI is widely used to examine vegetation responses to environmental changes driven by both natural factors and human activities. Among natural influences, climate and topography are closely associated with vegetation growth and distribution [17]. In recent decades, the magnitude of NDVI changes across China has exhibited a decreasing trend from high to low latitudes [18], with temperature, precipitation, and solar radiation identified as primary climatic drivers [19]. Numerous studies highlight a strong relationship between vegetation growth and precipitation [20,21], particularly in arid regions where NDVI shows spatial consistency with rainfall patterns. Although temperature also affects NDVI [22], its correlation is generally weaker than that of precipitation in dryland areas [23,24]. In addition to climate, human activities—such as afforestation initiatives over the past two decades—have profoundly influenced vegetation greening trends in China [25].
Traditional quantitative methods, including multiple regression and principal component analysis, have established statistical relationships between NDVI changes and driving factors. However, these approaches often rely heavily on statistical modeling while overlooking the ecological mechanisms behind NDVI variations [26]. In response, Evans and Geerken developed the Restrend (Residual Trend Analysis) method, which uses NDVI residuals to separate the effects of climate change from human activities [27]. This technique assumes climate change as the sole driver, constructs a regression model between climate variables and NDVI, and interprets residuals to identify dominant factors influencing vegetation change.
Although many early studies applied linear statistical methods to attribute vegetation changes—such as correlation analysis, multiple regression, and residual trend analysis [28,29,30], these techniques assume linear relationships and are prone to certain limitations and errors. By contrast, the geodetector model offers a more flexible statistical framework, capable of detecting spatial heterogeneity and quantifying nonlinear driving forces and their interactions with vegetation dynamics [31]. This method allows for the examination of geographic stratification and variable interactions without requiring linear assumptions [32].
To address these research gaps, this study incorporates solar radiation as a key climatic driver, in addition to conventional temperature and precipitation factors, thereby providing a more comprehensive understanding of climate–vegetation interactions in arid and semi-arid regions. A synergistic analytical framework was developed by integrating residual trend analysis with a geographical detector model. The former was applied to isolate the impacts of climate change and human activities, while the latter was employed to quantify the nonlinear interactions among various driving factors. This integrated methodology not only enables quantitative attribution of vegetation dynamics but also reveals the underlying coupling mechanisms between natural and anthropogenic influences. Furthermore, the Hurst exponent was introduced to predict future vegetation trends, offering a scientific foundation for vegetation restoration and ecological management strategies in Gansu Province.

2. Materials and Methods

2.1. Research Area

Gansu Province (32°11′–42°57′ N, 92°13′–108°46′ E) is situated in the inland northwest of China (Figure 1) and served as a core segment of the ancient Silk Road [33]. The terrain slopes gradually from southwest to northeast, featuring a long, narrow shape with elevations ranging from 587 to 5485 m and mean annual temperatures between 0 °C and 15 °C. The region exhibits complex and diverse topography under a typical continental arid to semi-arid monsoon climate. Influenced by monsoon patterns, precipitation is concentrated primarily from June to August, with an average annual rainfall of approximately 400 mm.

2.2. Data Source

The data utilized in this study primarily consist of remote sensing data, climate data, topographic data, land cover data, and anthropogenic data (Table 1). All datasets were spatially rasterized on an annual basis using ArcGIS 10.8. Following projection transformation, masking with the study area boundary, and resampling, a uniform spatial resolution of 1 km was achieved under the UTM projection coordinate system. In the geodetector model, the NDVI was employed as the dependent variable (Y), while the 11 influencing factors served as independent variables (X). Unless otherwise specified, this study defines the growing season in Gansu Province as April to October based on Jin et al. [34], with NDVI values synthesized using the Maximum Value Composite (MVC) method [35]. However, it should be noted that in arid and semi-arid regions, NDVI values may be subject to saturation effects in densely vegetated areas and influenced by soil background brightness in sparsely vegetated areas, which constitutes a known limitation of the NDVI dataset despite the application of the MVC approach.

2.3. Research Method

2.3.1. Sen + Mann–Kendall Significance Test

The Theil–Sen Median slope estimator exhibits strong resistance to noise and outliers, making it effective in mitigating the influence of measurement errors and discrete data points. Compared with conventional slope analysis methods, it offers enhanced robustness and is widely employed to detect trends in long-term time series for vegetation, hydrological, and meteorological data [36]. The estimator is defined as follows:
β   =   median   ( N D V I j N D V I i j i )   2000 i < j 2022
where β represents the NDVI trend; median is the median function; and NDVIi and NDVIj are NDVI values for different years. When β > 0, NDVI shows an upward trend. Otherwise, it shows a downward trend.
To evaluate the statistical significance of the trends, this study applied the Mann–Kendall method [37] to non-parametrically test the Sen’s slope estimates. Considering the potential autocorrelation in the time series data, we first conducted an autocorrelation test on the NDVI series. The lag-1 autocorrelation coefficient was 0.742, indicating strong temporal dependence in the NDVI sequence. Therefore, pre-whitening treatment was applied to eliminate the effects of autocorrelation and ensure the validity of subsequent significance testing. The test statistic for the Mann–Kendall method is calculated as follows:
Z = S 1 v a r S                 S > 0   0                                           S > 0 S + 1 v a r S                 S > 0
S = i = 1 n 1 j = i + 1 n s g n N D V I j N D V I i
v a r S = n n 1 2 n + 5 18
s g n N D V I j N D V I i 1                       N D V I j N D V I i > 0 0                       N D V I j N D V I i = 0 1                     N D V I j N D V I i < 0
where Z is the test statistic; var is the variance function; sgn is the sign function; and n is the time series length. In this study, the critical value Z1−α/2 is found in the normal distribution table using the two-sided trend test at a given significance level. When |Z| ≤ Z1−a/2, the null hypothesis is accepted, i.e., the trend is not significant. If |Z| > Z1−a/2, the null hypothesis is rejected, i.e., the trend is considered significant. The significance levels α = 0.05 and α = 0.01 are applied in this study. When the absolute value of Z is greater than 1.96 and 2.58, the trend passes the significance test with a reliability of 95% and 99%, respectively [38]. See Table 2 for the judgment method for trend significance.

2.3.2. Hurst Index

The Hurst index is used to detect the evolution trend of long-time series variables in the future [39]. It is widely used in hydrology, meteorology, and the economy. Currently, the Hurst exponent is often calculated using the rescaled range (R/S) analysis method. This study employs the classical R/S method due to its well-established theoretical foundation and wide application in vegetation dynamics research, which facilitates comparison with the literature. However, this method is sensitive to short time series and potential structural breaks, and therefore, it has certain limitations. The method works as follows:
N D V I t t = 1 , 2 , , n
< N D V I > τ = 1 τ t = 1 τ N D V I t τ = 1,2 , , n
X ( t , τ ) = t = 1 τ ( N D V I ( t ) < N D V I > τ )         1 t τ
R ( τ ) = max 1 t τ [ X ( t , τ ) ] min 1 t τ [ X ( t , τ ) ]
S τ = 1 τ t = 1 τ N D V I t < N D V I > τ 2 1 2
R τ S τ = τ H
where {NDVI(t)}, <NDVI> τ , X(t, τ ), R( τ ), and S( τ ) are the NDVI time series, mean series, cumulative deviation series, range series and standard deviation series, respectively; H is the Hurst index.
The range of the Hurst index is from 0 to 1. When 0 ≤ H < 0.4, the future and the past have a strong reverse sustainability. The closer H is to 0, the stronger the inverse value is. When 0.4 ≤ H < 0.5, the reverse sustainability between the future and the past is relatively weak; When H = 0.5, it indicates that the time series variation is random. When 0.5 < H ≤ 0.6, the future trend aligns with the past but exhibits weak long-term sustainability. Conversely, when 0.6 < H ≤ 1, the future trend remains consistent with historical patterns and demonstrates stronger long-term sustainability, with sustainability increasing as H approaches 1. Coupling NDVI trend results with Hurst exponent analysis enables the assessment of future vegetation dynamics.

2.3.3. Partial Correlation Analysis

Many factors affect vegetation coverage. A change in any one of these influencing factors may affect a change in another. With the aid of second-order partial correlation analysis, the correlations between the three types of climate factors and NDVI were characterized by controlling the influences of other variables, and a significance analysis of the partial correlation results was conducted through the t-test [40]. The formula is as follows:
R x y · z λ = r x y · z r x λ · z × r y λ · z 1 r x λ · z 2 1 r y λ · z 2
In the formula, R x y · z is the second-order partial correlation coefficient of x and y after the control variables Z and λ ; R x y · z λ   > 0 is positively correlated; and R x y · z λ   < 0 is negatively correlated.

2.3.4. Multiple Residual Regression Analysis

The multiple regression residual analysis method was adopted to study the influence of human activities and climate change on the changes in vegetation NDVI and their relative contributions [41,42]. This method has the following three steps: ① Based on the NDVI of the growing season and the processed time series data of temperature, precipitation, and solar radiation, with NDVI as the dependent variable and temperature, precipitation, and solar radiation as the independent variables, a binary linear regression model is established to calculate each parameter in the model. ② Based on temperature, precipitation, and solar radiation data, as well as the parameters of the regression model, the predicted value of NDVI (NDVICC) was calculated to represent the influence of climatic factors on NDVI; ③ The difference between the observed NDVI value and NDVICC is calculated, that is, the NDVI residual (NDVIHA), which is used to represent the impact of human activities on NDVI. The specific calculation formula is as follows:
N D V I C C = a + b × T + c × P + d × S
N D V I H A = N D V I o b s N D V I C C
In the formula, NDVICC and NDVIobs, respectively, refer to the predicted NDVI value based on the regression model and the observed NDVI value based on remote sensing images (dimensionless); a, b, c, and d are the model parameters; T, P, and S, respectively, refer to the average temperature of the growing season, the cumulative precipitation, and the average solar radiation; and NDVIHA is the residual. The determination criteria for the driving factors of NDVI changes in vegetation and the calculation method for the contribution rates are shown in Table 3.

2.3.5. Geographic Detector Model

The geographic detector is a statistical tool used to detect spatial heterogeneity and its driving factors, consisting of four parts: factor detection, interaction detection, ecological detection, and risk detection [43]. We select factor detection and interactive detection to analyze the influence of natural factors and human factors on the spatial differentiation of vegetation.
(1)
Factor detection
The factor detector was used to measure the determining power of the influencing factors of natural and human factors on the spatial distribution of NDVI in Gansu Province. The formula is as follows:
q = 1 S S W S S T
S S W = h = 1 L N h ρ h 2
S S T = N ρ 2
In the formula, q represents the explanatory power of the factor, and the range of the q-value is [0, 1]. The larger the q-value, the stronger the explanatory power of the factor, and the stronger the influence on the spatial distribution of vegetation NDVI. H = 1, 2,… L is the classification or partition of the dependent variable or independent variable, and N h and N are, respectively, the number of pixels in the h layer and the entire region; ρ h 2 and ρ 2 are, respectively, the variances in NDVI in the h layer and the entire region; SSW and SST are, respectively, the sum of the intra-layer variance and the total variance of the region.
(2)
Interactive detection
Interactive detection identifies the interactions between different influencing factors, X; evaluates whether the combined effect of two influencing factors will increase or weaken the explanatory power for the spatial distribution of Y (NDVI); and determines whether the influence of these influencing factors on the spatial distribution of Y is independent. The specific determination methods are shown in Table 4.
The analysis was implemented on the R (R version 4.4.3) platform utilizing the GD software package (GD version 1.9). In accordance with the discretization requirements of the geographical detector model, this study performed a systematic evaluation of four discretization methods (equal interval, natural breaks, quantile, and geometric interval), combined with eight classification schemes (ranging from 3 to 10 categories), to determine the optimal discretization parameters for each continuous independent variable (X1–X11). The parameter selection followed the principle of maximizing the q-statistic in the factor detector, which quantifies the proportion of spatial heterogeneity in the dependent variable explained by a given independent variable, with values bounded between [0, 1]. Higher q-values indicate the greater explanatory power of the corresponding factor. This multi-parameter optimization framework ensures the robust identification of dominant drivers underlying the spatial distribution of Y while enhancing the methodological rigor of the analysis.

3. Results

3.1. The Spatio-Temporal Variation Characteristics of NDVI

3.1.1. The Interannual Variation Characteristics of NDVI

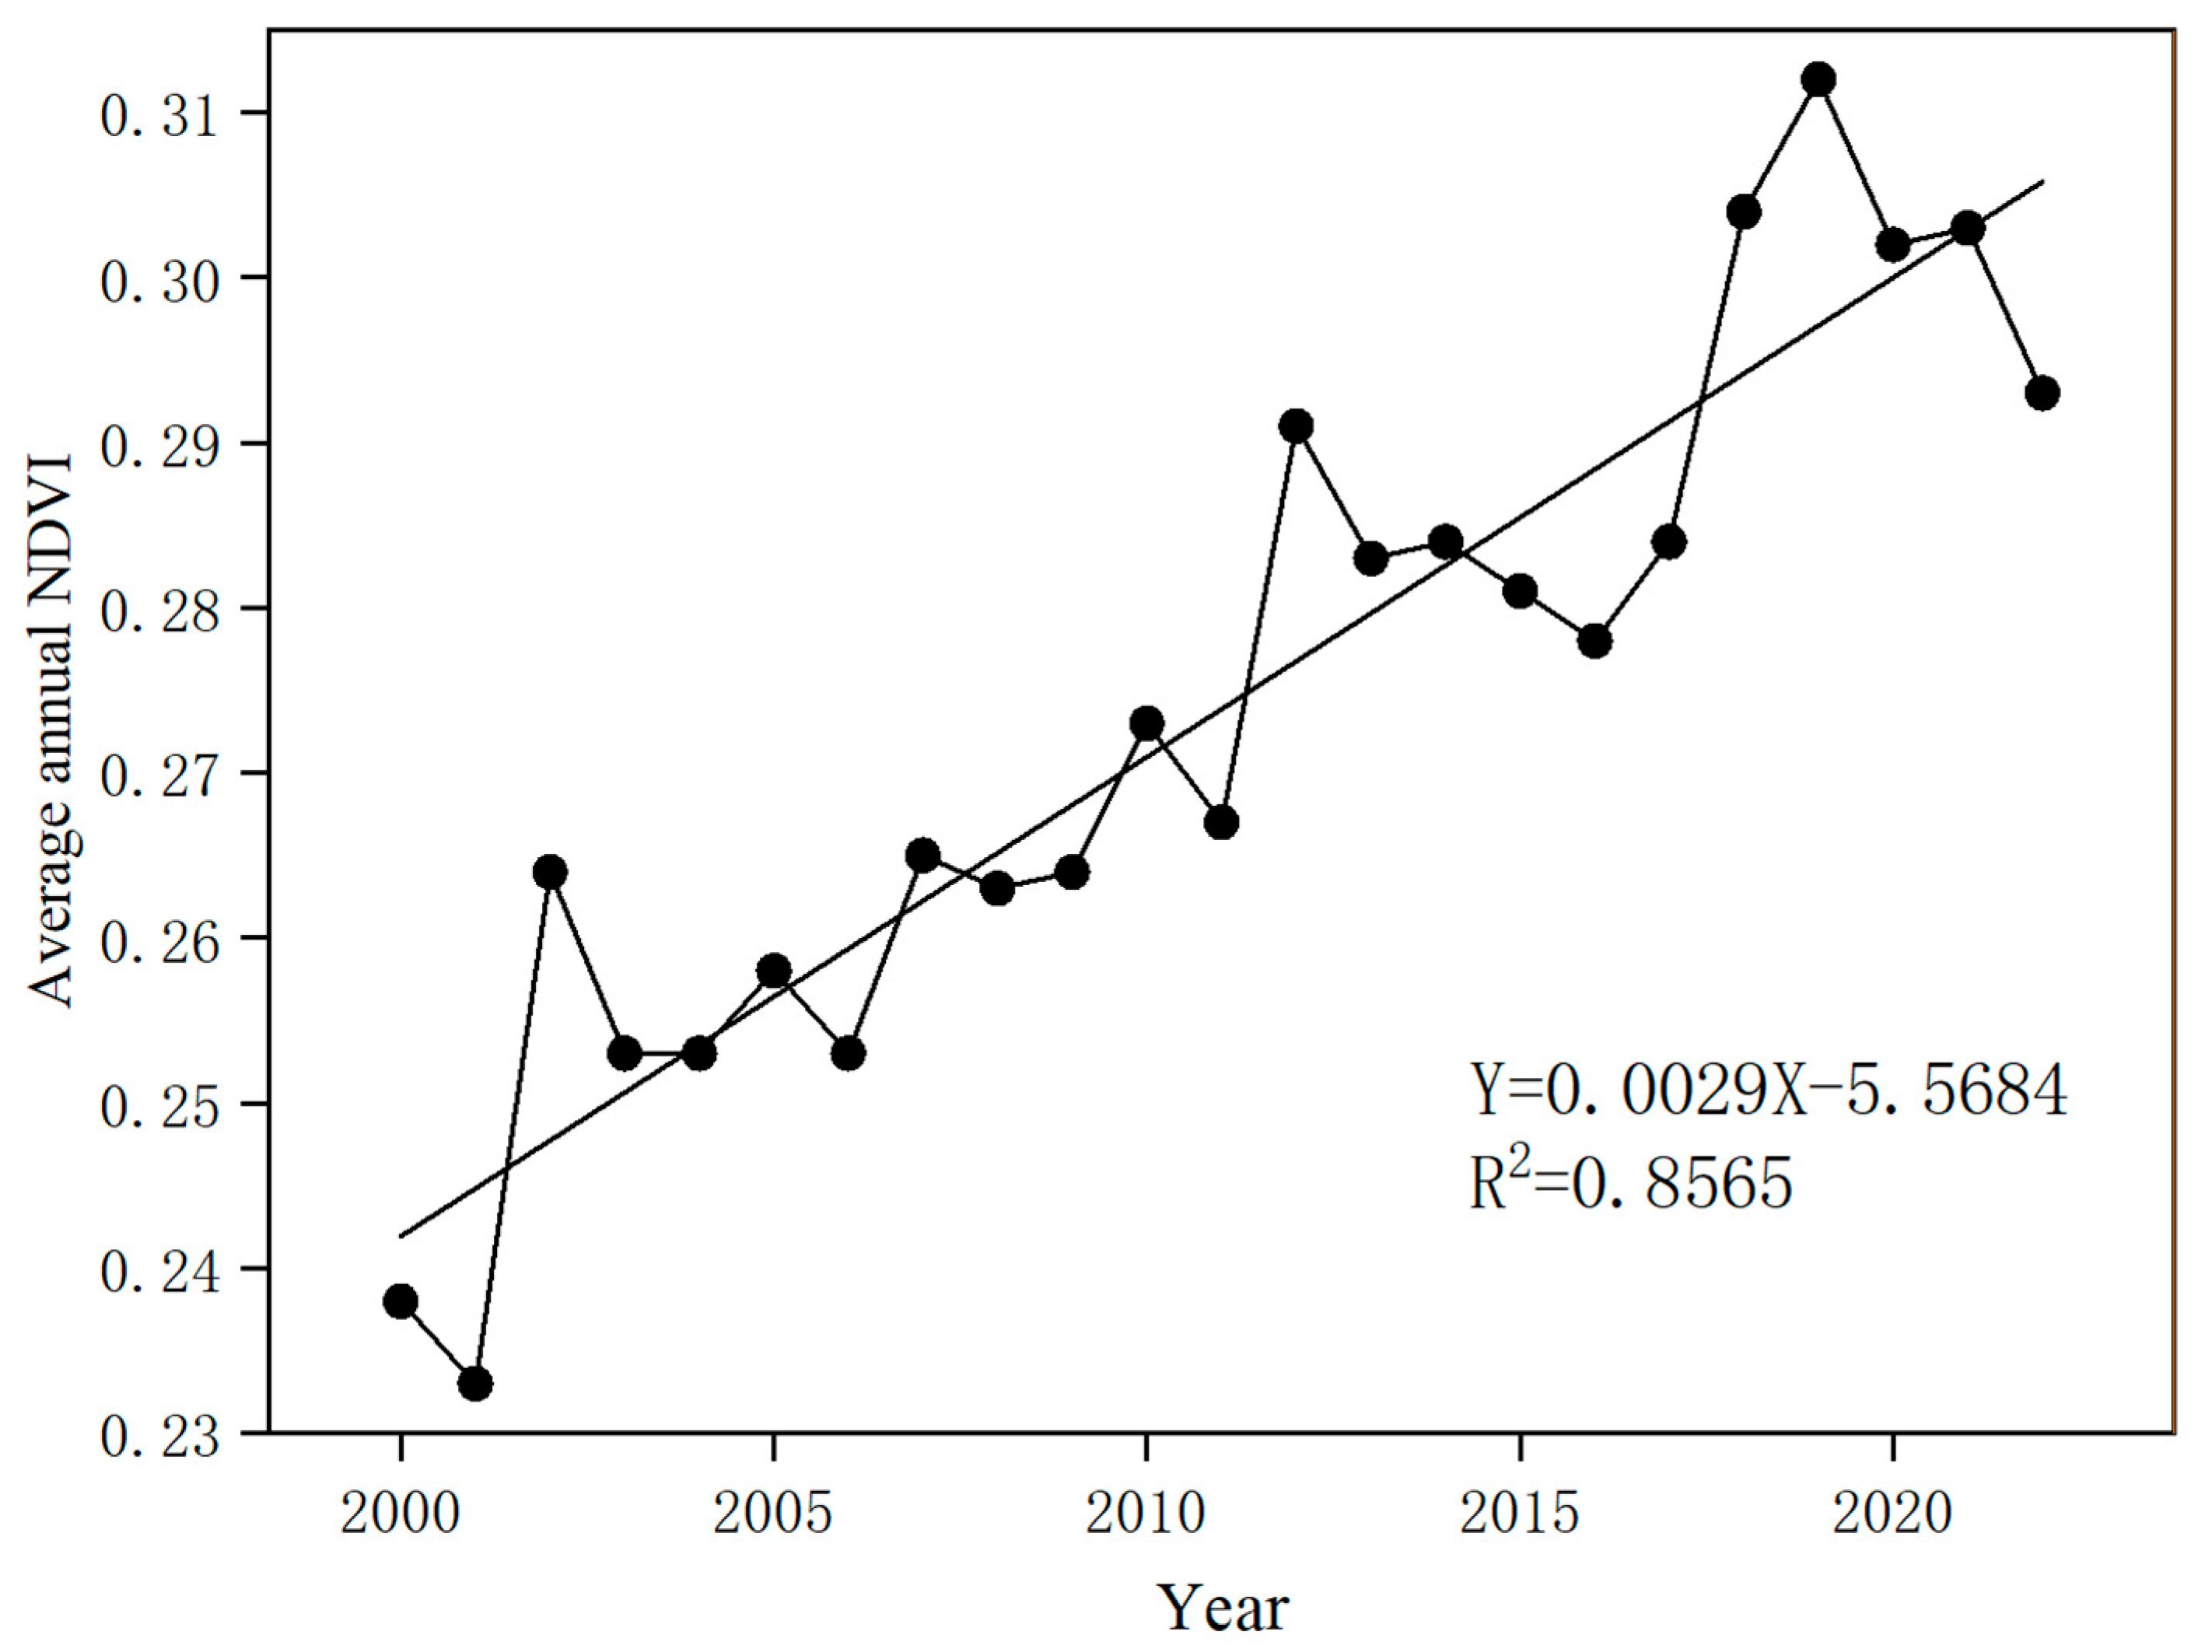
The overall trend of vegetation change in Gansu Province over the past 23 years was assessed using the average growing season NDVI from 2000 to 2022. As illustrated in Figure 2, the growing season NDVI exhibited a significant increasing trend across the region, with a slope of 0.0029 per year (p < 0.05). Nevertheless, considerable interannual variability was observed. Noticeable declines in vegetation coverage occurred in specific years, including 2003, 2013, and 2020.

3.1.2. Spatial Variation Characteristics of the NDVI

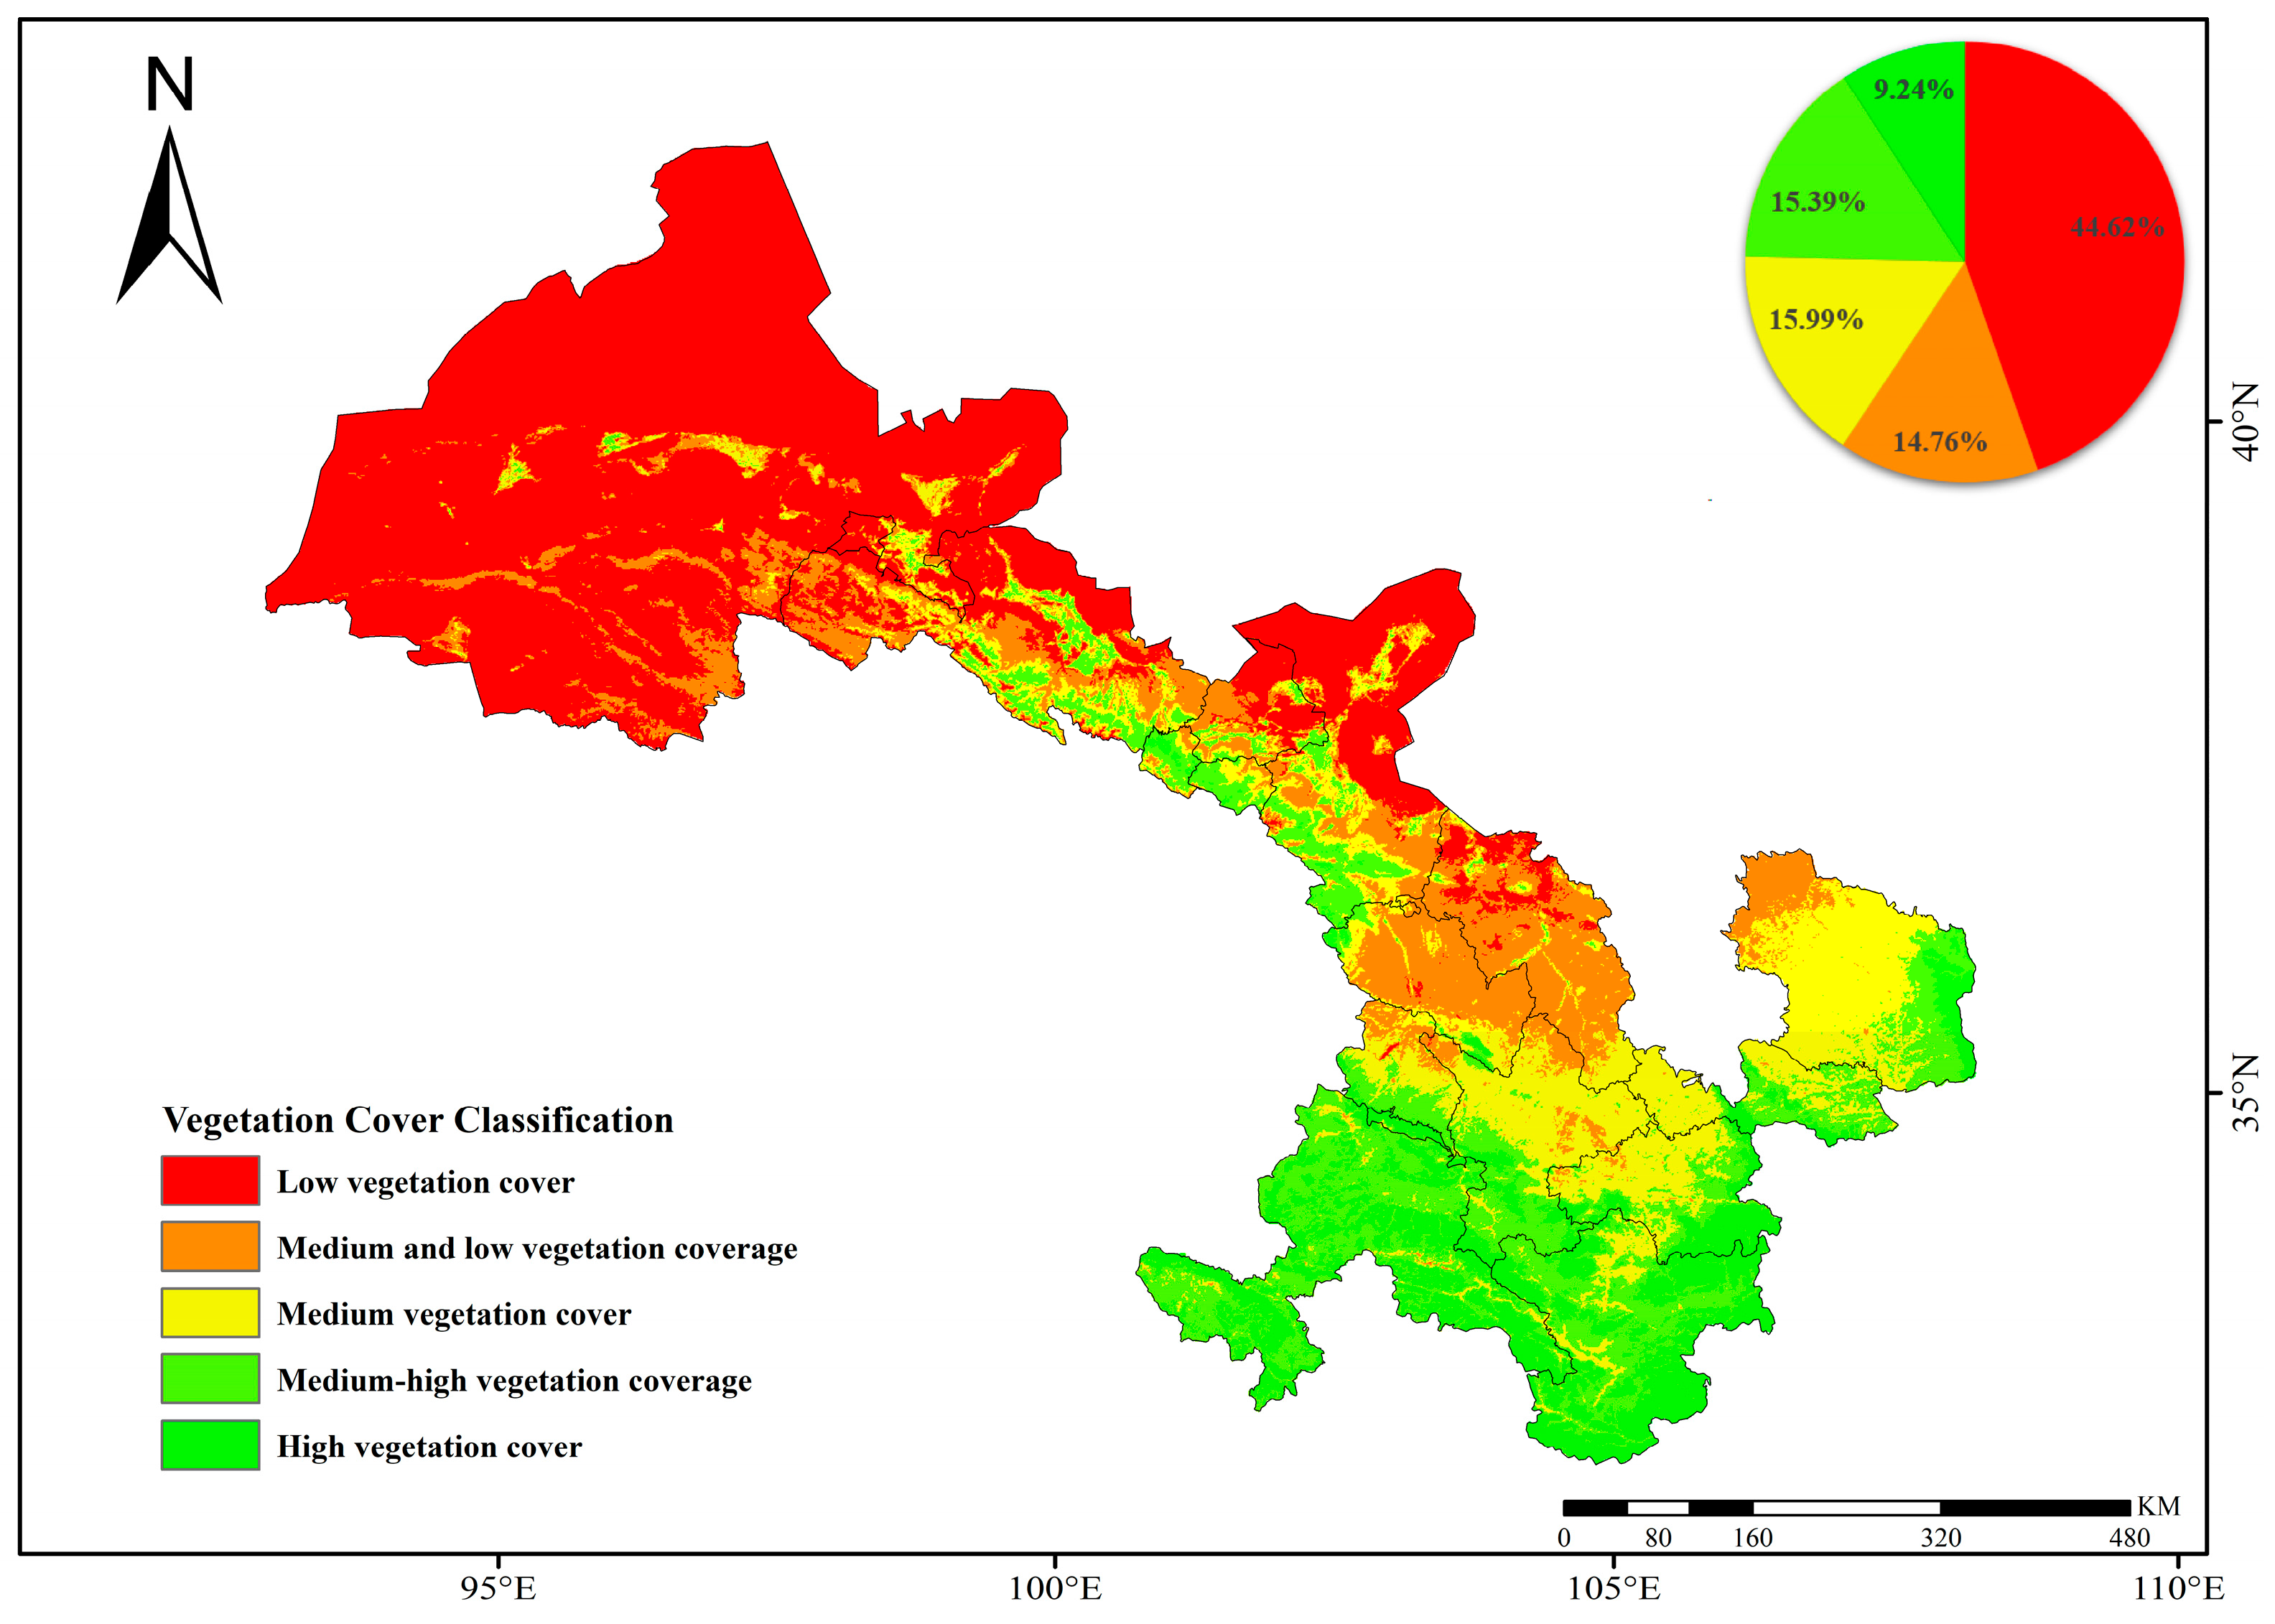
The multi-year average NDVI value in Gansu Province from 2000 to 2022 ranged from 0 to 0.919, with an average of 0.351. We divided the NDVI of Gansu Province into five grades using the equal interval method. As shown in Figure 3, the NDVI in Gansu Province demonstrated a spatial distribution pattern of “high in the southeast and low in the northwest”. Notably, areas with low vegetation coverage (NDVI < 0.2) accounted for 44.62% of the total area, with the majority distributed in the central and western regions. These regions were constrained by extreme aridity, poor soil quality, and ecological vulnerability. By contrast, areas with relatively good vegetation coverage (NDVI > 0.4) accounted for only 24.63% of the total area, mainly concentrated in the southeast, where water resources are abundant. Therefore, the overall vegetation coverage in Gansu Province was relatively low, with a remarkably distinct spatial variation in vegetation distribution, and areas with better vegetation coverage were relatively concentrated.
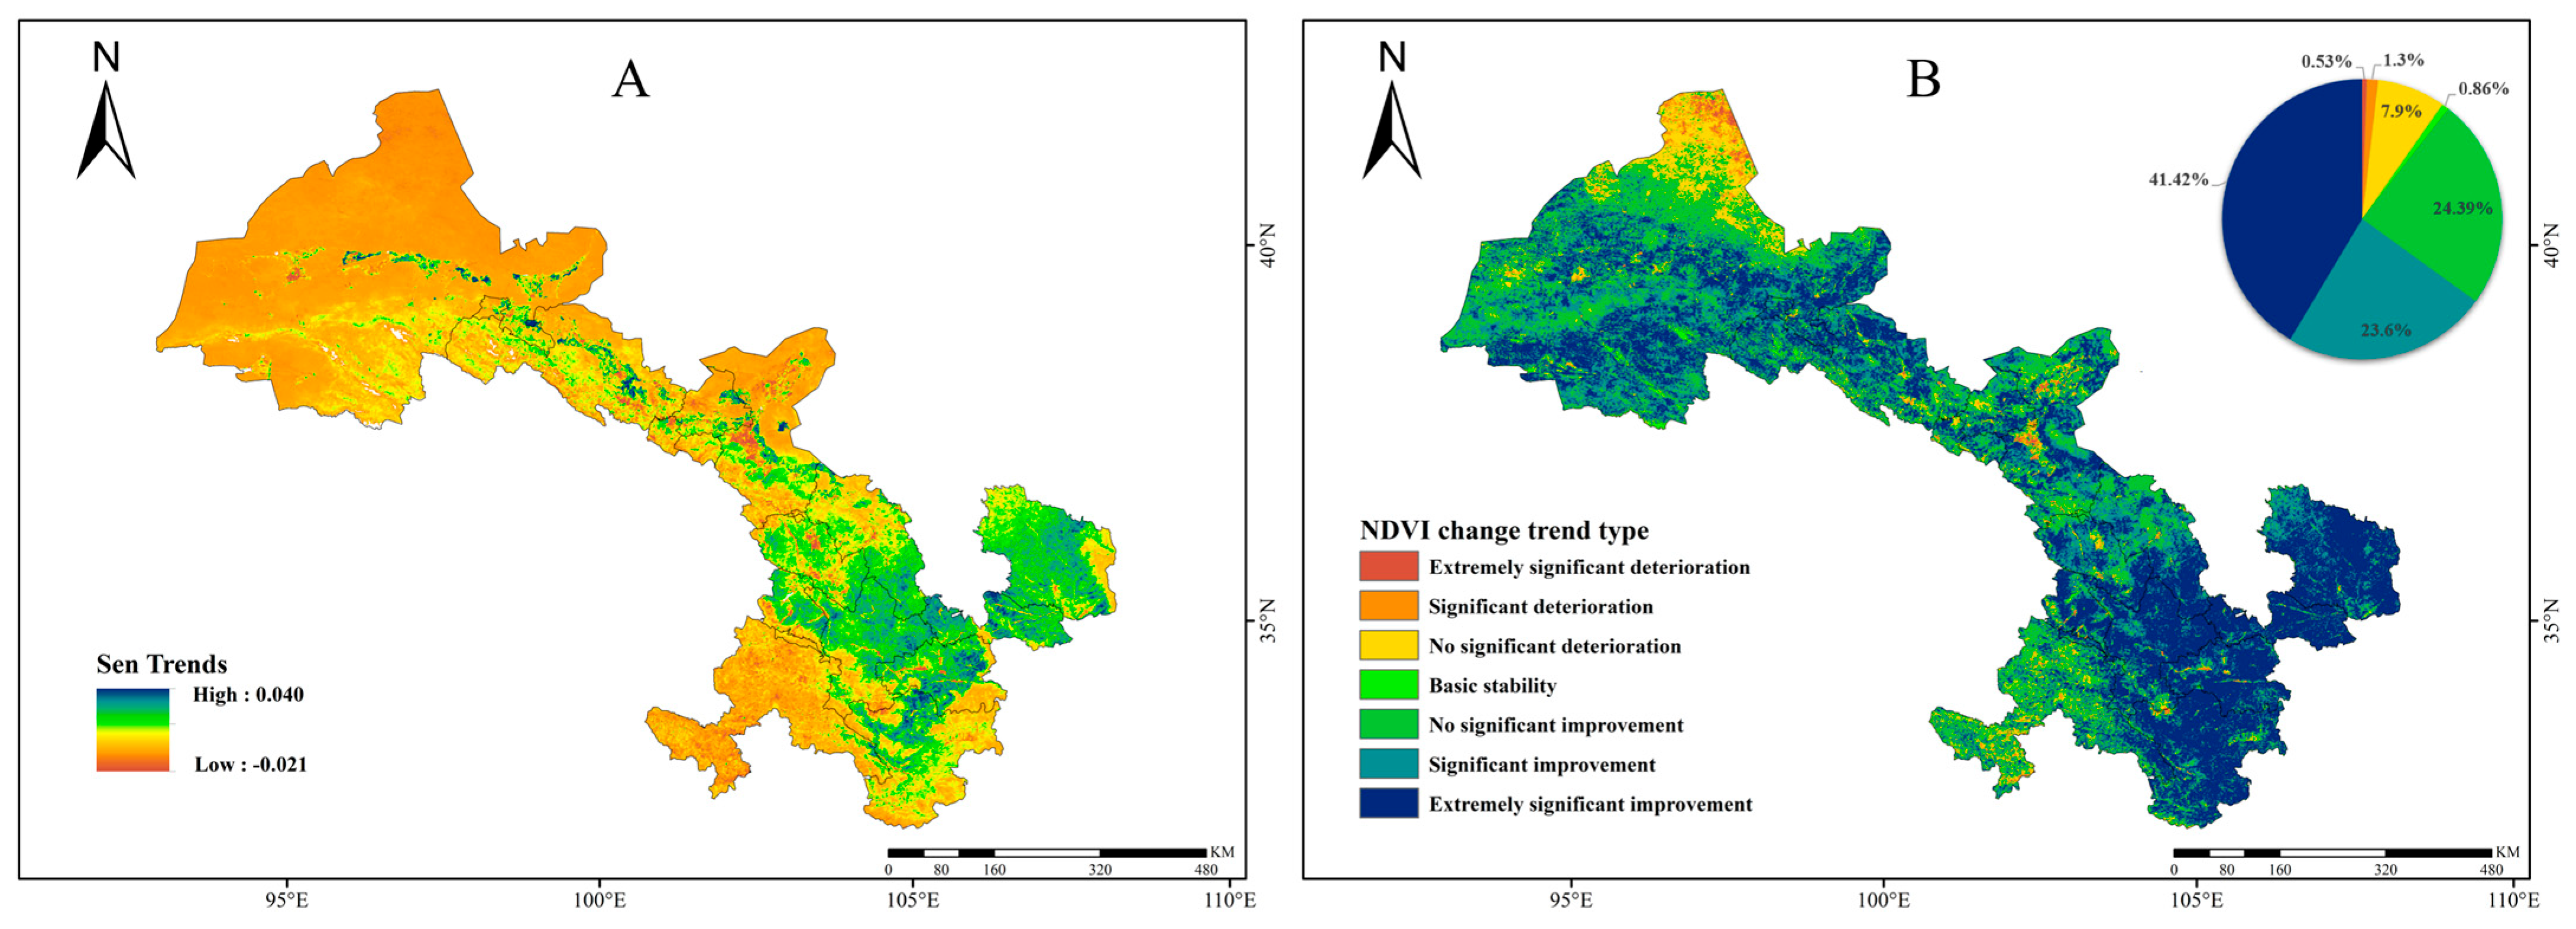
Trends in vegetation change throughout Gansu Province over the past 23 years were assessed using the Sen’s slope estimator in conjunction with the Mann–Kendall test (Figure 4). Although Figure 3 indicates that more than half of the province is characterized by low vegetation coverage, 89.41% of the region exhibited an increasing trend in NDVI over the study period, with a maximum increase of 0.043 per year (Figure 2). More importantly, 41.42% of the total area showed a statistically significant improvement (p < 0.01). These significantly improved areas were predominantly concentrated in Qingyang, Pingliang, Tianshui, Dingxi, and the Linxia Hui Autonomous Prefecture, as well as the southeastern parts of Zhangye and Jiuquan. This widespread vegetation recovery contributed positively to ecosystem stability and ecological environmental quality in the region.
Conversely, areas exhibiting a declining trend in NDVI accounted for 9.73% of the total area, primarily located in northern Jiuquan and the central and northern parts of Wuwei. Although these degraded areas represented a relatively small proportion, they were ecologically vulnerable due to harsh natural conditions and limited precipitation. Once degradation occurs, it may lead to devastating and potentially irreversible damage to local ecosystems. Furthermore, as indicated by the Sen’s slope values in Figure 4A, these regions may face a sustained risk of continued degradation.

3.2. The Future Changing Trend of NDVI in Gansu

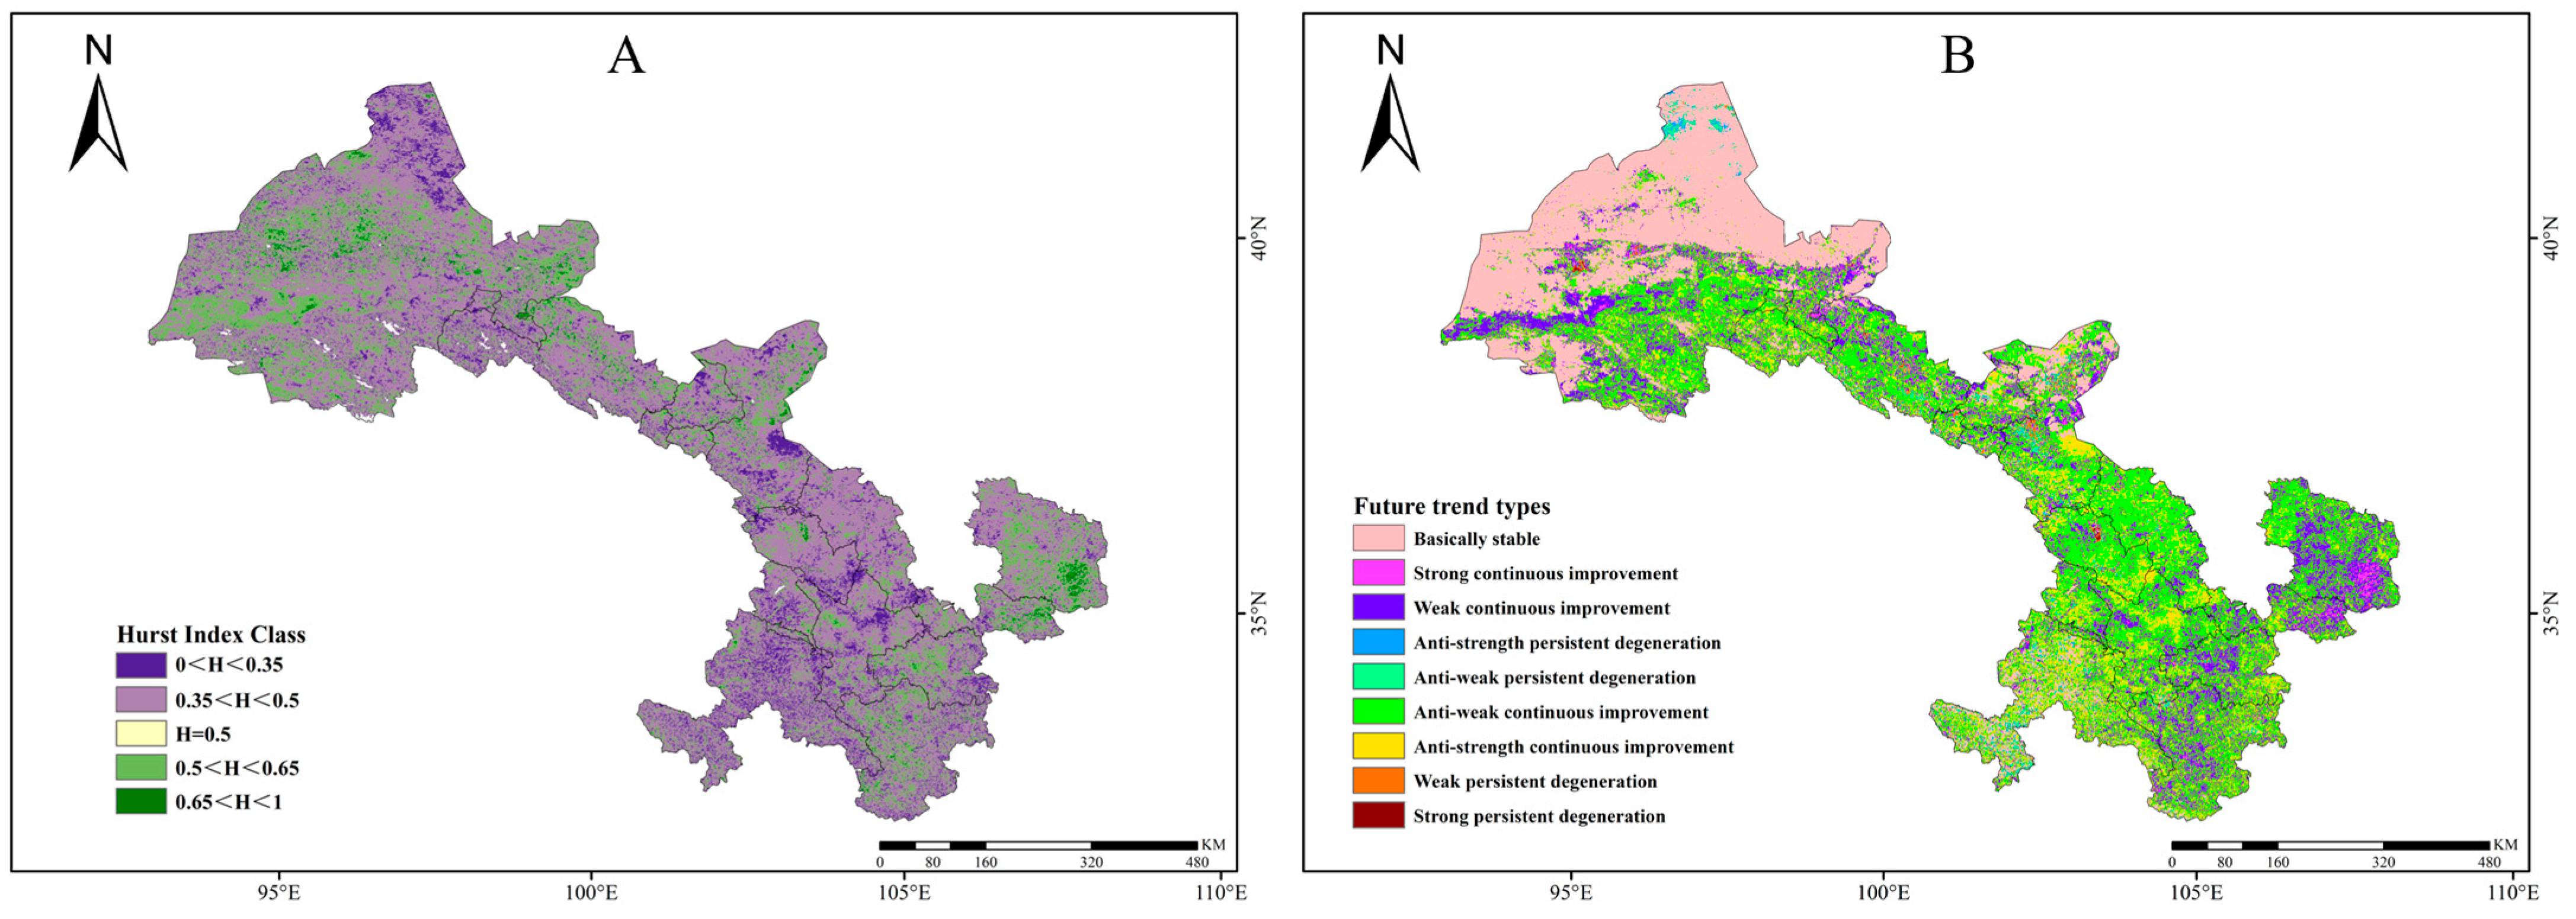
To assess the future trends and persistence of NDVI in Gansu Province, we integrated the Hurst index with the Sen’s slope trend analysis. This approach revealed the future trajectory of vegetation coverage and its linkage with historical trends. Based on the Hurst index values, the persistence of NDVI changes was categorized into four levels, as summarized in Table 5.
As shown in Figure 5A and Table 5, areas where NDVI is expected to continue improving cover approximately 116,200 km2, accounting for 27.28% of the total area. These regions are primarily located in central and western Jiuquan, central and northern Zhangye, northern Wuwei, and eastern Qingyang. Most of these areas are situated near desert margins, and the sustained vegetation improvement is expected to enhance ecosystem stability.
By contrast, regions projected to experience NDVI degradation encompassed 309,600 km2, representing 72.71% of the province. These areas were widely distributed across Gansu, with particularly high probabilities of future vegetation decline observed in northwestern Jiuquan, central Dingxi, Linxia, and Gannan.
By combining the future NDVI trends (Figure 5B) with the persistence levels in Table 5, we identified four distinct trend categories:
(1)
Sustained Improvement Zone: Covering 193,700 km2 (45.5% of the province), this region is mainly distributed in Jiuquan, Wuwei, Qingyang, and Pingliang. NDVI values here are expected to continue increasing, supporting a sustained improvement in ecological conditions.
(2)
Improvement-to-Degradation Transition Zone: Encompassing 219,200 km2 (51.47% of the total area), this category represents the most extensive trend type and is concentrated in central and southeastern Gansu. The NDVI in these regions is likely to reverse from an upward to a downward trend, posing a risk to continued ecological improvement.
(3)
Sustained Degradation Zone: Scattered in localized parts of central Jiuquan, central Zhangye, and northern Lanzhou, this zone covers only 3500 km2 (0.83% of the province). NDVI is expected to continue declining, indicating persistent ecological pressure.
(4)
Degradation-to-Improvement Transition Zone: Covering 9400 km2 (2.2% of the province), this area can be found mainly in northern Jiuquan and central Wuwei. A future shift from degradation to improvement is anticipated, suggesting potential ecological recovery.
From the perspective of ecological strategy, the future vegetation dynamics in Gansu Province present both opportunities and challenges. Therefore, it is essential to develop differentiated ecological management strategies tailored to these distinct trend types.

3.3. Analysis of the Driving Forces of NDVI Changes in Gansu Province

3.3.1. Respective Impact Characteristics and Spatial Distribution Patterns of Climate and Human Activities on NDVI

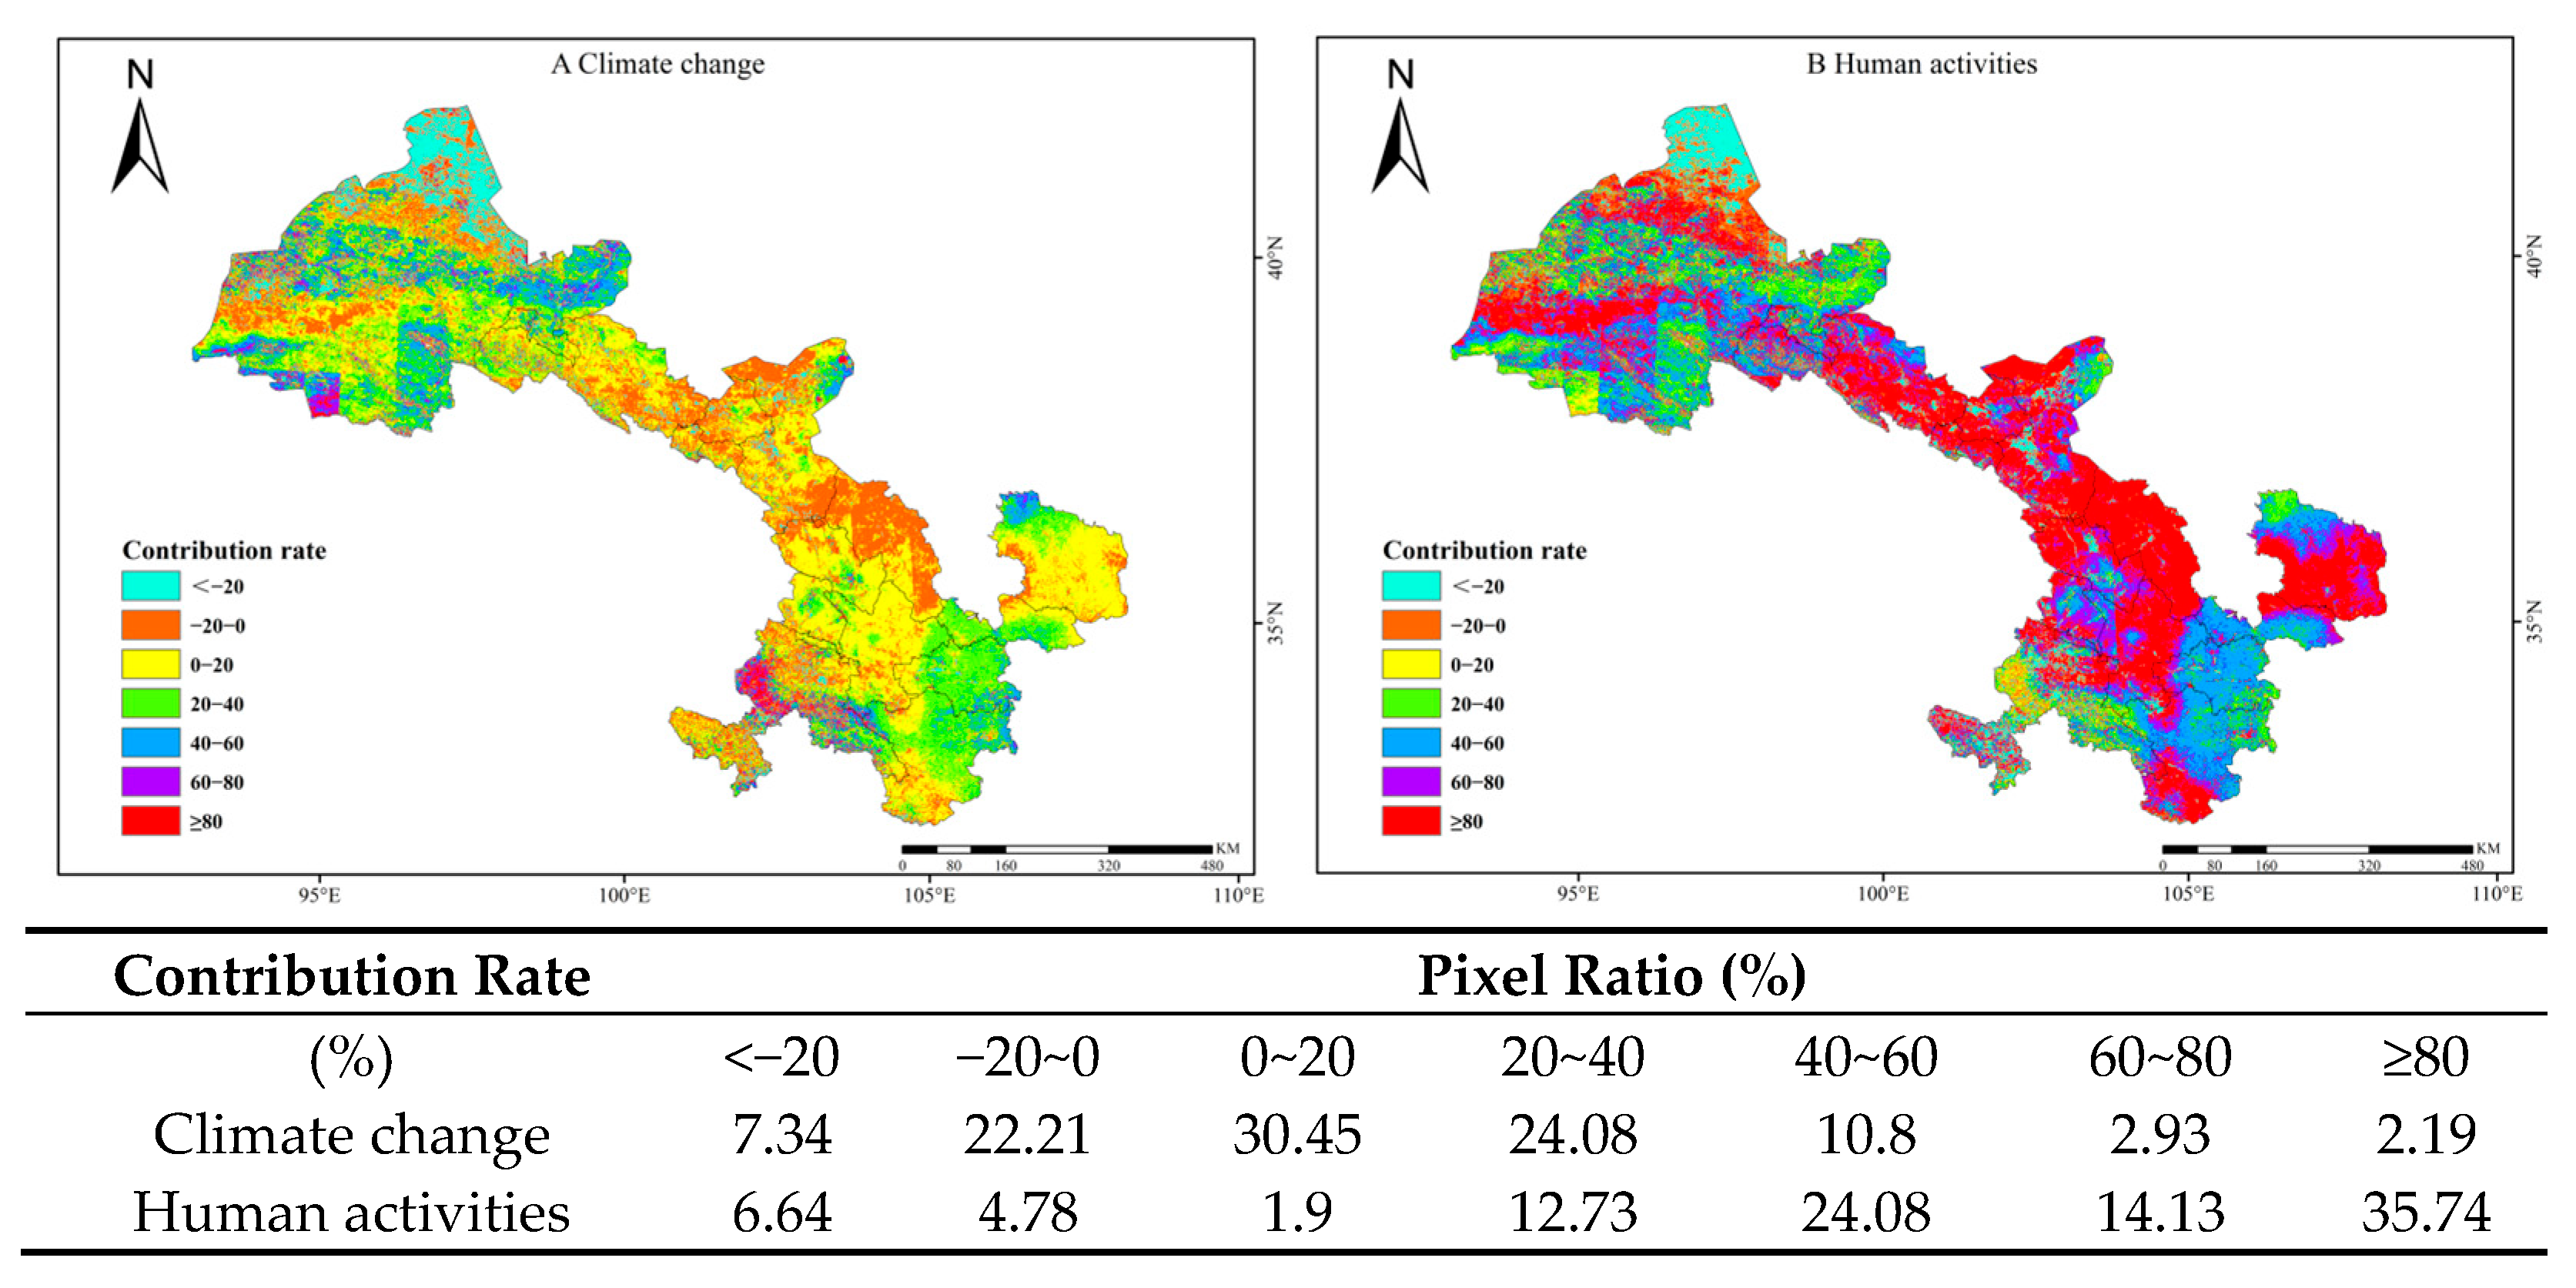
Figure 6 illustrates the respective impacts of climate change and human activities on NDVI in Gansu Province from 2000 to 2022. As shown in Figure 6A, 50.49% of the area showed no significant correlation between NDVI changes and climate factors over the 23-year period. Among the remaining regions, only 38.9% exhibited a positive climatic influence on NDVI, primarily concentrated in most parts of Tianshui and Longnan. By contrast, 61.14% of these climatically influenced areas experienced a negative climate impact on vegetation, widely distributed across northwestern, central, and southeastern Gansu. Importantly, most of these affected regions—whether positively or negatively influenced—showed only mild climate-driven changes in NDVI.
In comparison, human activities have influenced NDVI changes across more than 80% of the province (Figure 6B). Within these affected areas, the proportions of positive and negative impacts were nearly equal. Regions subject to negative anthropogenic influences were mainly concentrated in the northwestern, north-central, and southeastern parts of Gansu. Similarly to climate effects, most changes in NDVI were only mildly influenced by human activities. Nevertheless, human activities constituted a more extensive driver of vegetation change than climate factors over the past 23 years, though their overall magnitude of impact remains moderate.
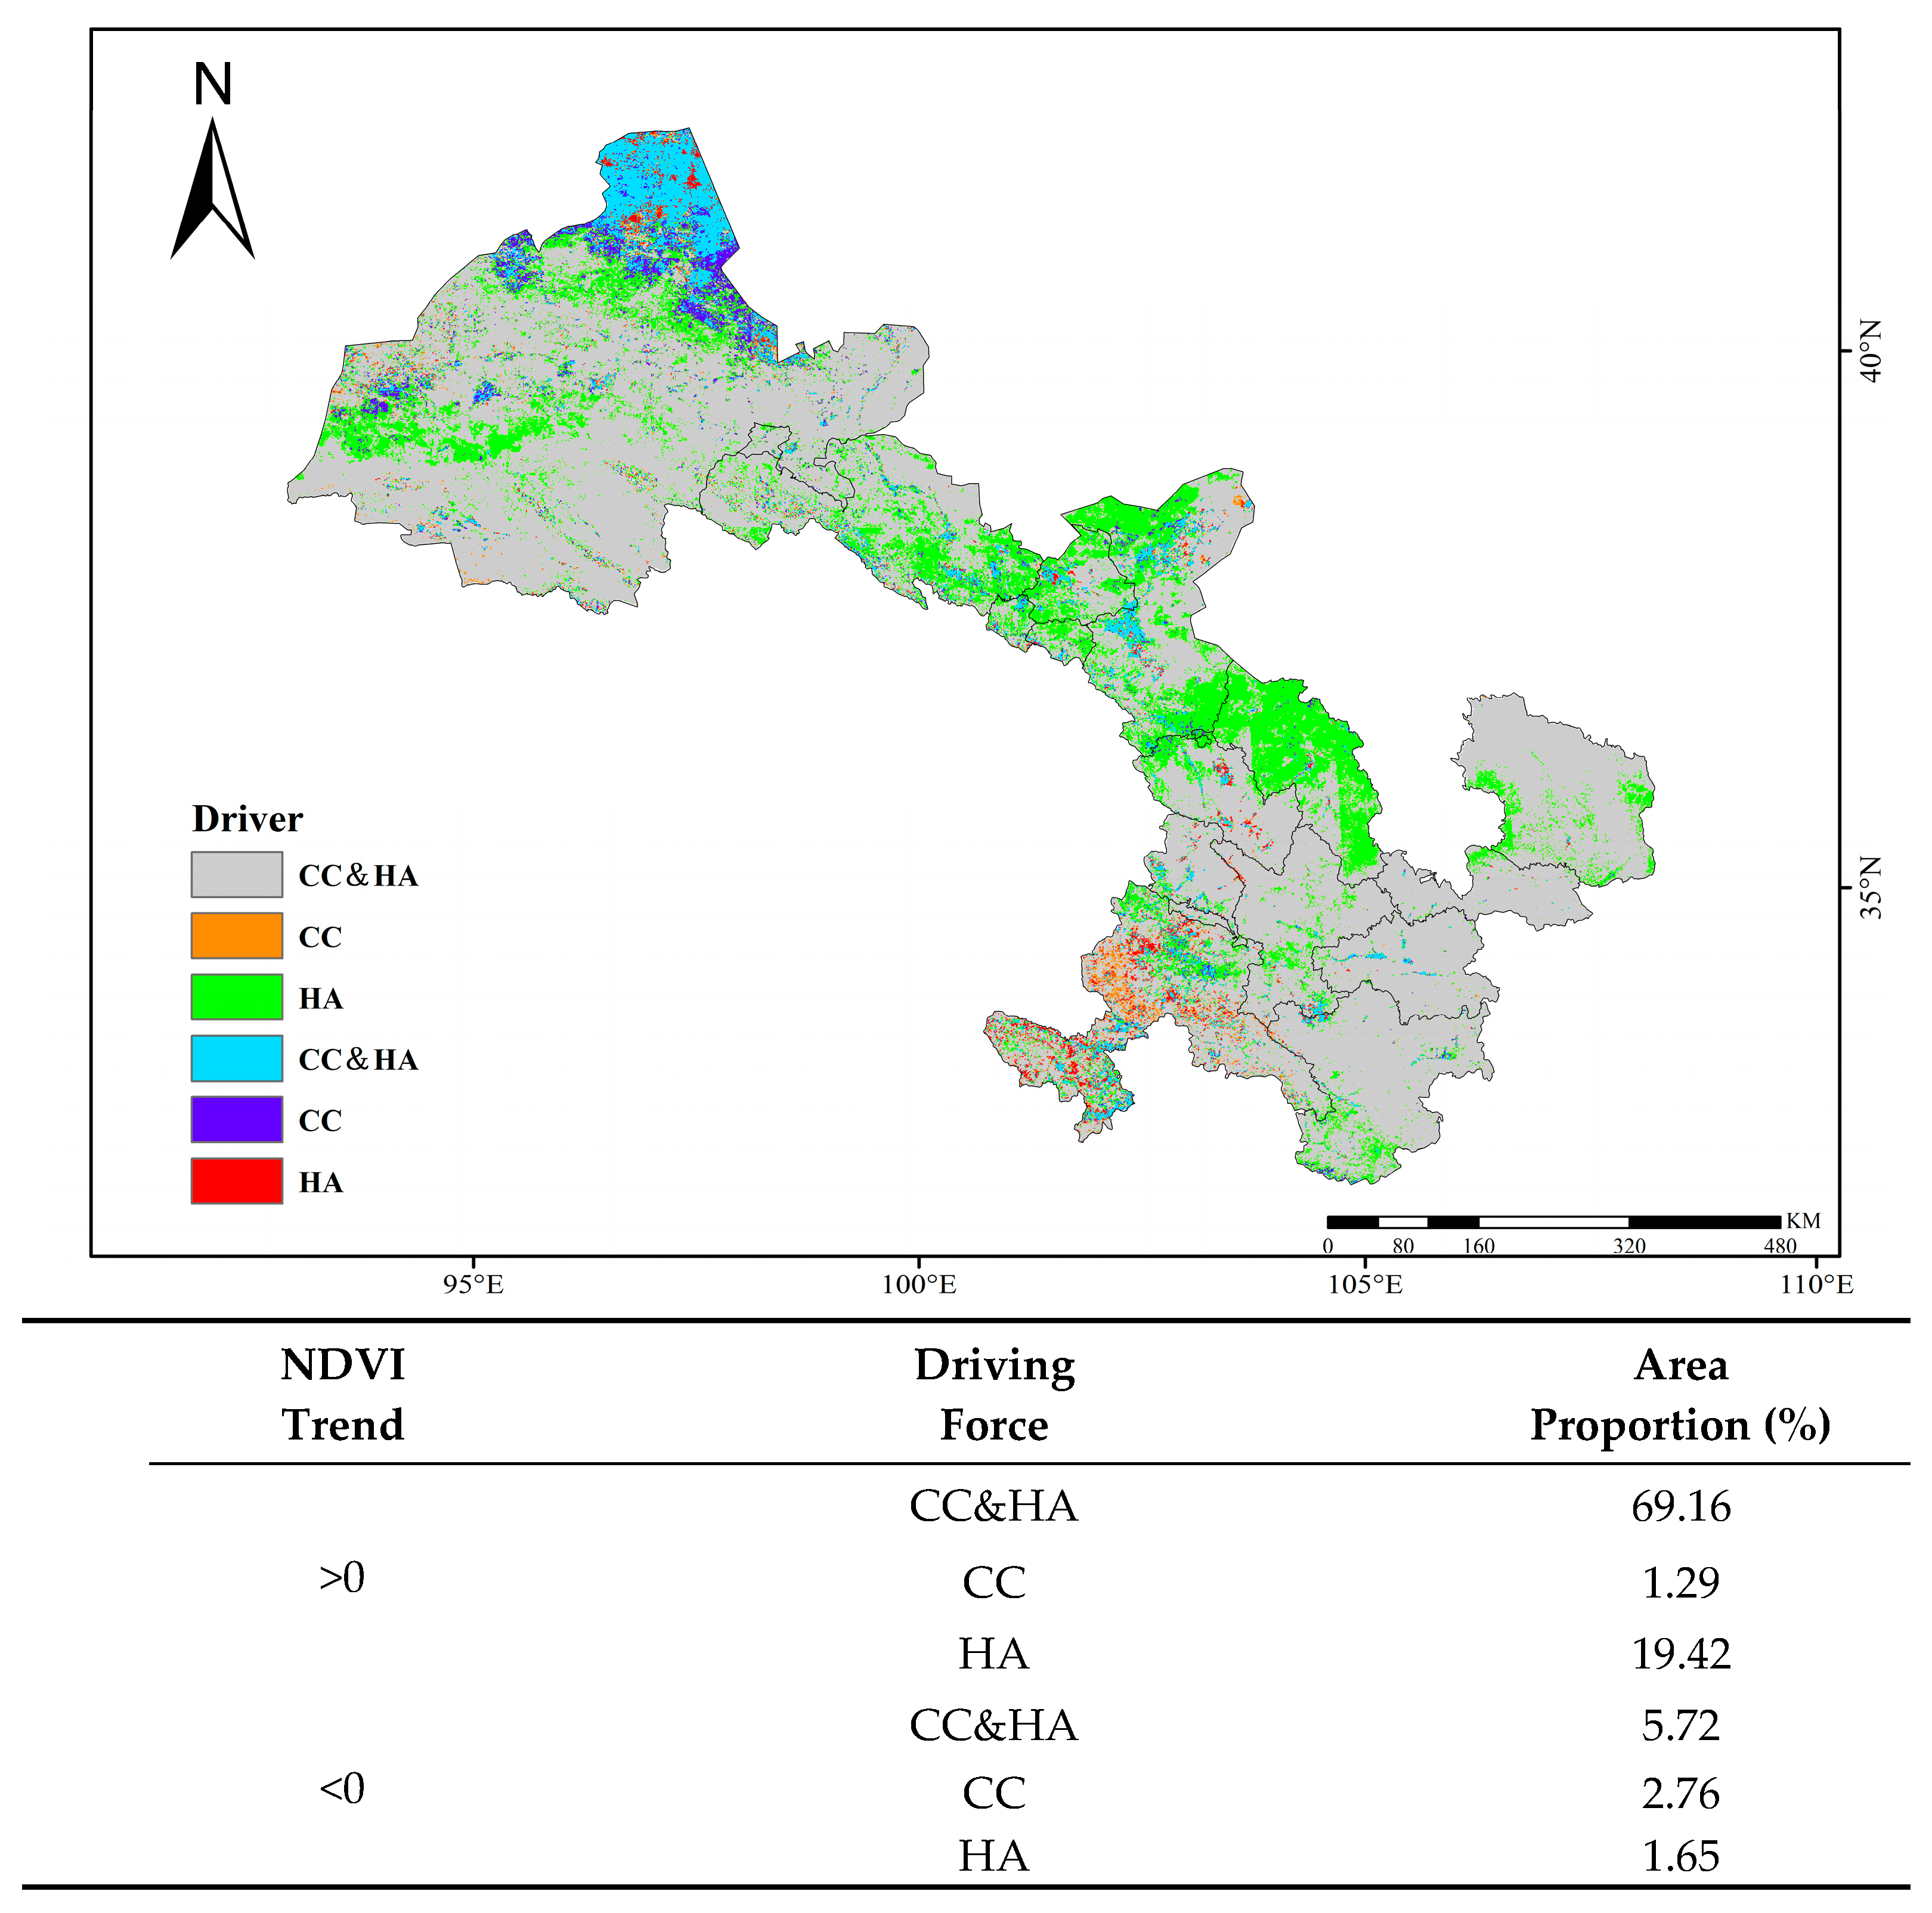
Notably, vegetation dynamics are rarely driven by isolated factors but rather emerge from the interplay of multiple drivers. Therefore, we further analyzed the combined effects of climate change and human activities on NDVI trends (Figure 7). The results indicated that 74.88% of the total area was affected by synergistic impacts of both drivers. Among these, 69.16% of the provinces experienced a facilitative effect on NDVI growth, while 5.72% showed an inhibitory effect. Within the remaining 25.12% of the area, the largest share was represented by regions where human activities alone promoted vegetation improvement. Overall, these findings indicated that over the past 23 years, climate change and human activities had jointly dominated vegetation growth across more than two-thirds of Gansu Province.

3.3.2. Analysis of the Relative Contribution Rates of Climate Change and Human Activities to NDVI in Gansu Province

Figure 8 presents the contribution rates of climate change and human activities to NDVI changes in Gansu Province over the past 23 years. As indicated in Figure 8A, climate change had a facilitative effect on NDVI in 70.45% of the total area, though in most cases its contribution rate remained below 40%. Only 17.92% of the province exhibited a climatic contribution exceeding 60%, primarily concentrated in parts of southwestern and southeastern Gansu. By contrast, climate change exerted an inhibitory effect in 29.55% of the area, mainly located in the northwestern region.
In comparison, human activities played a positive role in NDVI changes across 88.58% of the province. Notably, nearly half of the total area (49.87%) experienced a contribution rate from human activities exceeding 60%. A comparison between Figure 8A,B reveals that the area where the contribution rate of human activities surpassed 80% was 16 times larger than that for climate change. Furthermore, cross-referencing with Figure 3 shows that most areas with improved vegetation coverage aligned closely with regions where human activities contributed more than 60%. These results demonstrate that human activities constituted the dominant factor driving vegetation changes in Gansu between 2000 and 2022.
Additionally, human activities exerted negative impacts across approximately 11.62% of the province. In these regions, the contribution rate of climate change was also negative. Although the negative impact of these two factors on NDVI changes was small, the inherently fragile ecological conditions in these areas imply that combined negative pressures could inflict substantially greater damage on vegetation growth than any single factor alone.

4. Discussion

4.1. The Impact of Climate on the Spatiotemporal Variations in NDVI in Gansu Province

Over the past 23 years, 70.45% of Gansu Province has exhibited a positive NDVI response to climate change. To identify the key climatic drivers, we further analyzed the effects of precipitation, temperature, and solar radiation on vegetation dynamics.
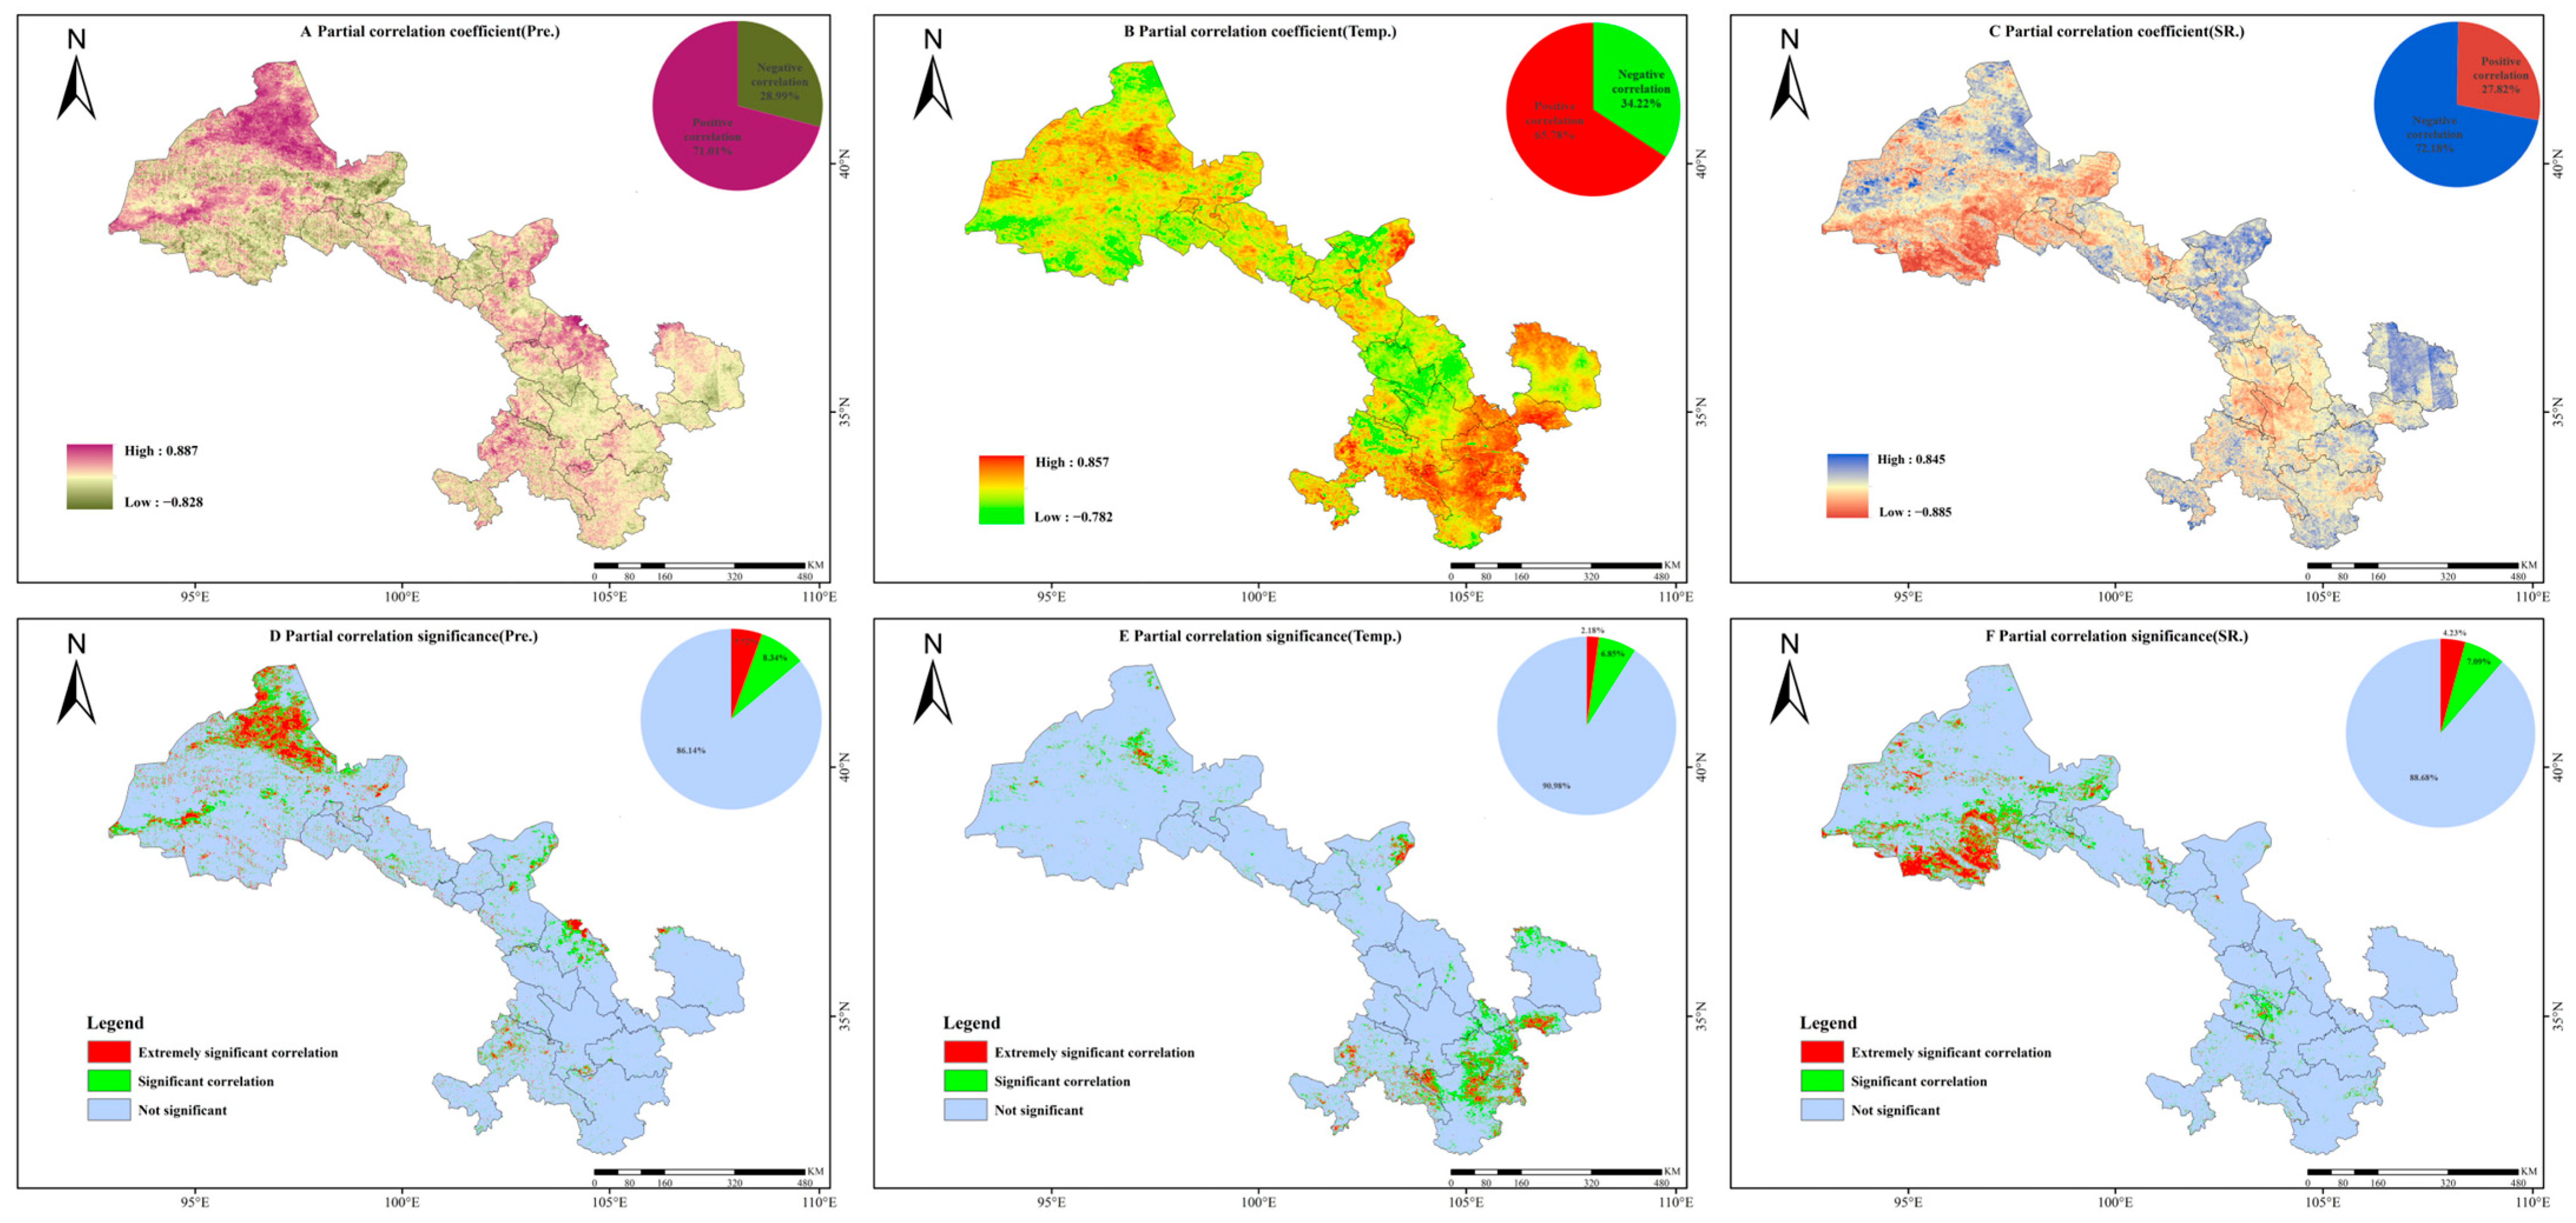
NDVI was positively correlated with precipitation (mean partial correlation coefficient = 0.12; standard deviation = 0.25), with stronger spatial associations observed in the northwestern and central regions. As the dominant climatic factor, precipitation influenced 71.01% of the study area, highlighting the crucial role of moisture availability in arid-region vegetation—a finding consistent with prior research in Northwest China [44,45]. Significantly correlated areas (p < 0.05; 13.86% of the province) were mainly distributed in northern Jiuquan, eastern Wuwei, and northern Baiyin (Figure 9D). These regions border deserts and are highly dependent on precipitation as the primary water source for vegetation. By contrast, the southeastern parts of the province benefit from ample rainfall, long-standing agricultural practices, and ecological restoration projects, contributing to relatively high vegetation coverage.
NDVI also showed a positive correlation with temperature (mean partial correlation coefficient = 0.09; standard deviation = 0.23), with stronger correlations detected in the southeastern and western regions. Significantly correlated areas (9.03%) were concentrated in northeastern Wuwei, Longnan, Tianshui, Pingliang, northern Qingyang, and the Gannan Tibetan Autonomous Prefecture (Figure 9E). In high-elevation zones such as northeastern Wuwei and Gannan, elevated temperatures appear to promote and extend the vegetation growing season. In regions with relatively sufficient precipitation (500–800 mm annually), including Longnan, Tianshui, Pingliang, and Qingyang, seasonal temperature variations significantly influenced vegetation phenology.
By contrast, solar radiation was negatively correlated with NDVI (mean partial correlation coefficient = −0.144; standard deviation = 0.22), showing stronger negative associations in the southwest and weaker ones in the central and southeast. Approximately 11.32% of the area exhibited a significant negative correlation (p < 0.05), particularly in Jiuquan, northwestern Dingxi, and eastern Zhangye (Figure 9F). In these regions, high solar radiation exacerbates water stress by increasing evapotranspiration, thereby reducing photosynthetic efficiency and suppressing plant growth [46]. Enhanced surface reflection also contributes to local warming, creating a dry microclimate that further restricts vegetation development.

4.2. Anthropogenic Impact on Spatiotemporal Variations in NDVI in Gansu Province

In this study, vegetation changes reflected by NDVI were associated with human activities across over 80% of Gansu Province. To further quantify anthropogenic contributions, we calculated partial correlation coefficients between NDVI and two representative indicators: GDP and the human footprint index.
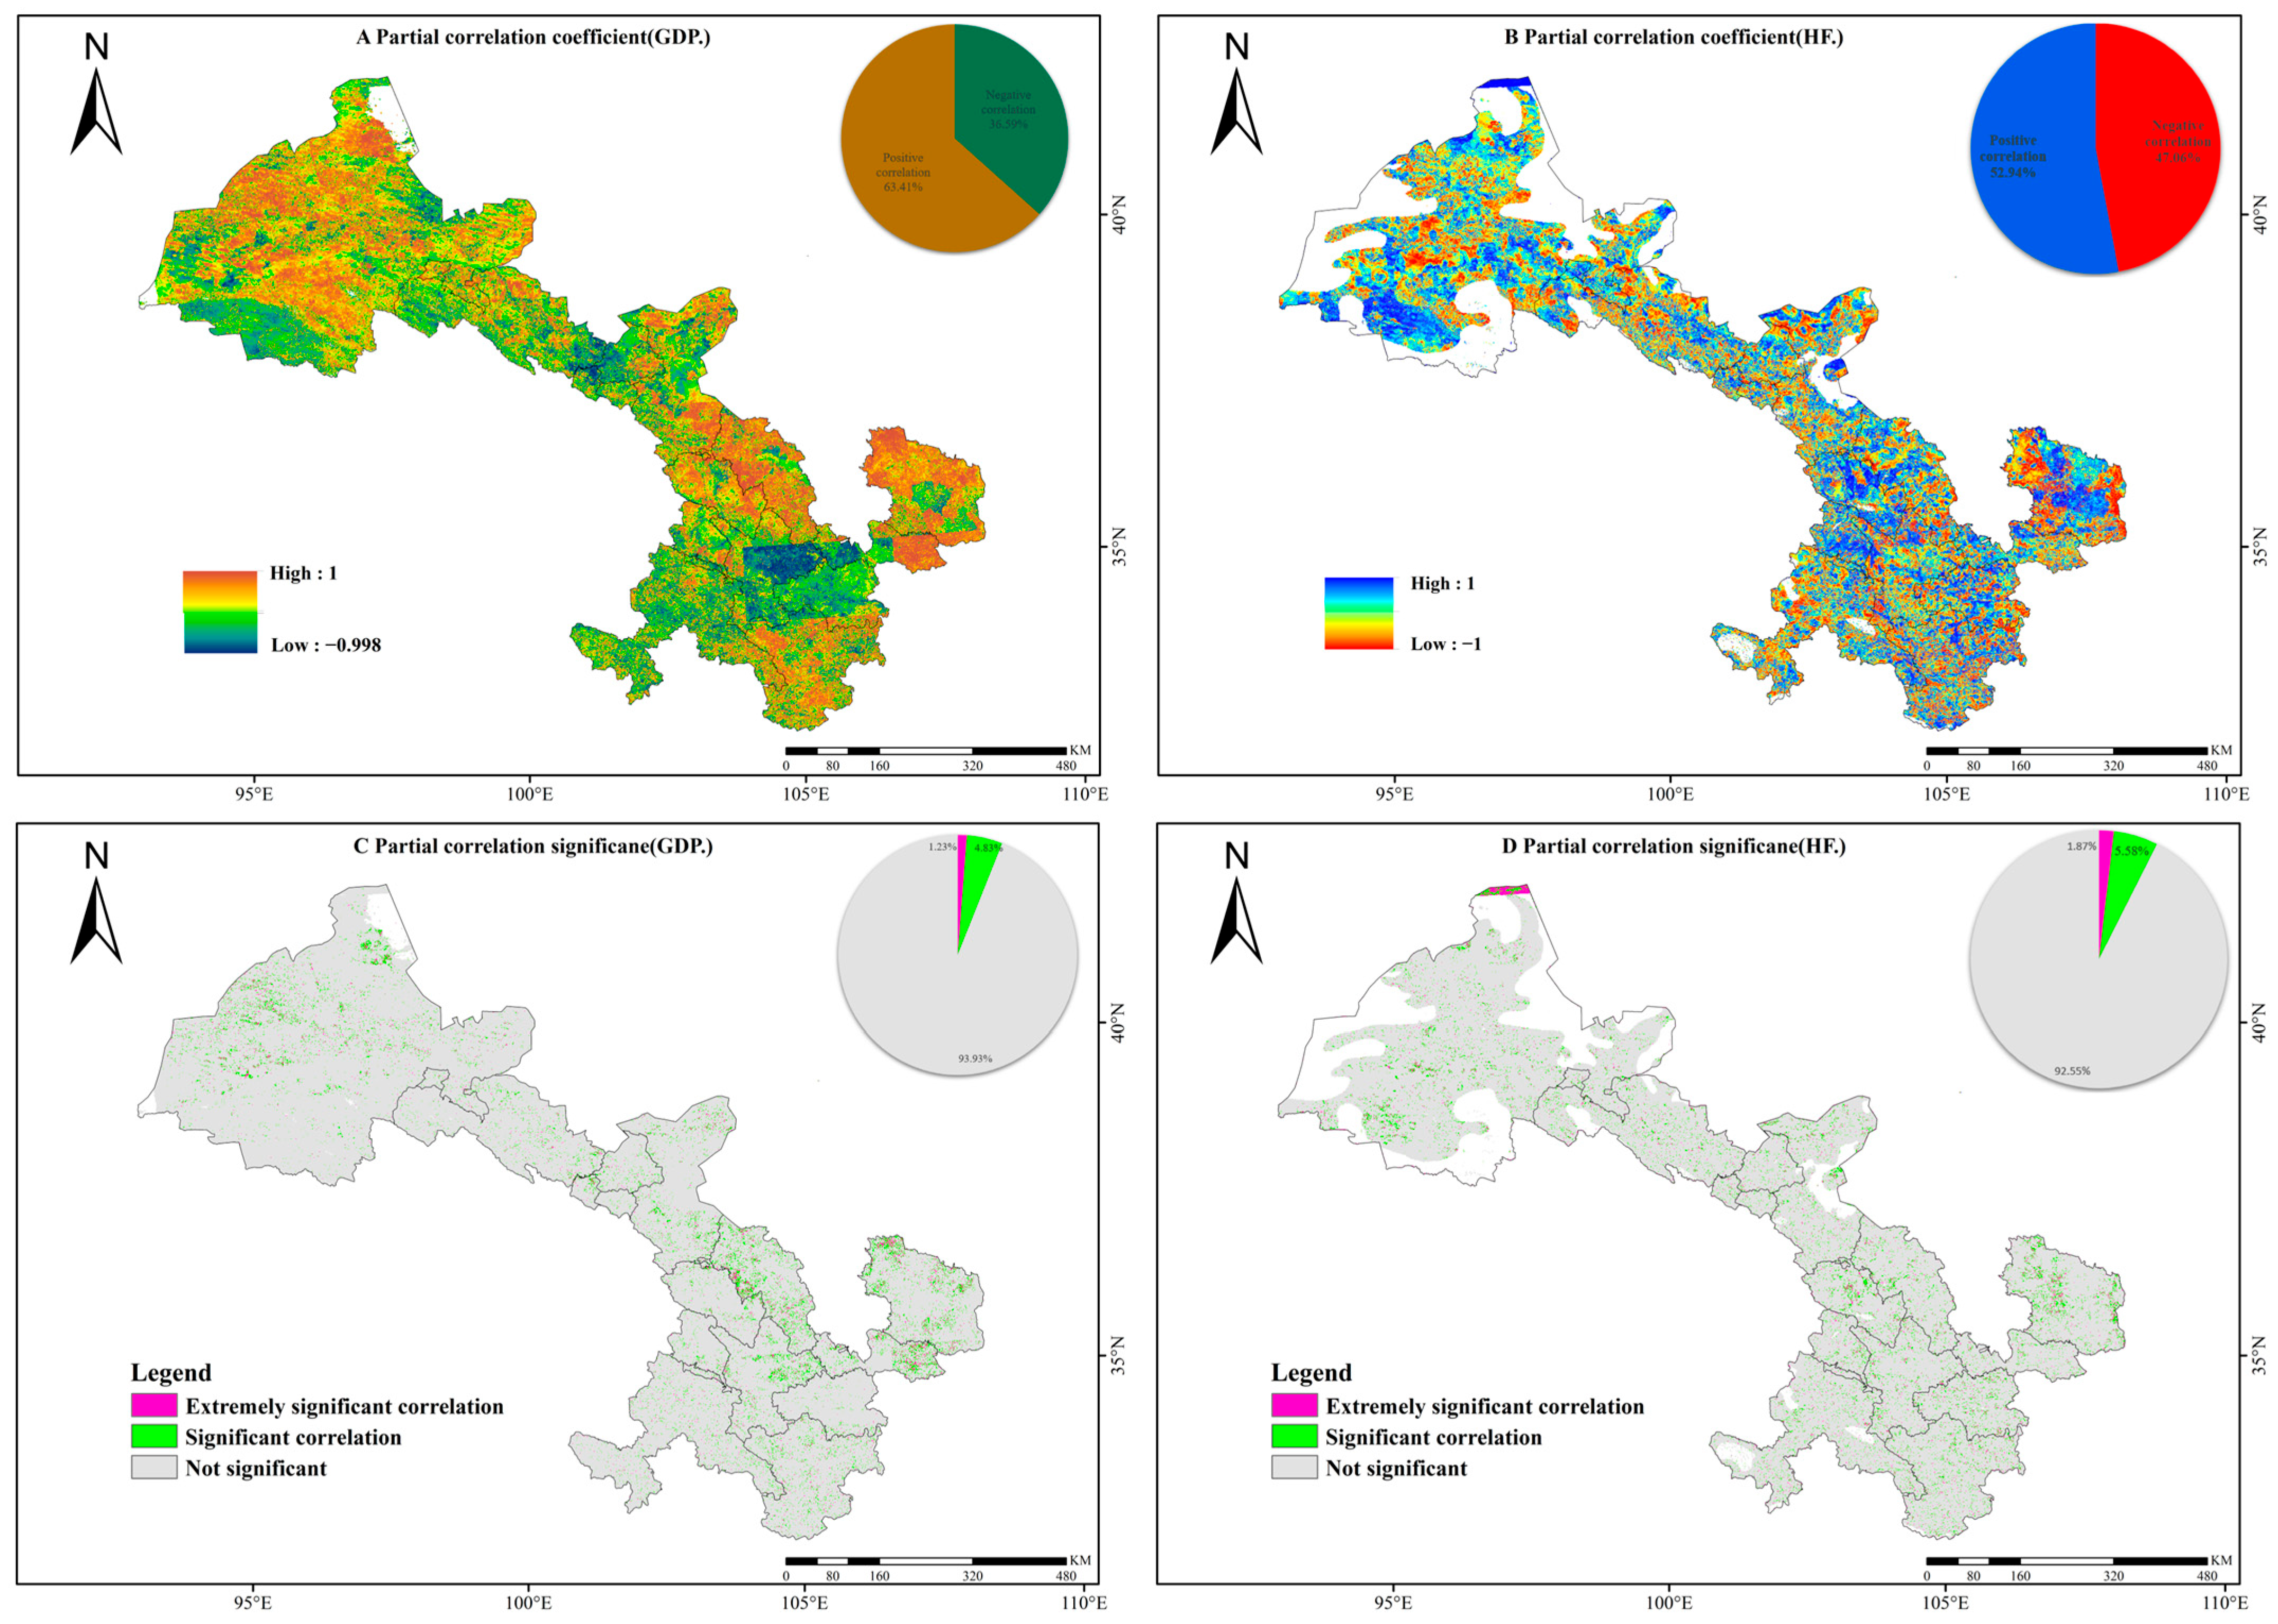
As shown in Figure 10, NDVI demonstrated positive correlations with GDP in 63.41% of the provincial territory, with 6.06% of these areas showing statistically significant correlations (p < 0.05). These regions are predominantly distributed in traditional agricultural zones or energy resource development areas, including Baiyin, Pingliang, Jiuquan, and northern Qingyang. This positive relationship indicates that regional economic growth has been concomitant with practices facilitating vegetation recovery. Specifically, large-scale ecological restoration projects implemented over the past two decades, such as the Grain for Green Program and the Three-North Shelterbelt Development Program, have significantly enhanced vegetation coverage in the Loess Plateau regions of Qingyang and Pingliang by modifying land surface properties and soil hydrological processes [47]. Furthermore, modernization of irrigation infrastructure—including widespread adoption of water-saving technologies (e.g., drip and sprinkler irrigation) and optimization of cropping patterns in the oasis agricultural zones of the Hexi Corridor—has alleviated water stress and improved water use efficiency, thereby generating sustained positive impacts on NDVI [48].
Similarly, NDVI showed positive correlations with the human footprint index across 52.94% of the province, with 7.45% of these areas reaching statistical significance (p < 0.05). These regions were scattered throughout Jiuquan, Dingxi, Qingyang, and other locations. The human footprint index comprehensively reflects the spatial aggregation of population, land use intensity, and infrastructure development. The observed positive correlations reflect the beneficial impacts of directed human interventions on vegetation, including ecological protection projects, construction of water conservancy facilities, and development of urban green spaces. Moreover, the consistent directional effects of both GDP and the human footprint index on NDVI across most regions underscore the potential for synergistic effects between economic development and ecological construction under effective policy guidance [49]. This synergy was particularly evident in regions with major national ecological projects, such as the eastern Gansu Loess Plateau and sections of the Hexi Corridor oases, where government-led ecological investments combined with local industrial transformation have collectively driven significant improvements in vegetation coverage.
However, the impact of human activities on vegetation demonstrates a distinct “dual character.” In ecologically vulnerable areas—including the Gannan Plateau, the northern foothills of the Qilian Mountains, and sections of the Shiyang River Basin—unsustainable practices have triggered localized declines in NDVI, such as overgrazing, unregulated mining, and rapid tourism infrastructure expansion. For instance, in the Shiyang River Basin, groundwater over-extraction for irrigation has caused precipitous declines in water tables, directly resulting in degradation of natural vegetation dependent on groundwater recharge [50]. Similarly, in northern Jiuquan and central Wuwei, mining activities and industrial land development not only directly destroy surface vegetation but also exacerbate desertification, thereby reducing overall ecosystem resilience [51].
Although areas affected by negative anthropogenic impacts constitute a relatively small proportion of the total territory, their location in ecologically fragile and critical zones presents non-negligible threats to regional ecological security. Consequently, implementing differentiated ecological management strategies is imperative. In areas with vegetation improvement, the effectiveness of existing ecological projects should be consolidated and expanded. In areas at risk of degradation, it is essential to enforce grazing exclusion and grassland restoration policies, regulate mining and land use practices, and promote sustainable water resource management based on eco-hydrological principles to curb and reverse degradation trends [52,53].
In summary, human activities constitute one of the dominant factors driving spatiotemporal NDVI variations in Gansu Province, with complex and spatially heterogeneous mechanisms. Positive impacts are primarily achieved through large-scale ecological construction, technological advancement, and policy guidance, whereas negative impacts stem from unsustainable resource exploitation and land use practices. Future ecological policy-making must fully consider this “dual character” to achieve continuous improvement in regional ecological quality.

4.3. Synergistic Mechanisms of Climate Change and Human Activities on NDVI in Gansu Province

(1)
Factor detection
In our study, the area affected by the combined impacts of climate change and human activities on NDVI variations accounted for 74.88% of Gansu Province’s total area. To study ecological driving mechanisms, it is necessary to conduct an analysis of the synergism among multiple factors [25]. Therefore, we used the geographic detector model to analyze how climate change and human activities synergistically influenced the variations in NDVI in Gansu Province over the past 23 years. Based on 11 influencing factors, we analyzed the synergistic impact mechanism of climate change and human activities on the NDVI in Gansu Province for the years 2000, 2005, 2010, 2015, and 2022. The larger the q value, the higher the explanatory degree of the factor’s influence on the spatial distribution of vegetation coverage. As shown in Figure 11, the results show that the dominant factors in each year are precipitation, solar radiation, slope, land use type, population density, and human activity footprint. Meanwhile, except for population density, all the other factors have an increasingly greater impact on vegetation NDVI over time.
(2)
Interaction detection
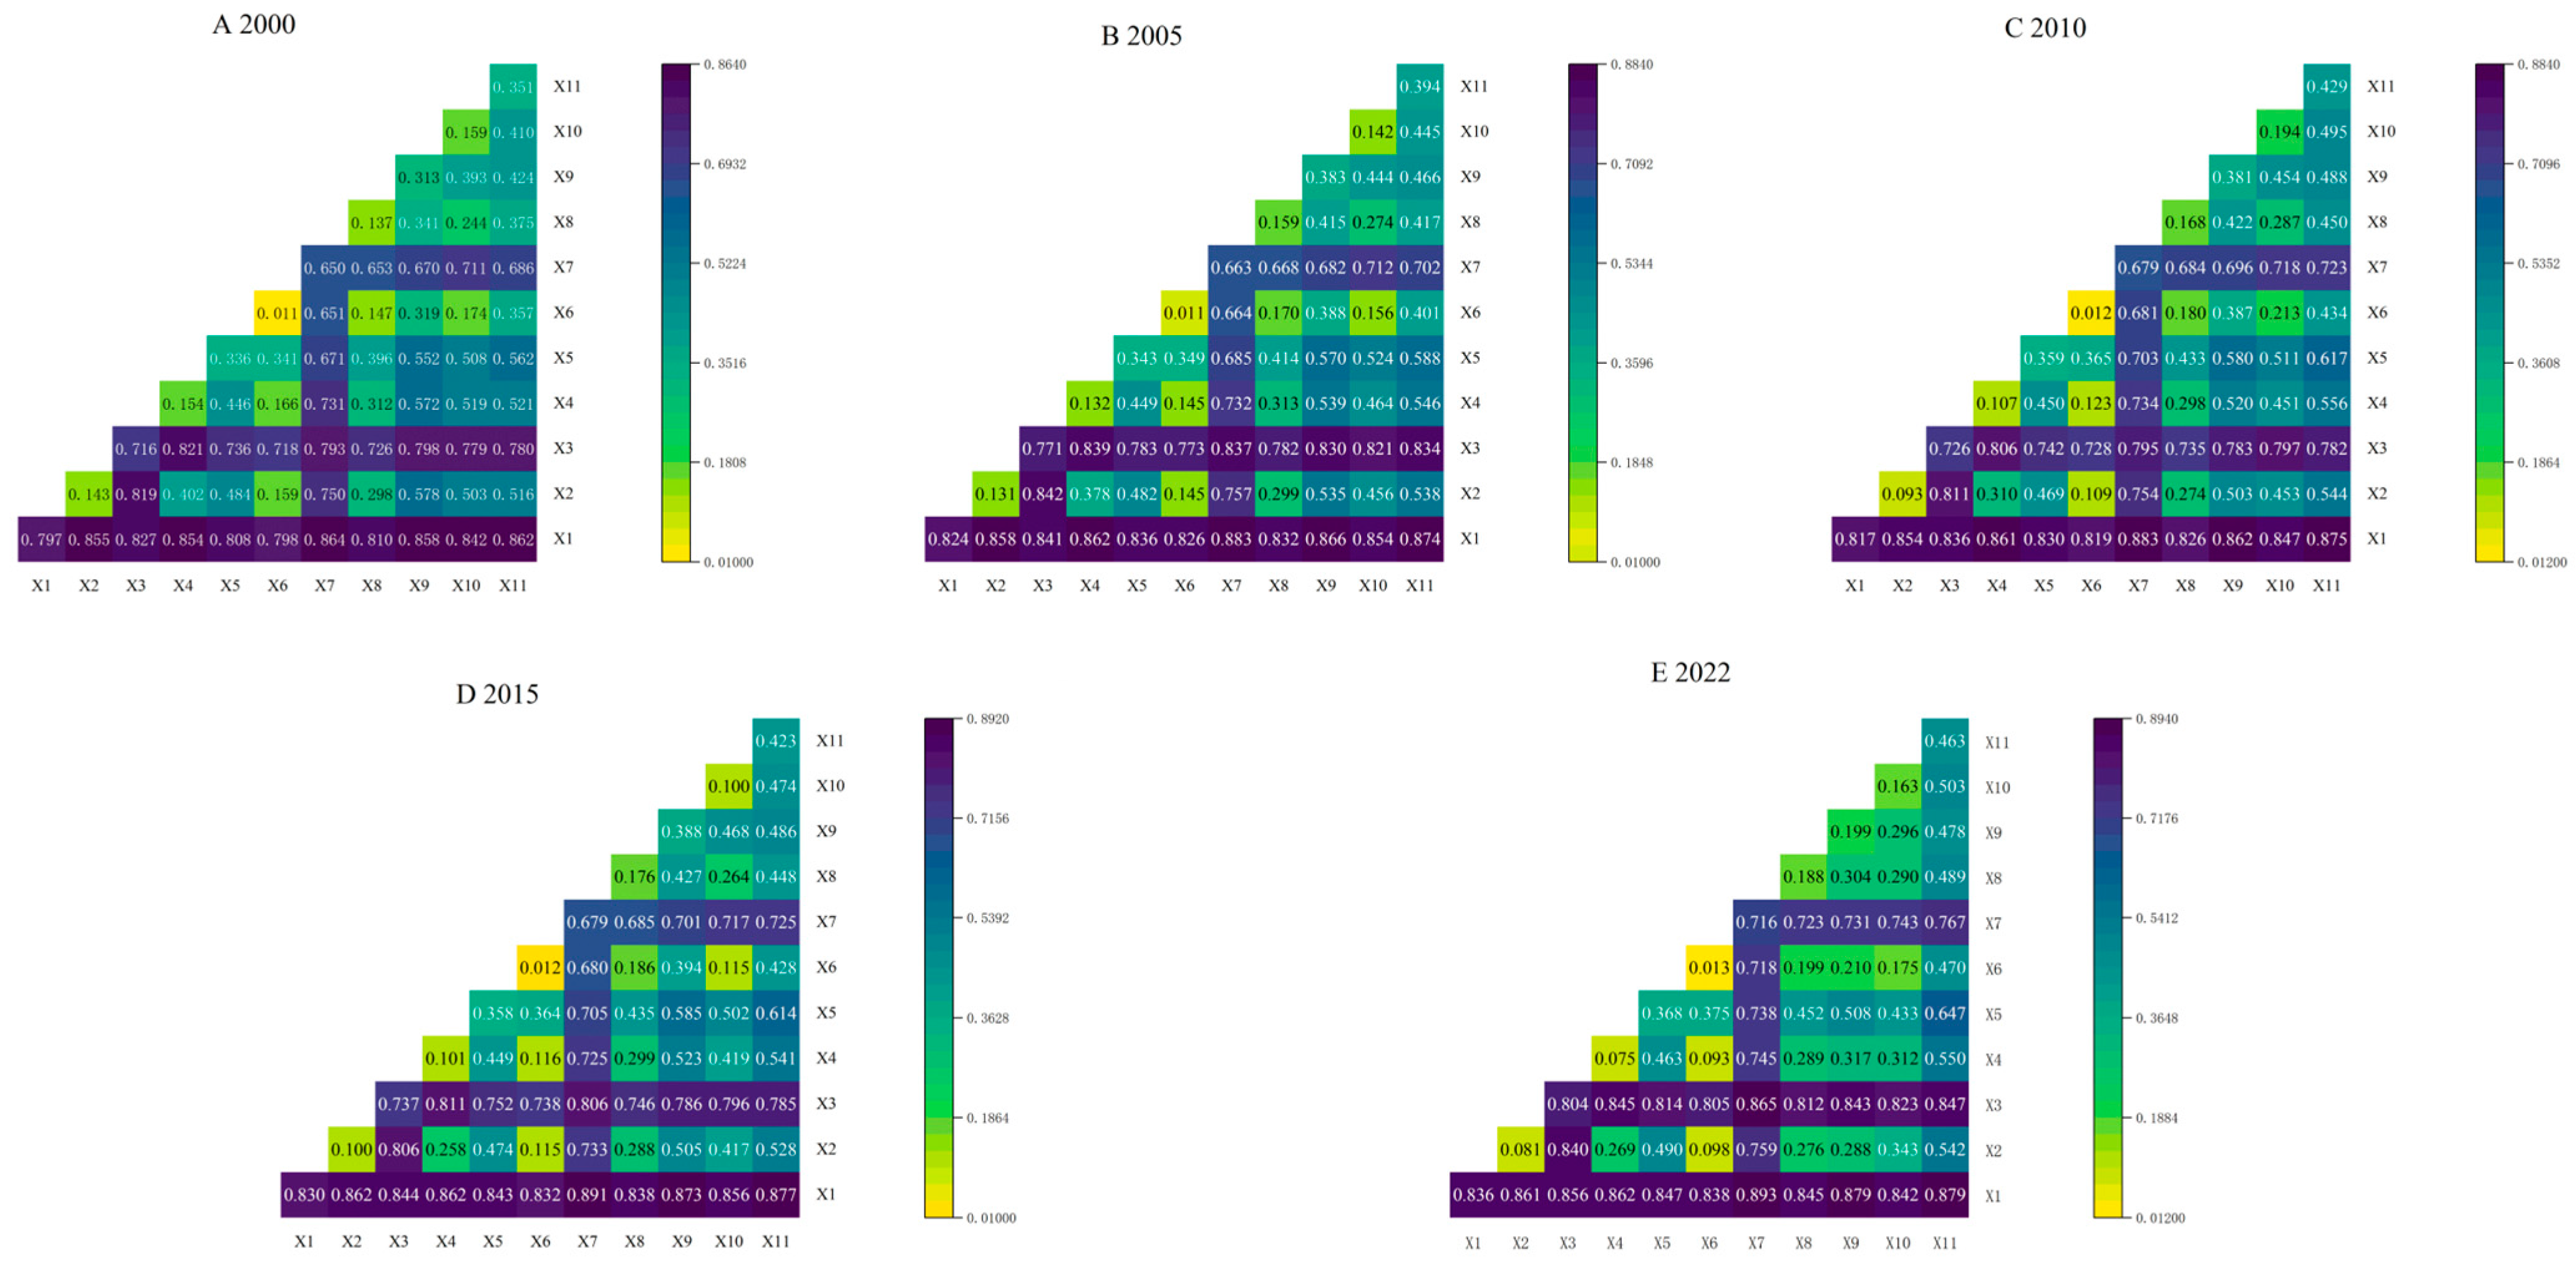
As shown in Figure 12, the influence of two-factor interactions on the spatial distribution of NDVI was significantly greater than that of any single factor, indicating that synergistic effects played a dominant role in driving NDVI changes in Gansu Province [32]. According to Table 6, these interactions primarily resulted in enhanced or nonlinearly enhanced effects, with the “precipitation ∩ land use” combination consistently exhibiting the strongest explanatory power from 2000 to 2022.
To further investigate the mechanism underlying this dominant interaction, we examined the sensitivity of different land use types to precipitation variability. The underlying mechanism lies in how land use types alter surface properties—such as vegetation rooting depth, canopy structure, and soil characteristics—thereby regulating ecosystem-level efficiency in precipitation utilization. In semi-arid regions, it suppresses nutrient fluxes by reducing soil moisture availability and impeding root-soil nutrient contact, thereby limiting vegetation uptake of water and nutrients and consequently restraining growth [54]. By contrast, forested areas, particularly those involved in ecological projects such as the Grain for Green Program (e.g., in the loess hilly regions of Qingyang and Pingliang), enhanced water retention and soil moisture availability through improved root systems and litter layers, thereby stabilizing vegetation responses to precipitation [41]. Thus, the “precipitation ∩ land use” interaction essentially reflects the coupling of hydrological redistribution and biological utilization processes.
Over the multi-year observation period, the interactions between human activity footprint and precipitation (X11 ∩ X1) and between population density and precipitation (X9 ∩ X1) consistently ranked high among driving factors, occupying the second and third positions, respectively. This finding further supports the view that human activities play a significant regulatory role in vegetation dynamics in water-limited regions. As highlighted by Zheng et al. [49] in their study of typical ecological zones in China, human activities can alleviate water stress through management measures such as water-saving irrigation and ecological water diversion, thereby enhancing vegetation efficiency in precipitation utilization. Similarly, Liu et al. [18] found that densely populated areas often coincide with more intensive ecological management efforts, leading to more pronounced vegetation recovery under similar climatic conditions. This provides theoretical support for the importance of the population–precipitation interaction observed in this study.
In summary, this study clearly demonstrates that precipitation is the dominant climatic factor regulating the spatiotemporal dynamics of vegetation in Gansu Province. Within this precipitation-dominated framework, human activities—particularly through changes in land use patterns and the spatial distribution of population—have played a crucial regulatory and modifying role in vegetation changes over the past 23 years. Meanwhile, against the background of global warming, solar radiation, as an auxiliary energy factor for vegetation growth, has seen its influence gradually become more prominent, potentially emerging as a secondary yet non-negligible climatic driver at the regional scale.

5. Conclusions

This study systematically examined the spatiotemporal patterns and driving mechanisms of NDVI changes in Gansu Province from 2000 to 2022, with emphasis on the synergistic effects of climate change and human activities. The main conclusions are as follows:
(1)
The growing-season NDVI in Gansu Province exhibited a significantly increasing trend overall (0.0029 per year, p < 0.05). Spatially, NDVI showed a distinct pattern of “higher in the southeast and lower in the northwest.” Although low vegetation coverage dominated the entire province, 41.42% of the area experienced an extremely significant increasing trend (p < 0.01).
(2)
Future vegetation trends present both opportunities and risks. The area with sustained or potential improvement accounts for 45.5% of the province, while regions facing sustained degradation or a reversal from improvement to degradation account for 54.5%.
(3)
Partial correlation analysis revealed that NDVI was positively correlated with precipitation and temperature in most areas, whereas it was negatively correlated with solar radiation. Spatially, 13.86% of the region showed a significant positive correlation with precipitation (p < 0.05), while 11.32% exhibited a significant negative correlation with solar radiation (p < 0.05).
(4)
The contribution rate of human activities to NDVI changes surpassed that of climate change. Human activities played a positive role in 88.58% of the province, with nearly half of the area experiencing a contribution rate exceeding 60%. Precipitation was the dominant climatic factor, while solar radiation increasingly influenced vegetation dynamics under global warming.
(5)
Interaction detection revealed that two-factor interactions—particularly between precipitation and land use—significantly enhanced the explanatory power of NDVI spatial heterogeneity. Human activities, mediated through land use and population distribution, played a critical regulatory role in vegetation dynamics under precipitation constraints.
In summary, vegetation dynamics in Gansu Province are jointly shaped by climate change and human activities, with the latter serving as the dominant driver. Future ecological management strategies must account for this “dual character” and adopt region-specific approaches to promote sustainable vegetation restoration.

Author Contributions

Conceptualization, J.F. and X.W.; methodology, J.F. and X.W.; software, J.F.; validation, J.F., X.W. and X.Z. (Xiaowei Zhang); formal analysis, S.L.; investigation, S.L. and W.D.; resources, M.L., M.F. and X.Z. (Xiaowei Zhang); data curation, M.L. and M.F.; writing—original draft preparation, J.F.; writing—review and editing, X.W.; visualization, J.F.; supervision, X.W. and X.Z. (Xiaolei Zhou); project administration, X.W. and X.Z. (Xiaolei Zhou); funding acquisition, X.W. and X.Z. (Xiaolei Zhou). All authors have read and agreed to the published version of the manuscript.

Funding

This research work was supported by grants from the Science and Technology Innovation Fund of Gansu Agricultural University (GAU-KYQD-2020-13) and Fundamental Research Funds of CAF (CAFYBB2024ZA001).

Data Availability Statement

The data presented in this study are openly available in NASA at https://ladsweb.modaps.eosdis.nasa.gov/search/ (accessed on 18 March 2025).

Conflicts of Interest

The authors declare no conflicts of interest. The funders had no role in the design of the study; in the collection, analyses, or interpretation of data; in the writing of the manuscript; or in the decision to publish the results.

References

  1. Davis, E.; Trant, A.J.; Hermanutz, L.; Whitaker, D.J.S.U. Plant-Environment Interactions in the Low Arctic Torngat Mountains of Labrador. Ecosystems 2021, 24, 1038–1058. [Google Scholar] [CrossRef]
  2. Wei, X.; Yang, J.; Luo, P.; Lin, L.; Lin, K.; Guan, J. Assessment of the variation and influencing factors of vegetation NPP and carbon sink capacity under different natural conditions. Ecol. Indic. 2022, 138, 108834. [Google Scholar] [CrossRef]
  3. Wang, Y.; You, C.; Tan, X.; Ren, T.; Su, T.; Han, X.; Chen, S. Co-regulation of climate and vegetation on seasonal and interannual variations of energy exchange over a temperate grassland. Agric. For. Meteorol. 2025, 369, 110556. [Google Scholar] [CrossRef]
  4. Zhao, J.; Huang, S.; Huang, Q.; Wang, H.; Leng, G.; Peng, J.; Dong, H. Copula-Based Abrupt Variations Detection in the Relationship of Seasonal Vegetation-Climate in the Jing River Basin, China. Remote Sens. 2019, 11, 1628. [Google Scholar] [CrossRef]
  5. Tuoku, L.; Wu, Z.; Men, B. Impacts of climate factors and human activities on NDVI change in China. Ecol. Inform. 2024, 81, 102555. [Google Scholar] [CrossRef]
  6. Xie, Y.; Wang, X.; Silander, J.A. Deciduous forest responses to temperature, precipitation, and drought imply complex climate change impacts. Proc. Natl. Acad. Sci. USA 2015, 112, 13585–13590. [Google Scholar] [CrossRef]
  7. Pu, G.; Han, L.; Chen, L.; Wan, D.; Teng, H. Elevational dynamics of vegetation changes in response to climate change on the Tibetan plateau. Sci. Rep. 2025, 15, 9813. [Google Scholar] [CrossRef] [PubMed]
  8. Zhou, Y.; Batelaan, O.; Guan, H.; Liu, T.; Duan, L.; Wang, Y.; Li, X. Assessing long-term trends in vegetation cover change in the Xilin River Basin: Potential for monitoring grassland degradation and restoration. J. Environ. Manag. 2024, 349, 119579. [Google Scholar] [CrossRef]
  9. Farbo, A.; Sarvia, F.; De Petris, S.; Basile, V.; Borgogno-Mondino, E. Forecasting corn NDVI through AI-based approaches using sentinel 2 image time series. ISPRS J. Photogramm. Remote Sens. 2024, 211, 244–261. [Google Scholar] [CrossRef]
  10. Guo, Y.; Zhang, L.; He, Y.; Cao, S.; Li, H.; Ran, L.; Ding, Y.; Filonchyk, M. LSTM time series NDVI prediction method incorporating climate elements: A case study of Yellow River Basin, China. J. Hydrol. 2024, 629, 130518. [Google Scholar] [CrossRef]
  11. Wang, J.; Wang, K.; Zhang, M.; Zhang, C. Impacts of Climate Change and Human Activities on Vegetation Cover in Hilly Southern China. Ecol. Eng. 2015, 81, 451–461. [Google Scholar] [CrossRef]
  12. Liu, S.; Li, W.; Qiao, W.; Wang, Q.; Hu, Y.; Wang, Z. Effect of Natural Conditions and Mining Activities on Vegetation Variations in Arid and Semiarid Mining Regions. Ecol. Indic. 2019, 103, 331–345. [Google Scholar] [CrossRef]
  13. Shi, S.; Li, W.; Lin, X.; Zhai, Y.; Ding, Y. Spatiotemporal Variations of Vegetation NDVl and Influencing Factors in Heilongjiang Province. Res. Soil Water Conserv. 2023, 30, 294–305. [Google Scholar] [CrossRef]
  14. Zhang, L.; Cong, Z.; Zhang, D.; Li, Q. Response of Vegetation Dynamics to Climatic Variables across a Precipitation Gradient in the Northeast China Transect. Hydrol. Sci. J. 2017, 62, 1517–1531. [Google Scholar] [CrossRef]
  15. Zhang, Y.; Zhang, L.; Wang, J.; Dong, G.; Wei, Y. Quantitative Analysis of NDVI Driving Factors Based on the Geographical Detector Model in the Chengdu-Chongqing Region, China. Ecol. Indic. 2023, 155, 110978. [Google Scholar] [CrossRef]
  16. Liang, Z.; Sun, R.; Duan, Q. Spatiotemporal variation of NDVI in the Yellow River water conservation zone and its driving factors. Prog. Geogr. 2023, 42, 1717–1732. [Google Scholar] [CrossRef]
  17. Xun, Q.; An, S.; Lu, M. Climate change and topographic differences influence grassland vegetation greening across environmental gradients. Front. Environ. Sci. 2024, 11, 1324742. [Google Scholar] [CrossRef]
  18. Liu, Y.; Tian, J.; Liu, R.; Ding, L. Influences of climate change and human activities on NDVI changes in China. Remote Sens. 2021, 13, 4326. [Google Scholar] [CrossRef]
  19. Sun, R.; Chen, S.; Su, H. Climate dynamics of the spatiotemporal changes of vegetation NDVI in northern China from 1982 to 2015. Remote Sens. 2021, 13, 187. [Google Scholar] [CrossRef]
  20. Kalisa, W.; Igbawua, T.; Henchiri, M.; Ali, S.; Zhang, S.; Bai, Y.; Zhang, J. Assessment of climate impact on vegetation dynamics over East Africa from 1982 to 2015. Sci. Rep. 2019, 9, 16865. [Google Scholar] [CrossRef]
  21. Yang, X.; Li, X.; Wang, X.; Ding, F.; Chen, F.; Wang, J.; Zhang, X.; Zhang, Y. Meta-analysis of the correlation between vegetation and precipitation in the temperate deserts of the Northern Hemisphere over the last 40 years. Ecol. Indic. 2022, 142, 109269. [Google Scholar] [CrossRef]
  22. Sharma, M.; Bangotra, P.; Gautam, A.S.; Gautam, S. Sensitivity of normalized difference vegetation index (NDVI) to land surface temperature, soil moisture and precipitation over district Gautam Buddh Nagar, UP, India. Stoch. Environ. Res. Risk Assess. 2022, 36, 1779–1789. [Google Scholar] [CrossRef]
  23. Liu, L.; Gou, X.; Wang, X.; Yang, M.; Qie, L.; Pang, G.; Wei, S.; Zhang, F.; Li, Y.; Wang, Q.; et al. Relationship between extreme climate and vegetation in arid and semi-arid mountains in China: A case study of the Qilian Mountains. Agric. For. Meteorol. 2024, 348, 109938. [Google Scholar] [CrossRef]
  24. Li, X.; Wang, Y.; Zhao, Y.; Zhai, J.; Liu, Y.; Han, S.; Liu, K. Research on the impact of climate change and human activities on the NDVI of arid areas—A case study of the Shiyang River Basin. Land 2024, 13, 533. [Google Scholar] [CrossRef]
  25. Zheng, K.; Tan, L.; Sun, Y.; Wu, Y.; Duan, Z.; Xu, Y.; Gao, C. Impacts of climate change and anthropogenic activities on vegetation change: Evidence from typical areas in China. Ecol. Indic. 2021, 126, 107648. [Google Scholar] [CrossRef]
  26. Becerril-Pina, R.; Mastachi-Loza, C.A.; Gonzalez-Sosa, E.; Diaz-Delgado, C.; Ba, K.M. Assessing desertification risk in the semi-arid highlands of central Mexico. J. Arid. Environ. 2015, 120, 4–13. [Google Scholar] [CrossRef]
  27. Evans, J.; Geerken, R. Discrimination between climate and human-induced dryland degradation. J. Arid. Environ. 2004, 57, 535–554. [Google Scholar] [CrossRef]
  28. Li, P.; Wang, J.; Liu, M.; Xue, Z.; Bagherzadeh, A.; Liu, M. Spatio-temporal variation characteristics of NDVI and its response to climate on the Loess Plateau from 1985 to 2015. CATENA 2021, 203, 105331. [Google Scholar] [CrossRef]
  29. Mehmood, K.; Anees, S.A.; Rehman, A.; Pan, S.; Tariq, A.; Zubair, M.; Liu, Q.; Rabbi, F.; Khan, K.A.; Luo, M. Exploring spatiotemporal dynamics of NDVI and climate-driven responses in ecosystems: Insights for sustainable management and climate resilience. Ecol. Inform. 2024, 80, 102532. [Google Scholar] [CrossRef]
  30. Yang, S.; Zhao, Y.; Yang, D.; Lan, A. Analysis of vegetation NDVI changes and driving factors in the Karst concentration distribution area of Asia. Forests 2024, 15, 398. [Google Scholar] [CrossRef]
  31. Wang, J.F.; Zhang, T.L.; Fu, B.J. A measure of spatial stratified heterogeneity. Ecol. Indic. 2016, 67, 250–256. [Google Scholar] [CrossRef]
  32. Wang, J.; Xu, C. Geodetector: Principle and prospective. Acta Geogr. Sin. 2017, 72, 116–134. (In Chinese) [Google Scholar]
  33. Liu, C.; Dong, X.; Liu, Y. Changes of NPP and their relationship to climate factors based on the transformation of different scales in Gansu, China. CATENA 2015, 125, 190–199. [Google Scholar] [CrossRef]
  34. Jin, K.; Wang, F.; Li, P. Responses of Vegetation Cover to Environmental Change in Large Cities of China. Sustainability 2018, 10, 270. [Google Scholar] [CrossRef]
  35. Lu, X.; Liang, Y.; Zhao, T.; Zhu, X.; Qin, Z. Decreasing soil erosion in South China with uncertainties driven by NDVI estimates. Ecol. Indic. 2025, 173, 113422. [Google Scholar] [CrossRef]
  36. Sen, P.K. Estimates of the Regression Coefficient Based on Kendall’s Tau. J. Am. Stat. Assoc. 1968, 63, 1379–1389. [Google Scholar] [CrossRef]
  37. Qi, X.Z.; Jia, J.H.; Liu, H.Y.; Lin, Z. Relative importance of climate change and human activities for vegetation changes on China’s silk road economic belt over multiple timescales. CATENA 2019, 180, 224–237. [Google Scholar] [CrossRef]
  38. Lie, Q.; Hu, Z.; Wang, J.; Zhang, Y.; Wu, G. Spatiotemporal Dynamics of NDVI in China from 1985 to 2015: Ecosystem Variation, Regional Differences, and Response to Climatic Factors. Acta Ecol. Sin. 2023, 43, 6378–6391. [Google Scholar]
  39. Jiang, L.L.; Guli, J.; Bao, A.M.; Guo, H.; Ndayisaba, F. Vegetation dynamics and responses to climate change and human activities in Central Asia. Sci. Total Environ. 2017, 600, 967–980. [Google Scholar] [CrossRef]
  40. Wang, F.; Ma, Y.; Darvishzadeh, R.; Han, C. Annual and Seasonal Trends of Vegetation Responses and Feedback to Temperature on the Tibetan Plateau since the 1980s. Remote Sens. 2023, 15, 2475. [Google Scholar] [CrossRef]
  41. Gao, W.; Zheng, C.; Liu, X.; Lu, Y.; Chen, Y.; Wei, Y.; Ma, Y. NDVI-based vegetation dynamics and their responses to climate change and human activities from 1982 to 2020: A case study in the Mu Us Sandy Land, China. Ecol. Indic. 2022, 137, 108745. [Google Scholar] [CrossRef]
  42. Shi, S.; Yu, J.; Wang, F.; Wang, P.; Zhang, Y.; Jin, K. Quantitative contributions of climate change and human activities to vegetation changes over multiple time scales on the Loess Plateau. Sci. Total Environ. 2021, 755, 142419. [Google Scholar] [CrossRef] [PubMed]
  43. Zhao, X.; Tan, S.; Li, Y.; Wu, H.; Wu, R. Quantitative analysis of fractional vegetation cover in southern Sichuan urban agglomeration using optimal parameter geographic detector model, China. Ecol. Indic. 2024, 158, 111529. [Google Scholar] [CrossRef]
  44. Stow, D.; Petersen, A.; Hope, A.; Engstrom, R.; Coulter, L. Greenness trends of Arctic tundra vegetation in the 1990s: Comparison of two NDVI data sets from NOAA AVHRR systems. Int. J. Remote Sens. 2010, 28, 4807–4822. [Google Scholar] [CrossRef]
  45. Han, J.C.; Huang, Y.; Zhang, H.; Wu, X. Characterization of elevation and land cover dependent trends of NDVI variations in the Hexi region, northwest China. J. Environ. Manag. 2019, 232, 1037–1048. [Google Scholar] [CrossRef]
  46. Zhang, Q.; Kong, D.; Singh, V.P.; Shi, P. Response of vegetation to different time-scales drought across China: Spatiotemporal patterns, causes and implications. Glob. Planet. Change 2017, 152, 1–11. [Google Scholar] [CrossRef]
  47. Shang, J.; Zhang, Y.; Peng, Y.; Huang, Y.; Zhu, L.; Wu, Z.; Wang, J.; Cui, Y. Climate change drives NDVI variations at multiple spatiotemporal levels rather than human disturbance in Northwest China. Environ. Sci. Pollut. Res. 2022, 29, 13782–13796. [Google Scholar] [CrossRef] [PubMed]
  48. Yin, X.; Feng, Q.; Zheng, X.; Wu, X.; Zhu, M.; Sun, F.; Li, Y. Assessing the impacts of irrigated agriculture on hydrological regimes in an oasis-desert system. J. Hydrol. 2021, 594, 125976. [Google Scholar] [CrossRef]
  49. Lü, Y.; Zhang, L.; Feng, X.; Zeng, Y.; Fu, B.; Yao, X.; Li, J.; Wu, B. Recent ecological transitions in China: Greening, browning and influential factors. Sci. Rep. 2015, 5, 8732. [Google Scholar] [CrossRef]
  50. Wang, J.; Wu, T.; Li, Q.; Wang, S. Quantifying the effect of environmental drivers on water conservation variation in the eastern Loess Plateau, China. Ecol. Indic. 2021, 125, 107493. [Google Scholar] [CrossRef]
  51. Song, D.; Hu, Z.; Zeng, J.; Sun, H. Influence of mining on vegetation in semi-arid areas of western China based on the coupling of above ground and below ground–A case study of Daliuta coalfield. Ecol. Indic. 2024, 161, 111964. [Google Scholar] [CrossRef]
  52. He, C.; James, L.A. Watershed science: Linking hydrological science with sustainable management of river basins. Sci. China Earth Sci. 2021, 64, 677–690. [Google Scholar] [CrossRef]
  53. Zhan, T.; Zhao, W.; Feng, S.; Hua, T. Plant community traits respond to grazing exclusion duration in alpine meadow and alpine steppe on the Tibetan plateau. Front. Plant Sci. 2022, 13, 863246. [Google Scholar] [CrossRef] [PubMed]
  54. Guo, J.; Liao, W.; Qimuge, H.; Xu, Y.; Wang, J.; Narisu. Seasonal analysis of spatial and temporal variations in NDVI and its driving factors in Inner Mongolia during the vegetation growing season (1999–2019). Front. For. Glob. Change 2025, 8, 1555385. [Google Scholar] [CrossRef]
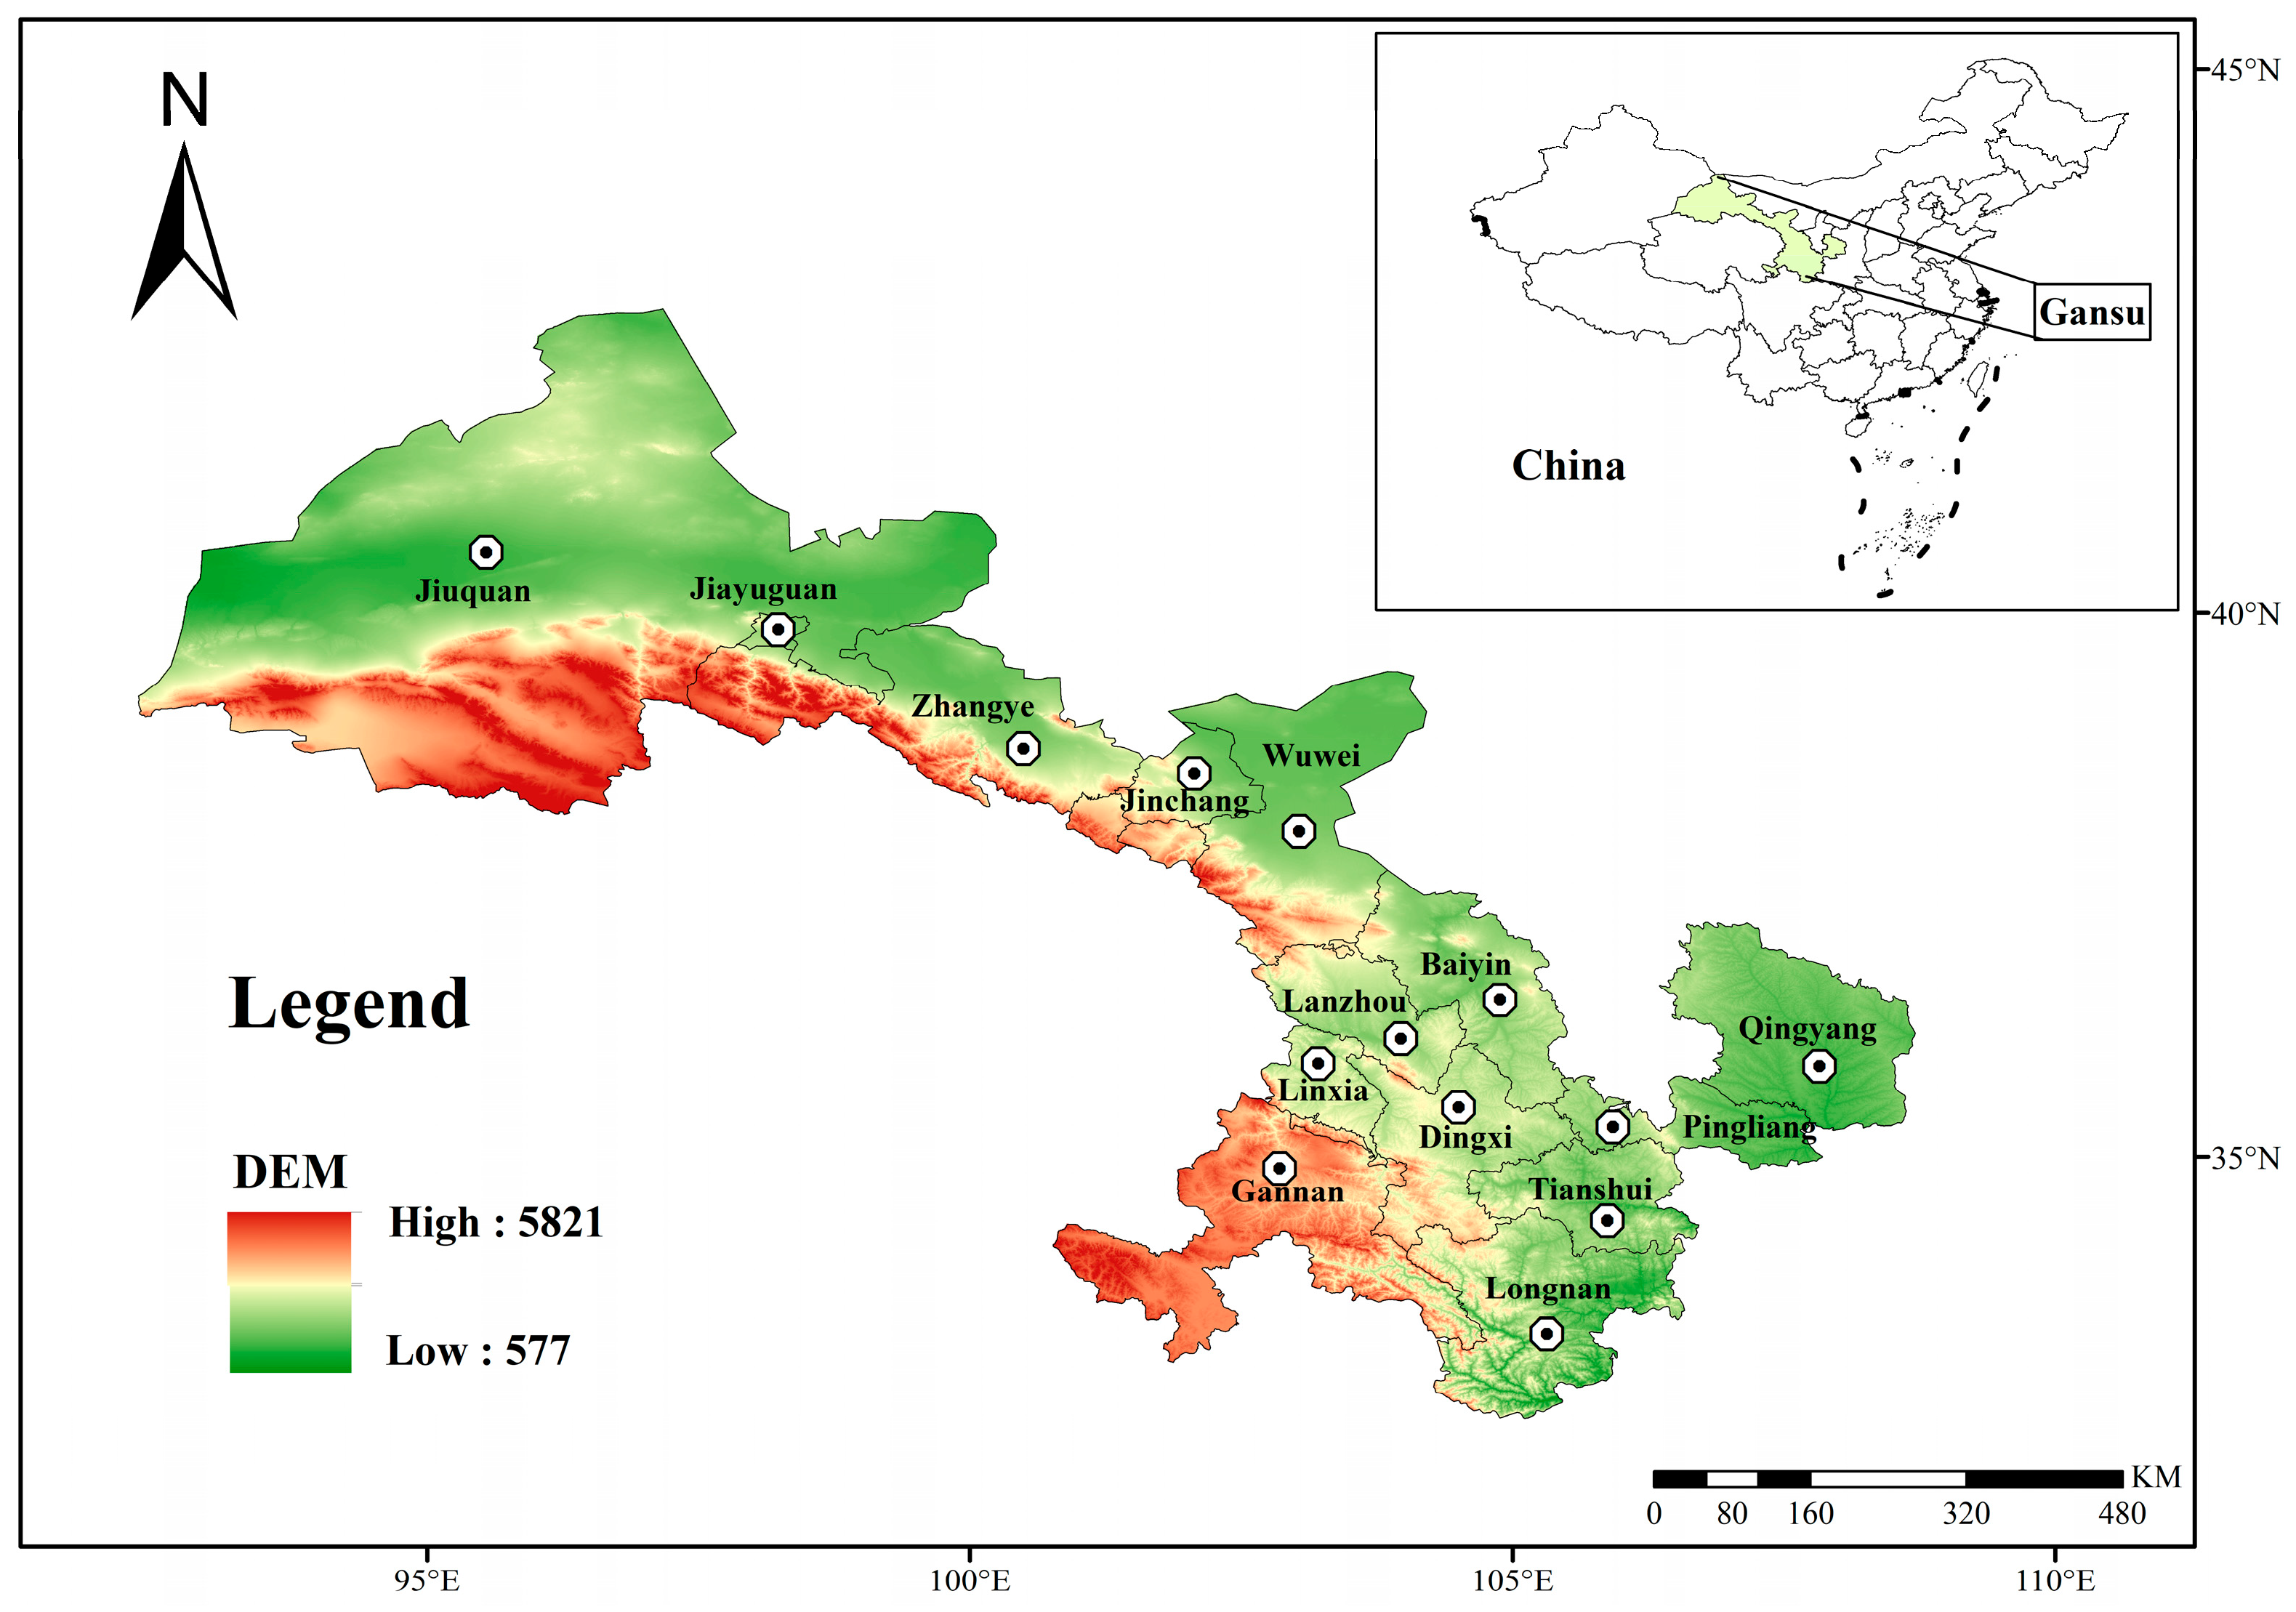
Figure 1. Overview of the study area.
Land 14 02184 g001
Figure 2. Interannual variation in NDVI during the growing season in Gansu Province from 2000 to 2022.
Land 14 02184 g002
Figure 3. Spatial Distribution of NDVI in Gansu Province from 2000 to 2022.
Land 14 02184 g003
Figure 4. Spatio-temporal variation trend of NDVI in Gansu Province from 2000 to 2022. (A) Sen Trends, (B) NDVI change trend type.
Land 14 02184 g004
Figure 5. Hurst Index of Vegetation NDVI in Gansu Province and its future changing trend. (A) Hurst Index Class, (B) NDVI future trend types.
Land 14 02184 g005
Figure 6. Spatial distribution of the impact of climate change (A) and human activities (B) on vegetation restoration in Gansu Province from 2000 to 2022.
Land 14 02184 g006
Figure 7. Spatial distribution of driving factors for NDVI changes in Gansu Province (CC and HA refer to climate change and human activities, respectively).
Land 14 02184 g007
Figure 8. Spatial distribution of the contribution rates of climate change (A) and human activities (B) to the NDVI changes in Gansu Province from 2000 to 2022.
Land 14 02184 g008
Figure 9. Partial Correlation coefficient (AC) and significance of partial correlation (DF) between NDVI and climate factors in Gansu Province from 2000 to 2022.
Land 14 02184 g009
Figure 10. GDP and HF partial correlation between NDVI and them in Gansu Province.
Land 14 02184 g010
Figure 11. Changes in the q values of each factor from 2000 to 2022.
Land 14 02184 g011
Figure 12. The influence of the interaction of each factor from 2000 to 2022.
Land 14 02184 g012
Table 1. Data sources.
Data TypeFactorData ContentYearResolutionData Source
Remote sensing dataYMODIS13 A3 NDVI2000–20221 KMhttps://ladsweb.modaps.eosdis.nasa.gov/search/
(accessed on 18 March 2025)
Climate dataX1Annual total precipitation2000–20221 KMhttps://data.tpdc.ac.cn/
X2Annual average temperature2000–20221 KM
X3Annual average solar radiation2000–20221 KMhttps://power.larc.nasa.gov/
Terrain dataX4Altitude20221 KMhttps://www.gscloud.cn/
X5Slope20221 KM
X6Slope direction20221 KM
Land cover dataX7Land use type2000–20221 KMhttps://doi.org/10.5281/zenodo.15853565 (accessed on 20 March 2025)
X8River density2000–20221 KMhttps://download.geofabrik.de/ (accessed on 20 March 2025)
Human factorsX9Population density2000–20221 KMhttps://landscan.ornl.gov/
X10GDP2000–20221 KMhttps://data.tpdc.ac.cn/
X11Human activity footprint2000–20201 KMhttps://www.x-mol.com/groups/li_xuecao/news/48145 (accessed on 25 March 2025)
Table 2. Significant Trends.
β|Z|Trend Category
β > 02.58 < ZExtremely significant improvement
1.96 < Z ≤ 2.58Significant improvement
0 < Z ≤ 1.96Slightly significant improvement
β = 0ZNo change
β < 00 < Z ≤ 1.96Micro-significant degradation
1.96 < Z ≤ 2.58Significant degradation
2.58 < ZExtremely significant degradation
Table 3. Identification criterion and contribution calculation of the drivers of NDVI change.
Slope(NDVIobs) aDriving
Factors
The Classification Criteria of Driving FactorsContribution Rate of Driving Factors (%)
Slope(NDVICC) bSlope(NDVIHA) cClimate changeHuman activities
>0CC&HA>0>0 s l o p e N D V I C C s l o p e N D V I o b s s l o p e N D V I H A s l o p e N D V I o b s
CC>0<01000
HA<0>00100
<0CC&HA<0<0 s l o p e N D V I C C s l o p e N D V I o b s s l o p e N D V I H A s l o p e N D V I o b s
CC<0>01000
HA>0<00100
a slope of the observed NDVI trend, b Slope of the climate-driven NDVI trend, c Slope of the human activity-driven NDVI trend.
Table 4. Type of independent variable interaction.
Interaction TypeJudgment Interval
Two-factor enhancement q ( X n X m ) > m a x [ q ( X n ) , q ( X m ) ]
Nonlinear enhancement q ( X n X m ) > q ( X n ) + q ( X m )
Single-factor nonlinear attenuation m i n q X n , q X m < q X n X m < m a x q X n , q X m
Nonlinear weakening q X n X m < m i n q X n , q X m
Independent of each other q X n X m = q X n + q X m
Table 5. Development Direction and Future Change Trend Proportion of NDVI in Gansu Province.
Development DirectionFuture Changing TrendArea Proportion (%)
Continuous degradationStrong persistent degradation0.11
Weak persistent degradation0.72
There was improvement in the past, but a
regressive trend in the future
Anti-strong continuous improvement8.15
Anti-weakness continuous improvement43.32
The past has deteriorated, but the future is an
improving trend
Anti-weak continuous degradation1.74
Anti-strong persistent degradation0.46
Continuous improvementWeak continuous improvement17.62
Strong and continuous improvement1.19
Basically stable26.69
Table 6. Ranking of interaction influence in each year.
YearRanking of Interaction Influence (Top 4 Factors)
2000X7 ∩ X1 > X11 ∩ X1 > X9 ∩ X1 > X2 ∩ X1
2005X7 ∩ X1 > X11 ∩ X1 > X9 ∩ X1 > X4 ∩ X1
2010X7 ∩ X1 > X11 ∩ X1 > X9 ∩ X1 > X4 ∩ X1
2015X7 ∩ X1 > X11 ∩ X1 > X9 ∩ X1 > X2 ∩ X1
2022X7 ∩ X1 > X11 ∩ X1 = X9 ∩ X1 > X7 ∩ X3
Disclaimer/Publisher’s Note: The statements, opinions and data contained in all publications are solely those of the individual author(s) and contributor(s) and not of MDPI and/or the editor(s). MDPI and/or the editor(s) disclaim responsibility for any injury to people or property resulting from any ideas, methods, instructions or products referred to in the content.