1. Introduction
Coastal cities have constituted decisive spatial focal points in urbanization processes since the early periods of human settlement due to their advantages in transportation, trade, and access to natural resources [
1]. Throughout the Ancient and Medieval periods, urban planning was shaped around compact urban cores in which commercial, public, and administrative functions developed in an integrated manner around ports; urban centers were predominantly located in direct relation to the coastline [
2,
3,
4]. During this period, coastal cities exhibited a spatial structure characterized by functional continuity with the sea, pedestrian-scale development, and relatively low density [
5].
With the Industrial Revolution, transformations in modes of production, advances in transportation technologies, and the expansion of global trade volumes fundamentally altered planning approaches in coastal cities [
6]. As port infrastructures expanded and industrial facilities became integrated into coastal areas, the traditional relationship between the urban center and the coastline was redefined; coastal zones increasingly came under the pressure of production- and logistics-oriented uses [
7]. This process intensified spatial fragmentation within coastal cities and directed planning practices toward balancing economic development with environmental and social impacts [
8,
9].
The spatial and functional transformation initiated by the Industrial Revolution decisively shaped the position of coastal cities within global production and circulation networks throughout the twentieth century [
10]. Today, the concentration of port activities, logistics, tourism, and service sectors within the same spatial framework has transformed coastal cities into areas with high rent potential and excessive agglomeration of economic activities [
11,
12]. This economic concentration exerts strong pressure on land-use decisions in urban planning and generates development dynamics that frequently conflict with principles of public access, environmental quality, and social cohesion in coastal areas [
13,
14,
15].
One of the fundamental problems accompanying economic concentration is the increasing spatial pressure experienced by coastal cities. Due to limited land availability, natural thresholds, and sensitive ecosystems, urban growth is constrained both horizontally and vertically; this leads to increased building density, reduced physical and visual access to the coastline, and the weakening of coastal–urban integration [
16,
17,
18,
19,
20]. While growing spatial pressure and environmental factors render coastal cities more vulnerable to the impacts of climate change, they also necessitate that planning processes move beyond purely engineering-based solutions and adopt integrated approaches incorporating ecosystem-based strategies, green–blue infrastructure systems, and adaptation measures [
21,
22].
In addition to economic and institutional dynamics, natural and geographical conditions also play a fundamental role in shaping the spatial structure and morphology of coastal cities. Factors such as coastal topography, the configuration of the coastline, geomorphological structures (e.g., cliffs, deltas, and narrow coastal plains), and natural thresholds significantly influence urban growth patterns, land-use distribution, and the physical relationship between the city and the sea. In many coastal cities, the sloping nature of the hinterland or the limited availability of flat land tends to concentrate urban development along narrow coastal corridors. Therefore, understanding the morphology of coastal cities requires consideration not only of socio-economic dynamics but also of the geographical and environmental conditions specific to each settlement.
The overlap of port, tourism, residential, and infrastructure functions within the same spatial framework in coastal cities creates a multi-layered planning field that extends coastal–urban relations beyond one-dimensional analyses [
6,
23,
24]. The tension between the logistical and industrial demands of ports and the expectations of tourism and residential areas regarding public access, environmental quality, and living environments positions coastal zones at the center of multi-actor and multi-scalar decision-making processes [
25,
26]. Therefore, coastal–urban relations should be addressed holistically through economic, environmental, social, and governance interactions rather than being limited to land-use considerations alone [
27]. While single-variable or sectoral approaches prove insufficient, multi-criteria evaluation frameworks provide a more comprehensive methodological basis for analyzing the balance among overlapping functions [
28].
The literature on coastal cities is largely structured around specific thematic and spatial foci. Prominent approaches include case-based studies that examine morphological transformation, port–city relations, or redevelopment processes through individual city examples [
1,
29,
30,
31,
32]; port-oriented research investigating the transformation of coastal cities in the context of port infrastructures, logistics networks, and global trade systems [
10,
13,
26,
33] and studies focusing on the role of coastal areas within the recreation and service sectors through the lens of tourism and economic functions [
34,
35,
36]. However, a substantial portion of this literature remains insufficient in addressing the simultaneity of port, industrial, tourism, and residential pressures together with planning, governance, and spatial quality dimensions within an integrated framework. Moreover, the predominance of studies limited to single cities or national scales complicates the comparative analysis of coastal cities operating under different planning regimes [
37,
38]. This limitation becomes more pronounced due to significant cross-country differences in the scale, institutional responsibility, and update frequency of spatial, environmental, and socio-economic data related to coastal areas [
38]. The lack of direct comparability among indicators related to land use, shoreline changes, port activities, and environmental pressures constrains methodological consistency in multi-country studies and increases the need for alternative, context-sensitive analytical approaches [
39,
40].
In comparative analyses of coastal cities, approaches based on absolute quantitative indicators tend to inadequately reflect local and context-specific dynamics, as they assess cities developed under different planning regimes and governance contexts using uniform criteria. This leads to an oversimplification of the complex spatial, governance, and environmental processes characterizing coastal cities and limits the potential for meaningful comparison. Consequently, there is a growing need for alternative analytical approaches based on relative (ordinal) indicators that enable the comparison of trends across different contexts [
41].
The Black Sea basin, as a semi-enclosed sea system, offers a distinctive spatial context in which environmental pressures are rapidly intensifying and coastal cities can be examined comparatively [
42,
43,
44,
45]. Despite sharing the same marine system, port, industrial, and tourism pressures emerge simultaneously in Black Sea coastal cities that have developed under different national planning regimes and governance models; this condition renders a multi-criteria, planning-oriented analysis of coastal–urban relations particularly meaningful [
46]. Within this framework, the aim of the study is to analyze coastal cities located in the Black Sea basin through a multi-criteria and comparative perspective, focusing on physical–morphological structure, demographic and scalar characteristics, economic and functional structure, transportation and accessibility, and urban quality and governance dimensions. The study seeks to evaluate coastal cities that have evolved under different national planning regimes and data production systems through relative (ordinal) indicators rather than absolute quantitative measures, thereby proposing an analytical approach that is context-sensitive, methodologically consistent, and suitable for cross-country comparison. In this respect, the objective is to provide an analytical basis for planning and policy debates by making visible the patterns of structural similarity and differentiation among coastal cities.
In addition to contemporary economic and spatial pressures, another important factor shaping the development of coastal cities is their historical development processes. The Black Sea basin has historically functioned as a strategic interface between Europe, Asia, and the Mediterranean world, hosting different stages of urban development shaped by ancient trade networks, the port systems of the Ottoman and Russian Empires, and later by socialist and post-socialist planning regimes.
These historical layers have led to the emergence of different urban morphologies, governance traditions, and economic orientations among coastal cities. For example, many cities along the northern and eastern coasts of the Black Sea were shaped by the industrial and port-based development strategies of the Soviet period, while some others developed around trade, tourism, or regional service functions within the framework of Ottoman or post-socialist planning approaches. Although the main objective of this study is to focus on the structural and comparative analysis of contemporary urban characteristics, considering these historical development processes is important for interpreting the spatial and functional differentiation among the cities.
2. Materials and Methods
2.1. Material
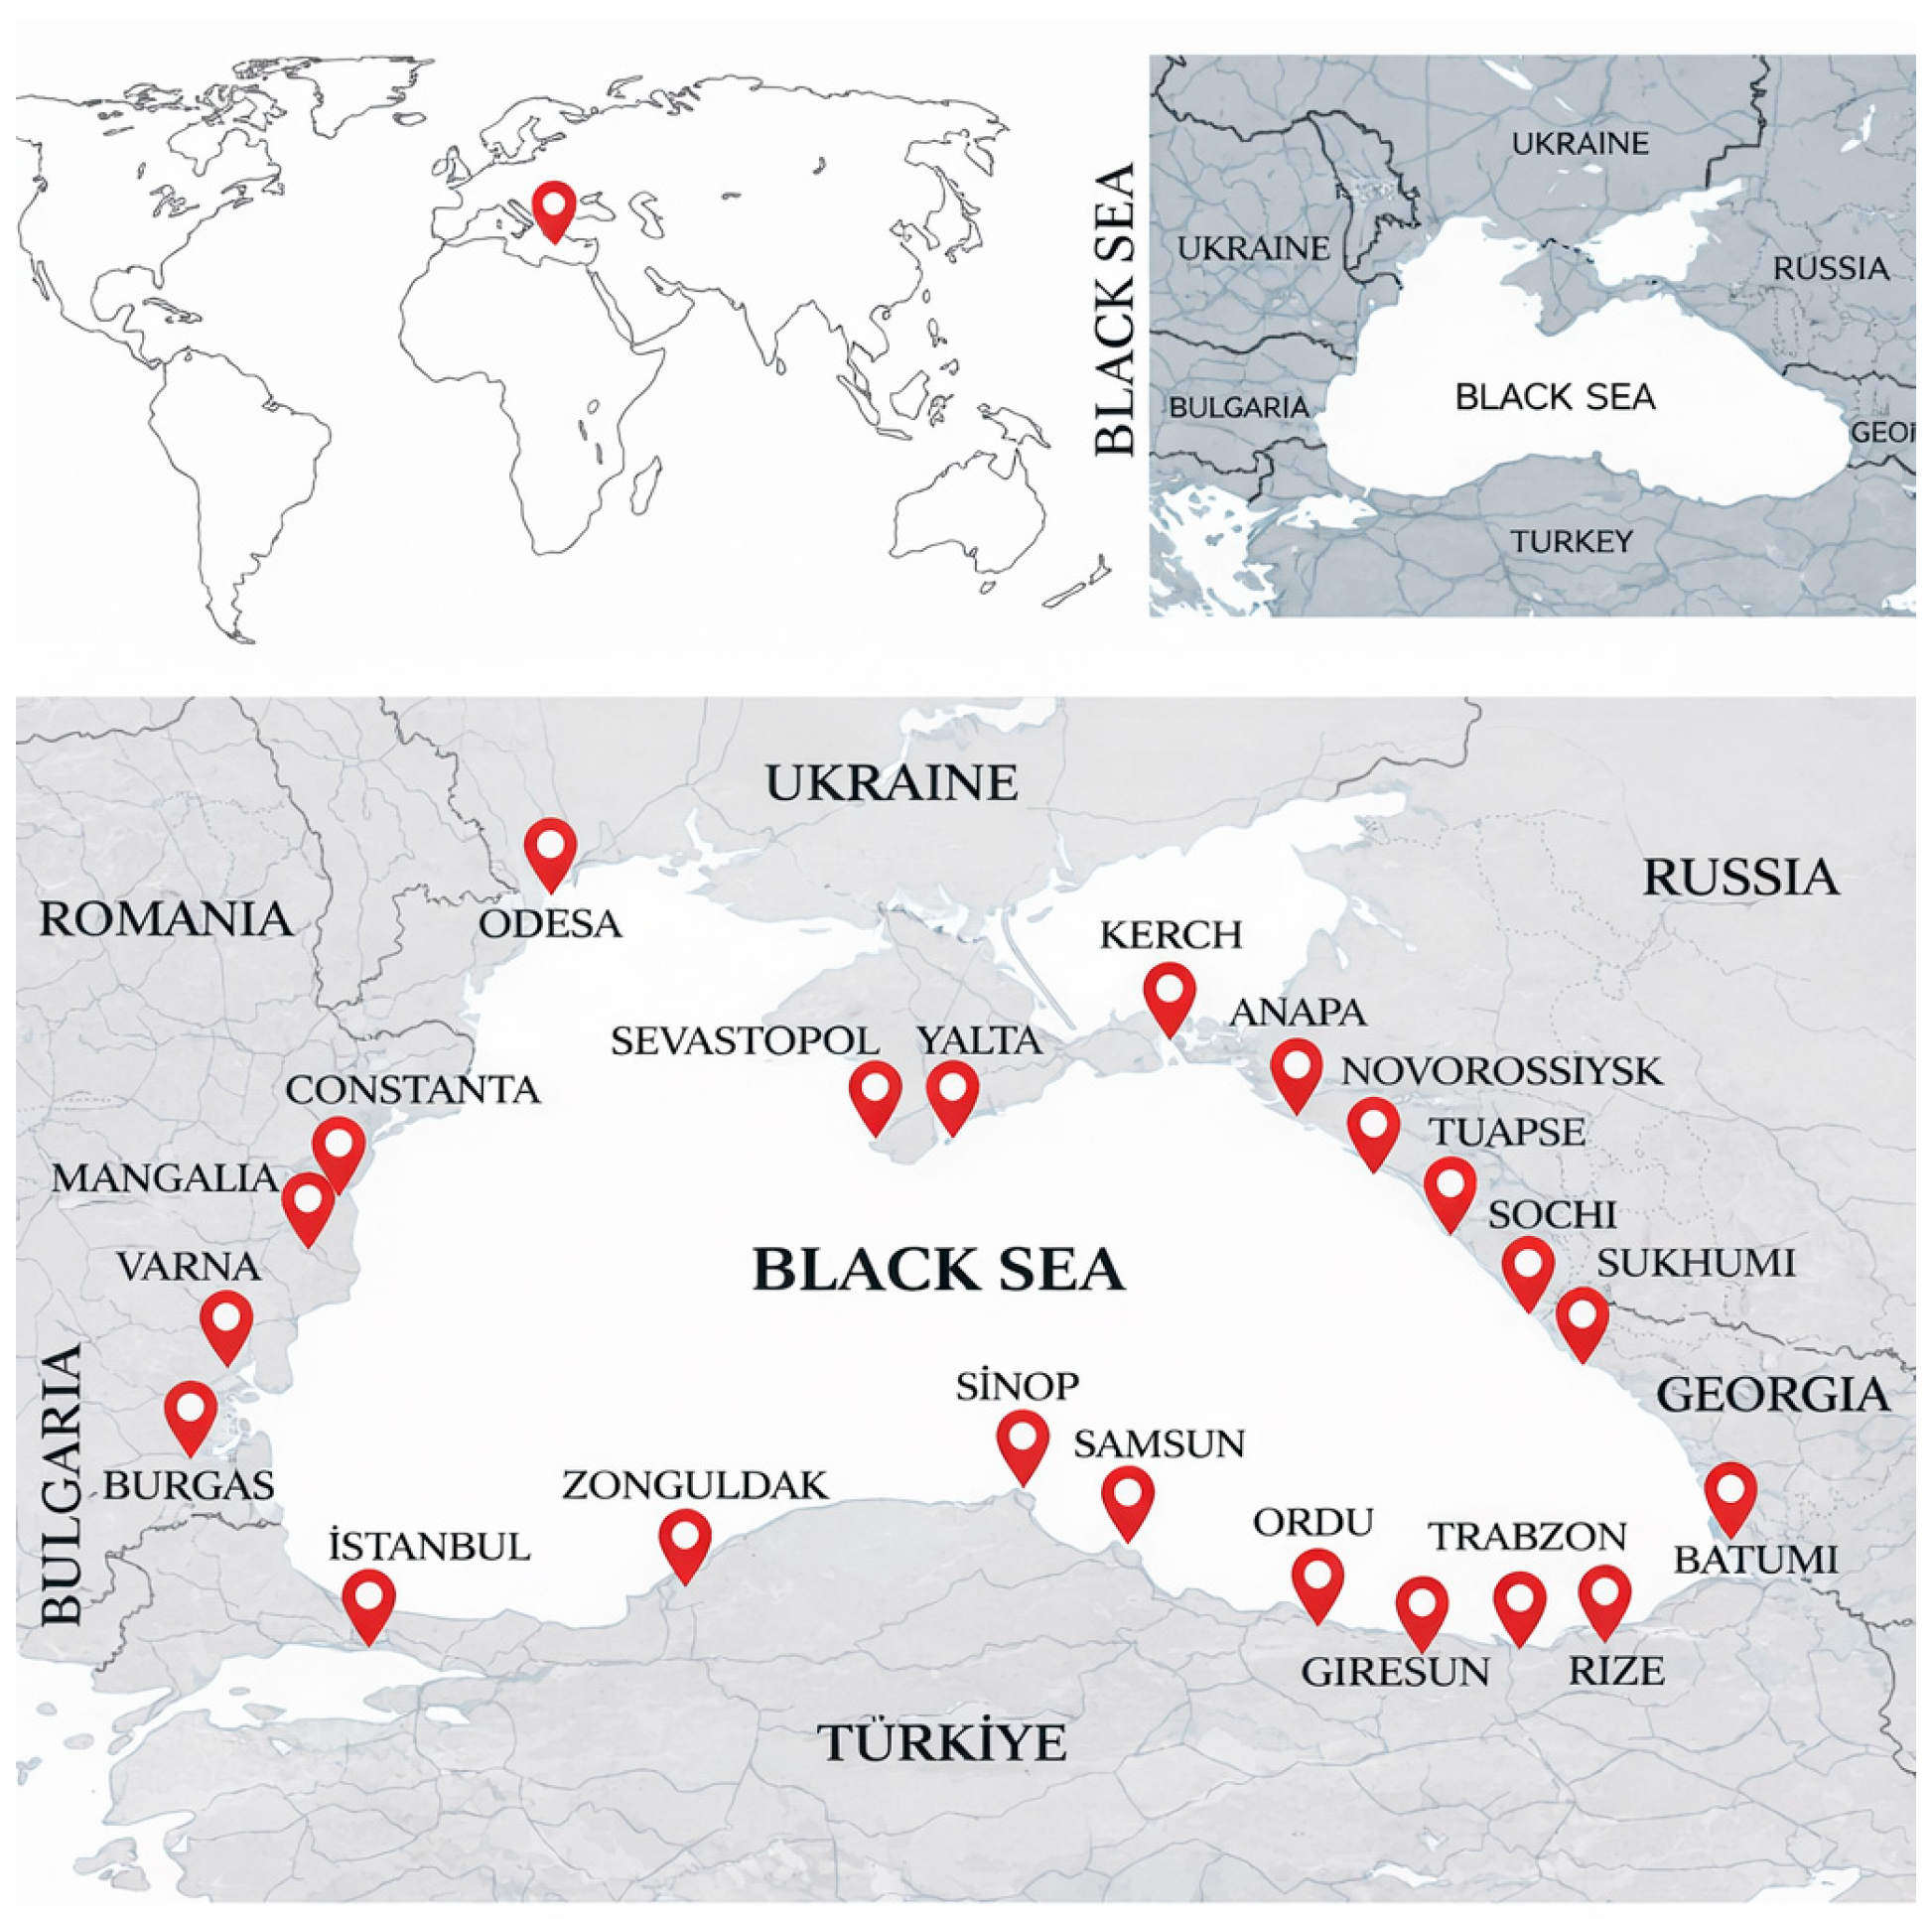
The study aims to comparatively examine the spatial, functional, and governance characteristics of coastal cities located along the Black Sea. Accordingly, the study area consists of urban settlements situated within the borders of Türkiye, Bulgaria, Romania, Ukraine, Russia, and Georgia that have a coastline along the Black Sea (
Figure 1). As a semi-enclosed sea system shaped historically by a network of port cities and currently subject to the simultaneous pressures of tourism, industrial, and logistics activities, the Black Sea provides a distinctive regional context for examining coastal–urban relations [
1].
In selecting the cities included in the study, a population threshold of 50,000 (commonly used in the literature to establish an analytical distinction between small settlements and cities) has been adopted. This threshold is considered to represent not only demographic size but also a minimum urban scale reflecting functional diversity, spatial complexity, institutional capacity, and the level of regional interaction. Pacione (2009) [
5] defines settlements with fewer than 50,000 inhabitants as small towns with limited functional diversity, emphasizing that settlements exceeding this threshold begin to exhibit a clearly articulated urban system logic. Similarly, Knox and McCarthy (2012) [
47] identify 50,000 inhabitants as the lower limit for medium-sized cities and note that settlements below this scale generate analytical ambiguities in multi-criteria comparative urban analyses. Roberts (2014) [
48] likewise argues that, in comparative urban studies, small settlements fail to provide sufficient differentiation in terms of infrastructure, governance, and economic diversity, and therefore excluding settlements below a certain population threshold from the sample is methodologically justified.
Other studies conducted in the context of coastal cities similarly indicate that population size is not merely a demographic indicator but also a variable directly associated with port activities, tourism capacity, the use of public coastal spaces, and the level of institutionalization of planning and governance mechanisms [
1,
49]. For this reason, coastal settlements with populations below 50,000 were excluded from the scope of the study on the grounds that coastal–urban interaction remains limited and that they do not provide sufficient structural diversity for multi-criteria comparison. Accordingly, the sample of the study consists of a total of 23 coastal cities located along the Black Sea coastal belt with populations exceeding 50,000. Although the selected cities are situated within different national planning systems and socio-economic contexts, they constitute an appropriate sample for comparative analysis due to their shared location within the same ecosystem and their concentration around a common spatial focus.
Some of the coastal cities examined in this study are located in a geography characterized by complex geopolitical contexts and historically contested regions. In this study, the identification and naming of the cities are based on widely used geographical references in the international academic literature and publicly available spatial data sources. The inclusion of these cities in the study does not imply the recognition of any political or legal position. The sample was selected solely based on their location along the Black Sea coastal belt and the analytical criteria defined in the study.
2.2. Method
Within the scope of the study, a comparative analysis of Black Sea coastal cities was conducted across five main thematic categories. As shown in
Table 1, the themes addressed in the study were formulated on the basis of a multidisciplinary body of literature on coastal cities, port–city relations, and the planning of urban coastal areas. Rather than relying on a single theoretical model, the analytical framework represents the intersection of various strands of research addressing urban morphology, urban scale, economic structure, accessibility and governance.
It is also acknowledged that the cities included in the study developed under different historical and political contexts, which have influenced their urban development processes. Cities along the Black Sea coast have historically evolved under various governance regimes, such as the Ottoman Empire, the Russian Empire, the Soviet Union, and post-socialist planning systems. These historical layers have created significant differences among cities in terms of port development strategies, industrialization processes, spatial planning traditions, and governance capacities. However, within the scope of this study, topics such as historical processes and cultural context have been excluded, and the cities were selected based on their current urban characteristics and according to the analytical criteria defined in the Materials section.
The literature review indicates that analyses of coastal cities have primarily addressed the physical and spatial relationship between the city and the coastline. Coastal continuity, topographic structure, coastal morphology, and patterns of development are widely recognized as key indicators revealing whether a city utilizes its coastal areas as public spaces or as functional interfaces. In particular, the port–city relations literature emphasizes the spatial discontinuities created by port and industrial functions within coastal areas, as well as the transformation potential of these spaces [
1,
49]. For this reason, the physical and morphological structure presented in
Table 1 has been adopted as the primary dimension of evaluation in the comparative analysis of coastal cities. The sub-criteria defined under the main category of physical and morphological structure, together with their descriptions, are presented in
Table 2.
The inclusion of criteria related to coastal morphology and topographic constraints in the analysis is based on acknowledging the determining role of natural geographical conditions in the spatial organization of coastal cities. The shape of the coastline, coastal geomorphology, and the availability of areas suitable for development behind the coast significantly influence the ways in which cities expand, densify, or integrate with coastal areas. In this context, the criteria categorized under physical and morphological structure (particularly A3 and A6) aim to represent the impact of geographical conditions on urban form within the framework of the comparative analysis.
The literature review has identified population size and scalar position as fundamental factors determining the functional diversity of coastal cities and their roles within regional systems. In the literature, population size is addressed not merely as a quantitative indicator but as a representation of a city’s service capacity, economic diversity, and governance strength [
5,
47]. Within the framework of the OECD’s Functional Urban Area (FUA) approach, it has been demonstrated that cities should be evaluated beyond administrative boundaries, taking into account metropolitan influence areas and daily mobility patterns [
52]. In this context, demographic and scalar characteristics have been defined as a distinct dimension of evaluation representing the position of coastal cities within the regional hierarchy and have been incorporated into the study through the sub-criteria and their definitions presented in
Table 3.
The research indicates that the economic and functional structure of coastal cities constitutes one of the fundamental dimensions shaping the spatial development patterns and urban identities of settlements. Port activities, industrial production, and tourism-based service economies often represent competing development orientations in the evolution of coastal cities [
1,
54]. While the port-related literature generally emphasizes the determining influence of port scale and industrial pressure on urban land-use patterns, studies in tourism geography highlight the dominance of the service sector in coastal cities and the transformative role of seasonality in shaping economic structures [
13]. The sub-criteria defined under the main category of economic and functional structure, along with their descriptions, are presented in
Table 4.
The literature indicates that the development of coastal cities is largely associated with the degree to which cities are integrated into national and international transportation networks. Transportation and accessibility are understood as a fundamental dimension shaping not only the physical connectivity of coastal cities but also their economic integration, functional diversity, and position within regional hierarchies [
8,
55]. In the case of port cities, the joint consideration of maritime, land, and air transportation systems is particularly important for understanding how cities are connected to global and regional networks [
78].
On the other hand, within the coastal cities literature, accessibility is assessed not only in terms of long-distance connections but also through the coherence of local transportation infrastructure and public transport systems provided along coastal areas. Coastal transportation infrastructure plays a crucial role in enabling the public use of shorelines, pedestrian access, and integration with urban circulation networks [
59,
61]. The sub-criteria defined under the main category of Transportation and Accessibility, together with their descriptions identified through the literature review, are presented in
Table 5.
Studies focused on the evaluation of coastal cities increasingly indicate that, beyond physical and functional characteristics, the dimensions of urban quality and governance play an ever more decisive role. In particular, the design of public coastal spaces, pedestrian priority, the integrity of the urban skyline, and the consistency of planning processes are addressed as factors that directly influence the level of livability and spatial sustainability of coastal cities [
57,
58,
59]. Accordingly, urban quality has been conceptualized not only as the quality of spatial design but also as encompassing the governance instruments and planning decisions through which these spaces are produced and maintained. In this sense, urban quality is treated as a distinct evaluative dimension that enables the comparative assessment of coastal cities in terms of planning capacity, public space production, and governance coherence (
Table 6).
The cities constituting the study sample were analyzed by being represented through ordinal indicators based on 24 criteria defined under the five main evaluation dimensions. As a substantial proportion of the indicators used in the study required the assessment of the physical, spatial, and functional characteristics of cities’ coastal areas, google earh (Pro 7.3) were employed as primary visual data sources during the data collection process. In particular, criteria such as coastal continuity, the presence of public coastal spaces, the distance between development and the shoreline, transportation infrastructure, and coastal–urban integration were evaluated through map-based visual inspection and spatial observation.
Map-based visual assessment approaches are widely used in urban studies for exploratory and relative analyses, particularly in contexts where quantitative and standardized datasets are limited or where cross-country comparability is low. The literature emphasizes that Google Maps and similar online geographic information platforms can be effectively utilized as secondary data sources and visual validation tools, especially in analyses of urban morphology, public space quality, and accessibility [
82].
Visual information obtained from Google Maps was not employed to generate absolute measurements; rather, it was used to inform an ordinal (0–1–2) indicator system developed to compare relative conditions across cities. In this way, the effects of inconsistencies among data production systems and measurement precision across different countries were reduced, and visually based assessments were treated, in line with the literature, as a supportive and exploratory data layer within multivariate analyses [
5,
83].
Each sub-criterion was coded on a 0–1–2 scale, representing low, medium, and high levels in a manner that reflects relative conditions among cities. This form of indicator was selected in accordance with the literature highlighting issues of data production systems and comparability across countries in urban studies [
5,
47]. Moreover, drawing on methodological arguments suggesting that relative differences may be more meaningful than absolute values in rank- and distance-based multivariate analyses [
83], the ordinal representation approach was adopted as an appropriate method for this study.
To enhance methodological transparency, the coding process was based on a structured assessment framework developed for each indicator. Scores of 0, 1, and 2 were assigned according to pre-determined comparative decision rules, representing relatively low, medium, and high levels among the cities. The coding process was supported by visual assessments using Google Maps, satellite imagery, and Street View, and, where necessary, supplemented with secondary sources. Particular attention was given to observable spatial features such as coastal continuity, the presence of public coastal areas, topographic constraints, transportation infrastructure, and the relationship of built-up areas with the coast. Repeated comparisons were conducted during the scoring process to ensure relative consistency across cities.
The coding process was carried out independently by the authors, and the results obtained after the initial assessment were compared. Any discrepancies between evaluations were discussed, and a consensus was reached to create the final dataset. This process contributed to the consistent application of the indicators across all cities.
No formal inter-coder reliability test was applied in this study. However, the scoring process was reviewed through repeated assessments and inter-city comparisons within the dataset. This may be considered a limitation of the study and could be strengthened in future research through independent multi-coder validation.
For the data represented through ordinal indicators, the multivariate analyses presented in
Table 7 were applied in accordance with their respective methodological rationales. Among these, NMDS, hierarchical clustering, MCA, Spearman rank correlation, and network analysis (
Table 7: Analyses 2, 3, and 7) constitute the core analytical framework of the study, while the Gower dissimilarity matrix, bootstrap validation, and rank-transformed PCA (Analyses 1, 4, 5, 6, and 8) were conducted as supporting and confirmatory analyses. This structure aims to ensure the exploratory robustness and methodological consistency of the typological and relational findings obtained.
Within this framework, an ordinal dataset consisting of 23 cities and 24 indicators was first constructed. Second, a Gower similarity matrix was calculated to account for the ordinal nature of the data. In the third step, non-metric multidimensional scaling (NMDS) analysis was applied to visualize the structural similarities among the cities. Fourth, hierarchical clustering analysis was performed using Ward’s method to identify city clusters. Finally, multiple correspondence analysis (MCA) and Spearman rank correlation analysis were conducted to examine the relationships among the indicators.
Comparative analysis of cities developed in different national contexts can have significant limitations when based solely on descriptive observations or single indicators. Therefore, multivariate analytical approaches are widely used in the urban studies literature to reveal structural patterns and relationships that cannot be easily identified through qualitative comparisons alone [
5,
83]. Techniques such as multidimensional scaling, cluster analysis, and correspondence analysis allow for the simultaneous evaluation of different dimensions of urban systems, helping to identify typologies and relational structures among cities. These approaches provide a particular analytical advantage in regional studies where cities located within the same environmental system have developed under different institutional and socio-economic conditions. In this context, the use of multivariate analytical techniques in this study aims to systematically reveal the structural similarities and differences among Black Sea coastal cities within a multidimensional framework.
Within the scope of the study, a city-to-city dissimilarity matrix was constructed using the Gower dissimilarity coefficient in order to provide a basis for the multi-criteria comparison of Black Sea coastal cities. The data employed in the analysis consist of a total of 24 sub-criteria representing physical, demographic, economic, transportation, and governance dimensions, all of which are defined through ordinal (0–1–2) and anchored indicators.
As in this study, when cities from different countries are analyzed jointly, the direct use of absolute quantitative data often generates comparability problems. Differences in data production systems, definitional frameworks, and measurement precision can render methods based on classical Euclidean distances misleading [
5,
47]. In response to this challenge, the Gower dissimilarity coefficient offers an appropriate methodological solution by enabling variables measured on different scales to be analyzed within a common analytical framework through internal standardization within a bounded value range [
84].
The Gower dissimilarity coefficient calculates the degree of dissimilarity between two observational units i and j using the following general formulation:
Here, p denotes the total number of variables, s
(ijk) represents the standardized similarity between observations i and j for variable k, and w
(ijk) indicates the variables included in the comparison [
84].
In this study, the Gower dissimilarity matrix constituted the core data structure representing relative similarity patterns among cities; this matrix was subsequently used as input for Non-metric Multidimensional Scaling (NMDS) and hierarchical clustering analyses employing the Ward linkage method. In this way, the typological comparison of coastal cities was conducted through multivariate methods that do not rely on linear assumptions and that prioritize relative differences.
In the second stage of the study, the Non-metric Multidimensional Scaling (NMDS) method was applied to the Gower dissimilarity matrix in order to exploratorily visualize the multidimensional inter-city similarity structure and to reveal its overall patterns. NMDS was not treated as a method that directly defines city typologies; rather, it was employed as a complementary tool that supports the interpretation of subsequent hierarchical clustering analyses by representing the relative positions and differentiation tendencies of cities within a two- or three-dimensional space.
The ordinal nature of the indicators used in the analysis and the emphasis on comparing cities based on their relative positions rather than absolute quantitative values render NMDS a method well aligned with the context of the study [
83]. Accordingly, NMDS was selected as a multidimensional scaling technique that is based on the rank order of relative dissimilarities among observations and does not require assumptions of linear relationships among variables [
85,
86].
NMDS aims to represent a multidimensional dissimilarity structure in a lower-dimensional space—typically two or three dimensions—while preserving the relative relationships among observations as closely as possible. In this representation process, the method seeks to minimize the mismatch between the original dissimilarity matrix and the distances obtained in the reduced-dimensional space. This mismatch is measured by the stress value. The stress function defined by Kruskal (1964) [
85] is generally expressed as follows:
Here, d(ij) denotes the inter-observation distance in the original dissimilarity matrix, while represents the distances obtained in the low-dimensional space produced by the NMDS solution.
In this study, the stress value calculated for the two-dimensional NMDS solution was 0.143. According to the interpretative thresholds proposed by Clarke (1993) [
86], this value indicates an acceptable level of two-dimensional representation. A stress value below 0.20 suggests that the relative inter-city similarity structure is captured to an interpretable degree within a two-dimensional plane. Accordingly, it was not considered necessary to proceed to higher-dimensional solutions in the analysis.
Within the scope of the study, hierarchical clustering analysis was employed to transform the dissimilarity structure derived from the inter-city Gower dissimilarity matrix into groups, using the Ward minimum-variance linkage method. The Ward method aims to generate more homogeneous subgroups composed of cities with similar attribute profiles by minimizing the increase in within-cluster variance at each agglomeration step [
83,
87].
In the Ward method, the increase in variance resulting from the merger of two clusters is defined as follows:
Here, and represent the number of observations in clusters A and B, respectively, while and denote the mean vectors of clusters A and B.
The use of Ward’s minimum-variance agglomeration rule in conjunction with the Gower dissimilarity matrix has been recognized in the literature as a pragmatic approach aimed at maximizing within-cluster homogeneity, particularly in typology studies conducted with mixed-scale and predominantly ordinal data [
83,
88,
89].
The stability of the cluster solution obtained through Hierarchical Clustering (Ward) analysis was tested during the analysis process by applying the bootstrap resampling method with 999 replications. In determining the optimal number of clusters, breaks in the fusion heights observed in the dendrogram, separation patterns in the NMDS space, and solution stability were evaluated jointly.
The bootstrap results indicate that the primary structural division distinguishing the cities is reproduced at a high level, suggesting that this upper-scale pattern is robust. In contrast, the support values of more refined sub-clusters are more variable, revealing that the micro-level boundaries of the typology are relatively sensitive. This finding is consistent with expectations in exploratory typology studies based on multi-criteria and ordinal indicators, and it necessitates interpreting the analyses in terms of relative positioning rather than rigid classifications [
83,
90,
91].
Another analytical component of the study is Multiple Correspondence Analysis (MCA). MCA was employed to jointly visualize the relationships between coastal city characteristics represented by ordinal indicators and the cities themselves. Together with NMDS and hierarchical clustering analyses, MCA was treated as an interpretative and complementary method aimed at understanding the combinations of criteria through which the identified city typologies were structured.
In this context, MCA was not considered a method that directly defines city typologies; rather, it was evaluated as a tool enabling the substantive interpretation of patterns identified through multivariate analyses. MCA provides a structure suitable for working with categorical and ordinal data and allows variables and observations to be represented simultaneously within the same analytical space. This feature enables the interpretation of the relationships between coastal cities and specific criterion levels within a common analytical plane.
During the analysis process, the levels of each sub-criterion (0–1–2) were treated as separate categories, and an indicator (disjunctive) matrix containing city–category relationships was constructed. MCA was performed on the basis of the chi-square (χ
2) distance calculated from this matrix. The fundamental measure used in the method, inertia, is defined as a normalized measure of the deviations between the observed and expected distributions, and the dimensions obtained in the analysis explain specific proportions of the total inertia [
92].
Mathematically, the total inertia in MCA is expressed as follows:
Here, represents the observed relative frequency, while and denote the row and column marginal proportions, respectively. The extracted dimensions are defined as the directions that explain the largest shares of this total inertia.
In the study, the results of MCA were used to visualize the relationships between cities and specific criterion levels within a two-dimensional plane and to qualitatively interpret the clustering results. The dimensions derived from MCA were evaluated within an explanatory and exploratory framework; the proportions of explained inertia were considered not in terms of absolute threshold values, but rather in relation to cross-analysis consistency and interpretability. This approach is consistent with the exploratory use of MCA widely adopted in social sciences and spatial planning research [
93,
94].
The Spearman rank correlation analysis conducted in the study was applied to examine the structural relationships among the ordinal (0–1–2) indicators used to characterize coastal cities. Spearman correlation is calculated on the basis of ranked values of variables and is capable of revealing non-linear yet monotonic relationships [
95,
96]. In this context, Spearman correlation analysis was treated as a complementary and interpretative tool aimed at understanding which co-variations among criteria underlie the multidimensional patterns identified through NMDS and hierarchical clustering [
83].
During the analytical process, the values assigned to cities for each criterion were transformed into ranks, and the relationships between pairs of criteria were calculated using Spearman’s rho (ρ) coefficient. The Spearman correlation coefficient is defined as follows [
97]:
Here, represents the difference between the ranks of the two variables for each observation, while denotes the number of observations. The coefficient ranges between −1 and +1; the magnitude of its absolute value indicates the strength of the monotonic relationship between the variables.
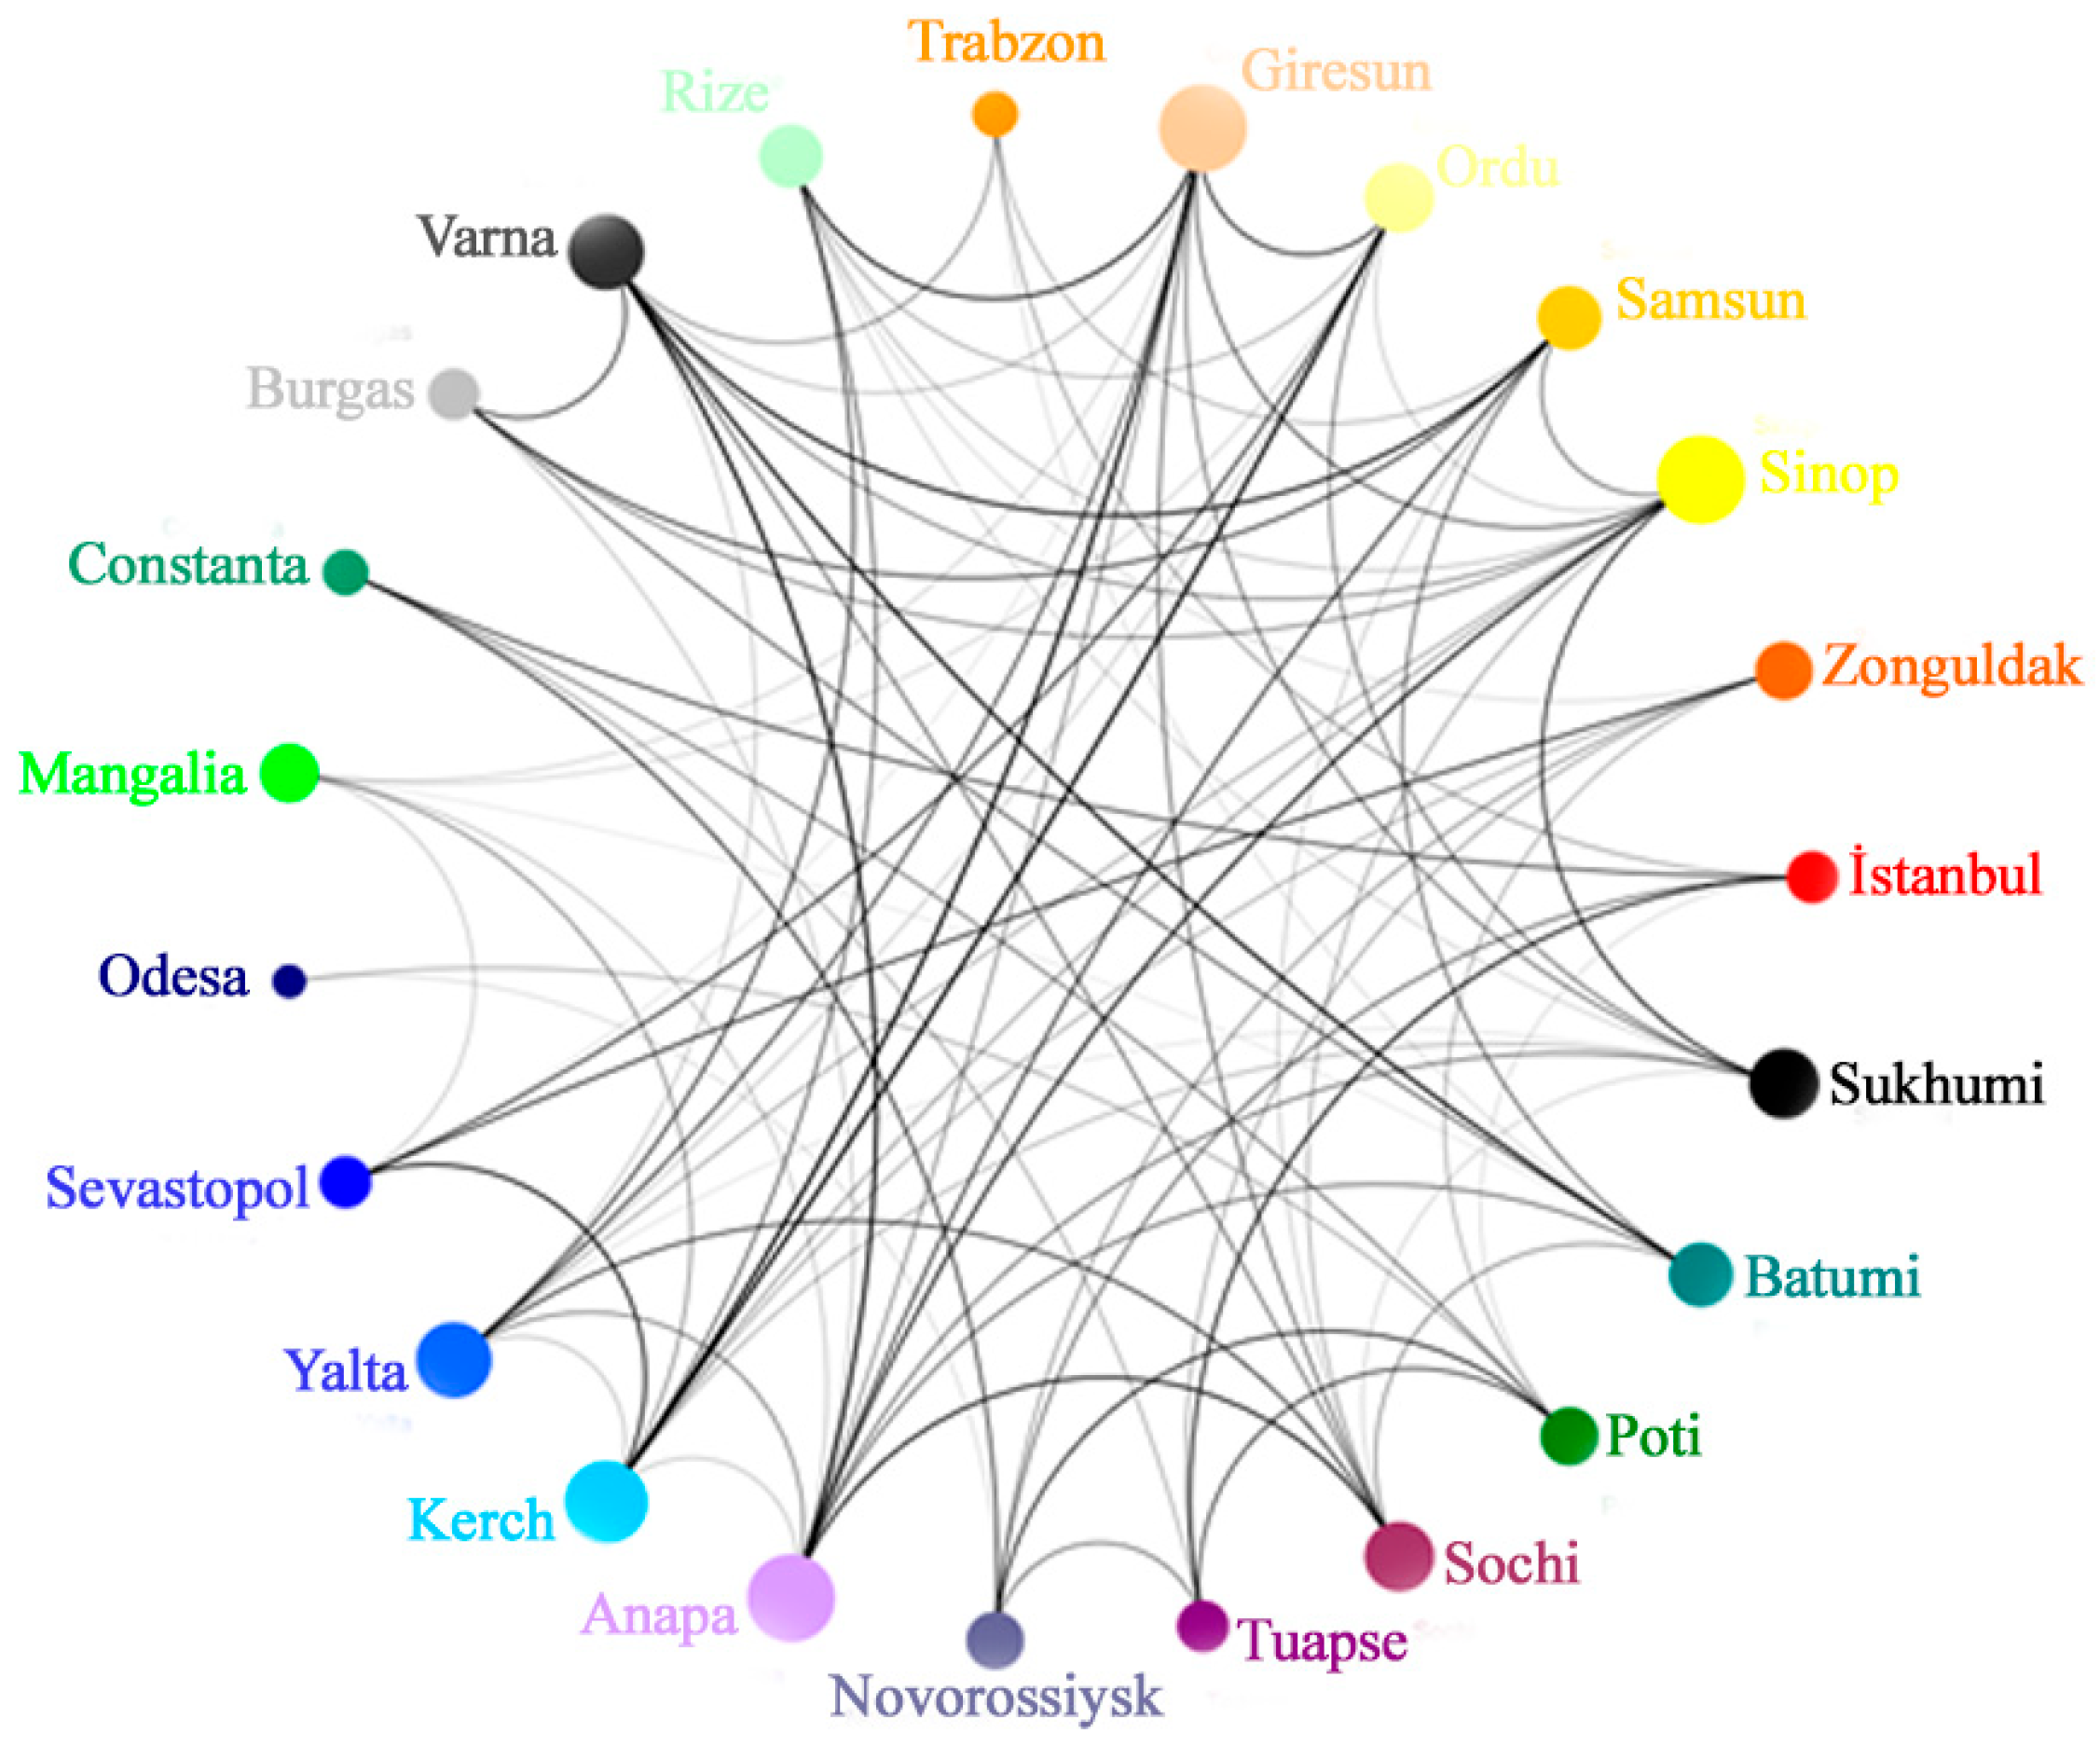
A correlation-based network analysis was employed as a complementary tool to NMDS and hierarchical clustering in order to visualize the structural patterns of multi-criteria similarity relationships among coastal cities. To retain only the strongest inter-criterion relationships, a 60% threshold was applied in the construction of the network. Node sizes represent the number of strong connections (edges) associated with each city, while edge thickness reflects the strength of the relationship.
The final analysis conducted in the study, rank-transformed Principal Component Analysis (PCA), was applied to test and support the multidimensional patterns identified through NMDS and hierarchical clustering by means of an independent linear method. PCA was not employed to directly define city typologies; rather, it was treated as a complementary analytical tool to assess the consistency of structural relationships derived from non-metric methods in terms of general orientations and dominant dimensions [
83,
98].
Because the variables used in the study are represented by ordinal (0–1–2) indicators rather than absolute quantitative measurements, the assumption of continuous interval- or ratio-scaled data required by classical PCA is not directly satisfied. For this reason, PCA was applied to the rank-transformed values of the variables. Rank transformation preserves the relative ordering of variables while reducing the influence of scale-sensitive differences, thereby rendering the linear structure of PCA more appropriate in the context of ordinal data [
83,
96].
During the analysis, observations for each variable were ranked in ascending order across cities, and these rank values—rather than the raw scores—were used as input for PCA. Following rank transformation, the classical PCA procedure was applied to the resulting data matrix; components were defined as the directions that best represent the covariance structure of the dataset [
99].
Rank-transformed Principal Component Analysis (PCA) was not implemented in this study to generate a typology; rather, it was used to evaluate whether the principal structural patterns identified through non-metric multivariate analyses (NMDS and hierarchical clustering (Ward)) could also be observed within a linear dimension-reduction framework. PCA was approached as a descriptive and exploratory method aimed at uncovering relational structures among variables and dominant gradients, rather than focusing on the absolute magnitude of explained variance [
98,
99,
100].
The primary objective of PCA is to obtain linear components that explain the total variance in the dataset. The mathematical foundation of PCA is based on the eigenvalue decomposition of the covariance (or correlation) matrix [
99]:
Here,
denotes the covariance (or correlation) matrix,
represents the k-th eigenvalue, and
corresponds to the associated eigenvector. Each principal component explains a specific portion of the total variance; in this study, components were evaluated on the basis of interpretability and their consistency with the results of other analyses [
98].
3. Results
In the first stage of the study, the characteristics of the cities were coded according to the previously defined criteria and entered into the dataset using the ordinal data system.
The fully coded dataset used in the analysis is presented in
Table 8. This table contains the ordinal data matrix for all cities and indicators used in the study and serves as the primary data source for the analytical processes, enhancing the reproducibility of the research.
When the group means calculated on the basis of the 24 ordinal indicators presented in
Table 8 are examined, a relative differentiation among the evaluation categories becomes evident. Accordingly, the economic and functional structure (Group C) exhibits the highest mean value (mean = 1.30). This is followed by physical and morphological structure (Group A; mean = 1.25) and transportation and accessibility (Group D; mean = 1.15). The mean value of the urban quality and governance indicators (Group E) was calculated as 1.10, while demographic and scalar characteristics (Group B) display the lowest mean (mean = 0.95).
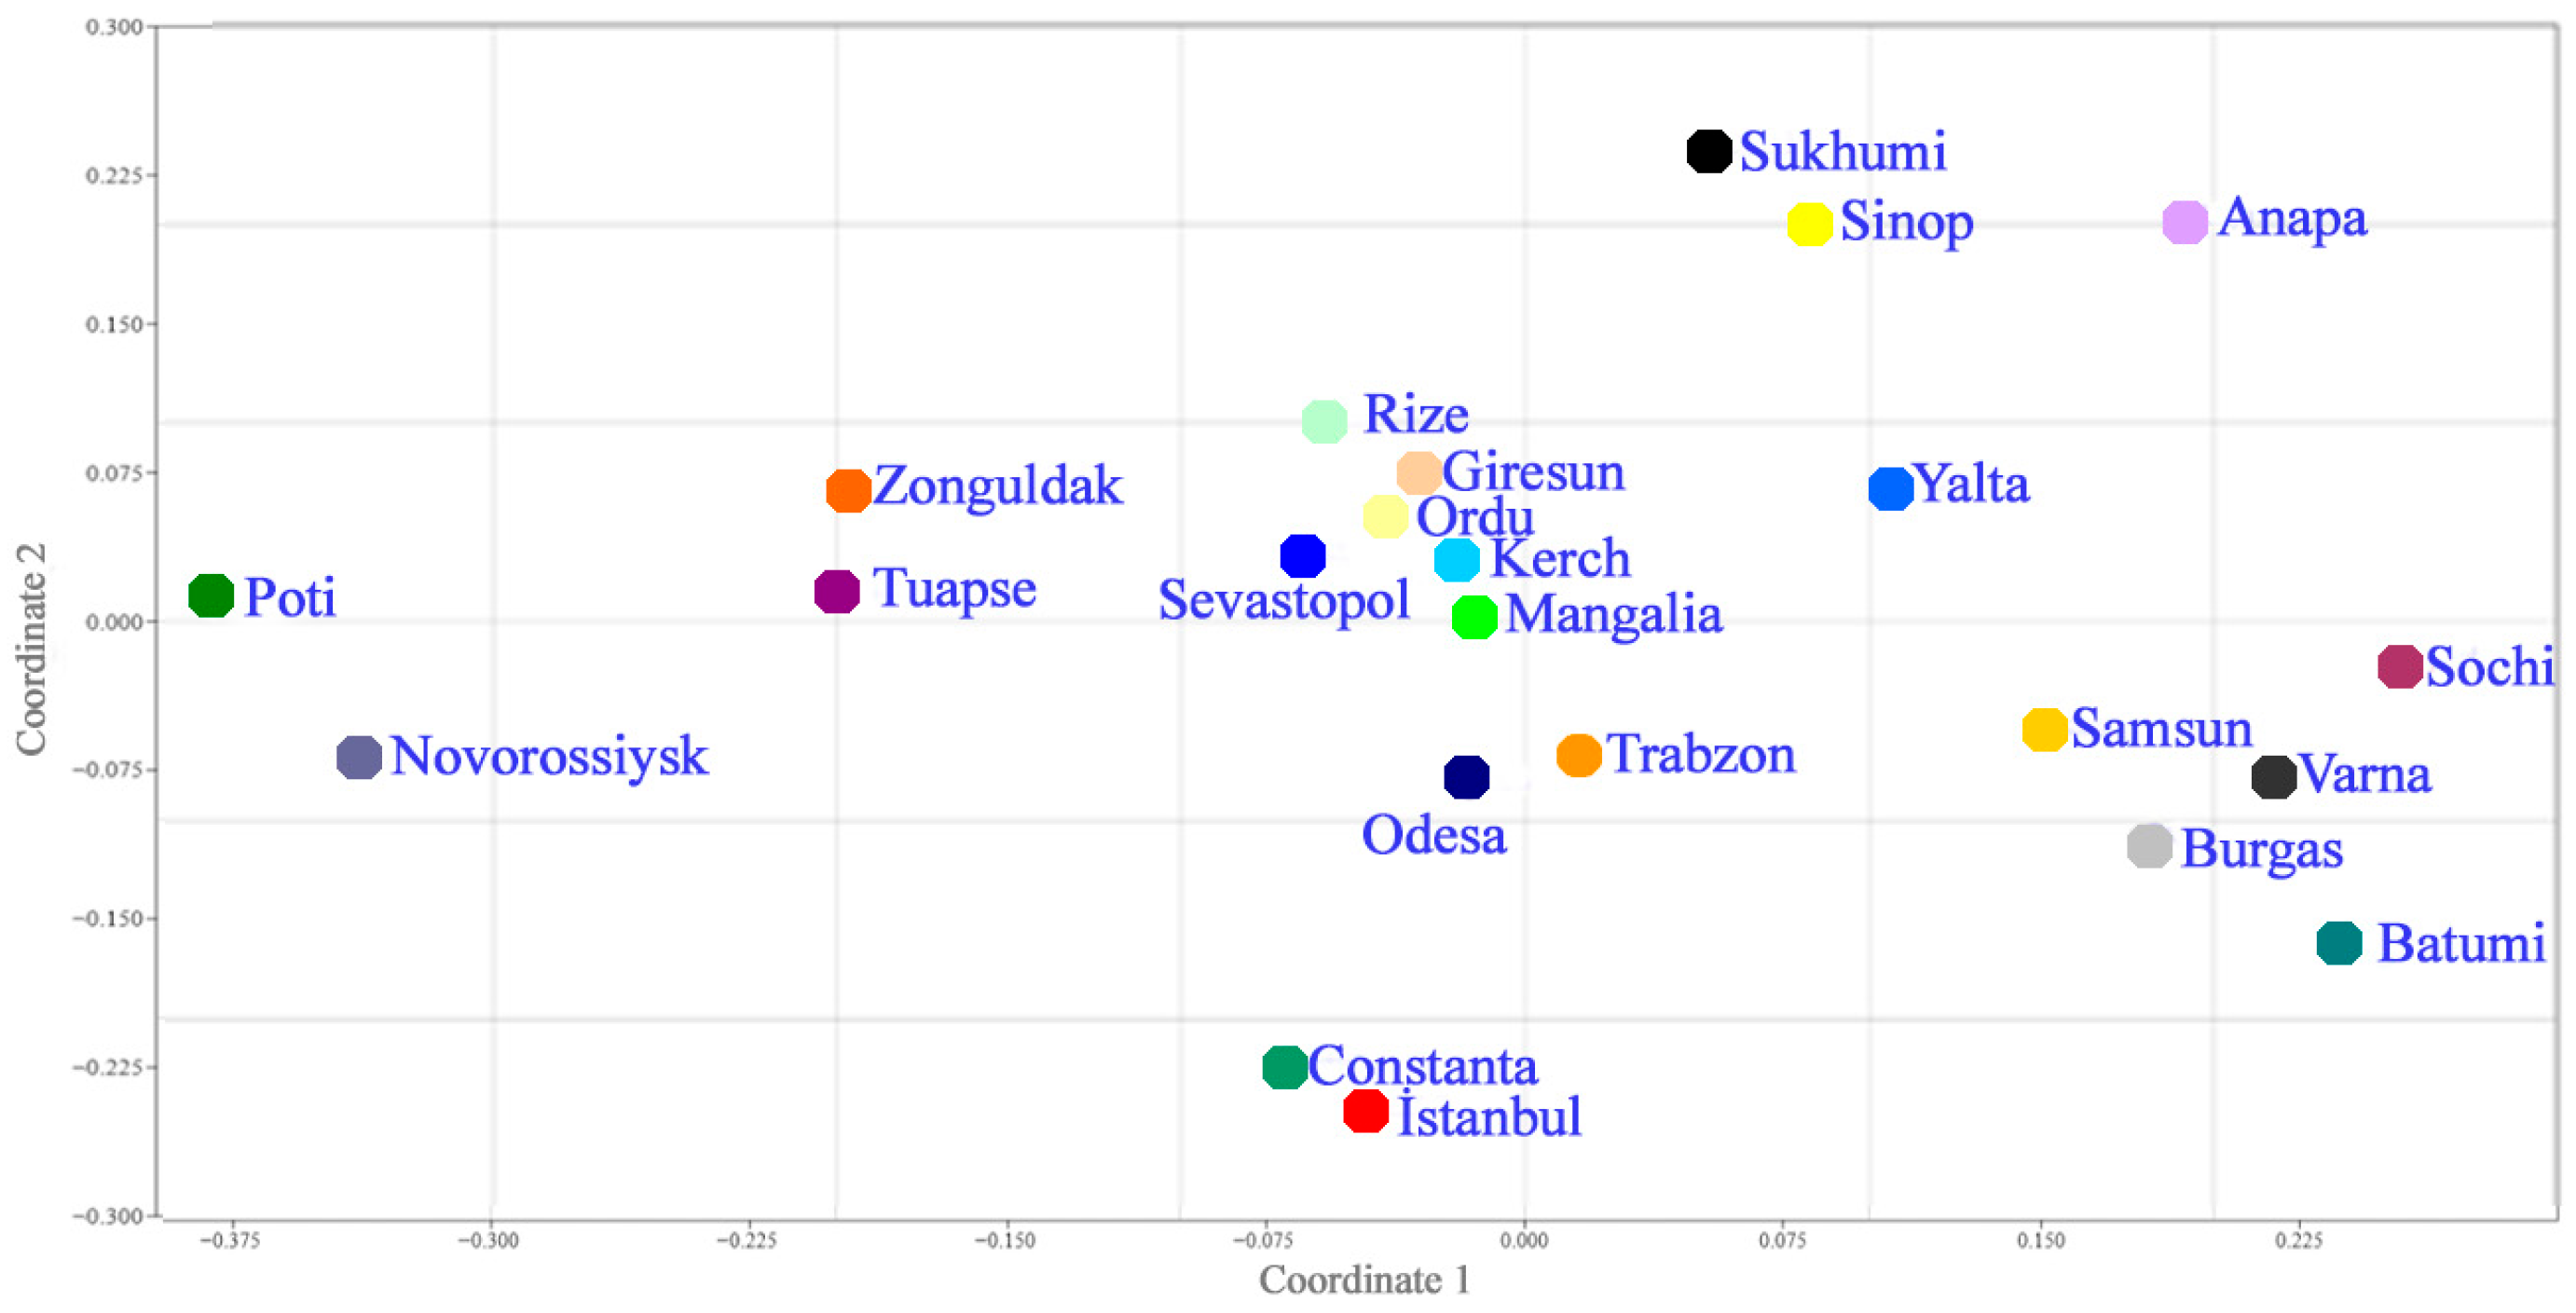
The Non-metric Multidimensional Scaling (NMDS) analysis conducted on the basis of the data in
Table 8 indicates that the cities differentiate along the first axis primarily according to the combined influence of criteria defined under demographic scale (Group B), economic–functional structure (Group C), and transportation–accessibility (Group D). The results of the NMDS analysis are presented in
Figure 2.
As shown in
Figure 1, the NMDS analysis indicates that the cities cluster along Coordinate 1 and Coordinate 2. Examination of the grouping pattern reveals six distinct clusters.
Although each cluster includes a combination of physical, economic, and accessibility characteristics, the typology emerging from the analysis is primarily shaped around a limited number of dominant distinguishing features. Overall, the clusters can be interpreted within three main structural orientations: port–industrial cities with strong logistics and production functions; tourism–service-oriented coastal cities characterized by high economic seasonality; and multifunctional regional cities exhibiting moderate values across multiple criteria.
The first group consists of Poti, Novorossiysk, Tuapse, and Zonguldak; the second group includes Rize, Giresun, Ordu, Kerch, Sevastopol, and Mangalia. The third group comprises Sukhumi, Sinop, Anapa, and Yalta, while the fourth group consists of Samsun, Burgas, Sochi, and Batumi. The fifth group includes Trabzon and Odesa, and the sixth group consists of Constanța and İstanbul.
When the first group, located at the negative end of Coordinate 1, is examined, it is observed that the cities in this cluster exhibit a moderate level of urban density (A4) in terms of physical and morphological structure. In addition, most of the cities (Zonguldak, Novorossiysk, Tuapse) demonstrate high urban morphological diversity (A6). However, in a majority of these cities (Poti, Novorossiysk, Tuapse), public use of the coastal area (A2) is weak, and the distance between built-up areas and the shoreline (A5) is limited. Furthermore, in terms of coastal continuity and accessibility (A1), the cities display either relatively favorable (Zonguldak, Novorossiysk) or weak (Poti, Tuapse) conditions.
In terms of demographic and scalar characteristics, these cities experience moderate daily population fluctuation (B3) and exhibit a medium level of regional centrality (B4). Their population sizes (B1) are predominantly medium-scale (Zonguldak, Novorossiysk, Tuapse). While no metropolitan influence (B2) is observed in Zonguldak and Poti, a partial metropolitan effect is identified in Novorossiysk and Tuapse.
Regarding economic and functional structure, the cities in this group display low tourism intensity (C1), and their economic structures are either non-seasonal or only weakly seasonal. The economic structure is partially diversified in most of the cities (Zonguldak, Tuapse, Poti). In addition, a high level of port activity (C2) and industrial pressure (C4) is evident in the majority of these cities (Zonguldak, Novorossiysk, Poti), whereas the service sector (C6) is not dominant.
From the perspective of transportation and accessibility, public transport integration (D4) is at a moderate level. National and coastal transport connections (D1, D3) are either well-developed (Zonguldak, Tuapse) or partially available (Novorossiysk, Poti).
In terms of urban quality and governance, coastal–urban integration (E1) and pedestrian priority (E2) are generally weak in these cities.
The second group of cities, located near the intersection of Coordinate 1 and Coordinate 2, exhibits highly similar characteristics across numerous criteria. In these cities, criteria A1, A2, A4, A5, C1, C5, C6, B3, B4, D1, D4, E2, E3, and E4 are predominantly at a moderate level. Furthermore, none of the cities in this group display a metropolitan influence (B2).
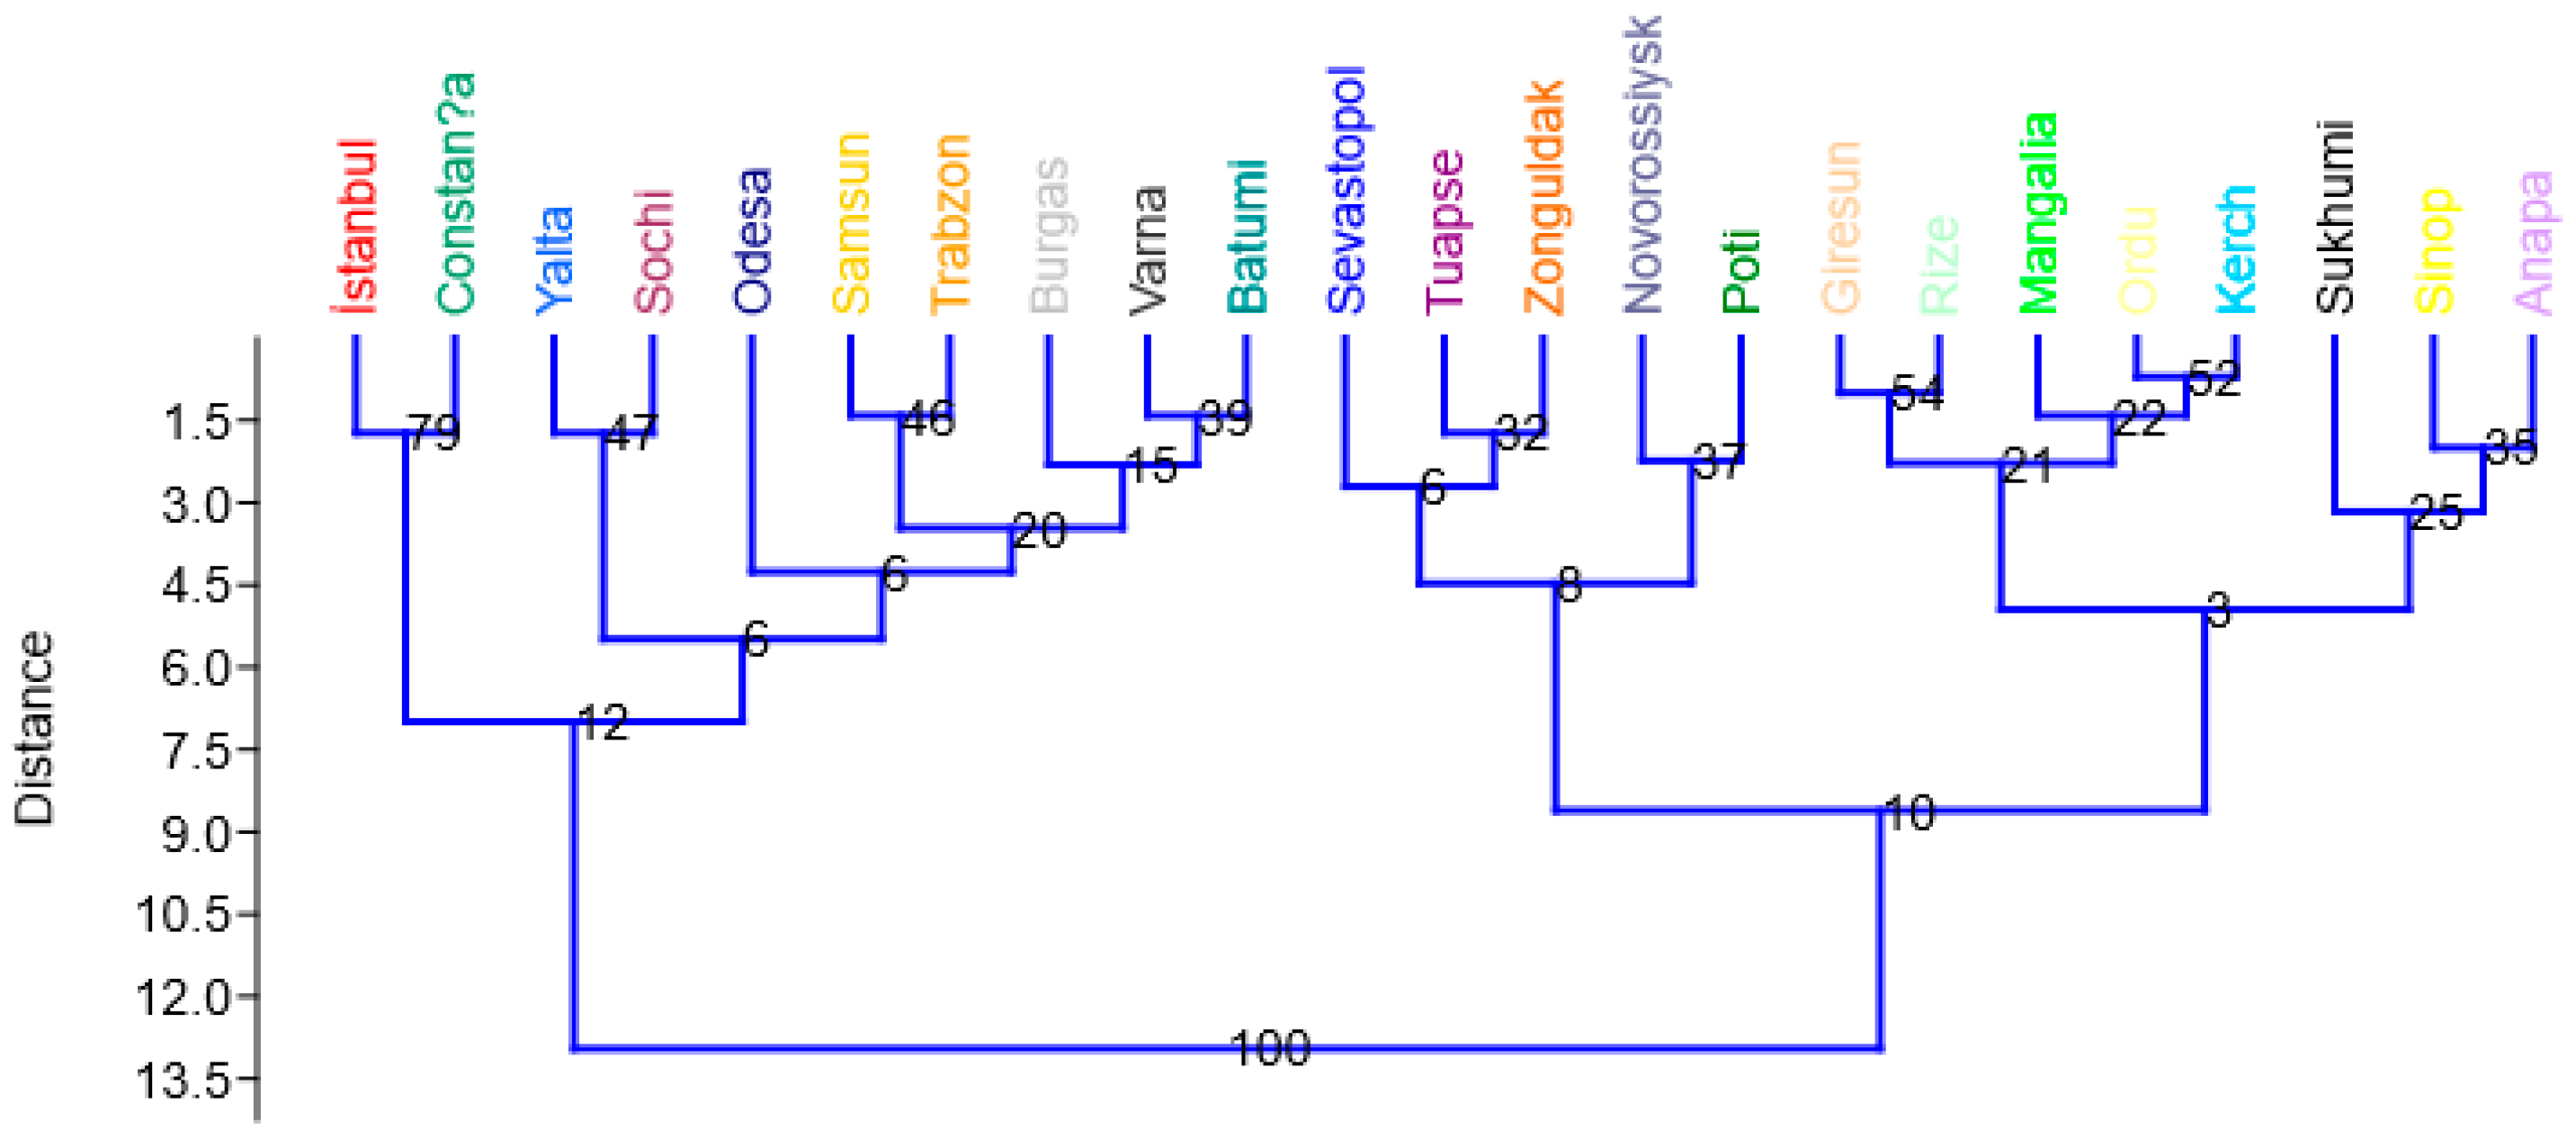
Based on the Gower dissimilarity matrix calculated from the 24 ordinal indicators presented in
Table 8, the Ward hierarchical clustering analysis (
Figure 3) identifies six main clusters of coastal cities according to their similarity structures.
The first cluster consists of İstanbul and Constanța. Both cities display similar values in terms of high population size and metropolitan influence (B1, B2), large-scale port activity and industrial pressure (C2, C4), and advanced national and international accessibility (D1, D2). Urban quality and governance indicators (E) are generally represented at a moderate level; however, coastal–urban integration (E1) is low (0) in İstanbul and moderate (1) in Constanța.
Yalta and Sochi form a distinct sub-core in the dendrogram, constituting the second cluster. The cities in this cluster exhibit medium-to-high tourism intensity (C1) and high similarity in terms of economic seasonality (C5) and the dominance of the service sector (C6). Physical and morphological structure indicators (A) are generally at medium-to-high levels. Demographic scale and metropolitan influence criteria (B) are represented at a moderate level (B1–B3 mostly scored as 1; in Yalta, regional centrality (B4) is high (2)).
The third cluster, composed of Odesa, Trabzon, Samsun, Burgas, Varna, and Batumi, brings together medium- and large-scale cities with regional center characteristics. In most of these cities, moderate urban density (A4), medium-level port scale (C2), and medium-to-high transport connectivity (D1, D3) are observed. In terms of economic structure, tourism intensity (C1) varies between medium and high levels across cities, while industrial pressure (C4) is generally moderate. Economic diversification (C3) is mostly at a medium-to-high level within this cluster (
Table 8). Although differences exist among the cities, their attachment to the same main branch in the dendrogram indicates a shared structural pattern.
The fourth cluster includes Sevastopol, Poti, Tuapse, Zonguldak, and Novorossiysk, where port and industrial functions are particularly pronounced. Port activity (C2) is generally high (except Tuapse, where C2 = 1). Industrial pressure (C4) varies across cities: it is high (2) in Zonguldak, Novorossiysk, and Sevastopol, but low (0) in Poti and Tuapse. The proportion of public coastal space (A2) and coastal–urban integration (E1) are mostly low or moderate. Demographic scale and metropolitan influence (B) are limited, and transportation indicators (D) vary among the cities.
The fifth cluster, composed of Rize, Giresun, Ordu, Mangalia, and Kerch, consists of cities with broadly similar values across many criteria. In most of these cities, the majority of indicators are represented at moderate levels (across categories A, B, C, D, and E), and inter-city differences are limited (
Table 8). Metropolitan influence (B2) is generally absent in this group.
The sixth cluster includes Sinop, Anapa, and Sukhumi, which are smaller-scale cities with relatively homogeneous characteristics. In terms of physical and morphological structure (A), coastal continuity and public use are relatively strong (A1, A2). Regarding economic structure, tourism intensity (C1) is medium-to-high; seasonality (C5) is high (2) in Anapa, moderate (1) in Sinop, and low (0) in Sukhumi. The dominance of the service sector (C6) is low to moderate in this cluster (0 in Sukhumi). Industrial pressure (C4) is low. Transportation and accessibility criteria—particularly international accessibility (D2)—are represented at limited levels (
Table 8).
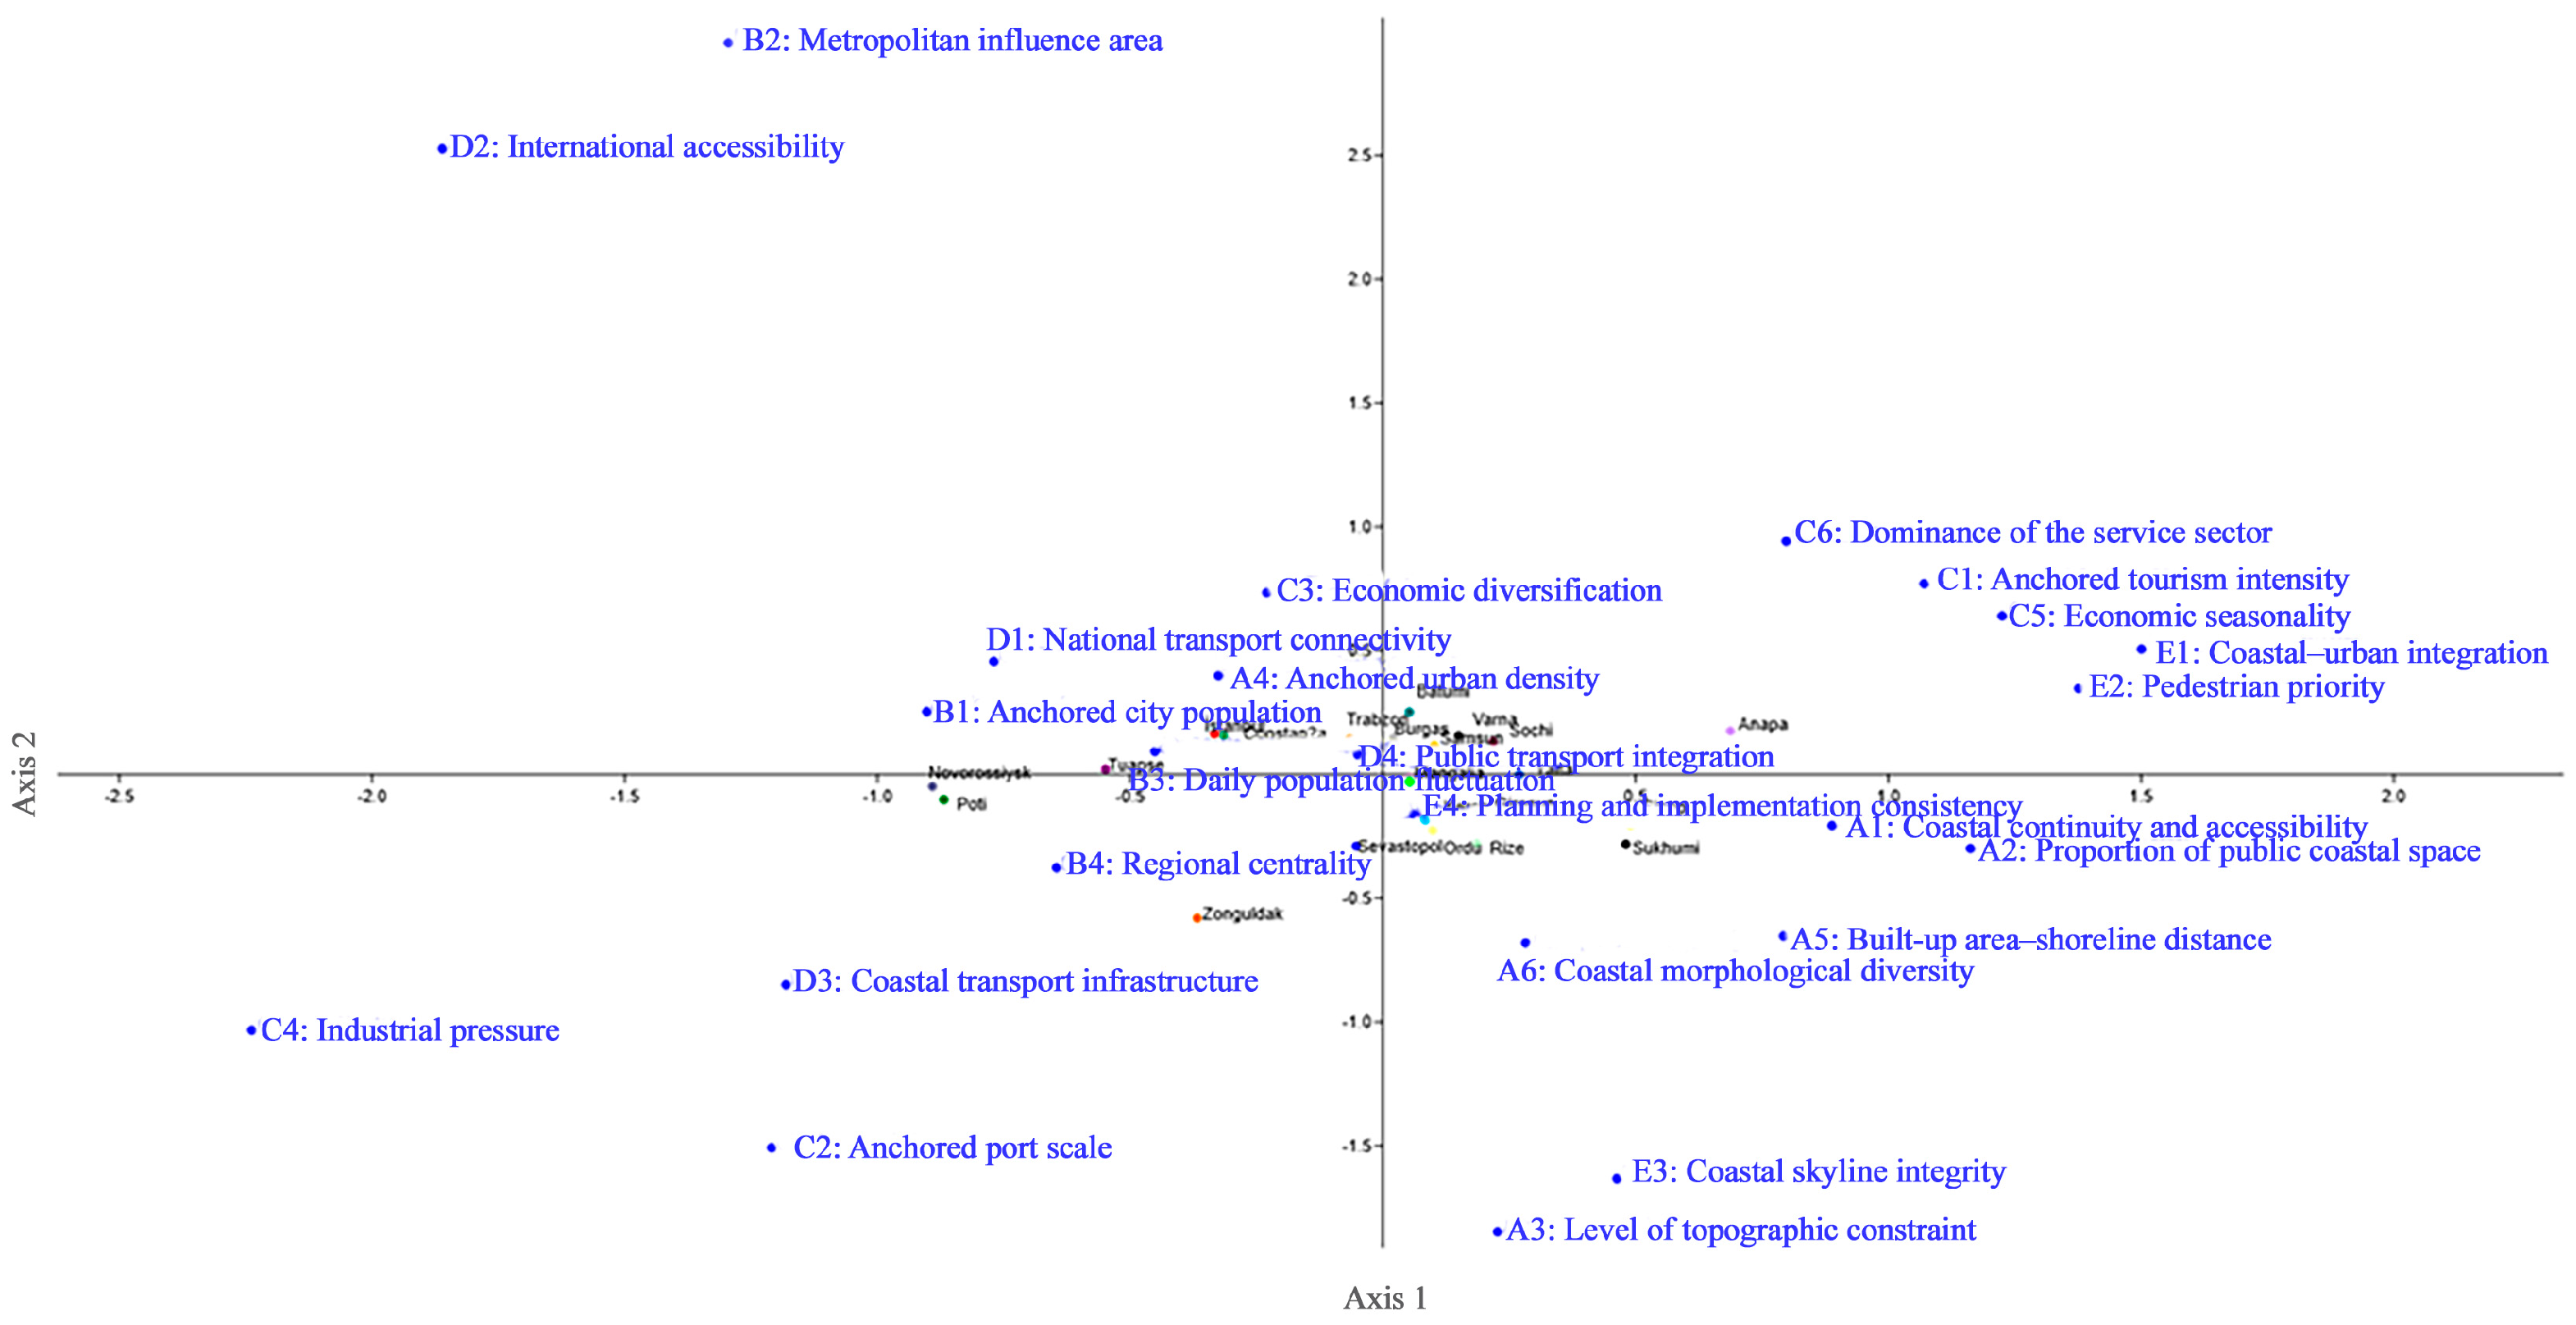
The Multiple Correspondence Analysis (MCA), conducted using the ordinal (0–1–2) indicators presented in
Table 8, demonstrates that both criteria and cities are jointly positioned within a two-dimensional space. MCA enables the simultaneous evaluation of relationships between cities and criteria, thereby supporting, at the variable level, the patterns identified through NMDS and hierarchical clustering analyses.
According to the MCA results (
Figure 4), Axis 1 primarily emerges as a dimension along which criteria related to urban scale, accessibility, and economic structure differentiate. On the positive side of this axis, urban quality and service-oriented criteria—such as tourism intensity (C1), dominance of the service sector (C6), economic seasonality (C5), coastal–urban integration (E1), and pedestrian priority (E2)—are positioned. In contrast, the negative side of the axis includes criteria associated with production, logistics, and higher-order urban functions, such as metropolitan influence (B2), international accessibility (D2), industrial pressure (C4), and port scale (C2).
Axis 2 indicates a differentiation between physical–morphological structure and governance- and network-oriented variables. In the lower section of the axis, criteria representing spatial and natural characteristics—such as topographic constraint level (A3), coastal skyline integrity (E3), and coastal morphological diversity (A6)—are concentrated. In contrast, the upper section includes more abstract and network-based variables, such as metropolitan influence (B2) and international accessibility (D2).
An examination of the distribution of cities within the MCA plane shows that tourism- and service-oriented cities (e.g., Yalta, Sochi, Anapa) are positioned on the positive side of Axis 1, whereas port–industrial cities (e.g., Zonguldak, Novorossiysk, Tuapse) are located on the negative side. Meanwhile, cities such as Rize, Giresun, Ordu, Mangalia, and Kerch are positioned close to the origin, indicating that they possess moderate values across many criteria and do not exhibit strongly distinguishing extreme characteristics.
The MCA results demonstrate that city typologies are not shaped by a single criterion; rather, they emerge through the combined influence of physical, demographic, economic, transportation, and governance dimensions.
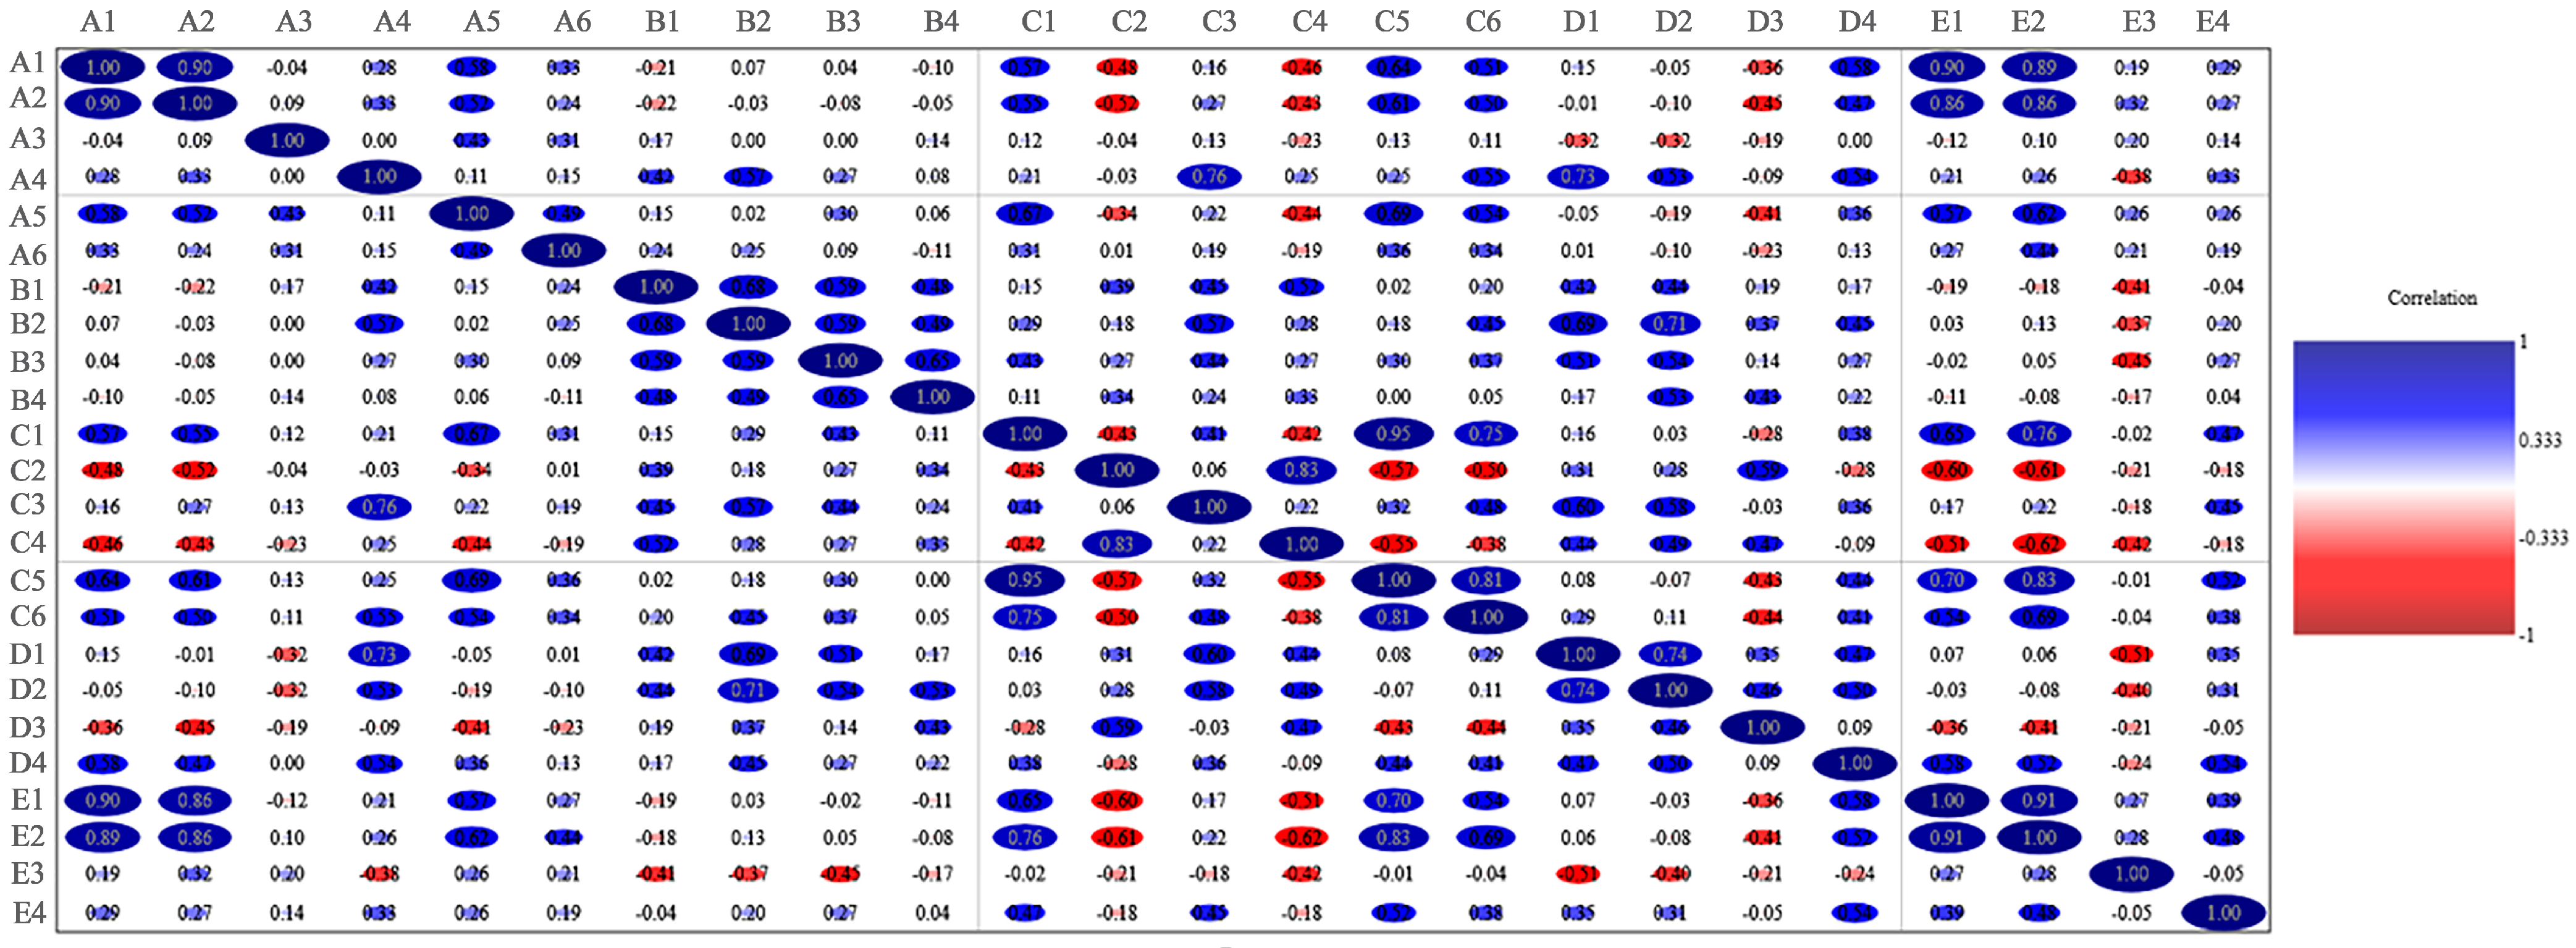
The Spearman rank correlation matrix presented in
Figure 5 reveals the structural relationships among the 24 ordinal indicators used in the study, calculated on the basis of their relative distributions across cities. The analysis results indicate the presence of meaningful co-variation patterns among criteria, both within the same main thematic category and across different categories.
An examination of the physical and morphological structure indicators reveals a strong and positive relationship between coastal continuity and accessibility (A1) and the proportion of public coastal space (A2). Similarly, a positive correlation is observed between urban density (A4) and the built-up area–shoreline distance (A5), indicating that dense development in close proximity to the coastline tends to occur simultaneously. Coastal morphological diversity (A6), on the other hand, exhibits moderate relationships with several of the physical indicators.
In terms of demographic and scalar characteristics, clear and positive correlations are identified among city population size (B1), metropolitan influence (B2), and regional centrality (B4). By contrast, daily population fluctuation (B3) demonstrates relatively weaker relationships with the other demographic indicators.
Regarding economic and functional structure, strong positive correlations are observed among tourism intensity (C1), economic seasonality (C5), and the dominance of the service sector (C6). The positive relationship between port scale (C2) and industrial pressure (C4) indicates that port- and industry-oriented economic structures tend to co-occur. Economic diversification (C3), however, displays moderate relationships with both tourism- and industry-related indicators.
Among the transportation and accessibility indicators, national transport connectivity (D1), international accessibility (D2), and coastal transport infrastructure (D3) generally show positive relationships. Public transport integration (D4) exhibits moderate associations with both demographic scale and urban quality indicators.
Within the urban quality and governance category, strong positive correlations are identified among coastal–urban integration (E1), pedestrian priority (E2), and coastal skyline integrity (E3). Planning and implementation consistency (E4) demonstrates generally moderate relationships with these indicators.
Overall, the Spearman correlation matrix indicates that the multidimensional patterns identified through NMDS and hierarchical clustering analyses are consistent with the co-variation structures observed among the criteria (
Figure 6).
The network plot analysis, constructed to visually represent inter-city similarity relationships based on the 24 ordinal indicators presented in
Table 8, is shown in
Figure 6.
Within the network structure, nodes represent cities, while the connections between nodes indicate the relative similarity levels that cities exhibit across the entire set of criteria. Connection density reflects the proximity of cities in terms of their composite profiles across physical (A), demographic (B), economic–functional (C), transportation (D), and governance (E) dimensions.
Cities positioned centrally in the graph (e.g., Samsun, Trabzon, Giresun, Ordu) are characterized by a high number of connections. This suggests that, in these cities, most criteria are represented at moderate levels and that they exhibit a profile commonly observed across the sample. In contrast, cities located at the periphery of the network (e.g., Poti, Novorossiysk, Tuapse, Odesa) have fewer connections, reflecting distinctive characteristics that differentiate them across specific groups of criteria.
Overall, the network diagram demonstrates that inter-city relationships are structured around relative similarity fields rather than sharply defined classes. In this respect, it visually supports the findings obtained through the other multivariate analyses employed in the study.
In the PCA conducted on the basis of the correlation matrix, the first two principal components explain 58.2% of the total variance. In the literature, particularly in highly heterogeneous datasets such as social, spatial, and environmental systems, no universal threshold of explained variance is defined for the evaluation of PCA results. Instead, emphasis is placed on the interpretability of components, the consistency of variable loadings, and their alignment with findings obtained through other analytical methods [
83,
99,
100].
4. Discussion
The use of ordinal (0–1–2) indicators in this study has partially mitigated the comparability problems arising from structural differences in data production systems and measurement sensitivities across countries. This approach aligns with a planning perspective that seeks to reveal the relative positions and structural tendencies of cities rather than producing absolute rankings. Particularly in multi-country comparative research, relative and ordinal evaluation frameworks provide a significant methodological advantage by reducing the risk of analytical reductionism stemming from context-specific differences.
The NMDS analysis demonstrates that cities are positioned relative to one another within a two-dimensional analytical space based on their multidimensional characteristic sets. The differentiation observed along the first axis primarily reflects the combined influence of demographic scale, economic–functional structure, and transportation–accessibility criteria. This indicates that differentiation among Black Sea coastal cities does not arise from a single criterion, but rather from the interaction of multiple structural dimensions.
Natural and geographical conditions also play an important role in explaining the spatial patterns observed in the analysis. In many cities along the Black Sea coast, steep topography behind the coast, narrow coastal plains, or specific geomorphological features constrain urban expansion and shape the form of coastal development. Cities located in narrow coastal strips or areas with strong topographic constraints generally exhibit a more compact urban form and linear development along the coast. In contrast, cities with wider coastal plains or deltaic environments show more extensive urban expansion and spatial flexibility. These geographical differences partly explain the variations observed in variables such as coastal accessibility, urban density, and city–coast integration in the study.
An examination of the groups identified within the NMDS plane reveals that some cities exhibit clearly distinctive extreme profiles, while others are located close to one another in the analytical space due to moderate values across numerous criteria. In particular, the positioning of port- and industry-dominated cities along axes distinct from tourism- and service-oriented cities indicates that economic functions play a decisive role in shaping spatial organization along the Black Sea coast. This finding is consistent with studies emphasizing how port–industrial development transforms coastal–urban relations [
8,
10].
Conversely, the positioning of cities such as Rize, Giresun, Ordu, Mangalia, and Kerch near the intersection of the axes in the NMDS space suggests that these cities do not generate extreme values across most criteria and instead exhibit a more balanced profile. This implies that they are not shaped by a single dominant function; rather, they display a structure in which different functions coexist at relatively limited levels. The emphasis in the literature on the transformation and steering capacity of secondary and small-scale cities [
48,
68] corresponds with the findings obtained in this study.
In this respect, the NMDS analysis positions cities according to relative similarities rather than rigid classifications, thereby enabling a more holistic evaluation of the structural patterns of Black Sea coastal cities. Within this framework, the NMDS results indicate that cities concentrate around four principal pattern domains within the two-dimensional analytical space.
The first NMDS pattern encompasses cities in which production and logistics functions are dominant and where port and industrial activities play a decisive role in shaping urban structure. Cities within this pattern are distinguished by low tourism intensity (C1), limited dominance of the service sector (C6), and relatively weak urban quality indicators (E). In the Ward analysis, this pattern is represented in greater detail under two separate clusters comprising industry–port-oriented cities.
The second NMDS pattern consists of cities characterized by the predominance of tourism and service-sector activities, with high levels of economic seasonality. These cities are defined by high tourism intensity (C1), a strong service sector (C6), and relatively developed urban quality indicators (E1–E2). In the Ward analysis, this pattern is more clearly differentiated as a distinct cluster composed particularly of tourism-oriented cities.
The third NMDS pattern includes medium- and large-scale cities functioning as regional centers, with relatively balanced transportation linkages and economic diversification. These cities do not exhibit extreme values in terms of either industrial or tourism specialization; rather, they display a moderately high level of multifunctional urban structure. In the Ward analysis, this pattern is represented within a broader cluster containing multiple cities, thereby detailing their shared structural characteristics.
The fourth NMDS pattern comprises cities that exhibit moderate values across many criteria and do not display strongly distinctive extreme characteristics. Their proximity to the origin in the NMDS space suggests a transitional structural profile positioned between different typologies. In the Ward analysis, this pattern is further differentiated into smaller and more homogeneous sub-clusters, making visible the subtle distinctions among these cities.
The NMDS results clearly demonstrate that addressing planning issues in Black Sea coastal cities through single-dimensional approaches is insufficient. The positioning of cities within the analytical space gains meaning only when physical structure, economic functions, transportation linkages, and governance indicators are evaluated together. This finding suggests that coastal–urban relations should be addressed not solely along axes of land use or economic growth, but also in conjunction with spatial quality, accessibility, and governance capacity [
37,
101].
Similarly, the six clusters identified through hierarchical clustering (Ward) analysis reveal that cities are grouped not according to singular attributes, but through the combined influence of physical–morphological structure, economic–functional profile, transportation connections, and governance indicators. The high metropolitan influence, advanced port scale, and strong accessibility observed in the İstanbul–Constanța cluster; the dominance of tourism, seasonality, and the service sector in the Yalta–Sochi cluster; and the prominence of port and industrial functions in the Sevastopol–Poti–Zonguldak–Novorossiysk cluster demonstrate that the Ward analysis effectively distinguishes city types based on functional specialization.
At the same time, certain governance-related indicators—particularly planning and implementation consistency—are indirectly inferred from observable spatial outcomes rather than directly measured through institutional data. This reflects an inherent methodological limitation of visually based comparative analyses, as governance capacity is fundamentally related to institutional arrangements and policy processes that cannot always be fully captured through spatial morphology alone.
Conversely, the grouping of cities such as Rize, Giresun, Ordu, Mangalia, and Kerch into a separate cluster indicates that these cities exhibit moderate values across most criteria and do not display pronounced extreme characteristics, reflecting a relatively balanced and less specialized structural profile.
The groupings obtained through the NMDS and Ward analyses in this study differ from one another. This difference does not indicate inconsistency; rather, it reflects the distinct analytical scales and logics upon which the two methods are based. In the NMDS analysis, cities were positioned within a two-dimensional plane according to their relative similarities, and four main clusters were identified on the basis of broader and more holistic patterns within this analytical space. In contrast, the Ward hierarchical clustering analysis examined the similarity structure in greater detail and subdivided these patterns into six clusters through finer-scale distinctions.
By its nature, NMDS represents relationships among cities through continuities and proximity fields rather than sharp boundaries. Consequently, NMDS results tend to group cities with predominantly moderate values under broader clusters; cities exhibiting relatively similar profiles but diverging in specific criteria may still be located within the same cluster. In this context, the four clusters identified through NMDS represent macro-scale structural patterns of Black Sea coastal cities.
The Ward hierarchical clustering analysis, operating on the basis of the Gower dissimilarity matrix, evaluates differences among cities according to the principle of cumulative variance minimization and reveals more fine-grained similarity structures. For this reason, the Ward analysis separates certain city groups—located within a single NMDS cluster—into two distinct sub-clusters based on functional and structural nuances.
Accordingly, this situation should be interpreted as the subdivision of the four NMDS clusters into more detailed sub-clusters in the Ward analysis. In other words, the Ward analysis does not fragment the general patterns identified by NMDS; rather, it renders the structural diversity within these patterns more visible. Therefore, the difference in the number of clusters between the two methods does not imply a lack of mutual validation; on the contrary, it provides the opportunity for a multi-scalar reading of coastal city structures.
From a planning perspective, this finding demonstrates that coastal cities exhibit multi-layered and transitional characteristics that cannot be adequately captured under a single typology. While the NMDS analysis offers an appropriate framework for defining broad strategic categories, the Ward analysis enables more targeted and context-sensitive policy approaches within these strategic categories. In this respect, the difference in cluster numbers between the two methods should be regarded as a complementary element that enhances the analytical depth of the study.
The network plot analysis provides a distinctive contribution among the multivariate methods employed in the study by visualizing inter-city similarity relationships not as rigid classes but as a continuous and graded structure. Whereas hierarchical clustering and NMDS define similarities among cities through specific group boundaries, the network approach reveals the degree to which these boundaries are permeable and illustrates how cities occupy relational positions within the analytical space.
The central positioning of cities such as Samsun, Trabzon, Giresun, and Ordu within the network structure—characterized by a high number of connections—indicates that these cities exhibit moderate values across most of the physical, demographic, economic, transportation, and governance indicators used in the study. This suggests that they neither display strongly extreme profiles nor demonstrate pronounced differentiation based on singular criteria. Their central location in the network analysis corresponds to the “intermediate groups” identified in the NMDS and Ward analyses, reflecting a consistent structural pattern across methods.
Conversely, the peripheral positioning of cities such as Poti, Novorossiysk, Tuapse, and Odesa—marked by a more limited number of connections—indicates that these cities exhibit more distinctive characteristics within specific groups of criteria. In particular, cities characterized by high port–industrial pressure or differentiation in certain economic and transportation indicators tend to occupy peripheral positions within the network structure. This pattern corresponds closely with the more clearly delineated clusters identified in the Ward hierarchical clustering analysis.
Overall, the network plot analysis demonstrates that the structural similarities among coastal cities cannot be fully explained through binary comparisons or rigid cluster boundaries. Instead, inter-city relationships exhibit a multidimensional, graded, and contextual character. This finding suggests that, in planning and policy discussions concerning coastal cities, evaluating cities through similarity and differentiation fields—rather than classifying them into fixed “types”—offers a more functionally relevant analytical approach.
The clustering of criteria observed along the axes in the MCA reveals strong visual patterns related to the multidimensional structure of coastal cities. However, it is important to assess whether these patterns are supported not only by two-dimensional spatial proximity but also by co-variation relationships among the criteria. For this reason, the MCA results were interpreted in conjunction with the Spearman rank correlation analysis.
Criteria positioned on the positive side of the first MCA axis—such as tourism intensity (C1), dominance of the service sector (C6), economic seasonality (C5), coastal–urban integration (E1), and pedestrian priority (E2)—also exhibit significant and positive relationships among themselves in the Spearman correlation matrix. This indicates that tourism- and service-oriented urban profiles are not only spatially proximate in the MCA plane but also statistically co-occurring.
Similarly, the criteria located on the negative side of the first MCA axis—metropolitan influence (B2), international accessibility (D2), industrial pressure (C4), and port scale (C2)—demonstrate positive relationships in the Spearman correlation analysis. This finding confirms that the criteria situated at the production–logistics end of the MCA axis form a coherent and internally consistent block in terms of their correlation structure.
When evaluated in the context of the second MCA axis, the spatial proximity observed between physical–morphological structure indicators and coastal skyline integrity is also supported by moderate relationships in the Spearman correlation analysis. In contrast, the relatively weaker associations of these criteria with network-based variables reinforce the interpretation that the second axis represents a distinction between physical–spatial characteristics and higher-order network relations.
Overall, the Spearman rank correlation analysis reveals the co-variation patterns among the ordinal indicators employed in the study, thereby clarifying the variable-level foundations of the multidimensional differentiations identified through NMDS and hierarchical clustering analyses. The analysis clearly demonstrates that physical, demographic, economic, transportation, and governance dimensions do not operate independently; rather, they are structured together within specific patterns of interaction.
Beyond these structural relationships, it is also important to consider the broader institutional and policy contexts that may influence coastal urban development. In addition to the structural relationships identified in the analysis, differences in national and local planning policies may also contribute to the spatial patterns observed among Black Sea coastal cities. Public policy frameworks influence land-use regulation, coastal protection strategies, infrastructure investment, and the development of port and tourism functions. Variations in governance capacity, regulatory systems, and planning traditions may therefore produce different spatial outcomes even among cities located within the same geographical region. In some cases, strong planning control and coordinated coastal management policies may support higher levels of coastal–urban integration and public accessibility. In contrast, fragmented governance structures or strong industrial development pressures may limit the provision of public coastal spaces and weaken the integration between the city and the coastline. These observations suggest that the structural differences identified in this study should also be interpreted within the broader context of planning governance and public policy frameworks.
While some general differences among coastal cities may appear intuitive, the comparative analytical framework developed in this study provides a systematic and empirically grounded way of identifying structural patterns across multiple dimensions. By integrating physical, demographic, economic, accessibility, and governance indicators within a multivariate analytical framework, the study reveals relational patterns and typological structures that cannot easily be identified through descriptive observation alone. Rather than merely confirming obvious differences among cities, the analysis highlights broader structural gradients and transitional profiles among Black Sea coastal cities. In this sense, the comparative approach contributes to the literature by moving beyond single-case interpretations and offering a regional perspective on coastal urban systems within the Black Sea basin.
In this respect, the combined evaluation of MCA and Spearman analyses shows that the city typologies defined in the study are grounded not only in visual or positional proximities but also in statistically consistent relationships among criteria. The findings indicate that the structural characteristics of coastal cities cannot be explained through singular variables. Instead, a multidimensional and multi-criteria planning perspective emerges not merely as a methodological preference, but as an analytical necessity for comparative analyses of coastal cities.
Beyond its region-specific findings, this study also contributes to the literature on coastal urban systems. In the existing literature, coastal cities are often examined through single thematic dimensions, such as tourism development, port activities, or environmental vulnerability. In contrast, this study considers physical morphology, economic specialization, accessibility, and governance indicators within a single analytical framework. This multidimensional approach allows for a more comprehensive interpretation of the transformation of coastal cities developing within shared regional systems, such as the Black Sea basin. In this regard, the proposed analytical framework provides a comparative approach that can be applied in studies of other regional coastal cities.
It should also be acknowledged that the use of visually interpreted ordinal indicators introduces a certain degree of subjectivity into the analytical framework. Although the coding process was conducted through structured evaluation criteria and cross-checked by the authors, indicators such as urban quality or planning–implementation consistency inevitably require interpretative judgment when derived from map-based and satellite imagery sources. For this reason, the results should be interpreted primarily as representing relative structural tendencies rather than precise measurements. Future research could further strengthen the robustness of the approach by incorporating independent multi-coder validation or additional institutional datasets related to planning governance.
Implications for Coastal Planning and Policy
From a planning perspective, the typological differentiation identified in this study suggests that coastal cities within the Black Sea basin require context-sensitive policy approaches. Cities characterized by strong port and industrial functions often face spatial pressure on coastal land, environmental risks associated with industrial activities, and conflicts between port infrastructure and public coastal use. In such contexts, planning strategies may focus on strengthening environmental regulations, establishing spatial buffer zones between industrial and residential areas, and improving governance mechanisms related to coastal management.
In contrast, tourism-oriented coastal cities encounter different planning challenges, including seasonal economic fluctuations, pressure on public coastal spaces, and the need to preserve urban quality in highly visible waterfront areas. Planning approaches in these cities may therefore prioritize public accessibility, environmental protection, and the balanced integration of tourism functions with urban space.
Cities positioned between these two extremes, displaying multifunctional urban structures, may benefit from more flexible planning strategies that support economic diversification while maintaining a balance between development and environmental protection. In this sense, the typology proposed in this study can serve as an analytical reference for identifying context-specific planning priorities among different coastal city profiles.
5. Conclusions
This study has evaluated Black Sea coastal cities within a multi-criteria and comparative analytical framework that simultaneously considers physical–morphological structure, demographic scale, economic–functional profile, transportation–accessibility, and urban quality–governance dimensions. The analysis was based on the assumption that cities developed under different national planning regimes and institutional contexts are nevertheless subject to similar spatial and functional pressures within the same marine system. This approach has enabled coastal cities to be interpreted not as isolated cases or solely within national contexts, but in terms of shared structural tendencies and fields of differentiation.
The combined use of multivariate analytical methods demonstrates that Black Sea coastal cities are too differentiated to be subsumed under a single homogeneous typology; yet at the same time, they cluster around identifiable structural patterns. While the NMDS analysis represents macro-scale structural tendencies through a holistic and continuity-based framework, the Ward hierarchical clustering analysis disaggregates these tendencies into more detailed sub-clusters, rendering functional and structural nuances visible. The network analysis further complements these findings by illustrating that inter-city relationships exhibit a graded and relational structure rather than rigid classifications. This multi-method approach clearly indicates that the planning dynamics of coastal cities cannot be adequately captured through a single analytical framework.
The findings reveal a clear differentiation between port–industrial production and logistics-oriented development trajectories and tourism- and service-based growth tendencies among Black Sea coastal cities. At the same time, the presence of cities positioned between these two extremes (characterized by moderate values across numerous criteria) indicates that a significant portion of coastal cities exhibit multifunctional and transitional structures. Rather than being shaped by a single dominant function, these cities present relatively balanced profiles in which different functions coexist at limited levels. From a planning perspective, such structures entail both risks and opportunities, as they remain open to strategic redirection yet may also face vulnerabilities stemming from structural ambiguity and limited specialization.
One of the notable findings of the study is that, although the analytical profiles of cities are not entirely independent of national borders, cultural contexts, or administrative traditions, they are shaped to a considerable extent by structural dynamics such as port scale, economic specialization, accessibility levels, and spatial pressure. The fact that cities located in different countries can be positioned within similar analytical clusters when they assume comparable functional roles suggests that development trajectories among Black Sea coastal cities are largely determined by structural and functional conditions. This finding indicates that planning approaches focusing solely on national planning regimes may be insufficient; instead, comparative perspectives that account for shared spatial and economic dynamics are of critical importance in the planning of coastal cities.
These structural patterns can also be partially interpreted in the context of the historical development processes of Black Sea coastal cities. For example, cities developed under the Soviet planning system generally exhibit stronger port–industrial orientations and associated spatial arrangements shaped by centralized industrial policies. In contrast, cities influenced by post-socialist economic transformation processes or tourism-focused development strategies tend to display economic structures dominated by the service sector, with more pronounced seasonality. Similarly, cities that historically developed as regional administrative or trade centers show higher population scales and stronger transportation connections. While this study does not aim to provide a detailed historical analysis of each city, these historical development processes offer important context for interpreting the structural clustering revealed in the comparative analysis.
It is also important to note that the findings of this study reflect a specific temporal context and, therefore, provide a cross-sectional perspective on the structural characteristics of Black Sea coastal cities. The analysis focuses on the current spatial and functional structures of the cities rather than their temporal transformation processes. As a result, contemporary geopolitical developments in the region, such as the Russia–Ukraine war, and global economic fluctuations may influence the future development dynamics of Black Sea coastal urban systems. Although such dynamic processes are beyond the scope of the current study, future research could examine how these geopolitical and economic changes transform the developmental patterns of coastal cities over time.
The semi-enclosed nature of the Black Sea and its limited ecological carrying capacity result in the cumulative regional impacts of planning decisions taken in coastal cities. In this context, the spatial and functional orientations of cities generate not only local but also regional consequences. By making this interdependent relationship visible, the study highlights the need to address the planning and governance of Black Sea coastal cities within a broader spatial and institutional framework.
In conclusion, the research demonstrates that the development patterns of Black Sea coastal cities can be interpreted not through singular urban narratives or exclusively national contexts, but through multi-layered structures shaped jointly by physical, economic, demographic, transportation, and governance dimensions. This holistic perspective suggests that planning and policy approaches for coastal cities should be developed through flexible, context-sensitive, and multi-scalar strategies rather than through fixed typologies tied to specific countries or cultural settings. It should also be noted that the study is based on a relatively limited sample of 23 coastal cities within the Black Sea basin. Although the use of multiple analytical techniques helps reveal consistent structural patterns, the results should be interpreted primarily as exploratory typological tendencies rather than definitive classifications. In comparative urban research, particularly in studies covering complex regional systems, such analyses aim to identify broader relational patterns rather than provide statistically universal generalizations. The typology developed in this study should be regarded not as a rigid classification system, but as an analytical framework that supports context-sensitive coastal planning.