Article

Initial Responses of Riparian Vegetation and Wetland Functions to Stage 0 Restoration of Whychus Creek, Oregon


1
Strathclyde University, Glasgow G1 1XQ, UK
2
Royal Botanic Gardens Edinburgh, Edinburgh EH3 5NZ, UK
3
Aequinox, Bend, OR 97703, USA
4
Department for Environment, Food and Rural Affairs, London SW1P 4DF, UK
5
Upper Deschutes Watershed Council, Bend, OR 97702, USA
6
School of Geography, University of Nottingham, Nottingham NG7 2RD, UK
*
Author to whom correspondence should be addressed.
Land 2026, 15(3), 500; https://doi.org/10.3390/land15030500
Submission received: 21 October 2025 / Revised: 9 February 2026 / Accepted: 27 February 2026 / Published: 19 March 2026

Abstract

Floodplain disconnection caused by channel incision and/or levee construction has led to widespread loss of riparian habitats and ecosystem functions globally. Restoring full stream–floodplain connectivity is increasingly promoted, yet evidence of ecological outcomes remains limited. This study evaluates the initial performance of two Stage 0 restoration projects on Whychus Creek, Oregon, which reconnected incised channels to their historical floodplains in 2012 and 2016. We combined pre- and post-restoration vegetation surveys along fixed transects with hydrogeomorphic-based riparian and wetland function assessments and applied quantitative analyses, including Kruskal–Wallis tests, Jaccard correlations, Sorensen similarity indices, and factor analysis, to compare changes in plant assemblages and ecosystem functions across restored, transitional, and unrestored reaches. Our research results indicate that two years post-restoration, the active riparian area expanded 2.5-fold, species richness and structural diversity increased significantly, and riparian and wetland functions such as water storage, sediment retention, and habitat support for fish and amphibians improved markedly. Numbers of anadromous salmonids also increased markedly. This is important as salmon recovery is a regional stream restoration goal. Comparisons with a reach restored six years earlier suggest a positive trajectory toward mature, resilient ecosystems. These findings demonstrate that Stage 0 restoration can rapidly reestablish complex habitat mosaics and enhance ecosystem services critical for biodiversity, water quality, and flood resilience. Practically, this evidence supports process-based restoration strategies that prioritize full floodplain reconnection as a cost-effective approach to reversing long-term ecological degradation. Continued monitoring is essential to guide adaptive management and strengthen the evidence base for the wide-scale implementation of valley-floor wide stream restoration.

1. Introduction

Natural floodplains provide diverse aquatic, riparian, and wetland habitats. They also sustain a range of valuable ecosystem services that help manage the risks associated with floods, droughts, pollution, and wildfires [1,2,3]. Large numbers of streams have become partially or entirely disconnected from their floodplains due to channelization, artificial levee building and/or anthropogenically triggered channel incision [4,5,6]. In response, river restoration has become central to modern river and flood risk management and engineering [7,8,9,10,11]. Many streams that have been physically or biologically degraded by past management and engineering lack the capacity to recover naturally. The premise underpinning river restoration is that it is possible to recover lost forms, functions and species by re-instating the necessary hydrologic, geomorphic and biomic processes [12,13,14,15]. From an ecological perspective, reconnecting the channel and floodplain restores riparian and wetland mosaics and thereby increases ecosystem resilience, defined as the breadth of environmental conditions that the system can tolerate [16].
Early restoration approaches concentrated on in-channel measures [17,18,19]. In the last decade, the focus has shifted to measures that restore the floodplain as well [20,21]. Returning a stream to its pre-disturbance condition by fully reconnecting an anthropogenically incised channel to its historical floodplain is Stage 0 in the Stream Evolution Model proposed by Cluer and Thorne [5]. Projects that reconnect channels to their historical floodplains are widely referred to as ‘Stage 0 restoration’ (http://stagezeroriverrestoration.com/, accessed on 8 January 2026).
It is important to note that Stage 0 is a restoration target, not a method. Stage 0 can be achieved using two different approaches. The first is by filling in the incised channel and ‘resetting’ the valley floor using heavy machinery. The second is by initiating stream evolution to Stage 0 using low-impact technology, process-based approaches and/or the reintroduction of beavers [22,23,24].
Full hydrologic, geomorphic, and biologic connectivity between the stream and its historical floodplain is a key feature of Stage 0 restoration. This includes rehydration of both the floodplain and the hyporheic, alluvial aquifer beneath it. The resulting river planform is often multi-channelled (i.e., anabranching or anastomosed), though there may be a single channel or, in headwater basins and meadows, no channel at all [24].
Prior to anthropogenic disturbance, Stage 0 conditions in the floodplains along many rivers featured extensive riparian zones and wetlands, with typical streams best described as ‘riparian–wetland corridors’ [6]. Riparian and wetland vegetation are important because they provide valuable ecological goods and services. Species-rich, structurally diverse riparian and wetland vegetation distributed across hydrologically connected floodplains provide wildlife habitat, support biodiversity, stabilize streambanks, sequester carbon, provide shade to maintain water temperature, provide resilience to climate disturbances such as drought, and, over time, contribute in-stream and floodplain wood [9,25,26,27,28].
However, riparian zones now cover only 0.5–1% of the global land area [29]. The global area of riparian vegetation prior to significant human impacts is unknown because there are no reliable measurements, but detailed accounts like those of the pioneering ecologists indicate it was extensive [30]. About 80% of riparian habitats in Europe have disappeared since the 18th century [31] and more than 90% of riparian habitats in the United States are considered degraded [32]. Loss and degradation of riparian habitat is not confined to North America and Europe: it is a global issue [33]. Wet meadow ecosystems were previously abundant across the world but now occupy <1% of alluvial valley floors in most watersheds [27].
Wetlands are also in decline [34]. It is estimated that wetlands once covered ~16 million km2 of the Earth’s land surface [35]. This area has diminished during the Anthropocene, with recent estimates of wetland loss varying between 21% and 87% [35]. Worldwide destruction of wetlands has led to dramatic losses of previously undervalued wetland-related functions, biodiversity, and ecosystem services [36]. Although wetlands are now being restored in many areas, net loss is likely to continue due to climate change [37].
We are able to locally reverse the historical and on-going losses of riparian habitats and wetland functions through large-scale restoration projects. But unfortunately, the results of early, channel-centric stream restoration have been disappointing [38]. In contrast, reconnecting the channel to its floodplain and rehydrating both the floodplain and its alluvial aquifer (i.e., restoration to Stage 0) have long been hypothesized to lead to the recovery of lost wildlife habitats and refugia associated with healthy aquatic, riparian, floodplain, and wetland ecosystems [5,39]. Hard evidence to support this hypothesis is limited [40]. To address this hypothesis, this project assesses riparian vegetation and wetland functions data gathered to evaluate the initial outcomes of Stage 0 restoration of two anthropogenically incised reaches of Whychus Creek within the Deschutes Land Trust’s ‘Whychus Canyon Preserve’, downstream of the City of Sisters.
The aim of our study was to assess the initial performance of full floodplain reconnection in increasing the extent and diversity of riparian vegetation and enhancing wetland functions, two and six years after project completion. Specific objectives were as follows:
  • Objective 1: Use statistical analyses of data gathered along multiple transects in ‘Canyon Reach 4’ to compare the vegetation present in 2018 to that observed in 2015, prior to restoration.
  • Objective 2: Compare data gathered along multiple transects in ‘Canyon Reach 4’ in 2015 (prior to restoration) and 2018 (two years post-restoration) with those made in 2018 at ‘Camp Polk Meadow’ (six years post-restoration), in order to gauge the potential for the further development of vegetation in the more recently restored reach and make recommendations for further adaptive management.
  • Objective 3: Use a well-established, standard riparian and wetland functions assessment method to compare ecosystem services provided by ‘Canyon Reach 4’ in 2018 to those provided by the adjacent, unrestored ‘Canyon Reach 3’ and by ‘Camp Polk Meadow’.
  • Objective 4: Interpret our findings and consider their implications for restoration research, monitoring and restorative actions along Whychus Creek and more generally.

2. Whychus Creek: Historical Degradation and Recent Restoration to Stage 0

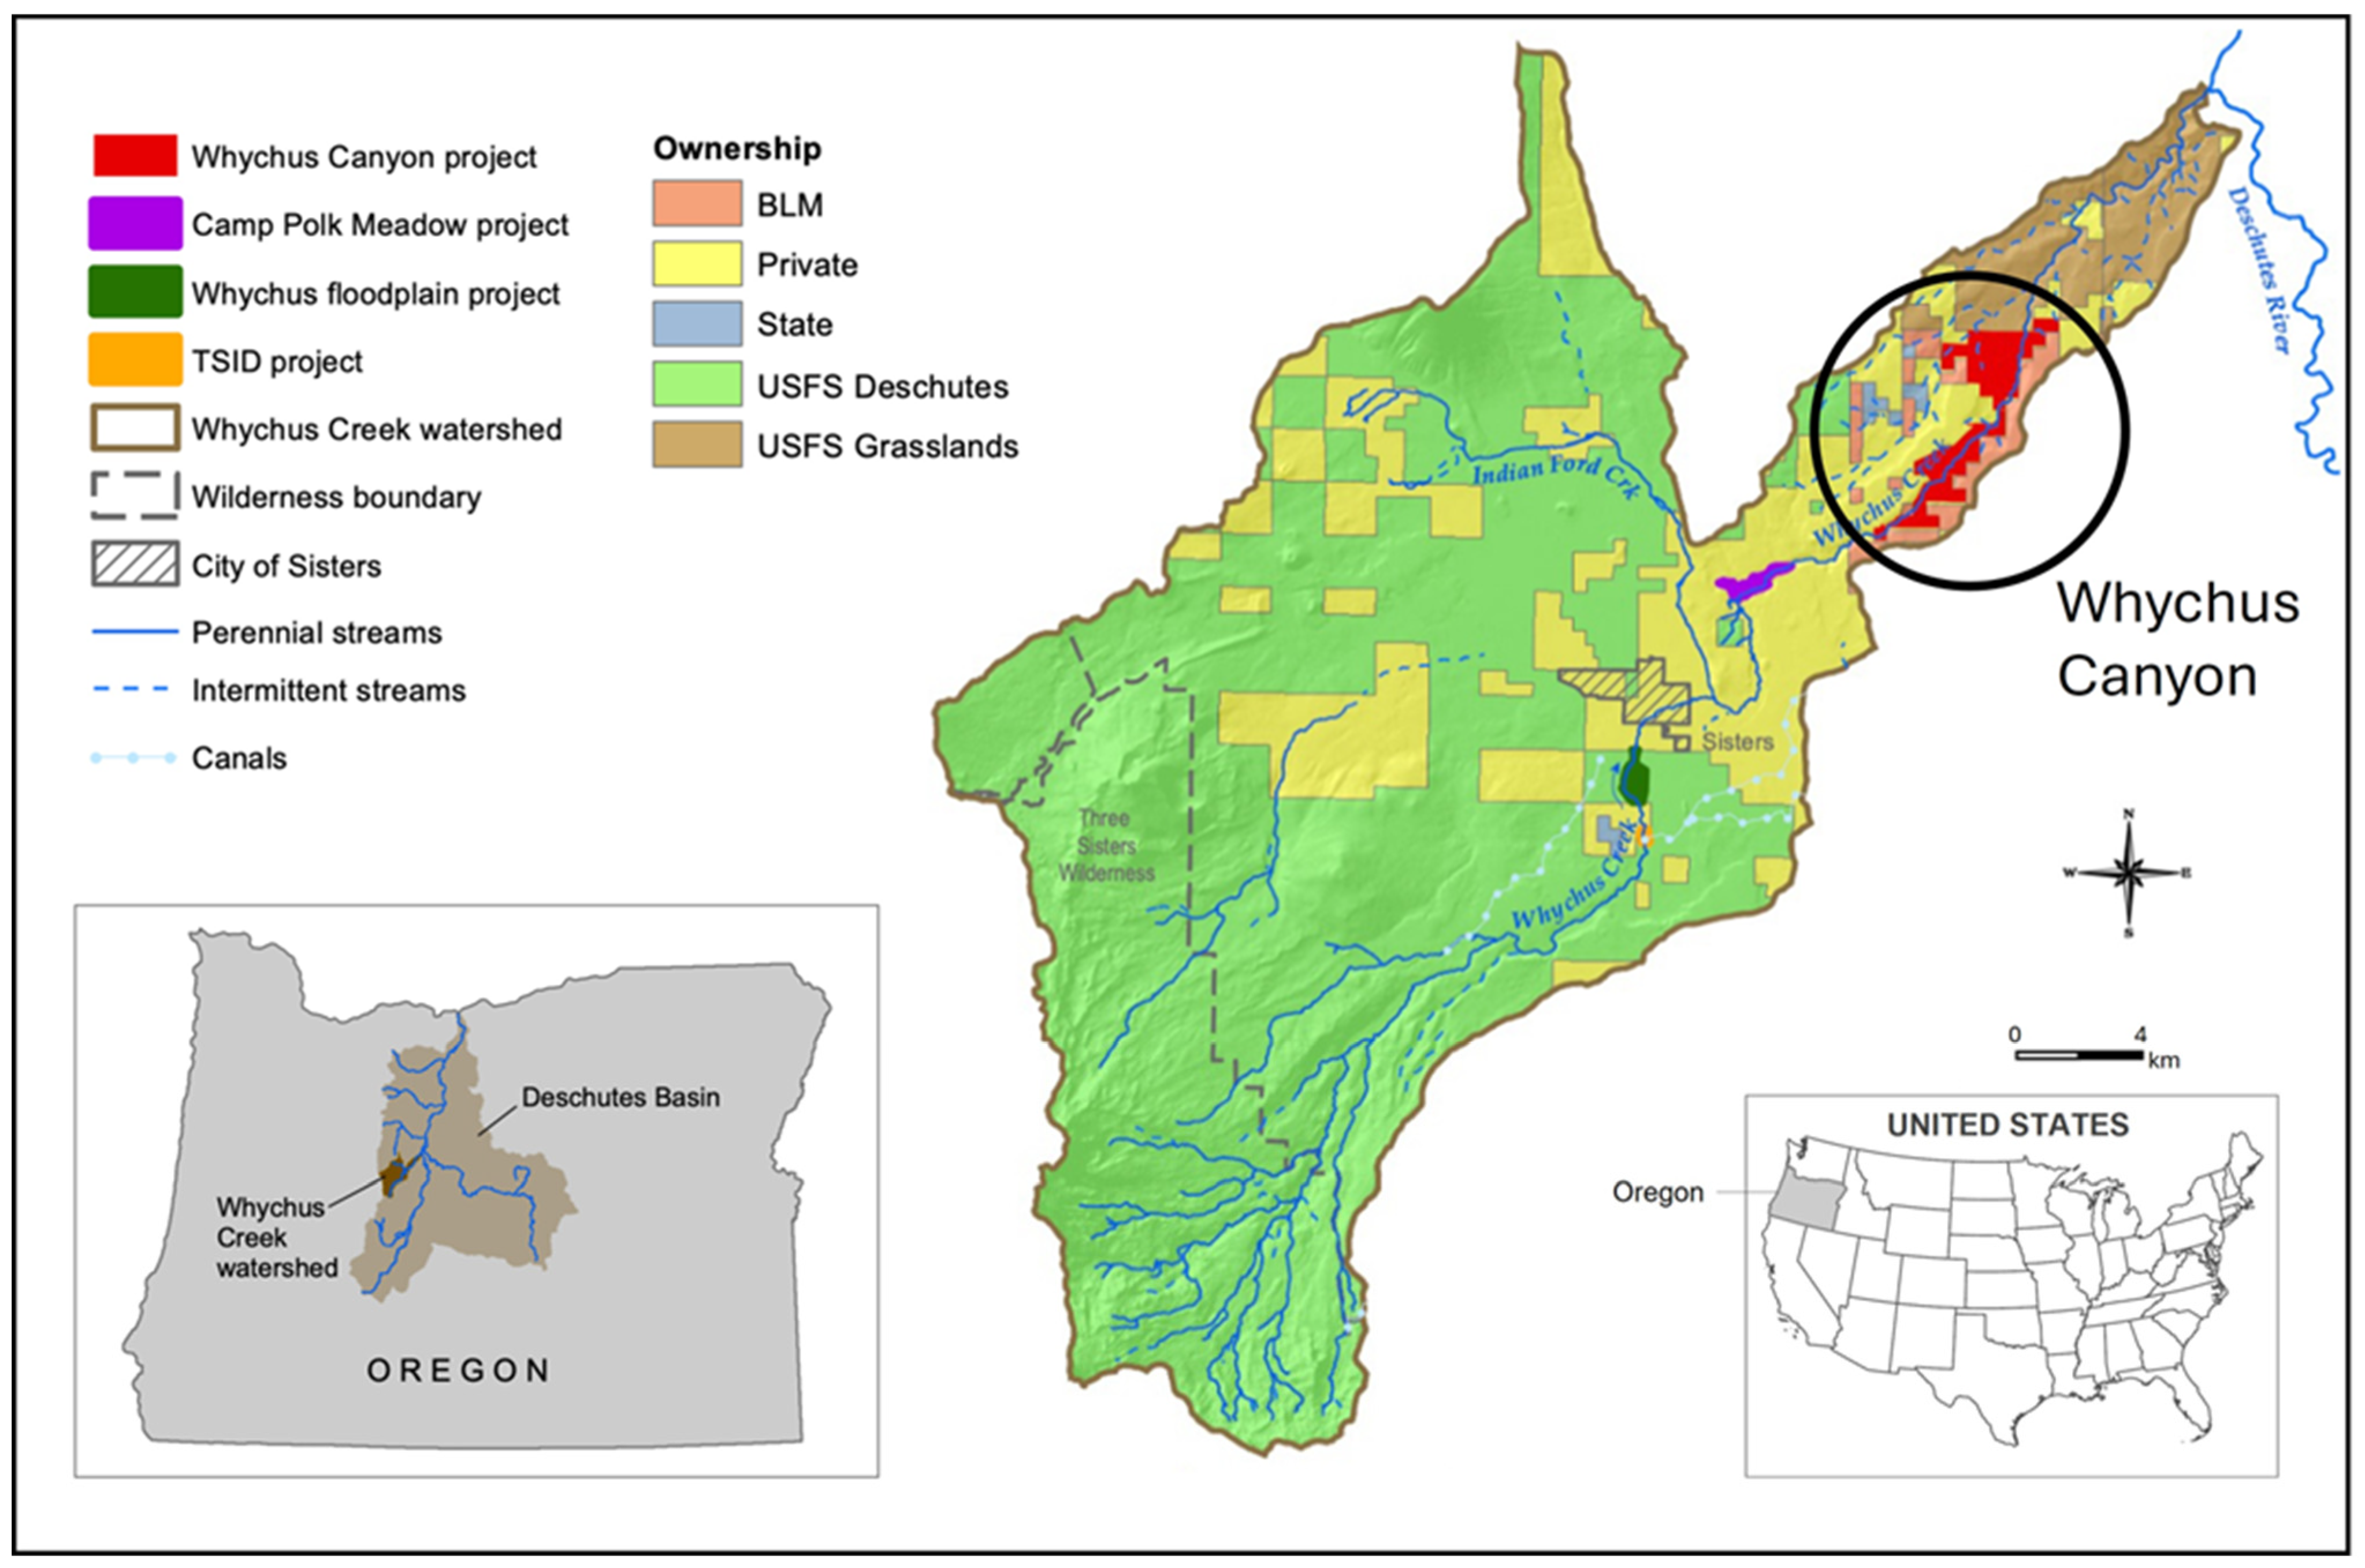
Our study was conducted on Whychus Creek, a tributary of the Upper Deschutes River in central Oregon. This creek rises at the base of the Bend Glacier on Broken Top Mountain, passing through the subalpine Three Sisters Wilderness Area and the City of Sisters before entering Whychus Canyon and then confluencing with the Deschutes River (Figure 1).
Whychus Creek’s ~660 km2 drainage basin is located in the rain shadow east of the Cascade Mountains. Consequently, average annual precipitation is only ~360 mm. Base flow is sourced primarily from springs and glacial meltwater. Of the 65 km length of the creek, 25 km is designated as either ‘wild’ or ‘scenic’ and only the short reach within Sisters is urban [41]. Land ownership within the watershed is a mixture of public (mostly US Forest Service), and private property (including the Deschutes Land Trust) (see Figure 1, above).
During the late-19th century and 20th century, extensive reaches of Whychus Creek and its floodplain were manipulated by European and US settlers to support homesteading, farming and ranching. Management actions included channelization, embanking, straightening, and relocating the Creek to a position along the edge of the valley floor. By the 1970s, these actions had resulted in channel incision that severed the channel’s lateral connection to its floodplain. As a result, resident fish populations—including redband trout Oncorhynchus mykiss and bull trout Salvelinus confluentus—declined, and the floodplains were no longer able to support the extensive riparian and wetland ecosystems known to be present until the 1940s [17]. This environmental degradation, coupled with three hydropower dams on the Deschutes River downstream of the Whychus Creek confluence that were constructed with no provision for volitional fish passage, wiped out Whychus Creek’s populations of anadromous salmon, including Steelhead Oncorhynchus mykiss and Chinook Oncorhynchus tshawytscha [41].
The Deschutes Land Trust’s ‘Whychus Canyon Preserve’ includes a 9.7 km stretch of Whychus Creek, divided into 6, 1.6 km (1 mile) reaches and numbered 1–6 from upstream to downstream. We focus on ‘Canyon Reach 4’, which was restored in 2016. The aim was to reactivate natural fluvial processes and encourage development of a multi-channel (i.e., anastomosing) planform with frequent flow-switching between anabranches and active meandering. The goal of the restoration was to establish heterogenous and resilient instream, wetland, pond, and floodplain habitats capable of supporting a diverse range of plant and animal species. This included a suitable habitat for both salmon transferred upstream of the dams on the Deschutes River through a ‘trap-and-haul’ programme and hatchery fish released within Whychus Creek itself [42].
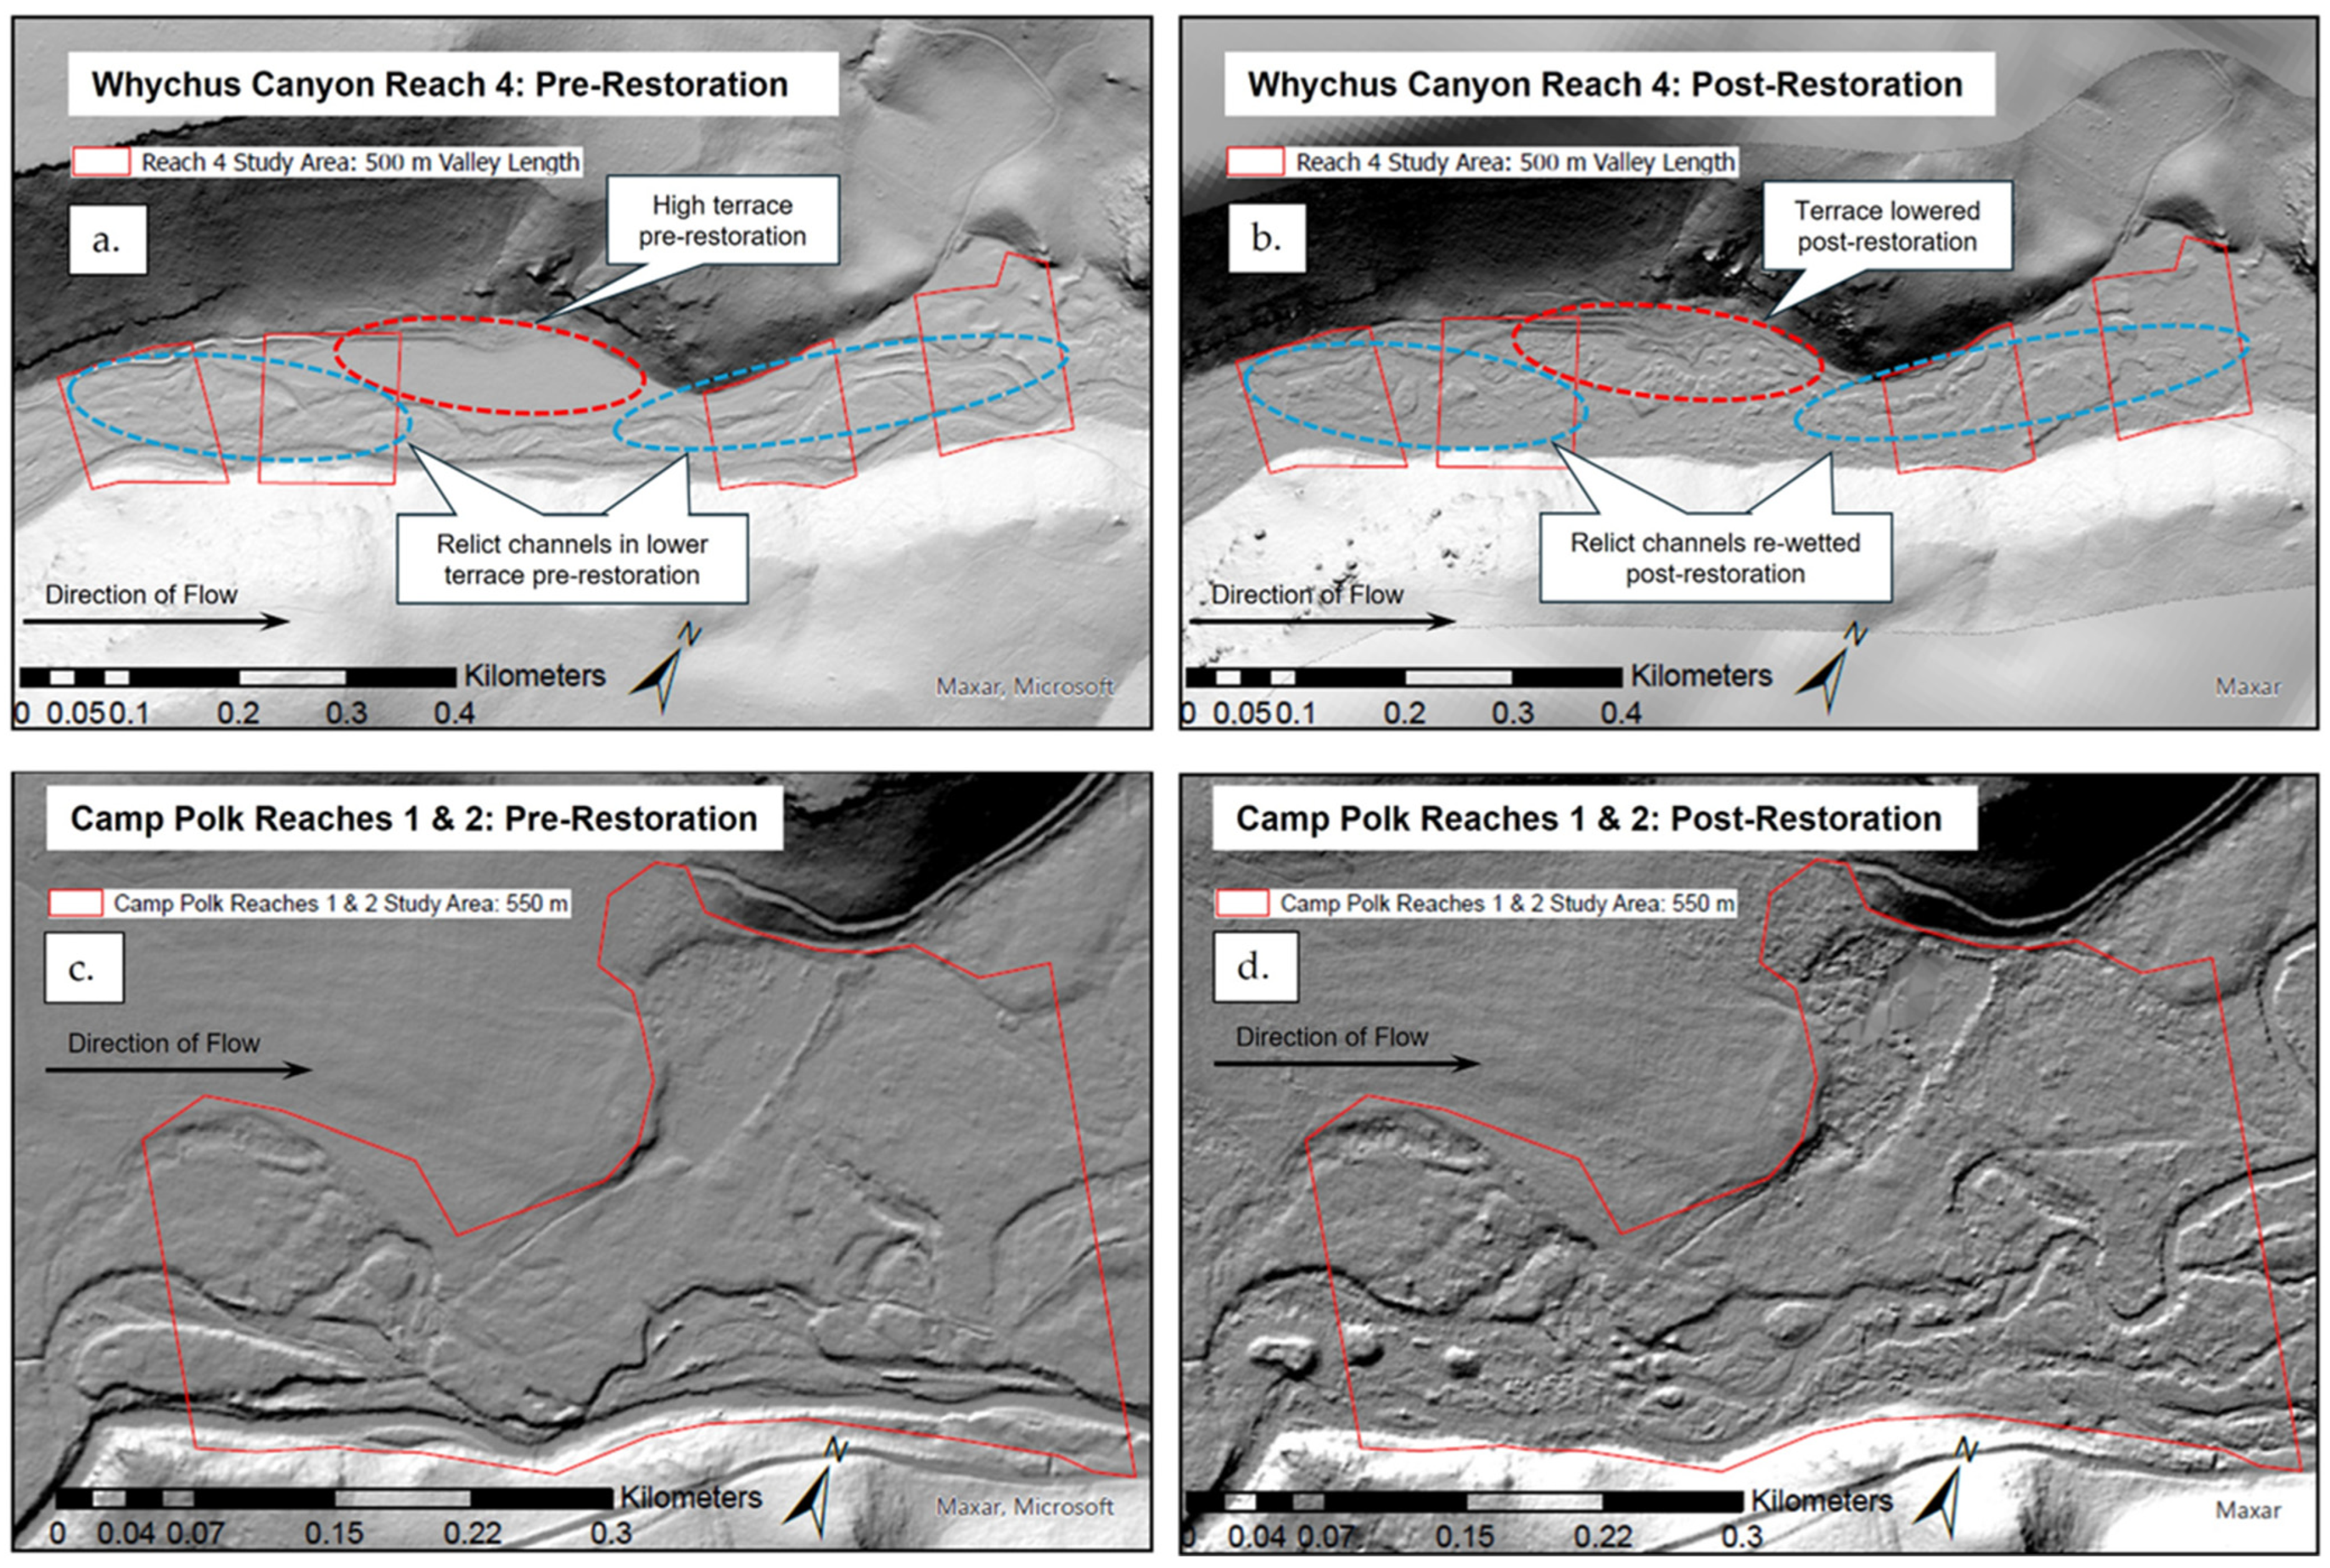
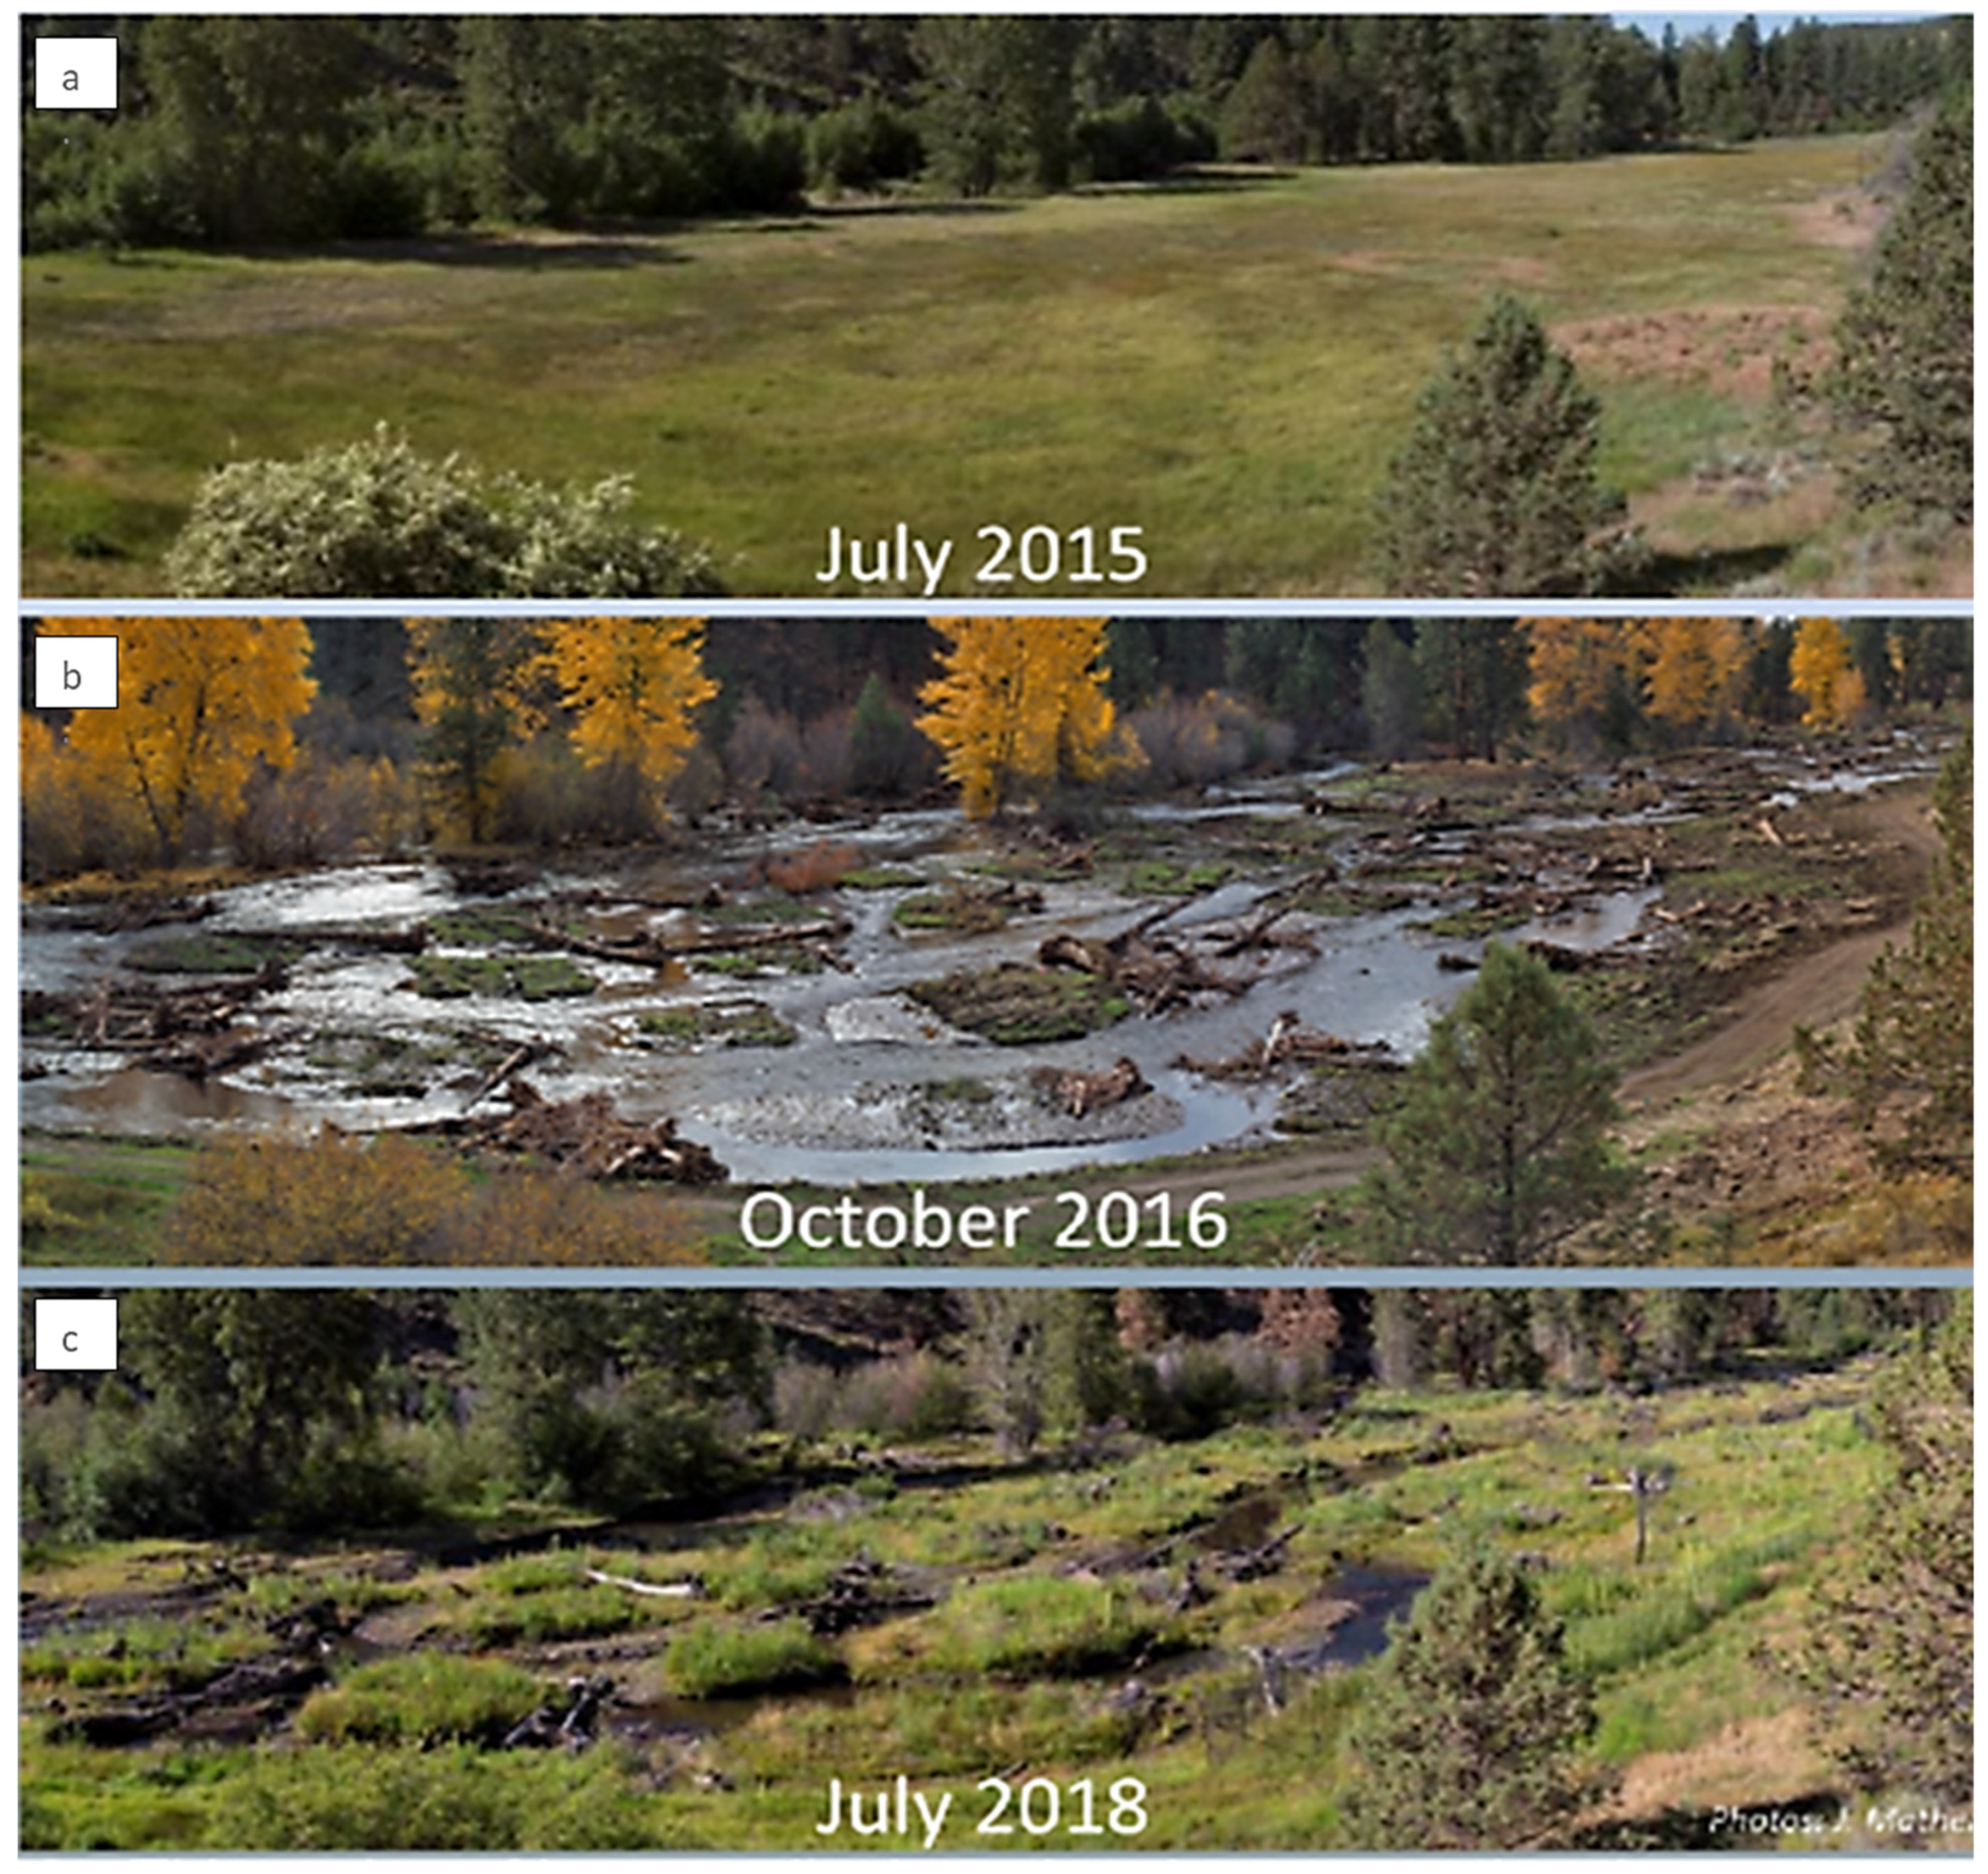
The restoration project was designed using the Geomorphic Grade Line and Relative Elevation Model approach developed by the US Forest Service [20]. The artificially straightened, relocated, and incised channel was filled in with material obtained by lowering a high terrace that was a legacy of anthropogenically triggered incision during the early 20th century (Figure 2a).
In areas where the high terrace was lowered, large wood and sedge mats were used to roughen the excavated surface and encourage the natural development of multiple flow paths and anabranches [42]. Reconnecting the stream to its floodplain at base flow and re-wetting relict anabranches still present in the surface of a lower terrace created an anastomosed planform for the creek, similar to that prior to anthropogenic disturbance (Figure 2b).
In-filling the incised channel rehydrated the alluvial aquifer beneath the floodplain. Within days of completing the work, the water table rose from ~2 m below the floodplain to ~30 cm. The water table then remained high, with its depth below ground fluctuating seasonally between 30 and 50 cm [43]. Geomorphological restoration was accompanied by extensive and diverse planting, predominantly with native riparian and wetland species but also including upland species on the more elevated parts of the restored floodplains (see Supplementary Materials Section S1). Remote sensing showed dramatic increases in vegetation cover following the restoration action [44].
Post-project monitoring of the physical environment in ‘Canyon Reach 4’ demonstrated that, by 2018, in-stream and floodplain conditions had evolved from a static, single-thread channel constrained by high and low terraces that were hydrologically and geomorphically disconnected to a dynamic, multi-channel system fully connected to its floodplain (Figure 3).
Monitoring is necessary to inform the adaptive management of Stage 0 restorations, as well as being essential to disseminating best practice [40]. Recognizing this, in 2015 (immediately prior to restoration in 2016), the Upper Deschutes Watershed Council surveyed vegetation in ‘Canyon Reach 4’ and we resurveyed the reach again in 2018. Detailed observations of changes in plant community composition and the provision of wetland ecosystem services were also made. In the remainder of our paper, we use the results of the 2015 and 2018 vegetation surveys to assess the initial performance of full floodplain reconnection of ‘Canyon Reach 4’ in increasing the extent and diversity of riparian vegetation and enhancing wetland functions, two years after project completion. This corresponds to the first of the study objectives, as stated above.
To achieve the second and third objectives, the survey results for ‘Canyon Reach 4’ in 2018 are compared to those recorded in 2018 at the following points:
  • ‘Canyon Reach 3’, which is immediately upstream of ‘Canyon Reach 4’ and which is unrestored;
  • The upper 550 m of Camp Polk Meadow Preserve, which was restored to the form of an alluvial fan between 2009 and 2012, and which subsequently evolved towards its multi-channel, pre-disturbance, or Stage 0, condition (see Figure 2c,d, above).

3. Study Reaches and Sampling Methodology

3.1. Study Reaches

Sampling was performed within three study reaches of Whychus Creek:
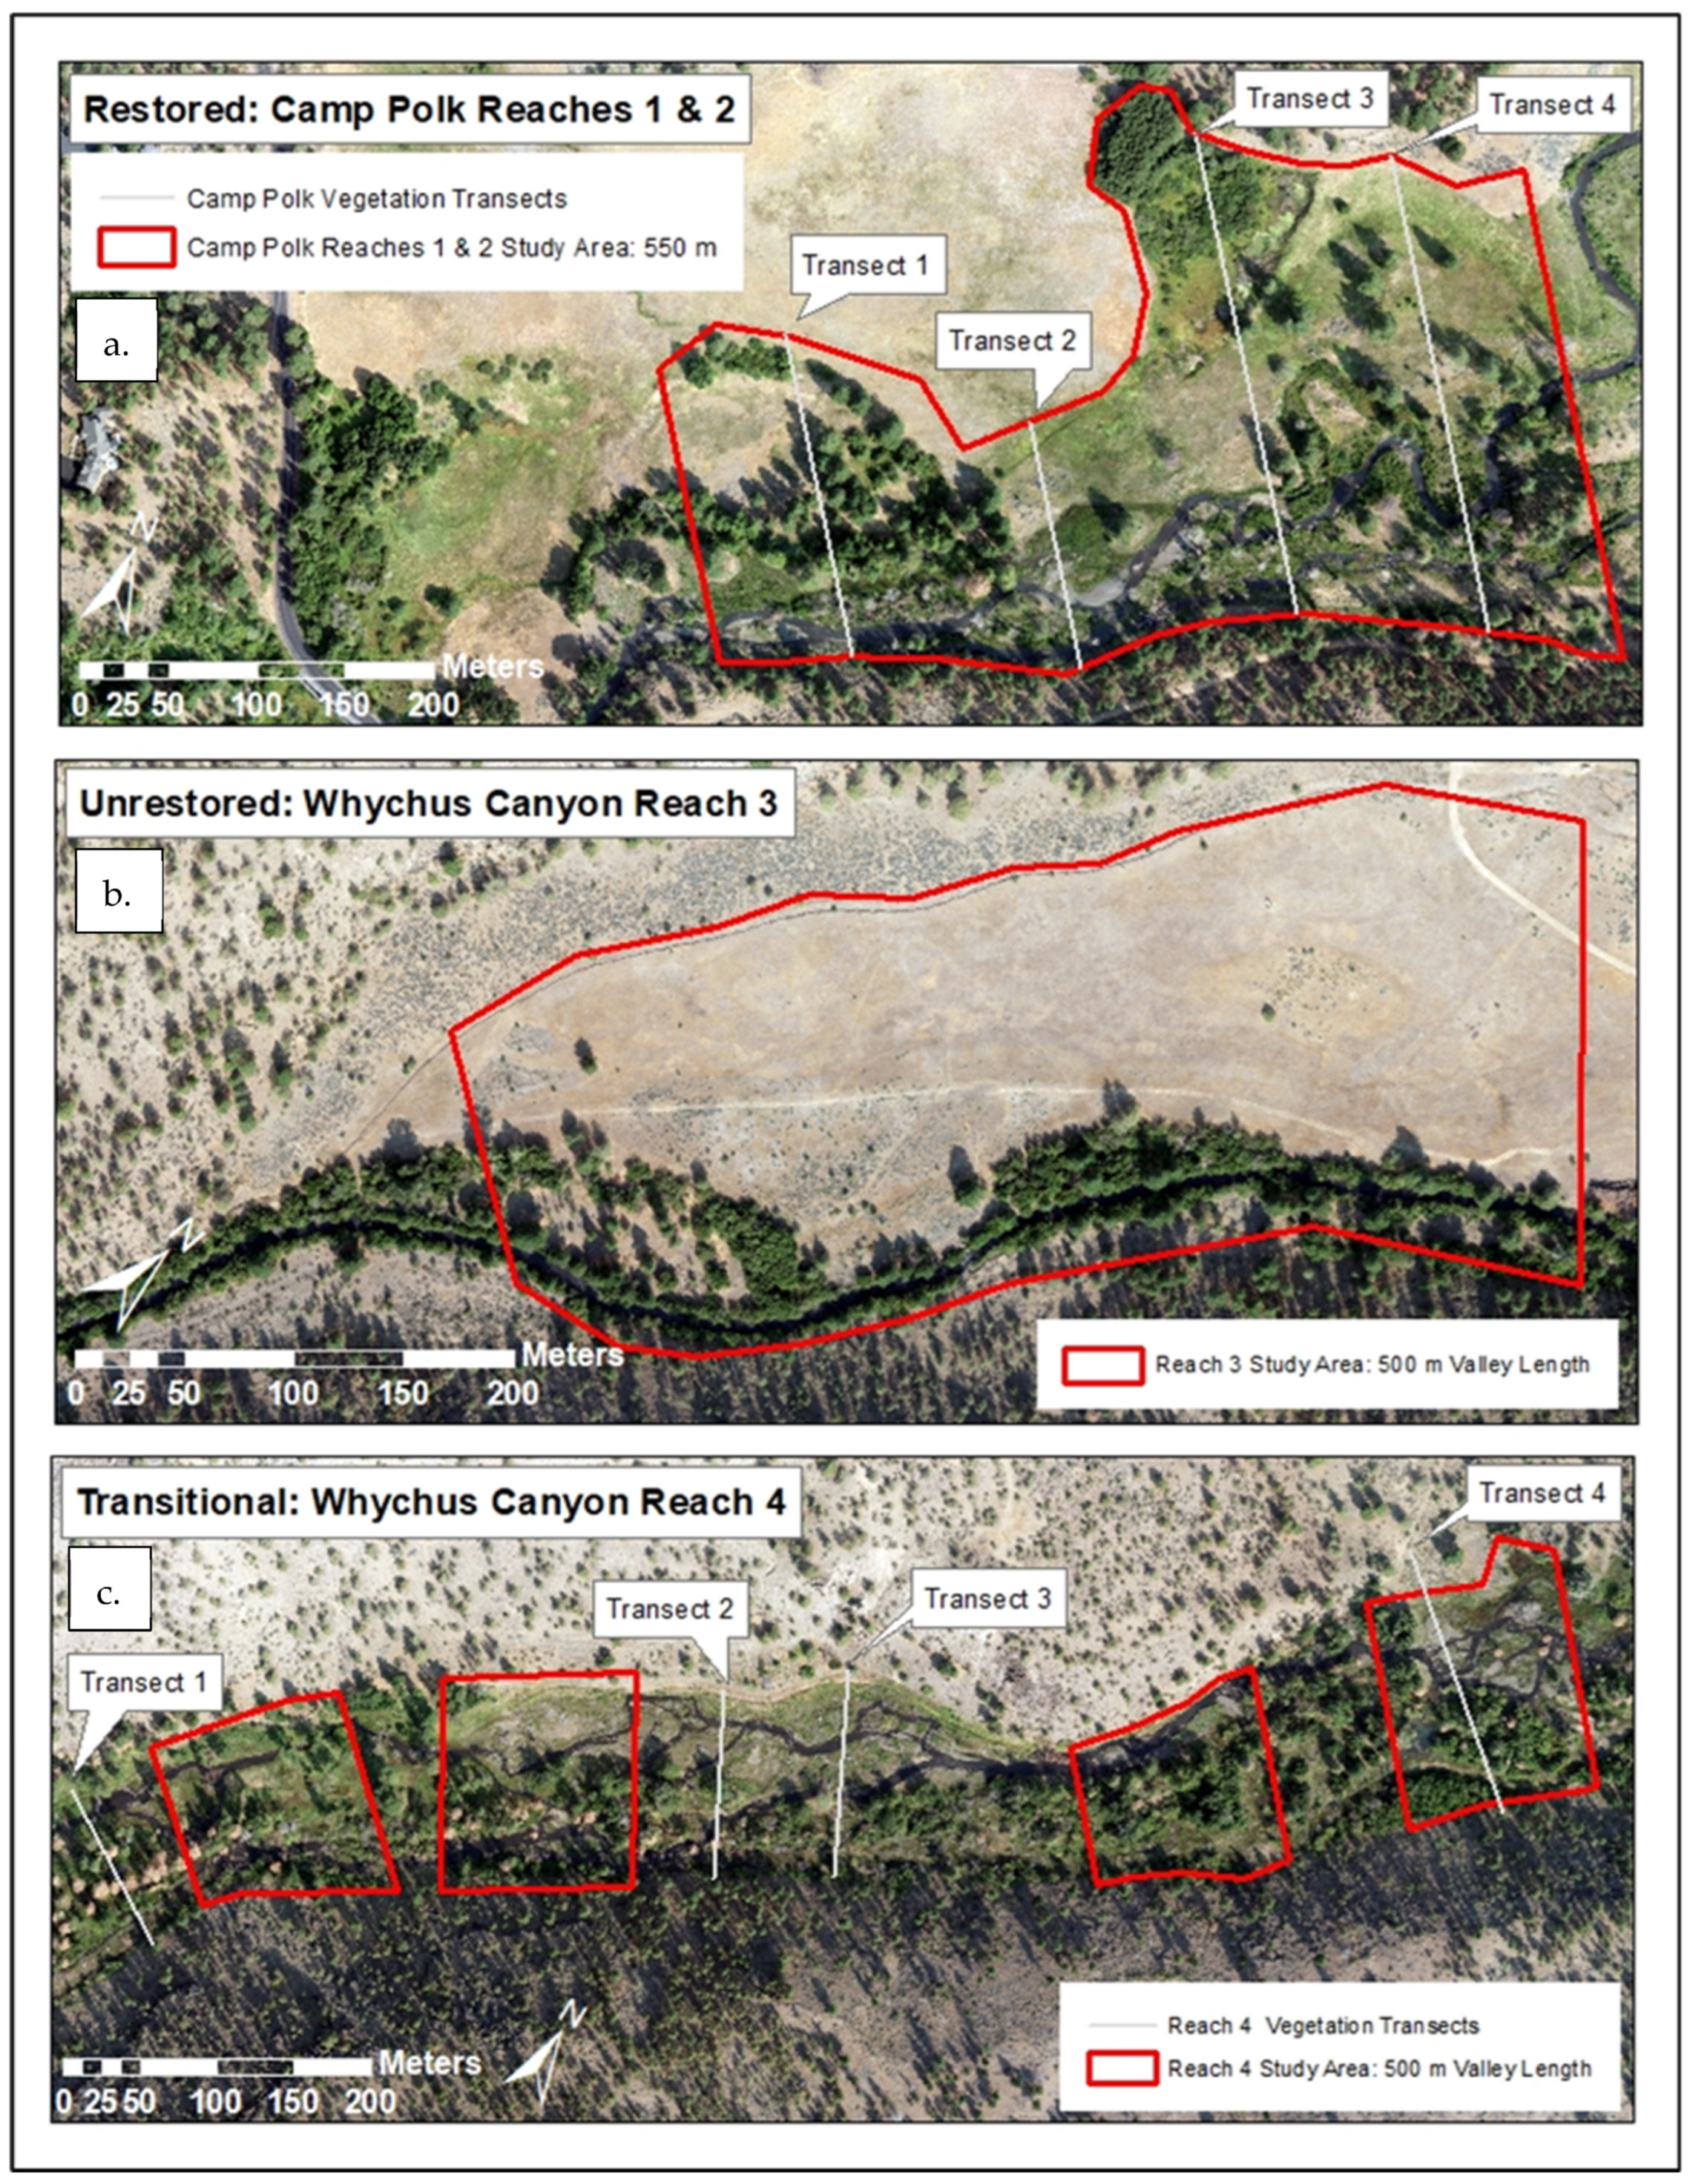
  • Camp Polk Meadow Preserve (‘Camp Polk Meadow’), where 2.4 km of the valley floor was restored using a modified Natural Channel Design between 2009 and 2012. The uppermost 550 m of the meadow has since naturally developed a multi-channel river–wetland corridor that resembles a Stage 0 condition. Throughout this paper, we refer to this study reach as being ‘restored’ (Figure 4a);
  • Whychus Canyon Reach 3 (‘Canyon Reach 3’), which is unrestored and represents the pre-restoration condition of degraded and simplified stream habitat along Whychus Creek. We refer to this reach as being the ‘control’ (Figure 4b);
  • Whychus Canyon Reach 4 (‘Canyon Reach 4’), where 1.6 km of the valley floor was restored to its Stage 0 condition in summer 2016. We refer to this reach as being in ‘transition’ (Figure 4c).

3.2. Vegetation Transect Sampling

Vegetation was sampled along transects, which is a long-established, standard method that provides an efficient, systematic, and objective way to gather data suitable for calculating the abundance, richness, and percentage cover of shrubby vegetation [45], which is still widely used [46]. It offers standardized measurements, reduces sampling error, and is more practical than trying to survey the entire study area. Using fixed transects also supports consistent re-sampling as part of long-term vegetation monitoring.
In the summer of 2015, pre-restoration vegetation data were collected along the four transects in ‘Canyon Reach 4’, shown in white in Figure 4c. These transects were re-surveyed in August 2018 to enable comparison between pre- and post-restoration vegetation characteristics. Because the transects were established in 2015, prior to selection of the plant community focal study quadrats in 2018, their locations are unrelated to those quadrats. In August 2018, we also set up and surveyed four comparable transects within the study area of ‘Camp Polk Meadow’ (Figure 4a). No transects were set up in ‘Canyon Reach 3’ because there were no discernible changes in the vegetation in the unrestored control reach (see Figure 4b).
To sample the vegetation along each transect, a pin was lowered on the upstream side of the tape at 1.2 m (4 ft) intervals. Species and height data for all the plants touched by the pin were recorded on custom datasheets. Living plants were recorded to species level and dead plants were recorded as litter unless they could be positively identified. For example, although the standing cheatgrass (Bromus tectorum) had died by the time of our field campaign (in August), it was easily identified and so was classified to species level.
As all transects are valley-wide, their lengths differed. Sample points were uniformly spaced at 1.2 m intervals, so the percentage of the transect represented by each sample point differed between transects. To account for this in the results, the number of points along a transect where a particular plant species was encountered was converted to a percentage of the total number of points along that transect. The maximum cover for an individual species is 100%. However, because multiple species were often recorded at a single sample point, the total percentage of cover for all species at a transect is likely to exceed 100%.
In addition to collecting data on the plants encountered at each sample point, we also observed the composition of the ground surface (i.e., bare earth, sand, gravel, large wood, or litter (i.e., the undecomposed remains of dead vegetation)) and again converted the absolute numbers of surface-type observations along each transect into percentages.

3.3. Plant Community Focal Study Sampling

Quadrats have been used in field ecology since 1898, often being used alongside transects for the standardized, long-term monitoring of restoration-driven succession in diverse ecosystems [47]. The great advantage of this sampling method is that the dimensions of sample quadrats can be adjusted to match the study’s objectives and sampling strategy, and quadrats remain a standard method in vegetation studies (e.g., Yang et al. [48]).
In August 2018, we established focal plant community study areas (i.e., quadrats) in all three study reaches. Single 500 m long quadrats were established at ‘Canyon Reach 3’ and ‘Camp Polk Meadow’. The quadrat at ‘Camp Polk Meadow’ was later extended downstream by 50 m to capture the full extent of Stage 0 conditions in the reach. To capture the habitat diversity apparent in the longer 1.6 km of restored creek at ‘Canyon Reach 4’, we divided that study reach into 4 × 125 m long study sub-areas, distributed along its length, and situated one quadrat in each. In Figure 4 (above), the focal plant community quadrats within each study reach are outlined in red.
We conducted detailed floristic observations in these quadrats, paying particular attention to local geomorphological features and wildlife. We recorded all plant species observed using botanical names taken from the USDA (2018) ‘PLANTS’ database https://plants.usda.gov/ (accessed on 8 January 2026).

3.4. Riparian and Wetland Functions Assessment Method

To assess wetland functions, we used a scientifically robust and legally recognized method for classifying Oregon’s wetlands [49]. Full details of the principles and rationality of the method are provided in Supplementary Materials Section S2. See also [50] and [51].
In applying the method, surveyors followed the standard set of specific instructions laid out in the methodological guide authored by Adamus [49] to generate numerical scores for the 13 wetland functions listed in Table 1.
Numerous methods exist to assess wetlands. We selected this method for the following reasons:
  • It was developed specifically for use in the State of Oregon.
  • It provides numeric scores for wetland functions.
  • It is a standard, legally approved method that is extensively referenced in the technical literature.
  • It generates scores that are comparable with those for other wetlands across the State of Oregon.
  • It has been applied in at least 50 similar studies.
  • It is more time-efficient than alternative methods.
For further justification, see Supplementary Materials Section S2.

4. Data Processing

All the information and data collected in the field were transcribed into Excel worksheets, and a quality control and assurance review was performed to ensure any issues related to data recording and transcription were resolved.
For the vegetation communities observed, we assessed each plant’s indicator status, which is a measure of a plant’s likelihood to occur in wetlands versus non-wetlands [53]. We used five wetland indicator status ratings to determine whether a species is hydrophytic. These indicator status ratings are based on the following attributes:
  • Obligate Wetland (OBL) plants almost always occur in wetlands;
  • Facultative Wetland (FACW) plants usually occur in wetlands, but are occasionally found in uplands;
  • Facultative (FAC) plants occur in both wetlands and uplands;
  • Facultative Upland (FACU) plants usually occur in uplands, but may occur in wetlands;
  • Upland (UPL) plants almost always occur in uplands.
Following the guidance first provided by the U.S. Army Corps of Engineers [53,54], all species not listed on the national wetland plant list were listed as upland plants (UPL).
Matlab (R2023b) scripts were compiled to plot the results and perform the statistical analyses. Factor analysis was carried out using SPSS (version 25). When comparing study reaches, some data (e.g., transect biodiversity) were normalized to sum to 100%. Whether original or normalized data were used for each analysis is indicated in the resulting graphs. Kruskal–Wallis tests were used to compare the distributions of specific floristic variables and wetland function scores. For comparisons involving two groups, the calculation of significance levels by the Kruskal–Wallis test is mathematically equivalent to the Wilcoxon rank-sum test and to the Mann–Whitney U test, and produces the same p-value.
We applied comparative statistical analyses to the results of vegetation transect surveys at ‘Canyon Reach 4’ in 2015, ‘Canyon Reach 4’ in 2018, and ‘Camp Polk Meadow’ in 2018. To identify differences in vegetation assemblages, factor analysis using principal-component extraction and Varimax rotation with Kaiser Normalization was conducted, along with calculations of Jaccard correlation coefficients and Sørensen similarity indices.

5. Results

5.1. Study Reach Plant Communities

5.1.1. Overview

Before presenting the results relevant to the four stated objectives of our study, it is useful to set the context for those results based on the plant assemblages recorded across the three study reaches, together with our observations of characteristic species found in each study reach.
In total, 90 species of vascular plants were recorded across all the focal study quadrats in Whychus Creek. A complete list of the plants recorded is in the Supplementary Materials Section S3. Plants observed include species from all five indicator status ratings (Table 2).
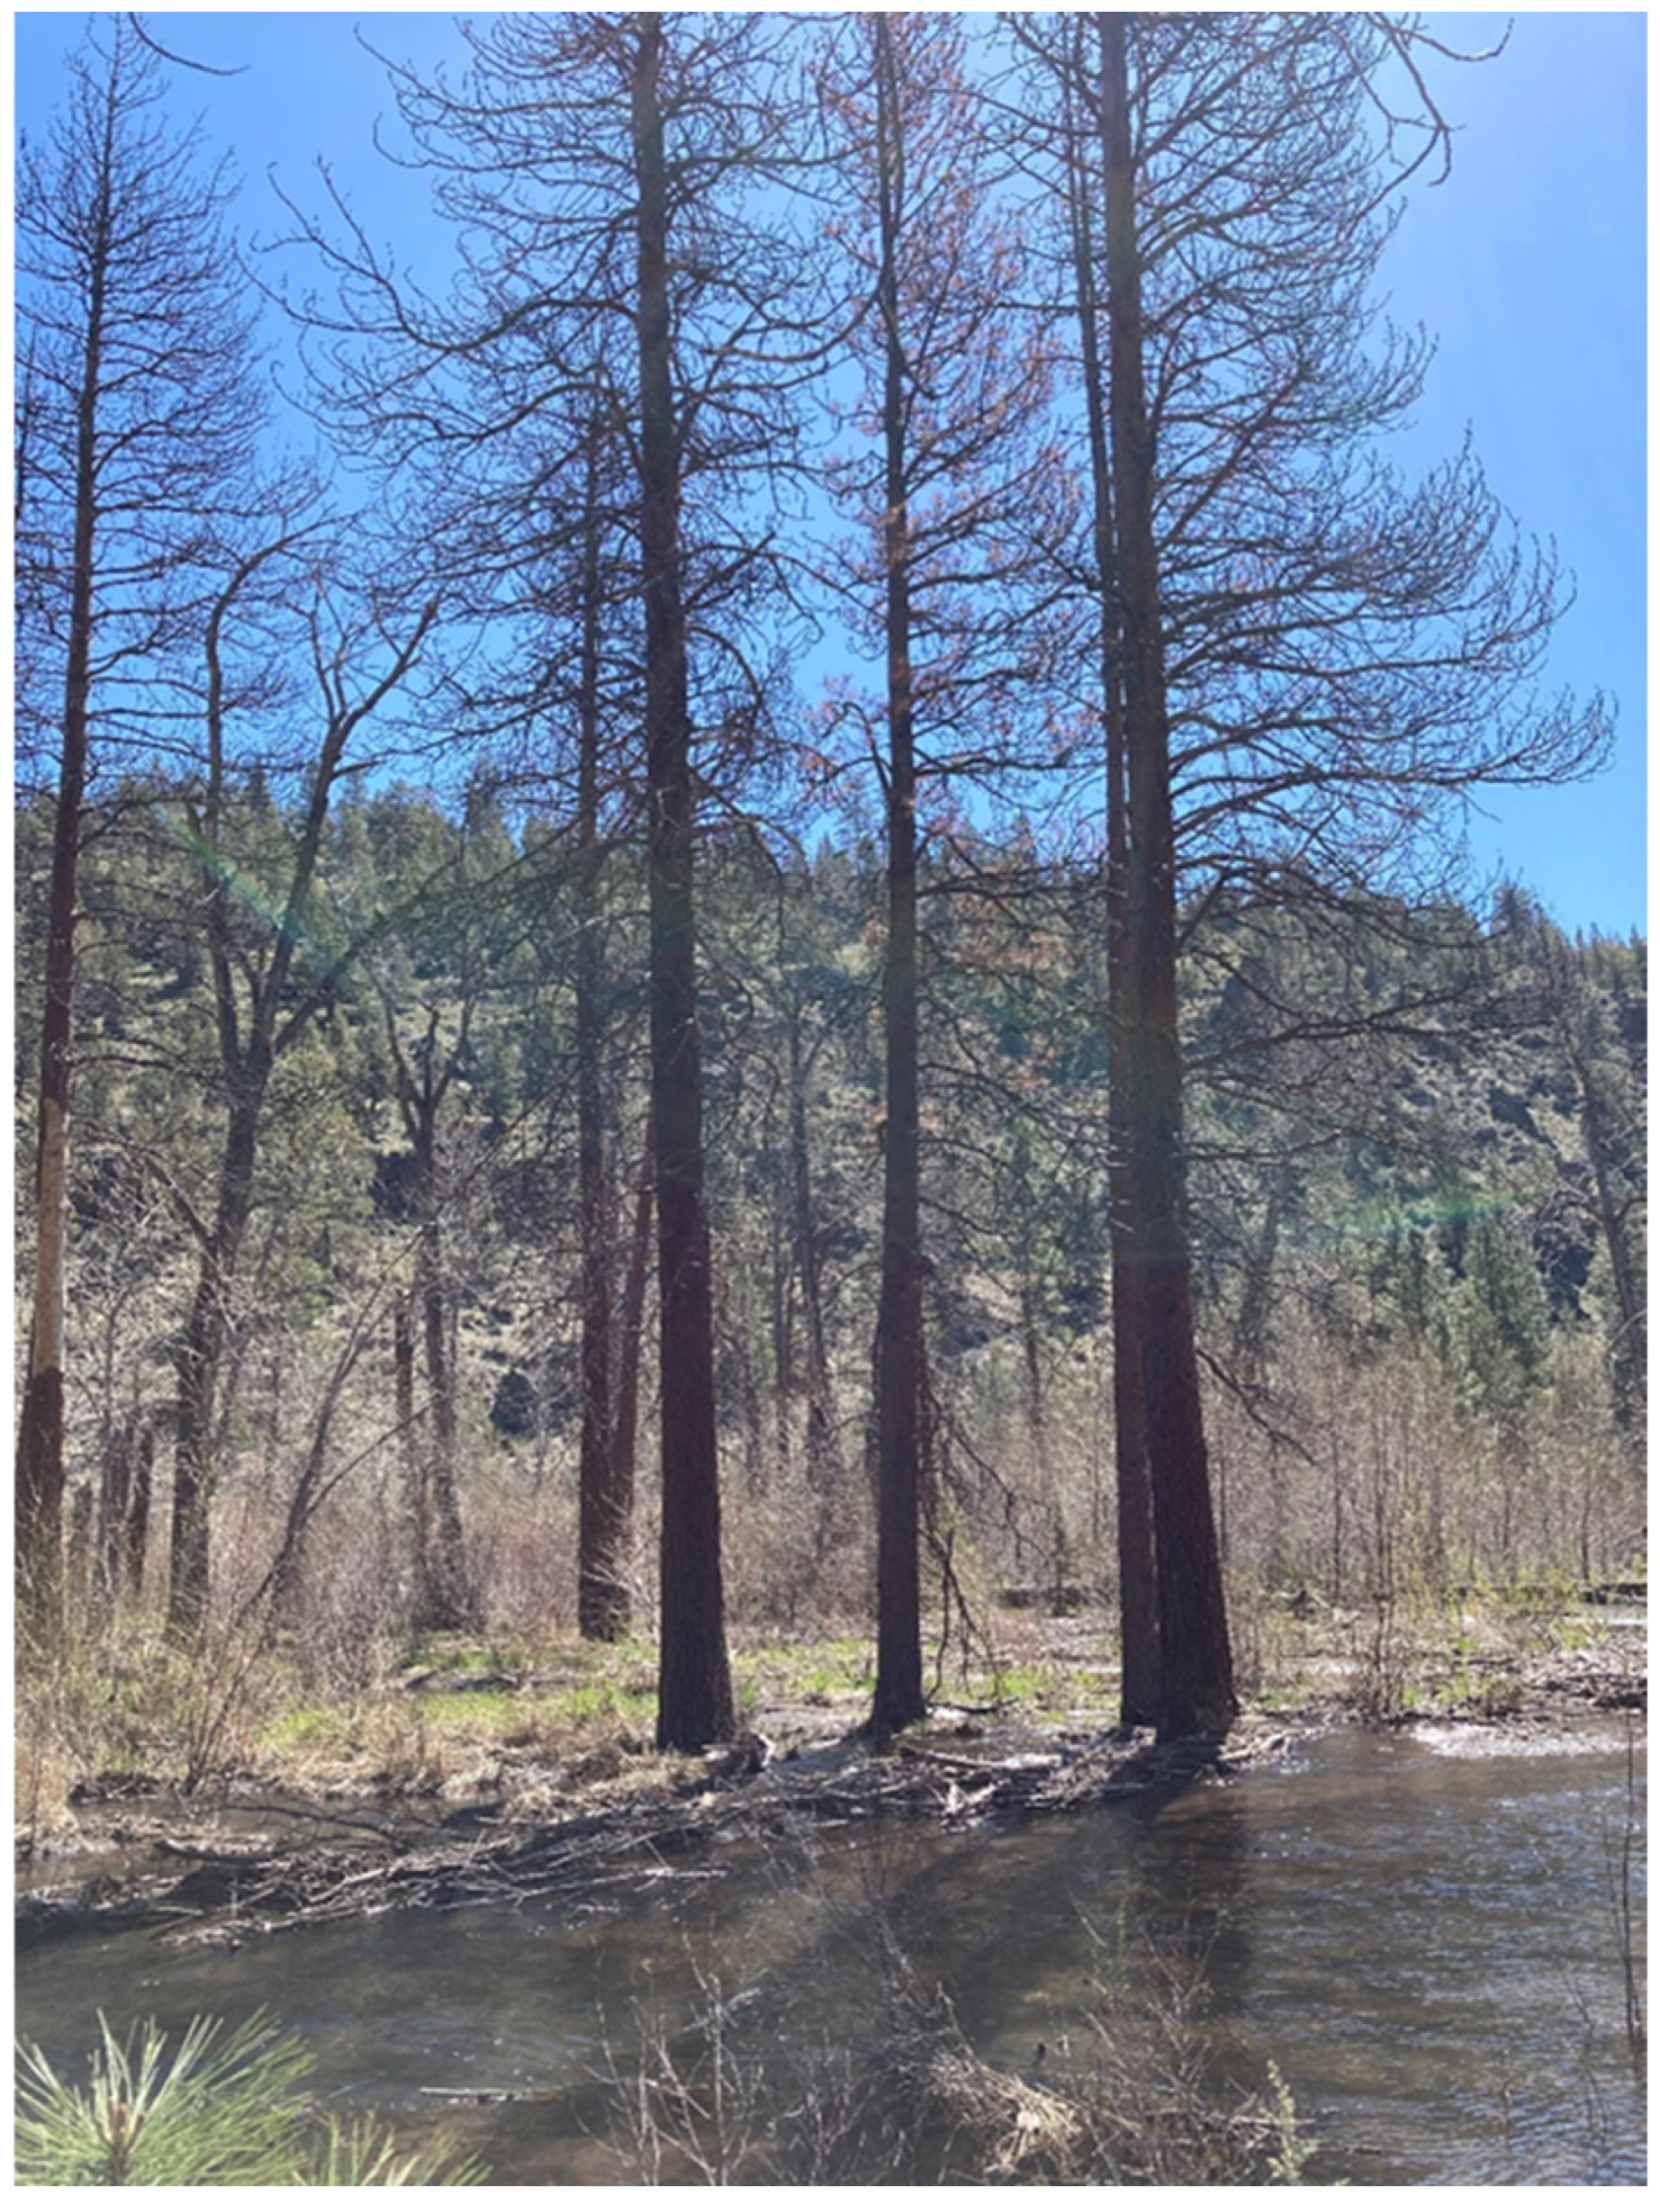
There was an apparent inconsistency with this indicator series concerning Ponderosa pines (Pinus ponderosa), which have the status Facultative Upland, meaning that they can occasionally be found in wetlands. Ponderosa pines grow across a 1500 m range of elevations throughout the Cascades [55,56] and were observed in all three study reaches of Whychus Creek. However, while the mature ponderosa pines in ‘Canyon Reach 3’ were thriving, those at ‘Camp Polk Meadow’ and ‘Canyon Reach 4’ were either in poor health, dying, or dead (Figure 5), which is inconsistent with their indicator status of Facultative Upland.
We attribute the deterioration of the ponderosa pines in ‘Canyon Reach 4’ and at ‘Camp Polk Meadow’ to the rapidity with which the water tables in those reaches rose following restoration. We conclude that the pine trees had insufficient time to adapt to the wetter conditions in the rehydrated floodplains despite their indicator status being Facultative Upland.
The geomorphic characteristics and plant community attributes observed in the study areas of the three study reaches are summarized in the following sub-sections.

5.1.2. ‘Canyon Reach 3’ (Control)

The disconnected floodplain is around 3 m higher than the incised channel and, during the field study in August 2018, it was dominated by the invasive grass Bromus tectorum, which had senesced due to a long, antecedent, dry period. Two upland shrubs, Ericameria nauseosa and Chrysothamnus viscidiflorus, were widely observed on the disconnected floodplain. The channel is degraded and geomorphically simple, the riparian corridor is narrow, and no hydric soils were observed. The few plants still green in August were clustered along the channel. We observed herbs (including rare occurrences of Achillea millefolium, Juncus ensifolius, Carex sp., Cirsium arvense, Dipsacus sylvestris, and occasional Centaurea stoebe), and shrubs and trees (represented by Populus balsamifera ssp. trichocarpa, Alnus incana, Juniperus occidentalis, Cornus sericea, Betula occidentalis and Pinus ponderosa). As noted above, the Pinus ponderosa on the drained floodplain in the control reach were observed to be thriving, and the largest tree in this reach (Diameter at Breast Height—DBH = 0.86 m) was indeed a Pinus ponderosa, which is classed as a Facultative Upland species.

5.1.3. ‘Canyon Reach 4’ (Transition)

The geomorphological and biological diversities in this reach were greater than in the control reach. Widely observed native plants included Deschampsia spp., Elymus repens, Tragopogon dubius, Lactuca serriola, Equisetum spp., Mimulus spp., Juncus spp. (including J. balticus, J. effusus, J. ensifolius and J. articulatus—the latter being a new species for the site), and Carex spp. (including C. pellita, another new species for the site). Ericameria nauseosa and Chrysothamnus viscidiflorus were observed in higher/dryer areas. Invasive species Centaurea stoebe and Verbascum thapsus were widespread, although observations of the latter were reduced due to its on-going removal as part of post-restoration management. Another potentially invasive plant, Rumex crispus, was observed in lower/wetter areas, while the upland invasive species Sisymbrium altissimum was observed in higher/dryer areas. A further invasive, Erodium cicutarium, was commonly encountered along the unpaved track that runs parallel to the creek in this reach.
In contrast to Canyon Reach 3, Salix spp. were common in this reach, and there was evidence of developing hydric soils, albeit in a small number of samples. Standing water (a habitat absent from Canyon Reach 3), was observed at a number of locations, including one sizable pond fringed by Typha latifolia. Also, in contrast to Canyon Reach 3, the Pinus ponderosa observed on the floodplain in Reach 4 were in poor health, dying, or dead.

5.1.4. ‘Camp Polk Meadow’ (Restored)

Geomorphological and biological diversities were highest in this reach. Plants that were not on the existing Camp Polk Meadow Preserve plant list (e.g., Madia glomerata and Carex pellita) were observed. Most plants were native species, and the proportion of invasives was lower than those recorded at the control and transition reaches. That said, the invasive species Rumex crispus and Verbascum thapsus were present, albeit mostly in small to moderate densities.
The extensive, wet areas were dominated by Carex and Juncus species, Typha latifolia, Phalaris arundinacea and Scirpus microcarpus, with Equisetum hyemale, and herbs/forbs (e.g., Solidago canadensis and Epilobium ciliatum) were also present. Leymus cinereus, Equisetum arvense, Holcus lanatus, Rumex crispus (non-native), Smilacina stellata and Mimulus spp. were observed in the damp and shaded habitats.
Drier areas were mainly occupied by native grasses, including Agrostis spp., Festuca spp., and Elymus repens. While observations of the non-native, introduced, Poa pratensis, and invasive Bromus tectorum were few, where they did occur they were often locally frequent or abundant. Upland shrubs including Ericameria nauseosa and Chrysothamnus viscidiflorus were common, as were drought-tolerant Juncus and Carex species. We also observed Achillea millefolium and the non-natives Tragopogon dubius, Lactuca serriola and Verbascum thapsus.
Woody plants were mainly Alnus incana, Pinus ponderosa, Salix spp., Populus balsamifera ssp. trichocarpa, and Populus tremuloides. Other widely observed trees and shrubs included Cornus sericea, Betula occidentalis, Juniperus occidentalis, Spiraea douglasii, and Ribes cereum (which, although widely observed at ‘Camp Polk Meadow’, was not recorded in any of the transects—see Supplementary Materials Section S3). The upland species Purshia tridentata was present, but it was mostly confined to the toe of the valley side slope defining the southern boundary of the study area, and so was not recorded. As noted above, only the Pinus ponderosa (Facultative Upland plant species) specimens observed on the higher, drier parts of floodplain at ‘Camp Polk Meadow’ were healthy; most trees of this species were dying or dead.

5.2. Comparison of Pre-Restoration (2015) and Post-Restoration (2018) Transect Surveys in ‘Canyon Reach 4’ (Transition)

5.2.1. Changes in Plant Communities

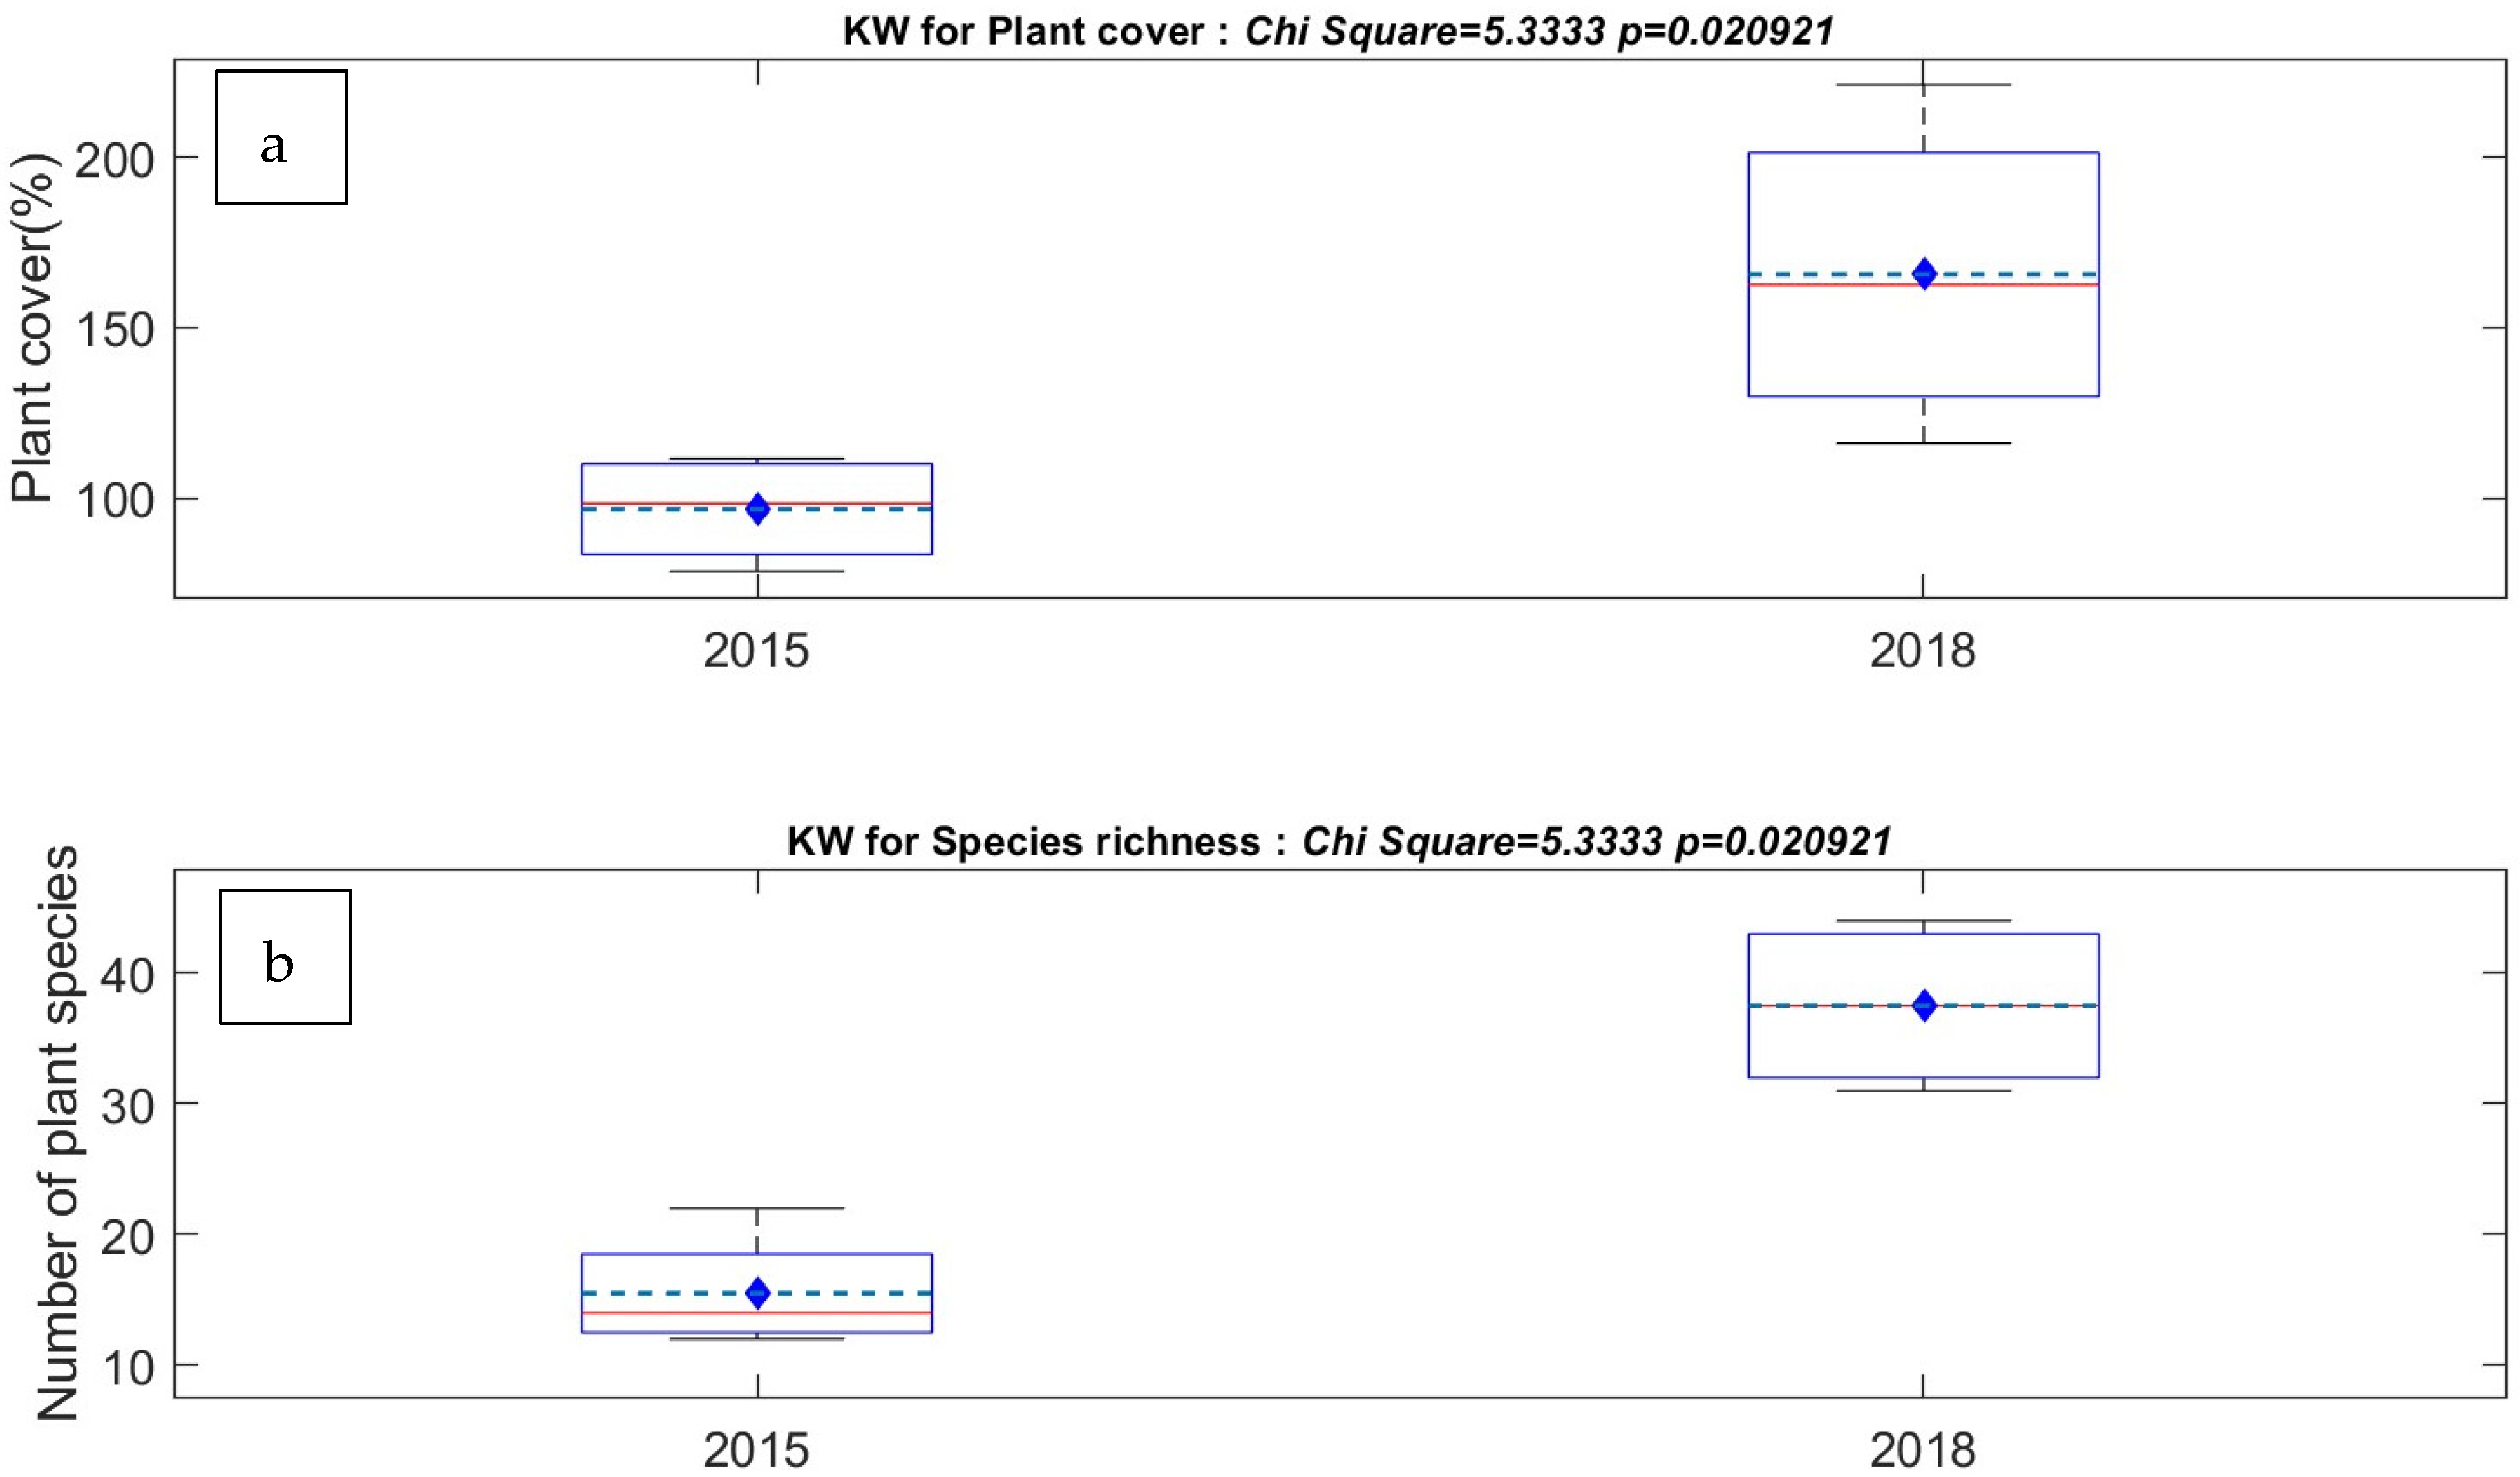
To address study Objective 1, we first aggregated data for all observed plant groups. The results for ‘Canyon Reach 4’ (transition) demonstrate statistically significant increases in both percentage cover and species richness (Figure 6a and Figure 6b, respectively).
Next, we separated out results for wetland and upland plants. In our analysis, wetland species were considered to be plants with indicator status OBL or FACW, while upland plants were considered to be those with the indicator status FACU or UPL. As plants with FAC (i.e., facultative) indicator status are found in both wetlands and uplands, they were not included in our comparison of changes specific to wetland and upland plants.
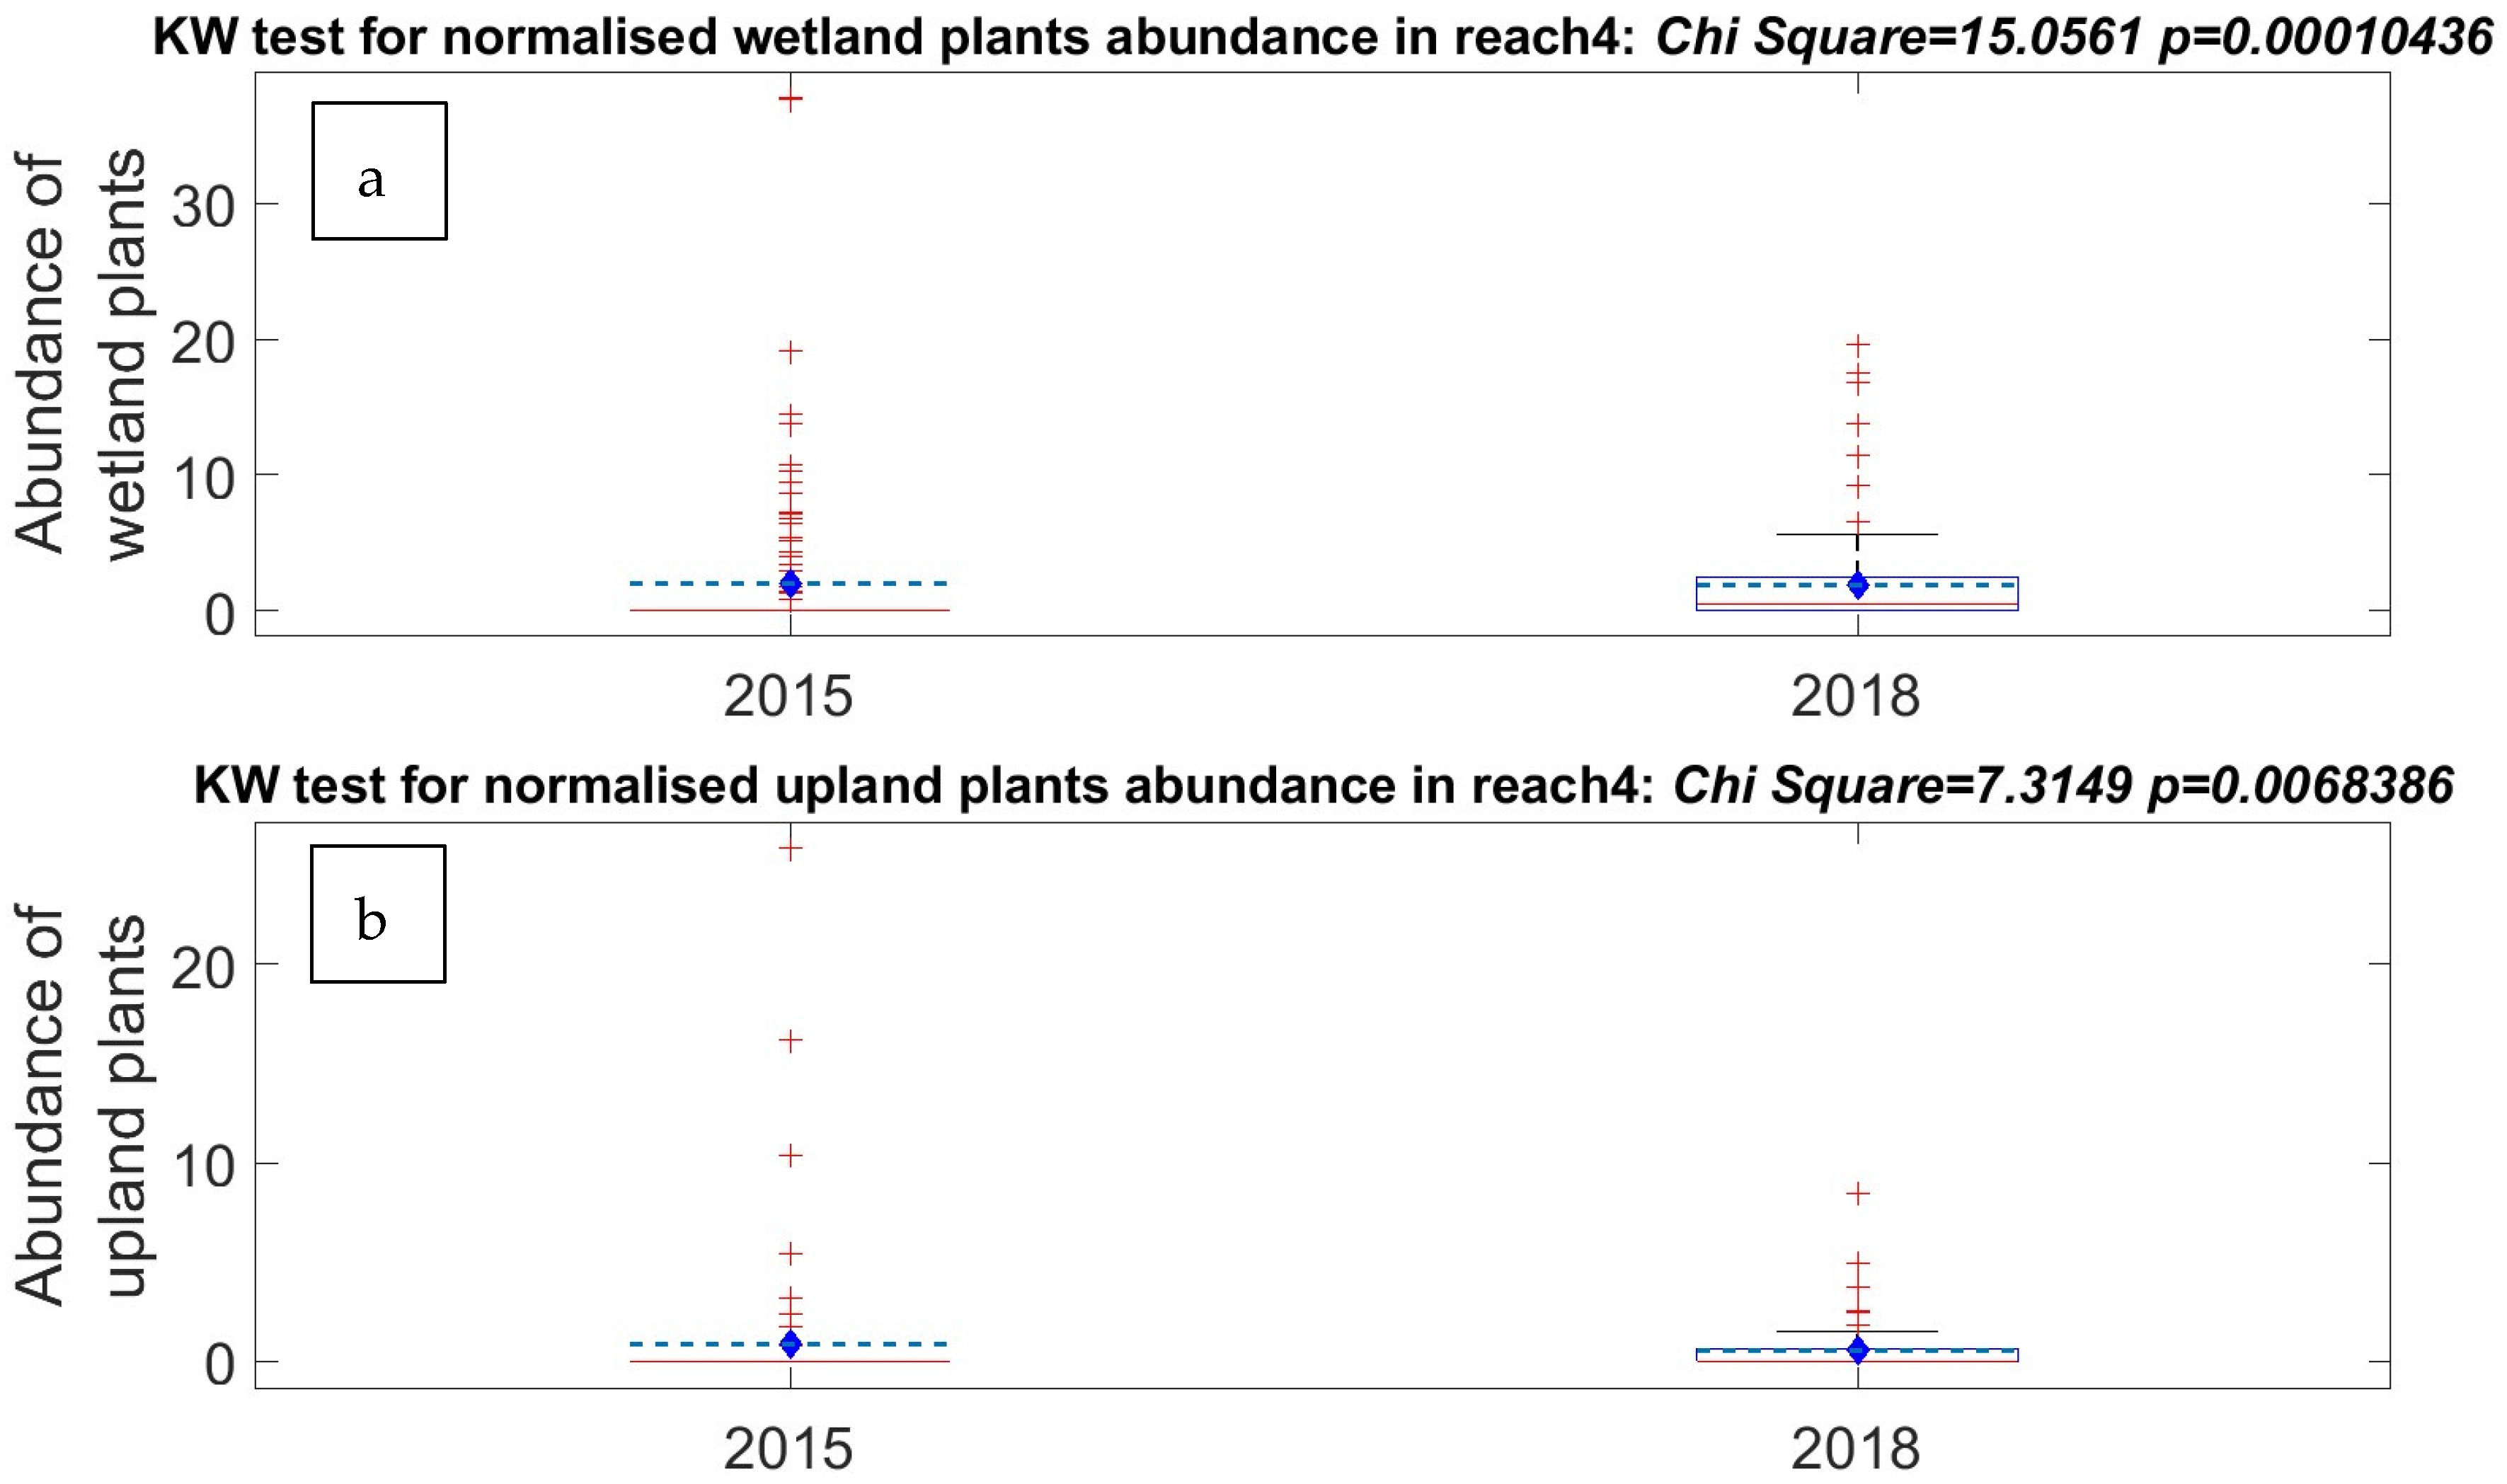
Analysis of the normalized plant abundance data pooled for all four transects show that the abundance of wetland and upland plants both increased significantly (p < 0.05) during the two years since restoration (Figure 7).
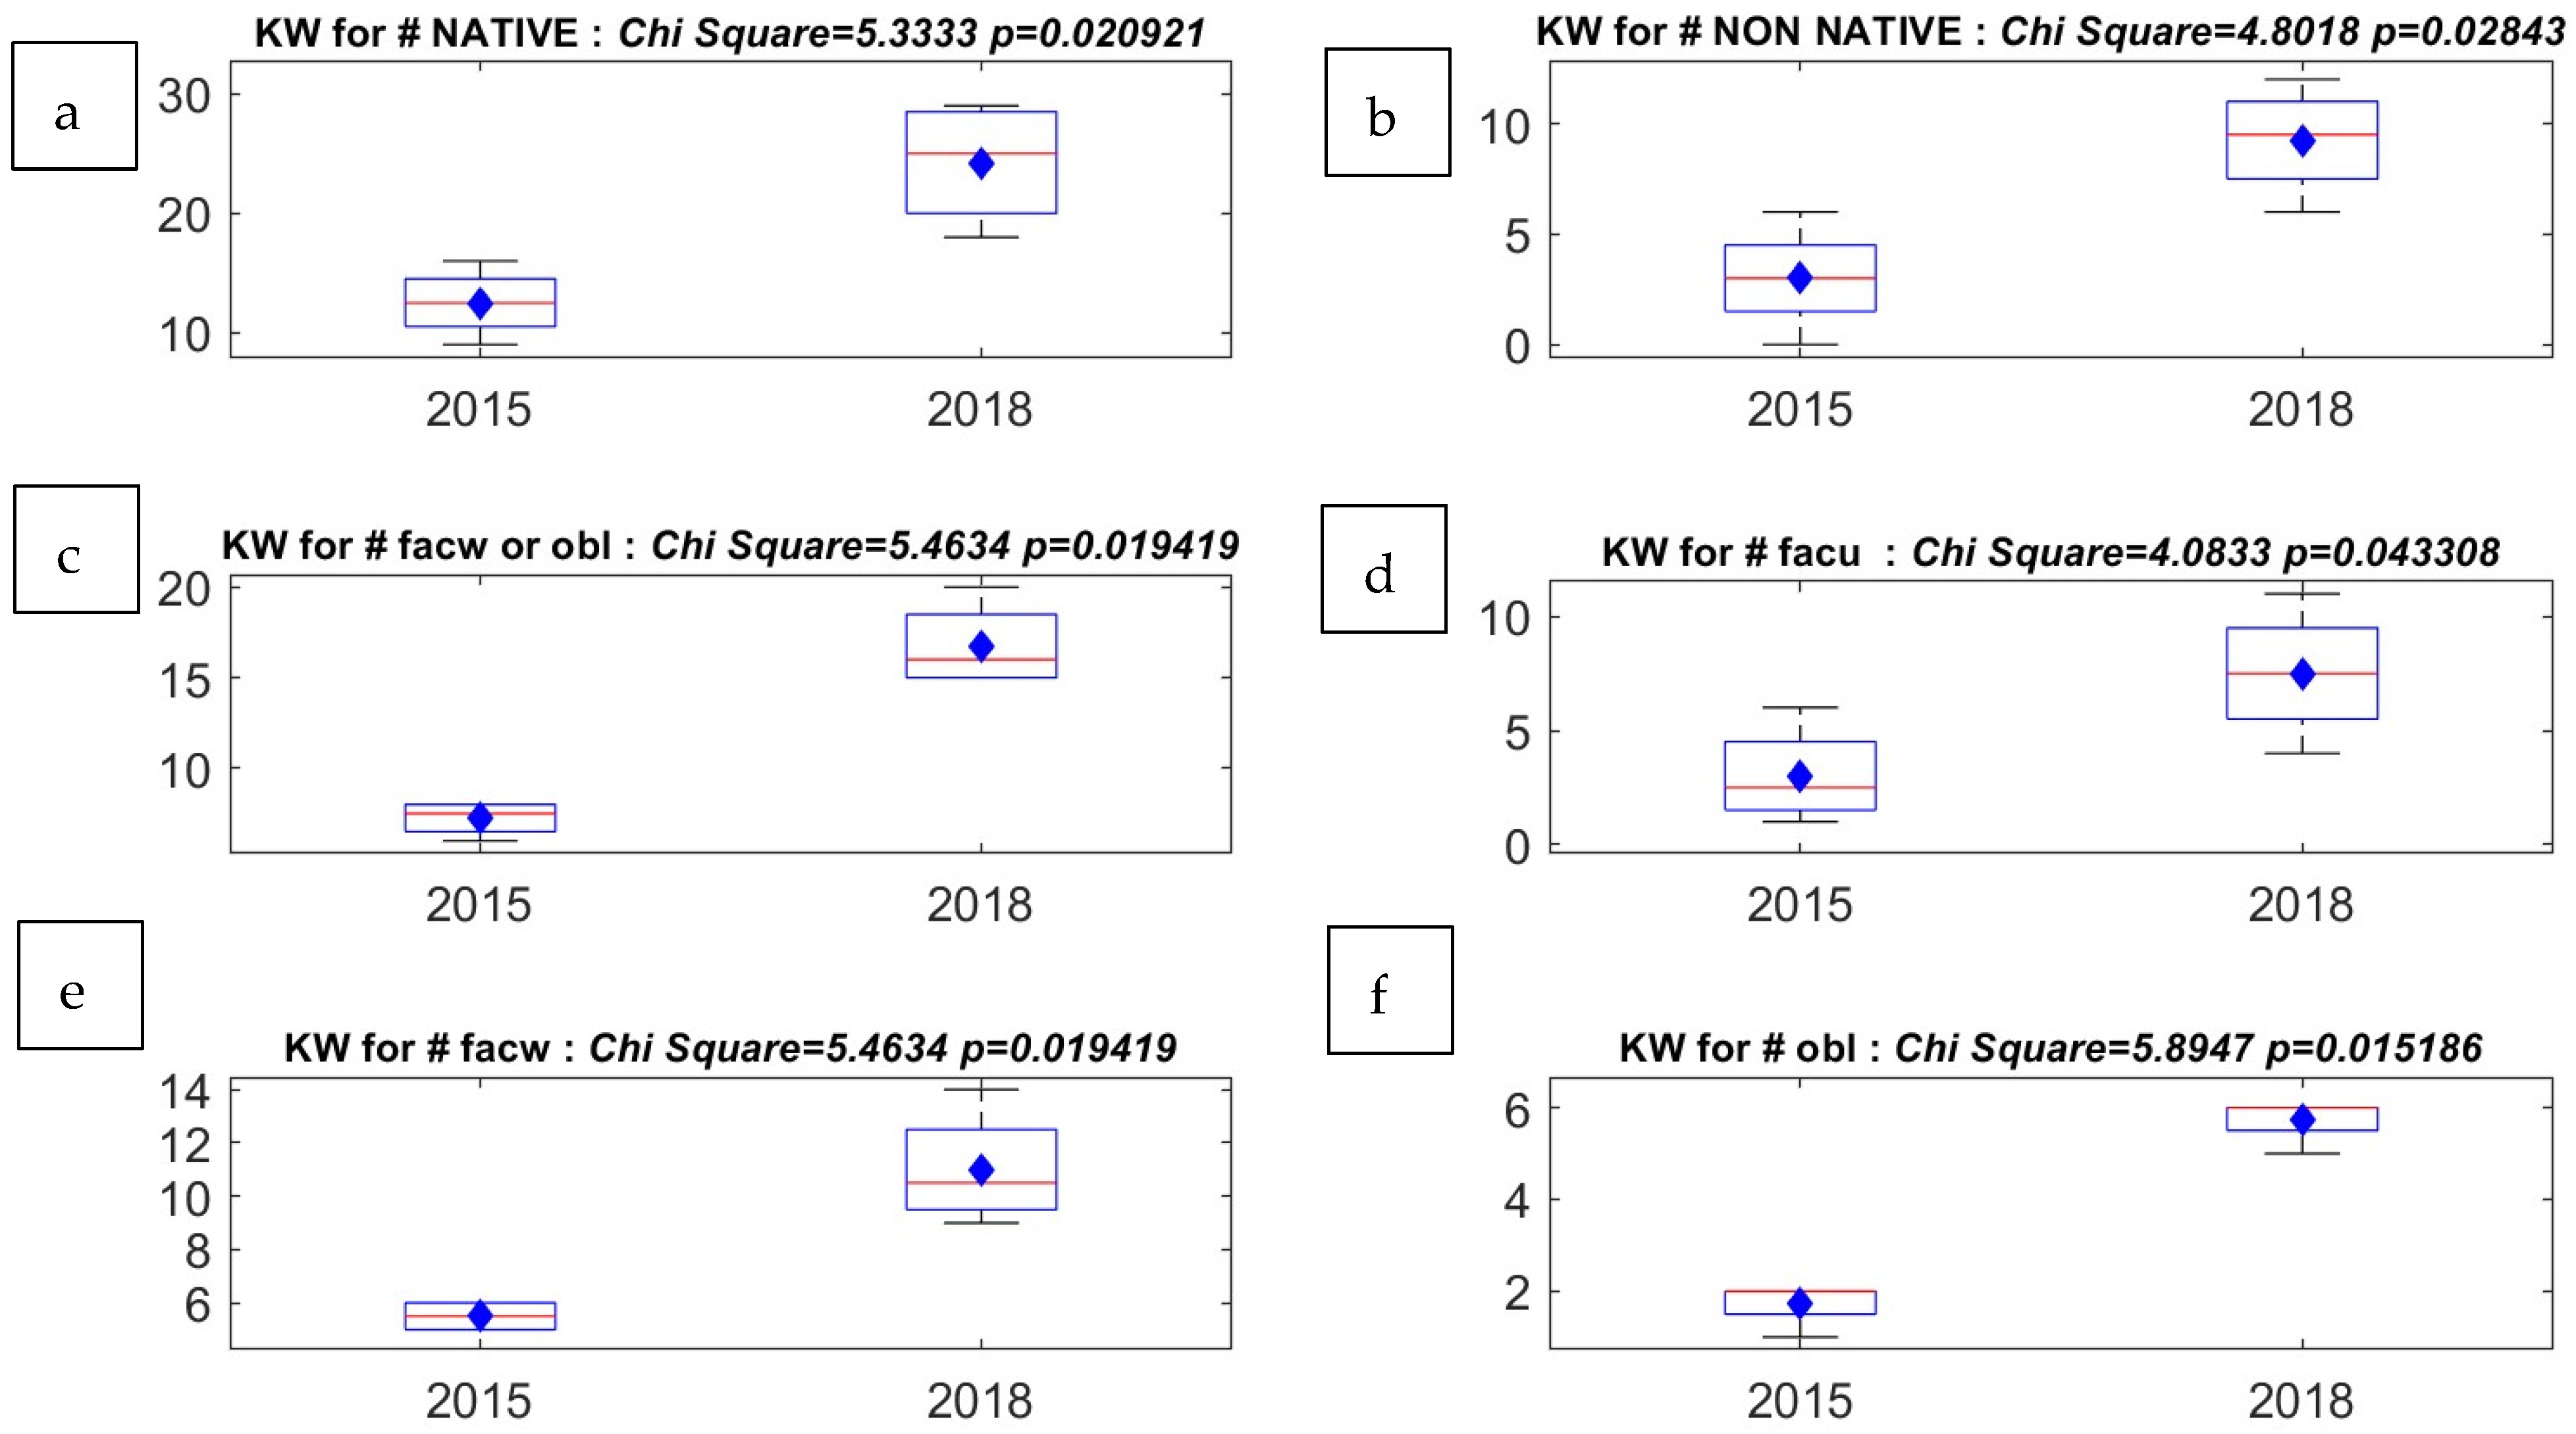
The results of transect surveys for the species richness of specific plant groups are plotted in Figure 8. There were significant (p < 0.05) increases in the species richness of native plants and non-native plants, and those with the statuses of obligate wetland, facultative wetland, and facultative upland. In short, the results for species richness show similar tendencies to those reported above for plant abundance.

5.2.2. Changes in Ground Cover and Large Wood

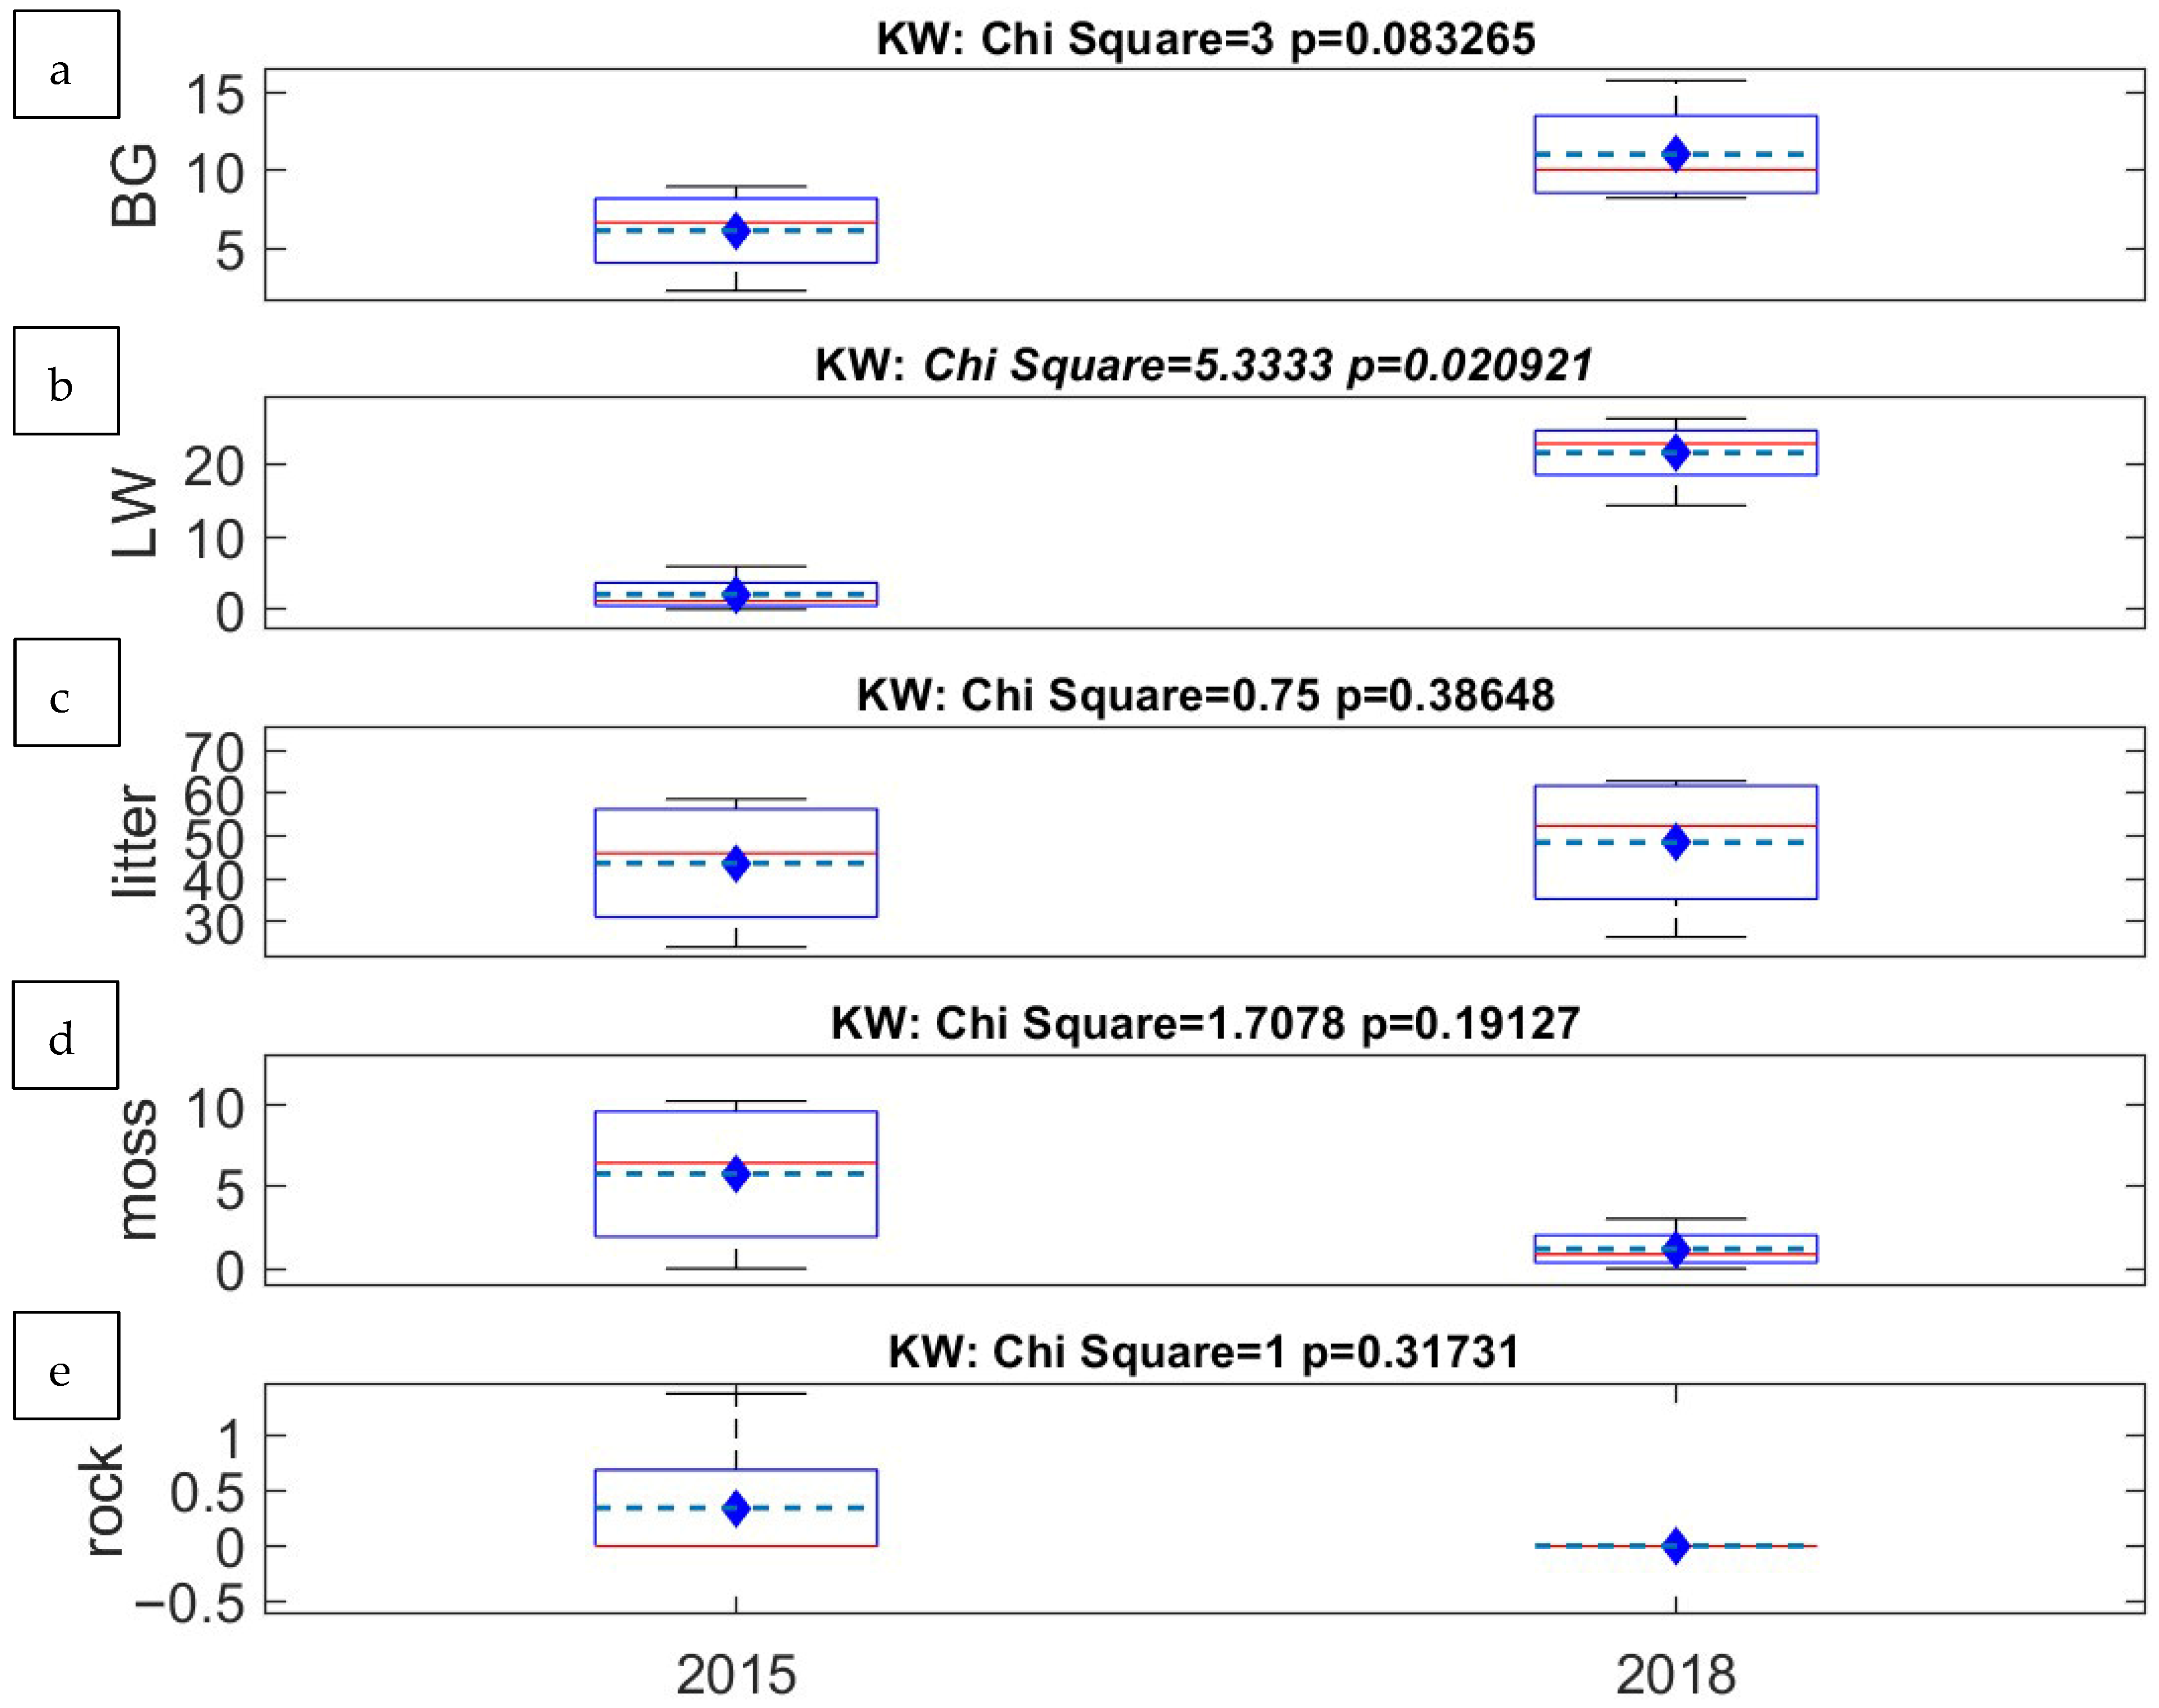
In addition to significant increases in plant abundance and richness, we also observed noticeable increases in the percentage covers of bare ground, large wood, and litter in ‘Canyon Reach 4’ following restoration (Figure 9). In contrast, areas of moss and exposed bedrock decreased. Statistically, only the increase in large wood was significant (p < 0.05).

5.3. Comparisons Between the Vegetation Transect Surveys in ‘Canyon Reach 4’ (2015, 2018) and ‘Camp Polk Meadow’ (2018)

Here, we report the results relevant to achieving study Objective 2. These results stem from comparisons between vegetation transect results obtained in 2015 and 2018 in ‘Canyon Reach 4’ (transition) and in 2018 at ‘Camp Polk Meadow’ (restored). For these comparisons, we used factor analysis, incorporating Varimax rotation with Kaiser Normalization. We compiled these results in a Rotated Component Matrix (Table 3).
The factor analysis clearly separates the transect survey data obtained at ‘Canyon Reach 4’ in 2015 (pre-restoration) from the 2018 (post-restoration) surveys at both ‘Canyon Reach 4’ and ‘Camp Polk Meadow’. The three principal components (factors) cumulatively explained 64.72% of the variance observed in the data. These factors appear to reflect a combination of site characteristics and the restoration actions.
Vegetation community composition comparisons were also carried out based on their Jaccard correlation coefficient (JC) and the Sorensen similarity index (SS) (Table 4).
These analyses reveal that the strongest similarity is that between the 2018 ‘Canyon Reach 4’ and 2018 ‘Camp Polk Meadow’ (transition and restored) plant communities, followed by that between the 2015 and 2018 (pre- and post-restoration) plant communities in ‘Canyon Reach 4’. The most dissimilar plant communities were those observed in ‘Canyon Reach 4’ in 2015 (pre-restoration) and at ‘Camp Polk Meadow’ (restored) in 2018.

5.4. Riparian and Wetland Functions Assessment (Objective 3)

This sub-section presents the riparian and wetland functions assessed in 2018, which are relevant to achieving study Objective 3. Also, ‘Canyon Reach 3’ and ‘Canyon Reach 4’ were reassessed in 2019 and the scores were similar to those in 2018 [57]. This result demonstrates that the Oregon Guidebook method [49] is repeatable, which helps validate our selection of this method.
The 2018 assessments generated estimates for 11 of the 13 riparian and wetland functions and contributions to ecosystem services defined by Adamus [49], because the ‘Nitrogen Removal’ and ‘Breeding Waterbird Support’ functions were not assessed. The ‘Nitrogen Removal’ function can only be assessed where well-developed hydric soil features are present [58]. Hydric soils were not observed in any of the study reaches due to the relative immaturity of the wetlands there. For the ‘Breeding Waterbird Support’ function to be assessed, the wetland must include at least one contiguous, lentic water body with an area of >0.5 acres. No such water bodies were observed within the study reaches.
Strictly, ‘Canyon Reach 3’ did not meet the criteria for wetland function assessment because it did not include a riverine impounding or slope/flats category wetland. Nevertheless, this unrestored reach provides baseline values for the assessment of riparian and wetland functions. Prior to restoration, the provision of riparian and wetland functions in Whychus Creek, although lacking, did not result in scores of zero. In that sense, using our estimates for ‘Canyon Reach 3’ as control values in our comparisons (rather than 11 zeros), makes our comparisons conservative. Consequently, confidence is increased in our interpretations of the changes to the provision of riparian and wetland functions following from restoration of ‘Camp Polk Meadow’ and’ Canyon Reach 4’.
Riparian and wetland function scores are listed in Table 5 and the scores for the three study reaches are compared in Table 6.
Overall, Table 5 indicates that ‘Camp Polk Meadow’ (restored) outperforms not only ‘Canyon Reach 3’ (control) but also ‘Canyon Reach 4’ (transition). Notably, the restored reach shows significant improvements in functions such as ‘Water Storage and Delay’, ’Sediment Stabilization and Phosphorus Retention’, and ‘Primary Production’. These enhancements suggest that restoration has successfully increased the capacity of Whychus Creek to store and delay water, stabilize sediments, and create organic matter. Additionally, the higher scores for ‘Resident Fish Habitat Support’ and ‘Anadromous Fish Habitat Support’ in the restored reach indicate better conditions for fish populations, which is crucial for salmon recovery in Whychus Creek. Although it does not match ‘Camp Polk Meadow’, ‘Canyon Reach 4’ (transition) also shows promising improvements, particularly in functions related to habitat support for invertebrates, amphibians, and turtles, reflecting the benefits of increased habitat heterogeneity and lateral connectivity.
For ‘Canyon Reach 3’ versus ‘Camp Polk Meadow’, the results listed in columns 3 and 4 of Table 6 indicate that the median scores for 7 of 11 wetland functions were significantly higher in the restored reach than the control reach. Specifically, ‘Camp Polk Meadow’ exhibited higher scores in ‘Water Storage and Delay’, ‘Sediment Stabilization and Phosphorus Retention’, ‘Primary Production’, ‘Anadromous Fish Habitat Support’, ‘Invertebrate Habitat Support’, ‘Wintering and Migratory Waterbird Support’ and ‘Amphibian and Turtle Habitat’. These differences highlight the effectiveness of Stage 0 restoration in enhancing floodplain functionality and supporting diverse aquatic and terrestrial habitats. Improvements in these functions indicate increased water retention, sediment stabilization, and habitat quality, which collectively contribute to the overall ecological health, biodiversity, and resilience in the restored reach.
For ‘Canyon Reach 4’ versus ‘Camp Polk Meadow’, the results listed in columns 5 and 6 of Table 6 indicate that median scores for 5 of 11 wetland functions were significantly different. Specifically, the restored reach at ‘Camp Polk Meadow’ showed significantly higher scores in ‘Sediment Stabilization and Phosphorus Retention’, ‘Primary Production’, ‘Anadromous Fish Habitat Support’, and ‘Amphibian and Turtle Habitat’. Furthermore, the difference in the scores for the ‘Support of Characteristic Vegetation’ is almost significant (p = 0.052). These differences underscore the longer-term (i.e., six years versus two years post-restoration) benefits of Stage 0 restoration in enhancing wetland functions and ecosystem services. In this context, the higher scores for these functions at the restored reach provide a window into what may evolve in ‘Canyon Reach 4’ in the future.
For ‘Canyon Reach 3’ versus ‘Canyon Reach 4’, the results listed in columns 7 and 8 of Table 6 indicate that the median scores for 9 of 11 wetland functions were significantly different.
The chi-square statistic for ‘Anadromous Fish Habitat support’ provides a high level of confidence that, just two-years post-restoration, the provision of this function in the transition reach was already better than that in the control reach. This is important as one of the regional targets for the restoration is to support salmon recovery, specifically, Steelhead Oncorhynchus mykiss and Chinook Oncorhynchus tshawytscha.
Significant differences were also revealed for the majority of other functions, including ‘Support of Characteristic Vegetation’, ‘Water Storage and Delay’, and ‘Sediment Stabilization and Phosphorus Retention’. This demonstrates that restoration efforts in ‘Canyon Reach 4’ have enhanced habitat quality, increased water retention, and improved sediment control, which collectively contribute to improved ecological health, biodiversity and resilience in the transition reach.
The median score for ‘Thermoregulation’ was slightly higher in the control reach, although the difference was not statistically significant. To interpret this outcome, it is important to consider how the ‘Thermoregulation’ function score is derived when applying the Adamus [49] assessment method, which is hydrogeomorphically based. This score is derived from the product of two indicators:
The percentage of permanent zone shaded by woody or aquatic plants;
The predominant depth category during biennial low water.
A stream habitat survey performed in 2011 included observation of the extent of permanent shading in Canyon Reaches ‘3’ and ‘4’ prior to restoration. While the results ranged widely (31–94%), the average value was the same in both reaches, 51%. This was expected as, prior to restoration, these reaches were similar in all respects. In 2017, the stream habitat survey was repeated in Canyon Reach 4 (i.e., 1 year post-restoration). The range of values remained high (14–94%), but the reach-averaged score had risen slightly, to 53%. As conditions had not changed in the control reach, it is reasonable to assume that the control value remained 51%. This finding indicates that there was a small increase in permanent shading in Canyon Reach 4 compared to Canyon Reach 3 just 1 year post-restoration.
From Column 4 of Table 5, it is evident the scores for all the polygons in the ‘Canyon Reach 3’ are the same (0.3), reflecting the uniform conditions in the control reach. Conversely, scores for ‘Canyon Reach 4’ range from 0.120 to 0.386, reflecting the greater diversity of shading and water depths in the transition reach. The higher range in the transition reach results from its heterogenous environment, which is ecologically beneficial as it provides a wider range of thermal habitats for use by both warm- and cool-water flora and fauna.
The median score for only one wetland function, ‘Songbird Habitat Support’, is significantly higher in the control reach. The score for this function is derived from 19 indicators, which include the percentage of the study area occupied by closed-canopy woodland, the diameters of the largest trees and the diameters of dead trees (snags). These (and several other) indicators increase with the extent and maturity of woodland. It is therefore logical that ‘Canyon Reach 3’ (control), which has a well-developed gallery forest within the narrow, but continuous riparian fringe along its channel, should score higher for this function. Probably, the score for ‘Songbird Habitat Support’ in ‘Canyon Reach 4’ (transition) will increase as riparian trees mature in the reconnected floodplain, which now extends across the full width of the valley floor.

6. Interpretation and Implications

This section draws on all our results in order to achieve Objective 4. Here, we interpret the results relevant to each of the three previous objectives in turn, before considering their implications for habitat heterogeneity and biodiversity and the long-term monitoring of Stage 0 restoration projects. We close this section by briefly considering the wider implications of our research.

6.1. Objective 1: Interpretation of Post-Restoration Changes in Vegetation and Ground Cover in Canyon Reach 4 (Transition)

6.1.1. Changes to Vegetation

Two years following project completion, the restoration of ‘Canyon Reach 4’ led to statistically significant increases in both percentage plant cover and species richness for all plant groups (Figure 6a and Figure 6b, respectively). Within this overall result, the increased wetland plant abundance following restoration (Figure 7a) was expected; indeed, it was one of the restoration targets specified when the restoration of ‘Canyon Reach 4’ was proposed. The increase in upland plant abundance (Figure 7b) appears counterintuitive, but may be explained by four relevant, project-specific, factors:
  • The purposeful construction of micro-terrain in the cut and fill surfaces created during restoration, including local depressions with enhanced stream, hyporheic, and groundwater connections, interspersed with low terraces and ‘leave islands’ that are slightly higher and, therefore, drier;
  • The planting palette used in the restoration project (listed in Supplementary Materials Section S1) included both wetland and upland species, which accounted for hydrological patchiness related to the impacts of local terrain on soil wetness and micro-habitats;
  • The alleviation of seasonal water stresses on established vegetation growing on the higher surfaces that were not disturbed during restoration;
  • Recognition that the two years since restoration activity was completed is probably not enough time for wetland flora to have out-competed disadvantaged upland plants within the rehydrated margin areas on the valley floor.
However, succession from pre-restoration upland to post-restoration riparian and wetland species abundance is complicated. The mosaic of micro-habitats created during restoration is dynamic and, in some areas, morphological adjustments and channel evolution, can create opportunities for upland plants. For example, some anabranches in the anastomosed planform featured head cuts that lowered the channel bed slightly, locally reducing hydrological connectivity between flow in the channel, its hyporheic fringe, and the floodplain. Upland plants in those locales appeared to be surviving and we would expect them to persist until the trend for local incision is reversed and the drier patch is rehydrated.
The results for species richness (Figure 8) are similar to those for abundance in that values for all plant indicator statuses increased following restoration. Increases recorded in non-native species have been noted and volunteers are assisting with on-going efforts to control the spread of non-native species and noxious weeds.
In both the restored and transition reaches, wetland, facultative, and upland species coexist post-restoration, are in close proximity, and form a ‘shifting floodplain mosaic’ of heterogenous habitats. The project’s proponents and the authors regard this as a primary benefit of restoration to Stage 0.

6.1.2. Changes in Ground Cover

Observed increases in the area of bare ground and the amount of large wood following restoration (Figure 9) are explained by two actions taken as part of project implementation:
  • The lowering of the high terrace in Figure 2a (above), which resulted in an extensive area of bare ground;
  • The placement of multiple wood pieces to roughen lowered terrace surfaces and slow flows in bare areas where vegetation had to be cleared during construction.
Restoration also involved extensive plantings on the newly created, bare surfaces and, in addition of the large wood that was placed, we also observed wood recruited naturally through treefall (especially from dying Pinus ponderosa) and the trapping of trees and branches carried into the transition reach from upstream.
The slight, post-restoration increase in litter and decrease in moss were to be expected given the significant increase in vegetation cover. The burial of bedrock exposed within the incised channel when that channel was filled-in as part of its 2016 restoration explains why this category of surface cover was observed to have been practically eliminated.

6.2. Objective 2: Interpretation of Changes in Vegetation in ‘Canyon Reach 4’ (Transition) and ‘Camp Polk Meadow’ (Restored)

A comparison of vegetation transect data from the transition and restored reaches provides insights into the time dimension of ecological recovery following Stage 0 restoration. Factor analysis and similarity indices reveal that, by 2018, only two years post-restoration, the plant communities in ‘Canyon Reach 4’ had already diverged substantially from those observed in 2015, prior to its restoration. They further demonstrate that post-restoration plant assemblages in ‘Canyon Reach 4’ closely resembled those observed at ‘Camp Polk Meadow’, which was restored in 2012. This suggests that significant ecological progress towards the rich and diverse communities observed in the restored reach six years post-restoration had occurred in the transition reach just two years following restoration. This is consistent with the hypothesis that restoring lateral hydrologic and geomorphic connectivity promotes the rapid recovery of habitat heterogeneity and biodiversity.
However, factor analysis also indicates that the vegetation assemblages in the restored reach remain distinct from those in the transition reach. A longer post-restoration period provided more chance for ecological succession at ‘Camp Polk Meadow’, during which plant communities have had more time to mature, stabilize, adapt to new hydrological regimes, and respond to biotic interactions. This finding implies that further changes are likely in the transition reach as habitats continue to evolve.
The principal components extracted by factor analysis also clearly separate the pre-restoration, 2015 transect survey data for the transition reach from the 2018, post-restoration data for both the transition and restored reaches. Hence, in the results of factor analysis, the restoration factor plays a more influential role in determining similarities and differences between plant communities than the location factor (i.e., whether the assemblage is in ‘Canyon Reach 4’ or at ‘Camp Polk Meadow’).
The three sets of Jaccard and Sorensen scores listed in Table 4 show that the strongest similarity is that between the plant communities in the transition and the restored reaches, followed by that between the plant communities in ‘Canyon Reach 4’ before and after restoration. The most dissimilar plant communities were those observed in ‘Canyon Reach 4’ in 2015 and the restored reach at ‘Camp Polk Meadow’ in 2018. These findings underscore the strong influence of restoration on vegetation assemblages and highlight the importance of time in shaping mature, resilient assemblages.
The differences revealed by our analysis may also be partly attributable to the cumulative effects of seasonal cycles, the recruitment of additional species, and the competition between plants that develops over longer timescales. For example, the presence of greater diversity of native, wetland species and the reduced presence of invasive plants in the restored reach suggest that lateral floodplain reconnection promotes the establishment of more stable, native and diverse plant communities over time.
In summary, our findings support the hypothesis that restoration outcomes improve with time and highlight the need for further long-term monitoring to capture the trajectory of ecological recovery.

6.3. Objective 3: Interpretation of Changes in Wetland Ecosystem Functions

When assessing the value classes proposed by Mitsch and Gosselink [52], ‘Ecosystem Values’ most directly relate to human wellbeing and can therefore be interpreted to represent ecosystem services. Four of the functions in the ‘Ecosystem Values’ category showed a notable increase in the restored reach, namely ‘Water Storage and Delay’, ‘Sediment Stabilization and ‘Phosphorus Retention’, ‘Primary Production’, and ‘Support of Characteristic Vegetation’. This is evidence that Stage 0 restoration is contributing to recovery of valuable ecosystem services previously lost from Whychus Creek.
Of the Riparian and Wetland Functions categories listed in Table 1, most had higher median scores in the recently restored ‘Canyon Reach 4’ than in the unrestored ‘Canyon Reach 3’ (Table 6). Increases in ‘Resident Fish Habitat Support’, ‘Anadromous Fish Habitat Support’, ‘Invertebrate Habitat Support’, ‘Amphibian and Turtle Habitat’ and ‘Wintering and Migratory Waterbird Support’ can be attributed to the greater riparian and wetland habitat diversity and heterogeneity that developed just two years after Stage 0 restoration.
The improved provision of ‘Anadromous Fish Habitat Support’ is especially significant given that salmon recovery is a regional goal for the on-going programme of restoration projects in Whychus Creek. In this respect, salmon response to restoration of ‘Canyon Reach 4’ is demonstrated by observations made in 2018, which showed that there were 3.5 times more steelhead O. mykiss per 100 m2 than prior to restoration. Compared to the adjacent, upstream, unrestored ‘Canyon Reach 3’, the number of steelhead per 100 m2 more than doubled [59]. The number of juvenile Spring Chinook (O. tshawytscha) observed in ‘Canyon Reach 4’ post-restoration was 24 times that in ‘Canyon Reach 3’ reach (USFS and ODFW, unpublished data).
Wetlands have an important role in the hydrological cycle, and are often said to ‘act like sponges’, as they soak up water during wet periods and then release it gradually [60]. In the transition reach, the ‘Water Storage and Delay’ function is significantly different from the unrestored, control reach. Hence, there is a statistically confirmed improvement in flood resilience. Furthermore, there is a substantial body of literature relating to the role of wetlands in the protection and enhancement of water quality [61]. The median function score for ‘Sediment Stabilisation and Phosphorus Retention’ in transitional ‘Canyon Reach 4’ was significantly different from the score for the control reach. Hence, our functional assessment suggests that restoration to Stage 0 benefited water quality. Analyzing the riparian and wetland functions of these laterally reconnected reaches in terms of the ecosystem services they offer allows for better communication with stakeholders and the public by creating more direct links with human wellbeing, which helps to secure further support for Stage 0 restoration [62]. Increased support can lead to additional funding being secured for future valley-floor reset projects and their post-project monitoring [63].

6.4. Implications for Habitat Heterogeneity and Biodiversity

Dynamic fluvial systems and net-depositional floodplain environments have long been known to contribute to increased habitat heterogeneity [64]. The post-restoration vegetation transects in ‘Canyon Reach 4’ are consistent with this finding. Our findings indicate that the full reconnection of Whychus Creek to its floodplain prompted the creation of a shifting mosaic of aquatic, mesic, and terrestrial habitats related to differences in surface elevations, distance from a channel, and water table depth. The variety of habitats is also evident through the outcomes of the focal community vegetation surveys, which unambiguously demonstrate a substantial increase in plant species richness, commensurate with increases in the diversity of surveyed habitats. Increases in plant and habitat diversity are not only important in themselves, but are also beneficial for other biological taxa, particularly invertebrate and vertebrate animals [65]. The statistical results for the Riparian and Wetland Function assessments support this conclusion, alongside general observations of fauna in other unrestored and restored reaches of Whychus Creek.
For example, rattlesnakes (Crotalus oreganus) were not encountered in the unrestored ‘Canyon Reach 3’ but were observed both in the transitional ‘Canyon Reach 4’ and at the restored reach at ‘Camp Polk Meadow’. Mule deer (Odocoileus hemionus) also appeared to be more common at ‘Camp Polk Meadow’. The transition and restored reaches were observed to host good numbers of birds. For example, hummingbirds (Trochilidae) were observed in abundance at ‘Camp Polk Meadow’ and, to a lesser degree, ‘Canyon Reach 4’. Similarly, American dippers (Cinclus mexicanus) were repeatedly encountered in the restored reach, a family of at least 10+ Merganser (Merganser merganser) was seen, and an old warbler’s nest was collected from the Typha-dominated wetland at ‘Camp Polk Meadow’. We did not observe these bird species in either of the ‘Canyon’ reaches and their common occurrence at ‘Camp Polk Meadow’ provides indirect evidence for the abundance of insects, aquatic macroinvertebrates, and fish, which are the preferred food source for warblers, dippers and mergansers, respectively.
‘Camp Polk Meadow’ also appears to be very hospitable for dragonflies and damselflies (Odonata), with representatives of both Aeshnidae and Libellulidae regularly being encountered. In contrast, we saw no dragonflies in the degraded, control reach, whilst at the transitional reach the frequency of encounters was noticeably lower.
Butterflies (Cercyonis pegala, Colias spp., Papilio spp.) were variously encountered at the restored and transitional reaches. It should be noted, however, that (based on our qualitative observations) the biodiversity of order Lepidoptera appeared to be the highest in ‘Canyon Reach 4’. This suggests that transitional reaches may be providing optimal conditions for the biodiversity of Lepidoptera; this hypothesis should be investigated by further monitoring and research.
Despite uncertainties regarding the precise future patterns of ecosystem functioning in the restored and transitional reaches of Whychus Creek, the benefits achieved so far are unambiguous. The documented increases in plant diversity and richness, and Riparian and Wetland Functions achieved through restoration to Stage 0 justify further restoration actions both at Whychus Creek and other drainage systems. The results presented in this paper should, therefore, be of use for practitioners, policy makers, and funders, as well as providing a useful reference for further biodiversity research.

6.5. Implications for Long-Term Monitoring of Stage 0 Restorations

Our results compare vegetation assemblages and Riparian and Wetland Functions in two restored reaches of Whychus Creek with those in an unrestored, control reach. Given the limited time since the restoration, we refer to conditions in the more recently restored ‘Canyon Reach 4’ as being transitional. There is an expectation that riparian plant diversity and wetland functions in ‘Canyon Reach 4’ should continue to improve over time, to match or surpass those recorded at ‘Camp Polk Meadow’. This expectation can only be substantiated by further monitoring. Notwithstanding this, it should be recognized that the establishment of the heterogeneous mosaics of aquatic, mesic and xeric habitats recorded in ‘Canyon Reach 4’ is already benefiting a wide range of plant and animal taxa. Achieving this two years after restoration can justifiably be described as an optimal river restoration outcome.
That said, in this study, the short monitoring period, site-specific geomorphic context, and incomplete development of hydric soils (which precluded assessment of some wetland functions, such as nitrogen removal) limit the conclusions that may be drawn here. Long-term, multi-site studies are therefore needed to confirm ecological trajectories and resilience under varying climatic and geomorphic conditions.
In Whychus Creek, as in restored streams, the need for long-term, post-project monitoring is clear. Most restoration projects lack a rigorous post-restoration monitoring of ecological outcomes, often due to logistical and financial constraints. There is considerable scope for improvement, particularly in terms of a detailed analysis of the effects of restoration on target species [18,66]. The role of ecology is becoming increasingly important, particularly in supporting stream resilience to changes in land-use and hydro-climate. Without more extensive monitoring programmes for river restoration projects across the globe, the ecological outcomes, whether positive or negative, cannot be fully understood. This has become an increasingly common theme in discourse surrounding river restoration, for example, with the introduction of concepts such as biomic river restoration [14].

6.6. Wider Implications

This study provides one of the first quantitative evaluations of Stage 0 restoration outcomes for valley-floor vegetation and Riparian and Wetland Functions, adding empirical evidence to a restoration concept that has been largely theoretical. The added contribution lies in demonstrating that full floodplain reconnection can deliver measurable ecological benefits within two years, including significant increases in species richness and riparian and wetland functions. Practically, these findings support Stage 0 restoration as a cost-effective strategy for enhancing biodiversity, water quality, and flood resilience, and offer a replicable monitoring framework combining vegetation surveys and hydrogeomorphic-based function assessment.
In addition, the results of this study are also relevant to a broader range of research topics, including, e.g., the biodiversity of river floodplains [67], interactions between vegetation and hydrology in Blue-Green Infrastructure networks [68,69], and fire ecology [70,71,72,73,74]. The latter point became particularly apparent in August 2025, when wildfires that swept through Whychus Creek consumed practically all the vegetation in unrestored reaches whilst the impact in the transitional reach was very patchy and far less severe. A detailed analysis of those patterns will be a subject of further monitoring and research.

7. Conclusions

  • Vegetation Assemblages
    The restoration of ‘Canyon Reach 4’ of Whychus Creek significantly increased riparian vegetation abundance and species richness within two years, creating a heterogeneous mosaic of aquatic, mesic, and upland habitats.
  • Wetland Functions
    Riparian and Wetland Function scores increased markedly in restored and transition reaches compared to the unrestored control, particularly for water storage, sediment stabilization, and habitat support for fish, amphibians, and invertebrates. These improvements indicate enhanced ecosystem services and flood resilience.
  • Habitat and Biodiversity
    Six years after restoration to the form of an alluvial fan, the upper part of Camp Polk Meadow Preserve exhibited greater geomorphic and biological diversity, supporting a wider range of taxa and providing evidence that Stage 0 restoration promotes biodiversity, ecological complexity and resilience.
  • Vegetation Succession
    While the restored Camp Polk Meadow Preserve reach outperformed the transitional Canyon Reach 4 ecologically, similarities between their plant community compositions and Riparian and Wetland Functions suggest that both reaches are on a positive trajectory toward fully recovering from the adverse impacts of past anthropogenic channel straightening, relocation, incision, and floodplain disconnection.
  • Salmon Recovery
    Very large increases in numbers of both steelhead (O. mykiss) and juvenile Spring Chinook (O. tshawytscha) observed in Canyon Reach 4 in 2018 indicate that returning this reach to its Stage 0 condition was supporting salmon recovery, which is a regional goal, only 2 years post-restoration.
  • Implications and Future Work
    The findings reported here support valley-wide, process-reset restoration approaches that prioritize full floodplain reconnection. However, continued, long-term monitoring is essential to confirm the initial trends we identified, guide adaptive management, and strengthen the evidence base for Stage 0 restoration as a future-resilient strategy. The results will also serve as a reference for a broader range of further research and applications in biodiversity and vegetation studies, hydrology, and fire ecology.
  • Overall significance
    Our research makes an important contribution by providing quantitative evidence that Stage 0 restoration accelerates ecological recovery compared to traditional channel-centric approaches. Beyond academic significance, the main practical implications are clear: rapid improvements in habitat quality, vegetation diversity, and ecosystem services can inform restoration design, funding priorities, and adaptive management strategies. However, the short-term nature of this study and its site-specific context highlight the need for extended monitoring and replication across diverse landscapes to validate long-term outcomes and broaden applicability.

Supplementary Materials

The following supporting information can be downloaded at: https://www.mdpi.com/article/10.3390/land15030500/s1, Section S1. Palette of native riparian and wetland species planted in areas disturbed during restoration of Canyon Reach 4. Section S2. Method adopted for assessment of Wetland Functions in Whychus Creek. Section S3. Full list of plants recorded in the focal study areas of Whychus Creek.

Author Contributions

Conceptualization, V.K. and T.G.; validation, L.M. and K.A.; formal analysis, V.K. and T.G.; investigation and resources, K.A. and L.M.; data curation, L.M. and V.K., writing—original draft preparation, V.K.; writing—review and editing, All; visualization, L.M. and V.K.; supervision, C.R.T.; project administration, L.M.; funding acquisition, L.M. All authors have read and agreed to the published version of the manuscript.

Funding

This research received no external funding.

Data Availability Statement

The original data collected and analysed in this study are included in the article/Supplementary Material. Further data inquiries can be directed to the Upper Deschutes Watershed Council, for the attention of Lauren Mork.

Acknowledgments

Thanks to Mathias Perle, UDWC’s Restoration Program Manager, for his insights and significant contributions to developing monitoring plans for the transition and restored reaches. Field data were collected by the authors with assistance from UDWC’s 2018 interns, Jessica Reeves and Alex Scagliotti as well as Dr. Liam Clark (University of Nottingham) and his students—Ollie Brown, Lorna Burnell, Mikaela D’Souza, Shuyi Hu, Ellie Jackson, Elinor Kinrade, Paul Sciver, Rob Smith, Michael Suddens, Rachael Todd, Sam Valman, Ellie Wilson, Hazel Wilson, Simon Wylde and Yi Luan. Thanks also to UDWC’s 2023 intern, Sarah Ross, for her help with data validation.

Conflicts of Interest

The authors declare no conflicts of interest.

References

  1. Hauer, F.R.; Locke, H.; Dreitz, V.J.; Hebblewhite, M.; Lowe, W.H.; Muhlefeld, C.C.; Nelson, C.R.; Proctor, M.F.; Rood, S.B. Gravel-bed River Floodplains are the Ecological Nexus of Glaciated Mountain Landscapes. Sci. Adv. 2016, 2, e1600026. [Google Scholar] [CrossRef] [Scilit]
  2. Lawson, C.; Rothero, E.; Gowing, D.; Nisbet, T.; Barsoum, N.; Broadmeadow, S.; Skinner, A. The Natural Capital of Floodplains: Management, Protection and Restoration to Deliver Greater Benefits; Valuing Nature Natural Capital Synthesis Report VNP09; UKCEH: Crowmarsh Gifford, England, 2018; Available online: https://valuing-nature.net/FloodplainNC (accessed on 8 January 2026).
  3. Pugh, B.E.; Colley, M.; Dugdale, S.J.; Edwards, P.; Flitcroft, R.; Holz, A.; Johnson, M.; Mariani, M.; Means-Brous, M.; Meyer, K.; et al. A possible role for river restoration enhancing biodiversity through interaction with wildfire. Glob. Ecol. Biogeogr. 2022, 31, 1990–2004. [Google Scholar] [CrossRef] [Scilit]
  4. Brown, A.G.; Lespez, L.; Sear, D.A.; Macaire, J.-J.; Houben, P.; Klimek, K.; Brazier, R.E.; Van Oost, K.; Pears, B. Natural vs. Anthropogenic Streams in Europe: History, Ecology and Implications for Restoration, River-Rewilding and Riverine Ecosystem Services. Earth Sci. Rev. 2018, 180, 185–205. [Google Scholar] [CrossRef] [Scilit]
  5. Cluer, B.; Thorne, C. A Stream Evolution Model Integrating Habitat and Ecosystem Benefits. River Res. Applic. 2014, 30, 135–154. [Google Scholar] [CrossRef] [Scilit]
  6. Wohl, E.; Castro, J.; Cluer, B.; Merritts, D.; Powers, P.; Staab, B.; Thorne, C. Rediscovering, Reevaluating, and Restoring Lost River-Wetland Corridors. Front. Earth Sci. 2021, 9, 653623. [Google Scholar] [CrossRef] [Scilit]
  7. Bridges, T.S.; Bourne, E.M.; Suedel, B.C.; Moynihan, E.B.; King, J.K. Engineering with Nature: An Atlas; US Army Engineer Research and Development Center, Environmental Laboratory: Vicksburg, MS, USA, 2018; p. 0280. [Google Scholar]
  8. Carter, N.T.; Lipiec, E. Flood Risk Reduction from Natural and Nature-Based Features: Army Corps of Engineers Authorities; Congressional Research Service: Washington, DC, USA, 2020; Available online: https://www.everycrsreport.com/files/20200427_R46328_5ecc0e851941e017b50b62075a15c4abbbd36d19.pdf (accessed on 8 January 2026).
  9. Glassic, H.C.; Al-Chokhachy, R.; Wheaton, J.; Macfarlane, W.W.; Jordan, C.E.; Murphy, B.; Shahverdian, S.; Bennett, S.; Bouwes, N.; Fryirs, K.; et al. Principles of Riverscape Health. WIREs Water 2025, 12, e70028. [Google Scholar] [CrossRef] [Scilit]
  10. Lashford, C.; Lavers, T.; Reaney, S.; Charlesworth, S.; Burgess-Gamble, L.; Dale, J. Sustainable catchment-wide flood management: A review of the terminology and application of sustainable catchment flood management techniques in the UK. Water 2022, 14, 1204. [Google Scholar] [CrossRef] [Scilit]
  11. Piégay, H.; Cottet, M.; Lamouroux, N. Innovative approaches in river management and restoration. River Res. Appl. 2020, 36, 875–879. [Google Scholar] [CrossRef] [Scilit]
  12. Downs, P.; Gregory, K. River Channel Management: Towards Sustainable Catchment Hydrosystems; Routledge: Oxford, England, 2014. [Google Scholar]
  13. Geist, J.; Hawkins, S.J. Habitat recovery and restoration in aquatic ecosystems: Current progress and future challenges. Aquat. Conserv. Mar. Freshw. Ecosyst. 2016, 26, 942–962. [Google Scholar] [CrossRef] [Scilit]
  14. Johnson, M.F.; Thorne, C.R.; Castro, J.M.; Kondolf, G.M.; Mazzacano, C.S.; Rood, S.B.; Westbrook, C. Biomic river restoration: A new focus for river management. River Res. Appl. 2020, 36, 3–12. [Google Scholar] [CrossRef] [Scilit]
  15. Modi, A.; Kapoor, V.; Tare, V. River space: A hydro-bio-geomorphic framework for sustainable river-floodplain management. Sci. Total Environ. 2022, 812, 151470. [Google Scholar] [CrossRef] [Scilit]
  16. Hearnshaw, E.J.S.; Hughey, K.F.D. A Tolerance Range Approach for the Investigation of Values Provided by Te Waihora/Lake Ellesmere; Report 17; Centre for Land, Environment & People, Lincoln University: Christchurch, Aotearoa/New Zealand, 2010; 78p. [Google Scholar]
  17. Beechie, T.; Imaki, H.; Greene, J.; Wade, A.; Wu, H.; Pess, G.; Roni, P.; Kimball, J.; Stanford, J.; Kiffney, P.; et al. Restoring salmon habitat for a changing climate. River Res. Appl. 2013, 29, 939–960. [Google Scholar] [CrossRef] [Scilit]
  18. Bernhardt, E.S.; Palmer, M.A. River restoration: The fuzzy logic of repairing reaches to reverse watershed scale degradation. Ecol. Appl. 2011, 21, 1926–1931. [Google Scholar] [CrossRef] [Scilit]
  19. Booth, D.; Scholz, J.; Beechie, T.; Ralph, S.C. Integrating limiting factors analysis with process-based restoration to improve recovery of endangered salmonids in the Pacific Northwest, USA. Water 2016, 8, 174. [Google Scholar] [CrossRef] [Scilit]
  20. Powers, P.D.; Helstab, M.; Niezgoda, S.L. A Process-based Approach to Restoring Depositional River Valleys to Stage 0, an Anastomosing Channel Network. River Res. Appl. 2019, 35, 3–13. [Google Scholar] [CrossRef] [Scilit]
  21. Powers, P.; Staab, B.; Cluer, B.; Thorne, C. Rediscovering, reevaluating, and restoring Entiatqua: Identifying pre-Anthropocene valleys in North Cascadia, USA. River Res. Appl. 2022, 38, 1527–1543. [Google Scholar] [CrossRef] [Scilit]
  22. Behan, J.; Fetcho, K.; Davis, R.; Gaines, L. River Restoration to Achieve a Stage 0 Condition: Summary of a Workshop Held November 5–6, 2020; Oregon State University: Corvallis, OR, USA, 2021. [Google Scholar]
  23. Ciotti, D.C.; Mckee, J.; Pope, K.L.; Kondolf, G.M.; Pollock, M.M. Design criteria for process-based restoration of fluvial systems. Bioscience 2021, 71, 831–845. [Google Scholar] [CrossRef] [Scilit]
  24. Pollock, M.M.; Beechie, T.J.; Wheaton, J.M.; Jordan, C.E.; Bouwes, N.; Weber, N.; Volk, C. Using beaver dams to restore incised stream ecosystems. BioScience 2014, 64, 279–290. [Google Scholar] [CrossRef] [Scilit]
  25. Hinshaw, S.; Wohl, E. Quantitatively estimating carbon sequestration potential in soil and large wood in the context of river restoration. Front. Earth Sci. 2021, 9, 708895. [Google Scholar] [CrossRef] [Scilit]
  26. McCabe, C.L.; Matthaei, C.D.; Tonkin, J.D. The ecological benefits of more room for rivers. Nat. Water 2025, 3, 260–270. [Google Scholar] [CrossRef] [Scilit]
  27. Pollock, M.M.; Norman, L.M. Wet meadow regeneration through restoration of biophysical feedbacks. Front. Environ. Sci. 2025, 13, 1592036. [Google Scholar] [CrossRef] [Scilit]
  28. Riis, T.; Kelly-Quinn, M.; Aguiar, F.C.; Manolaki, P.; Bruno, D.; Bejarano, M.D.; Clerici, N.; Fernandes, M.R.; Franco, J.C.; Pettit, N.; et al. Global Overview of Ecosystem Services Provided by Riparian Vegetation. BioScience 2020, 70, 501–514. [Google Scholar] [CrossRef] [Scilit]
  29. Mohan, M.; Chacko, A.; Rameshan, M.; Gopikrishna, V.G.; Kannan, V.M.; Vishnu, N.G.; Sasi, S.A.; Baiju, K.R. Restoring Riparian Ecosystems During the UN-Decade on Ecosystem Restoration: A Global Perspective. Anthr. Sci. 2022, 1, 42–61. [Google Scholar] [CrossRef] [Scilit]
  30. Von Humboldt, A.; Bonpland, A. Essai sur la Géographie des Plantes (Essay on the Geography of Plants); Levrault & Schoell: Paris, France, 1807. [Google Scholar]
  31. Naiman, R.J.; Decamps, H.; Pollock, M. The role of riparian corridors in maintaining regional biodiversity. Ecol. Appl. 1993, 3, 209–212. [Google Scholar] [CrossRef] [Scilit]
  32. Graziano, M.P.; Deguire, A.K.; Surasinghe, T.D. Riparian Buffers as a Critical Landscape Feature: Insights for Riverscape Conservation and Policy Renovations. Diversity 2022, 14, 172. [Google Scholar] [CrossRef] [Scilit]
  33. Li, M.; Johnson, C.J.; Rex, J.F.; Todd, M. Long-term riparian forest loss around streams, lakes, and wetlands in ecologically diverse managed and unmanaged landscapes. For. Ecol. Manag. 2024, 562, 121931. [Google Scholar] [CrossRef] [Scilit]
  34. Davidson, N.C. How much wetland has the world lost? Long-term and recent trends in global wetland area. Mar. Freshw. Res. 2014, 65, 934–941. [Google Scholar] [CrossRef] [Scilit]
  35. Fluet-Chouinard, E.; Stocker, B.D.; Zhang, Z.; Malhotra, A.; Melton, J.R.; Poulter, B.; Kaplan, J.O.; Goldewijk, K.K.; Siebert, S.; Minayeva, T.; et al. Extensive global wetland loss over the past three centuries. Nature 2023, 614, 281–286. [Google Scholar] [CrossRef] [Scilit]
  36. Finlayson, C.M.; Davidson, N.C.; Spiers, A.G.; Stevenson, N.J. Global wetland inventory–current status and future priorities. Mar. Freshw. Res. 1999, 50, 717–727. [Google Scholar] [CrossRef] [Scilit]
  37. Hardouin, L.; Decharme, B.; Colin, J.; Delire, C. Climate-driven projections of future global wetlands extent. Earth’s Future 2024, 12, e2024EF004553. [Google Scholar] [CrossRef] [Scilit]
  38. Palmer, M.A.; Hondula, K.L.; Koch, B.J. Ecological restoration of streams and rivers: Shifting strategies and shifting goals. Annu. Rev. Ecol. Evol. Syst. 2014, 45, 247–269. [Google Scholar] [CrossRef] [Scilit]
  39. Moreno-Mateos, D.; Power, M.E.; Comín, F.A.; Yockteng, R. Structural and functional loss in restored wetland ecosystems. PLoS Biol. 2012, 10, e1001247. [Google Scholar] [CrossRef] [Scilit]
  40. Flitcroft, R.L.; Brignon, W.R.; Staab, B.; Bellmore, J.R.; Burnett, J.; Burns, P.; Cluer, B.; Giannico, G.; Helstab, J.M.; Jennings, J.; et al. Rehabilitating valley floors to a stage 0 condition: A synthesis of opening outcomes. Front. Environ. Sci. 2022, 10, 892268. [Google Scholar] [CrossRef] [Scilit]
  41. U.S. Forest Service. Sisters/Whychus Watershed Analysis; Sisters Ranger District, Deschutes National Forest: Sisters, OR, USA, 1998; 384p.
  42. Perle, M.; Mork, L.; Thorne, C. ‘Stage Zero’ Restoration of Whychus Creek, Oregon: Monitoring Results and Lessons Learned; UDWC: Bend, OR, USA, 2018; Available online: www.ecotoneinc.com (accessed on 8 January 2026).
  43. Mork, L.; Perle, M.; Thorne, C. Stage 0 Outcomes: Monitoring Results and Stakeholder Views; Upper Deschutes Watershed Council: Bend, OR, USA, 2018. [Google Scholar]
  44. Mork, L.; Allen, K.; Goss, T.; Thorne, C.; Krivtsov, V. Increase in riparian vegetation following a ‘Stage 0’ river restoration project on Whychus Creek, Oregon. In Proceedings of the 39th IAHR World Congress, Granada, Spain, 19–24 June 2022; International Association for Hydro-Environment Engineering and Research (IAHR): Madrid, Spain, 2022. [Google Scholar]
  45. Bauer, H.L. The statistical analysis of chaparral and other plant communities by means of transect samples. Ecology 1943, 24, 45–60. [Google Scholar] [CrossRef] [Scilit]
  46. Six, L.J.; Verschuyl, J.; Coble, A.A. Riparian vegetation layers differ three years after mixed severity wildfire in Oregon. Sci. Rep. 2025, 15, 36247. [Google Scholar] [CrossRef] [Scilit]
  47. Weaver, J.E. The quadrat method in teaching ecology. Plant World 1918, 21, 267–283. [Google Scholar]
  48. Yang, X.; Feng, Q.; Zhu, M.; Zhang, J.; Yang, L.; Zhang, C.; Wang, Z.; Feng, Y. Vegetation communities and soil properties along the restoration process of the Jinqianghe mine site in the Qilian Mountains, China. Front. Plant Sci. 2024, 15, 1358309. [Google Scholar] [CrossRef] [Scilit]
  49. Adamus, P.R. Guidebook for Hydrogeomorphic (HGM)—Based Assessment of Oregon Wetland and Riparian Sites: Statewide Classification and Profiles; Oregon Division of State Lands: Salem, OR, USA, 2001. Available online: https://www.oregon.gov/dsl/wetlands-waters/Documents/HGMGuide.pdf (accessed on 8 January 2026).
  50. Hruby, T.; Bruner, K.; Cooke, S.; Dublonica, K.; Gersib, R.; Granger, T.; Reinelt, L.; Richter, K.; Sheldon, D.; Wald, A.; et al. Methods for Assessing Wetland Functions. Volume 1: Riverine and Depressional Wetlands in the Lowlands of Western Washington; Ecology Publication 99–115; Washington State Department of Ecology: Olympia, WA, USA, 1999. [Google Scholar]
  51. Smith, R.D.; Ammann, A.; Bartoldus, C.; Brinson, M.M. An Approach for Assessing Wetland Functions Using Hydrogeomorphic Classification, Reference Wetlands and Functional Indices; US Army Corps of Engineers: Vicksburg, MS, USA, 1995. [Google Scholar]
  52. Mitsch, W.J.; Gosselink, J.G. Wetlands; John Wiley & Sons: Hoboken, NJ, USA, 2015. [Google Scholar]
  53. Lichvar, R.W.; Melvin, N.C.; Butterwick, M.L.; Kirchner, W.N. National Wetland Plant List Indicator Rating Definitions; ERDC/CRREL TR-12-1; U.S. Army Engineer Research and Development Center, Cold Regions Research and Engineering Laboratory: Hanover, NH, USA, 2012. [Google Scholar]
  54. U.S. Army Corps of Engineers. Regional Supplement to the Corps of Engineers Wetland Delineation Manual: Arid West Region (Version 2.0); Wakeley, J.S., Lichvar, R.W., Noble, C.V., Eds.; ERCD/EL TR-08-28; U.S. Army Engineer Research and Development Center: Vicksburg, MS, USA, 2008. [Google Scholar]
  55. Allen, C.D.; Breshears, D.D. Drought-induced shift of a forest/woodland ecotone: Rapid landscape response to climate variation. Proc. Natl. Acad. Sci. USA 1998, 95, 14839–14842. [Google Scholar] [CrossRef] [Scilit] [PubMed]
  56. Allen, C.; Savage, M.; Falk, D.; Suckling, K.; Swetnam, T.; Schulke, T.; Stacey, P.; Morgan, P.; Hoffman, M.; Klingel, J. Ecological restoration of southwestern ponderosa pine ecosystems: A broad perspective. Ecol. Appl. 2002, 12, 1418–1433. [Google Scholar] [CrossRef]
  57. Goss, T. Assessing the Wetlands of a Stage 0 River Restoration Project on Whychus Creek, Deschutes County, Oregon. MSc Master’s Thesis, School of Geography, University of Nottingham, Nottingham, England, 2020. [Google Scholar]
  58. Vasilas, L.M.; Hurt, G.W.; Berkowitz, J.F. Field Indicators of Hydric Soils in the United States: A Guide for Identifying and Delineating Hydric Soils, Version 8.1; United States Department of Agriculture, Natural Resources Conservation Service: Washington, DC, USA, 2017. [Google Scholar]
  59. Riehle, M.; Moberly, E. Population trends of redband trout and brown trout in habitat improvement reaches of Whychus Creek, Oregon. In Proceedings of the Portland General Electric Fisheries Workshop, Bend, OR, USA, 13 July 2023. [Google Scholar]
  60. Bucher, E.H.; Bonetto, A.; Boyle, T.; Canevari, P.; Castro, G.; Huszar, P.; Stone, T. Hidroviaan Initial Environmental Examination of the Paraguay—Parana Waterway; Publication No. 10; Wetlands for the Americas: Manomet, MA, USA, 1993. [Google Scholar]
  61. Maltby, E. (Ed.) Functional Assessment of Wetlands: Towards Evaluation of Ecosystem Services; Woodhead Publishing: Cambridge, England, 2009. [Google Scholar]
  62. Albert, C.; Galler, C.; Hermes, J.; Neuendorf, F.; Von Haaren, C.; Lovett, A. Applying ecosystem services indicators in landscape planning and management: The ES-in-Planning framework. Ecol. Indic. 2016, 61, 100–113. [Google Scholar] [CrossRef] [Scilit]
  63. Bullock, A.; Acreman, M.C. The role of wetlands in the hydrological cycle. Hydrol. Earth Syst. Sci. 2003, 7, 75–86. [Google Scholar] [CrossRef] [Scilit]
  64. Yarnell, S.M.; Mount, J.F.; Larsen, E.W. The influence of relative sediment supply on riverine habitat heterogeneity. Geomorphology 2006, 80, 310–324. [Google Scholar] [CrossRef] [Scilit]
  65. Henning, J. An Evaluation of Fish and Amphibian Use of Restored and Natural Floodplain Wetlands; Final Report EPA Grant CD-97024901-1; Washington Department of Fish and Wildlife: Olympia, WA, USA, 2004; 81p. [Google Scholar]
  66. Katz, S.L.; Barnas, K.; Hicks, R.; Cowen, J.; Jenkinson, R. Freshwater habitat restoration actions in the Pacific Northwest: A decade’s investment in habitat improvement. Restor. Ecol. 2007, 15, 494–505. [Google Scholar] [CrossRef] [Scilit]
  67. Krivtsov, V.; Buckman, J.; Birkinshaw, S.; Olive, V. Interactions of hydrology, geochemistry, and biodiversity in woodland ponds located in riverine floodplains: Case study from Scotland. Environ. Sci. Pollut. Res. 2024, 31, 40678–40693. [Google Scholar] [CrossRef] [Scilit] [PubMed]
  68. Krivtsov, V. Green and blue-green infrastructure–benefits, trade-offs, and optimisation of ecosystem services: An overview with perspectives for research and management. Plant Ecol. Divers. 2025, 18, 267–285. [Google Scholar] [CrossRef] [Scilit]
  69. Krivtsov, V.; Ahilan, S.; Arthur, S.; Birkinshaw, S.; Dawson, D.; Everett, G.; Fenner, R.; Glenis, V.; Kapetas, L.; Kilsby, C.; et al. Blue-Green Cities: Achieving Urban Flood Resilience, Water Security and Biodiversity. In The Palgrave Encyclopedia of Urban and Regional Futures; Springer: Berlin/Heidelberg, Germany, 2023. [Google Scholar] [CrossRef] [Scilit]
  70. Guitart, N.P.; Valor, T.; Krivtsov, V. Efectes postincendi en una torbera d’Escòcia. Treb. Soc. Catalana Geogr. 2011, 71–72, 93–114. [Google Scholar]
  71. Krivtsov, V.; Vigy, O.; Legg, C.; Curt, T.; Rigolot, E.; Lecomte, I.; Jappiot, M.; Lampin-Maillet, C.; Fernandes, P.; Pezzatti, G.B. Fuel modelling in terrestrial ecosystems: An overview in the context of the development of an object-orientated database for wild fire analysis. Ecol. Model. 2009, 21, 2915–2926. [Google Scholar] [CrossRef] [Scilit]
  72. Krivtsov, V.; Gray, A.; Valor, T.; Legg, C.J.; Davies, G.M. The fuel moisture content of peat in relation to meteorological factors. In Modelling, Monitoring and Management of Forest Fires; de la Heras, J., Brebbia, C.A., Viegas, D., Leone, V., Eds.; WIT Transactions on Ecology and the Environment; WIT Press: Ashurst, England, 2008; Volume 119, pp. 193–200. [Google Scholar]
  73. Krivtsov, V.; Legg, C. Modelling Soil Moisture Deficit and Moisture Content of Ground Vegetation: Progress Towards Development of a Fire Weather Index System Appropriate to the UK. Fire Technol. 2011, 47, 539–548. [Google Scholar] [CrossRef] [Scilit]
  74. Legg, C.J.; Pezzatti, G.B.; Rigolot, E.; Vigy, O.; Lecomte, I.; Marell, A.; Krivtsov, V. Development of an object-orientated database for wildfire modelling. In Modelling, Monitoring and Management of Forest Fires; de la Heras, J., Brebbia, C.A., Viegas, D., Leone, V., Eds.; WIT Transactions on Ecology and the Environment; WIT Press: Ashurst, England, 2008; Volume 119, pp. 39–47. [Google Scholar]
Figure 1. Whychus Creek location maps. Ownerships: BLM = Bureau of Land Management; USFS Deschutes = US Forest Service Deschutes National Forest; USFS Grasslands = USFS Crooked River National Grasslands. TSID = Three Sisters Irrigation District.
Land 15 00500 g001
Figure 2. Geomorphology of the valley floor of Whychus Creek before and after restoration to Stage 0 at (a,b) ‘Canyon Reach 4’ and (c,d) ‘Camp Polk Meadow’. In this study, these reaches are referred to as the ‘transition’ and ‘restored’ reaches, respectively.
Land 15 00500 g002
Figure 3. Pre- and post-restoration views of part of Canyon Reach 4. (a) Pre-project high terrace in 2015. The anthropogenically relocated, incised, single-thread channel is located within the narrow riparian corridor at the base of the far valley wall. (b) Reconnected, braided channel–floodplain system created by lowering the terrace during summer 2016. (c) Anastomosed river–wetland complex featuring vegetated islands and a patchy, shifting mosaic of habitats that developed within two years of restoration of the Creek to its Stage 0 condition. Photo credit: Deschutes Land Trust/Jay Mather.
Land 15 00500 g003
Figure 4. Satellite images of study areas and vegetation transects in (a) Camp Polk Meadow (restored), (b) Canyon Reach 3 (control), and (c) Canyon Reach 4 (transitional). Flow is from left to right.
Land 15 00500 g004
Figure 5. Dying ponderosa pines (Pinus ponderosa) observed following the restoration of Canyon Reach 4, which fully reconnected the anthropogenically incised stream to its floodplain and rehydrated the hyporheic alluvial aquifer, raising the water table to near the floodplain surface within a few days.
Land 15 00500 g005
Figure 6. Comparison of box plots and Kruskal–Wallace test statistics for (a) normalized abundance (% of total plant cover) and (b) species richness (number of plant species) for all the plants recorded at ‘Canyon Reach 4’ in the 2015 and 2018 transect surveys. Statistically significant differences (95% level of confidence, p ≤ 0.05) are displayed in italics. In each box, the red line indicates the median value. The dashed blue line with diamond indicates the mean. Data used to prepare this plot may be found in the Supplementary Materials Section S3.
Land 15 00500 g006
Figure 7. Comparative box plots and Kruskal–Wallace test statistics for pooled, normalized wetland (a) and upland (b) plant abundances (expressed as percentage of total plant cover) along all transects in ‘Canyon Reach 4’ prior to (2015) and post-restoration (2018). Wetland plants are those with indicator status OBL and FACW. Upland plants are those with indicator status FACU or UPL. Statistically significant differences (95% level of confidence, p ≤ 0.05) are displayed in italics. In each box, the red line indicates the median value. Note that 2018 data for both plant categories contain more non-zero values and have significantly higher overall abundances, even though 2015 data had higher outliers. The dashed blue line with diamond indicates the mean. Data used to prepare this plot may be found in the Supplementary Materials Section S3.
Land 15 00500 g007
Figure 8. Comparative box plots and Kruskal–Wallace test statistics for species richness for plants rated as (a) Native; (b) Non-Native, (c) FACW = Facultative Wetland or OBL = Obligate Wetland; (d) FACU = Facultative Upland; (e) FACW = Facultative Wetland; or (f) OBL = Obligate Wetland. Statistically significant differences (95% level of confidence, p ≤ 0.05) are displayed in italics. In each box, the median value is shown by a red line. The mean is indicated by the blue diamond.
Land 15 00500 g008
Figure 9. Comparative box plots and Kruskal–Wallace test statistics for changes in the percentage covers of (a) bare ground (BG), (b) large wood (LW), (c) litter, (d) moss, and (e) exposed bedrock. Statistically significant differences (95% level of confidence, p ≤ 0.05) are displayed in italics. Red lines indicate the medians and dashed blue lines and diamonds indicate means.
Land 15 00500 g009
Table 1. Wetland functions, defined by Adamus [49] and categorized using the Mitsch & Gosselink classification [52].
Riparian and Wetland FunctionValue TypeBrief Description
1. Water Storage and DelayEcosystemTemporarily retains water, reducing downstream flooding and peak flow.
2. Sediment Stabilization and Phosphorus RetentionEcosystemReduces erosion and traps sediment-bound phosphorus.
3. Nitrogen RemovalN/ARemoves nitrogen via denitrification; not supported in study reaches.
4. ThermoregulationEcosystemModerates temperature fluctuations in surface and groundwater.
5. Primary ProductionEcosystemProduces organic biomass that supports food webs.
6. Resident Fish Habitat SupportPopulationProvides habitat for non-migratory fish species.
7. Anadromous Fish Habitat SupportPopulationSupports migratory fish, like salmon, during breeding or juvenile stages.
8. Invertebrate Habitat SupportPopulationOffers feeding, breeding, and refuge sites for aquatic invertebrates.
9. Amphibian and Turtle HabitatPopulationSupports breeding, foraging, and sheltering habitats.
10. Breeding Waterbird SupportN/ARequires large water bodies; not applicable in study reaches.
11. Wintering and Migratory Waterbird SupportPopulationProvides stopover or overwintering habitat along migratory routes.
12. Songbird Habitat SupportPopulationSupports nesting and feeding areas for passerines.
13. Support of Characteristic VegetationEcosystemMaintains hydrophytic plant communities typical of natural wetlands.
Upland Inclusions (%)N/APercent of upland area within wetland boundaries; not a function per se.
Note: the ‘Nitrogen Removal’ and ‘Breeding Waterbird Support’ functions were not supported in the study reaches due to the absence of properly developed hydric soils and large, open water bodies, respectively. Hence, these wetland functions were not applicable.
Table 2. Plant indicator status for all plants observed in the three study areas.
Indicator StatusNumber Indicated Conditions
Obligate Wetland (OBL)11Mesic (32)
Facultative Wetland (FACW)21
Facultative (FAC)17Indeterminate (17)
Facultative Upland (FACU)19Dry (34)
Upland (UPL)15
Unassigned7
Table 3. Rotated matrix of principal components generated using factor analysis on transect vegetation data.
Component
123
18_WCR4T2 0.779
18_WCR4T3 0.903
18_WCR4T4 0.902
18_WCR4T5
15_WCR4T20.809
15_WCR4T30.716
15_WCR4T40.916
15_WCR4T50.842
CPT1 0.826
CPT2 0.775
CPT3 0.808
CPT4 0.757
Notes: Abbreviation ‘WCR4T’ = Whychus Creek Reach 4 Transect. Prefix indicates survey year (2015, pre-restoration, or 2018, two years post-restoration). Suffix indicates transect number (2–5). Abbreviation ‘CPT’ = Camp Polk Transect. Data are from 2018, six years post-restoration. Suffix indicates transect number (1–4). For clarity of presentation, factor loadings < 0.5 are not displayed.
Table 4. Statistical comparisons of plant community compositions observed along the vegetation transects in the three study reaches in 2018.
ComparisonJaccard Correlation Coefficient
(JC)
Sorensen Similarity Index
(SS)
2018 Canyon Reach 4 (transition) and 2018 Camp Polk Meadow (restored)0.71230.832
2018 Canyon Reach 4 (transition) and 2015 Canyon Reach 4 (pre-restoration)0.55560.7143
2018 Camp Polk (restored) and 2015 Reach 4 (pre-restoration)0.47060.64
Table 5. Wetland functions scores obtained in 2018 using the Adamus [49] hydrogeomorphic-based assessment method.
Reach and QuadratWetland Functions (See Table 1, Above, for Function Numbering Key)% Upland Inclusions
1.2.4.5.6.7.8.9.11.12.13.
WCR4_P1u0.2000.3640.2570.7361.1820.6840.8110.8050.7370.9870.3945
WCR4_P1d0.0600.3320.3430.7181.1430.8070.7320.8150.4740.9870.7165
WCR4_P2u0.0600.3090.3000.7361.0780.8600.7680.8360.6780.9970.8635
WCR4_P2d0.1000.2730.3860.6911.0000.9820.9890.7790.4670.9740.8485
WCR4_P3u0.0600.1730.1200.6181.1430.7540.7930.8160.5990.9890.87510
WCR4_P3d0.0600.2640.1710.6451.1430.7370.7630.8000.4140.9870.84010
WCR4_P4u0.0600.4450.3000.8641.1300.8070.8070.8390.4110.9870.84815
WCR4_P4d0.1000.5230.2570.9001.1950.7890.8310.6190.4740.9870.86320
WCR3_P10.0400.1450.3000.5821.0910.6670.2220.6660.3821.0260.67990
WCR3_P20.0400.1450.3000.5821.0910.6670.2220.6660.3821.0260.67990
WCR3_P30.0400.1450.3000.5821.0910.6670.2220.6660.3821.0260.67990
WCR3_P40.0400.1820.3000.5451.0910.6670.6890.6600.3821.0260.67590
CP_P10.2000.7730.3000.9181.1820.9650.8830.8590.6511.0260.88910
CP_P20.2000.7950.3861.0451.2472.3860.8610.8700.6381.0260.88120
CP_P30.1000.6590.3430.9181.1820.9470.8890.8620.6181.0260.88715
CP_P40.1200.4140.2570.7911.1300.8600.8130.8660.7201.0260.87020
CP_P50.0400.5090.3000.8101.0781.0850.7810.8190.5611.0130.86510
CP_P60.4500.800N/A1.052N/AN/A0.9481.1270.5601.0280.41630
Notes: Functions 3. and 10. are not listed as they were inapplicable. The study reach is defined by the first four digits and the assessment polygon by the last two or three digits in the first column. For WCR4 (‘Canyon Reach 4’), polygons are indicated by study sub-area (1–4) and location (up or downstream). For WCR3 (‘Canyon Reach 3’) and CP (‘Camp Polk Meadow’), polygons were evenly spaced through the study area and are numbered consecutively from upstream to downstream.
Table 6. Results of the Kruskal–Wallis tests comparing wetland functions scores in the study reaches. Classification into ‘population’ and ‘ecosystem’ categories after Mitsch and Gosselink [52]. Note: ‘upland inclusions’ is not a function but is listed for reference.
Wetland FunctionValue TypeReach 3 vs. Camp Polk Reach 4 vs. Camp PolkReach 3 vs.
Reach 4
Chi SquarepChi SquarepChi Squarep
Water Storage and DelayEcosystem5.2080.0222.5570.1108.2820.004
Sediment Stabilization and Phosphorus RetentionEcosystem6.7080.0107.3500.0076.5820.010
ThermoregulationEcosystem0.3390.5611.0980.2950.5280.467
Primary ProductionEcosystem6.7500.0096.6960.0107.5160.006
Resident Fish Habitat SupportPopulation2.3780.1230.5510.4581.9410.164
Anadromous Fish Habitat SupportPopulation6.5450.0115.8660.0157.6800.006
Invertebrate Habitat SupportPopulation6.7080.0102.8170.0937.4890.006
Amphibian and Turtle Habitat SupportPopulation6.7080.0108.0670.0054.2130.040
Wintering and Migratory Waterbird SupportPopulation6.9680.0082.0210.1557.6800.006
Songbird Habitat SupportPopulation<0.0011.00010.2780.0018.2500.004
Support of Characteristic VegetationEcosystem 2.9810.0843.7670.0524.2430.039
Upland Inclusions (%)N/A7.0590.0084.2370.0407.9700.005
Note: Probabilities shaded grey indicate statistically significant differences between median scores for the reaches being compared.
Disclaimer/Publisher’s Note: The statements, opinions and data contained in all publications are solely those of the individual author(s) and contributor(s) and not of MDPI and/or the editor(s). MDPI and/or the editor(s) disclaim responsibility for any injury to people or property resulting from any ideas, methods, instructions or products referred to in the content.