Article

Agricultural Land-Use Structure Across Hierarchical Classification Levels in Kosovo

1
Division of Landscape Ecology and Landscape Planning, Department of Landscape Ecology and Resources Management, Justus Liebig University Giessen, 35392 Giessen, Germany
2
Department of Plant Protection, Faculty of Agriculture and Veterinary, University of Prishtina, 10000 Prishtina, Kosovo
*
Author to whom correspondence should be addressed.
Land 2026, 15(3), 465; https://doi.org/10.3390/land15030465
Submission received: 30 January 2026 / Revised: 26 February 2026 / Accepted: 12 March 2026 / Published: 14 March 2026

Abstract

Fine-grain heterogeneity in agricultural landscapes is often obscured by coarse land-use classification schemes. This study provides a structural characterization of agricultural land use in selected sites within the Dukagjini and Kosova Plains of Kosovo using fine-grain, field-mapped data. Agricultural land-use structure was analyzed across three hierarchical classification levels, from broad categories to specific crop types, focusing on patterns of composition and configuration. Descriptive analyses and non-metric multidimensional scaling (NMDS) were used to examine structural patterns across thematic resolution and spatial grouping, with topographic and geographic variables included as contextual variables. Landscape metrics derived from field mapping were also compared with the ESA WorldCover dataset to evaluate how global land-cover products represent agricultural landscape structure. The results show that coarse classifications limit detectable structural differentiation. While broad land-use categories showed limited compositional variation and low diversity, finer classification levels revealed stronger contrasts in composition, configuration, and diversity. At the finest classification level, significant differentiation was detected among villages and municipalities, while contrasts between plains were weak. Topographic and geographic variables showed limited but detectable associations with structural patterns. Overall, this study provides a descriptive baseline of agricultural land-use structure in a data-scarce region.

1. Introduction

Agriculture occupies about one-third of the Earth’s land surface and represents the most extensive human-modified terrestrial ecosystem [1]. Agriculture plays a central role in meeting food demand for a global population projected to reach 9.7 billion by 2050 [2]. In recent decades, agricultural intensification has been widely promoted to meet rising food demand; however, empirical studies consistently associate intensification with biodiversity loss and reduced ecosystem resilience at local and landscape levels [3,4,5,6]. Agricultural landscapes also support essential ecosystem services such as pollination, soil fertility, and pest regulation, which are increasingly threatened under intensive land-use regimes [1,3,7,8,9]. Intensification has also been linked to soil and water degradation, and increased greenhouse gas emissions, with the agriculture, forestry, and land-use sector accounting for approximately 22% of global emissions [10,11]. In contrast, diversified agricultural practices, including crop rotation, intercropping, and agroforestry, have been shown to support biodiversity and ecosystem services while reducing production risks and dependence on external inputs [12,13,14,15]. Empirical evidence from Europe and North America demonstrates that land-use diversification can reduce yield variability [12,16], mitigate pest outbreaks [17], improve soil properties [18,19], and enhance pollinator richness [20,21]. Integrating near-natural elements, such as hedgerows and small forest patches, has been shown to stabilize yields and reduce reliance on synthetic inputs in agricultural landscapes [22].
Biodiversity, ecosystem services, and ecological resilience are linked to the structure of agricultural landscapes, particularly their composition and spatial configuration [3,23,24]. Agricultural land-use structure refers to the spatial organization of land-use types and is commonly described through two complementary components: composition (types and relative proportions of land-use categories) and configuration (their spatial arrangement and degree of fragmentation) [25,26]. Several studies indicate that observed ecological responses depend on the thematic and spatial detail at which land use is characterized, with finer representations revealing patterns that remain obscured under coarse land-use classifications [27,28]. Recent studies have emphasized that the delineation and thematic resolution of agricultural land-use classifications influence the observed structure of landscape mosaics and their interpretation in biodiversity-oriented research [29,30]. Despite growing recognition of the ecological importance of heterogeneous agricultural landscapes, land-use classifications often simplify farmland into broad categories such as cropland or grassland, thereby overlooking crop-level diversity and small-scale heterogeneity [31,32]. Such simplification can misrepresent landscape structure and limit the interpretability of spatial analyses for biodiversity assessment and landscape-ecological research. This limitation is particularly relevant in regions dominated by smallholder farming systems, where parcel sizes are small and land-use mosaics are fragmented.
In the Balkan Peninsula, and particularly in Kosovo, empirical studies addressing agricultural land-use structure remain limited. Kosovo lies within the Mediterranean Basin biodiversity hotspot and is characterized by diverse agroecosystems that are affected by land-use change [33]. Field-based studies in Kosovo have shown that intensive monoculture and herbicide use have reduced plant species richness in arable land over recent decades, whereas abandoned or extensively managed fields exhibit higher diversity [34]. At broader spatial scales, land-use and land-cover change analyses document a decline in agricultural land and an expansion of artificial surfaces in parts of Kosovo, associated with ongoing urbanization and infrastructural development [35,36]. While these studies provide valuable regional context, they rely on coarse thematic resolution and do not capture the fine-grain structure of agricultural land use at the field or crop level. To date, no study has provided a fine-grain, field-based assessment of how agricultural land-use composition and configuration vary across hierarchical levels of thematic detail in Kosovo.
Several studies demonstrate that landscape metrics are sensitive to thematic resolution, with coarser classifications potentially masking structural heterogeneity and altering interpretations of landscape pattern [37,38]. Recent syntheses further emphasize that both spatial and thematic resolution influence the detectability of landscape structure, particularly in fragmented agroecosystems where fine-scale variation is ecologically relevant [39]. These challenges are especially pronounced in smallholder-dominated systems, where high parcel fragmentation and crop-level heterogeneity are common, yet often poorly captured in conventional land-cover datasets [40,41].
The aim of this study is to characterize agricultural land-use structure in sampled sites within the Dukagjini and Kosova Plains using fine-grain field mapping, examine how patterns of composition and configuration vary across increasing levels of thematic detail, and compare the resulting landscape metrics with those derived from a global land-cover dataset. The analysis evaluates agricultural land-use structure across three hierarchical classification levels and examines how geographic location, topographic context, and spatial grouping at the village, municipality, and plain are associated with observed structural patterns. The study provides a descriptive, spatially explicit baseline of agricultural land-use composition and configuration in smallholder-dominated agroecosystems.

2. Study Region

2.1. Geography, Climate, and Soils

Kosovo occupies a compact territory of 10,887 km2 in southeastern Europe with an altitudinal range from around 265 m near the Albanian border to 2656 m at Gjeravica. The country is divided primarily into mountain forests, grassland, and two main agricultural plains: the Dukagjini Plain (west) and the Kosova Plain (east). Climatically, the Dukagjini Plain experiences milder winters and receives approximately 700 mm of rainfall annually, influenced by Adriatic air masses, whereas the Kosova Plain’s climate is more continental, with colder winters and around 600 mm of annual rainfall [42]. Rainfall is unevenly distributed, peaking in late autumn and spring, while summer receives less precipitation, intensifying seasonal water stress [43]. Winter temperatures can drop to −27 °C, while summer highs reach +39 °C [43].
Seasonal water shortages, especially in the Kosova Plain, stem from limited reserves and high agricultural reliance on rainfall [44]. Since 2004, about 80% of municipalities have faced drought-related shortages, worsened by mismanagement and ecosystem degradation [44]. The Iber River Basin, a key water source, is nearing scarcity, while outdated irrigation, particularly in the White Drin scheme, further limits water availability [45]. Biogeographical classifications integrating vegetation, climate, and topography further highlight Kosovo’s position as a transitional zone between continental, alpine, and sub-Mediterranean influences [46]. Such classifications provide ecological context for patterns of agricultural land use across Kosovo’s plains, including long-established perennial systems such as viticulture and orchards in western regions, without implying direct causal relationships at the local scale.
Predominant soil types, such as cambisols, vertisols, fluvisols, and regosols, vary in quality, with approximately 15% classified as high-quality soil, 29% as medium, and 56% as poor [47]. Soil erosion affects 58% of agricultural land, exacerbated by practices such as residue burning [47]. However, high-resolution soil maps are currently unavailable for Kosovo, limiting spatial analysis of soil variability.

2.2. Utilized Agricultural Area (UAA), Farm Structure, and Productivity

While a single-year snapshot does not capture long-term trends, given variability in weather, economic conditions, and agricultural practices, the latest data for the year 2023 from the Kosovo Agency of Statistics (KAS) provide a representative view of the current agricultural status quo (Table 1) [48]. The table categorizes land use into meadows and pastures, arable land, gardens, and perennial crops, detailing their subcategories and key crop types (e.g., within cereals, wheat and maize are specified, while others are grouped as “other cereals”).
Cereals predominate within arable land use, with wheat and maize as principal crops; however, their average yields (3.8 t/ha for wheat and 4.1 t/ha for maize) remain below European Union (EU) levels (wheat: approximately 5.8 t/ha, and maize: around 7.7 t/ha) [49]. Vegetable cultivation includes peppers, onions, tomatoes, cabbage, and potatoes, among others, though yields vary among these crops. Perennial fruit plantations, including apples, plums, walnuts, pears, and raspberries, occupy around 2.5% of UAA, while vineyards account for approximately 0.8%. These vineyards contributed to a wine production of about 7.86 million liters in 2022, although grape yields fell by 11.4% from the previous year due to unfavorable weather [50]. UAA includes only actively utilized and fallow land, excluding areas abandoned for over five years.
Organic agriculture is expanding as a promising sustainable alternative despite productivity constraints. Organic farmland increased from just 5 ha in 2009 to approximately 3089 ha (0.7% of UAA) in 2022, a 55.2% increase from 2021, while wild collection dominates with about 1.96 million ha (99.8% of organic certification) [51,52]. Unlike Kosovo, the EU’s organic sector is farmland-focused (10.4% of UAA) [52]. The National Organic Action Plan (NOAP) of Kosovo aims to expand certification and align with the EU Farm-to-Fork Strategy’s 25% organic land target, requiring approximately 105,000 ha by 2030 [47,51]. This transition could enhance high-value exports in medicinal aromatic plants (MAPs), wines, and specialty fruits.
Agriculture in Kosovo is characterized by significant fragmentation, with around 92.7% of farms under 5 ha managing approximately 60.6% of arable land, whereas only 1.6% exceed 10 ha but control over 30% [47]. This fragmentation limits mechanization potential, reduces economies of scale, and contributes to lower yields compared to EU averages [47,49]. Moreover, farm-level heterogeneity in Kosovo has been shown to encompass distinct clusters differing in production function [53]. Despite structural inefficiencies, agriculture remains economically significant, contributing 7.4% (€658 million) to Kosovo’s GDP in 2022 [50]. Nevertheless, the sector faces substantial reliance on imports (€1.2 billion), dwarfing its agricultural exports (€118.9 million) [50]. To improve competitiveness, MAFRD provides subsidies and grants to encourage mechanization, modernization, and risk mitigation (e.g., crop insurance), yet structural fragmentation and market barriers persist [47].
A key constraint is the lack of adequate irrigation infrastructure, which covers only about 18,885 ha [50]. Limited water availability further reduces yields, particularly during drought periods, affecting resilience to climate variability. Additionally, the use of fertilizers and pesticides has evolved, consistent with increased input intensity but also regulatory gaps. The area fertilized with organic inputs expanded from 34,872 ha in 2016 to 63,940 ha in 2023 (+83.4%), while application declined from 962,185 to 900,201 tons (−6.4%), suggesting inefficiencies, reduced availability, or shifts toward alternative methods [54]. Poor manure management further limits effectiveness, leading to nutrient loss and environmental risks. In contrast, mineral fertilizer use increased from 78.08 million kg to 80.88 million kg (+3.6%), despite a decline in fertilized land from 183,102 ha to 174,161 ha (−4.9%), indicating higher input intensity per hectare and potential soil degradation [54]. Limited soil testing, inefficient application, and weak quality regulation exacerbate nutrient imbalance and environmental pollution. Similarly, pesticide-treated land expanded from 115,014 ha to 122,752 ha (+6.7%), yet weak regulation, poor monitoring, and inconsistent application pose environmental and health risks [54]. To address these challenges, strengthening regulatory frameworks, improving soil testing, and enhancing advisory services are essential for balancing productivity with sustainability [47,54].

3. Materials and Methods

3.1. Study Design

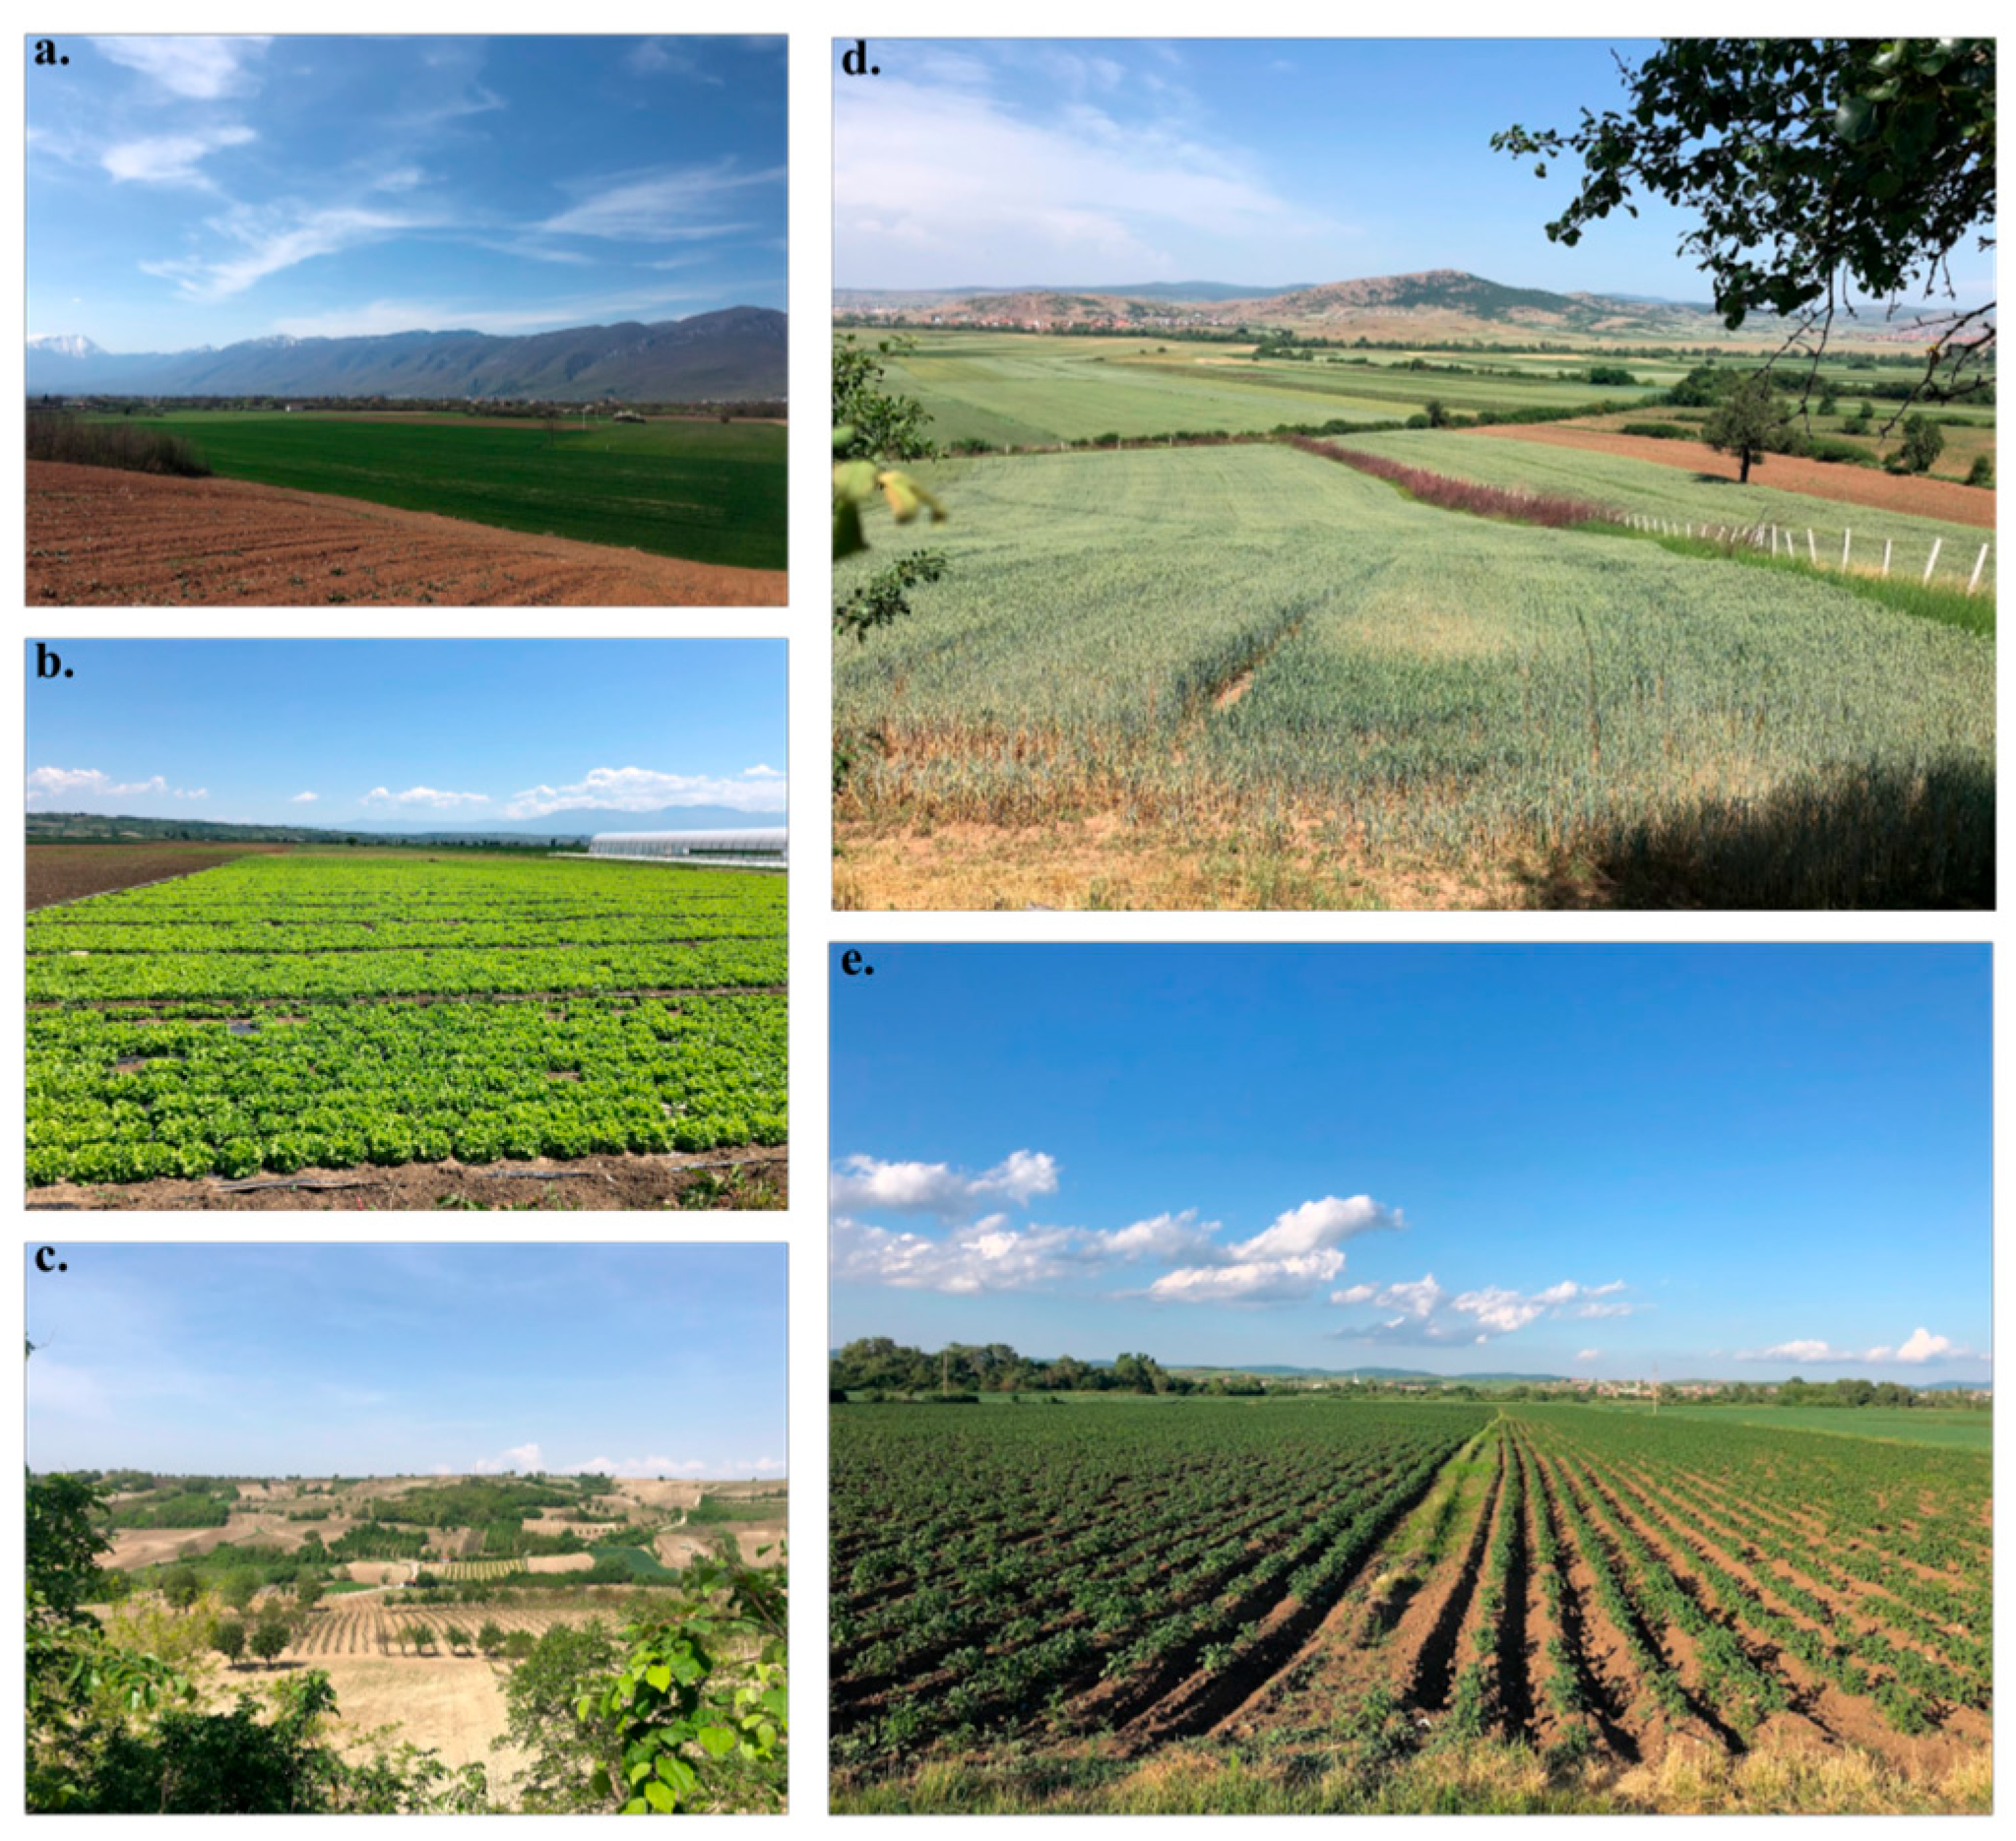
This study was conducted in Kosovo’s two main agricultural plains: Dukagjini and Kosova (Figure 1). Within each plain, two agriculturally dominated municipalities were selected (Istog and Rahovec in the Dukagjini Plain; Viti and Vushtrri in the Kosova Plain) to represent contrasting agricultural systems within the principal farming regions (e.g., cereal crops, vineyards, orchards). Within each municipality, four predominantly agricultural villages were selected, resulting in 16 villages. In each village, three non-overlapping 1 km2 circular plots were delineated to ensure consistent spatial grain and spatial coverage, yielding 48 sites. Site selection followed a purposive design focused on agriculturally dominated landscapes of the two plains and was not intended to produce statistically representative estimates at the national scale.
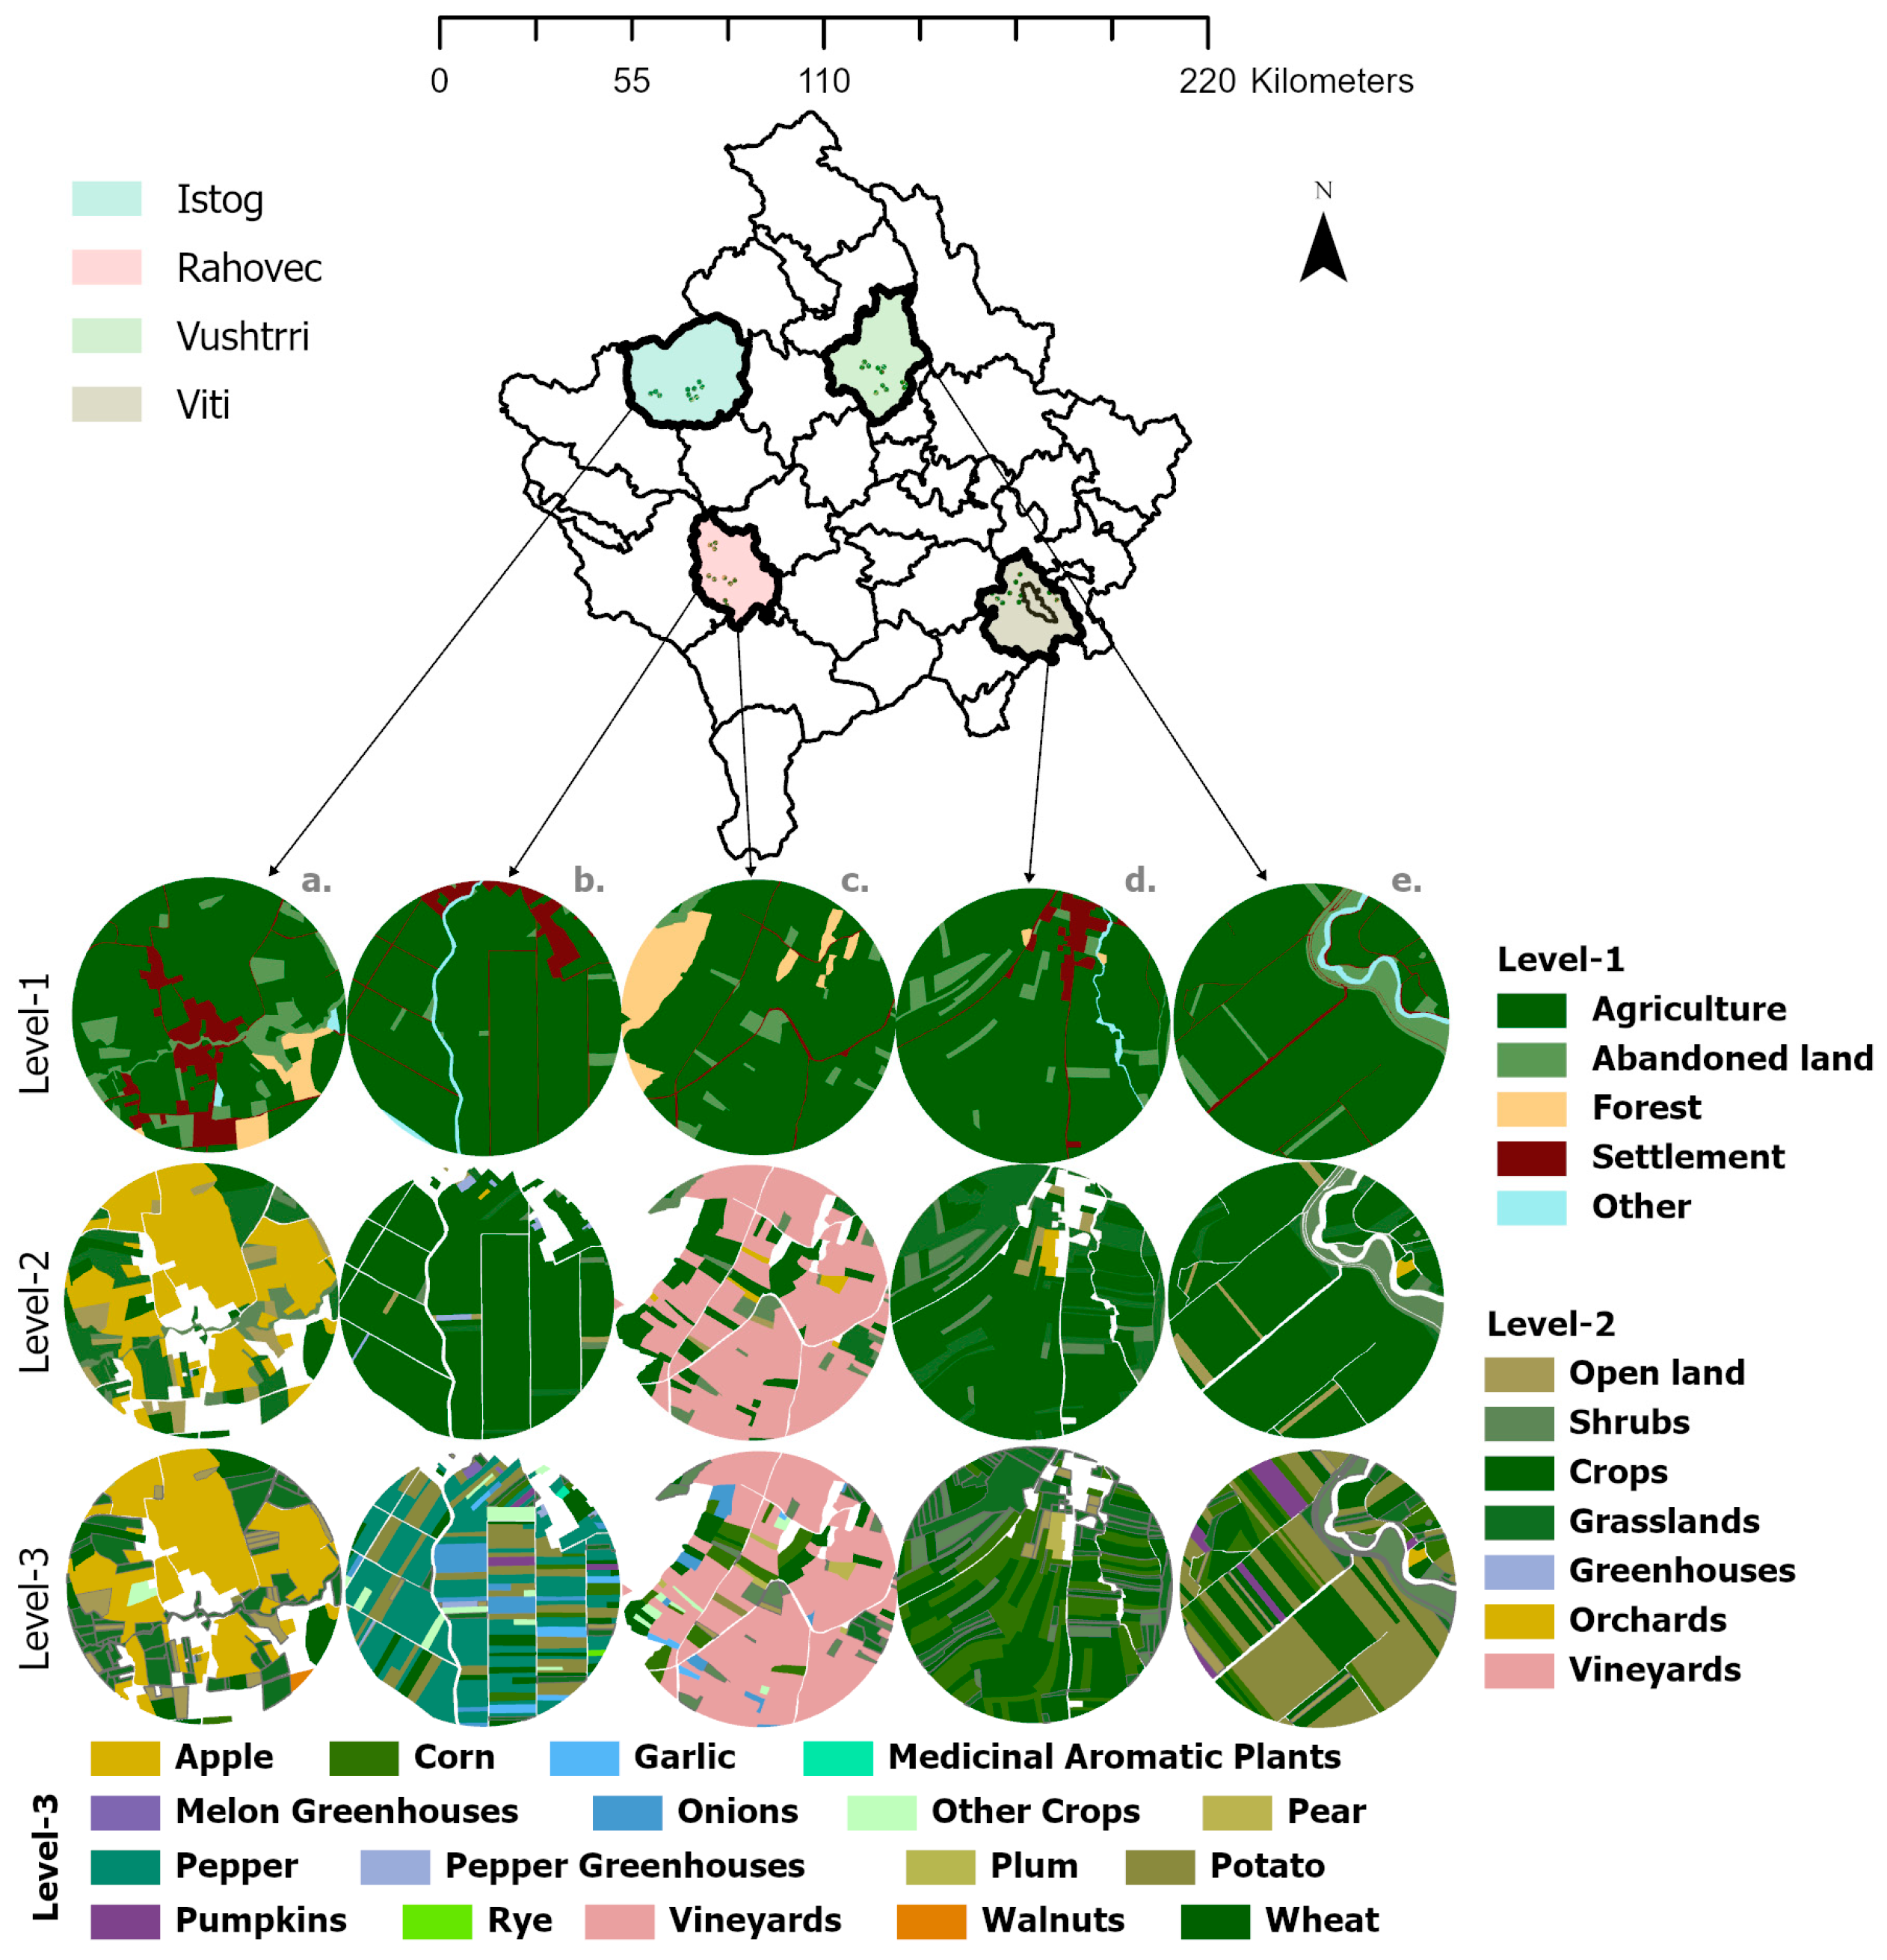
Field mapping of individual land-use patches was conducted between spring and summer 2022, with a focus on agricultural land. Mapping was carried out on foot to delineate parcel boundaries and record land-use types in situ, particularly in areas where existing land-use datasets were too coarse for parcel-level analysis. Printed high-resolution orthophoto base maps of the 1 km2 plots were used during fieldwork to record land-use classes; the same base maps were subsequently georeferenced and used for on-screen digitization in ArcGIS Desktop 10.8.2 (Figure 2). Parcel boundaries were digitized following clearly identifiable physical features observable both in the field and in the orthophotos.
Field mapping across the 48 surveyed sites resulted in a total of 9574 individual land-use patches. Soil properties and land-use intensity data lacked sufficient spatial resolution at the site level and were therefore excluded. All geospatial data were projected to the ETRS-1989-Kosovo-Grid coordinate system. Topographic variables and landscape metrics were derived following the procedures described in Section 3.3 and Section 3.4.

3.2. Land-Use Classification

Agricultural land use was classified using a three-level hierarchical scheme reflecting increasing thematic detail. The classification primarily represents agricultural land use, while non-agricultural categories (forest, settlement, and others) were included at Level-1 as contextual land-cover classes to characterize the surrounding landscape matrix. Level-1 comprised broad categories: Agriculture, Abandoned Land, Forest, Settlement, and Others. Level-2 introduced subcategories within Agriculture (Crops, Grassland, Orchards, Vineyards, and Greenhouses) and Abandoned Land (Shrubs; Open land). “Open land” refers to parcels not cultivated at the time of field mapping but showing visible signs of prior agricultural use; classification was based solely on field observations at the time of mapping. Level-3 retained Level-2 classes that were not further subdivided and disaggregated selected agricultural classes into specific crop types identified during field mapping, enabling crop-level analysis of agricultural landscape composition and configuration. Minor crop types occurring infrequently or covering very small areas were aggregated into broader categories (e.g., “Other crops” and “Other fruits”) to maintain thematic consistency and reduce sparsity at Level-3. Higher-level classes are broadly aligned with European land-cover nomenclature (e.g., CORINE Land Cover), while agricultural categories were refined based on field observations.

3.3. Independent Variables

Independent variables included geographic location (latitude and longitude) and topographic descriptors derived from the Copernicus Digital Elevation Model (DEM), projected at 30 m resolution to the ETRS 1989 Kosovo Grid coordinate system. Elevation, slope, aspect, and the Topographic Wetness Index (TWI) were calculated from the DEM. For each 1 km2 site polygon, zonal statistics (mean, minimum, maximum, standard deviation, and range) were computed for elevation and slope. Aspect was transformed into circular components (northness = cos(aspect), and eastness = sin(aspect)) to avoid angular discontinuity. Because several elevation-derived descriptors were strongly correlated (>0.7), mean elevation and elevation range were retained to represent topographic position and local relief, while mean slope was retained as an indicator of terrain steepness. TWI was excluded due to strong correlation with elevation- and slope-derived variables. Topographic variables (mean elevation, elevation range, and mean slope) were compared among municipalities and plains using one-way ANOVA, followed by Tukey’s HSD tests. Values are reported as mean ± standard deviation.

3.4. Agricultural Land-Use Structure and Landscape Metrics (Dependent Variables)

Agricultural land-use structure was characterized within each 1 km2 site across hierarchical levels. Land-use composition (class areas and proportional cover) and mean patch area were derived directly from the digitized polygon map for all land-use classes. Configuration and diversity metrics were computed in FRAGSTATS v4.2 for the agricultural subsystem (agriculture and abandoned land) from a 1 m rasterized version of the land-use map using edge-adjacency (4-neighbor) to define patch connectivity.
A broad suite of metrics was initially computed. To reduce redundancy among highly correlated (>0.7) indices, a subset representing complementary structural dimensions was retained for inferential analyses. These included Patch Density (PD), Largest Patch Index (LPI), Edge Density (ED), and Shannon’s Diversity Index (SHDI). The Landscape Division Index (DIVISION), which was strongly correlated with LPI, was retained for multivariate ordination analyses but was not included in mixed-effects models. Metrics were calculated independently for each hierarchical level to account for differences in thematic resolution.
Differences in PD, LPI, ED, and SHDI among municipalities and plains were analyzed using linear mixed-effects models. For each metric, municipality or plain and classification level (Level-1–3) were included as fixed effects. Site identity was included as a random intercept to account for repeated measurements across classification levels, and village (and municipality for plain-level models) was included as an additional random intercept to account for clustering of sites within higher spatial units when supported by the data. Significance of fixed effects was assessed using Type III tests with Satterthwaite approximation of degrees of freedom. Where significant interactions were detected, group differences were evaluated within classification levels using Tukey-adjusted estimated marginal means and summarized with compact letter displays. Relationships between mean elevation and SHDI were assessed separately for each classification level. Linear regression models were fitted, and generalized additive models (GAMs) were additionally used to evaluate potential nonlinear responses. When GAM smooth terms were not significant or approximated linearity (effective degrees of freedom ≈ 1), linear models were retained; otherwise, GAM results were reported.

3.5. Multivariate Analysis

Non-metric multidimensional scaling (NMDS) was applied separately at each hierarchical level to summarize multivariate patterns in agricultural land-use composition across sites. The ordination matrix consisted of proportional area of land-use classes and was Hellinger-transformed prior to analysis using Bray–Curtis dissimilarity. Two-dimensional solutions were used for visualization; three-dimensional solutions were examined to assess stress reduction and ordination stability. For Level-3, crop types were retained if they exceeded 1% of site area in at least one site; classes remaining below this threshold across all sites were excluded to reduce the influence of rare categories on ordination stability. Spatial (latitude and longitude), topographic (mean elevation, elevation range, mean slope, northness, and eastness), configuration (PD and DIVISION), and diversity (SHDI) metrics were fitted post hoc using the envfit procedure to evaluate their association with compositional gradients. Vectors with p < 0.10 were displayed to illustrate both significant and near-significant trends in compositional gradients. Differences among villages, municipalities, and plains were evaluated using PERMANOVA (adonis2). Homogeneity of multivariate dispersion was tested using PERMDISP (betadisper) to distinguish centroid separation from dispersion effects.

3.6. Comparison with the WorldCover Dataset

To evaluate how coarse-resolution land-cover datasets capture agricultural landscape structure, the field-mapped data were compared with the ESA WorldCover 10 m land-cover dataset (2021). The WorldCover raster was mosaicked, projected to the ETRS-1989 Kosovo Grid coordinate system, and clipped to the extent of the 48 study sites. The field mapping was rasterized to the same 10 m resolution to ensure comparability.
For thematic comparability, the field mapping was reclassified into categories corresponding to the WorldCover classes (tree cover, shrubland, grassland, cropland, built-up, and other). Pixels classified as “other” represented mixed or minor land-cover types without a direct WorldCover equivalent and were excluded from accuracy calculations.
Agreement between field mapping and the WorldCover dataset was evaluated using a confusion matrix based on pixel-wise comparison of the two rasters. Overall Accuracy (OA), observed agreement (Po), expected agreement by chance (Pe), and Cohen’s Kappa (κ) (1) were calculated. Class-specific accuracy was assessed using Producer Accuracy (PA) and User Accuracy (UA). Overall accuracy values were computed for each of the 48 sites and summarized as mean ± standard deviation for municipalities and plains.
κ = P o P e 1 P e
Landscape metrics derived from field mapping and WorldCover were compared using the same metrics described in Section 3.4. Metrics were computed separately for the field mapping and WorldCover for each site in FRAGSTATS v4.2 for the agricultural subsystem using edge adjacency (4-neighbor). Differences between datasets were analyzed using linear mixed-effects models, with data source (Field vs. WorldCover) and spatial grouping (municipality or plain) as fixed effects and site identity included as a random intercept. Significance of fixed effects was assessed using Type III tests with Satterthwaite approximation of degrees of freedom. Where significant effects were detected, pairwise comparisons were evaluated using Tukey-adjusted estimated marginal means. Results are reported as mean ± standard deviation with significance levels (* p < 0.05, ** p < 0.01, *** p < 0.001). All analyses were performed in R (version 4.5.2).

4. Results

4.1. Topographic Characteristics

Site elevations ranged from 312 to 598 m across the study area. Mean elevation differed among municipalities (Table 2), with Vushtrri having the highest mean elevation and Rahovec the lowest, while Viti was intermediate. Elevation range did not differ significantly among municipalities. Mean slope varied among municipalities, with Rahovec exhibiting steeper terrain than Istog, and Viti and Vushtrri showing intermediate values.
At the plain level, Kosova sites were situated at higher mean elevations than Dukagjini sites, whereas elevation range and mean slope did not differ between plains.

4.2. Agricultural Land-Use Composition and Diversity

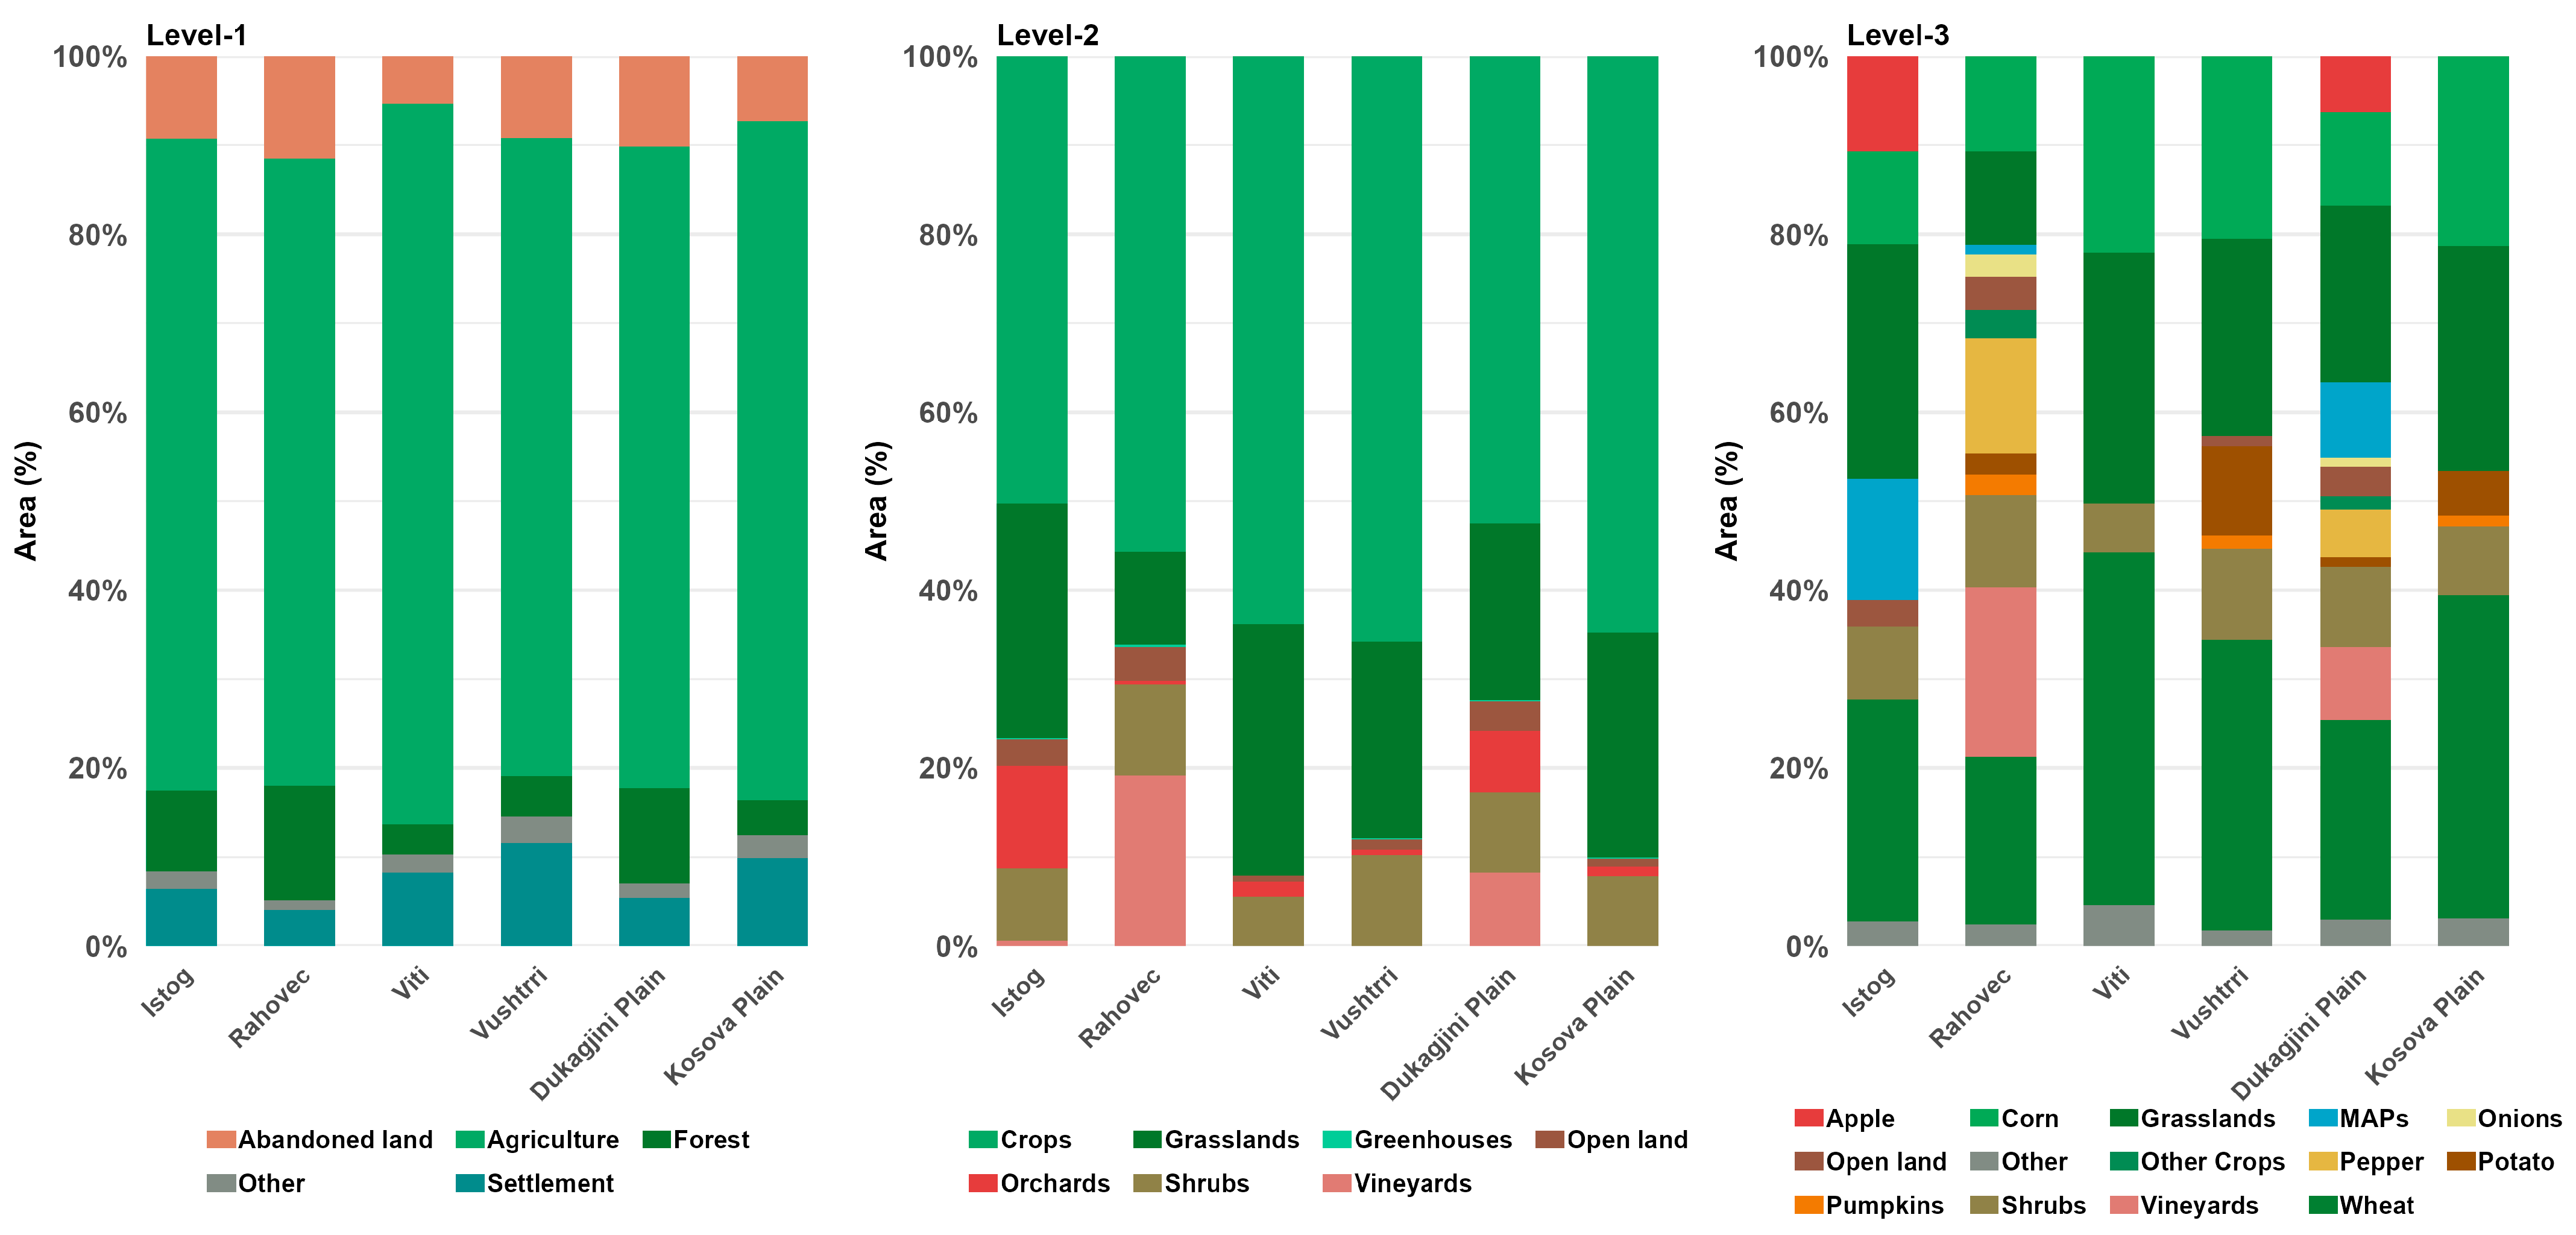
At the coarsest classification level, agricultural land dominated all municipalities, accounting for 70–81% of total area, while forest and other non-agricultural land-cover classes formed the surrounding landscape matrix, with limited variation among municipalities or between plains (Figure 3).
The broad thematic resolution at this level limited compositional differentiation. At Level-2, increased thematic detail revealed clear differences in agricultural composition. Crops dominated agricultural land in all municipalities, particularly in Viti and Vushtrri, while grasslands were more prominent in Istog, and vineyards were characteristic of Rahovec. Despite these contrasts, most sites remained dominated by one or two land-use subcategories. At Level-3, crop-type resolution further differentiated municipalities. Rahovec contained larger shares of vineyards and vegetable crops, whereas cereal crops (wheat and maize) dominated in Viti and Vushtrri. In Istog, apple orchards and MAPs represented a larger proportion of agricultural land. Crop types representing less than 1% of total agricultural areas were aggregated to maintain comparability across municipalities.
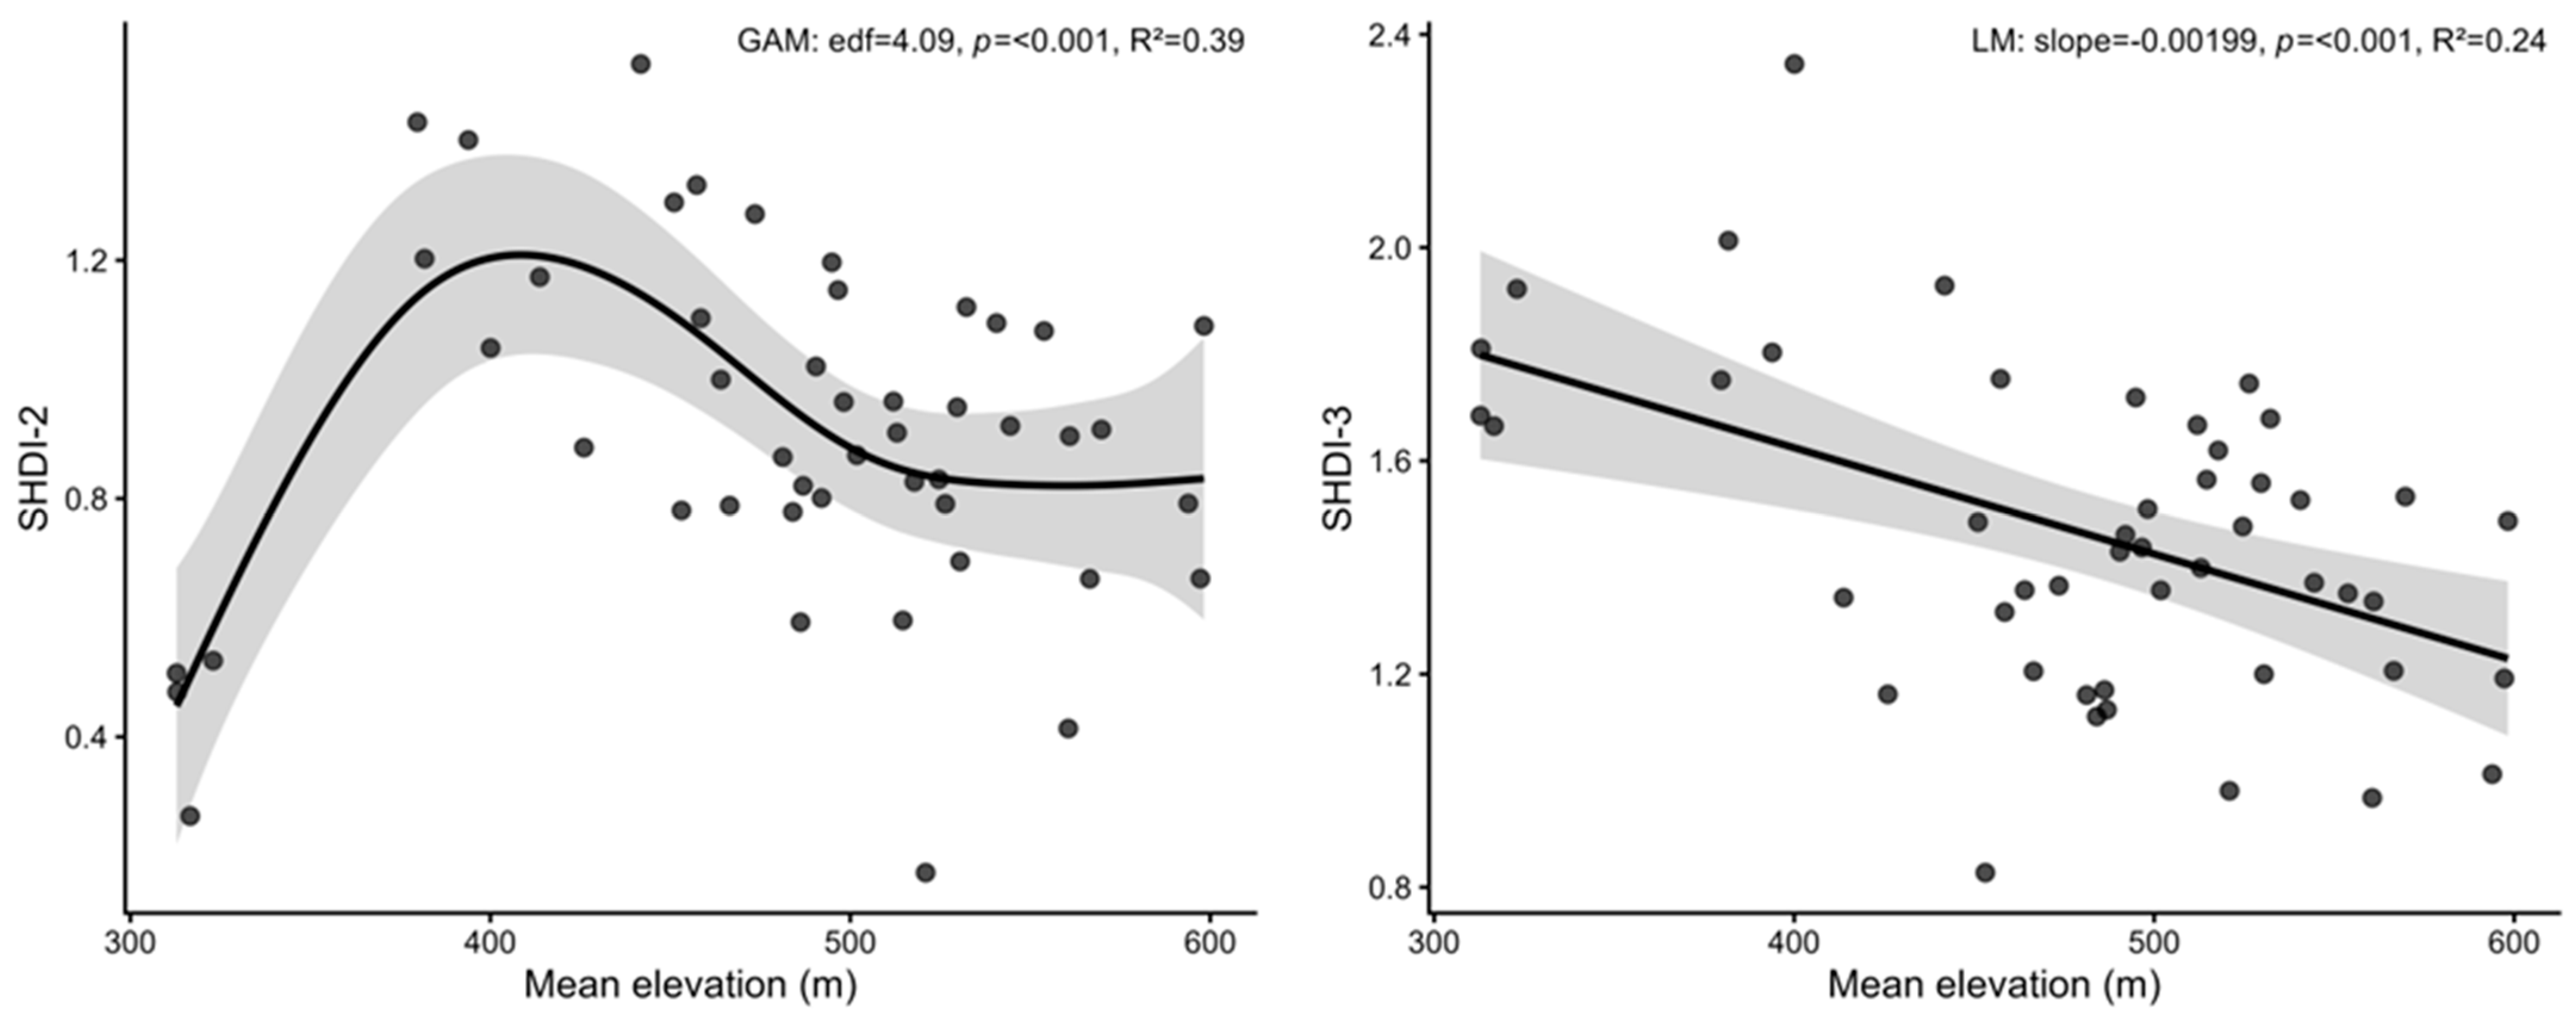
Shannon diversity at Level-1 (SHDI-1) did not differ among municipalities or between plains (Table 3). Similarly, SHDI-2 showed no significant differences among municipalities or plains. However, SHDI-2 exhibited a significant nonlinear association with elevation (GAM, edf ≈ 4.1, p < 0.001, R2 ≈ 0.39; Figure 4).
At Level-3, SHDI-3 differed among municipalities (Table 3), with Rahovec showing the highest diversity, followed by Vushtrri, while Istog and Viti had lower values. No significant differences were detected between the plains. SHDI-3 showed a significant negative linear relationship with elevation (LM slope < 0, p < 0.001, adj. R2 ≈ 0.22; Figure 4).

4.3. Agricultural Configuration Metrics

Mean patch area varied among land-use categories and across municipalities and plains (Table 4). At Level-1, forest patches exhibited the largest mean areas, whereas other classes occurred in smaller patches. Agricultural patches were larger in Istog compared to other municipalities.
At Level-2, increased thematic resolution revealed clearer structural contrasts. The overall mean patch area was higher in the Dukagjini plain than in the Kosova plain. Vineyards and grasslands formed relatively large patches in the Dukagjini Plain, whereas cropland patches were generally smaller in the Kosova Plain. At Level-3, crop-type resolution further differentiated configuration, with substantial variation in mean patch area among crop types and municipalities.
Configuration metrics showed little differentiation among municipalities at Level-1 and -2 (Table 5). At Level-3, contrasts emerged: patch density (PD) and edge density (ED) were higher in Rahovec and Vushtrri relative to Istog, while the largest patch index (LPI) was lower. No significant differences were detected between the plains.

4.4. Multivariate Ordination (NMDS)

4.4.1. Level-1 Broad Categories

NMDS ordination of Level-1 composition showed no significant separation among municipalities (PERMANOVA: R2 = 0.072, p = 0.34), between plains (R2 = 0.015, p = 0.507), or among villages (R2 = 0.388, p = 0.14). Multivariate dispersion did not differ among municipalities, plains, or villages (PERMDISP: p ≥ 0.438), indicating that PERMANOVA results were not influenced by dispersion differences.
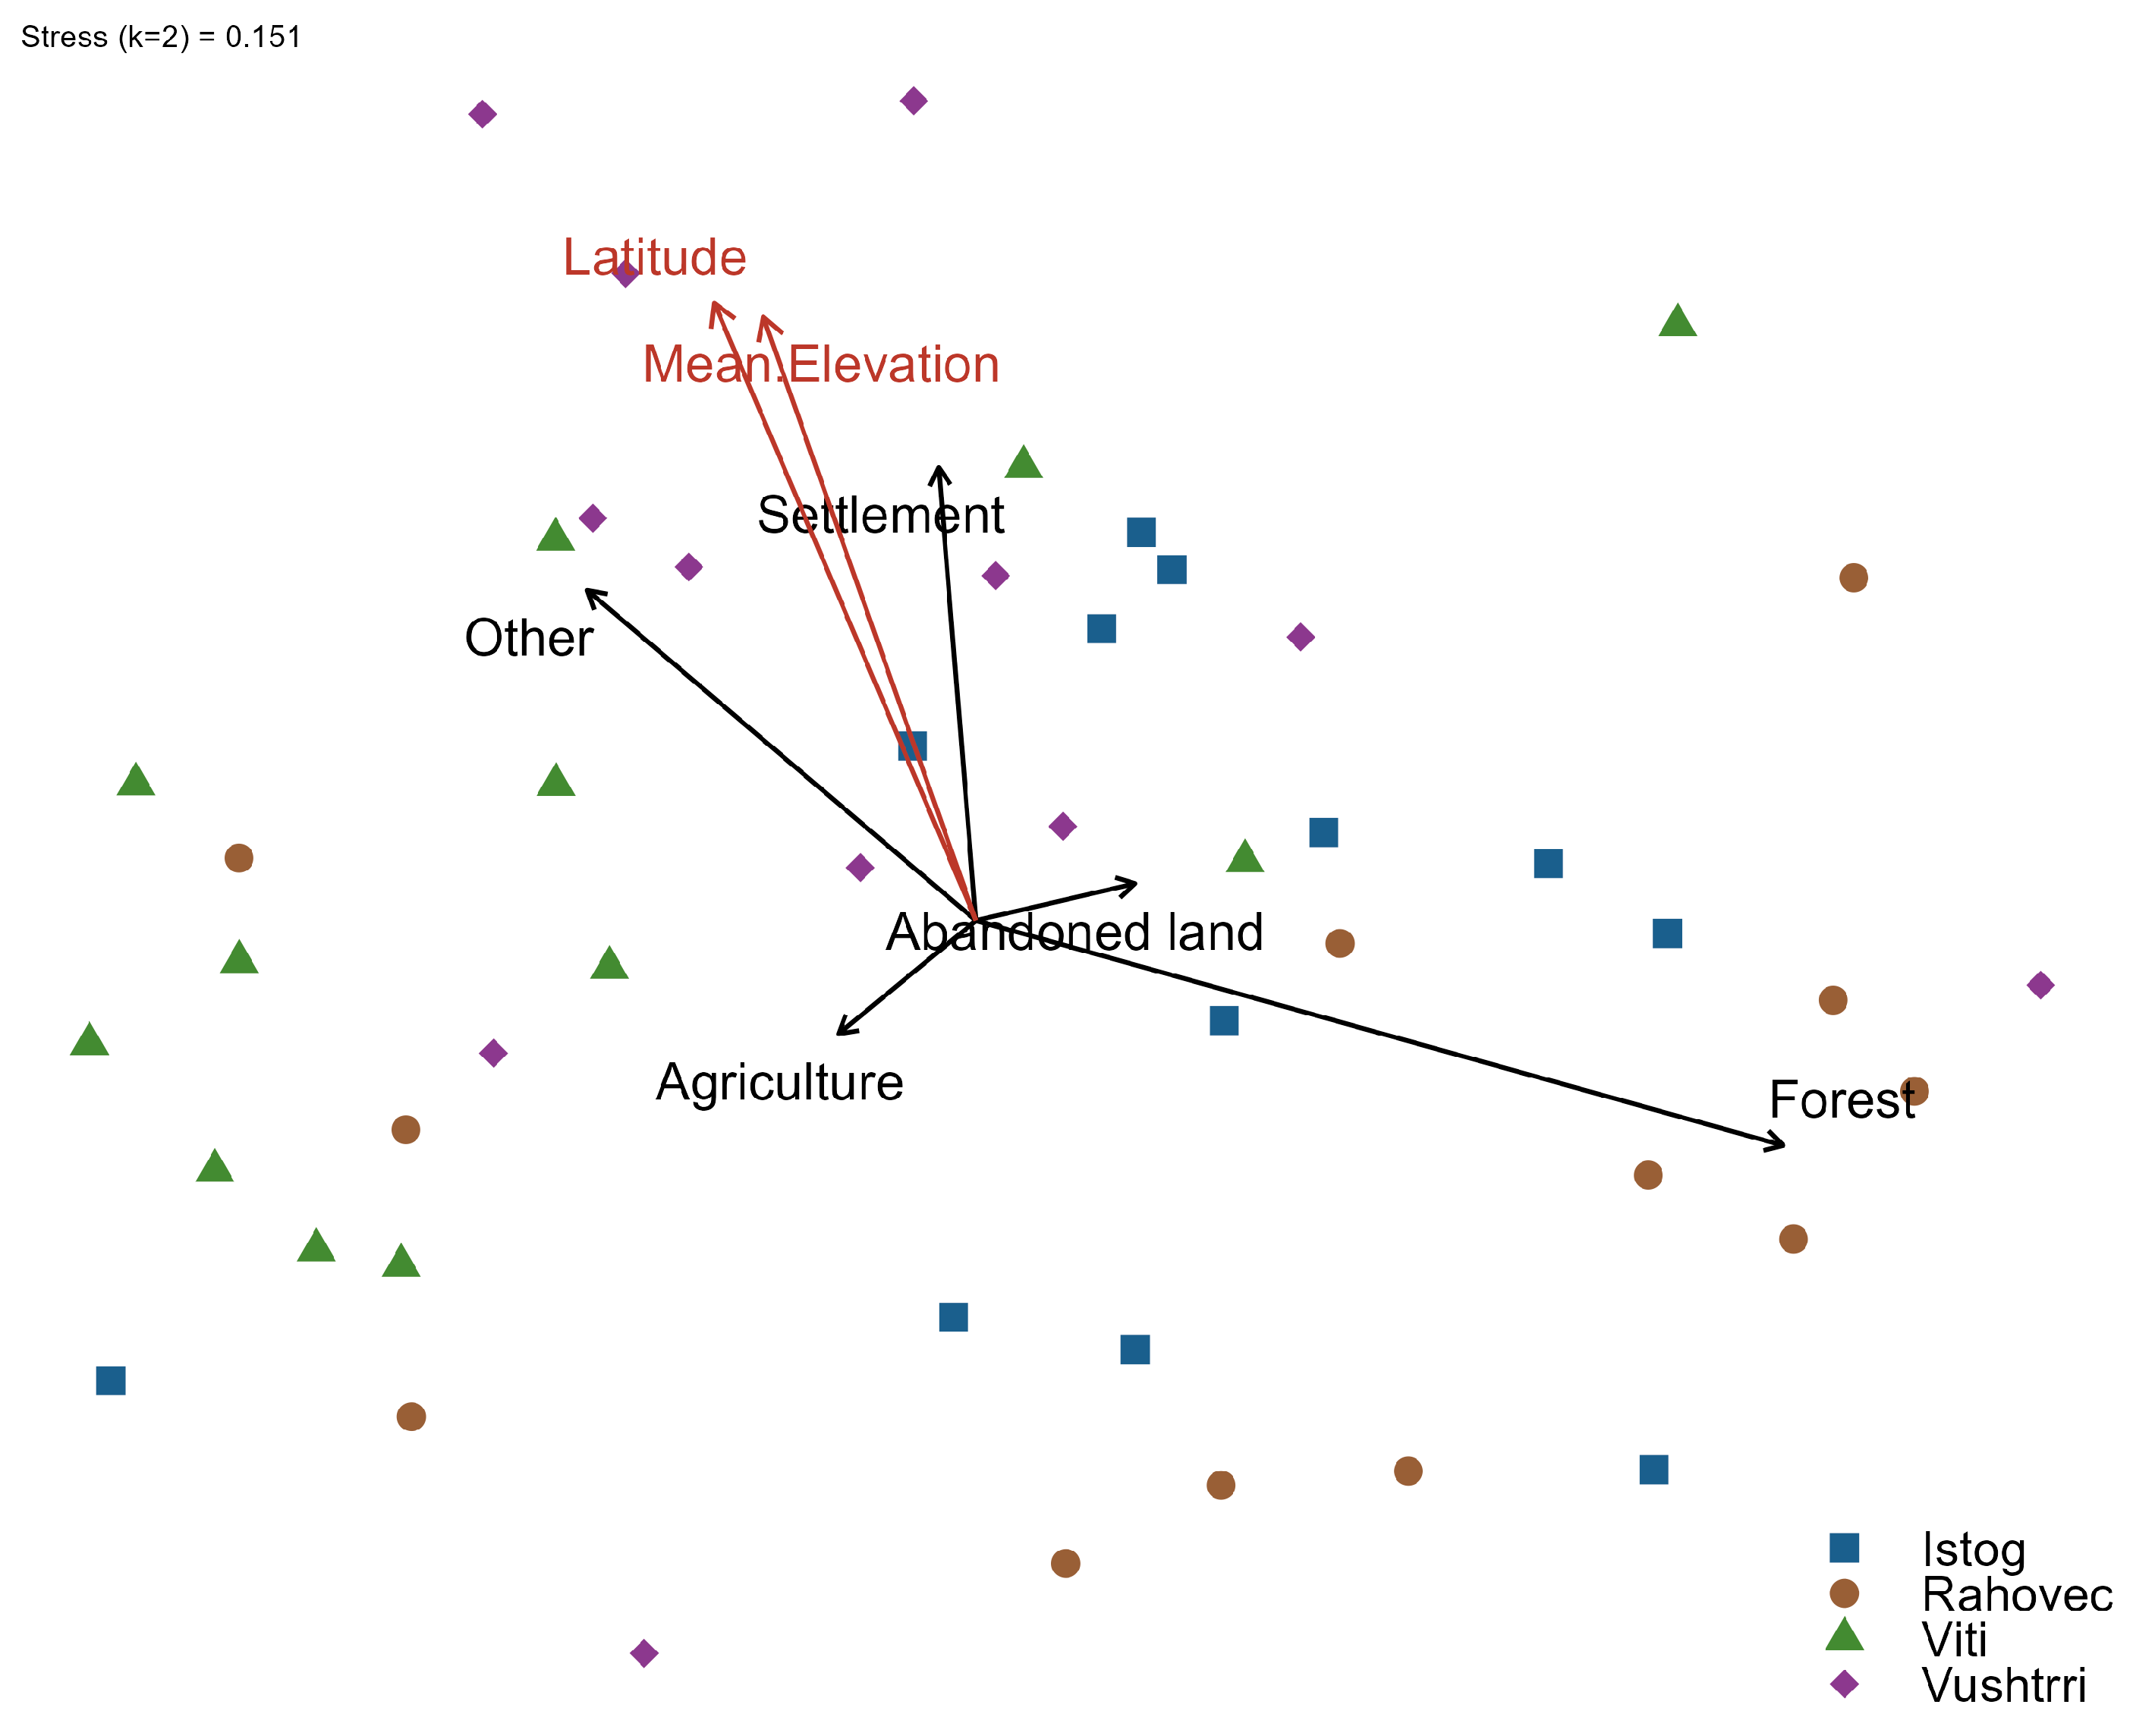
In envfit analyses, latitude was significantly associated with the ordination (r2 = 0.127, p = 0.039), while mean elevation showed a weak association (r2 = 0.114, p = 0.068). No other fitted variables were associated with the ordination (p ≥ 0.10). A two-dimensional solution was retained for presentation; a three-dimensional solution reduced stress (0.094) but did not alter overall patterns (Figure 5).

4.4.2. Level-2 Agricultural and Abandoned Land Subcategories

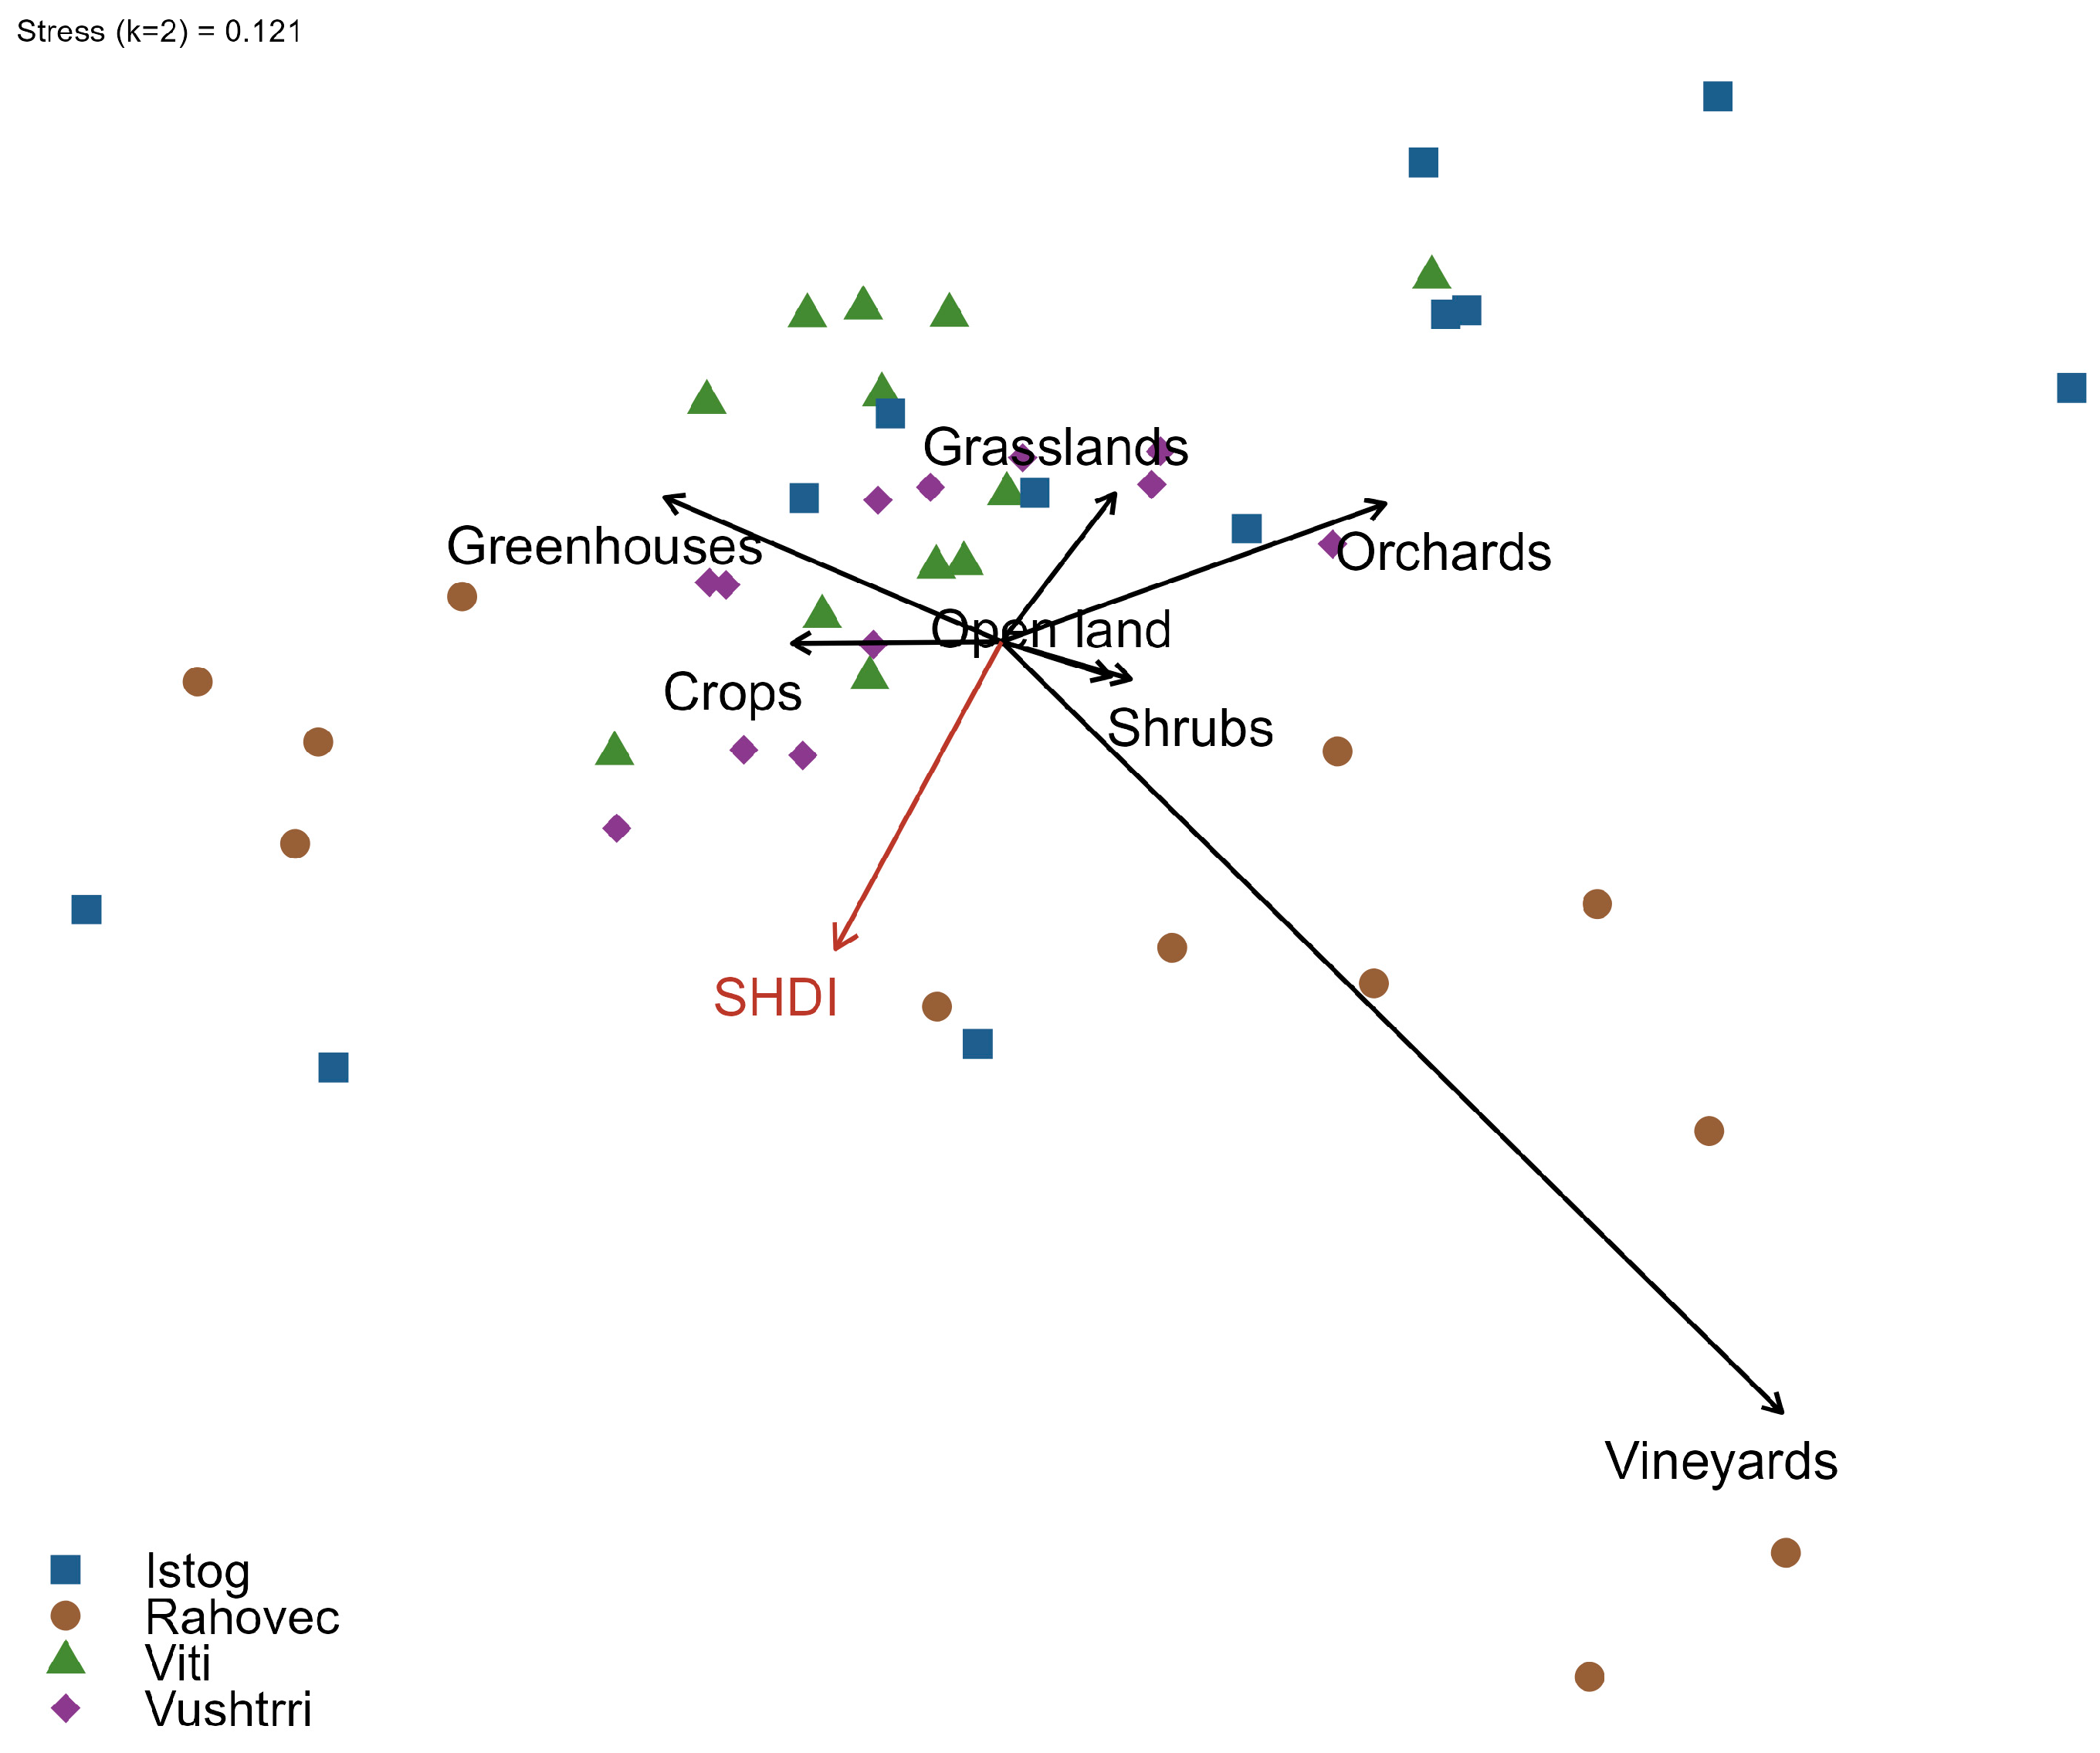
NMDS ordination of Level-2 composition did not show significant differences among municipalities (PERMANOVA: R2 = 0.062, p = 0.444), between plains (R2 = 0.022, p = 0.374), or among villages (R2 = 0.361, p = 0.197). Multivariate dispersion differed among municipalities (PERMDISP: p = 0.008) and between plains (p = 0.007), indicating heterogeneity in within-group dispersion for these groupings, while dispersion did not differ among villages (p = 0.258).
In envfit analyses, Shannon’s diversity index was significantly associated with the ordination (r2 = 0.162, p = 0.018). No other fitted variables were associated with the ordination at p < 0.10. As in Level-1, the two-dimensional solution was retained for presentation; a three-dimensional solution further reduced stress but did not change the observed patterns (Figure 6).

4.4.3. Level-3 Specific Crop Types

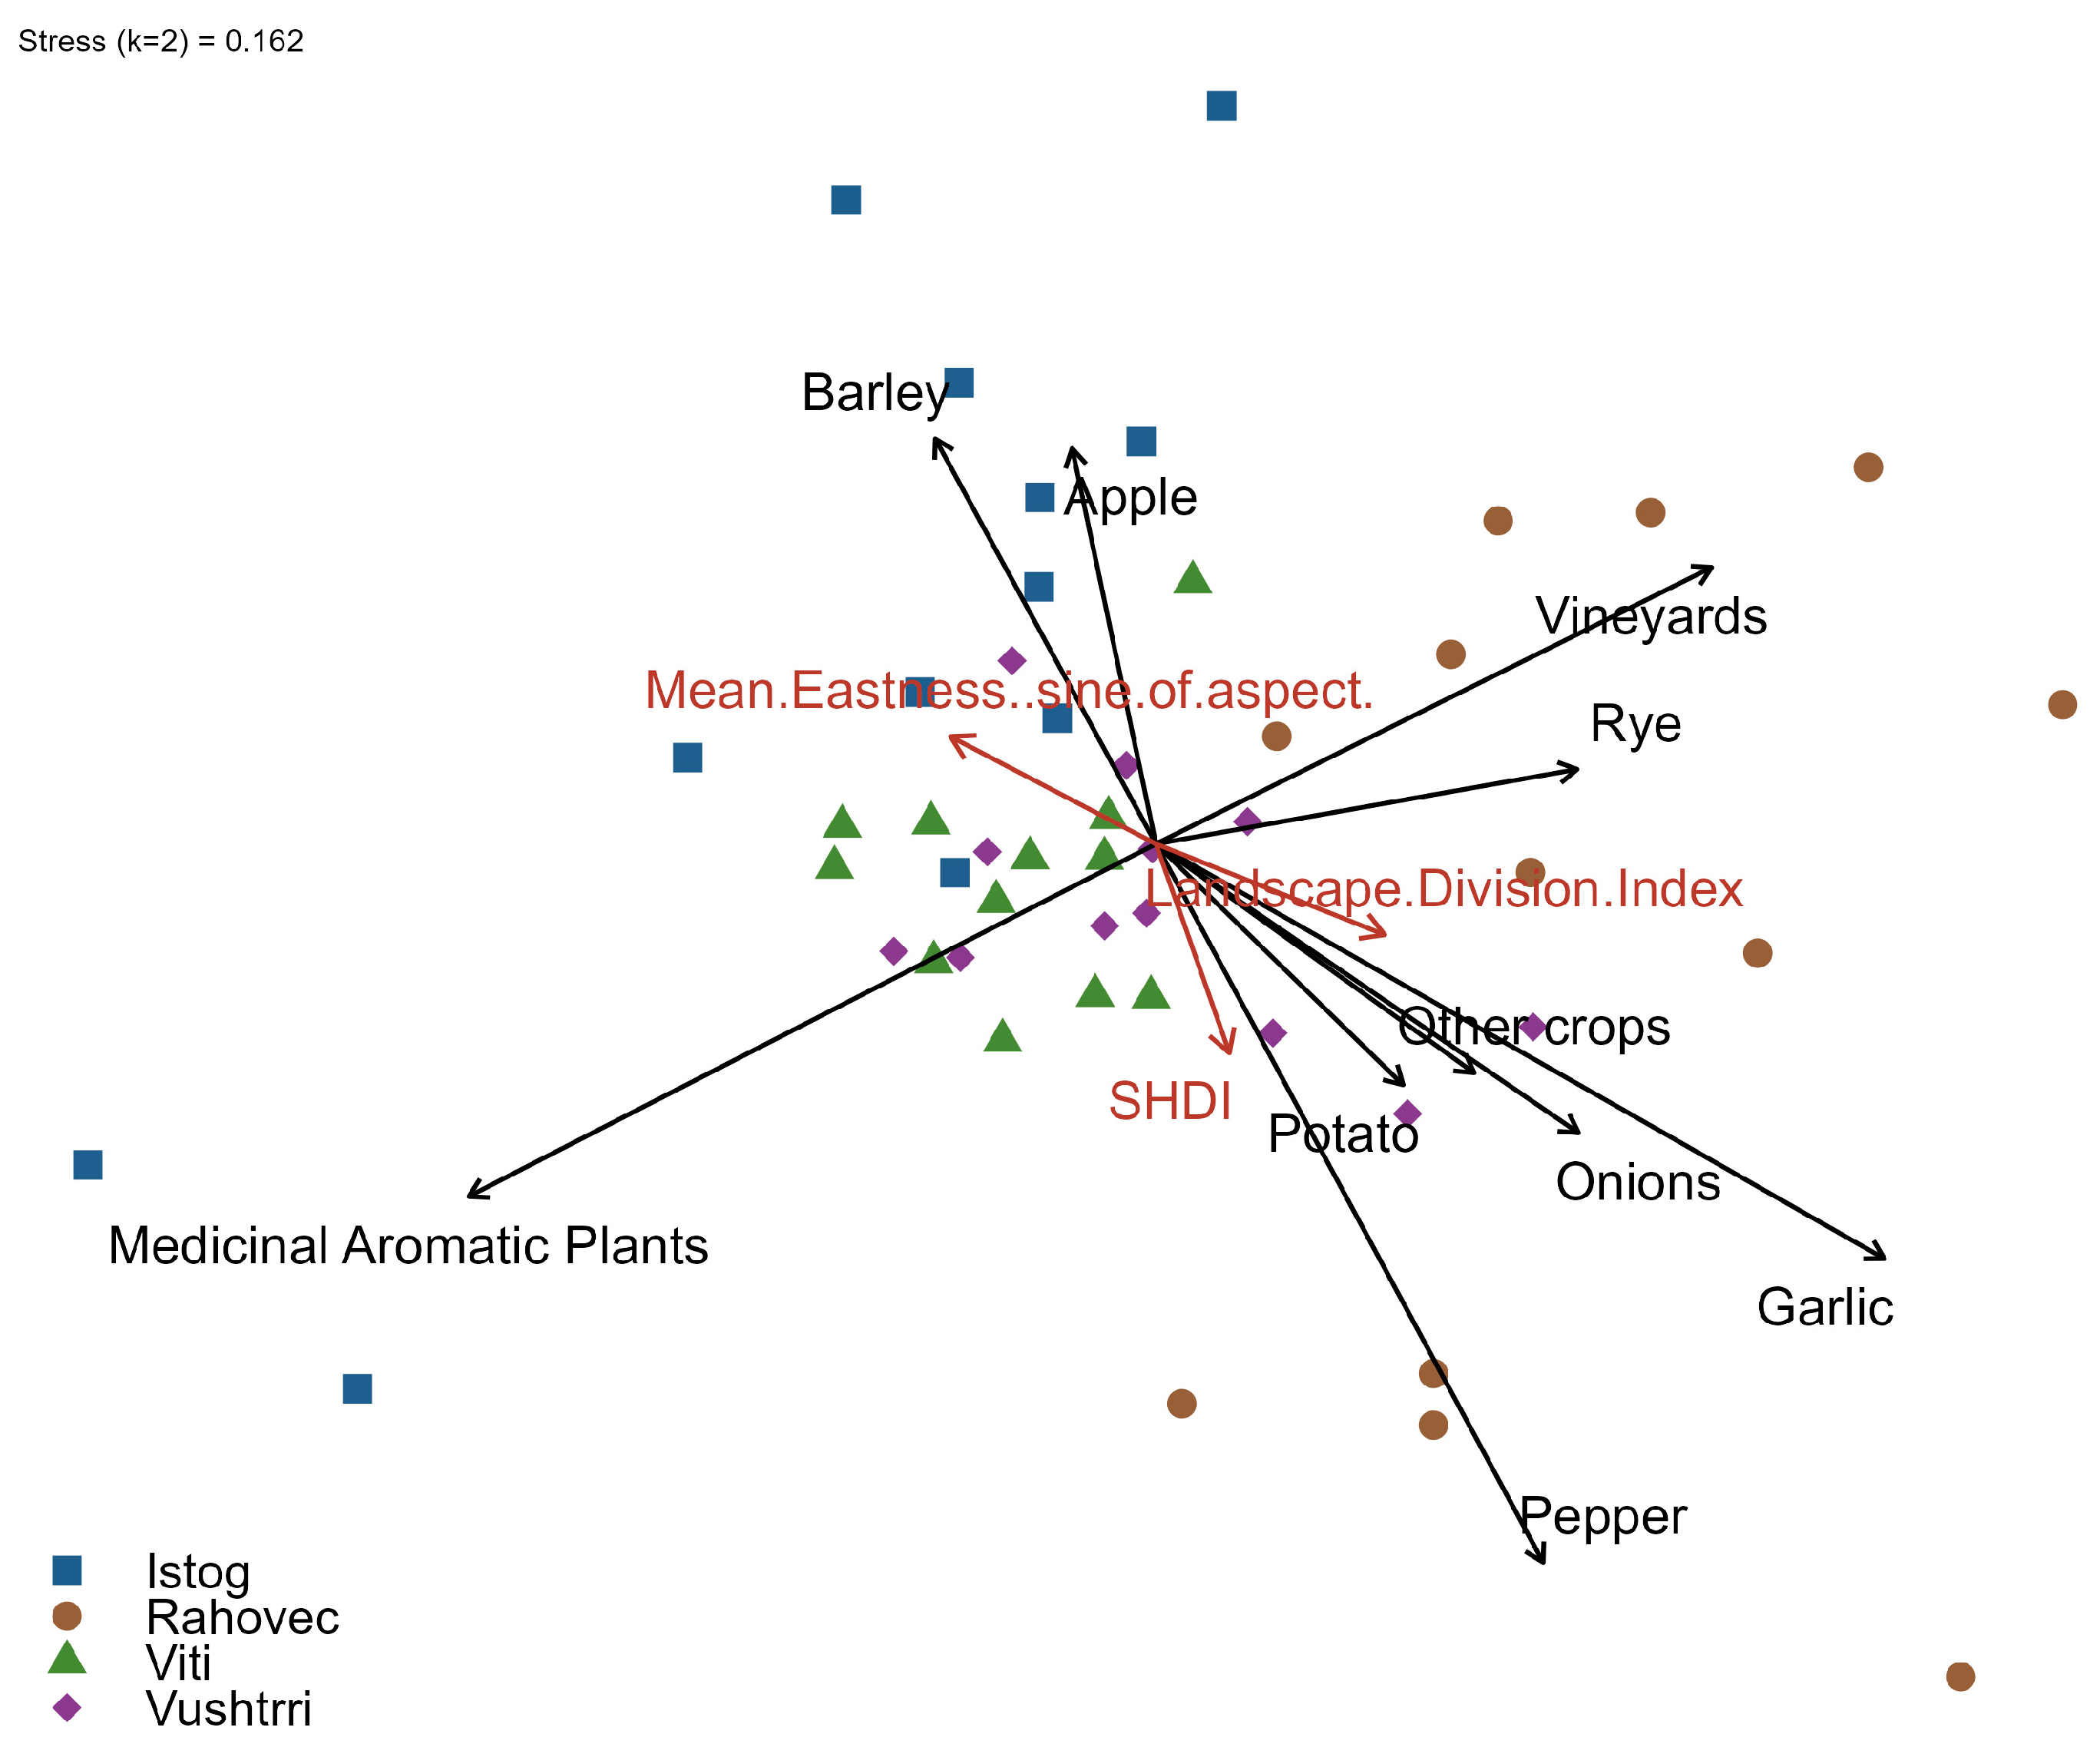
NMDS ordination of Level-3 composition showed significant differences among municipalities (PERMANOVA: R2 = 0.110, p = 0.009) and among villages (R2 = 0.456, p = 0.001), while differences between plains were weaker (R2 = 0.035, p = 0.104). Multivariate dispersion differed among municipalities and between plains (PERMDISP: p = 0.001 for both), indicating heterogeneity in within-group dispersion for these groupings; dispersion did not differ among villages (p = 0.438).
In envfit analyses, mean eastness (sine of aspect) showed a weak association with ordination structure (r2 = 0.112, p = 0.064), along with Shannon’s diversity index (r2 = 0.109, p = 0.071) and landscape division index (r2 = 0.125, p = 0.059). No other fitted variables met the display threshold (p ≥ 0.10). A two-dimensional solution was retained for presentation; a three-dimensional solution reduced stress (0.112) but did not change the observed patterns (Figure 7).

4.5. Comparison with the WorldCover Dataset

Comparison between the field mapping and the ESA WorldCover dataset showed moderate overall agreement (Table 6). The observed agreement exceeded the agreement expected by chance, resulting in a κ value indicating fair correspondence between the two datasets.
Class-specific accuracies varied among land-cover categories. Cropland showed comparatively higher reliability, whereas grassland exhibited lower agreement between datasets. Shrubland was rarely identified in the WorldCover dataset within the study area, which resulted in very low user accuracy for this class.
Overall accuracy showed limited variation among municipalities, with similar mean values across Istog, Rahovec, Viti, and Vushtrri (Table 6). Accuracy was also comparable between the Dukagjini and Kosova plains.
Given the moderate agreement between datasets (Table 6), landscape metrics derived from field mapping and the WorldCover dataset were compared to assess differences in the representation of agricultural landscape structure (Table 7). SHDI differed significantly between datasets in all municipalities and both plains. In contrast, differences in PD, ED, and LPI varied among spatial groupings. PD showed significant differences in three of four municipalities and in both plains. ED differed significantly in Istog, Viti, and Vushtrri and in the Kosova plain, but not in Rahovec or the Dukagjini plain. LPI differed significantly in Rahovec, Viti, Vushtrri, and both plains, but not in Istog.

5. Discussion

5.1. Structural Patterns Across Hierarchical Classification Levels

Across all analyses, increasing thematic detail revealed progressively stronger differentiation in agricultural land-use structure. At the coarsest classification (Level-1), agricultural land dominated all sampled municipalities, resulting in limited compositional variation and low diversity values. Differences at this level were primarily descriptive and were associated with variation in mean patch area among land-use categories (Table 4), whereas configuration metrics (PD, ED, and LPI) did not differ significantly among municipalities or plains (Table 5). Thus, broad thematic resolution captured dominance patterns but limited structural differentiation, consistent with previous findings on the sensitivity of landscape metrics to thematic resolution [37].
At intermediate thematic detail (Level-2), compositional contrasts among agricultural subcategories became more apparent, particularly in the relative shares of crops, grasslands, and vineyards. Although Shannon diversity did not differ among municipalities or plains, it exhibited a significant nonlinear association with elevation, corresponding to variation in subcategory-level composition along the topographic gradient. Mean patch area showed moderate differences among land-use types (Table 4), and patch density differed among municipalities (Table 5), whereas differences between plains remained limited. Compared with Level-1, these results show increased but still moderate structural differentiation.
At the finest classification (Level-3), crop-type resolution revealed the strongest compositional and configurational contrasts among municipalities. Shannon diversity differed significantly among municipalities, with higher values observed in Rahovec relative to other municipalities. For context, Rahovec combines high irrigation intensity (2597 ha, compared to 576 ha in Istog, 643 ha in Vushtrri, and no reported irrigated area in Viti; [50]), dominant national viticulture (>70% of Kosovo’s vineyard area and the majority of licensed wineries [55]), and a recognized horticultural aggregation and collection hub in the Rahovec–Xërxë area, where the Xërxë assembly market functions as a regional collection and redistribution point for vegetable production [56]. SHDI decreased significantly with elevation, showing a negative linear relationship between crop-level diversity and topographic position. Mean patch area varied substantially among crop types and municipalities (Table 4), and configuration metrics (PD and ED) differed among municipalities, whereas no significant differences were detected between plains (Table 5). Relative to Level-1 and -2, crop-level classification revealed the strongest structural differentiation among municipalities, in agreement with previous findings that increasing thematic resolution enhances detection of heterogeneity that remains obscured under broader land-use categories [37,38,39].
Multivariate ordination largely mirrored the univariate patterns. At Level-1, no significant separation was detected among villages, municipalities, or plains, and dispersion did not differ among groups, consistent with broad similarity in coarse compositional structure. At Level-2, centroid differences remained non-significant, although dispersion differed among municipalities and plains, consistent with variation in within-group heterogeneity without detectable centroid shifts. In contrast, Level-3 composition showed significant differentiation among municipalities and villages, with stronger differentiation among villages than among municipalities, while differences between plains remained weak. For municipalities and plains at Level-3, dispersion also differed, suggesting that both centroid shifts and heterogeneity contributed to multivariate structure.
Overall, multivariate separation was strongest at the finest thematic resolution. Post hoc fitting of spatial, topographic, diversity, and configuration variables revealed level-specific associations with ordination structure. At Level-1, ordination was significantly associated with latitude and weakly associated with elevation. At Level-2, Shannon diversity was significantly associated with ordination structure, while no topographic or configurational variables showed detectable associations. At Level-3, weak associations were observed for aspect (eastness), Shannon diversity, and landscape division index, consistent with partial correspondence between crop-level composition and diversity and configuration metrics. Across levels, fitted variables explained only a limited proportion of multivariate variation. The stronger differentiation among villages at Level-3 is consistent with previous findings that analytical outcomes depend on spatial aggregation [41]. In accordance with previous studies, these findings highlight the role of thematic resolution and spatial aggregation in the detectability of structural differentiation in smallholder-dominated agricultural systems [37,38,39,41].
The comparison with the ESA WorldCover dataset showed moderate agreement with the field mapping (Table 6), but also revealed systematic differences in several landscape metrics (Table 7). In particular, configuration and diversity metrics derived from field mapping differed significantly from those derived from the global dataset. These differences indicate that while coarse-resolution land-cover products capture broad land-use patterns, they may not fully represent the fine-grain heterogeneity of agricultural landscapes. Similar limitations of global land-cover datasets and challenges in representing small agricultural fields have been documented in previous studies [57,58]. Based on these findings, we recommend conducting an in-depth study on this topic covering other agricultural landscapes in the Western Balkans.

5.2. Limitations and Implications

This study is descriptive and focuses on the structural characterization of agricultural land use based on fine-grain, field-mapped data. It does not assess causal mechanisms, temporal change, or direct biodiversity responses. The analysis used a fixed spatial grain of 1 km2 plots, defined a priori as the sampling unit for parcel mapping across sites. This grain provided a consistent spatial unit for comparing landscape structure while remaining feasible for detailed field surveys. Landscape metrics are known to be sensitive to spatial grain and extent [39,59]. The sensitivity of structural patterns to alternative spatial grains was not evaluated; therefore, configuration and diversity patterns should be interpreted as grain-specific. Although elevation was included as a contextual variable, the relatively narrow altitudinal range limits interpretation of its association with diversity to relative differences among sites rather than a strong environmental gradient.
In addition, potentially relevant factors such as soil properties, irrigation, and input intensity could not be integrated due to the absence of consistent, high-resolution data at the site level. Previous research indicates that Kosovo farms are heterogeneous at the production-function level and can be grouped into at least two clusters with potentially different responses to policy incentives [53]. Such farm-level classifications were not available in the present study. Moreover, broader socio-economic characteristics (e.g., processing infrastructure, aggregation networks, or market integration) are not consistently documented across the municipalities. Integrating these biophysical, management, farm-structural, and socio-economic dimensions would have required additional data harmonization, downscaling, or modeling beyond the scope of this study.
While this study does not quantify biological responses, agricultural composition and configuration describe the structural context within which ecological patterns may be examined in agricultural systems. The fine-grain characterization presented here provides a reference for future studies integrating biological, management, or socio-economic data to examine agricultural land-use dynamics in Kosovo and comparable fragmented smallholder regions, where conventional remote sensing approaches may have limited capacity to resolve fine-grain heterogeneity [40].

Author Contributions

Conceptualization, R.W. and L.K.; methodology, R.W., A.M. and L.K.; formal analysis, L.K.; investigation L.K.; resources, L.K. and R.W.; writing—original draft preparation, L.K.; writing—review and editing, R.W. and A.M. All authors have read and agreed to the published version of the manuscript.

Funding

This research received no external funding.

Data Availability Statement

The original contributions presented in the study are included in the article, and further inquiries can be directed to the corresponding author.

Conflicts of Interest

The authors declare no conflicts of interest.

References

  1. Zhang, W.; Ricketts, T.H.; Kremen, C.; Carney, K.; Swinton, S.M. Ecosystem services and dis-services to agriculture. Ecol. Econ. 2007, 64, 253–260. [Google Scholar] [CrossRef] [Scilit]
  2. United Nations, Department of Economic and Social Affairs, Population Division. World Population Prospects 2024: Summary of Results; UN DESA/POP/2024/TR/NO. 9; United Nations, Department of Economic and Social Affairs, Population Division: New York, NY, USA, 2024; Available online: https://population.un.org/wpp/assets/Files/WPP2024_Summary-of-Results.pdf (accessed on 11 February 2025).
  3. Bommarco, R.; Kleijn, D.; Potts, S.G. Ecological intensification: Harnessing ecosystem services for food security. Trends Ecol. Evol. 2013, 28, 230–238. [Google Scholar] [CrossRef] [Scilit] [PubMed]
  4. Landis, D.A. Designing agricultural landscapes for biodiversity-based ecosystem services. Basic Appl. Ecol. 2017, 18, 1–12. [Google Scholar] [CrossRef] [Scilit]
  5. Tilman, D.; Cassman, K.G.; Matson, P.A.; Naylor, R.; Polasky, S. Agricultural sustainability and intensive production practices. Nature 2002, 418, 671–677. [Google Scholar] [CrossRef] [Scilit]
  6. Tscharntke, T.; Clough, Y.; Wanger, T.C.; Jackson, L.; Motzke, I.; Perfecto, I.; Vandermeer, J.; Whitbread, A. Global food security, biodiversity conservation and the future of agricultural intensification. Biol. Conserv. 2012, 151, 53–59. [Google Scholar] [CrossRef] [Scilit]
  7. Bianchi, F.J.J.A.; Booij, C.J.H.; Tscharntke, T. Sustainable pest regulation in agricultural landscapes: A review on landscape composition, biodiversity and natural pest control. Proc. R. Soc. B Biol. Sci. 2006, 273, 1715–1727. [Google Scholar] [CrossRef] [Scilit]
  8. Hipólito, J.; Boscolo, D.; Viana, B.F. Landscape and crop management strategies to conserve pollination services and increase yields in tropical coffee farms. Agric. Ecosyst. Environ. 2018, 256, 218–225. [Google Scholar] [CrossRef] [Scilit]
  9. Novara, A.; Gristina, L.; Sala, G.; Galati, A.; Crescimanno, M.; Cerdà, A.; Badalamenti, E.; La Mantia, T. Agricultural land abandonment in Mediterranean environment provides ecosystem services via soil carbon sequestration. Sci. Total Environ. 2017, 576, 420–429. [Google Scholar] [CrossRef] [Scilit] [PubMed]
  10. Food and Agriculture Organization of the United Nations. The State of Food and Agriculture 2024; Food and Agriculture Organization of the United Nations: Rome, Italy, 2024. [Google Scholar]
  11. Lee, H.; Calvin, K.; Dasgupta, D.; Krinner, G.; Mukherji, A.; Thorne, P.W.; Trisos, C.; Romero, J.; Aldunce, P.; Barrett, K.; et al. IPCC, 2023: Climate Change 2023: Synthesis Report. Contribution of Working Groups I, II and III to the Sixth Assessment Report of the Intergovernmental Panel on Climate Change; Core Writing Team, Lee, H., Romero, J., Eds.; IPCC: Geneva, Switzerland, 2023. [Google Scholar]
  12. Abson, D.J.; Fraser, E.D.G.; Benton, T.G. Landscape diversity and the resilience of agricultural returns: A portfolio analysis of land-use patterns and economic returns from lowland agriculture. Agric. Food Secur. 2013, 2, 2. [Google Scholar] [CrossRef] [Scilit]
  13. Altieri, M.A. The ecological role of biodiversity in agroecosystems. Agric. Ecosyst. Environ. 1999, 74, 19–31. [Google Scholar] [CrossRef] [Scilit]
  14. Duru, M.; Therond, O.; Martin, G.; Martin-Clouaire, R.; Magne, M.-A.; Justes, E.; Journet, E.-P.; Aubertot, J.-N.; Savary, S.; Bergez, J.-E.; et al. How to implement biodiversity-based agriculture to enhance ecosystem services: A review. Agron. Sustain. Dev. 2015, 35, 1259–1281. [Google Scholar] [CrossRef] [Scilit]
  15. Fischer, J.; Lindenmayer, D.B.; Manning, A.D. Biodiversity, ecosystem function, and resilience: Ten guiding principles for commodity production landscapes. Front. Ecol. Environ. 2006, 4, 80–86. [Google Scholar] [CrossRef] [Scilit]
  16. Di Falco, S.; Perrings, C. Crop biodiversity, risk management and the implications of agricultural assistance. Ecol. Econ. 2005, 55, 459–466. [Google Scholar] [CrossRef] [Scilit]
  17. Gardiner, M.M.; Landis, D.A.; Gratton, C.; DiFonzo, C.D.; O’Neal, M.; Chacon, J.M.; Wayo, M.T.; Schmidt, N.P.; Mueller, E.E.; Heimpel, G.E. Landscape diversity enhances biological control of an introduced crop pest in the north-central USA. Ecol. Appl. 2009, 19, 143–154. [Google Scholar] [CrossRef] [Scilit]
  18. McDaniel, M.D.; Tiemann, L.K.; Grandy, A.S. Does agricultural crop diversity enhance soil microbial biomass and organic matter dynamics? A meta-analysis. Ecol. Appl. 2014, 24, 560–570. [Google Scholar] [CrossRef] [Scilit]
  19. Tiemann, L.K.; Grandy, A.S.; Atkinson, E.E.; Marin-Spiotta, E.; McDaniel, M.D. Crop rotational diversity enhances belowground communities and functions in an agroecosystem. Ecol. Lett. 2015, 18, 761–771. [Google Scholar] [CrossRef] [Scilit]
  20. Schulte, L.A.; Niemi, J.; Helmers, M.J.; Liebman, M.; Arbuckle, J.G.; James, D.E.; Kolka, R.K.; O’Neal, M.E.; Tomer, M.D.; Tyndall, J.C.; et al. Prairie strips improve biodiversity and the delivery of multiple ecosystem services from corn-soybean croplands. Proc. Natl. Acad. Sci. USA 2017, 114, 11247–11252. [Google Scholar] [CrossRef] [Scilit]
  21. Tscharntke, T.; Klein, A.M.; Kruess, A.; Steffan-Dewenter, I.; Thies, C. Landscape perspectives on agricultural intensification and biodiversity—Ecosystem service management. Ecol. Lett. 2005, 8, 857–874. [Google Scholar] [CrossRef] [Scilit]
  22. Kremen, C.; Miles, A. Ecosystem Services in Biologically Diversified versus Conventional Farming Systems: Benefits, Externalities, and Trade-Offs. Ecol. Soc. 2012, 17, 40. [Google Scholar] [CrossRef] [Scilit]
  23. Benton, T.G.; Vickery, J.A.; Wilson, J.D. Farmland biodiversity: Is habitat heterogeneity the key? Trends Ecol. Evol. 2003, 18, 182–188. [Google Scholar] [CrossRef] [Scilit]
  24. Billeter, R.; Liira, J.; Bailey, D.; Bugter, R.; Arens, P.; Augenstein, I.; Aviron, S.; Baudry, J.; Bukacek, R.; Burel, F.; et al. Indicators for biodiversity in agricultural landscapes: A pan-European study. J. Appl. Ecol. 2008, 45, 141–150. [Google Scholar] [CrossRef] [Scilit]
  25. Botequilha Leitão, A.; Ahern, J. Applying landscape ecological concepts and metrics in sustainable landscape planning. Landsc. Urban Plan. 2002, 59, 65–93. [Google Scholar] [CrossRef] [Scilit]
  26. Fahrig, L.; Baudry, J.; Brotons, L.; Burel, F.G.; Crist, T.O.; Fuller, R.J.; Sirami, C.; Siriwardena, G.M.; Martin, J.-L. Functional landscape heterogeneity and animal biodiversity in agricultural landscapes. Ecol. Lett. 2011, 14, 101–112. [Google Scholar] [CrossRef] [Scilit]
  27. Gonzalez, A.; Germain, R.M.; Srivastava, D.S.; Filotas, E.; Dee, L.E.; Gravel, D.; Thompson, P.L.; Isbell, F.; Wang, S.; Kéfi, S.; et al. Scaling-up biodiversity-ecosystem functioning research. Ecol. Lett. 2020, 23, 757–776. [Google Scholar] [CrossRef] [Scilit] [PubMed]
  28. Simmering, D.; Waldhardt, R.; Otte, A. Quantifying determinants contributing to plant species richness in mosaic landscapes: A single- and multi-patch perspective. Landsc. Ecol 2006, 21, 1233–1251. [Google Scholar] [CrossRef] [Scilit]
  29. Chiaffarelli, G.; Vagge, I. Biodiversity in Agricultural Landscapes: Inter-Scale Patterns in the Po Plain (Italy). Diversity 2025, 17, 418. [Google Scholar] [CrossRef] [Scilit]
  30. Vagge, I.; Sgalippa, N.; Chiaffarelli, G. Agricultural Landscapes: A Pattern-Process-Design Approach to Enhance Their Ecological Quality and Ecosystem Services through Agroforestry. Diversity 2024, 16, 431. [Google Scholar] [CrossRef] [Scilit]
  31. Hurtt, G.C.; Chini, L.; Sahajpal, R.; Frolking, S.; Bodirsky, B.L.; Calvin, K.; Doelman, J.C.; Fisk, J.; Fujimori, S.; Klein Goldewijk, K.; et al. Harmonization of global land use change and management for the period 850–2100 (LUH2) for CMIP6. Geosci. Model Dev. 2020, 13, 5425–5464. [Google Scholar] [CrossRef] [Scilit]
  32. Hudson, L.N.; Newbold, T.; Contu, S.; Hill, S.L.L.; Lysenko, I.; de Palma, A.; Phillips, H.R.P.; Senior, R.A.; Bennett, D.J.; Booth, H.; et al. The PREDICTS database: A global database of how local terrestrial biodiversity responds to human impacts. Ecol. Evol. 2014, 4, 4701–4735. [Google Scholar] [CrossRef] [Scilit]
  33. BirdLife International. Ecosystem Profile: Mediterranean Basin Biodiversity Hotspot; BirdLife International: Cambridge, UK, 2017; Available online: https://www.cepf.net/sites/default/files/mediterranean-basin-2017-ecosystem-profile-english_0.pdf (accessed on 3 July 2025).
  34. Mehmeti, A.; Demaj, A.; Waldhardt, R. Plant species richness and composition in the arable land of Kosovo. Landsc. Online 2009, 11, 1–29. [Google Scholar] [CrossRef] [Scilit]
  35. Bytyqi, V.; Agaj, T.; Ramadani, I. Spatiotemporal Change Analysis of Land Cover on Soil Resources in Kosova Plain. Pol. J. Environ. Stud. 2024, 33, 3091–3104. [Google Scholar] [CrossRef] [Scilit]
  36. Bytyqi, V.; Qevani, S.; Agaj, T. Quantifying and visualizing land cover changes. An analysis from the Hasi Region (Kosovo). Folia Geogr. 2024, 66, 50–68. [Google Scholar]
  37. Bailey, D.; Herzog, F.; Augenstein, I.; Aviron, S.; Billeter, R.; Szerencsits, E.; Baudry, J. Thematic resolution matters: Indicators of landscape pattern for European agro-ecosystems. Ecol. Indic. 2007, 7, 692–709. [Google Scholar] [CrossRef] [Scilit]
  38. Buyantuyev, A.; Wu, J. Effects of thematic resolution on landscape pattern analysis. Landsc. Ecol. 2007, 22, 7–13. [Google Scholar] [CrossRef] [Scilit]
  39. Lechner, A.M.; Rhodes, J.R. Recent Progress on Spatial and Thematic Resolution in Landscape Ecology. Curr. Landsc. Ecol. Rep. 2016, 1, 98–105. [Google Scholar] [CrossRef] [Scilit]
  40. Crespin-Boucaud, A.; Lebourgeois, V.; Lo Seen, D.; Castets, M.; Bégué, A. Agriculturally consistent mapping of smallholder farming systems using remote sensing and spatial modelling. Int. Symp. Remote Sens. Environ. 2020, 42, 35–42. [Google Scholar] [CrossRef] [Scilit]
  41. Ndao, B.; Leroux, L.; Gaetano, R.; Diouf, A.A.; Soti, V.; Bégué, A.; Mbow, C.; Sambou, B. Landscape heterogeneity analysis using geospatial techniques and a priori knowledge in Sahelian agroforestry systems of Senegal. Ecol. Indic. 2021, 125, 107481. [Google Scholar] [CrossRef] [Scilit]
  42. Ministry of Agriculture, Forestry and Rural Development. Horticultural Strategy of Kosovo 2009–2013; Ministry of Agriculture, Forestry and Rural Development: Pristina, Kosovo, 2013. [Google Scholar]
  43. Ministry of Environment, Spatial Planning and Infrastructure. Review of the State Water Strategy 2023–2027 and Action Plan 2023–2025; Ministry of Environment, Spatial Planning and Infrastructure: Pristina, Kosovo, 2023. Available online: https://mmphi.rks-gov.net/MMPHIFolder/OtherDocuments/REVIEW%20OF%20THE%20STATE%20WATER%20STRATEGY%202023%20-%202027%20AND%20ACTION%20PLAN%202023%20-%202025_ENG%20(1).pdf (accessed on 20 February 2025).
  44. Water and Waste Water Works Association Kosovo. Detailed Analysis of the State of Play and the Framework for Addressing Drought Management in Kosovo; Water and Waste Water Works Association Kosovo: Pristina, Kosovo, 2023; Available online: https://www.gwp.org/globalassets/documents/state-of-the-art-analysis_act.-1.1.pdf (accessed on 20 February 2025).
  45. World Bank. Water Security Outlook for Kosovo; World Bank: Washington, DC, USA, 2018; Available online: https://documents1.worldbank.org/curated/en/496071548849630510/Water-Security-Outlook-for-Kosovo.pdf (accessed on 20 February 2025).
  46. Berisha, N.; Krasniqi, E.; Bytyqi, V. Biogeographical regionalization of Kosovo: Integrating vegetation, climate and topography. Mediterr. Bot. 2025, 46, e99744. [Google Scholar] [CrossRef] [Scilit]
  47. Ministry of Agriculture, Forestry and Rural Development. Strategy for Agriculture and Rural Development 2022–2028; Ministry of Agriculture, Forestry and Rural Development: Pristina, Kosovo, 2021. Available online: https://kryeministri.rks-gov.net/wp-content/uploads/2023/01/STRATEGJIA-2022-2028-FINAL-ENG-Web-Noprint-final-PDF.pdf (accessed on 18 August 2024).
  48. Kosovo Agency of Statistics. Economic Accounts for Agriculture, 2023 (Series 2: Agriculture and Environment Statistics); Kosovo Agency of Statistics: Pristina, Kosovo, 2024. Available online: https://askapi.rks-gov.net/Custom/ff27dfe0-765a-4c12-af5a-8e4705fe2448.pdf (accessed on 14 January 2025).
  49. European Commission. EU Agricultural Outlook for Markets 2023–2035; European Commission: Brussels, Belgium, 2023; Available online: https://agriculture.ec.europa.eu/system/files/2024-01/agricultural-outlook-2023-report_en_0.pdf (accessed on 14 January 2025).
  50. Ministry of Agriculture, Forestry and Rural Development. Kosovo Green Report 2023; Ministry of Agriculture, Forestry and Rural Development: Pristina, Kosovo, 2023. Available online: https://mbpzhr.rks-gov.net/wp-content/uploads/2025/10/Green_Report_2023.pdf (accessed on 14 January 2025).
  51. Arbenz, M.; Mehmeti, A.; Richter, T.; Demelezi, I.; Cikaqi, I.; Avdiu, V. National Organic Action Plan of Kosovo 2023–2026; Ministry of Agriculture, Forestry and Rural Development: Prishtina, Kosovo, 2023. Available online: https://mbpzhr.rks-gov.net/wp-content/uploads/2026/02/Plani-per-Bujqesi-Organike-i-Republikes-se-Kosoves-2023-2026.pdf (accessed on 18 August 2024). (In Albanian)
  52. Willer, H.; Trávníček, J.; Schlatter, B. (Eds.) The World of Organic Agriculture: Statistics and Emerging Trends 2024; Research Institute of Organic Agriculture (FiBL): Frick, Switzerland; IFOAM-Organics International: Bonn, Germany, 2024. [Google Scholar]
  53. Kostov, P.; Davidova, S. Smallholders Are Not the Same: Under the Hood of Kosovo Agriculture. Land 2023, 12, 146. [Google Scholar] [CrossRef] [Scilit]
  54. Kosovo Agency of Statistics. ASKdata; Kosovo Agency of Statistics: Pristina, Kosovo; Available online: https://askdata.rks-gov.net/pxweb/en/ASKdata (accessed on 25 February 2025).
  55. Ministry of Agriculture Forestry and Rural Development. Kosovo Viticulture and Winery; Ministry of Agriculture Forestry and Rural Development: Prishtina, Kosovo, 2023. [Google Scholar]
  56. Giencke, S.; Selimi, F. A Vision for Fruit and Vegetable Marketing Channels in Kosovo; Intercooperation: Horticultural Promotion Kosovo (HPK): Pristina, Kosovo, 2010. [Google Scholar]
  57. Xu, P.; Tsendbazar, N.-E.; Herold, M.; de Bruin, S.; Koopmans, M.; Birch, T.; Carter, S.; Fritz, S.; Lesiv, M.; Mazur, E.; et al. Comparative validation of recent 10 m-resolution global land cover maps. Remote Sens. Environ. 2024, 311, 114316. [Google Scholar] [CrossRef] [Scilit]
  58. Lesiv, M.; Laso Bayas, J.C.; See, L.; Duerauer, M.; Dahlia, D.; Durando, N.; Hazarika, R.; Kumar Sahariah, P.; Vakolyuk, M.; Blyshchyk, V.; et al. Estimating the global distribution of field size using crowdsourcing. Glob. Change Biol. 2019, 25, 174–186. [Google Scholar] [CrossRef] [Scilit] [PubMed]
  59. Wu, J. Effects of changing scale on landscape pattern analysis: Scaling relations. Landsc. Ecol. 2004, 19, 125–138. [Google Scholar] [CrossRef] [Scilit]
Figure 1. Agricultural landscapes in Kosovo’s two main plains. (ac) Dukagjini Plain: Kovragë (mixed cropping), Fortesë (vegetables), and Pataçan (vineyards). (d,e) Kosova Plain: Tërpezë (cereals) and Pestovë (potatoes).
Land 15 00465 g001
Figure 2. Agricultural land use maps (Levels 1–3) (ac) Dukagjini Plain: Kovragë, Fortesë, and Pataçan. (d,e) Kosova Plain: Tërpezë and Pestovë, illustrating increasing thematic detail from broad land-use categories to crop-level classes, based on field mapping and subsequent digitization.
Land 15 00465 g002
Figure 3. Proportional land-use composition (%) across municipalities and plains at Level-1–3.
Land 15 00465 g003
Figure 4. Elevation–diversity relationships at Level-2 (GAM; left) and Level-3 (linear; right). Points represent the 48 sites; lines show fitted relationships and shaded areas show 95% CI.
Land 15 00465 g004
Figure 5. NMDS ordination of Level-1 classification. Black vectors represent compositional variables, and red vectors represent fitted variables (p < 0.10); points represent sites grouped by municipality.
Land 15 00465 g005
Figure 6. NMDS ordination of Level-2 classification. Black vectors represent compositional variables, and red vectors represent fitted variables (p < 0.10); points represent sites grouped by municipality.
Land 15 00465 g006
Figure 7. NMDS ordination of Level-3 classification. Black vectors represent the ten strongest composition variables, and red vectors represent fitted variables (p < 0.10); points represent sites grouped by municipality.
Land 15 00465 g007
Table 1. UAA in 2023 in Kosovo.
UAA 4207 km2% % % (t/ha)
Meadows and pastures Communal land65.0
51.6Meadows32.6
Pastures2.4
Arable land44.8Cereal66.2Wheat64.2 (3.8)
Corn32.0 (4.1)
Other cereals 3.8
Forage19.9Alfalfa48.8 (4.5)
Grass Mixture24.8 (3.0)
Other forage26.4
Vegetables4.9Peppers31.0 (16.9)
Onions13.6 (13.7)
Watermelon12.8 (19.6)
Cabbage9.2 (27.0)
Tomatoes7.7 (24.8)
Other vegetables25.6
Potatoes2.1 (19.3)
Beans1.5 (1.8)
Pumpkin1.4 (8.5)
Other crops0.7
Fallow land3.3
Gardens0.3
Perennial crops3.4Fruit trees2.5Apples29.3 (12.8)
Plums21.0 (5.2)
Walnuts16.3 (3.6)
Raspberries15.2 (3.6)
Other18.2
Vineyards0.8
Nurseries0.03
Table 2. Elevation and slope characteristics (mean ± SD) across municipalities and plains.
Mean ElevationElevation RangeMean Slope
Istog484 ± 31 b29 ± 111.80 ± 0.79 b
Rahovec379 ± 51 c54 ± 354.31 ± 2.86 a
Viti516 ± 34 ab52 ± 492.90 ± 2.82 ab
Vushtrri548 ± 30 a51 ± 263.57 ± 2.00 ab
Dukagjini Plain432 ± 68 b41 ± 283.05 ± 2.42
Kosova Plain532 ± 35 a52 ± 383.23 ± 2.41
Note: Different letters indicate significant differences (p < 0.05).
Table 3. Shannon diversity index across municipalities and plains (mean ± SD).
Municipality/PlainSHDI-1SHDI-2SHDI-3
Istog0.335 ± 0.1240.925 ± 0.3471.293 ± 0.284 a
Rahovec0.365 ± 0.1930.979 ± 0.4341.743 ± 0.314 b
Viti0.225 ± 0.1180.849 ± 0.1321.313 ± 0.189 a
Vushtrri0.341 ± 0.1310.871 ± 0.1761.494 ± 0.172 ab
Dukagjini Plain0.350 ± 0.1590.952 ± 0.3861.518 ± 0.372
Kosova Plain0.283 ± 0.1360.860 ± 0.1521.403 ± 0.199
Note: Different letters indicate significant differences (p < 0.05).
Table 4. Mean patch area (m2 ± SD) across classification levels.
CropsIstogRahovecVitiVushtrriDukagjini PlainKosova Plain
Level-1Ab. land4977 ± 81194602 ± 10,3393396 ± 66633410 ± 59774794 ± 92633405 ± 6232
Agriculture8234 ± 19,2164636 ± 64514341 ± 54944091 ± 46296266 ± 13,9014220 ± 5094
Forest22,168 ± 41,39325,057 ± 40,93536,657 ± 56,34513,030 ± 34,29723,525 ± 41,04717,934 ± 40,393
Other8113 ± 74796688 ± 53968244 ± 99196529 ± 92747662 ± 68747141 ± 9486
Settlement4046 ± 55374063 ± 61253701 ± 50823364 ± 56294052 ± 57163497 ± 5419
Overall Mean7697 ± 18,1685163 ± 10,1664386 ± 68824086 ± 65636397 ± 14,6744230 ± 6720
Level-2Crops15,202 ± 32,6694281 ± 43824422 ± 48834631 ± 50837183 ± 17,9044522 ± 4980
Grasslands5201 ± 47383936 ± 37314156 ± 65293210 ± 34604861 ± 45233694 ± 5281
Greenhouses1100 ± 16391737 ± 1669535 ± 317568 ± 4271429 ± 1657563 ± 404
Open land4082 ± 33144142 ± 40522064 ± 14602742 ± 21604110 ± 36652430 ± 1890
Orchards5024 ± 58422519 ± 19645203 ± 73611819 ± 16424905 ± 57413563 ± 5630
Shrubs5412 ± 96024796 ± 12,0493688 ± 72993504 ± 63295105 ± 10,8833569 ± 6680
Vineyards27,206 ± 41,4977476 ± 13,409 7708 ± 13,9920 ± 0
Overall Mean7673 ± 17,8454631 ± 71254267 ± 55984000 ± 48356038 ± 13,2964134 ± 5231
Level-3Apple5118 ± 57395296 ± 03659 ± 34331475 ± 11135118 ± 57302749 ± 2891
Corn13,142 ± 24,5764170 ± 44654676 ± 59674513 ± 42596906 ± 14,6284598 ± 5224
MAPs25,466 ± 34,0536045 ± 4068 2589 ± 021,707 ± 31,5482589 ± 0
Onions 3141 ± 2803499 ± 2671474 ± 12553141 ± 28031021 ± 1046
Other Crops6969 ± 48913268 ± 24054010 ± 36111287 ± 14323485 ± 27192608 ± 3008
Pepper1249 ± 13894444 ± 44481020 ± 8021032 ± 9154411 ± 44391025 ± 810
Potato1015 ± 7313155 ± 24771220 ± 24114803 ± 61202665 ± 23774467 ± 5962
Pumpkins 4202 ± 43994194 ± 29574086 ± 29644202 ± 43994130 ± 2936
Wheat14,683 ± 37,0714886 ± 50594460 ± 43234859 ± 53838665 ± 23,8164625 ± 4794
Note: Blank cells indicate crop types absent from sampled sites in the respective municipality. Level-3 land-use categories (≥1%).
Table 5. Configuration metrics (mean ± SD) across municipalities and plains at Level-1–3.
Level-1Level-2Level-3
PDEDLPIPDEDLPIPDEDLPI
Istog20.8 ± 11.637.2 ± 23.024.2 ± 10.038.1 ± 27.3 a68.3 ± 44.618.0 ± 11.442.4 ± 29.4 a75.1 ± 44.2 a15.5 ± 8.9
Rahovec26.5 ± 5.541.6 ± 17.220.1 ± 11.748.6 ± 13.3 ab83.1 ± 30.511.5 ± 3.490.1 ± 31.7 bc148.0 ± 50.9 b6.6 ± 3.7
Viti24.1 ± 10.132.1 ± 16.629.9 ± 12.949.5 ± 13.1 ab94.4 ± 29.719.2 ± 8.170.2 ± 10.3 b145.0 ± 40.9 b11.6 ± 5.2
Vushtrri37.3 ± 12.541.1 ± 18.220.4 ± 12.767.9 ± 21.9 b94.8 ± 31.313.3 ± 6.695.4 ± 26.4 c146.5 ± 36.5 b6.7 ± 2.7
Dukagjini Plain23.7 ± 9.439.4 ± 20.022.2 ± 10.943.3 ± 21.775.7 ± 38.114.7 ± 8.966.2 ± 38.6111.6 ± 59.611.1 ± 8.1
Kosova Plain30.7 ± 13.036.6 ± 17.725.1 ± 13.558.7 ± 20.094.6 ± 29.816.2 ± 7.882.8 ± 23.5145.7 ± 37.99.2 ± 4.7
Note: PD = Patch Density, ED = Edge Density; LPI = Largest Patch Index. Different letters indicate significant differences (p < 0.05).
Table 6. Accuracy assessment of the WorldCover dataset relative to field mapping.
Overall Accuracy (OA)Observed Agreement (Po)Expected Agreement (Pe)Kappa (κ)
0.660.660.440.39
Class-specific AccuracyTree CoverShrublandGrasslandCroplandBuilt-Up
Producer accuracy (PA)0.620.880.380.730.77
User accuracy (UA)0.7960.0010.3360.8920.231
OA (Spatial Grouping)IstogRahovecVitiVushtrriDukagjini PlainKosova Plain
Mean ± SD0.61 ± 0.190.68 ± 0.180.68 ± 0.090.66 ± 0.090.65 ± 0.190.67 ± 0.09
Table 7. Comparison of landscape metrics derived from field mapping and the ESA WorldCover dataset across municipalities and plains.
Landscape MetricField MappingWorldCoverSignificance
IstogPD65.940 ± 50.50095.550 ± 37.710*
ED98.520 ± 57.460128.670 ± 58.430*
LPI47.150 ± 23.67057.260 ± 24.870
SHDI0.736 ± 0.2450.537 ± 0.168***
RahovecPD56.860 ± 35.86089.540 ± 60.650**
ED94.440 ± 53.37090.750 ± 60.360
LPI56.000 ± 25.07070.550 ± 22.480*
SHDI0.584 ± 0.3040.423 ± 0.267***
VitiPD82.730 ± 52.38067.360 ± 22.740
ED128.350 ± 51.21069.850 ± 29.240***
LPI46.880 ± 20.48083.710 ± 19.120***
SHDI0.747 ± 0.1230.339 ± 0.162***
VushtrriPD119.520 ± 47.11091.500 ± 39.870*
ED135.670 ± 48.90082.270 ± 39.410***
LPI34.030 ± 21.36073.410 ± 20.060***
SHDI0.781 ± 0.1940.408 ± 0.194***
Dukagjini PlainPD61.400 ± 43.09092.540 ± 49.490***
ED96.480 ± 54.280109.710 ± 61.240
LPI51.570 ± 24.27063.910 ± 24.160**
SHDI0.660 ± 0.2810.480 ± 0.226***
Kosova PlainPD101.130 ± 52.22079.430 ± 34.050**
ED132.010 ± 49.11076.060 ± 34.520***
LPI40.460 ± 21.49078.560 ± 19.870***
SHDI0.764 ± 0.1600.373 ± 0.178***
Note: PD = Patch Density, ED = Edge Density; LPI = Largest Patch Index; Shannon’s Diversity Index. Significance refers to pairwise comparisons between field mapping and WorldCover (* p < 0.05, ** p < 0.01, *** p < 0.001).
Disclaimer/Publisher’s Note: The statements, opinions and data contained in all publications are solely those of the individual author(s) and contributor(s) and not of MDPI and/or the editor(s). MDPI and/or the editor(s) disclaim responsibility for any injury to people or property resulting from any ideas, methods, instructions or products referred to in the content.