Article

Analysis of Influencing Factors of Ecosystem Service Value Based on Machine Learning—Evidence from the Huaihe River Ecological Economic Belt, China


School of Geography and Planning, Sun Yat-sen University, Guangzhou 510006, China
*
Authors to whom correspondence should be addressed.
These authors contributed equally to this work.
Land 2026, 15(3), 466; https://doi.org/10.3390/land15030466
Submission received: 4 February 2026 / Revised: 11 March 2026 / Accepted: 12 March 2026 / Published: 14 March 2026

Abstract

By integrating multi-source data, this study systematically analyzes the evolution of land use structure, spatiotemporal differentiation characteristics of Ecosystem Service Value (ESV), and core driving mechanisms in the Huaihe River Ecological Economic Belt (HREEB) in eastern China from 2000 to 2020, based on the ESV equivalent accounting model and XGBoost-SHAP coupled framework. The main results are as follows: (1) The land use structure is dominated by cropland, construction land, and forest land. Over the 20-year period, cropland was continuously converted out, primarily transforming into construction land and forest land, while other land types remained relatively stable. (2) Temporally, the total ESV showed a fluctuating downward trend, first increasing and then decreasing from 2000 to 2020. Spatially, the ESV exhibited a corridor effect of “decreasing from the river channel center to both banks”. High-value areas were concentrated in the eastern river–sea linkage zone and the central-western inland rising zone, while extremely low-value areas in 2020 were located in the northern Huaihai Economic Zone (with dense construction land), indicating an overall medium service level. (3) The evolution of ESV was driven by both natural and human factors: among natural factors, water coverage, elevation, and slope had positive effects, while high temperature had an inhibitory effect; among human–economic factors, population density showed an “increase first and then decrease” effect, and urban expansion significantly weakened ESV in the later period. The spatial differentiation presented a pattern of “natural background support in the upper reaches and socioeconomic intervention in the lower reaches”. This study provides a scientific basis for the optimization of territorial space and ecological protection and restoration in the Huaihe River Ecological Economic Belt, and also offers a replicable research paradigm for ecosystem service management in similar river basin-type regions.

1. Introduction

Against the backdrop of accelerated global urbanization and industrialization, land use transitions and changes in human activity intensity directly trigger profound reshaping of ecosystem structure and functions [1]. Consequently, Ecosystem Service Value (ESV) exhibits significant spatiotemporal heterogeneity, emerging as a core research topic in geography and ecology [2,3,4,5,6,7]. As a key link connecting natural ecosystems and human socio-economic systems, the dynamic evolution of ESV is directly related to regional sustainable development. Land use change serves as the core carrier driving this evolution; conversions between different land use types (e.g., cropland encroachment by construction land, protection of forests) directly alter ecosystem services. Thus, analyzing the evolutionary laws of ESV must take land use change as the core entry point [8]. Over the past two decades, China’s rapid economic development has led to a sustained expansion in demand for land resources, often ignoring the ecological carrying capacity. This has resulted in drastic changes in land use patterns, further exacerbating the spatiotemporal heterogeneity of ESV [9,10,11,12]. Therefore, clarifying the impact paths of land use change on ESV has become a critical scientific issue.
Research on the link between land use change and ecosystems has yielded rich results globally. Early studies primarily revealed the eco-environmental effects of land use transition during urbanization, focusing on the encroachment of croplands and wetlands by urban expansion, and its coupling relationship with regional carbon cycles and biodiversity [13,14,15]. Similarly, research in developing countries has explored the correlation mechanism between unordered land use expansion and ecological degradation at the river basin scale [16]. In China’s context, relevant studies have mostly focused on typical urban agglomerations and ecologically fragile areas, confirming that population growth, economic development, and policy regulation are the core drivers of land use change [17,18,19]. However, for special cross-provincial regions like the Huaihe River Ecological Economic Belt (HREEB)—characterized by both agricultural main producing areas and energy bases—systematic analysis of the multi-scale driving mechanisms of land use change and their nonlinear correlation with ESV remains insufficient [20].
The quantification of ESV and analysis of its driving mechanisms are crucial for linking natural and socio-economic systems. Since Costanza et al. [21] proposed the global ESV assessment framework, relevant research has gradually shifted from single-value accounting to multi-dimensional driving factor analysis, universally confirming that the synergistic effect of natural environments (topography, climate) and human activity intensity (land use, industrial structure) is the core logic behind the spatiotemporal heterogeneity of ESV [22]. For instance, studies in the Amazon Basin of South America have revealed the weakening effect of deforestation and agricultural expansion on ecological regulation services [23], while research in Europe has emphasized the differentiated impacts of climate change and land use intensity on ecosystem supply services [24].
Domestic studies, based on the Chinese terrestrial Ecosystem Service Value equivalent table proposed by Xie Gaodi et al. [25], have gradually formed a research paradigm of “value accounting—spatiotemporal evolution—driving factor analysis.” Research scales cover multiple levels including national, provincial, urban agglomeration, and river basin [26,27,28]. In terms of driving factor analysis methods, geographical detectors and Geographically Weighted Regression (GWR) are widely used, confirming that population density, urbanization level, and human activity intensity are key drivers of ESV changes, with significant two-factor enhancement or nonlinear enhancement effects among various factors [28,29,30,31]. However, despite these advancements, critical gaps remain in the current literature, particularly regarding the methodological depth and regional applicability of existing assessments: (1) Limitations in capturing complex nonlinear dynamics: Traditional spatial econometric models (e.g., OLS, GWR) typically assume linear or simple nonlinear relationships between driving factors and ESV [32,33]. They often struggle to identify the complex “tipping points” or threshold effects inherent in ecological systems—such as the sudden decline in ESV once population density exceeds a specific carrying capacity. (2) Insufficient interpretation of multi-dimensional interactions: While methods like Geographical Detectors can identify factor interactions, they lack the ability to visualize how these interactions vary spatially across a large-scale, cross-provincial river basin like the HREEB, which is characterized by significant heterogeneity in natural background and economic development [20]. (3) Methodological justification for machine learning: Although machine learning has been applied in some ecological studies [34,35,36,37], its application in river basin-type regions remains limited. More importantly, the necessity of adopting a gradient boosting framework (XGBoost) over traditional approaches lies in its superior ability to process high-dimensional data and fit complex nonlinear curves without pre-assuming functional forms. Furthermore, by integrating SHAP (SHapley Additive exPlanations), the model transcends the “black box” limitation, providing interpretable insights into how specific variable thresholds positively or negatively influence ESV, which standard regression coefficients cannot reveal.
Consequently, a systematic analysis that integrates multi-source data to decode the nonlinear driving mechanisms in the HREEB is urgently needed [38]. To address these gaps, this study formulates the following research questions: (1) How has the land use structure and ESV in the HREEB evolved spatiotemporally from 2000 to 2020? (2) What are the core driving factors of ESV differentiation, and how do natural and human–economic factors interact? (3) How do these factors nonlinearly influence ESV, and what are the critical thresholds for their positive or negative effects?
Correspondingly, the objectives of this study are: (1) To quantitatively assess the spatiotemporal evolution characteristics of land use and ESV in the HREEB based on the equivalent factor method; (2) to construct an XGBoost–SHAP coupled framework to identify the relative importance of driving factors and visualize their spatial differentiation; and (3) to reveal the nonlinear response mechanisms and marginal effects of key factors (e.g., population density, urban expansion) on ESV, providing a scientific basis for zoned territorial space optimization and ecological restoration policy formulation.

2. Data Sources and Research Methods

2.1. Study Area Overview

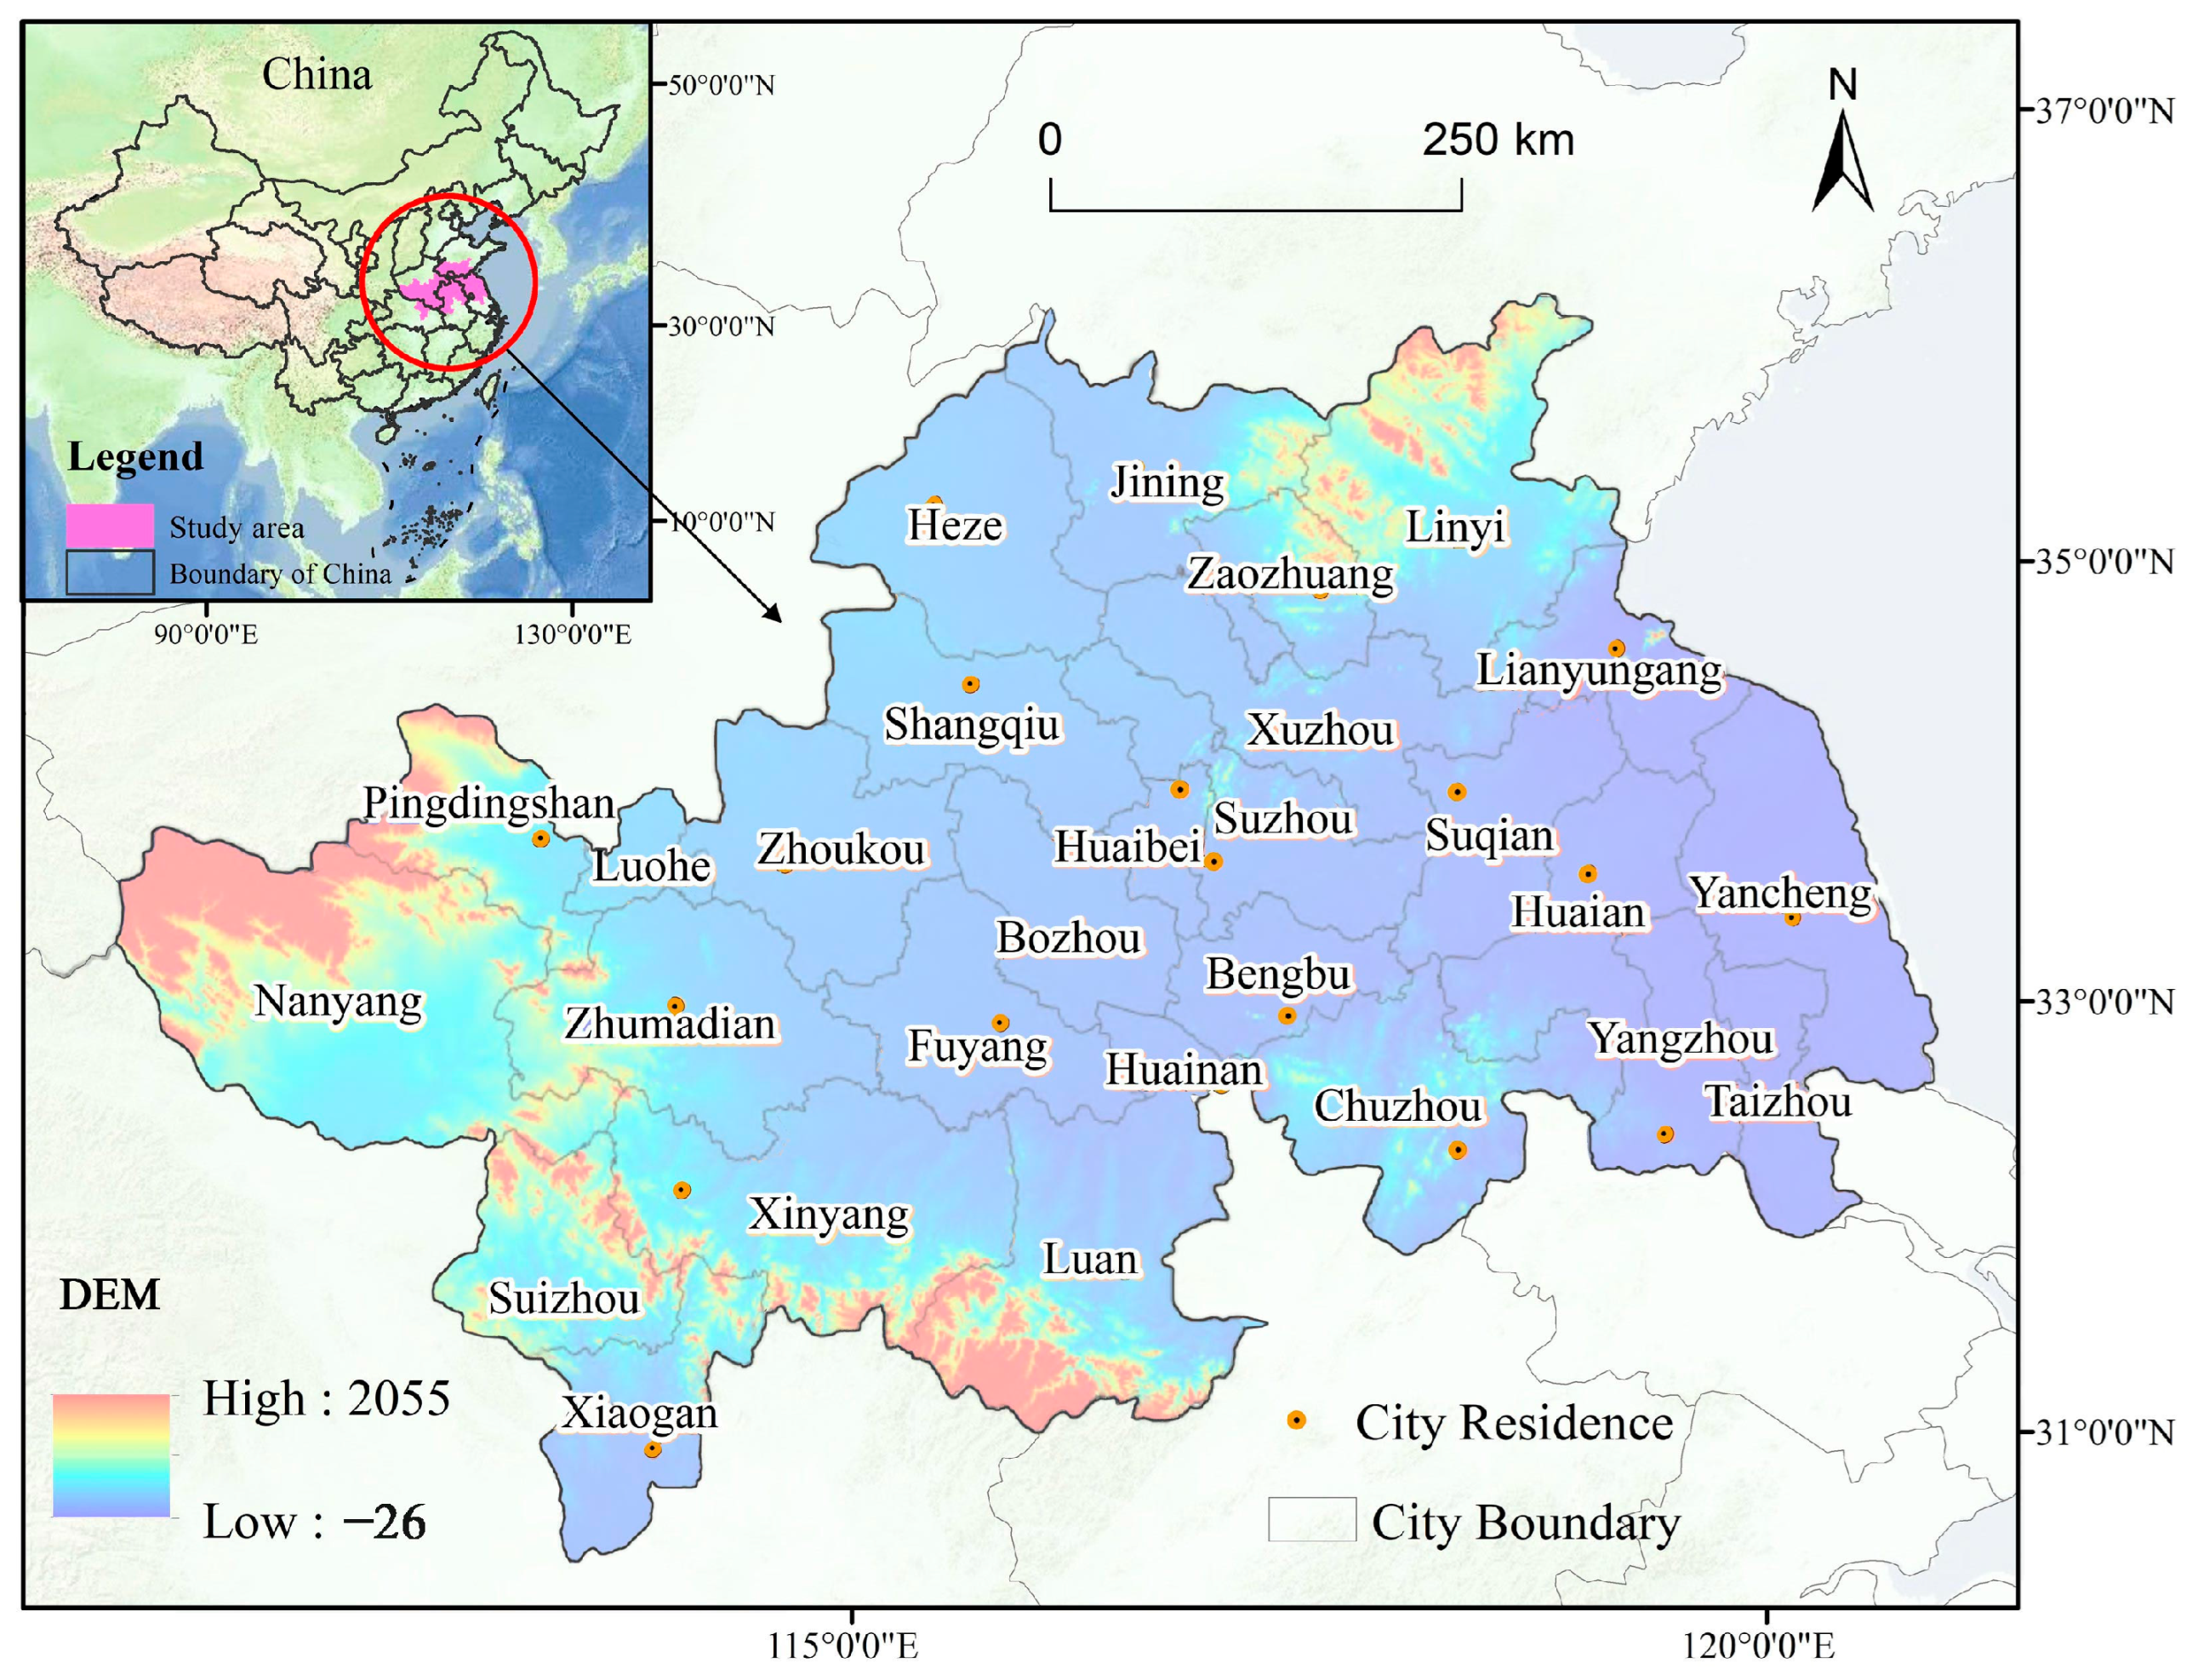
The Huaihe River Ecological Economic Belt (HREEB) is located in the central-eastern region of China (112°20′ E–120°32′ E, 30°93′ N–36°13′ N), encompassing 28 cities across five provinces: Huai’an, Yancheng, Suqian, Xuzhou, Lianyungang, Yangzhou, and Taizhou in Jiangsu Province; Zaozhuang, Jining, Linyi, and Heze in Shandong Province; Bengbu, Huainan, Fuyang, Lu’an, Bozhou, Suzhou, Huaibei, and Chuzhou in Anhui Province; Xinyang, Zhumadian, Zhoukou, Luohe, Shangqiu, Pingdingshan, and Nanyang in Henan Province; and Suizhou, Guangshui, and Xiaogan in Hubei Province.
The planning scope of the HREEB covers areas traversed by the main stream of the Huaihe River, its first-level tributaries, and the Yishu–Sishui river system in the lower reaches, with a total area of 243,000 km2. By the end of 2018, it had a permanent population of 146 million and a regional gross domestic product (GDP) of 6.75 trillion yuan. Based on the “One Belt, Three Regions, Four Axes, and Multiple Growth Points” spatial pattern proposed in the Huaihe River Ecological Economic Belt Development Plan, this study selects 28 cities involved in three sub-regions—the eastern river–sea linkage region, the northern Huaihai Economic Zone, and the central-western inland rising region—as the case study area (Figure 1). The “city residence” represents the municipal administrative centers, specifically denoting the geographic locations of the local municipal governments for these 28 cities.
Included in China’s national development strategy in 2018, the HREEB spans eastern, central, and western China, integrating the particularity of river basin ecosystems with the complexity of economic development [39]. As a national key agricultural product production base, energy hub, and ecological security barrier, it undertakes multiple strategic missions: ensuring food security, maintaining river basin ecological balance, and promoting coordinated regional development. However, the region has long relied on an industrialization-driven development model. While achieving phased economic achievements, it also faces prominent challenges such as ecological degradation, insufficient human capital, and economic backwardness, becoming a typical epitome of the unsustainability of traditional growth models in underdeveloped areas.
In recent years, with the in-depth implementation of the new urbanization strategy and accelerated regional economic integration, problems such as cropland occupation, water resource pollution, and wetland degradation have become more acute. The contradiction between ecological protection and economic growth has intensified, leading to the complex spatiotemporal evolution of Ecosystem Service Value (ESV). There is an urgent need to systematically analyze its driving mechanisms and impact paths. How to break away from the single economic growth orientation and achieve comprehensive high-quality development has become a core challenge for the HREEB. Its development experience will also provide important references for similar river basin-type regions in China.

2.2. Data Sources

This study takes the Huaihe River Ecological Economic Belt (HREEB) as the research area, with data covering four categories: basic geographical data, land use data, natural environment data, and socioeconomic data. All spatial data were unified to the WGS_1984 coordinate system, and data preprocessing and integration were completed using tools such as ArcGIS 10.8, ENVI 5.3, and Python 3.9.1 to ensure the spatiotemporal consistency and accuracy of the data. Specifically, to eliminate the potential deformation error caused by map projection in large-scale regional studies, the Geodesic algorithm was employed for all area-based calculations. This method calculates the area directly on the ellipsoid surface, ensuring the precision of statistical results. Specific data sources and processing are detailed as follows (Table 1):
1
Basic Geographical Data
Administrative boundary vector data of the HREEB were obtained from the 1:1000000 National Fundamental Geographic Database of the National Geomatics Center of China (NGCC). The final research area boundary was determined after verification and revision against the scope defined in the Huaihe River Ecological Economic Belt Development Plan. Digital Elevation Model (DEM) data with a 30 m resolution were derived from the United States Geological Survey (USGS) SRTM dataset. Terrain factor data (e.g., elevation, slope) for the study area were generated through operations including clipping, depression filling, and slope extraction, providing a topographic basis for the spatial differentiation analysis of Ecosystem Service Value (ESV).
2
Land Use Data
Three phases of land use data (2000, 2010, 2020) were acquired from the Resource and Environmental Science Data Center, Chinese Academy of Sciences (RESDC). The original data were interpreted from Landsat series remote sensing images, covering six first-level categories (cropland, forest land, grassland, water body, construction land, unused land) and 25 s-level categories. Field verification showed an overall classification accuracy higher than 85% and a kappa coefficient greater than 0.82, meeting the requirements for ESV accounting. On this basis, land use type transfer matrices and spatial distribution information for each phase were extracted using the spatial analysis tools in ArcGIS 10.8.
3
Natural Environment Data
Climatic data (e.g., annual average temperature, annual precipitation) were obtained from the China Meteorological Data Service Center (CMDC). Annual observation data from 2000 to 2020 were collected from meteorological stations inside and around the study area. After outlier elimination and homogeneity test, 1 km × 1 km raster data were generated using the Kriging interpolation method. Normalized Difference Vegetation Index (NDVI) data were derived from the National Aeronautics and Space Administration (NASA) MODIS product (MOD13Q1) with a 250 m spatial resolution. Annual NDVI data were generated via the Maximum Value Composite (MVC) method and resampled to 1 km. Water coverage data were revised by integrating land use water body data and hydrological monitoring data of the Huaihe River Basin released by the Huaihe River Water Conservancy Commission, Ministry of Water Resources, improving the accuracy of water body spatial boundaries.
4
Socioeconomic Data
Indicators such as population density, per capita GDP, and the proportion of the primary, secondary, and tertiary industries were collected from provincial- and prefectural-level statistical yearbooks (2001–2021), including the China City Statistical Yearbook, Jiangsu Statistical Yearbook, Anhui Statistical Yearbook, Henan Statistical Yearbook, Shandong Statistical Yearbook, and Hubei Statistical Yearbook. Partial refined data were supplemented by the Statistical Communique on National Economic and Social Development issued by local governments. Data for measuring urbanization level were obtained through inversion of the National Oceanic and Atmospheric Administration (NOAA) NPP-VIIRS nighttime light data. Urban expansion data were extracted from the spatial changes of construction land across the three phases (2000, 2010, 2020).

2.3. Indicator System and Research Methods

2.3.1. Construction of the Indicator System for Influencing Factors

The spatiotemporal differentiation of Ecosystem Service Value (ESV) is jointly influenced by multiple types of factors. Existing studies have shown that the evolution of ESV is comprehensively driven by natural factors (e.g., elevation, slope, average temperature, precipitation, Normalized Difference Vegetation Index (NDVI), and water coverage) and human–economic factors (e.g., population density, per capita GDP, proportion of industrial structure, urbanization level, and urban expansion) [28,29,30,31,32,33,34]. This study adopts a combination of qualitative and quantitative methods to explore the driving factors of ESV in the Huaihe River Ecological Economic Belt (HREEB). The specific indicator quantification is detailed as follows (Table 2):

2.3.2. Calculation of Ecosystem Service Value Equivalents

Considering the actual geographical environment of the HREEB and relevant empirical studies on ESV, this study refers to the equivalent table of ESV per unit area of China’s terrestrial ecosystems proposed by Xie Gaodi et al. [25]. After adjustment and revision, the ESV coefficient (VC) for the HREEB is determined. The ESV of the study area is calculated using the revised VC, with the estimation formula as follows [28,40]:
E S V = i = 1 n V C i × A i
where E S V is the total Ecosystem Service Value (ESV) of the Huaihe River Ecological Economic Belt (HREEB) (yuan); n is the number of different land use types in the study area; i is a specific land use type; V C i is the revised total ESV coefficient per unit area of the i-th land use type in the HREEB (yuan/(hm2·a)); A I is the area of the i-th land use type in the study area (m2).
According to the research hypothesis proposed by Xie Gaodi et al., one standard ESV equivalent factor (i.e., standard equivalent) refers to the economic value of the natural grain yield per year from 1 hectare of standard farmland. Based on the standard equivalent and the ESV equivalent factor table, the ESV coefficient table per unit area for each land use type and each ecosystem service function is calculated, which reflects the contribution capacity of each land use type and ecosystem service function to ESV.
Xie Gaodi et al. [25] defined one standard ESV equivalent factor as the economic value of the annual natural grain yield from 1 hm2 of farmland with the national average yield. Through comprehensive comparative analysis, it was determined that the economic value of one ESV equivalent factor equals 1/7 of the market value of the national average grain yield per unit area in the same year. This study selects the average grain yield per unit area in the HREEB from 2000 to 2020 as 6682 kg/hm2. To eliminate the impact of interannual grain price fluctuations, the grain price adopts the average grain price of 2.60 yuan/kg in five provinces (Anhui, Jiangsu, Henan, Shandong, and Hubei) in 2020. The calculated value of one standard ESV equivalent factor in the HREEB is 2481.89 yuan/hm2. To unify the spatial measurement units with the land use area ( k m 2 ) throughout the study, the equivalent factor was converted to 24.82 × 10 4   y u a n / k m 2 .
After adjusting for socioeconomic and biomass factors and applying the algorithm for the standard unit ESV equivalent factor, the ESV coefficient table per unit area in the HREEB is obtained (Table 3):

2.3.3. Machine Learning (Coupled Analysis of XGBoost Model and SHAP Values)

To accurately identify the core driving factors of Ecosystem Service Value (ESV) in the Huaihe River Ecological Economic Belt (HREEB), quantify the nonlinear action effects of factors, and characterize their spatial differentiation characteristics, this study employs the XGBoost model to fit the complex correlations between ESV and driving factors. Combined with SHAP values, it realizes the interpretability analysis of the machine learning model, forming a complete technical chain of “fitting—interpretation—visualization”.
1.
XGBoost Model
XGBoost is an ensemble learning algorithm based on gradient boosting decision trees, with its core being an objective function with regularization terms. It achieves high-precision fitting of the dependent variable through an additive model of multiple decision trees. The core formulas are as follows [41,42,43]:
y ^ i = k = 1 K f k ( x i ) ,   f k F
where y ^ i is the predicted ESV of the i-th sample; k is the number of decision trees; f k is the mapping relationship of the k-th decision tree; and F is the decision tree space.
O b j ( t ) = i = 1 n l ( y i , y ^ i ( t 1 ) + f k ( x i ) ) + i = 1 n Ω ( f k )
where O b j ( t ) is the objective function. The loss term l uses Mean Squared Error (MSE) to measure the deviation between the true value y i and the predicted value. The regularization term Ω f k γ T + 1 2 λ j = 1 T w j 2 is used to control model complexity ( T is number of leaf nodes, w j is the weight of leaf node j , γ is the penalty coefficient for the number of leaf nodes, λ = L2 regularization coefficient).
By performing second-order Taylor expansion and simplification on the loss term, the optimal leaf weight of the t-th tree is obtained:
w j = G i H i + λ ,   G i = i ϵ I j g i ,   H i = i ϵ I j h i
where g i = y ^ t 1 l ( y i , y ^ ( t 1 ) ) , h i = 2 y ^ t 1 l ( y i , y ^ ( t 1 ) ) are the first-order and second-order derivatives of the loss function, respectively; I j is the sample set of the j-th leaf node.
2.
SHAP
SHAP values are based on the Shapley value in game theory. By calculating the marginal contribution of each feature to the model’s predicted value, they realize the quantitative interpretation of the factor action mechanism. The core formula is as follows [44,45]:
φ i = S H \ i S ! H S 1 ! H ! ( t ( S i ) t ( S ) )
where φ i is the SHAP value of the i-th feature; S is the subset excluding feature i; H is the total number of features; t ( S ) is the model predicted value corresponding to subset S .
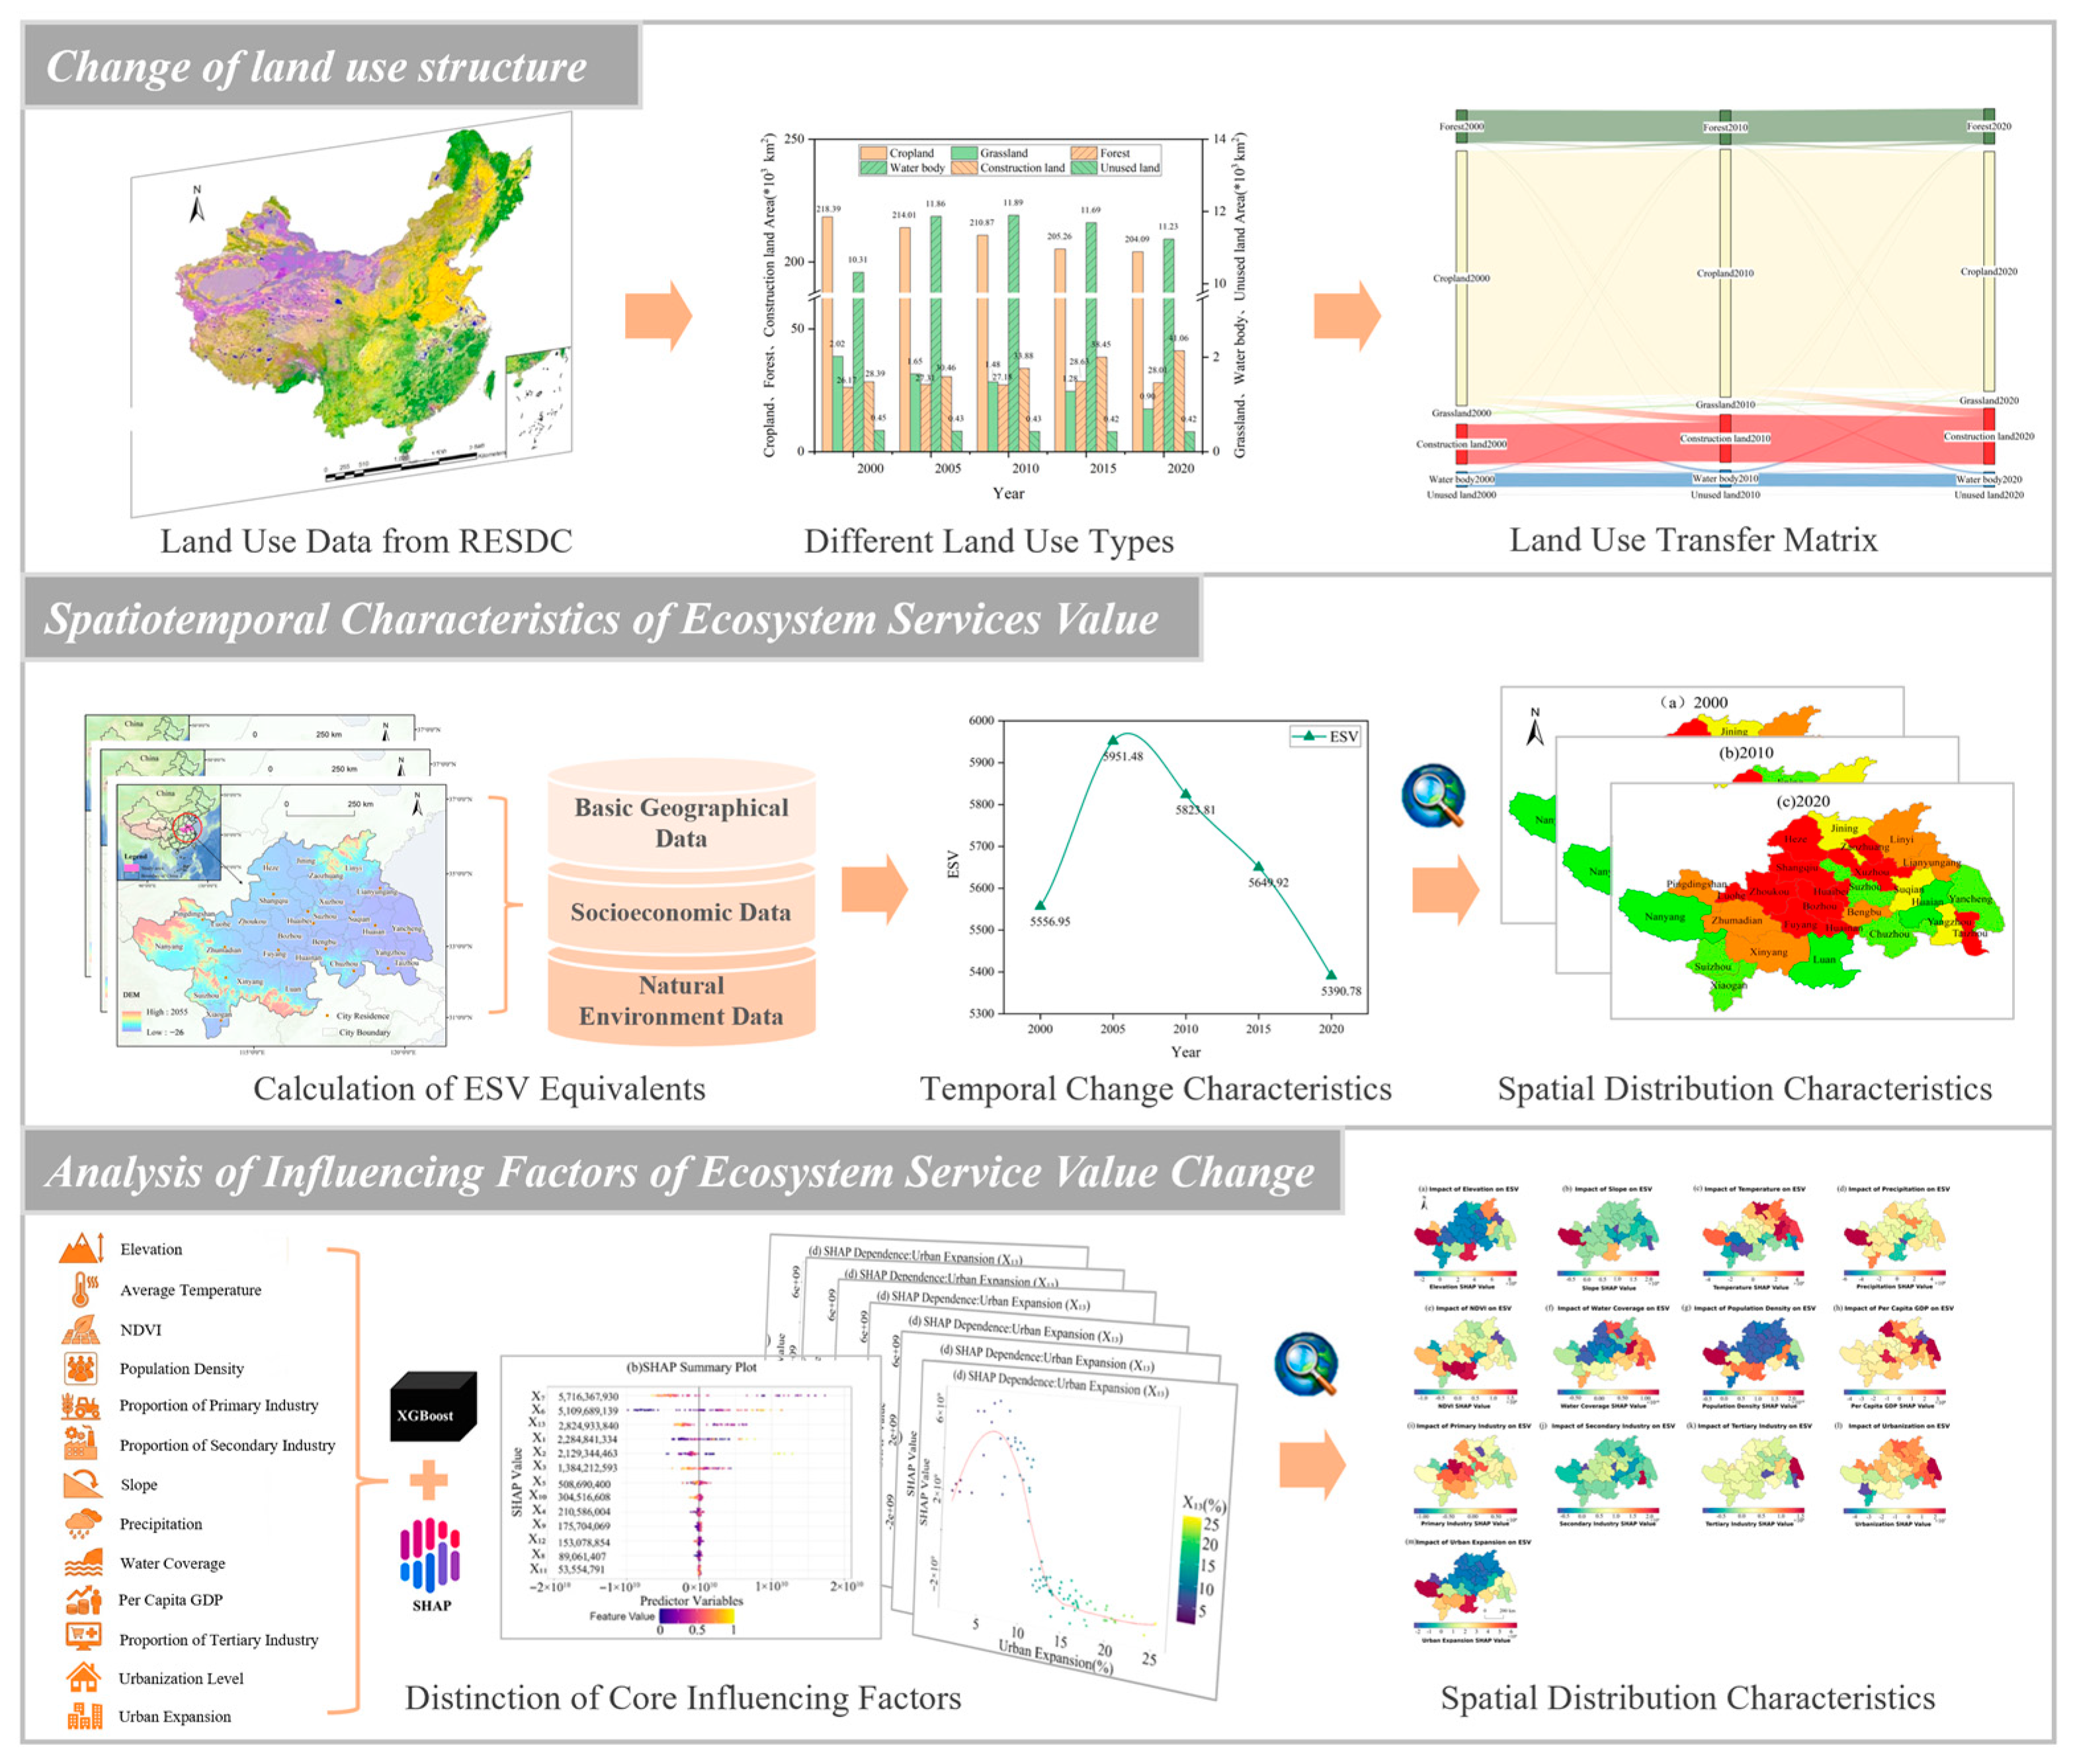
To systematically address the research objectives, the overall workflow of this study (Figure 2) is designed in three interrelated stages. In the first stage, based on multi-period land use data, the structural changes and transfer matrices among different land use types are quantified to reveal the regional land cover transition patterns. In the second stage, by integrating basic geographical, socioeconomic, and natural environment data, the ESV equivalents are calculated to map the temporal fluctuation trends and spatial distribution characteristics of ecosystem services. In the final stage, an XGBoost-SHAP coupled machine learning framework is constructed to evaluate various predictor variables. This stage aims to identify the core influencing factors, decompose their nonlinear dependence effects, and visualize their spatial differentiation, thereby comprehensively uncovering the driving mechanisms of ESV changes.

3. Results Analysis

3.1. Change in Land Use Structure

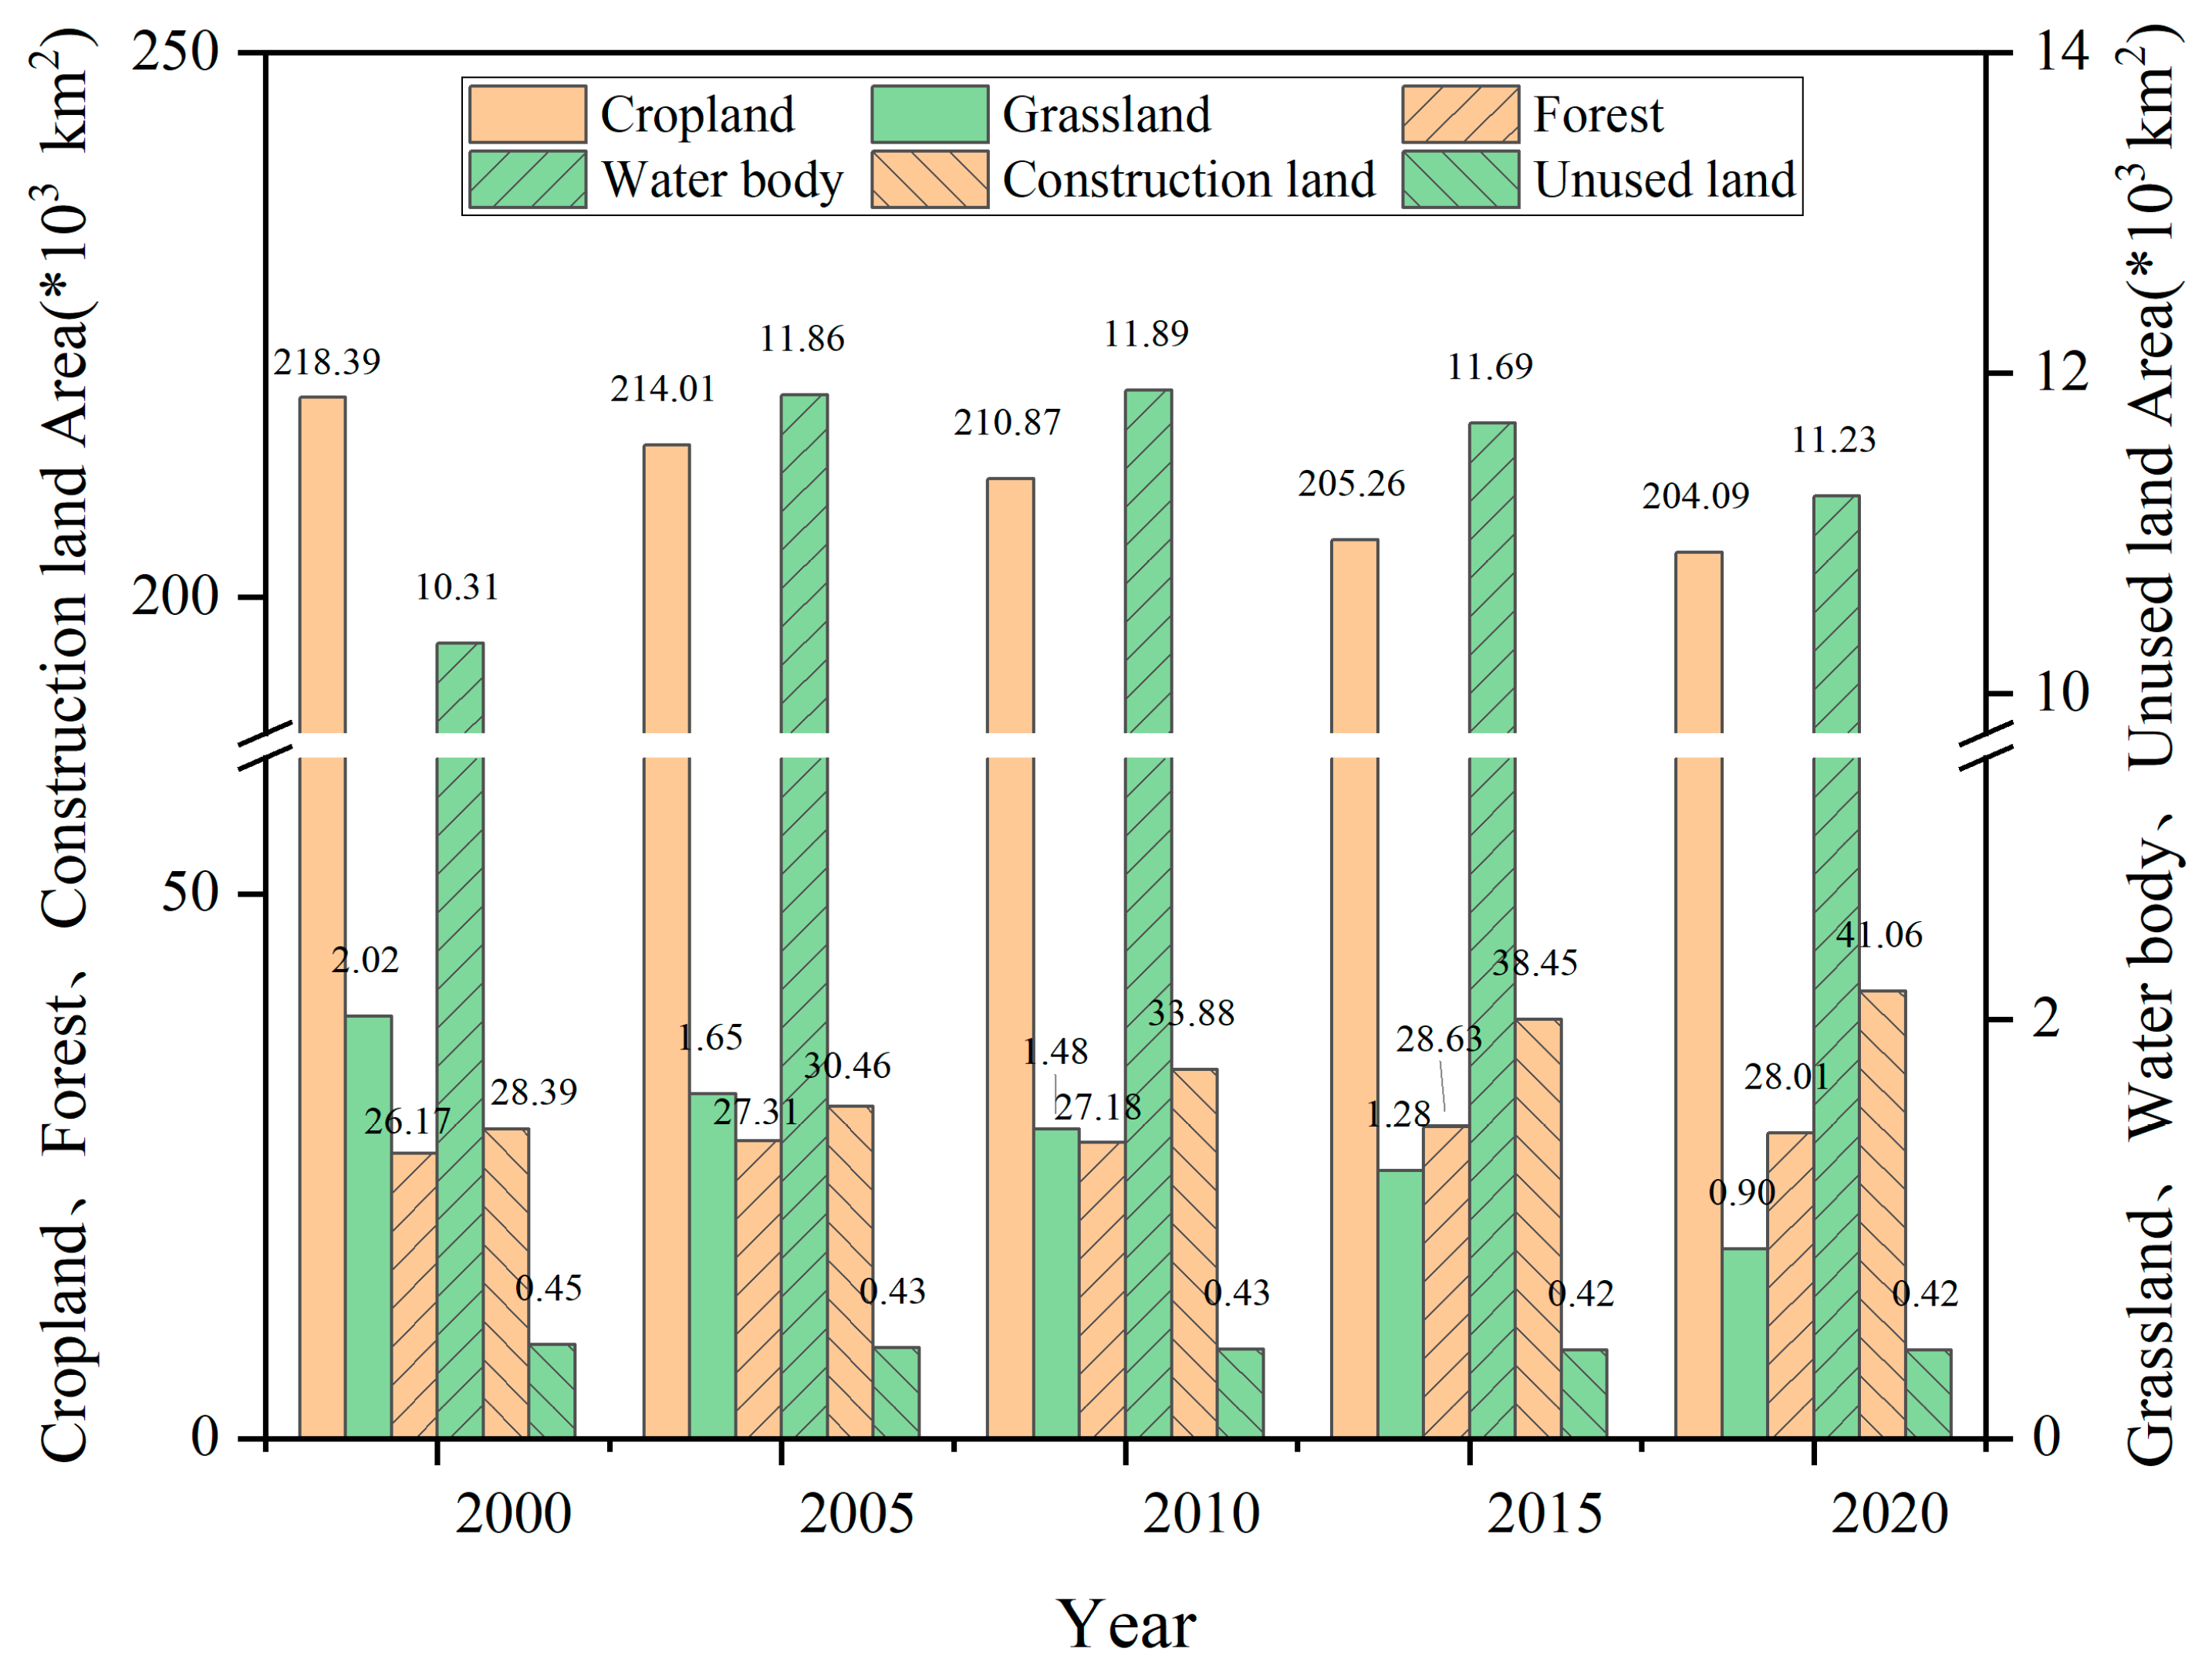
Based on the analysis of land use data (Figure 3), the land cover structure of the Huaihe River Ecological Economic Belt (HREEB) exhibits distinct dominant type characteristics. Cropland is the primary land use type in the region, with a total area of 205,259.43 km2, accounting for 71.84% of the total study area. Construction land and forest land rank second and third, with areas of 38,445.40 km2 and 27,999.60 km2, corresponding to proportions of 13.46% and 9.80%, respectively. In contrast, grassland (904.30 km2), water body (11,231.38 km2), and unused land (422.27 km2) have smaller areas, accounting for 0.32%, 3.93%, and 0.15% of the total area, respectively. In terms of land use composition, cropland, construction land, and forest land collectively constitute the main body of regional land use, with a combined proportion of 95.60%. Notably, although the total proportion of grassland and forest land is 10.12%, the proportion of unused land is extremely low (0.15%), indicating a high intensity of land development in the HREEB and a relative scarcity of available reserve land resources.
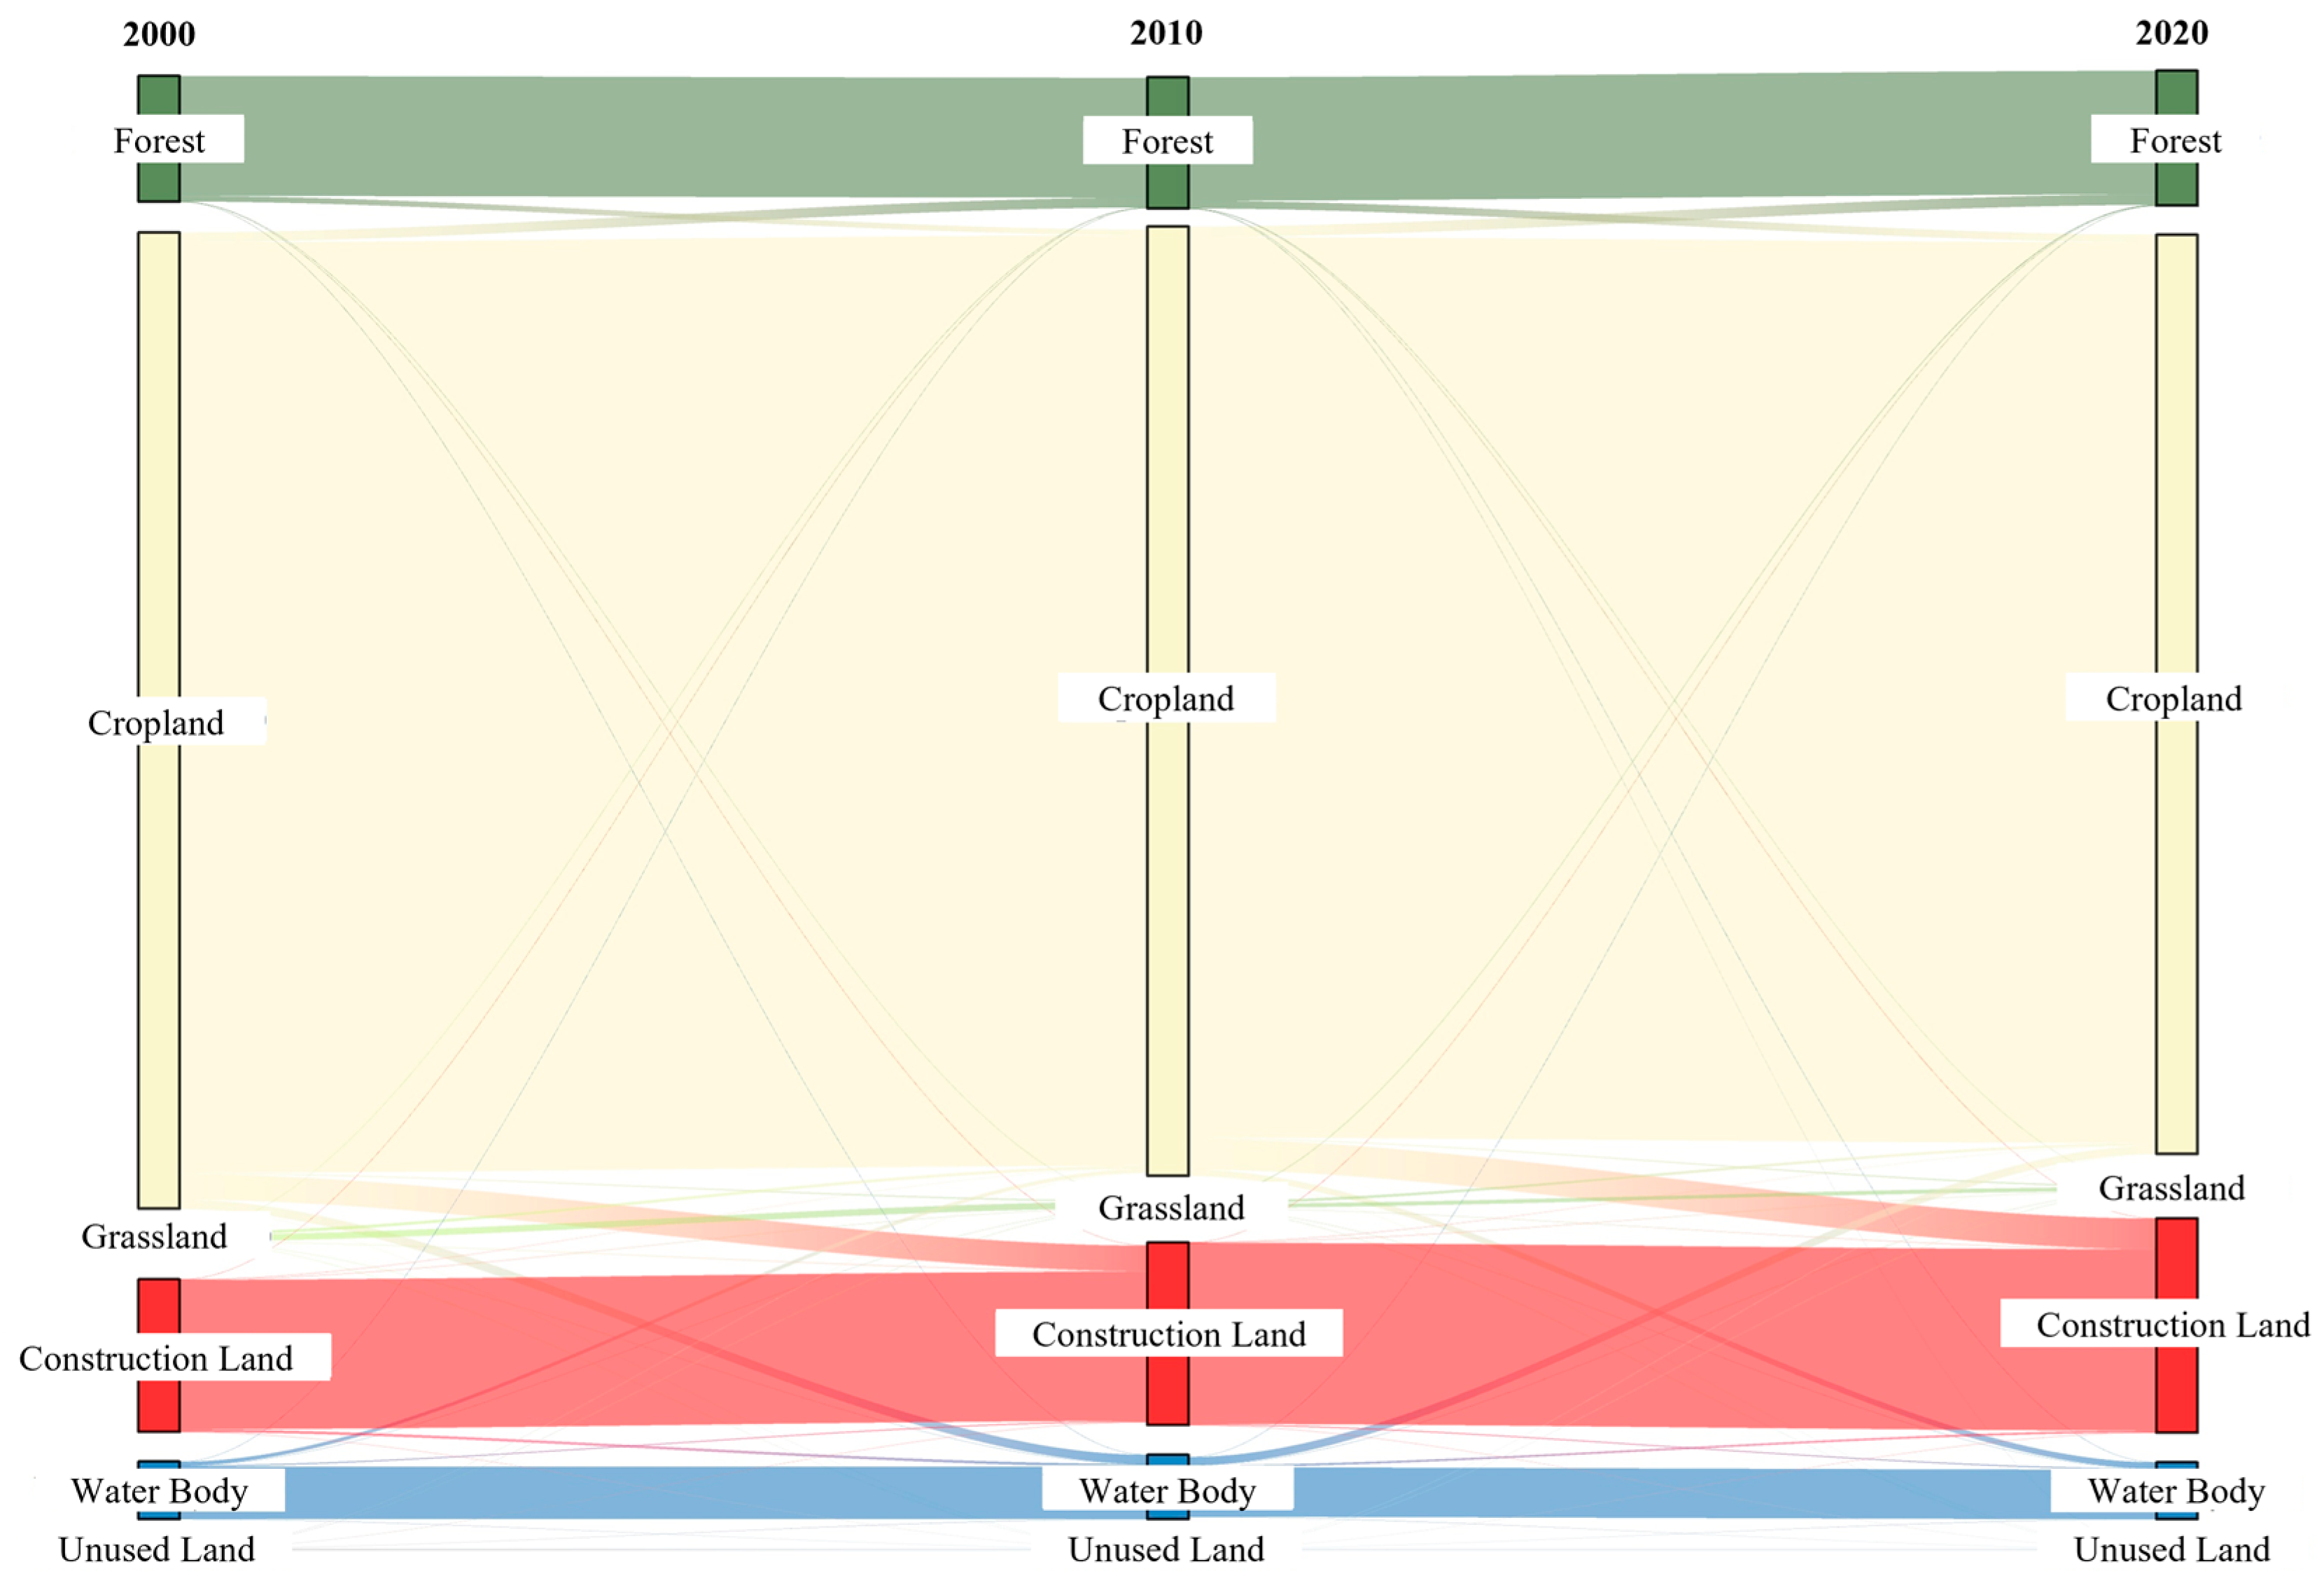
Through the analysis of the land use transfer matrix from 2000 to 2020 (Figure 4), the conversion paths and scales of various land types can be clearly identified. From the perspective of land conversion out, cropland is the main converted-out type, with 12,735.30 km2 and 3431.62 km2 converted to construction land and forest land, respectively. The conversion out of forest land is mainly manifested as conversion to cropland, with an area of 1839.64 km2. The area of grassland converted to cropland is 928.21 km2, while water bodies are mainly converted to cropland and construction land, with areas of 1468.23 km2 and 585.23 km2, respectively. From the perspective of land conversion in, cropland is mainly derived from water bodies and forest land, with conversion areas of 1468.23 km2 and 1839.64 km2, respectively. Forest land is mainly converted from cropland, with an area of 3431.62 km2. Water bodies are mainly converted from cropland and construction land, with areas of 2358.98 km2 and 584.23 km2, respectively. The expansion of construction land mainly occupies cropland, with a conversion-in area of up to 12,735.30 km2.
Combining the results of conversion-in and conversion-out analysis, the land use change in the HREEB from 2000 to 2020 shows obvious regularity: cropland serves as the main converted-out land type, while construction land and forest land are the main converted-in land types. Although water bodies, grassland, and unused land also underwent partial conversion, the overall conversion scale is relatively limited. This land use change pattern profoundly reflects the characteristics of land use evolution driven by the dual forces of urbanization and ecological construction in the study area.

3.2. Spatiotemporal Characteristics of Ecosystem Service Value

3.2.1. Temporal Change Characteristics of Ecosystem Service Value

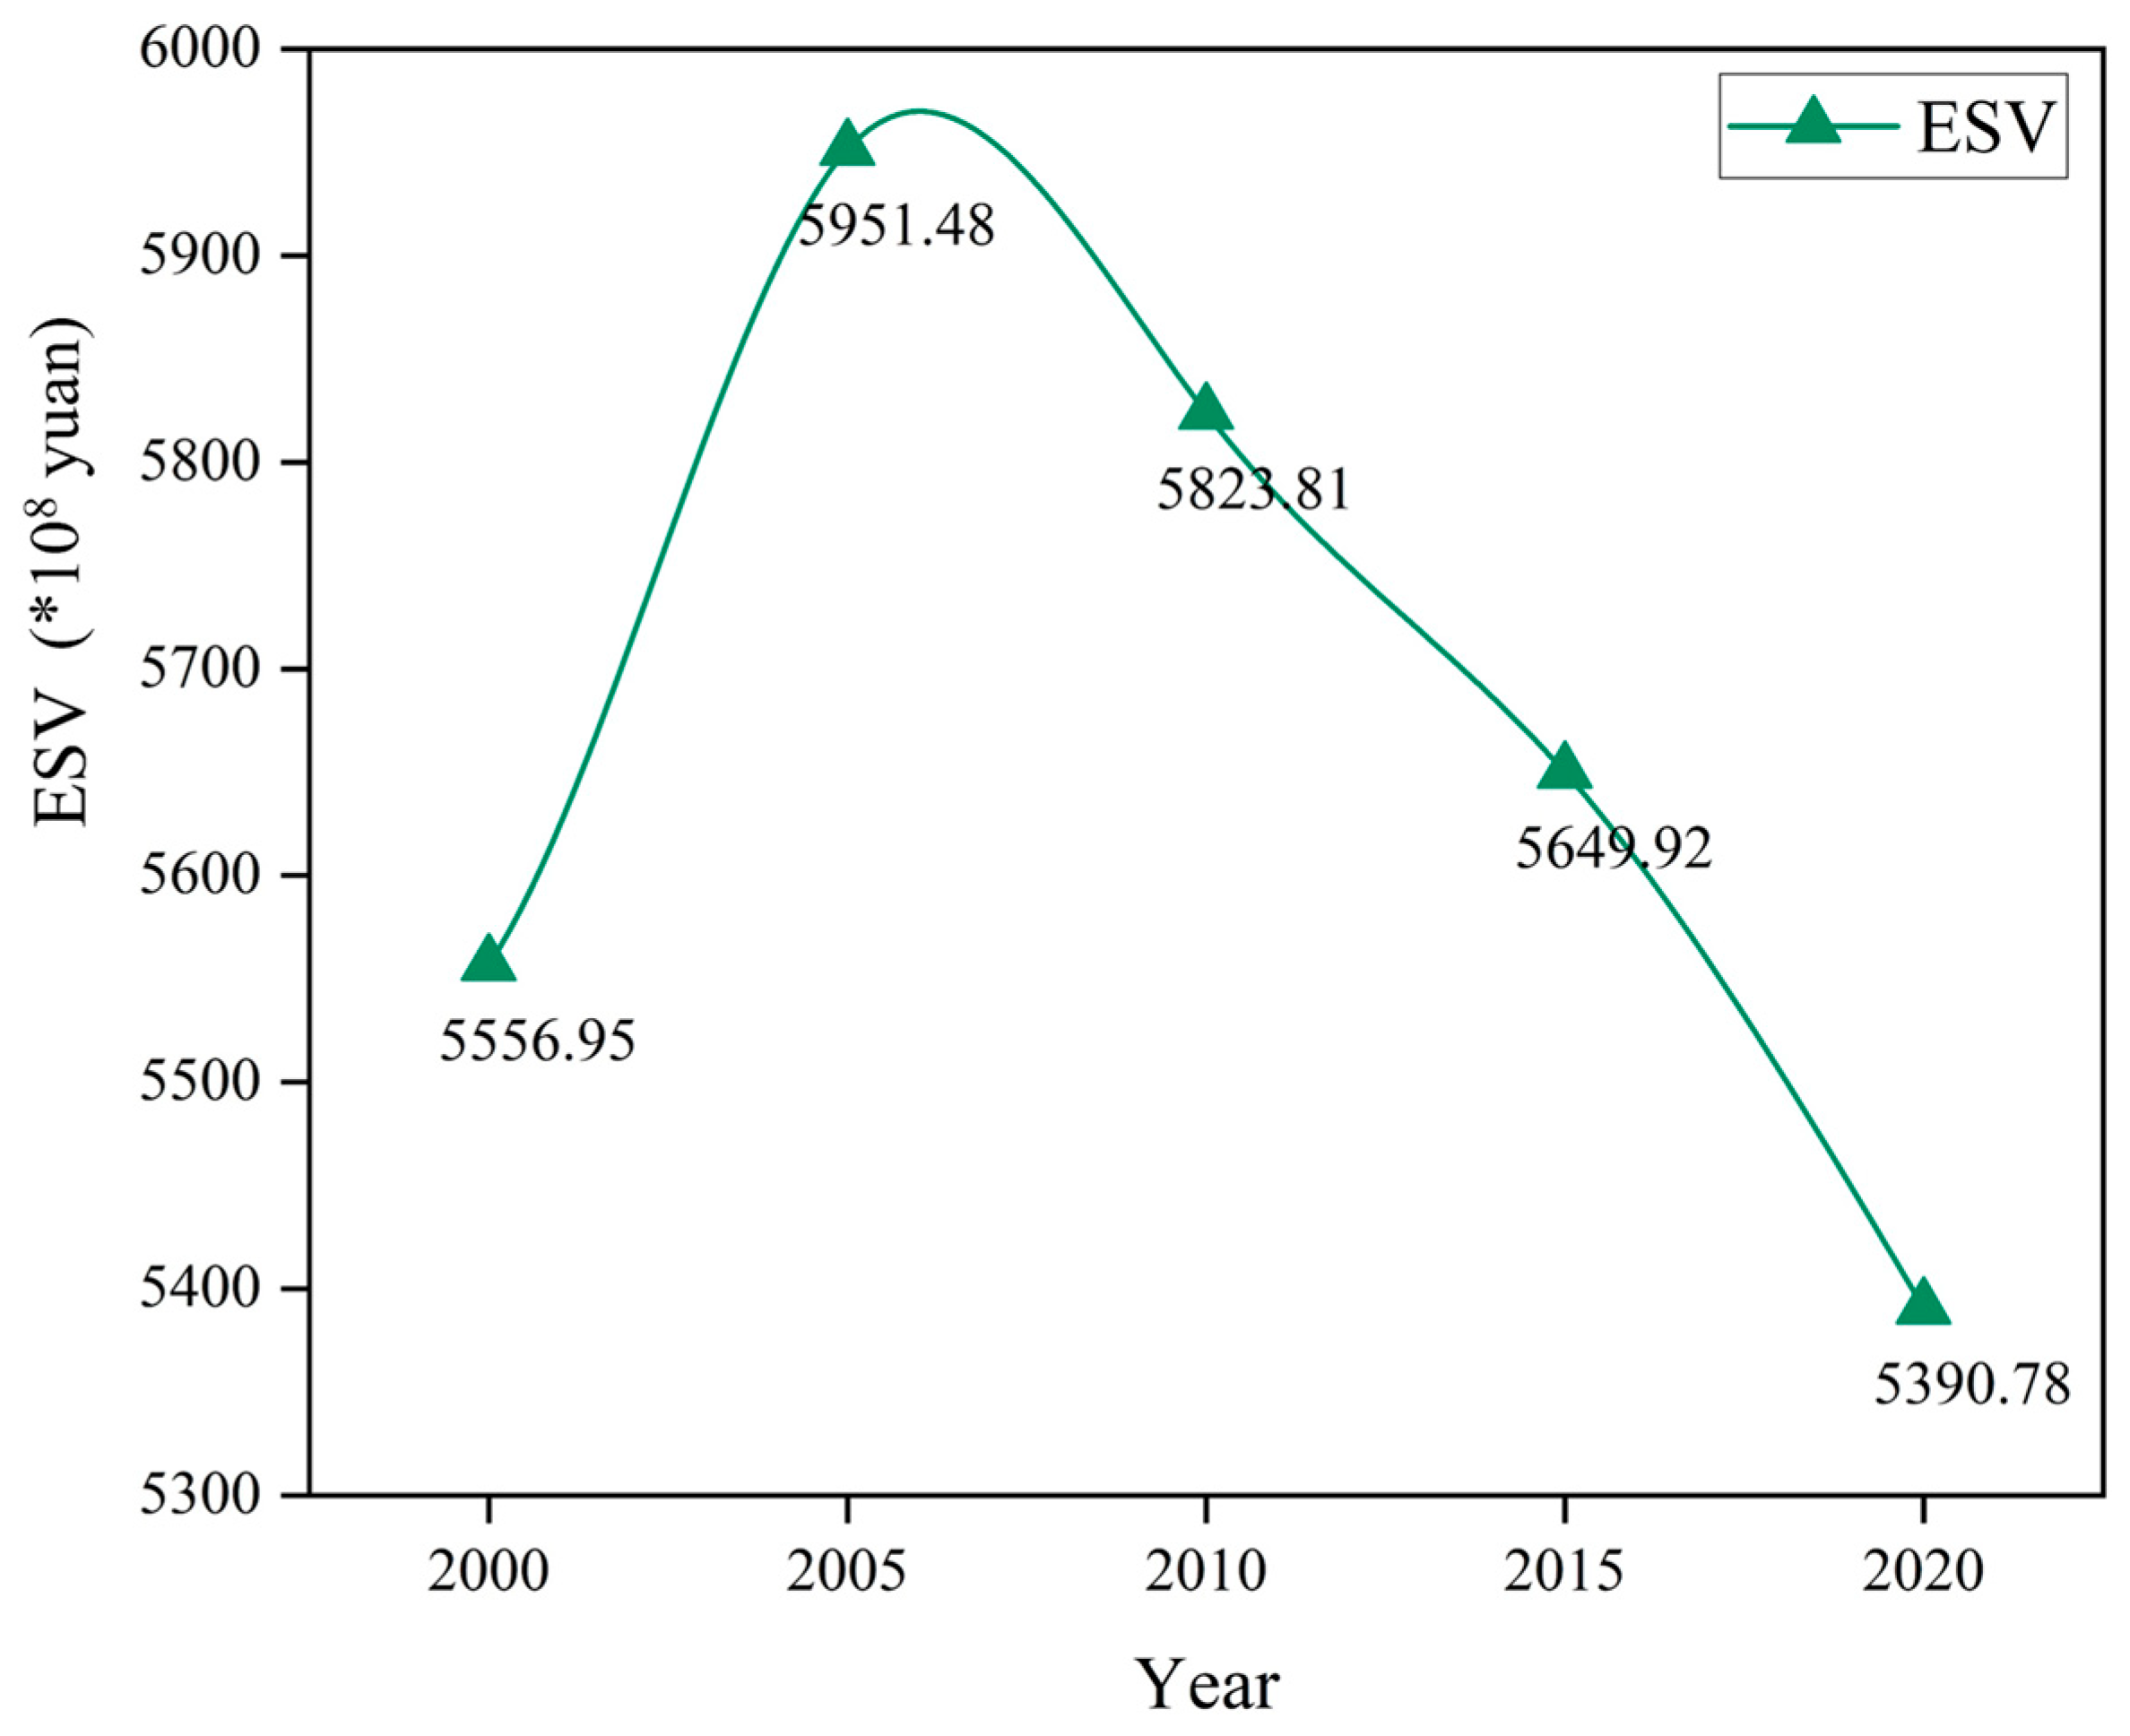
During the study period, the total Ecosystem Service Value (ESV) of the HREEB showed a trend of “first increasing and then decreasing” (Figure 5). Specifically: the total ESV increased by 39.453 billion yuan from 2000 to 2005, with a growth rate of 7.10%; from 2005 to 2020, the total ESV continued to decrease, dropping from 595.148 billion yuan in 2005 to 539.078 billion yuan in 2020, a total decrease of 56.070 billion yuan and an overall growth rate of −10.40%. Among them, the growth rates from 2005 to 2010, 2010 to 2015, and 2015 to 2020 were −2.15%, −2.99%, and −4.81%, respectively, indicating that the rate of decrease in total ESV is accelerating.

3.2.2. Spatial Distribution Characteristics of Ecosystem Service Value

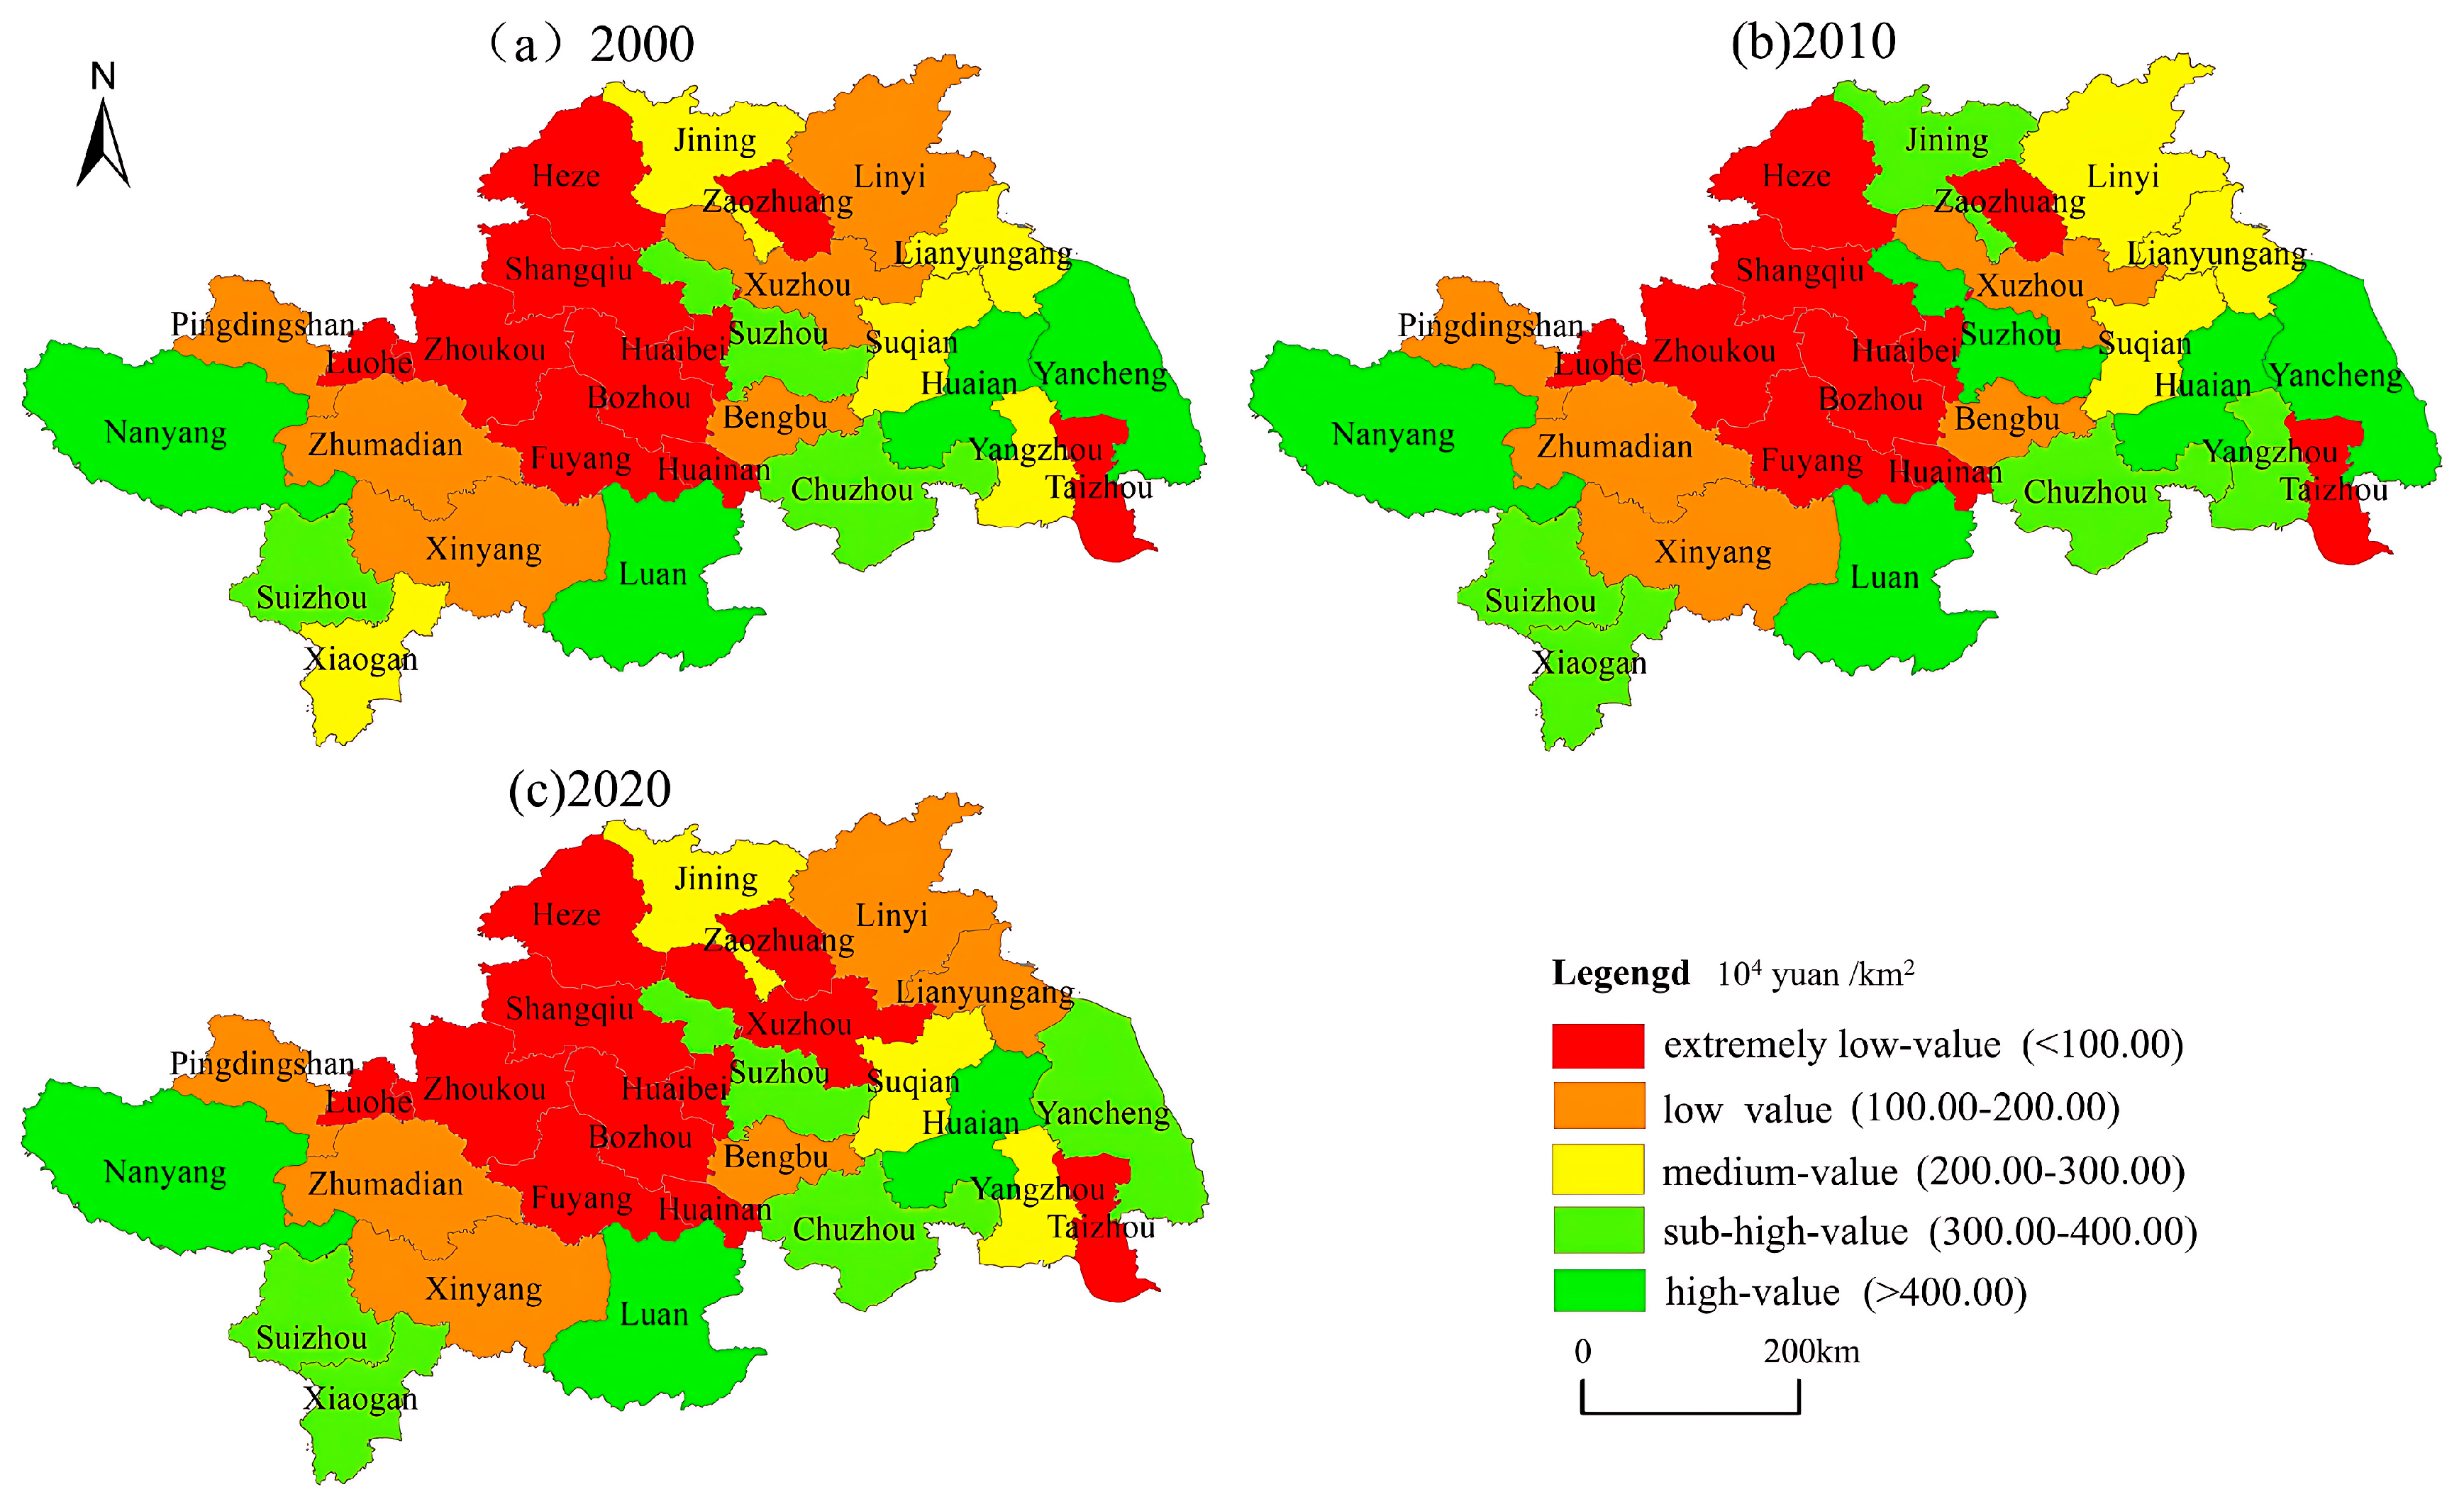
Taking the ESV of the HREEB in 2000, 2010, and 2020 as samples, this study used GIS tools to divide the ESV of the study area into five grade zones in sequence (Figure 6): extremely low-value zone (≤100.00 y u a n / k m 2 , red), low-value zone (100.00—200.00 y u a n / k m 2 , orange), medium-value zone (200.00—300.00 y u a n / k m 2 , yellow), sub-high-value zone (300.00—400.00 y u a n / k m 2 , light green), and high-value zone (≥400.00 y u a n / k m 2 , dark green).
From 2000 to 2020, the grade distribution of ESV in the HREEB fluctuated, with significant spatial differences. The number of high-value and sub-high-value zones has always been small, and they have continuously been concentrated in the eastern river–sea linkage region (e.g., Yancheng, Yangzhou) and the central-western inland rising region (e.g., Lu’an) from 2000 to 2020. Their distribution range did not expand significantly, only showing slight fluctuations in grades in local areas. The core reason is that these regions have a high proportion of ecological land such as water bodies and forest land, and the foundation of ecological service functions is stable. The number of extremely low-value zones showed a trend of “scattered expansion—reduction—re-expansion”. In 2000, they were scattered in the initial development areas of construction land such as Zhoukou and Fuyang; in 2010, the number decreased, and some areas jumped to low-value zones, mainly driven by the temporary restoration of ecological space; in 2020, the number increased again, concentrated in Zhoukou, Shangqiu and other places in the northern Huaihai Economic Zone, and their expansion originated from the occupation of ecological land such as cropland and wetlands by urban construction. The number of medium-value zones showed a fluctuating expansion trend. They were scattered in the region in 2000, expanded slightly in 2010, and further aggregated in areas with concentrated forest land and cropland such as Xinyang and Huai’an in 2020, reflecting that the ecological service functions of these regions are in a relatively stable state. Low-value zones are spatially adjacent to medium-value and extremely low-value zones, and have been concentrated in the cropland-dominated regions of eastern Henan and northern Anhui from 2000 to 2020, with no obvious grade jump, mainly limited by the service function dimensions of agricultural land.
Overall, compared with 2000, the range of extremely low-value zones expanded slightly in 2020, the range of high-value zones remained basically stable, and the coverage of medium-value zones increased slightly, indicating that the overall ESV of the HREEB is at a medium level, and the spatial differentiation pattern is significantly affected by changes in land use types. Combined with the spatial distribution, high-value and sub-high-value zones form a continuous distribution belt in the eastern and central-western regions with concentrated ecological land, while extremely low-value and low-value zones form a continuous distribution belt in the northern region with dense construction land. This pattern provides a basis for the subsequent zonal ecological regulation of “improving the quality of ecological land protection areas and controlling the quantity of construction land-intensive areas”.

3.3. Analysis of Influencing Factors of Ecosystem Service Value Change

Prior to analyzing the specific driving factors, the performance of the XGBoost regression model was evaluated to ensure reliability. The coefficient of determination ( R 2 ) for the validation set stabilized within the range of 0.51 to 0.64 across different simulation periods. The difference in R 2 between the training and validation sets was controlled within 0.15, preventing significant overfitting. Furthermore, the Root Mean Square Error (RMSE) remained within a reasonable fluctuation range relative to the mean ESV of the basin. These metrics indicate that the model possesses good fitting performance and robustness, providing a solid foundation for interpreting the driving mechanisms.

3.3.1. Distinction of Core Influencing Factors and Differences in Action Mechanisms

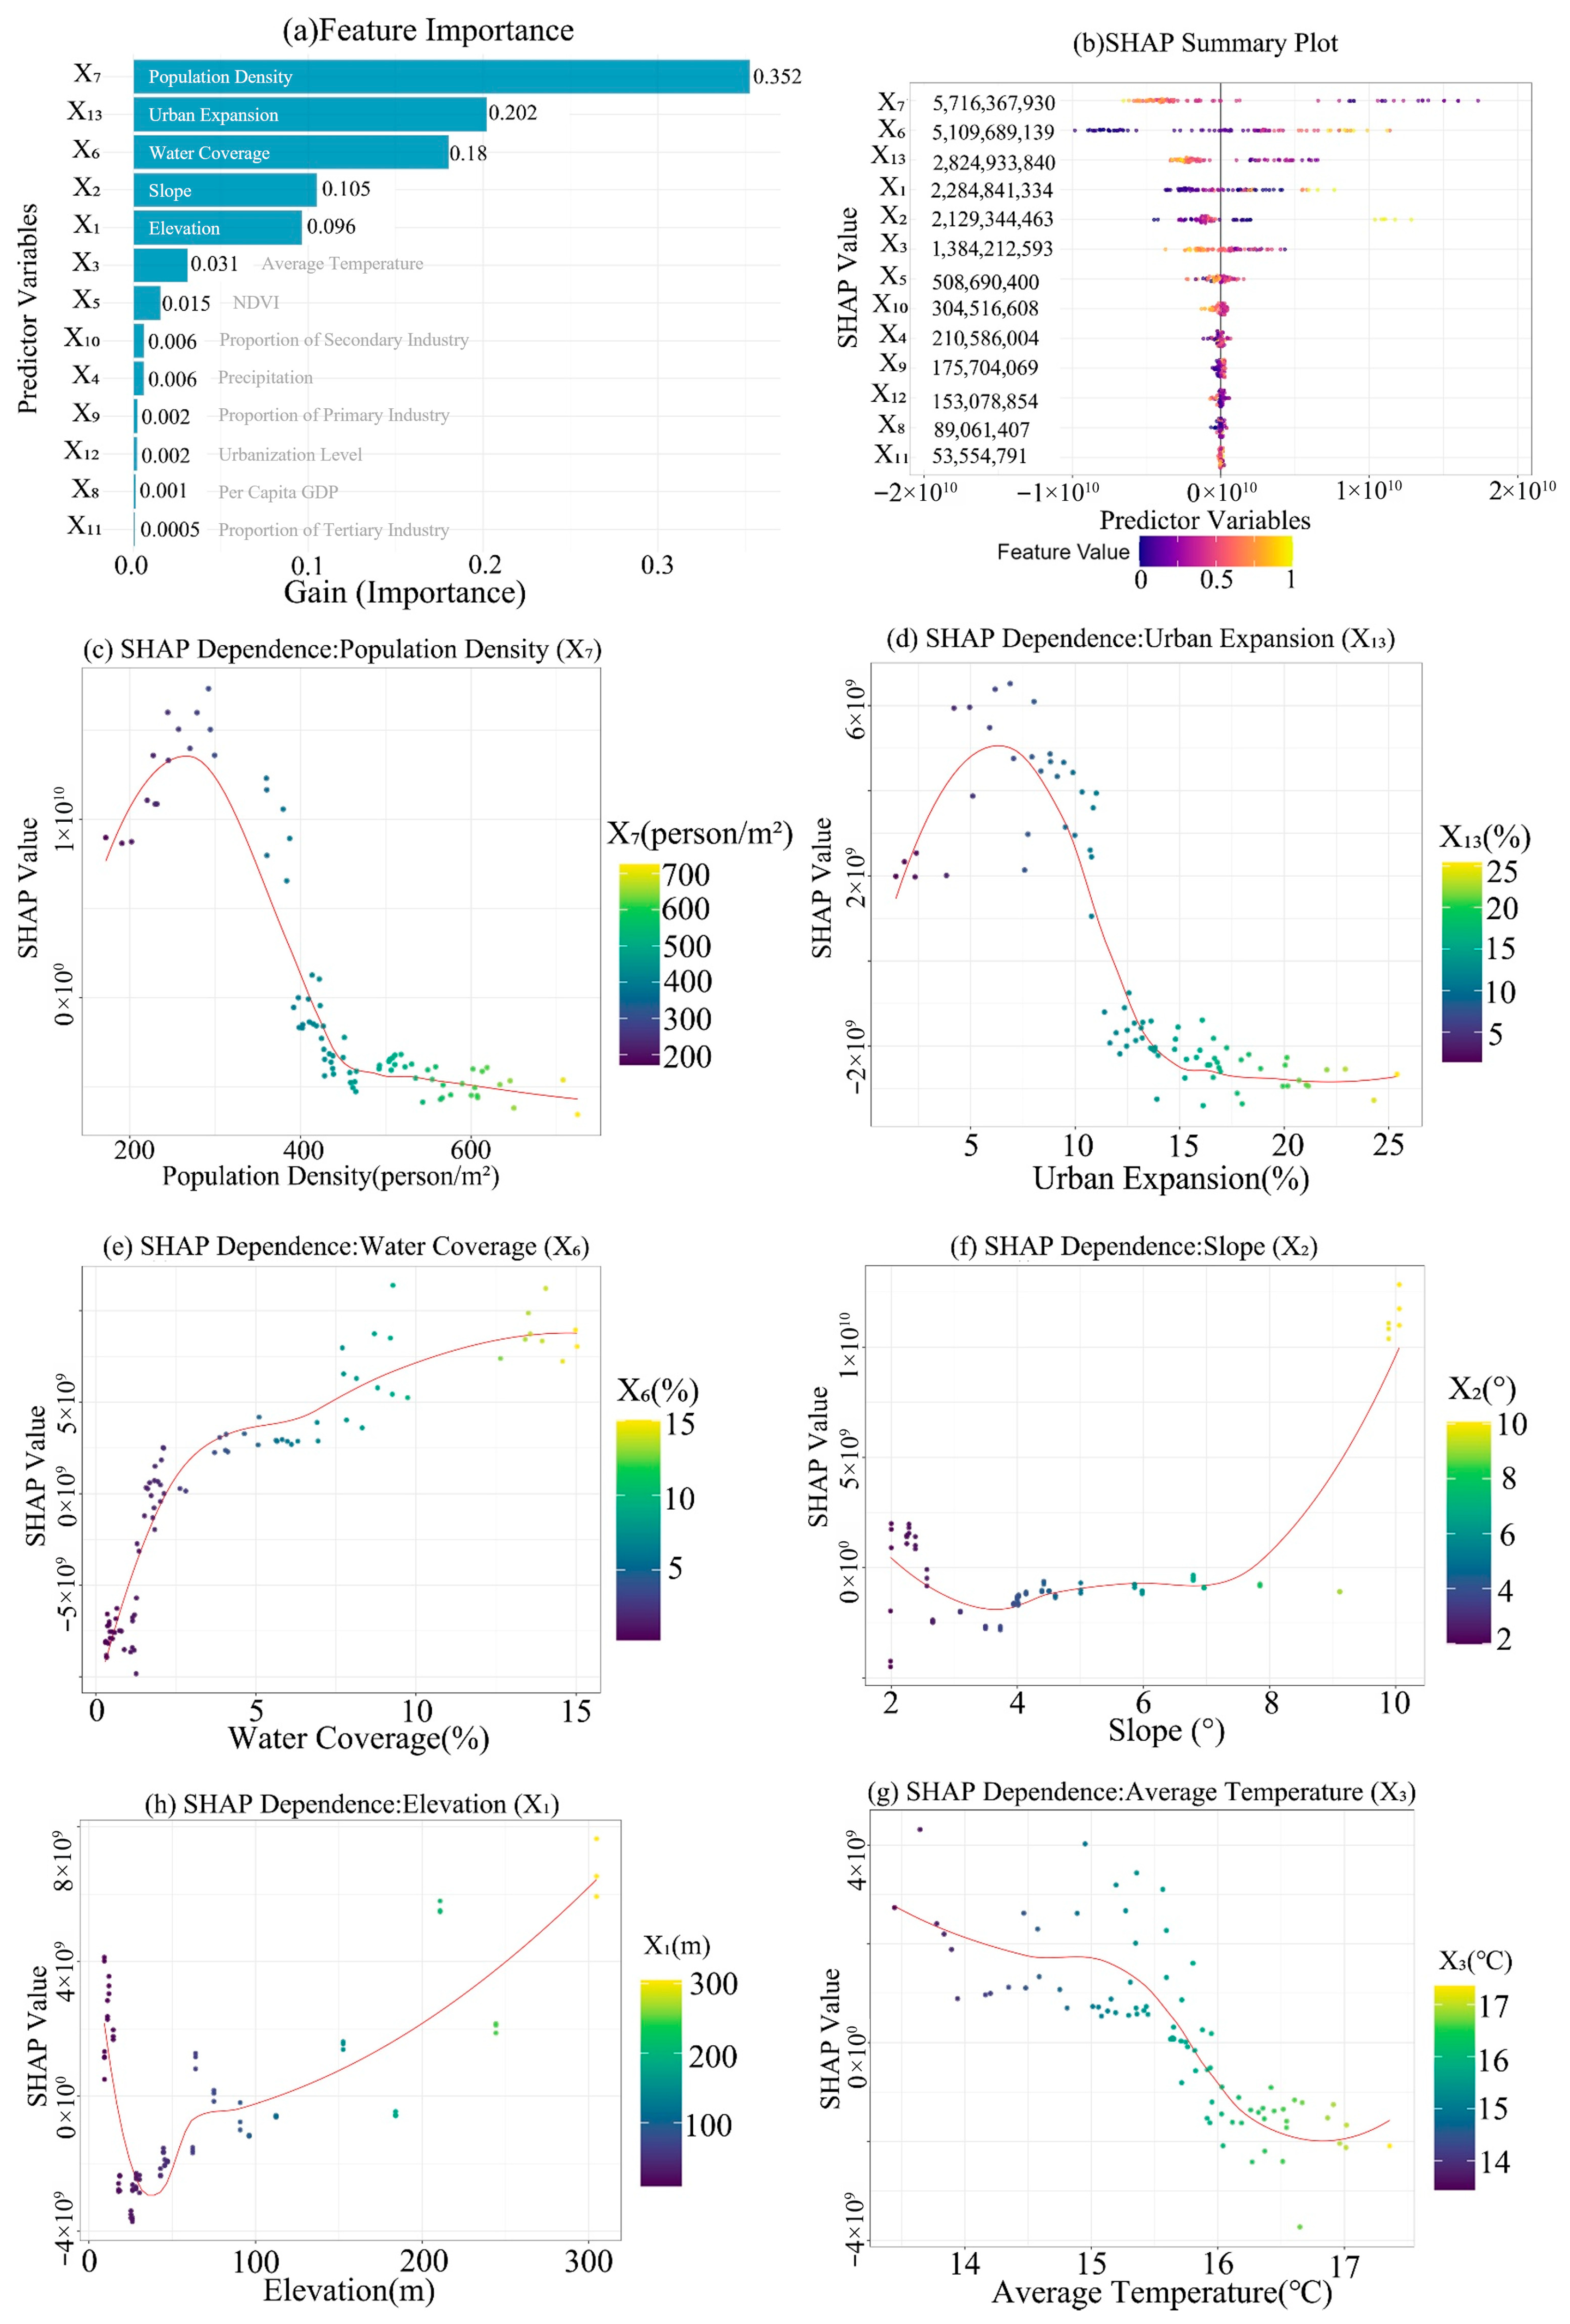
The combined analysis of the XGBoost model and SHAP values reveals that the core influencing factors of Ecosystem Service Value (ESV) in the Huaihe River Ecological Economic Belt (HREEB) exhibit significant differences in type attribution, action mechanisms, and spatial response logic, reflecting the differentiated regulatory effects of natural background conditions and human activities on regional ecosystem service functions (Figure 7). From the feature importance plot (Figure 7a) and SHAP summary plot (Figure 7b), the influencing factors of ESV can be divided into two categories: one is natural background factors, centered on water coverage, slope, elevation, and temperature, which are the basic constraint conditions for ESV formation and determine the original service potential of regional ecosystems; the other is human–economic factors, represented by population density and urban expansion, which account for a higher proportion of feature importance (Figure 7a) and are the dominant forces driving spatiotemporal fluctuations of ESV, directly intervening in ecosystem structure and functions through land use transition and other means.
In terms of differences in the action mechanisms of core factors, the action logic of different types of factors on ESV shows significant heterogeneity, specifically manifested as follows: Population density (Figure 7c) exhibits a nonlinear “increase first and then decrease” effect. In the low population density interval, moderate population agglomeration can drive investment in ecological protection facilities and improve ecological awareness, leading to a fluctuating upward trend of SHAP values and a corresponding enhancement of ESV; when population density exceeds the critical threshold, problems such as occupation of construction land and intensified resource consumption caused by excessive agglomeration become prominent, SHAP values decline rapidly, and ESV is significantly weakened. Urban expansion (Figure 7d) shows a constrained nonlinear response. In the early stage of urban expansion (the stage with a low proportion of construction land), reasonable supporting urban ecological space (e.g., waterfront green spaces) can slightly improve ESV, and SHAP values show a slight fluctuating upward trend; however, with the deepening of expansion, the encroachment of construction land on ecological land such as cropland and wetlands intensifies, SHAP values continue to decline, and the attenuation effect of ESV gradually becomes dominant.
Natural background factors exhibit threshold-driven unidirectional effects. Among them, water coverage (Figure 7e) has a sustained positive promoting effect on ESV. With the increase in the proportion of water area, service functions such as water resource regulation and biological habitat provision are gradually enhanced, SHAP values rise steadily, and the promoting effect in the high-proportion interval is further amplified. For the slope factor (Figure 7f), in the low-slope interval, ecological space is prone to compression due to the convenience of human development, and SHAP values remain at a low level; when the slope exceeds the critical value, the difficulty of human development increases, natural ecosystems (forest land, grassland) are preserved, SHAP values rise rapidly, and the natural supporting function of ESV becomes prominent. Elevation (Figure 7h) follows the same action logic as slope: in low-elevation areas (plains), SHAP values are low due to the occupation by intensive development; with the increase in elevation, development activities decrease, the integrity of natural ecosystems is enhanced, SHAP values rise significantly, and the positive contribution to ESV is gradually amplified. Temperature (Figure 7g) shows negative nonlinear regulation—in the low temperature interval, the restriction of thermal conditions on vegetation growth is weak, and the basic functions of ESV are stable; when the temperature exceeds the critical value, problems such as intensified evaporation and decreased vegetation productivity caused by high temperature become prominent, SHAP values continue to decrease, and ESV declines accordingly.

3.3.2. Spatial Differentiation Characteristics of Influencing Factors

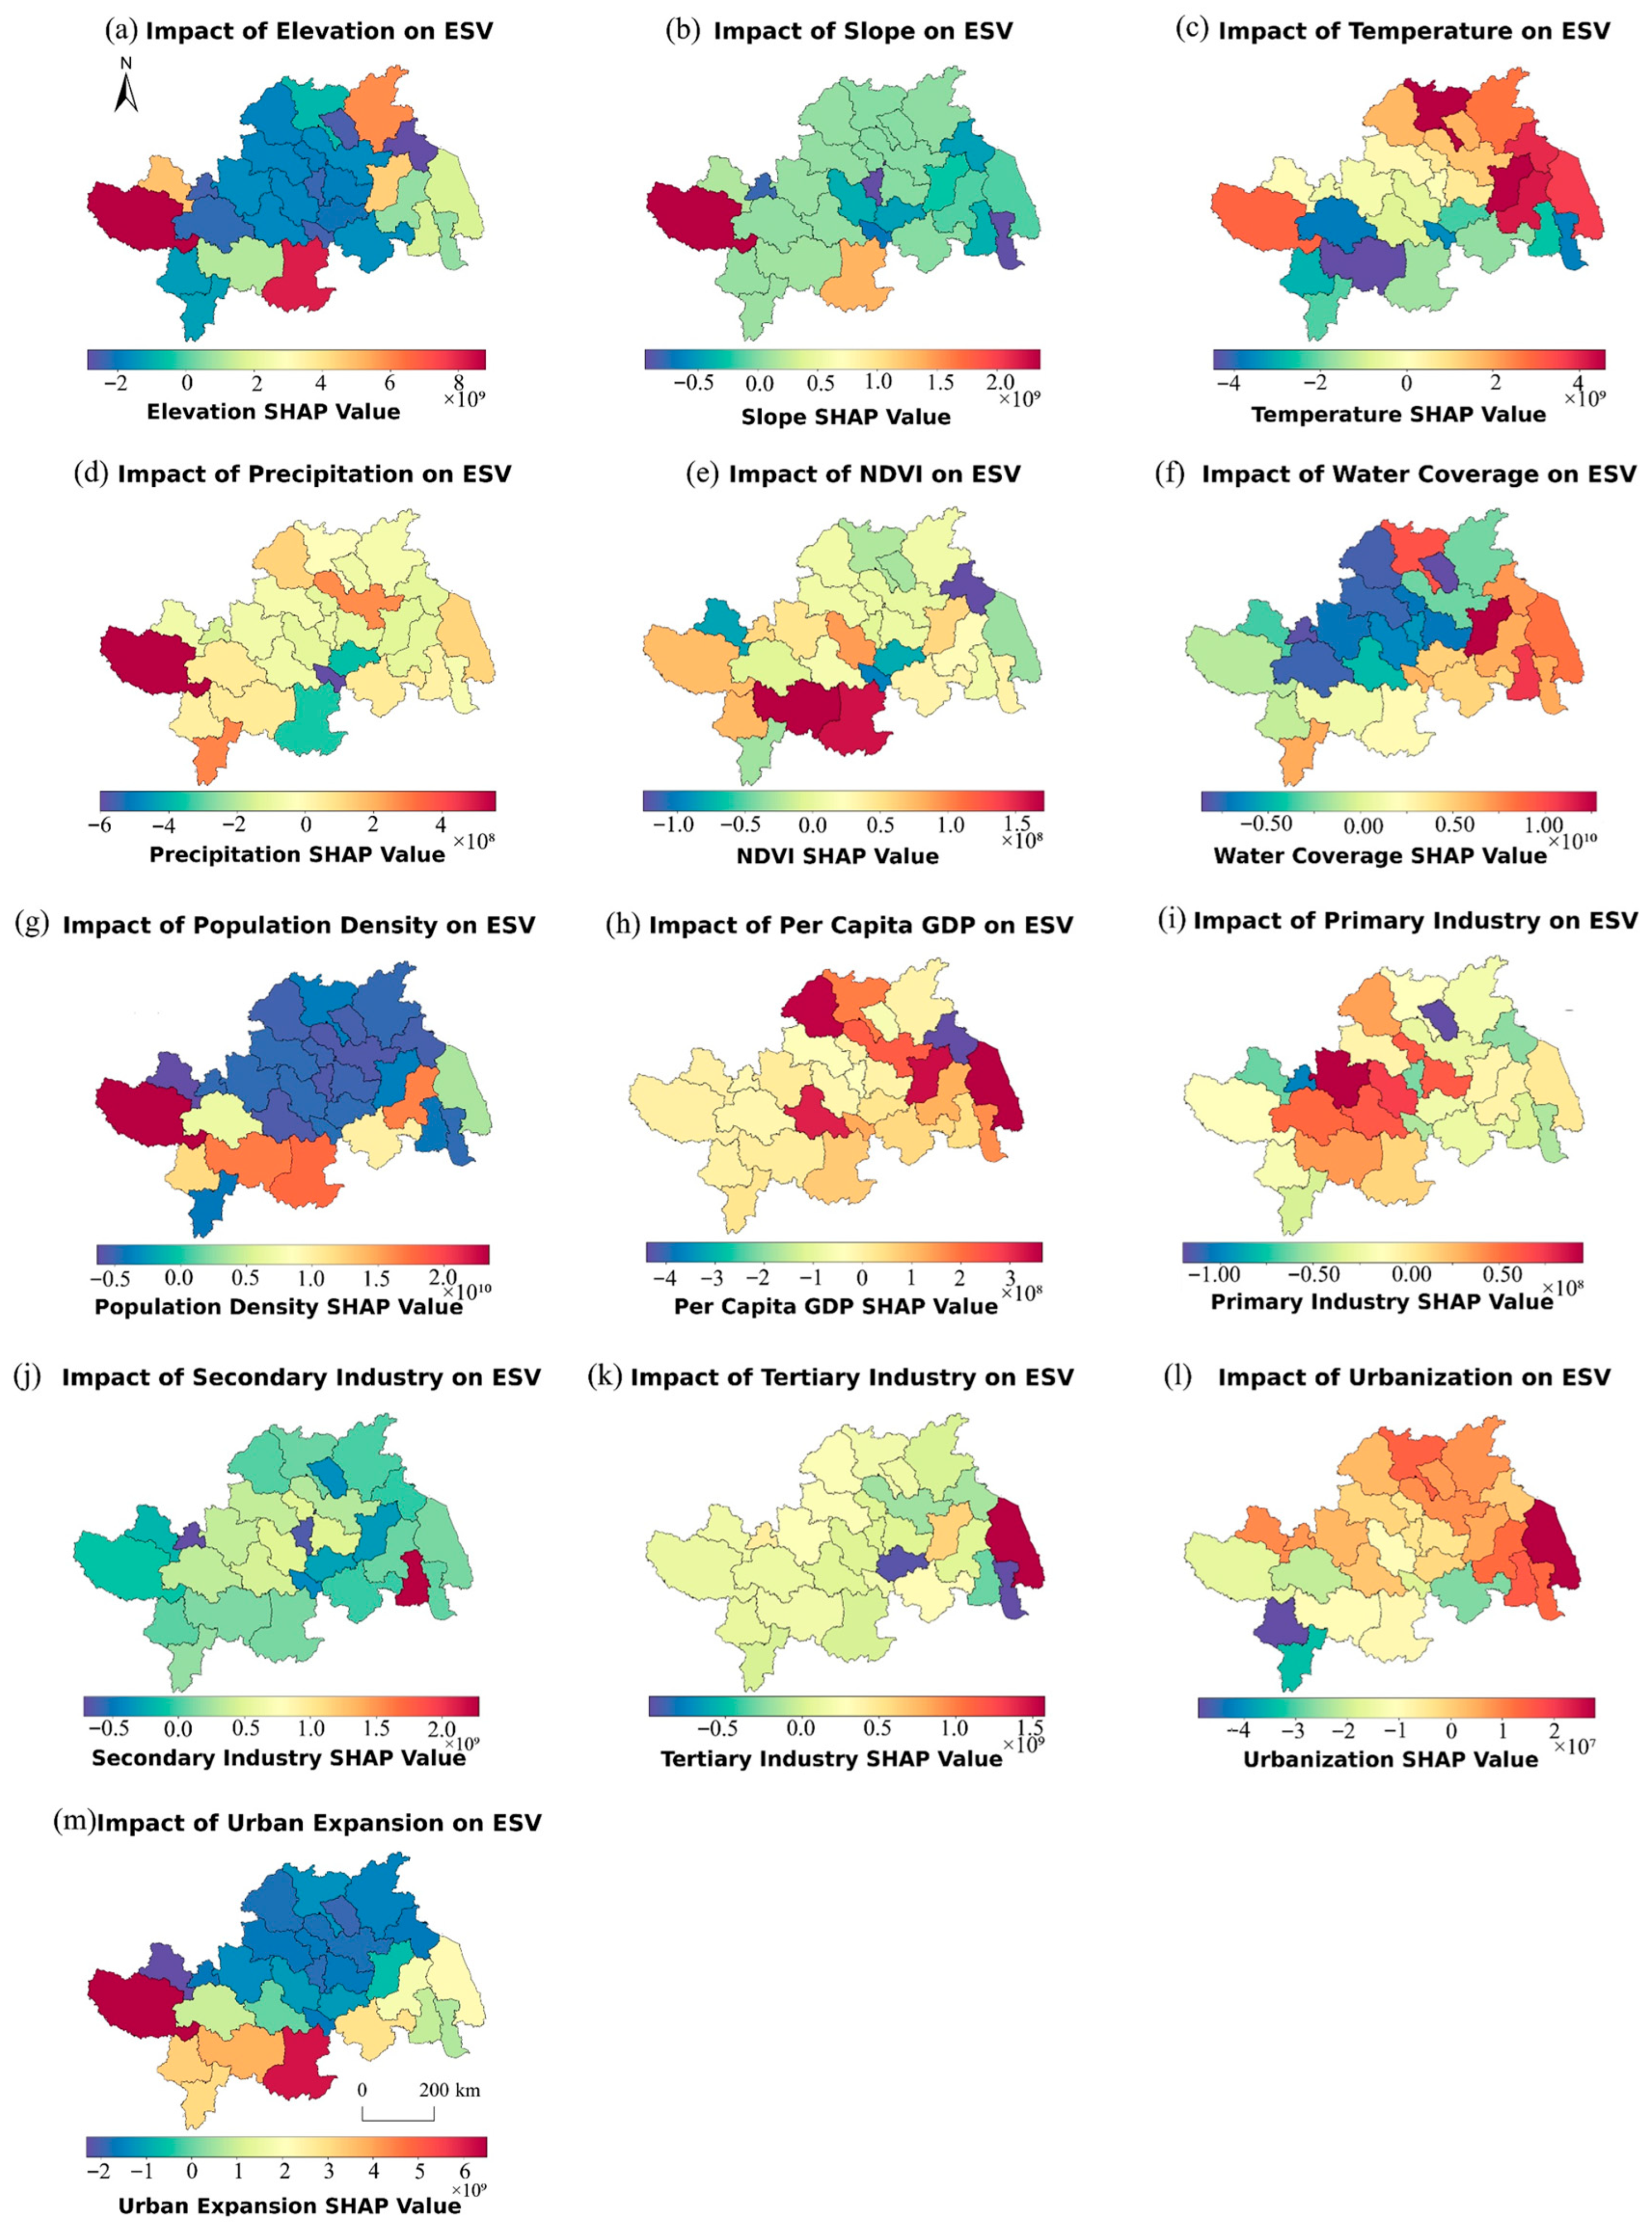
The effects of natural background factors on ESV present obvious topographic–hydrological gradient differences (Figure 8a–f). Regarding the spatial differentiation of elevation: in the upstream mountainous and hilly areas of the Huaihe River (e.g., Xinyang and Nanyang in southern Henan), SHAP values are mostly in the red high-value interval, indicating that the increase in elevation restricts human development activities, enhances the integrity of natural ecosystems (forest land, grassland), and exerts a significant positive promoting effect on ESV; while in the downstream plain areas (e.g., Xuzhou and Huai’an in northern Jiangsu), SHAP values are predominantly blue-green, and intensive development brought by low elevation occupies ecological space, resulting in a negative inhibitory effect on ESV.
For the spatial differentiation of slope, it follows the same action logic as elevation: in the hilly areas of western Anhui (e.g., parts of Lu’an), the slope is relatively large, SHAP values are biased red, the retention of natural ecosystems is high, and it provides positive support for ESV; in the low-slope areas of the downstream plain, SHAP values are biased blue-green, the development intensity is high, and it inhibits ESV. Regarding the spatial differentiation of temperature: in the high-temperature areas of northern Jiangsu in the downstream, SHAP values are mostly in the blue-green negative interval, where high temperature intensifies water evaporation and weakens vegetation productivity, forming an inhibitory effect on ESV; while in the moderate-temperature areas of southern Henan in the upstream, SHAP values are biased red, and thermal conditions are suitable for vegetation growth, exerting a certain promoting effect on ESV. For the spatial differentiation of water coverage: in the Anhui section along the main stream of the Huaihe River (e.g., Bengbu and Fuyang), water coverage is high, SHAP values are in the red high-value interval, service functions such as water resource regulation and aquatic biological habitat provision are prominent, and the positive promoting effect on ESV is significant; in inland areas far from the river channel, SHAP values are biased blue, the scarcity of water resources weakens ecological service capacity, resulting in a negative impact on ESV.
The effects of human–economic factors on ESV reflect socioeconomic development gradient differences (Figure 8g–m). Regarding the spatial differentiation of population density: in the high-population-density areas of northern Jiangsu in the downstream (e.g., the main urban areas of Xuzhou and Lianyungang), SHAP values are predominantly blue-green, and problems such as construction land expansion and intensified resource consumption caused by excessive agglomeration exert a negative inhibitory effect on ESV; while in the moderate-population-density areas of central Anhui in the middle reaches, SHAP values are biased red, and moderate population agglomeration drives investment in ecological protection facilities, making a positive contribution to ESV.
For the spatial differentiation of per capita GDP: in areas with high per capita GDP such as Huai’an and Yancheng in northern Jiangsu in the downstream, SHAP values are biased red, and economic support for ecological protection investment positively promotes ESV; in medium-level areas such as Chuzhou and Bengbu in central Anhui in the middle reaches, SHAP values fluctuate between yellow and orange, with a balance between ecological investment and development disturbance, resulting in a relatively neutral impact; in low-level areas such as Xinyang and Nanyang in southern Henan in the upstream, SHAP values are blue-green, and insufficient economic resources fail to cover ecological facilities, imposing a negative constraint on ESV.
Regarding the spatial differentiation of the proportion of the primary industry: in major agricultural product producing areas of the Huaihe River (e.g., Zhoukou and Shangqiu in Henan), the proportion of the primary industry is high, SHAP values are in the red high-value interval, and service functions such as grain supply and soil conservation of cropland form positive support for ESV; while in industry-dominated areas with an excessively low proportion of the primary industry, SHAP values are biased blue, exerting a negative impact on ESV. For the spatial differentiation of the proportion of the secondary industry: in industrial-intensive areas of northern Jiangsu (e.g., Suqian and Yancheng), the proportion of the secondary industry is high, SHAP values are blue-green negative, and problems such as industrial pollution and construction land occupation significantly weaken ESV; while in agriculture-dominated areas of eastern Henan with a low proportion of the secondary industry, SHAP values are biased red, resulting in weaker negative interference on ESV.
Regarding the spatial differentiation of the proportion of the tertiary industry: in areas with a high proportion of the tertiary industry such as Yangzhou and Nantong in Jiangsu in the downstream, SHAP values are biased red, with little disturbance from the tertiary industry and cultural and tourism enhancing service value, positively promoting ESV; in medium-proportion areas around Hefei in Anhui in the middle reaches, SHAP values transition between yellow and red, and the positive contribution is weaker than that in the downstream; in low-proportion areas such as Zhoukou and Shangqiu in Henan in the upstream, SHAP values are blue-green, and the narrow dimension of single agricultural services provides limited support for ESV.
For the spatial differentiation of urbanization: in areas with moderate urbanization such as Lu’an and Huainan in Anhui in the middle reaches, SHAP values are biased red, with supporting ecological facilities positively promoting ESV; in areas with excessive urbanization such as Xuzhou and Lianyungang in Jiangsu in the downstream, SHAP values are blue-green, and construction land occupies ecological space, exerting a negative inhibitory effect on ESV; in areas with low urbanization such as Zhumadian in Henan in the upstream, SHAP values are biased blue, and insufficient supporting facilities fail to exert ecological functions, imposing a negative constraint on ESV. Regarding the spatial differentiation of urban expansion: in areas with high urban expansion intensity in northern Jiangsu (e.g., the main urban area of Xuzhou), SHAP values are blue-green negative, and the occupation of cropland and wetlands by construction land directly reduces ESV; while in areas with moderate urban expansion in southern Anhui, SHAP values are biased red, and the supporting of urban ecological space (e.g., waterfront green spaces) improves ESV.
Overall, the spatial differentiation essentially corresponds to the regional pattern of “natural background support in the upstream and socioeconomic intervention in the downstream” in the HREEB. The upstream (southern Henan and western Anhui) relies on natural backgrounds such as terrain and water bodies, and the positive promoting effect of natural factors on ESV is prominent; the downstream (northern Jiangsu) is affected by socioeconomic development and development intensity, and the negative inhibitory effect of human–economic factors on ESV is more significant. This characteristic provides a quantitative basis for the HREEB to formulate zoned ecological regulation strategies of “protecting the ecological background in the upstream and adjusting development intensity in the downstream”.

4. Discussion

4.1. Comparison with Existing Relevant Studies

By constructing the XGBoost-SHAP coupled model, this study reveals the characteristics of ESV evolution in the HREEB. This evolution is driven by the nonlinear synergy of natural background and human–economic factors. Compared with existing studies, the conclusions of this study show significant progress. These advancements are particularly evident in driving mechanism analysis, spatial heterogeneity cognition, and method innovation. In terms of the spatiotemporal evolution law of ESV, this study found that the total ESV of the HREEB showed a fluctuating downward trend. Specifically, it followed a pattern of “first increasing and then decreasing” from 2000 to 2020 (Figure 5). This echoes the research findings on the Pearl River Delta urban agglomeration [12,28]. Generally, ESV in rapidly urbanized regions experiences a turning point from increase to decrease. However, a key difference exists. The ESV decline rate of the HREEB accelerated significantly from 2015 to 2020, reaching an annual decline rate of 4.81%. This rate was higher than that of the Pearl River Delta in the same period. This discrepancy reflects the severe ESV attenuation pressure faced by river basin-type regions. Such pressure arises from the superposition of ecological background vulnerability and high-intensity human activities [12,20]. At the level of driving mechanisms, this study identifies that population density has a nonlinear “first promoting and then inhibiting” effect on ESV (Figure 7c). This is consistent with the research results on Shanxi Province [30]. Moderate population agglomeration can drive ecological protection investment. Conversely, excessive agglomeration leads to intensified resource consumption. Notably, this study offers a new perspective on urban expansion. We found that urban expansion can slightly improve ESV in the low-intensity stage due to supporting ecological space (Figure 7d). However, high-intensity expansion leads to significant ESV attenuation. This finding breaks through the linear cognitive framework of traditional studies [9,11]. It is also consistent with the analysis conclusion of ESV driving factors in Zhejiang Province based on machine learning [32].
Regarding the role of natural factors, water coverage has a sustained positive promoting effect on ESV (Figure 7e), which is highly consistent with the evaluation conclusion of the ecological function of the Baiyangdian Wetland [26]. However, the elevation and slope factors in the HREEB highlight the role of ensuring the integrity of natural ecosystems while restricting human development intensity, which forms a regional difference with the comparative research results on the three major urban agglomerations in the Yangtze River Economic Belt—the topographic factors in the HREEB have a stronger constraint effect on ESV, reflecting the key supporting role of the ecological background of mountainous and hilly areas in the upper reaches of the river basin for ESV stability [37].
In terms of the spatial differentiation pattern, this study reveals an “upstream natural support–downstream socioeconomic intervention” model. This complements the research conclusions on the coordination relationship between ESV and economy in the Pearl River Delta [12,28]. The ESV in the Pearl River Delta is dominated by global economic factors. In contrast, the HREEB shows more significant “natural–human” gradient differentiation. This difference highlights the geographical particularity of the ESV driving mechanism in river basin-type regions [20,22].
At the methodological level, this study adopts the XGBoost-SHAP coupled model, overcoming the limitation of traditional linear models (such as GWR) in capturing the nonlinear relationships between factors [32,37], which is consistent with the research idea of using XGBoost–SHAP to predict forest temperature fields [42]. Compared with the practice of only using neural networks to predict ESV [35], this study further realizes the marginal effect decomposition and spatial visualization of driving factors, providing a replicable research paradigm for the mechanism analysis of ESV at the river basin scale.
In summary, on the basis of continuing the classic ESV assessment paradigm, this study deepens the understanding of the nonlinearity and spatial heterogeneity of the ESV driving mechanism in the HREEB through machine learning methods. The relevant findings not only form a dialog with existing studies but also highlight the particularity of ESV evolution in river basin-type regions and the differentiated needs of governance strategies.

4.2. Territorial Space Governance Effects

Policy factors are important forces driving the evolution of the territorial space pattern. They also influence the dynamic change in ESV in the HREEB. From 2000 to 2020, territorial space governance policies in different stages generated differentiated ecological–economic synergy effects. These policies guided the direction of land use transition and regulated development intensity. Their policy trajectories were highly correlated with the spatiotemporal evolution of ESV.
2000–2005: The national first round of the Grain for Green and Wetland Restoration Pilot Project was launched. Simultaneously, the Huaihe River small watershed ecological governance project was implemented [46]. Targeted ecological restoration subsidy policies were applied to address soil erosion in mountainous areas, such as southern Henan and western Anhui. These policies promoted the conversion of some sloping cropland to forest land and grassland. During this period, the annual average converted-out area of cropland reached 2547.06 km2. Of this area, more than 62% was converted to forest land and grassland (Figure 4). Consequently, the total regional ESV increased by 39.453 billion yuan, representing a growth rate of 7.10% (Figure 5). This marked the initial recovery of ecosystem services. The core goal of governance in this stage was to curb upstream ecological degradation. However, urbanization in the downstream northern Jiangsu Plain began to show signs of unordered expansion. This laid hidden dangers for subsequent ecological contradictions.
2005–2010: The Regulations on the Protection of Basic Farmland were revised, and the cropland balance policy was fully implemented [47]. As an important agricultural product producing area, the HREEB established a county-level cropland protection responsibility system. It also included the cropland preservation quantity into local government assessment indicators. As a result, the annual average converted-out area of cropland was reduced to 1892.31 km2. Additionally, the construction land expansion intensity decreased from 212.34 km2/a in the previous stage to 176.58 km2/a (Figure 4). Meanwhile, the special plan for water pollution prevention and control in the Huaihe River Basin was launched. This plan implemented ecological red line control on industrial and mining land along the river. To a certain extent, this slowed down the degradation of water ecological service functions. However, with the accelerated industrialization process, illegal conversion of cropland to industrial land still occurred in eastern Henan and northern Anhui. This led to a 2.15% decline in total ESV from 2005 to 2010 (Figure 5). This reflects that early territorial space governance focused on cropland quantity control but lacked sufficient attention to ecological function protection.
2010–2018: Regional policies such as the Central Plains Economic Zone Plan were issued [48,49]. Territorial space governance entered the “zonal guidance” stage. The eastern river–sea linkage region delineated ecological protection red lines for coastal wetlands. These lines strictly restricted reclamation and construction land occupation. The northern Huaihai Economic Zone strengthened the control of urban development boundaries. The central-western inland rising region promoted the construction of Dabie Mountain water conservation forests. Driven by these policies, the proportion of ecological land in the east and central-western regions increased by 3.2% and 4.7%, respectively. Consequently, the scope of high ESV zones tended to be stable. However, affected by urbanization policies, the annual average expansion intensity of construction land in the northern region rebounded to 238.62 km2/a (Figure 4). Furthermore, the proportion of cropland converted to construction land rose to 58%. This led to an expanded ESV decline rate of 2.99% from 2010 to 2015 (Figure 5). The spatial differentiation between development and protection within the region became increasingly obvious.
2018–2020: The Huaihe River Ecological Economic Belt Development Plan was officially implemented [50]. This plan established the overall territorial space development and protection pattern of “One Belt, Three Regions, Four Axes, and Multiple Growth Points”. It clarified the east as an ecological priority demonstration zone. The north was designated as a city-industry integration control zone. The central-western region became an ecological restoration core zone. Additionally, a cross-provincial ecological compensation and land use indicator coordination mechanism was established. After the implementation of the plan, the ecological protection investment in eastern coastal wetlands and central-western forest land increased by more than 40%. Thus, the stability of ESV in high-value zones was further enhanced. In the north, urban development boundaries were optimized. Construction land expansion was guided to transportation axes, curbing the unordered spread. As a result, the annual average expansion intensity of construction land from 2015 to 2020 decreased by 11.2% compared with the previous stage (Figure 4). Although the total ESV still decreased by 4.81% during this period, the trend of expanding decline was initially slowed down (Figure 5). Spatially, a differentiated pattern of “ecological protection quality improvement zones” and “development intensity control zones” was formed. This marks a shift in territorial space governance from passive control to active optimization. It lays a spatial foundation for the coordinated advancement of ESV improvement and high-quality development.

4.3. Policy Recommendations

Targeting the characteristics of land use transition and the fluctuating downward trend of ESV, this study proposes several countermeasures. These measures are based on the core impact mechanism of “natural background constraints-human–economic driving”. They also rely on the spatial differentiation law revealed by the XGBoost-SHAP model. The following spatial optimization and ecological protection strategies aim to promote regional ecological service functions and high-quality development:
Implement differentiated zonal management and control to consolidate the ecological service foundation. Relying on the regional pattern of “natural background support in the upstream and socioeconomic intervention in the downstream,” a three-level zonal management system should be constructed. For the central-western inland rising region (Xinyang, Lu’an, etc.), ecological red lines for Dabie Mountain water conservation forests must be delineated. The development of sloping cropland should be prohibited. Ecological compensation policies can promote the conversion of sloping cropland to forest land and grassland. This will increase the regional forest coverage rate and strengthen its core supporting role in ESV. For the eastern river–sea linkage region (Yancheng, Yangzhou, etc.), protection lines for coastal wetlands and the main stream of the Huaihe River must be strictly adhered to. A dynamic monitoring account of water coverage should be established to ensure the water area proportion remains stable. This will maintain water resource regulation and biological habitat supply services. For the northern Huaihai Economic Zone (Zhoukou, Shangqiu, etc.), the urban development boundary must be strictly controlled. The annual average expansion intensity of construction land should be limited. This will curb the occupation of cropland and wetlands and alleviate the expansion of extremely low-ESV zones.
Optimize the land use structure to balance development and protection. Targeting the land use characteristics of cropland being mainly converted out and construction land being mainly converted in, an optimization strategy is needed. This strategy should focus on “protecting cropland, controlling construction land, and increasing green space”. In major agricultural product producing areas, the cropland balance policy and the special protection system for permanent basic farmland must be implemented. High-standard farmland should be constructed to stabilize the cropland preservation quantity. This ensures food supply and soil conservation service functions. In urbanization core areas, the “compact city” and TOD (Transit-Oriented Development) models should be promoted. Construction land development intensity around rail stations must be controlled. Simultaneously, ecological spaces such as waterfront green spaces and pocket parks should be supported. This offsets the negative impact of urban expansion on ESV. Along the main stream and tributaries of the Huaihe River, projects like “construction withdrawal and wetland restoration” should be implemented. Adding ecological buffer zones will enhance the positive contribution of water-related ESV.
Targeted improvement of key ecological factors to enhance the resilience of service functions. Focusing on the core constraint effect of natural background factors on ESV, specific ecological quality improvement measures are required. For the water coverage factor, an ecological corridor network along the Huaihe River should be constructed. Key water patches, such as Yancheng Wetland and Bengbu Longzi Lake, need to be connected. Implementing water system connectivity projects will improve regional water resource regulation services. For the southern Henan mountainous and hilly areas with high elevation and slope, ecological restoration and closed hillsides for afforestation are necessary. Cultivating high-quality vegetation communities will increase the average NDVI of the region. This strengthens soil and water conservation and biodiversity services. For the northern Jiangsu Plain with high temperatures, farmland shelterbelt networks and wetland cooling systems should be promoted. These systems alleviate the inhibition of high temperatures on vegetation productivity and reduce their negative regulatory effect on ESV.
Regulate human–economic factors to realize ecological–economic synergy. In response to the nonlinear impact of human–economic factors, precise regulation must be implemented. In the central Anhui region, where population density is below the critical threshold, moderate population agglomeration should be guided. Supporting ecological protection facilities will leverage the positive promoting effect of population agglomeration on ESV. In the overcrowded urban areas of Xuzhou and Lianyungang, population relocation from core areas is necessary. This can be achieved through industrial relocation and new city construction, alleviating the pressure of construction land occupation. At the industrial structure level, the northern Huaihai Economic Zone should stabilize the proportion of the primary industry. This ensures the ecological service functions of cropland. The central and southern Jiangsu regions should promote the transformation of the secondary industry to green manufacturing. Reducing the proportion of high-energy-consuming industrial land is crucial. Simultaneously, increasing the proportion of the tertiary industry, focusing on low-carbon service industries, will reduce the disturbance of industrial development on ESV.
Construct an intelligent monitoring system to empower dynamic and precise governance. Relying on machine learning and spatial technology, a dynamic monitoring and early warning platform for ESV in the HREEB should be built. Integrating multi-source remote sensing data, land use data, and socioeconomic data is essential. An ESV prediction model based on the XGBoost-SHAP framework can realize quarterly assessments and trend predictions. Intelligent monitoring stations should be set up in expansion-sensitive northern areas and water protection core eastern areas. This allows for real-time monitoring of land use transitions and ESV changes. Establishing a cross-provincial ecological collaborative governance mechanism is also vital. Data sharing and joint early warnings among the involved provinces will ensure the implementation of countermeasures. Incorporating ESV into local government assessment indicators will promote the steady recovery of regional Ecosystem Service Value.

4.4. Limitations and Future Research

This study reveals the nonlinear relationship between ESV and driving factors through machine learning models. However, certain limitations remain. First, the impact of sudden factors, such as extreme climate events, on ESV was not considered. Second, the analysis of the long-term interaction between factors is still insufficient. Future research should combine multi-scenario simulation methods. This will help explore the evolution path of ESV under different development models. Consequently, it will provide a more forward-looking decision-making basis for territorial space optimization in the HREEB.

5. Conclusions

Taking the Huaihe River Ecological Economic Belt (HREEB) as the research area, this study systematically analyzed the evolution of land use, spatiotemporal characteristics of ESV, and their driving mechanisms from 2000 to 2020 using the XGBoost-SHAP coupled model. The main conclusions are as follows:
First, the land use structure of the HREEB is dominated by cropland, construction land, and forest land, collectively accounting for over 95% of the total area. Over the past two decades, land use transition exhibited distinct directional characteristics: cropland was continuously converted out, while construction land and forest land were the primary types converted in. This pattern strongly reflects the dual forces of rapid urbanization expansion and state-led ecological protection projects.
Second, the total ESV of the HREEB temporally exhibited a fluctuating downward trend of “first increasing and then decreasing,” reaching its peak in 2005 before declining continuously, with the attenuation rate accelerating in recent years. Spatially, the ESV demonstrated a corridor effect of decreasing from the river channel center to both banks. High-value zones remained stably clustered in the eastern river–sea linkage region and the central-western inland rising region, while extremely low-value zones expanded significantly in construction-intensive northern areas.
Third, the evolution of ESV is driven by the synergistic interaction of natural background constraints and human–economic interventions. Natural factors such as elevation, slope, and water coverage act as fundamental baseline constraints. In contrast, human–economic factors including population density and urban expansion dominate the spatiotemporal fluctuations of ESV. Specifically, human–economic factors exhibit complex nonlinear effects, with population density showing a “first promoting and then inhibiting” threshold effect. Spatially, factor impacts form a distinct pattern of “natural background support in the upstream and socioeconomic intervention in the downstream,” providing a quantitative basis for implementing zoned ecological management strategies.

Author Contributions

Conceptualization, Z.Z. and X.L.; methodology, X.Z.; software, Z.Z.; validation, X.L. and Z.Z.; formal analysis, X.L., X.Z. and Z.Z.; investigation, X.L.; resources, Z.Z.; data curation, X.Z.; writing—original draft preparation, Z.Z., X.Z. and X.L.; writing—review and editing, X.L.; visualization, X.L. and Z.Z.; supervision, C.Z. and X.Z.; project administration, C.Z.; funding acquisition, C.Z. All authors have read and agreed to the published version of the manuscript.

Funding

This research received no external funding.

Data Availability Statement

The raw data supporting the conclusions of this article will be made available by the authors on request.

Conflicts of Interest

The authors declare no conflict of interest.

References

  1. Han, B.; Jin, X.; Wang, J.; Yin, Y.; Liu, C.; Sun, R.; Zhou, Y. Identifying inefficient urban land redevelopment potential for evidence-based decision making in China. Habitat Int. 2022, 128, 102661. [Google Scholar] [CrossRef] [Scilit]
  2. Aghaloo, K.; Sharifi, A. Balancing priorities for a sustainable future in cities: Land use change and urban ecosystem service dynamics. J. Environ. Manag. 2025, 382, 125460. [Google Scholar] [CrossRef] [Scilit]
  3. Schaub, S.; El Benni, N.; Jan, P.; Huguenin-Elie, O.; Richter, F.; Klaus, V.H. Optimizing land-use strategies to improve grassland multifunctionality. Land Use Policy 2025, 153, 107548. [Google Scholar] [CrossRef] [Scilit]
  4. Kankam, S.; Koo, H.; Inkoom, N.J.; Fürst, C. Modeling coastal land use scenario impacts on ecosystem services restoration in Southwest Ghana, West Africa. npj Ocean Sustain. 2025, 4, 13. [Google Scholar] [CrossRef] [Scilit]
  5. Mashizi, K.A.; Sharafatmandrad, M. Management of soil-related ecosystem services in semi-arid regions of Iran using key environmental drivers. J. Environ. Manag. 2025, 381, 125181. [Google Scholar] [CrossRef] [Scilit]
  6. Crossman, D.N.; Connor, D.J.; Bryan, A.B.; David, M.S.; John, G. Reconfiguring an irrigation landscape to improve provision of ecosystem services. Ecol. Econ. 2009, 69, 1031–1042. [Google Scholar] [CrossRef] [Scilit]
  7. Rosa, L.D.; Barbarossa, L.; Privitera, R.; Francesco, M. Agriculture and the city: A method for sustainable planning of new forms of agriculture in urban contexts. Land Use Policy 2014, 41, 290–303. [Google Scholar] [CrossRef] [Scilit]
  8. Zhai, Y.; Li, W.; Shi, S.; Gao, Y.; Chen, Y.; Ding, Y. Spatio-temporal dynamics of ecosystem service values in China’s Northeast Tiger-Leopard National Park from 2005 to 2020: Evidence from environmental factors and land use/land cover changes. Ecol. Indic. 2023, 155, 110734. [Google Scholar] [CrossRef] [Scilit]
  9. Wang, Z.; Fu, H.; Liu, H.; Liao, C. Urban development sustainability, industrial structure adjustment, and land use efficiency in China. Sustain. Cities Soc. 2023, 89, 110734. [Google Scholar] [CrossRef] [Scilit]
  10. Wang, M.; Sun, X. Potential impact of land use change on ecosystem services in China. Environ. Monit. Assess. 2016, 188, 248. [Google Scholar] [CrossRef] [Scilit] [PubMed]
  11. Wu, K.; Ye, X.; Qi, Z.; Zhang, H. Impacts of land use/land cover change and socioeconomic development on regional ecosystem services: The case of fast-growing Hangzhou metropolitan area, China. Cities 2013, 31, 276–284. [Google Scholar] [CrossRef] [Scilit]
  12. Yao, H.; Zou, Z.; Zhu, Y.; Zhou, C. From pursuing quantity to pursuing quality: Exploring the coupling coordination and influencing factors of high-quality tourism development and ecosystem service value in the Pearl River Delta urban agglomeration of China. Front. Public Health 2025, 13, 1705088. [Google Scholar] [CrossRef] [Scilit]
  13. Arnold, C.; Wilson, E.; Hurd, J.; Civco, D. 30 Years of land cover change in Connecticut, USA: A case study of long-term research, dissemination of results, and their use in land use planning and natural resource conservation. Land 2020, 9, 255. [Google Scholar] [CrossRef] [Scilit]
  14. Vleeshouwers, L.M.; Verhagen, A. Carbon emission and sequestration by agricultural land use: A model study for Europe. Glob. Change Biol. 2002, 8, 519–530. [Google Scholar] [CrossRef] [Scilit]
  15. Kloiber, S.M.; Macleod, R.D.; Smith, A.J.; Knight, J.F.; Huberty, B.J. A semi-automated, multi-source data fusion update of a wetland inventory for east-central Minnesota, USA. Wetlands 2015, 35, 335–348. [Google Scholar] [CrossRef] [Scilit]
  16. Murakami, A.; Medrial Zain, A.; Takeuchi, K.; Tsunekawa, A.; Yokota, S. Trends in urbanization and patterns of land use in the Asian mega cities Jakarta, Bangkok, and Metro Manila. Landsc. Urban Plan. 2003, 70, 251–259. [Google Scholar] [CrossRef] [Scilit]
  17. Zou, Z.; Zhao, X.; Liu, S.; Zhou, C. Driving forces and future scenario simulation of urban agglomeration expansion in China: A case study of the Pearl River Delta Urban Agglomeration. Remote Sens. 2025, 17, 2455. [Google Scholar] [CrossRef] [Scilit]
  18. Li, Z.; Jiang, W.; Wang, W.; Lei, X.; Deng, Y. Exploring spatial-temporal change and gravity center movement of construction land in the Chang-Zhu-Tan urban agglomeration. J. Geogr. Sci. 2019, 29, 1363–1380. [Google Scholar] [CrossRef] [Scilit]
  19. Ye, B.; Huang, F.; Zhang, S.; Zhang, Y. The driving forces of land use/cover change in the upstream area of the Nenjiang River. Chin. Geogr. Sci. 2001, 11, 377–381. [Google Scholar] [CrossRef] [Scilit]
  20. Li, C.; Wu, Y.; Qiu, B.; Li, Y.; Ning, L.; Wang, H.; Liu, L.; Ma, J. Study on dynamic changes in land use and ecosystem service value in the Huaihe River ecological economic belt based on multi-scenario simulations. Front. Environ. Sci. 2025, 13, 1617829. [Google Scholar] [CrossRef] [Scilit]
  21. Yi, H.; Güneralp, B.; Filippi, A.M.; Kreuter, U.P.; Güneralp, İ. Impacts of land change on ecosystem services in the San Antonio River Basin, Texas, from 1984 to 2010. Ecol. Econ. 2017, 135, 125–135. [Google Scholar] [CrossRef] [Scilit]
  22. Xiao, Y.; Huang, M.; Xie, G.; Zhen, L. Evaluating the impacts of land use change on ecosystem service values under multiple scenarios in the Hunshandake region of China. Sci. Total Environ. 2022, 850, 158067. [Google Scholar] [CrossRef] [Scilit] [PubMed]
  23. Pinillos, D.; Bianchi, F.J.; Poccard-Chapuis, R.; Corbeels, M.; Tittonell, P.; Schulte, R.P. Understanding landscape multifunctionality in a post-forest frontier: Supply and demand of ecosystem services in eastern Amazonia. Front. Environ. Sci. 2020, 7, 206. [Google Scholar] [CrossRef] [Scilit]
  24. Moustakas, A.; Christoforidi, I.; Zittis, G.; Demirel, N.; Fois, M.; Zotos, S.; Gallou, E.; Stamatiadou, V.; Tzirkalli, E.; Zoumides, C.; et al. The land use–climate change–biodiversity nexus in the perceptions of European islands stakeholders. Environ. Impact Assess. Rev. 2026, 117, 108199. [Google Scholar] [CrossRef] [Scilit]
  25. Xie, G.D.; Zhang, C.X.; Zhang, L.M.; Chen, W.H.; Li, M.S. Improvement of the valuation method of ecosystem service value based on unit area value equivalent factor. J. Nat. Resour. 2015, 30, 1243–1254. (In Chinese) [Google Scholar]
  26. Zhu, J.F.; Zhou, Y.; Wang, S.X.; Wang, L.T.; Liu, W.L.; Li, H.T.; Mei, J.J. Evaluation and zoning of wetland ecological functions in Baiyangdian. Acta Ecol. Sin. 2020, 40, 459–472. (In Chinese) [Google Scholar]
  27. Liu, M.; Jia, Y.; Zhao, J.; Shen, Y.; Pei, H.; Zhang, H.; Li, Y. Revegetation projects significantly improved ecosystem service values in the agro-pastoral ecotone of northern China in recent 20 years. Sci. Total Environ. 2021, 788, 147756. [Google Scholar] [CrossRef] [Scilit]
  28. Zou, Z.; Yuan, X.; Zhang, Z.; Li, X.; Zhou, C. Spatio-temporal evolution and influencing factors of coupling and coordination between the ecosystem service value and economy in the Pearl River Delta Urban Agglomeration of China. Land 2024, 13, 1670. [Google Scholar] [CrossRef] [Scilit]
  29. Qiao, H.; Kang, Y.; Niu, Y. Spatio-temporal dynamics and driving factors of ecosystem services value in Lanzhou City, China. Sci. Rep. 2024, 14, 26562. [Google Scholar] [CrossRef] [Scilit]
  30. Hu, B.; Kang, F.; Han, H.; Cheng, X.; Li, Z. Exploring drivers of ecosystem services variation from a geospatial perspective: Insights from China’s Shanxi Province. Ecol. Indic. 2021, 131, 108188. [Google Scholar] [CrossRef] [Scilit]
  31. Xue, S.; Yao, L.; Xu, Y.; Li, C. Spatio-temporal dynamics and driving factors of ecosystem services in the Yellow River Delta, China. Sustainability 2024, 16, 3466. [Google Scholar] [CrossRef] [Scilit]
  32. Xu, X.; Yu, J.; Wang, F. Analysis of ecosystem service drivers based on interpretive machine learning: A case study of Zhejiang Province, China. Environ. Sci. Pollut. Res. 2022, 29, 64060–64076. [Google Scholar] [CrossRef] [Scilit]
  33. Yang, M.; Chen, A.; Cao, W.; Wang, S.; Xu, M.; Gu, Q.; Wang, Y.; Yang, X. Spatial and temporal patterns of grassland species diversity and their driving factors in the Three Rivers Headwater Region of China from 2000 to 2021. Remote Sens. 2024, 16, 4005. [Google Scholar] [CrossRef] [Scilit]
  34. Silva, J.; Santos, J.; Ribeiro, P.; Marta-Pedroso, C.; Magalhães, M.; Moreira, F. A farming systems approach to assess synergies and trade-offs among ecosystem services. Ecosyst. Serv. 2024, 65, 101591. [Google Scholar] [CrossRef] [Scilit]
  35. Hossain, N.U.I.; Fattah, M.A.; Morshed, S.R.; Jaradat, R. Predicting land cover driven ecosystem service value using artificial neural network model. Remote Sens. Appl. Soc. Environ. 2024, 34, 101180. [Google Scholar] [CrossRef] [Scilit]
  36. Huang, Y.; Wu, J. Spatial and temporal driving mechanisms of ecosystem service trade-off/synergy in national key urban agglomerations: A case study of the Yangtze River Delta urban agglomeration in China. Ecol. Indic. 2023, 154, 110800. [Google Scholar] [CrossRef] [Scilit]
  37. Luo, Q.; Zhou, J.; Li, Z.; Yu, B. Spatial differences of ecosystem services and their driving factors: A comparison analysis among three urban agglomerations in China’s Yangtze River Economic Belt. Sci. Total Environ. 2020, 725, 138452. [Google Scholar] [CrossRef] [Scilit] [PubMed]
  38. Xiong, S.; Yang, F.; Fan, H.; Zhang, J. Multiscale coordination dynamics in large freshwater lake basin ecosystems: Machine learning reveals spatiotemporal variations and driving mechanisms of risk–quality–service process interactions. Ecol. Indic. 2025, 180, 114381. [Google Scholar] [CrossRef] [Scilit]
  39. You, M.; Zou, Z.; Zhao, W.; Zhang, W.; Fu, C. Study on land use and landscape pattern change in the Huaihe River Ecological and economic zone from 2000 to 2020. Heliyon 2023, 9, e13430. [Google Scholar] [CrossRef] [Scilit]
  40. Zou, Z.D. Impact of Land Use Change on Ecosystem Service Value in the Huaihe River Ecological Economic Zone. Master’s Thesis, Henan University, Kaifeng, China, 2023. [Google Scholar]
  41. Kang, D.C. Nonlinear and spatial effects of urban form on building electricity consumption in Seoul, South Korea: Urban morphometric and XGBoost approaches. Cities 2026, 170, 106624. [Google Scholar] [CrossRef] [Scilit]
  42. Ghafarian, F.; Wieland, R.; Lüttschwager, D.; Nendel, C. Application of extreme gradient boosting and Shapley additive explanations to predict temperature regimes inside forests from standard open-field meteorological data. Environ. Model. Softw. 2022, 156, 105466. [Google Scholar] [CrossRef] [Scilit]
  43. Zhang, L.; Zhang, X.; Gao, S.; Gu, X. Revealing nonlinear relationships and thresholds of human activities and climate change on ecosystem services in Anhui Province based on the XGBoost–SHAP model. Sustainability 2025, 17, 8728. [Google Scholar] [CrossRef] [Scilit]
  44. Wang, X.; Zhao, X.; He, C.; Huang, P.; Ran, Y.; Ye, X.; Zhou, Y.; Wu, B.; Qu, G. An integrated multi-model approach reveals the nonlinear driving mechanisms of the ecosystem services supply-demand balance: Towards sustainable ecological management. Environ. Sustain. Indic. 2026, 29, 101058. [Google Scholar] [CrossRef] [Scilit]
  45. ArunKumar, K.E.; Blake, N.E.; Walker, M.; Yost, T.J.; Mata-Padrino, D.; Holásková, I.; Yates, J.W.; Hatton, J.; Wilson, M.E. Predicting dry matter intake in cattle at scale using gradient boosting regression techniques and Gaussian process boosting regression with SHAP explainable AI, MLflow and its containerization. J. Anim. Sci. 2025, 103, skaf041. [Google Scholar] [CrossRef] [Scilit] [PubMed]
  46. Several Opinions of the State Council on Further Doing a Good Job in the Pilot Work of Returning Farmland to Forests and Grasslands. Available online: https://www.gov.cn/gongbao/content/2000/content_60486.htm (accessed on 3 March 2026).
  47. The Regulations on the Protection of Basic Farmland. Available online: https://xzfg.moj.gov.cn/front/law/detail?LawID=1218 (accessed on 3 March 2026).
  48. Central Plains Economic Zone Plan (2012–2020). Available online: https://www.ndrc.gov.cn/xxgk/zcfb/ghwb/201402/P020190905497699586084.pdf (accessed on 3 March 2026).
  49. Guiding Opinions of the State Council on Supporting Henan Province in Accelerating the Construction of the Central Plains Economic Zone. Available online: https://www.gov.cn/zwgk/2011-10/07/content_1963574.htm (accessed on 1 March 2026).
  50. The Huaihe River Ecological Economic Belt Development Plan. Available online: https://www.ndrc.gov.cn/xxgk/zcfb/ghwb/201811/W020190905497962318984.pdf (accessed on 3 March 2026).
Figure 1. Location map of the research area. Drawing review No: GS(2024)0650.
Land 15 00466 g001
Figure 2. The workflow of this study.
Land 15 00466 g002
Figure 3. Temporal changes in the area of different land use types in the HREEB from 2000 to 2020.
Land 15 00466 g003
Figure 4. Land use area transfer in the HREEB from 2000 to 2020.
Land 15 00466 g004
Figure 5. Temporal trends and fluctuation characteristics of the total ESV of the HREEB from 2000 to 2020.
Land 15 00466 g005
Figure 6. Spatial distribution patterns and grade changes in ESV in the HREEB for the years 2000, 2010, and 2020.
Land 15 00466 g006
Figure 7. Feature importance ranking (a), SHAP summary plots (b) and SHAP dependence plots (ch) illustrating the contribution of influencing factors to ESV.
Land 15 00466 g007
Figure 8. Spatial visualization of absolute SHAP values of influencing factors.
Land 15 00466 g008
Table 1. Data list.
Table 1. Data list.
Data NameData DescriptionData TypeTimeData Source
Administrative BoundaryAdministrative boundary vector data Vector Data2020National Geomatics Center of China (http://www.ngcc.cn/)
DEMDigital Elevation Model dataRaster Data2020USGS-SRTM (https://earthexplorer.usgs.gov/)
Land Use DataLand use data Raster Data2000, 2005, 2010, 2015, 2020Resource and Environmental Science Data Center, Chinese Academy of Sciences (http://www.resdc.cn)
Natural Environment DataIncluding annual average temperature, annual precipitation, NDVIRaster Data2000–2020China Meteorological Data Service Center; NASA MODIS (https://modis.gsfc.nasa.gov/); Huaihe River Water Conservancy Commission, Ministry of Water Resources
Socioeconomic Statistical DataIndicators such as population density, per capita GDP, and proportion of tertiary industries for driving factor analysisStatistical Data2000–2020Provincial and prefectural statistical yearbooks (Jiangsu, Anhui, Henan, Shandong, Hubei, etc.) (https://www.stats.gov.cn/sj/ndsj/)
NPP-VIIRS Nighttime Lights DataUsed to invert urbanization level as a proxy index for socioeconomic analysisRaster Data2000, 2010, 2020National Oceanic and Atmospheric Administration (NOAA) (https://www.noaa.gov/)
Table 2. Construction of the indicator system for driving factors of ESV in the HREEB.
CategoryIndicatorMeasurement MethodUnit
Natural FactorsElevation (X1)Average elevationm
Slope (X2)Annual average slopedegree (°)
Average Temperature (X3)Annual average temperature°C
Precipitation (X4)Annual average precipitationmm
NDVI (X5)Normalized Difference Vegetation Index value-
Water Coverage (X6)Proportion of water area%
Human–Economic FactorsPopulation Density (X7)Permanent population densityperson/m2
Per Capita GDP (X8)GDP/Permanent populationyuan/person
Proportion of Primary Industry (X9)Primary industry output/GDP%
Proportion of Secondary Industry (X10)Secondary industry output/GDP%
Proportion of Tertiary Industry (X11)Tertiary industry output/GDP%
Urbanization Level (X12)Nighttime light index-
Urban Expansion (X13)Proportion of construction land area%
Table 3. ESV coefficients per unit area in the HREEB ( 10 4   y u a n / ( k m 2 · a ) ).
First-Level TypeSecond-Level TypeCroplandForest LandGrasslandWater BodyConstruction LandUnused Land
Supply ServicesFood Production25.32 5.96 7.45 19.86 0.00 0.00
Raw Material Production7.45 13.65 11.17 5.71 0.00 0.00
Regulation ServicesWater Resource Supply−21.34 6.95 6.20 205.75 −186.39 0.00
Gas Regulation20.35 44.43 38.72 19.11 −60.06 0.50
Climate Regulation10.67 133.28 99.77 56.84 0.00 0.00
Environment Purification2.98 39.96 33.75 137.74 −61.05 2.48
Hydrological Regulation27.05 100.52 74.95 2537.48 0.00 0.74
Soil Conservation17.13 54.35 47.16 23.08 0.50 0.50
Supporting ServicesNutrient Cycle Maintenance3.47 99.77 3.72 1.74 0.00 0.00
Biodiversity Conservation3.97 4.22 42.94 63.29 8.44 0.50
Cultural ServicesEsthetic Landscape1.74 21.84 18.86 46.91 0.25 0.25
Disclaimer/Publisher’s Note: The statements, opinions and data contained in all publications are solely those of the individual author(s) and contributor(s) and not of MDPI and/or the editor(s). MDPI and/or the editor(s) disclaim responsibility for any injury to people or property resulting from any ideas, methods, instructions or products referred to in the content.