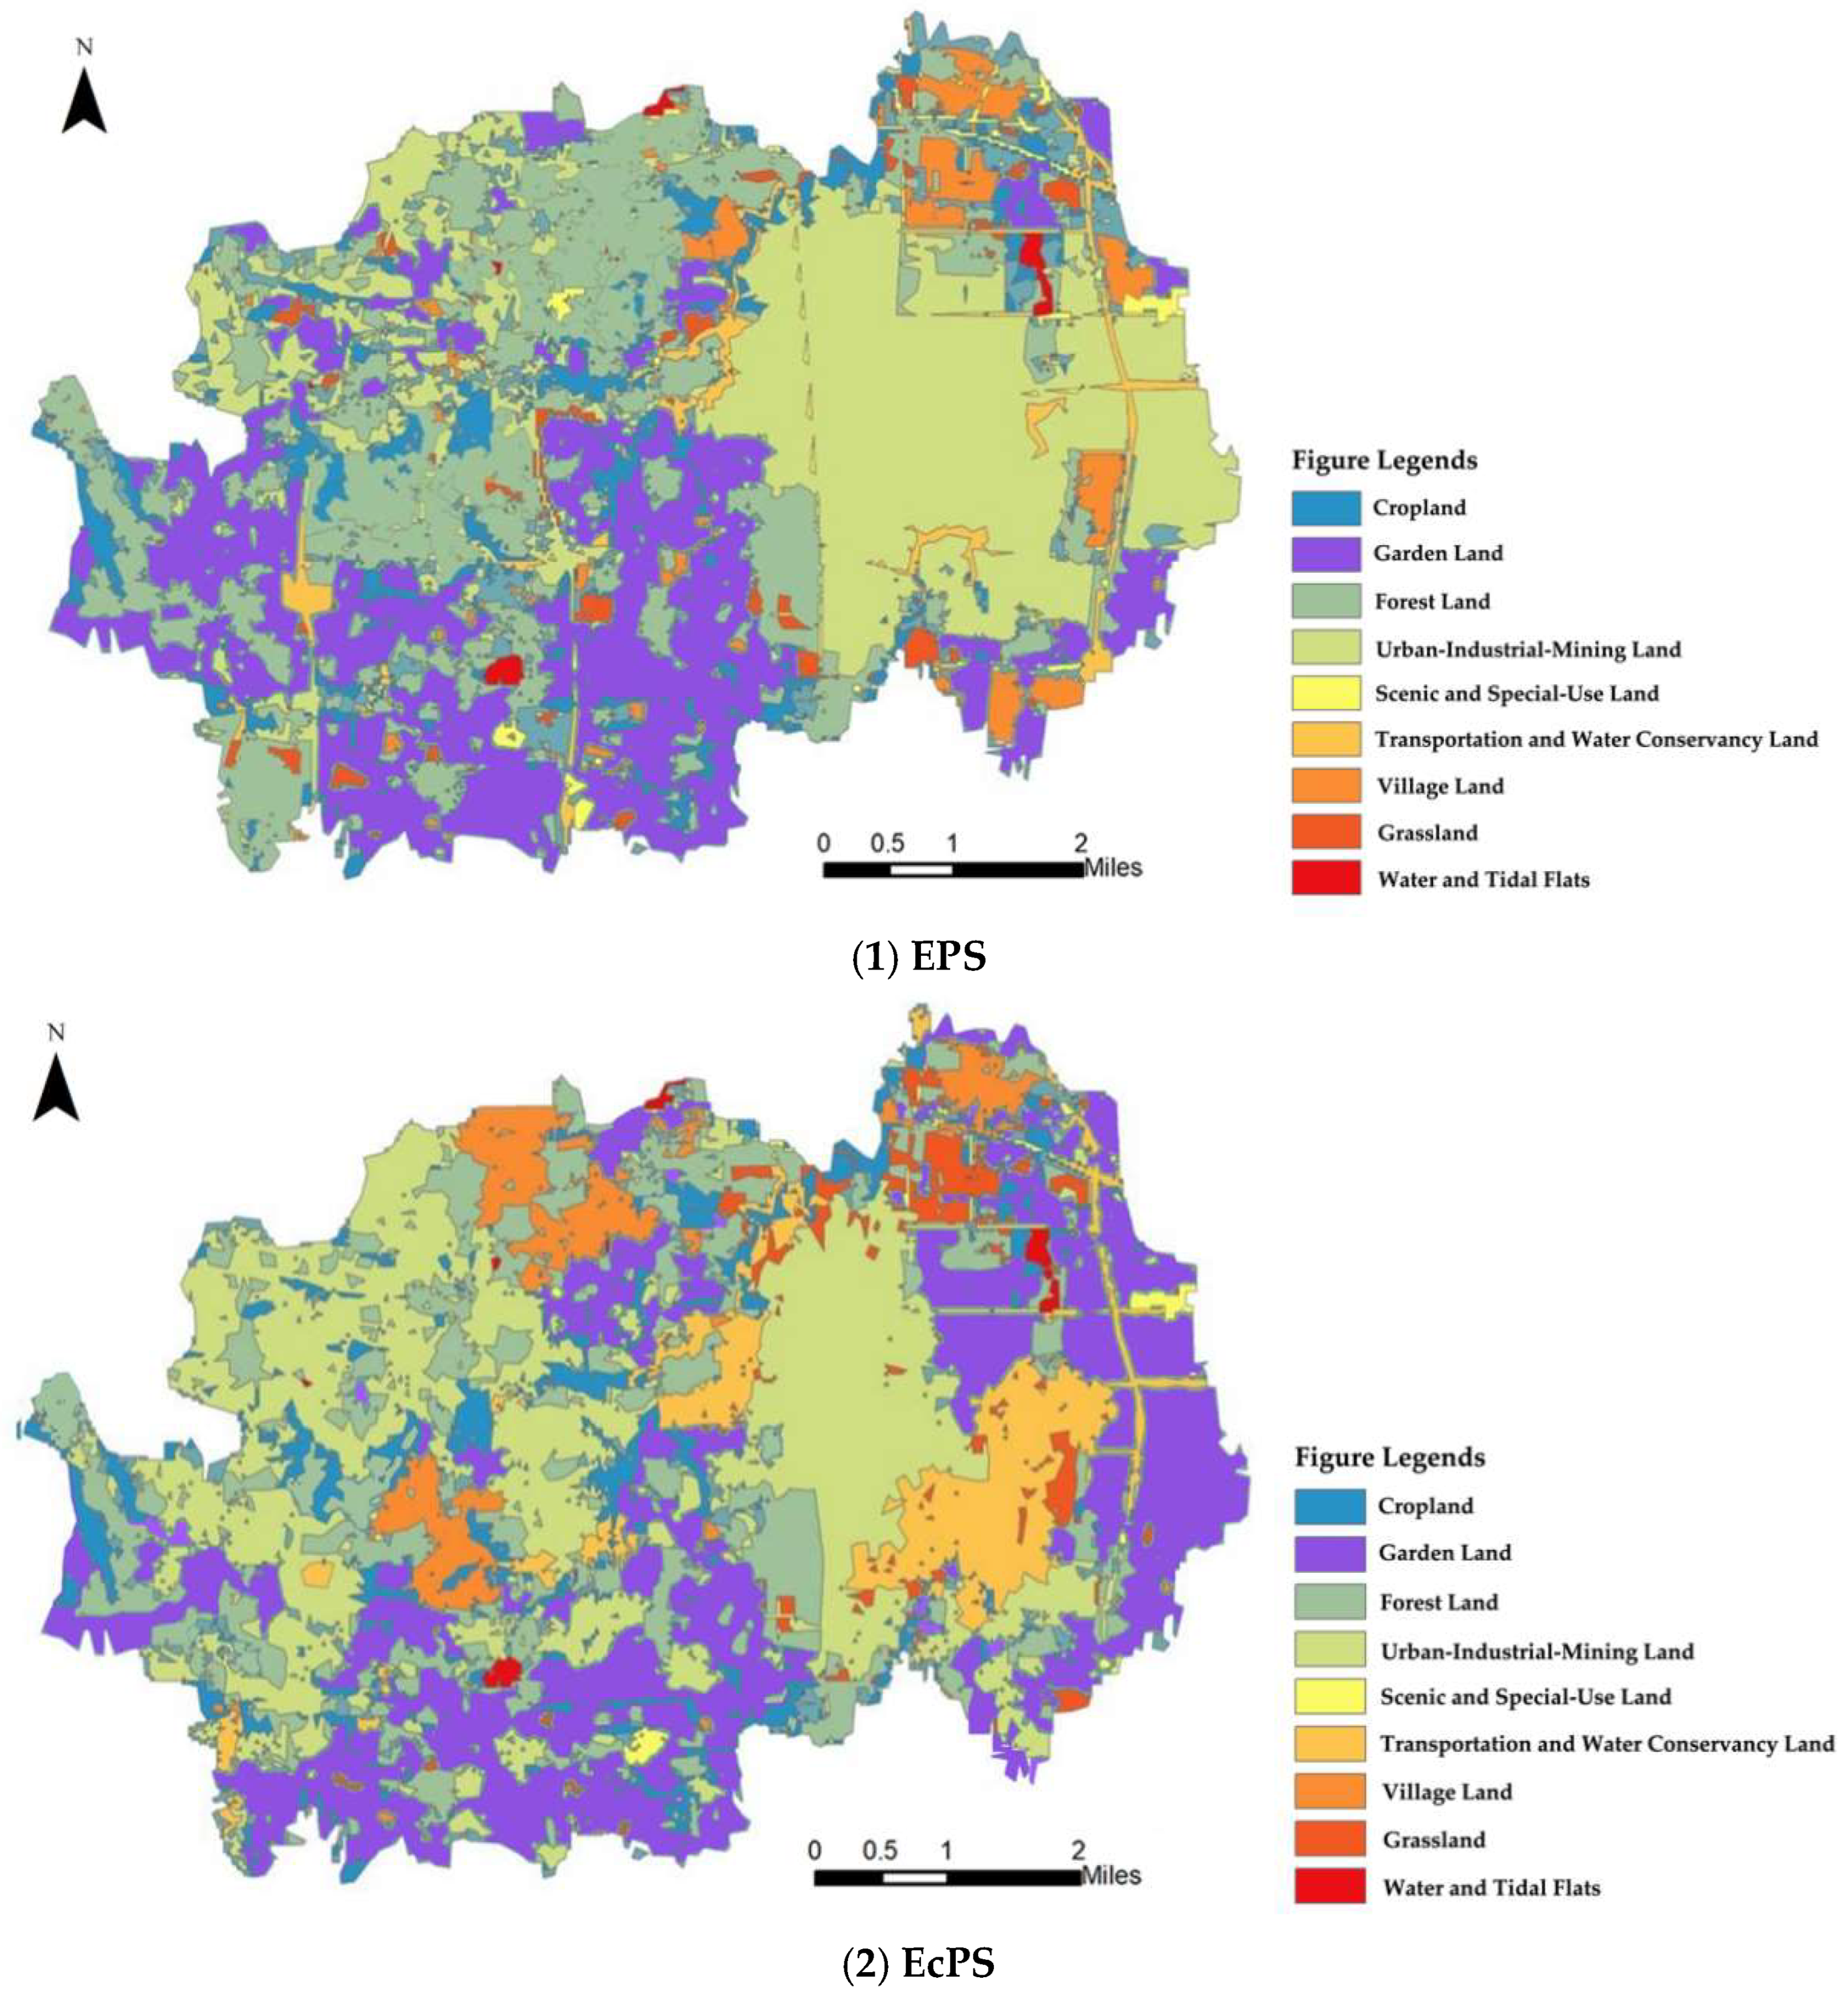
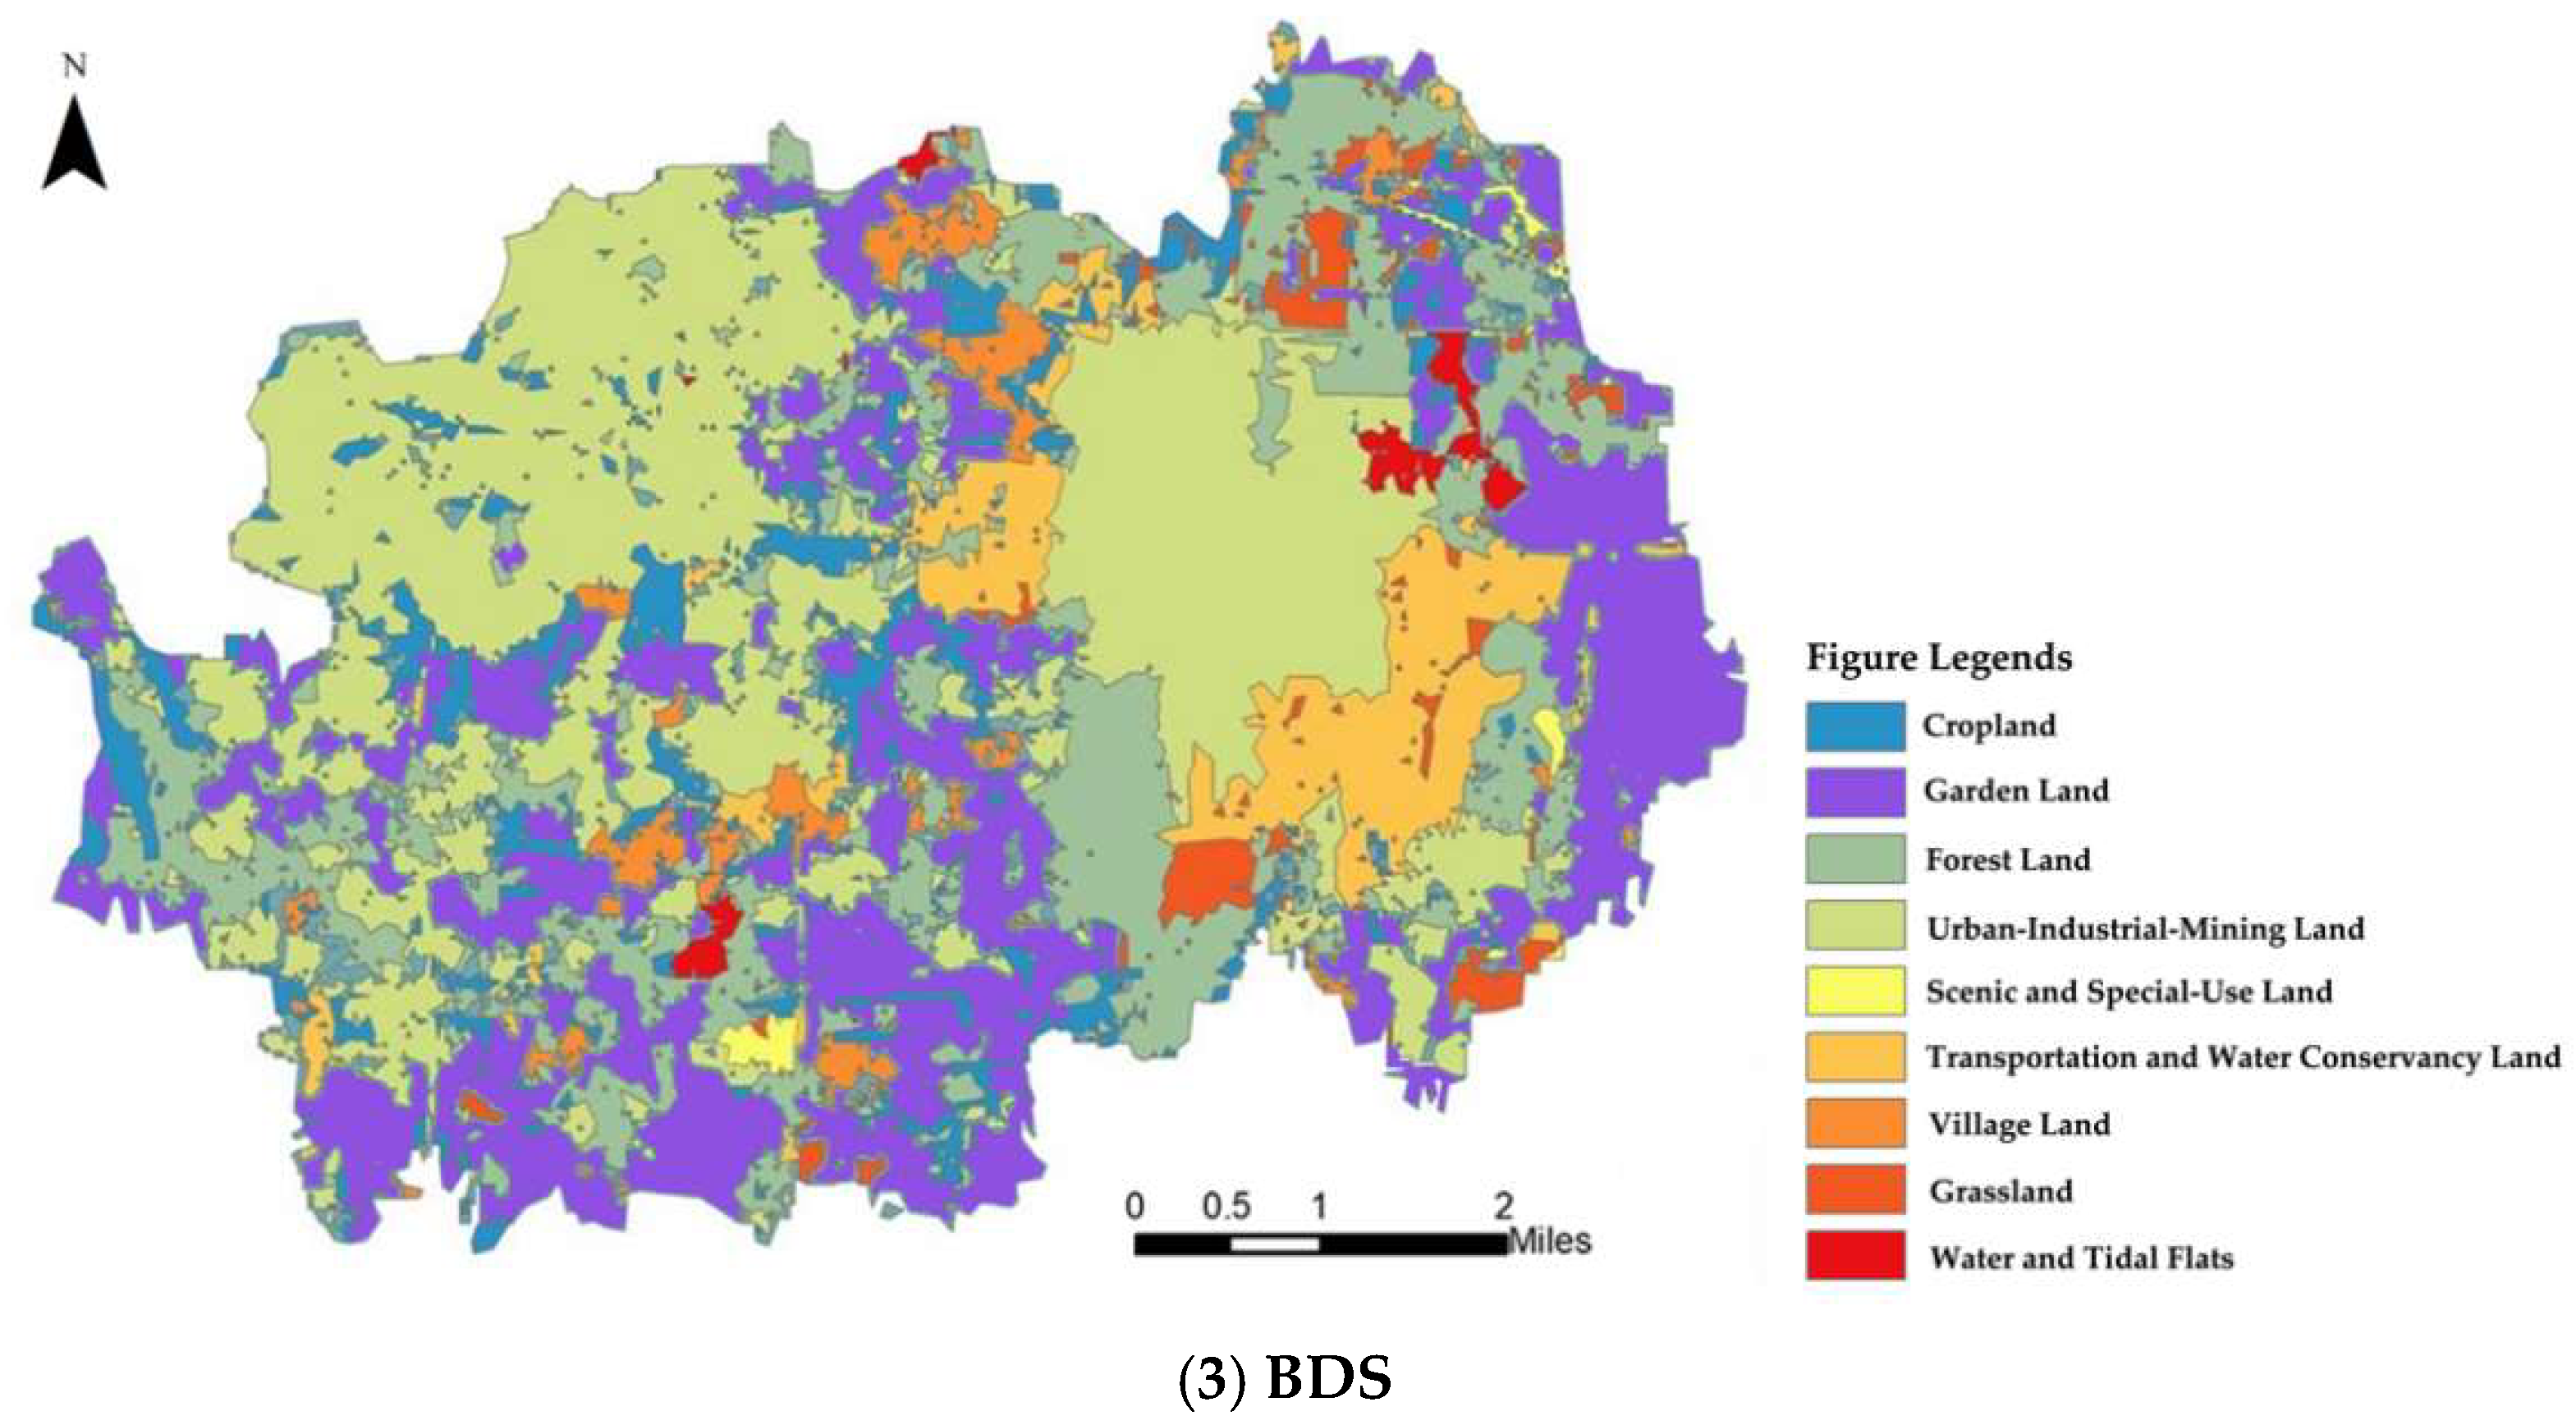
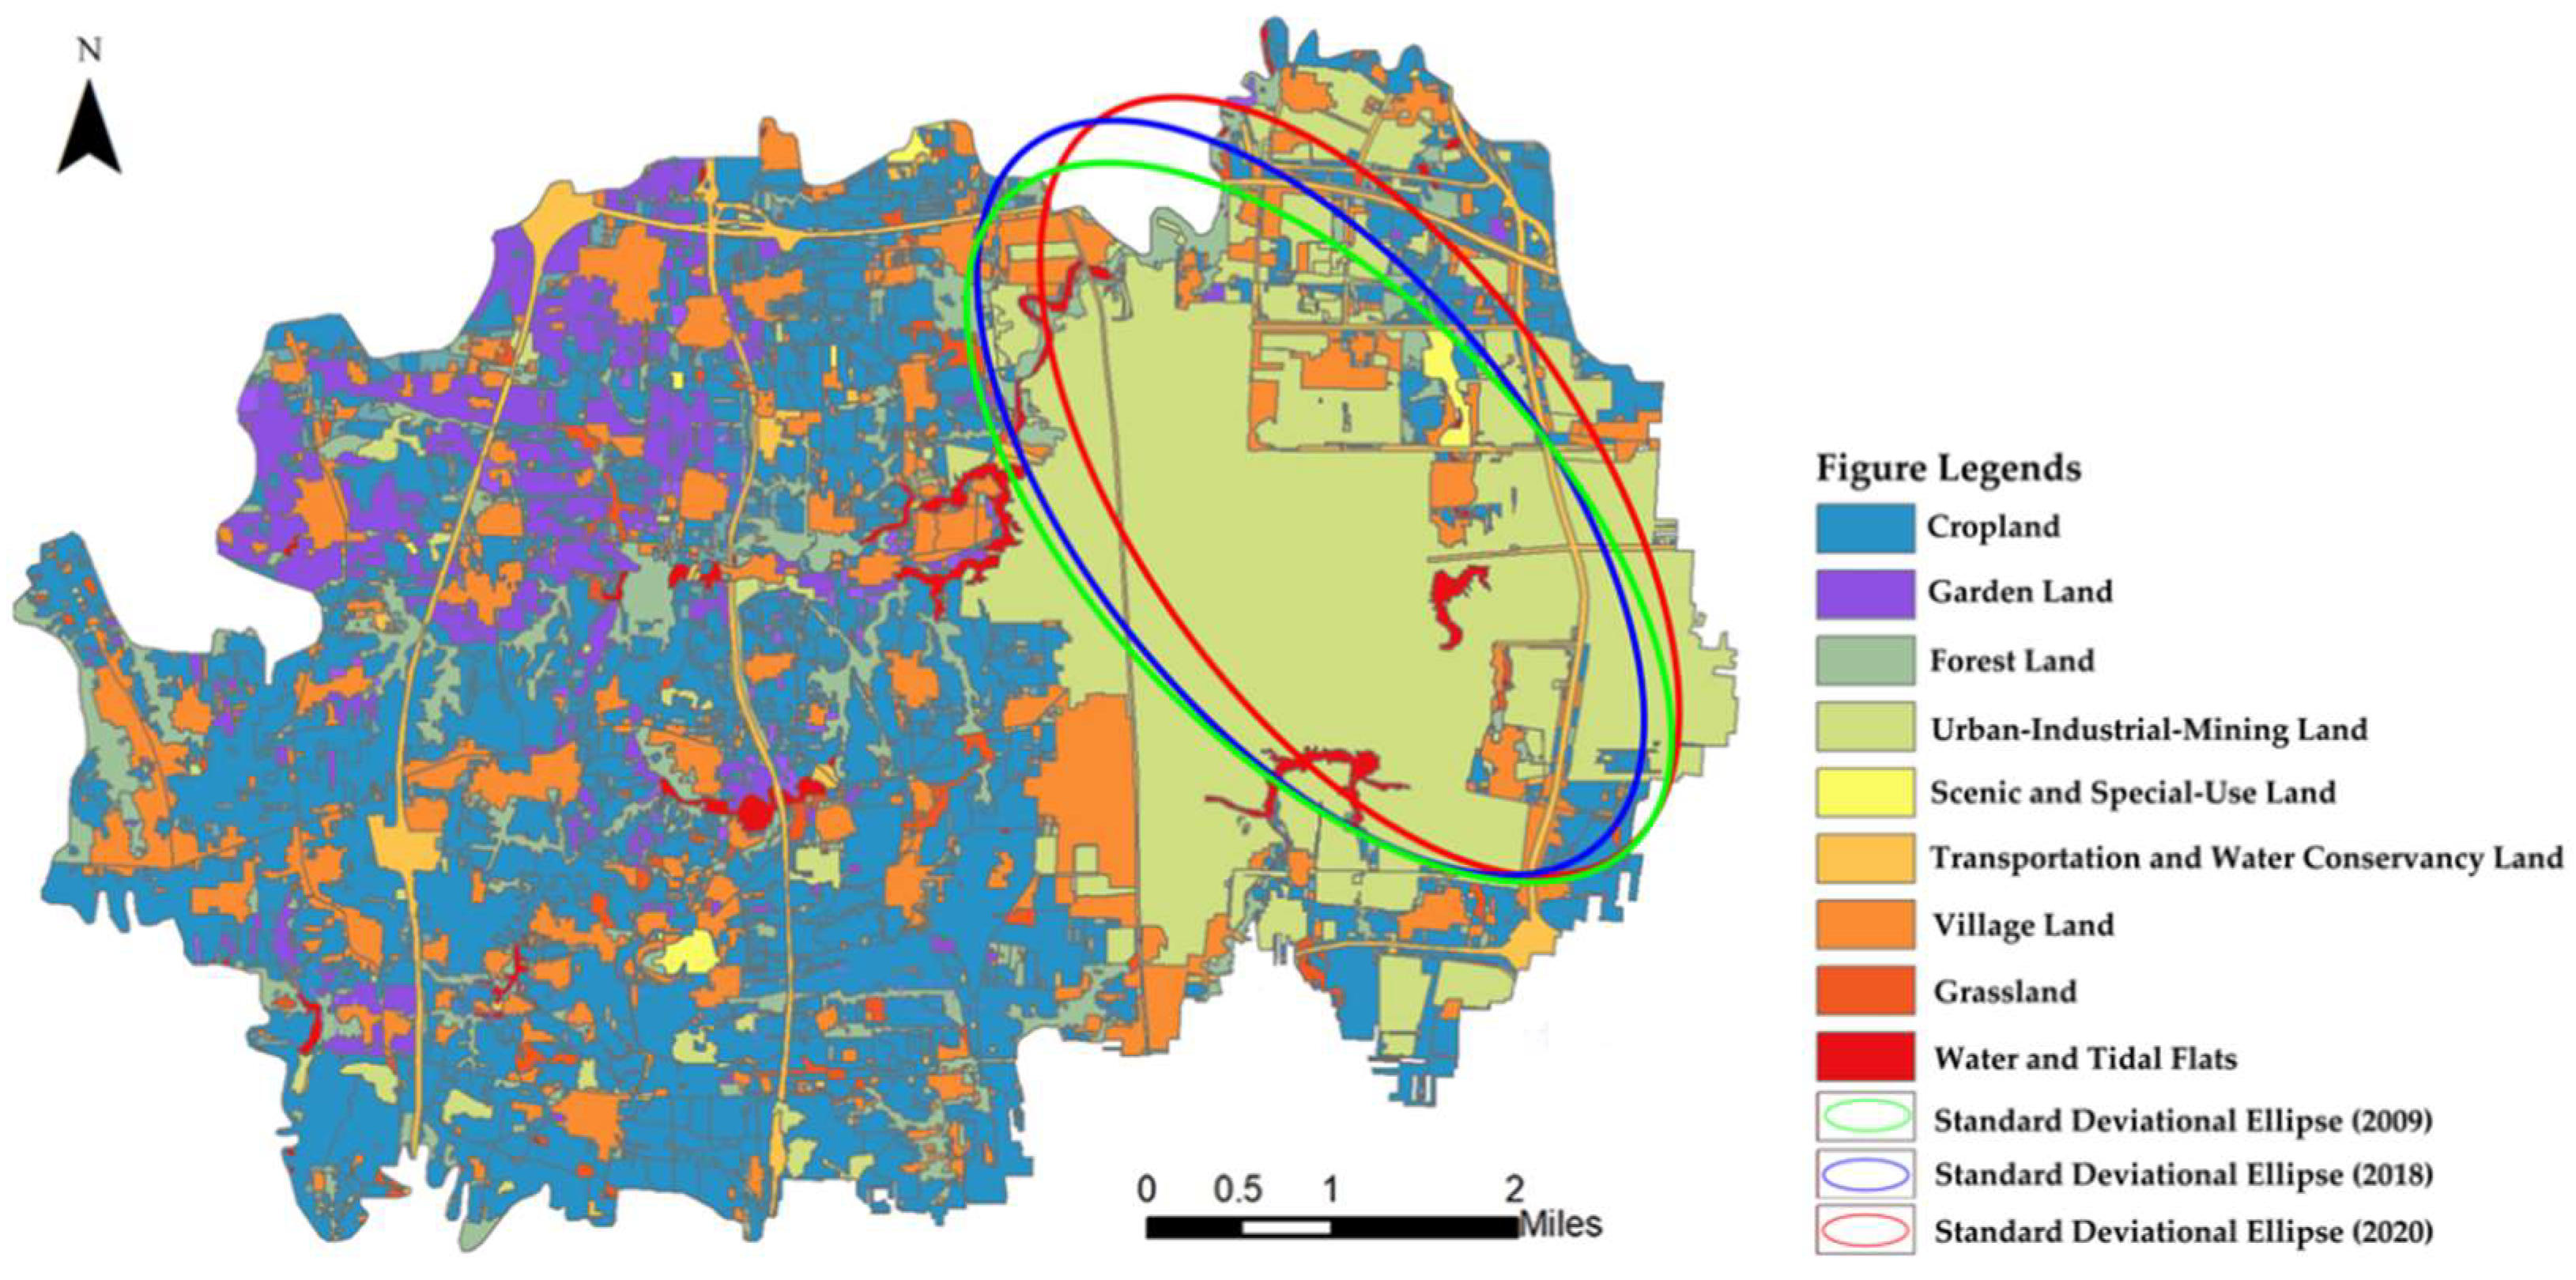
Multi-Scenario Simulation Analysis of Land Use Based on Geographical Processes: A Case Study of Longhu Town, China


Abstract
1. Introduction
2. Materials and Methodology
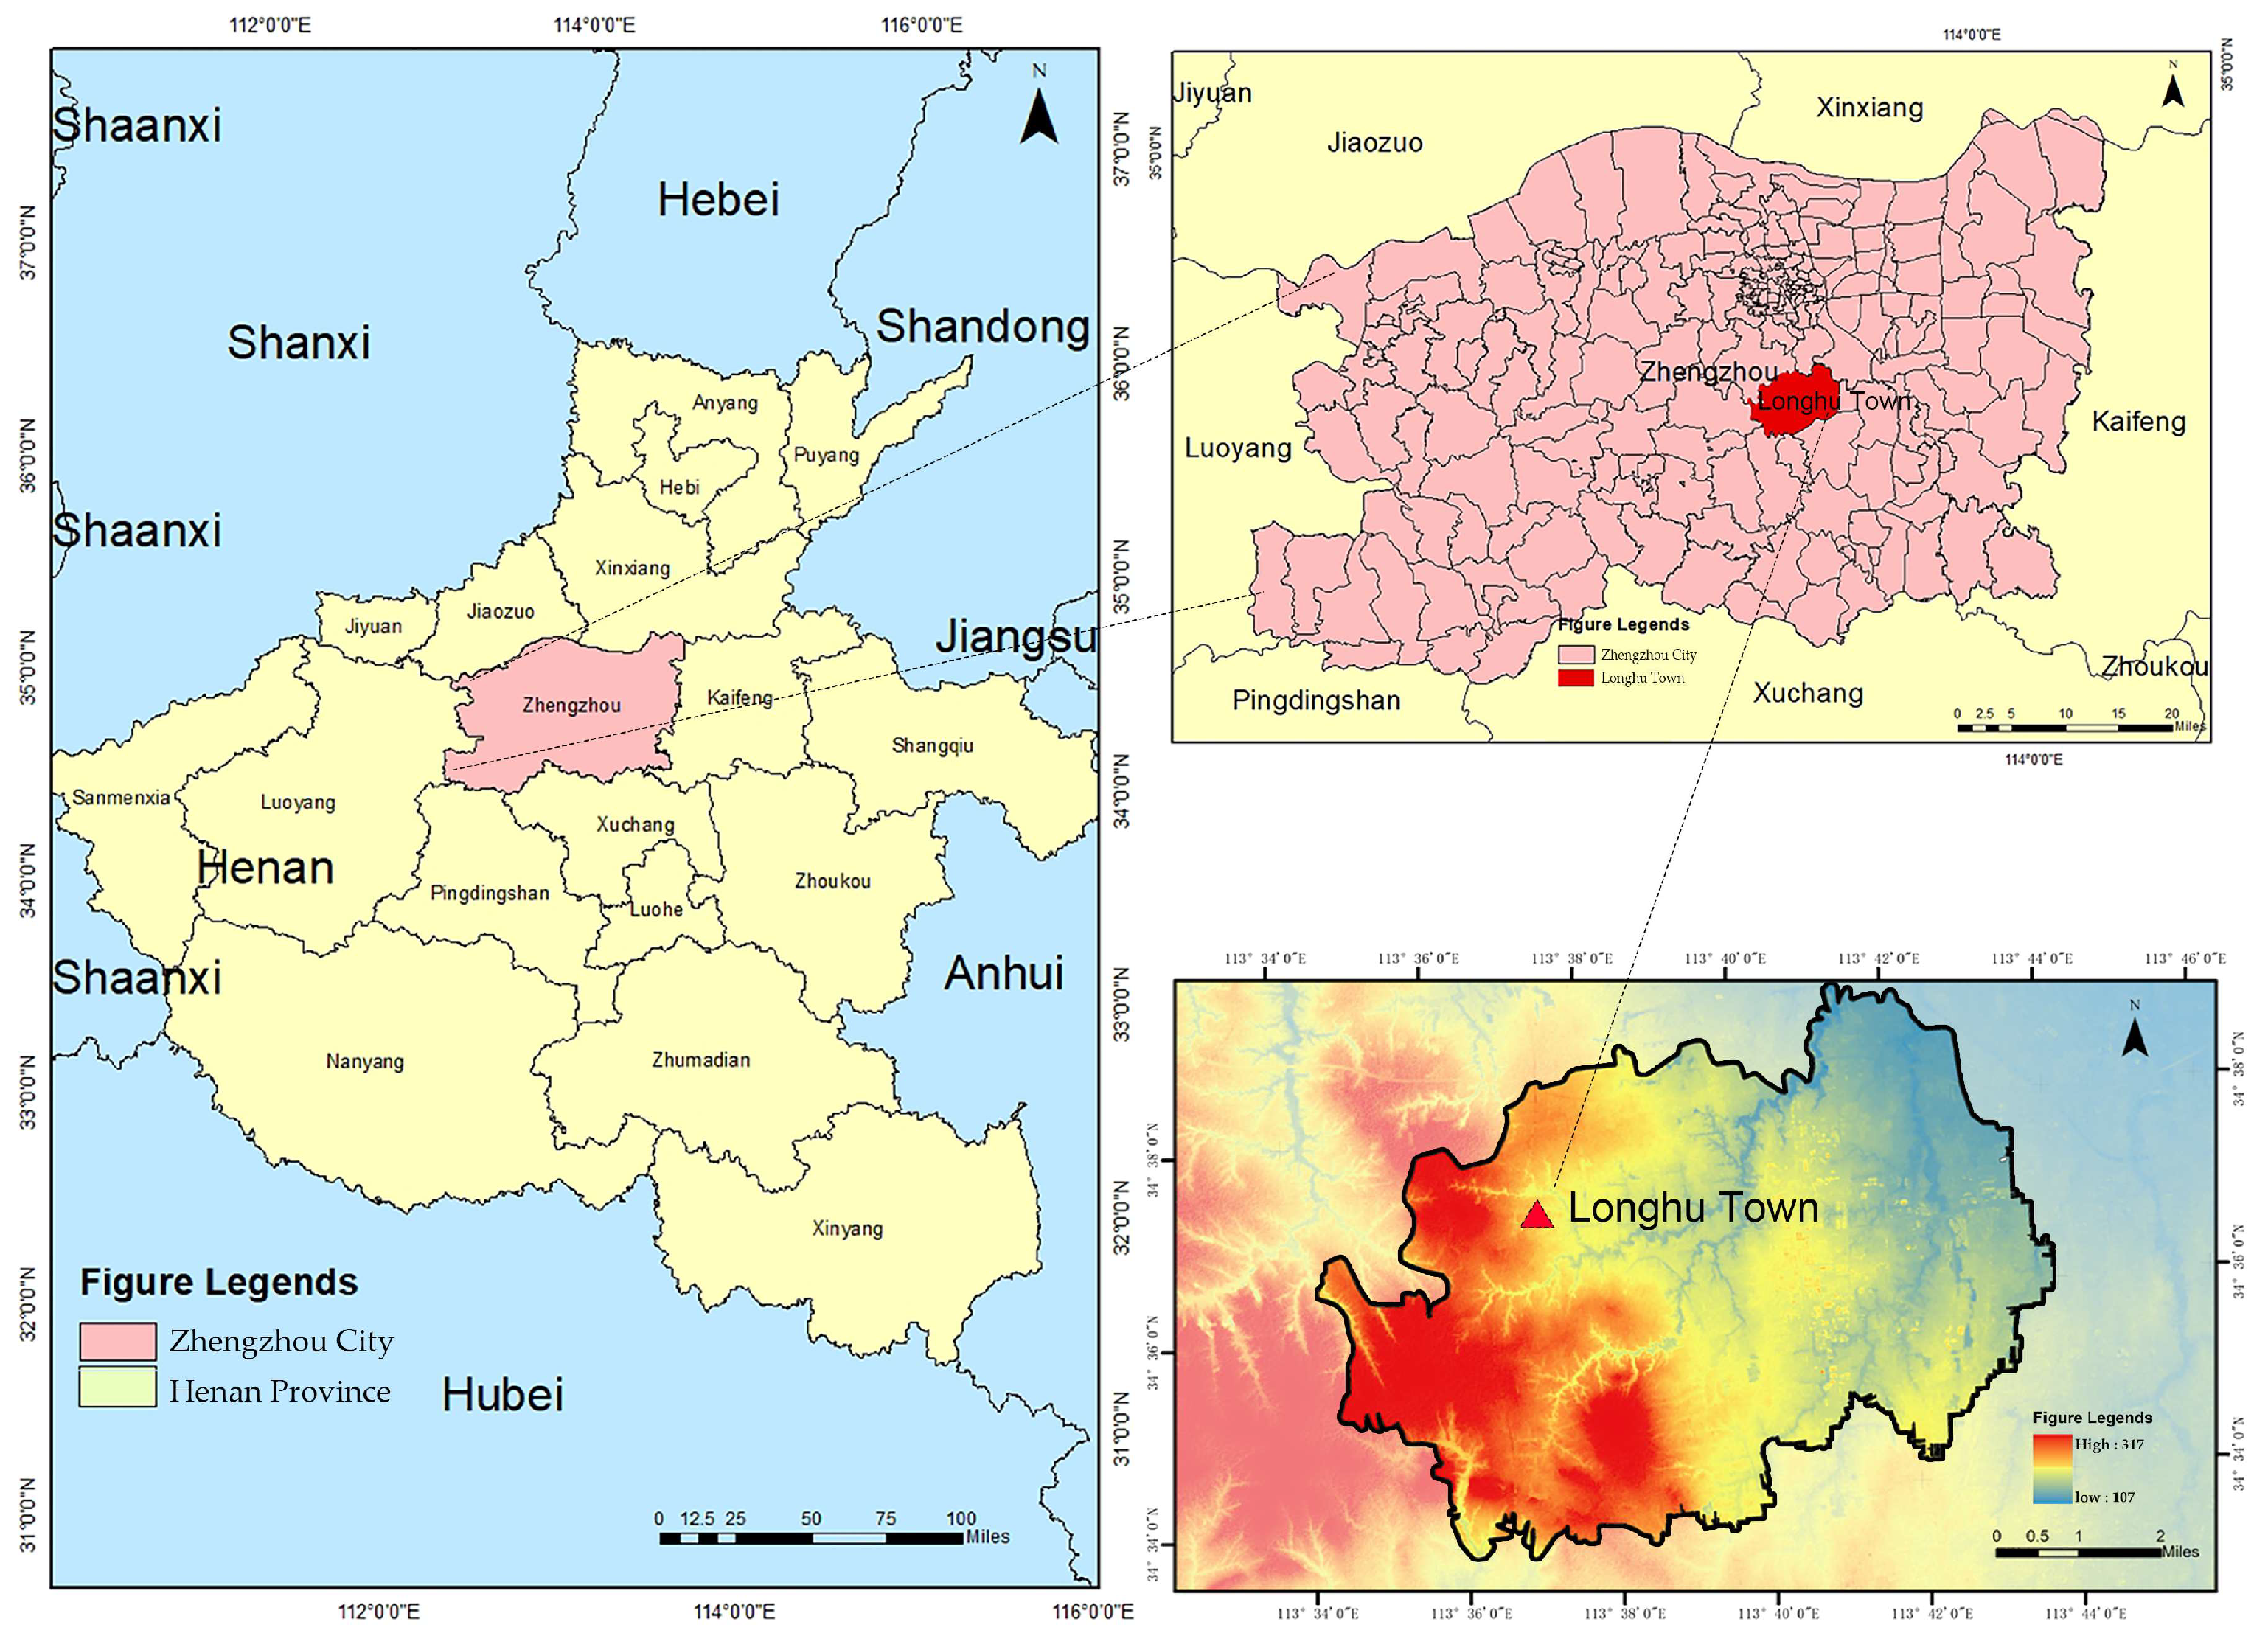
2.1. Study Area
2.2. Data Sources and Preprocessing
2.2.1. Land-Use Classification and Data Integration
2.2.2. Spatial Preprocessing and Standardization
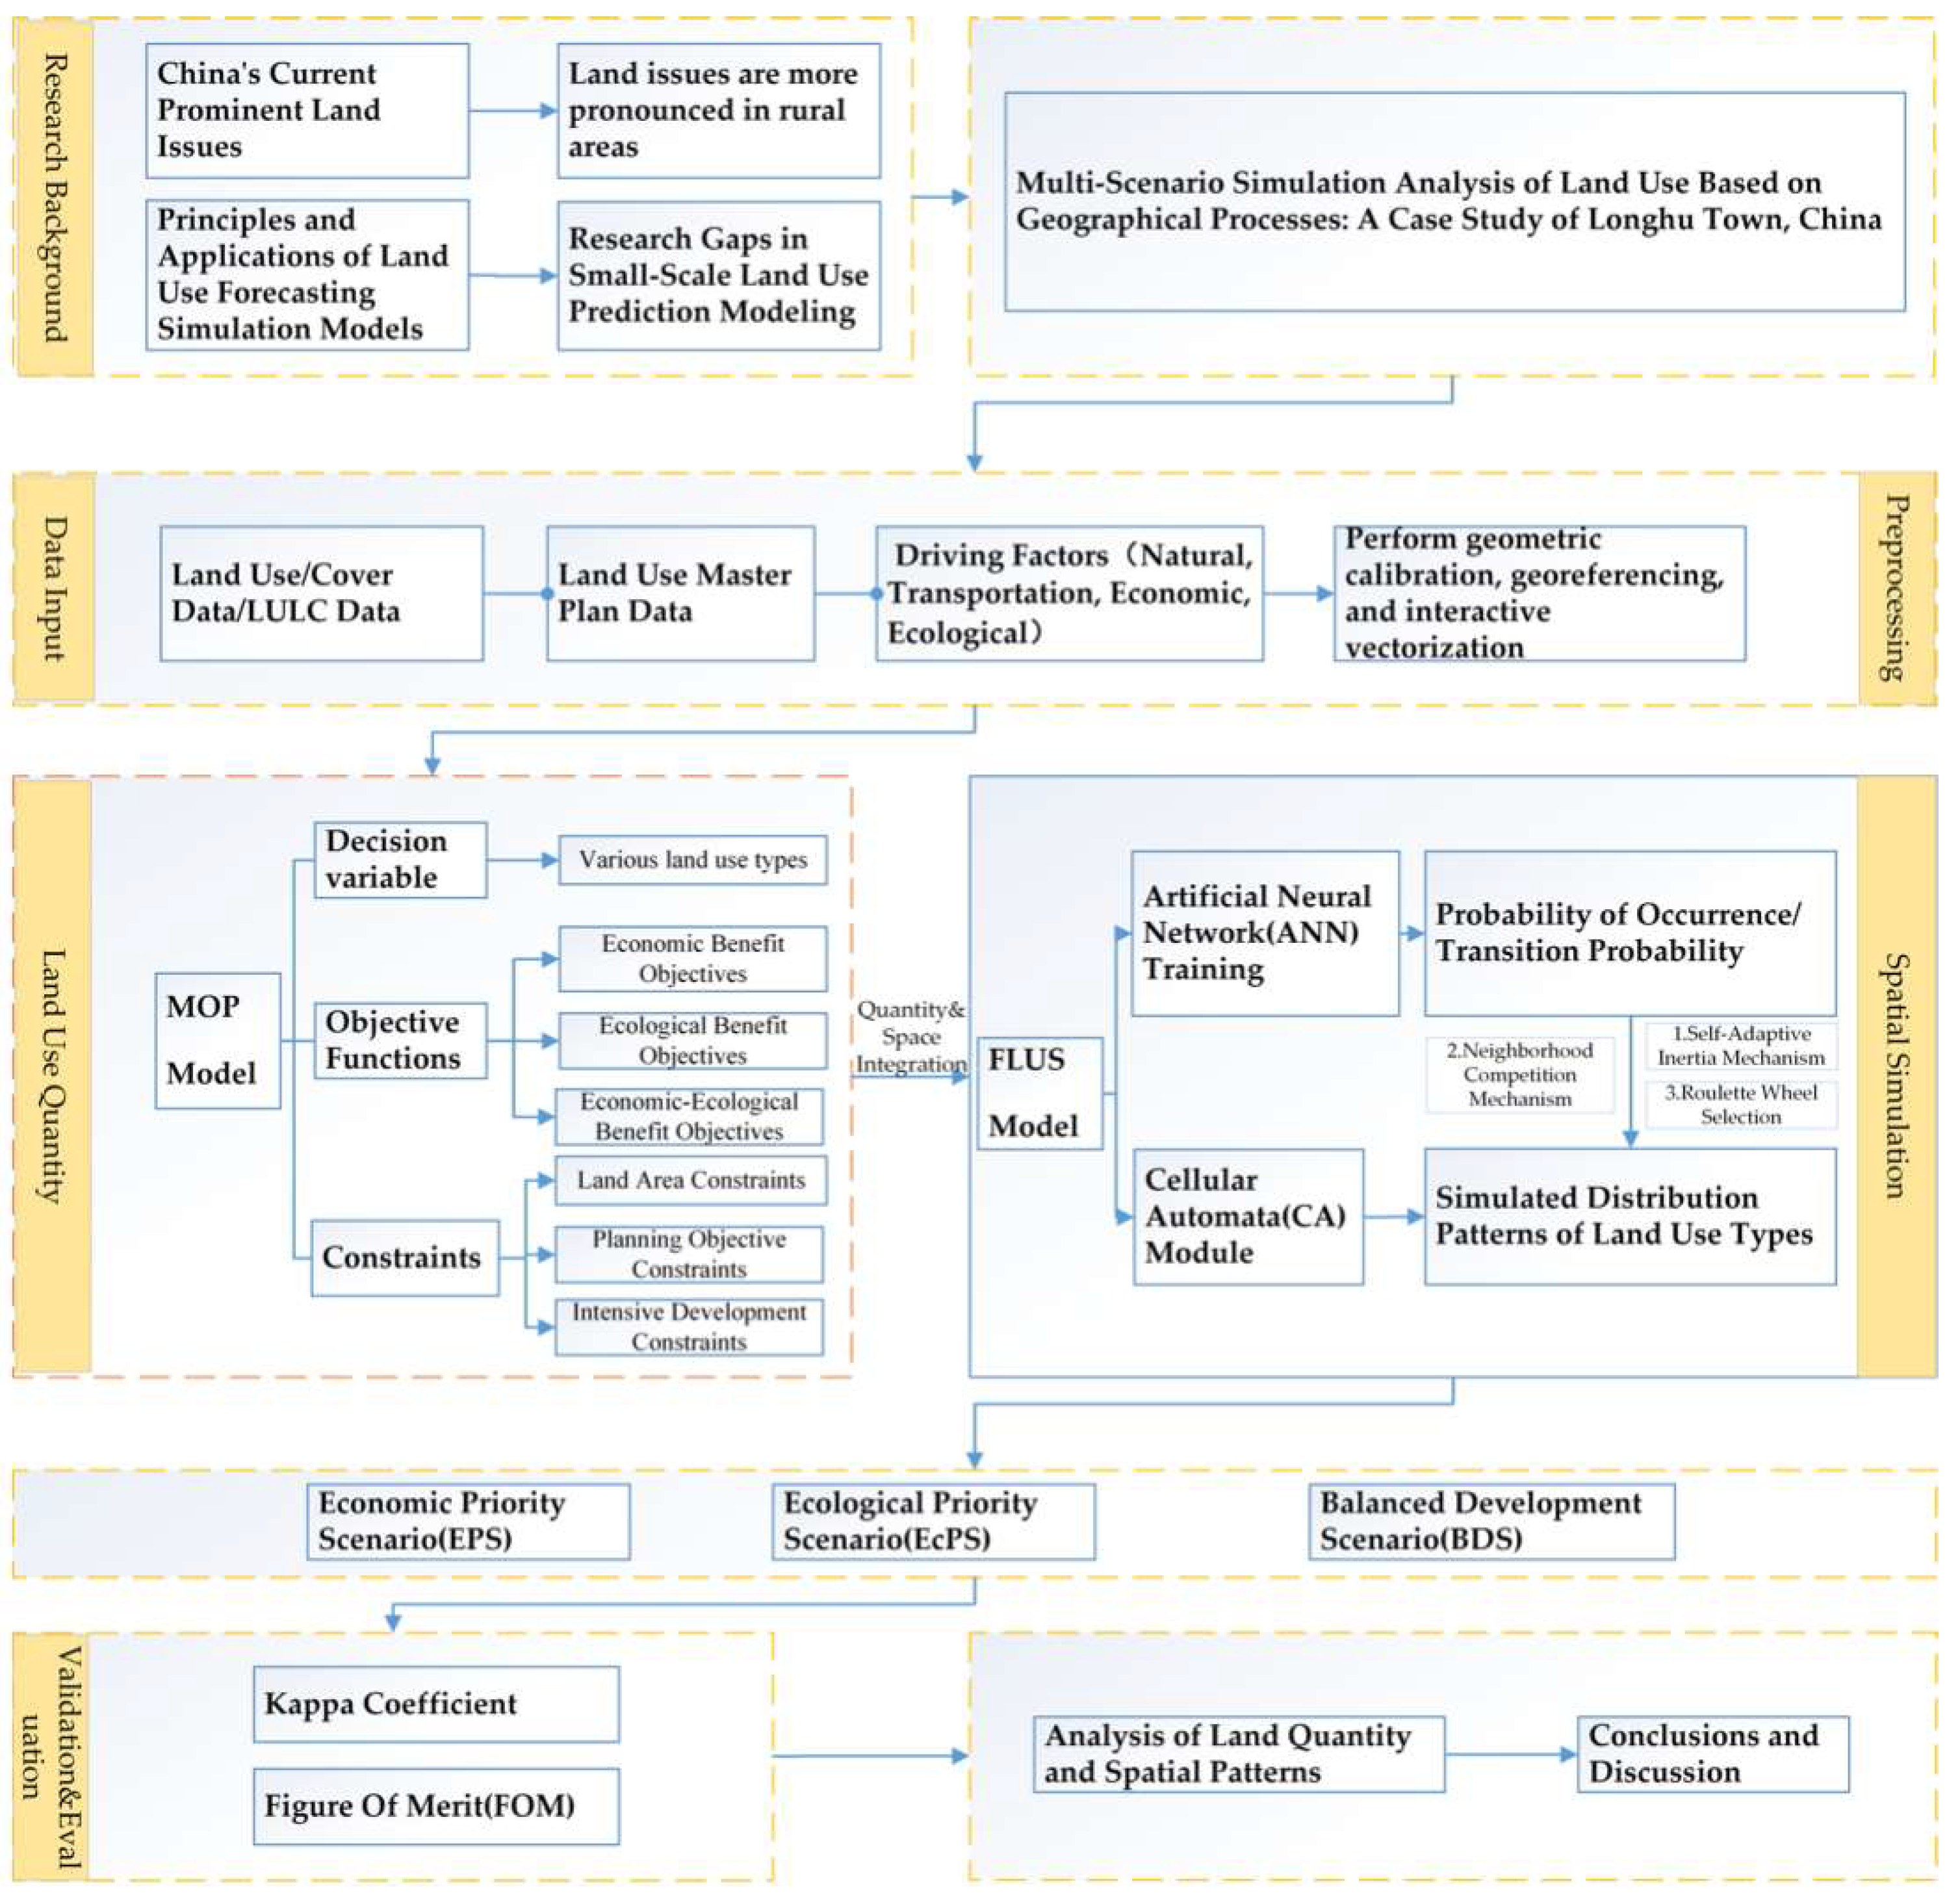
2.3. Research Design and Technical Framework
2.4. Land-Use Demand Prediction: Multi-Objective Planning (MOP)
2.4.1. Parameter Prediction Based on the Grey Prediction Model (GM(1,1))
2.4.2. Model Construction and Scenario Settings
- Decision Variables: In this study, nine land-use types are defined as decision variables: S1 (cropland), S2 (garden land), S3 (forest land), S4 (urban–industrial–mining land), S5 (scenic and special-use land), S6 (transportation and water conservancy land), S7 (village land), S8 (grassland), and S9 (water and tidal flats).
- Objective Functions: The economic benefit objective aims to maximize the sum of the area of each land-use type multiplied by its respective economic coefficient. The ecological benefit objective follows the same logic.
- Constraints: The constraint system integrates multiple policy and natural rigid limitations, categorized into three types: total land area constraints, planning target constraints, and intensive development constraints (Table 2). The setting of constraint intervals for decision variables follows a “Status Quo–Inertia Dual Benchmark” principle. Specifically, the upper and lower bounds for each variable are defined by two key benchmarks: (1) the actual area in 2020, representing the policy baseline of ‘status quo’ (i.e., zero growth or zero loss); and (2) the inertial projected value for 2030, calculated based on the average historical change rate from 2015 to 2020, representing the boundary of natural evolution driven by market forces. The MOP model seeks the optimal solution within the feasible region bounded by these two values. Furthermore, the values in Table 2 are presented with two decimal places as they are directly derived from the precise statistics of the GIS vector database. This precision is maintained to ensure strict mass balance with the total study area, preventing cumulative errors caused by rounding.
2.4.3. Solving and Output
2.5. Spatial Land-Use Simulation: The FLUS Model
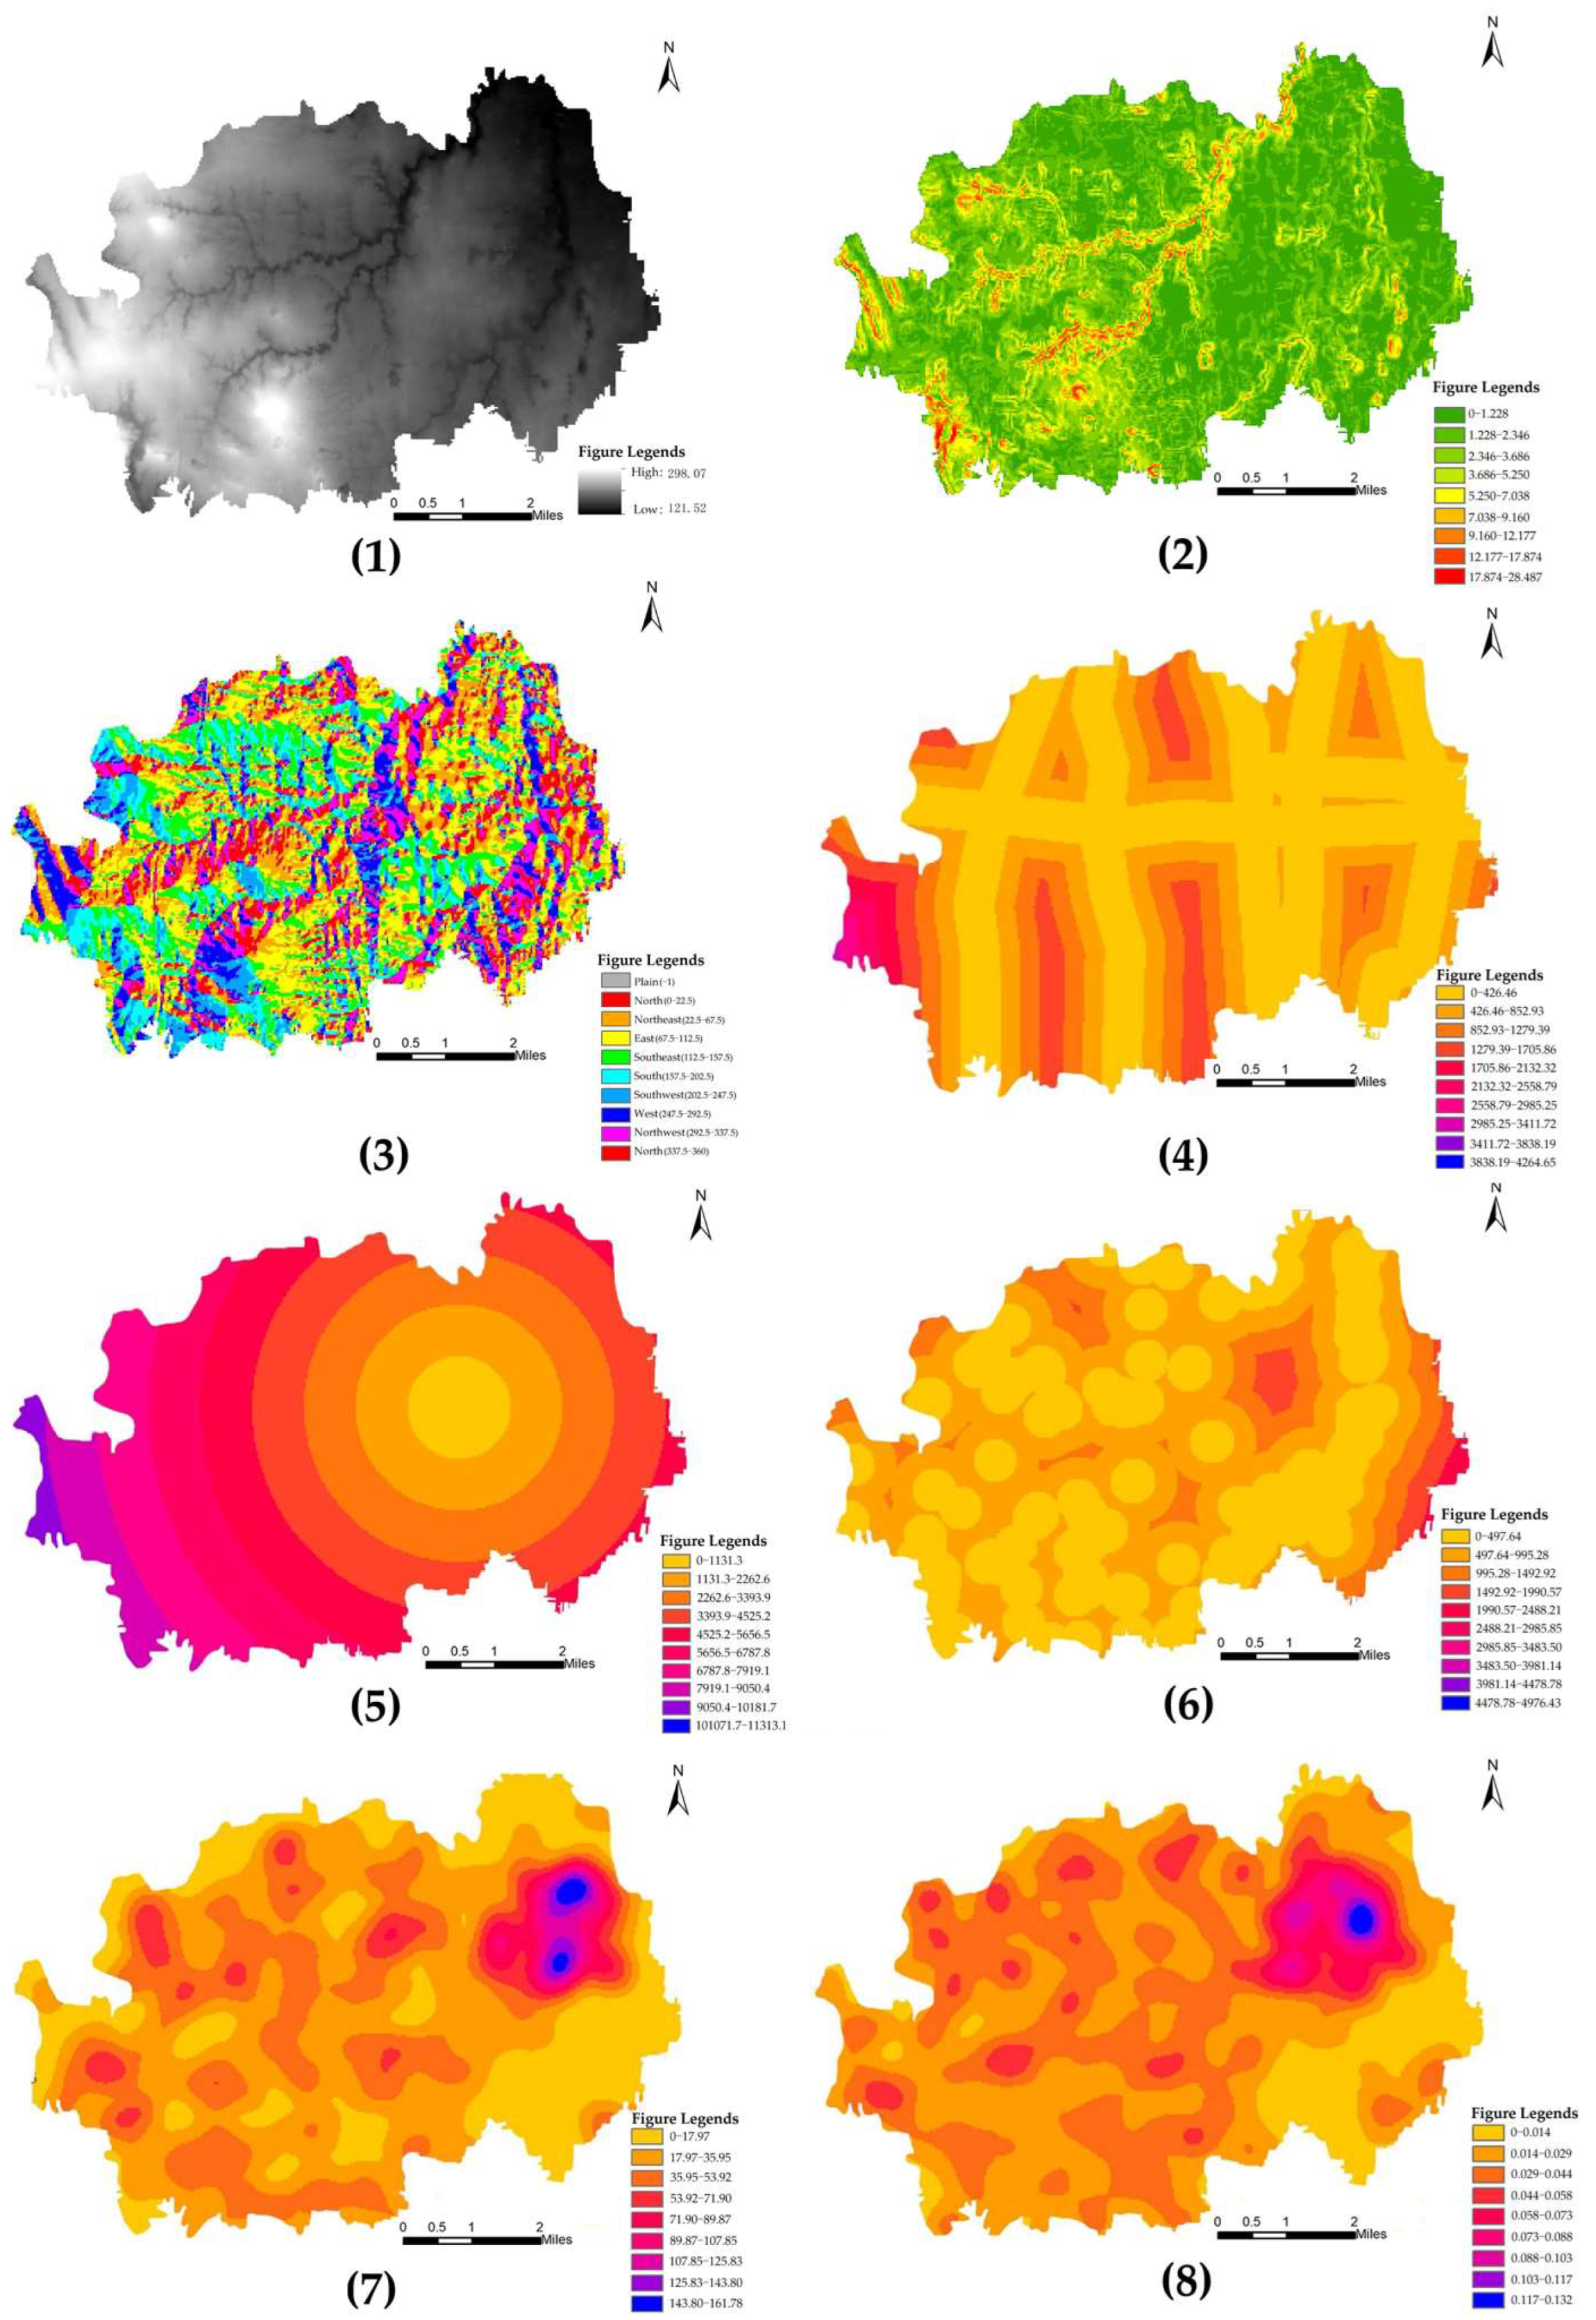
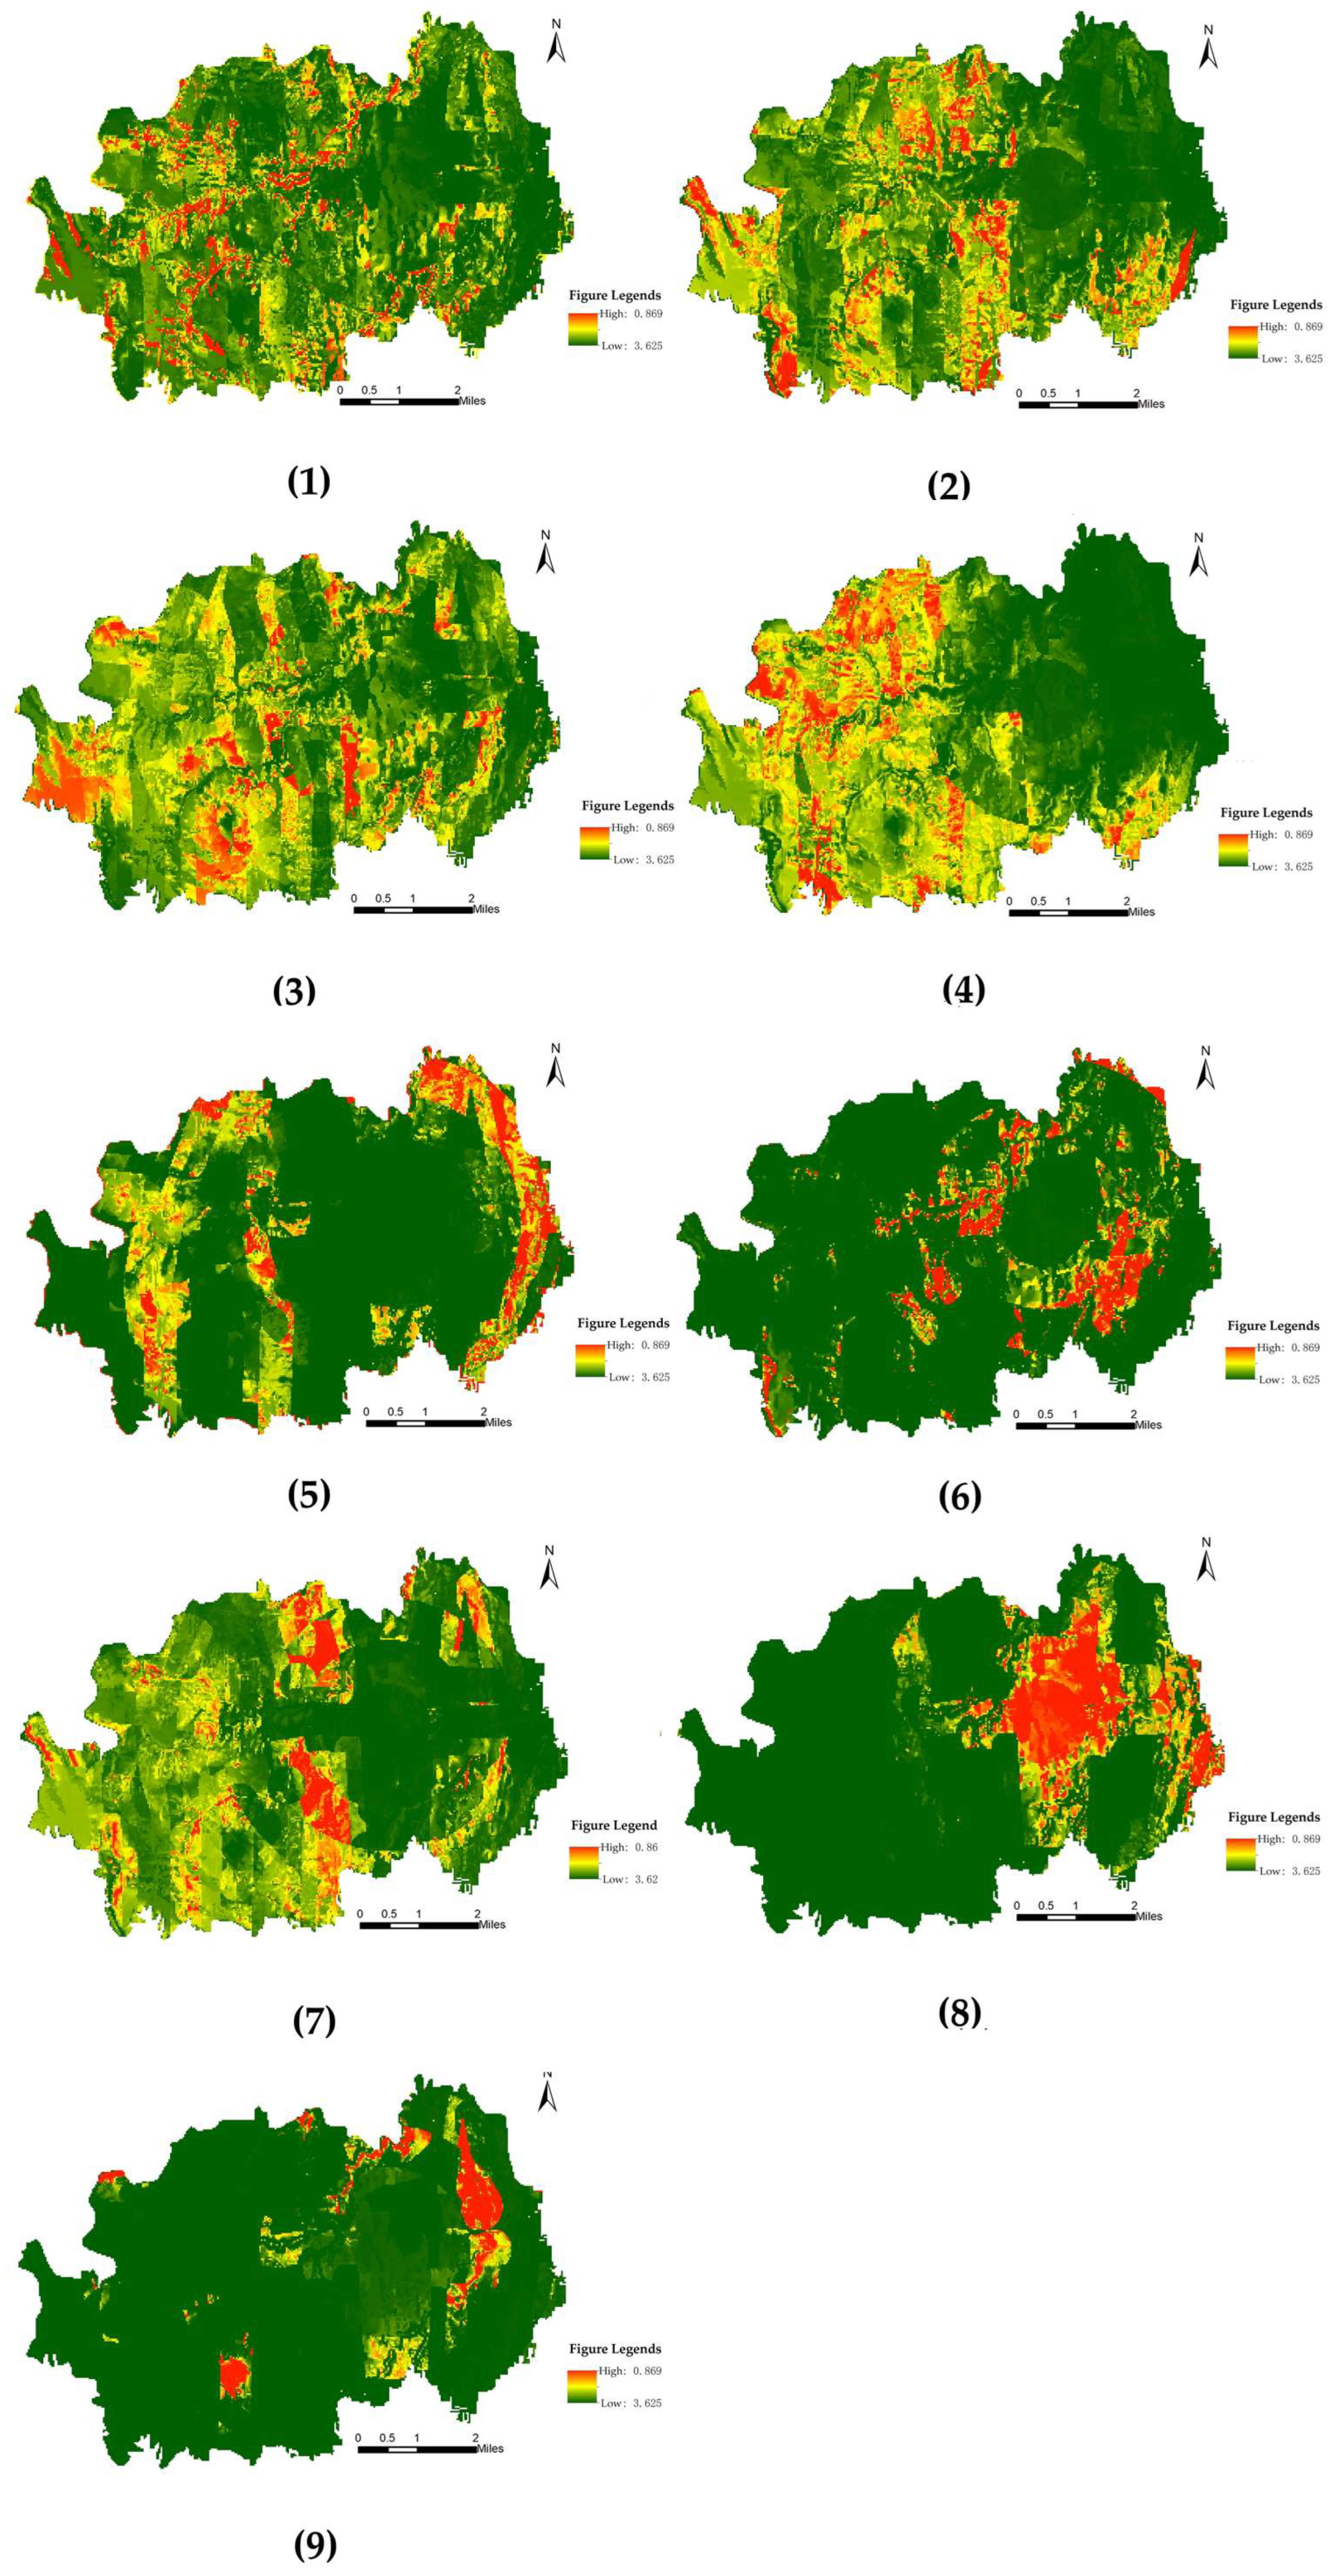
2.5.1. Driving Factors and Probability of Occurrence
2.5.2. Coupling Mechanism and Spatial Iteration
- Top-level Quantity Input: The optimal area structures for each scenario (from Section 2.4 serve as the total spatial allocation targets for the FLUS-CA module.
- Scenario Implementation: The transition cost matrix and neighborhood factor parameters are the primary tools for implementing scenario-specific logic.
- Cost Matrix: A binary matrix (0 or 1) defining permitted (1) or prohibited (0) transitions between land types.
- Neighborhood Factors: Ranging from 0 to 1, these quantify the relative expansion intensity of each land type. Higher values indicate a stronger competitive advantage in the spatial neighborhood.
- Bottom-up Spatial Competition: The self-adaptive CA module integrates suitability probabilities, neighborhood effects, and scenario-based transition costs. Under the constraint of the total area targets, the model performs multiple iterations to reach a spatial equilibrium.
2.6. Model Calibration and Validation
3. Results
3.1. Model Calibration, Mechanism, and Accuracy Validation
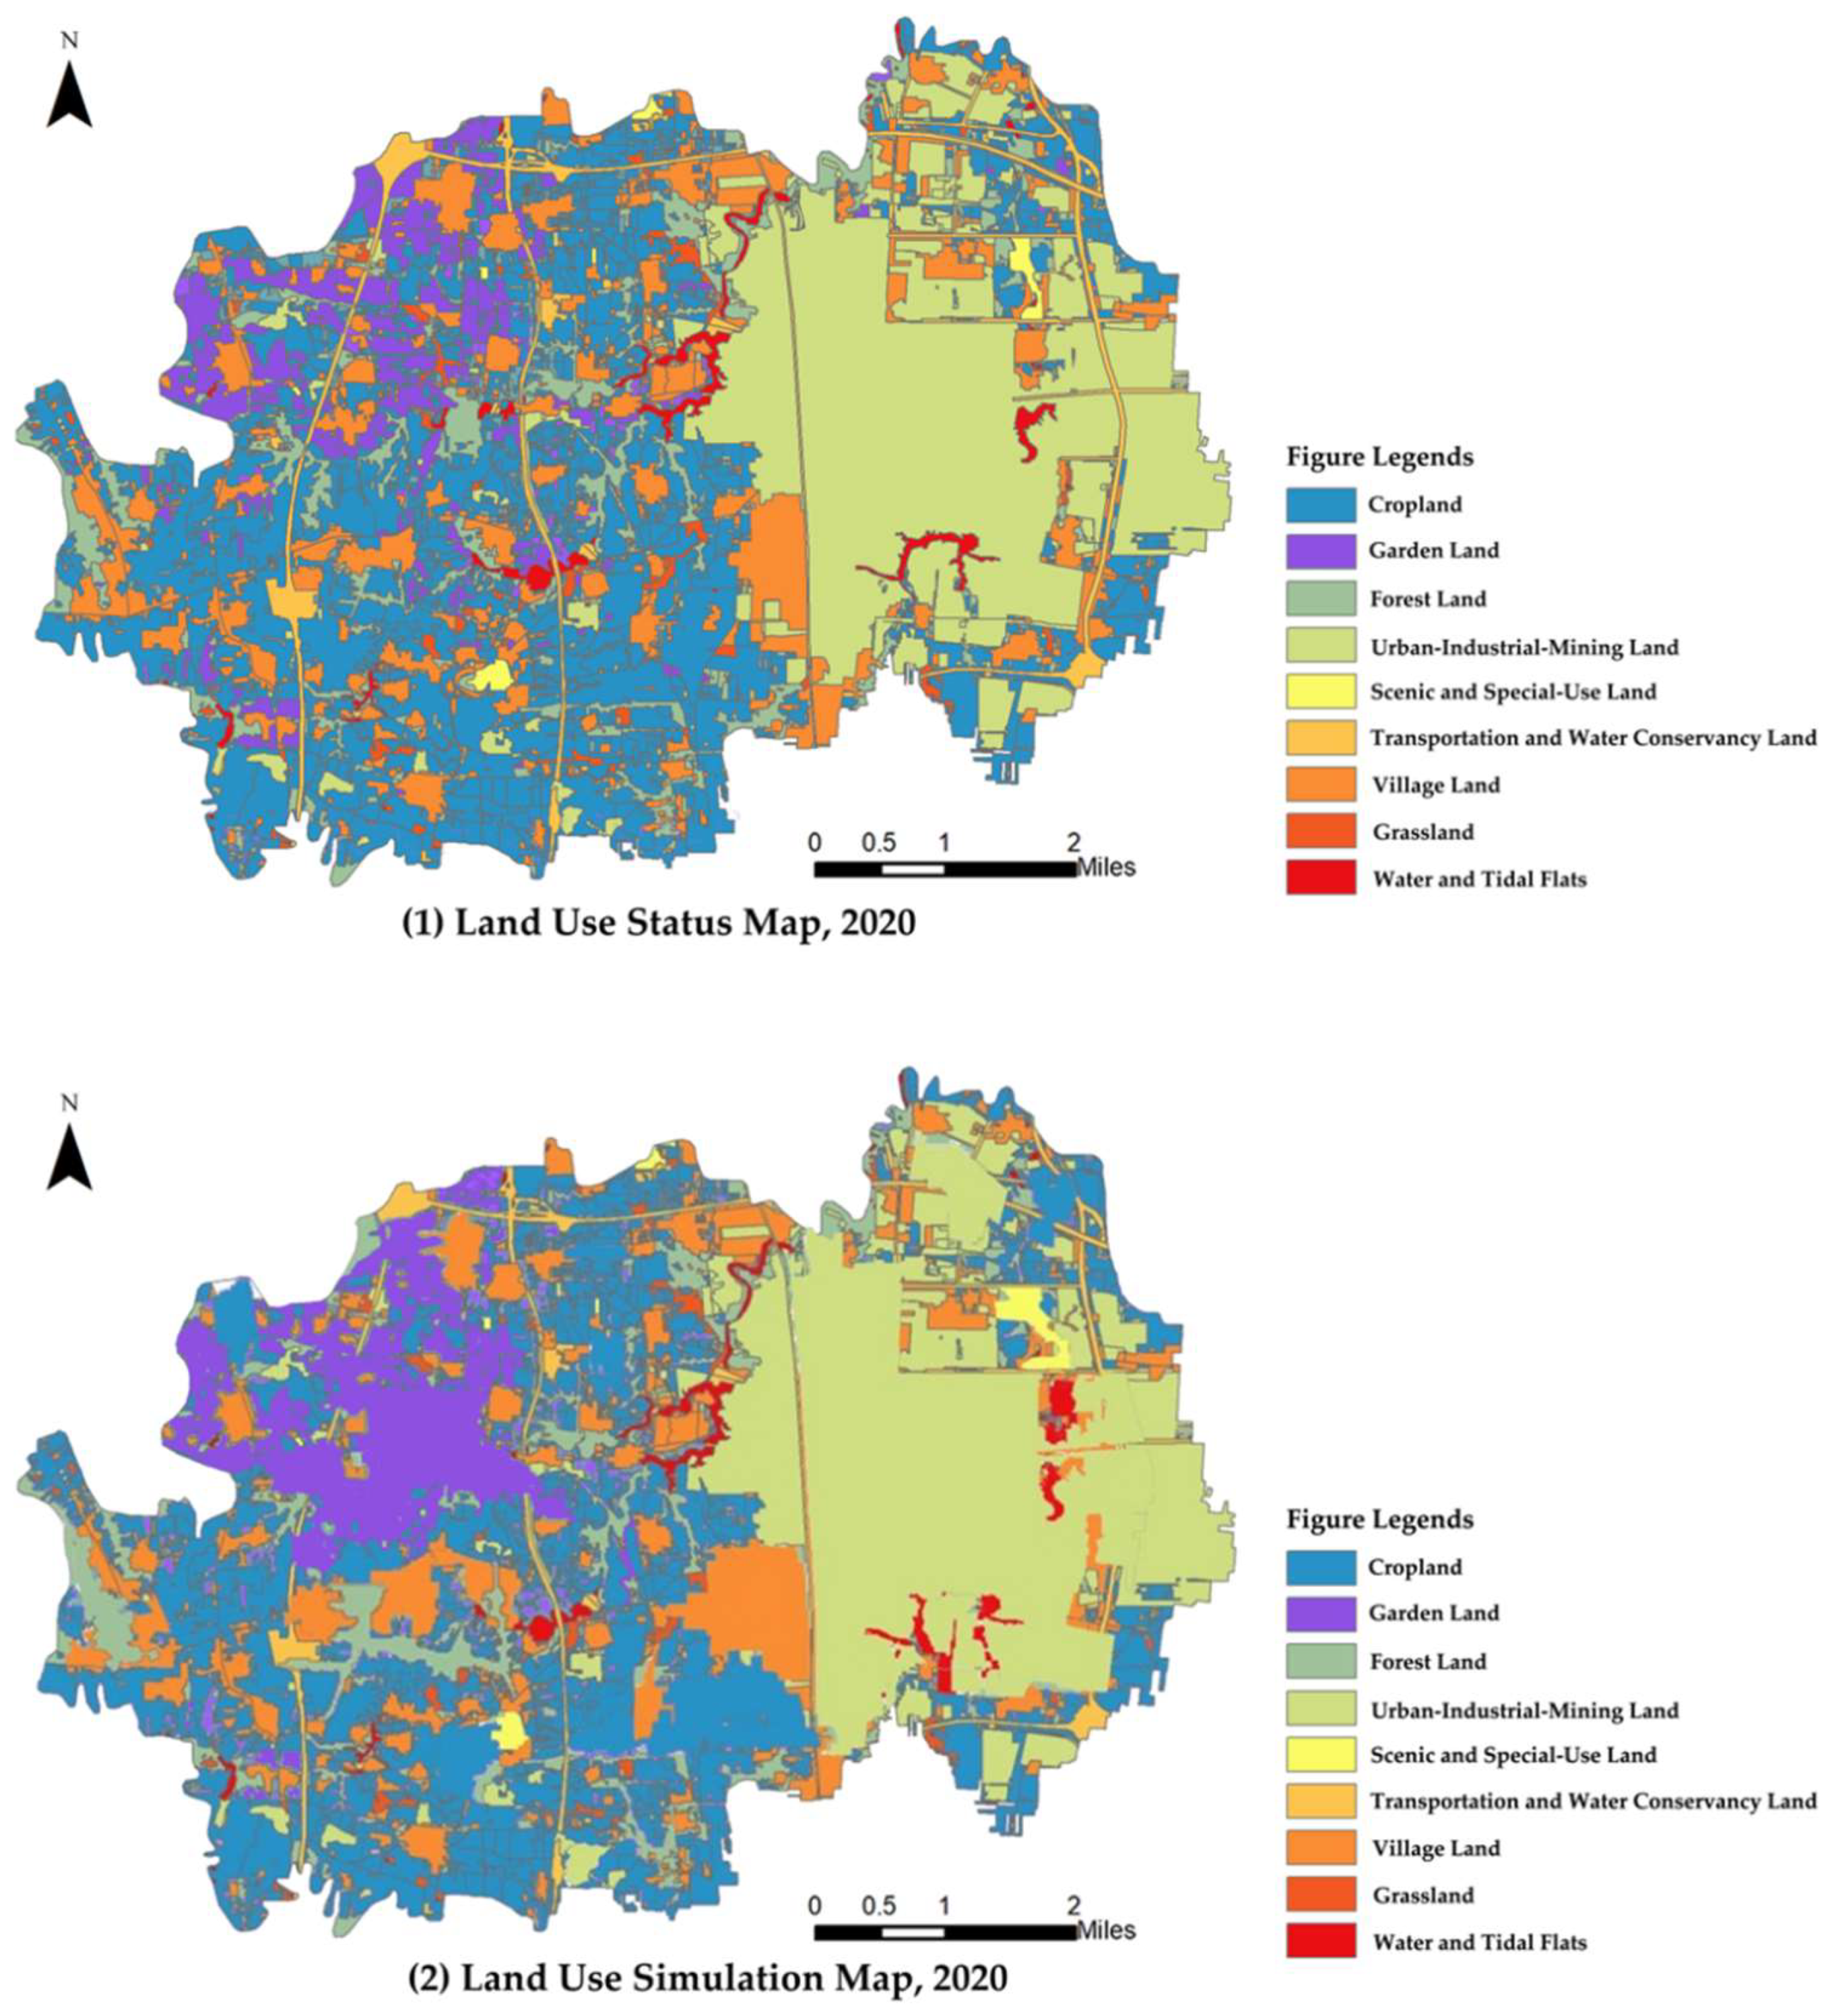
3.1.1. Historical Backtracking Calibration and Accuracy Verification
- Kappa Coefficient: This metric was calculated based on a global pixel-by-pixel comparison between the simulated 2020 land-use map and the actual observation, reflecting the overall consistency of the macroscopic spatial pattern. The formula is expressed as follows:
- Figure of Merit (FoM) Index: Recognizing that the Kappa coefficient is often biased upward by the large proportion of unchanged “persistent” pixels in short-term (e.g., 5–10 years) township-scale simulations, this study introduced the FoM index to specifically evaluate the model’s accuracy in simulating the dynamic “changed areas.” The formula is given by:
3.1.2. Driving Forces and Transition Mechanisms for Future Projections
3.2. Evolution of Land-Use Structure Under Multiple Scenarios
3.3. Spatial Pattern Simulation and Comparison Under Multiple Scenarios
3.3.1. Spatial Expansion and Encroachment Under the Economic Priority Scenario (EPS)
3.3.2. Spatial Protection and Restoration Under the Ecological Protection Scenario (EcPS)
3.3.3. Spatial Trade-Offs and Optimization Under the Balanced Development Scenario (BDS)
4. Discussion
4.1. Dialogue with Existing Research
4.2. Interpretations of Deep Mechanisms
4.2.1. Spatial Maneuvering Between Market and Policy Forces
4.2.2. The “Core–Periphery” Effect in Land Competition
4.2.3. Feedback Mechanisms of Regional Strategy at the Township Scale
4.2.4. Systematic Trade-Offs from “Quantity Balance” to “Spatial Efficiency”
4.3. Methodological Contributions
4.4. Validation of Temporal Representativeness and Long-Term Evolutionary Trajectories
4.5. Limitations and Future Directions
5. Conclusions
5.1. Core Findings and Optimal Pathway Identification
5.2. Methodological and Theoretical Contributions
5.3. Planning Implications and Policy Recommendations
- Adopt the Balanced Development Model: Planning authorities should transition from “single-growth” targets to a BDS-aligned framework, prioritizing the protection of the northeastern cropland belts while guiding industrial clustering toward the northwest.
- Implement Differentiated Zonal Governance: Targeted policies are required to resolve core spatial conflicts. In eastern conflict zones, we recommend “functional optimization and stock renewal” strategies to integrate ecological functions through urban renewal. In cropland-sensitive areas, a refined management approach focusing on “total volume stability, quality improvement, and layout adjustment” should be enforced to strictly protect contiguous high-quality agricultural land.
- Establish a “Diagnosis–Simulation–Evaluation” Dynamic Support System: The MOP-FLUS framework should be integrated as a routine tool for territorial spatial planning. By institutionalizing regular scenario simulations, planners can pre-evaluate the spatial impacts of various strategies, facilitating a shift from static “indicator control” to dynamic “scenario guidance and adaptive management.”
Author Contributions
Funding
Data Availability Statement
Conflicts of Interest
Appendix A

| ID | Reclassified Category | Original Category in GB/T 21010-2017 [41] | Description of Reclassification Logic |
|---|---|---|---|
| 1 | Cropland | 0101 Paddy Field | Direct Adoption: Retains the primary category “Cultivated Land” and its sub-categories from the national standard without merging. |
| 0102 Irrigated Land | |||
| 0103 Dry Land | |||
| 2 | Garden Land | 0201 Orchard | Direct Adoption: Retains the primary category “Garden Land” and its sub-categories from the national standard without merging. |
| 3 | Forest Land | 0305 Shrub Land | Direct Adoption: Retains the primary category “Forest Land” and its sub-categories from the national standard without merging. |
| 0307 Other Forest Land | |||
| 4 | Urban-Industrial-Mining Land | 0701 Urban Residential Land | Functional Aggregation: Due to the difficulty in precisely delineating “urban” and “isolated mining” boundaries in township data, and their shared non-agricultural construction function, these are merged into a single category. |
| 0601 Industrial Land | |||
| 0602 Mining Land | |||
| 5 | Scenic and Special-Use Land | 0906 Scenic Facilities Land | Scale-Dependent Simplification: At the township scale, these land types are small and fragmented. Statistical significance is limited if treated separately, hence they are aggregated. |
| 090 Special Use Land | |||
| 0903Corrections Land | |||
| 6 | Transportation and Water Conservancy Land | 1003 Highway Land | Morphological Aggregation: Given that transportation lines and water facilities are often mixed or hard to distinguish precisely on township maps, and both function as linear or point-based infrastructure, they are merged to simplify analysis. |
| 1004 Urban/Town Road | |||
| 1006 Rural Road | |||
| 1109 Hydraulic Structure Land | |||
| 7 | Village Land | 0702 Rural Homestead | Strategic Preservation: As the core carrier of rural residential functions, this category is crucial for township-level research and is thus retained as an independent class. |
| 8 | Grassland | 0404 Other Grassland | Direct Adoption: Retains the primary category “Grassland” and its sub-categories from the national standard without merging. |
| 9 | Water and Tidal Flats | 1104 Pond Surface | Ecological Distinction: To highlight the ecological attributes of natural water bodies and wetlands, these are separated from artificial hydraulic facilities and merged into a single ecological category. |
| 1102 Lake Surface | |||
| 1106 Inland Mudflat |
| Benefit Type | Factor | Data Suitability Check | Model Accuracy (Posterior Variance C) | Model Reliability (Error Prob. P) | 2030 Predicted Value |
|---|---|---|---|---|---|
| Economic | Cropland | Passed | 0.21 | 0.95 | 203 |
| Garden Land | Passed | 0.25 | 0.98 | 1.9 | |
| Forest Land | Passed | 0.15 | 0.94 | 8.6 | |
| Urban-Industrial-Mining Land | Passed | 0.13 | 0.91 | 1073 | |
| Scenic and Special-Use Land | Passed | 0.21 | 0.94 | 261 | |
| Transportation and Water Conservancy Land | Passed | 0.24 | 0.92 | 1023 | |
| Village Land | Passed | 0.22 | 0.99 | 165 | |
| Grassland | Passed | 0.14 | 0.99 | 1.2 | |
| Water and Tidal Flats | Passed | 0.17 | 0.98 | 2.1 | |
| Ecological | Cropland | Passed | 0.28 | 0.95 | 1.5 |
| Garden Land | Passed | 0.21 | 0.94 | 1.5 | |
| Forest Land | Passed | 0.19 | 0.95 | 5.3 | |
| Urban-Industrial-Mining Land | Passed | 0.26 | 0.94 | 0.2 | |
| Scenic and Special-Use Land | Passed | 0.24 | 0.97 | 0.3 | |
| Transportation and Water Conservancy Land | Passed | 0.25 | 0.98 | 0.2 | |
| Village Land | Passed | 0.25 | 0.95 | 0.1 | |
| Grassland | Passed | 0.27 | 0.91 | 2.2 | |
| Water and Tidal Flats | Passed | 0.22 | 0.99 | 8.5 |
| EPS | |||||||||
| S1 | S2 | S3 | S4 | S5 | S6 | S7 | S8 | S9 | |
| S1 * | 1 | 1 | 1 | 0 | 0 | 0 | 1 | 1 | 1 |
| S2 | 1 | 1 | 1 | 0 | 0 | 0 | 1 | 1 | 1 |
| S3 | 1 | 1 | 1 | 0 | 0 | 0 | 1 | 1 | 1 |
| S4 | 1 | 1 | 1 | 1 | 1 | 1 | 1 | 1 | 1 |
| S5 | 1 | 1 | 1 | 1 | 1 | 1 | 1 | 1 | 1 |
| S6 | 0 | 0 | 0 | 1 | 1 | 1 | 0 | 0 | 0 |
| S7 | 1 | 1 | 1 | 0 | 0 | 0 | 1 | 1 | 1 |
| S8 | 1 | 1 | 1 | 0 | 0 | 0 | 1 | 1 | 1 |
| S9 | 1 | 1 | 1 | 0 | 0 | 0 | 0 | 0 | 1 |
| EcPS | |||||||||
| S1 | S2 | S3 | S4 | S5 | S6 | S7 | S8 | S9 | |
| S1 * | 1 | 1 | 0 | 1 | 1 | 1 | 1 | 0 | 0 |
| S2 | 1 | 1 | 0 | 1 | 1 | 1 | 1 | 0 | 0 |
| S3 | 1 | 1 | 1 | 1 | 1 | 1 | 1 | 1 | 0 |
| S4 | 0 | 1 | 0 | 1 | 1 | 1 | 1 | 0 | 0 |
| S5 | 0 | 1 | 0 | 1 | 1 | 1 | 1 | 1 | 0 |
| S6 | 0 | 1 | 0 | 1 | 1 | 1 | 1 | 0 | 0 |
| S7 | 0 | 1 | 0 | 1 | 1 | 1 | 1 | 0 | 0 |
| S8 | 1 | 1 | 0 | 1 | 1 | 1 | 1 | 1 | 0 |
| S9 | 1 | 1 | 1 | 1 | 1 | 1 | 1 | 1 | 1 |
| BDS | |||||||||
| S1 | S2 | S3 | S4 | S5 | S6 | S7 | S8 | S9 | |
| S1 * | 1 | 1 | 0 | 1 | 1 | 1 | 1 | 1 | 1 |
| S2 | 1 | 1 | 1 | 1 | 1 | 1 | 1 | 1 | 1 |
| S3 | 1 | 1 | 1 | 1 | 1 | 1 | 1 | 0 | 0 |
| S4 | 1 | 1 | 0 | 1 | 1 | 1 | 1 | 1 | 1 |
| S5 | 0 | 1 | 1 | 1 | 1 | 1 | 1 | 1 | 1 |
| S6 | 1 | 1 | 0 | 1 | 1 | 1 | 1 | 0 | 0 |
| S7 | 1 | 1 | 1 | 1 | 1 | 1 | 1 | 1 | 0 |
| S8 | 0 | 1 | 1 | 1 | 1 | 1 | 1 | 1 | 1 |
| S9 | 1 | 1 | 1 | 1 | 1 | 1 | 1 | 1 | 1 |
| Land-Use Type | S1 | S2 | S3 | S4 | S5 | S6 | S7 | S8 | S9 |
|---|---|---|---|---|---|---|---|---|---|
| EPS | 0.2 | 0.2 | 0.5 | 0.9 | 0.8 | 0.9 | 0.2 | 0 | 0 |
| EcPS | 0.2 | 0.2 | 1 | 0.5 | 0.8 | 0.5 | 0.2 | 0.8 | 0.8 |
| BDS | 0.2 | 0.2 | 0.5 | 0.8 | 0.8 | 0.8 | 0.2 | 0.2 | 0.2 |
| Year | Gravity Center (X) | Gravity Center (Y) | Rotation Angle (°) |
|---|---|---|---|
| 2009 | 38,506,630.20 | 3,835,105.63 | 304 |
| 2018 | 38,506,400.00 | 3,835,300.00 | 310 |
| 2020 * | 38,506,200.00 | 3,835,500.00 | 315 |

References
- Ma, T.; Cao, X.; Zhao, H. Development Zone Policy and High-Quality Economic Growth: Quasi-Natural Experimental Evidence from China. Reg. Stud. 2023, 57, 590–605. [Google Scholar] [CrossRef] [Scilit]
- Chen, W.; Zeng, J.; Li, N. Change in Land-Use Structure Due to Urbanisation in China. J. Cleaner Prod. 2021, 321, 128986. [Google Scholar] [CrossRef] [Scilit]
- Zhou, Y.; Li, X.; Liu, Y. Rural Land System Reforms in China: History, Issues, Measures and Prospects. Land Use Policy 2020, 91, 104330. [Google Scholar] [CrossRef] [Scilit]
- Zhou, Y.; Wu, T.; Wang, Y. Urban Expansion Simulation and Development-Oriented Zoning of Rapidly Urbanising Areas: A Case Study of Hangzhou. Sci. Total Environ. 2022, 807, 150813. [Google Scholar] [CrossRef] [Scilit]
- Zhou, L.; Zhang, W.; Fang, C.; Sun, H.; Lin, J. Actors and Network in the Marketization of Rural Collectively-Owned Commercial Construction Land (RCOCCL) in China: A Pilot Case of Langfa, Beijing. Land Use Policy 2020, 99, 104990. [Google Scholar] [CrossRef] [Scilit]
- Hou, Y.; Li, Y.; Li, J.; Huang, Q.; Duan, X.; Feng, X.; Zhu, G. Simulating the Dynamics of Urban Land Quantity in China from 2020 to 2070 under the Shared Socioeconomic Pathways. Appl. Geogr. 2023, 159, 103094. [Google Scholar] [CrossRef] [Scilit]
- Wang, Y.; Song, C.; Gao, Y.; Ye, S.; Gao, P. Integrating National Integrated Assessment Model and Land-Use Intensity for Estimating China’s Terrestrial Ecosystem Carbon Storage. Appl. Geogr. 2024, 162, 103173. [Google Scholar] [CrossRef] [Scilit]
- Zhang, R.; Lee, C.Y.; Malahayati, M.; Xu, Y.; Onodera, S.; Saito, M.; Ridwansyah, I.; Wang, R. Optimizing Land Use for Carbon Neutrality: A Scenario Analysis in the Jakarta Metropolitan Area. Sustain. Futures 2025, 9, 100702. [Google Scholar] [CrossRef] [Scilit]
- Aghaloo, K.; Sharifi, A. Balancing Priorities for a Sustainable Future in Cities: Land Use Change and Urban Ecosystem Service Dynamics. J. Environ. Manag. 2025, 382, 125460. [Google Scholar] [CrossRef] [Scilit]
- Gong, Q.; Hui, X.; Tian, Z. Risk Section Classification of Tunnel Settlement Based on Land-Use Development Simulation and Uncertainty Analysis. Int. J. Transp. Sci. Technol. 2023, 12, 716–728. [Google Scholar] [CrossRef] [Scilit]
- Duan, Z.; Lu, C.; Wang, X.; Tang, X.; Sheng, S. Spatiotemporal Evolution and Multi-Scenario Simulation of Rural Settlements in Liangzhou District: Evidence from an Oasis Region in the Arid Northwest. Land 2025, 14, 2397. [Google Scholar] [CrossRef] [Scilit]
- Zhang, Z.; Pan, H.; Gan, J.; Sheng, S.; Lu, G. Spatiotemporal Evolution and Scenario Simulation of Landscape Ecological Risk in Hilly–Gully Regions: A Case Study of Zichang City. Land 2025, 14, 2358. [Google Scholar] [CrossRef] [Scilit]
- Liang, Y.; Zhang, L.; Li, Q.; Yang, L.; Sun, J.; Tian, G.; Wang, T.; Zhao, H.; Wang, D. Spatiotemporal Dynamics and Forecasting of Ecosystem Service Value in Zhengzhou Using Land-Use Scenario Simulation. Land 2025, 14, 2255. [Google Scholar] [CrossRef] [Scilit]
- Xing, X.; Wang, Q.; Meng, F.; Liu, P.; Huang, L.; Zhuo, W. Assessing the Land Use-Carbon Storage Nexus along G318: A Coupled SD-PLUS-InVEST Model Approach for Spatiotemporal Coordination Optimization. Land 2025, 14, 2067. [Google Scholar] [CrossRef] [Scilit]
- Han, S.; Kang, Y.; Jo, H.; Ahn, M.; Kim, T.; Son, S. Future Land Use and Cover Modeling in South Korea: Linking SSP-RCP with FLUS Model. Land 2025, 14, 2380. [Google Scholar] [CrossRef] [Scilit]
- Zhang, Y.; Zheng, M.; Qin, B. Optimization of Spatial Layout Based on ESV-FLUS Model from the Perspective of “Production-Living-Ecological”: A Case Study of Wuhan City. Ecol. Modell. 2023, 481, 110356. [Google Scholar] [CrossRef] [Scilit]
- Jiang, X.; Zhai, S.; Liu, H.; Chen, J.; Zhu, Y.; Wang, Z. Multi-Scenario Simulation of Production-Living-Ecological Space and Ecological Effects Based on Shared Socioeconomic Pathways in Zhengzhou, China. Ecol. Indic. 2022, 137, 108750. [Google Scholar] [CrossRef] [Scilit]
- Lai, J.; Qi, S.; Chen, J.; Guo, J.; Wu, H.; Chen, Y. Exploring the Spatiotemporal Variation of Carbon Storage on Hainan Island and Its Driving Factors: Insights from InVEST, FLUS Models, and Machine Learning. Ecol. Indic. 2025, 172, 113236. [Google Scholar] [CrossRef] [Scilit]
- Wang, N.; Chen, X.; Zhang, Z.; Pang, J. Spatiotemporal Dynamics and Driving Factors of County-Level Carbon Storage in the Loess Plateau: A Case Study in Qingcheng County, China. Ecol. Indic. 2022, 144, 109460. [Google Scholar] [CrossRef] [Scilit]
- Zhang, Y.; Yu, P.; Tian, Y.; Chen, H.; Chen, Y. Exploring the Impact of Integrated Spatial Function Zones on Land Use Dynamics and Ecosystem Services Tradeoffs Based on a Future Land Use Simulation (FLUS) Model. Ecol. Indic. 2023, 150, 110246. [Google Scholar] [CrossRef] [Scilit]
- Yang, Y.; Chen, X.; Zhang, Y.; Cao, Y.; Jin, D. Multi-Scenario Simulation of Land Use Transition in a Post-Mining City Based on the GeoSOS-FLUS Model: A Case Study of Xuzhou, China. Land 2025, 14, 2442. [Google Scholar] [CrossRef] [Scilit]
- Lin, W.; Sun, Y.; Nijhuis, S.; Wang, Z. Scenario-Based Flood Risk Assessment for Urbanizing Deltas Using Future Land-Use Simulation (FLUS): Guangzhou Metropolitan Area as a Case Study. Sci. Total Environ. 2020, 739, 139899. [Google Scholar] [CrossRef] [Scilit]
- Zhang, L.; Feng, F.; Huang, H.; Cao, Y.; Jiang, S.; Shi, W.; Lv, H.; Xu, C.; Sanesi, G.; Lafortezza, R. Scenario-Based Simulation of Ecosystem Service Supply and Demand in China’s Yangtze River Economic Belt. Environ. Res. 2025, 285, 122264. [Google Scholar] [CrossRef] [Scilit]
- Xu, Y.; Xiao, C.; Bai, J.; Wang, D.; Wen, L.; Long, L.; Qiu, J.; Zhang, Y. Spatio-Temporal Evolution of Coastal Wetlands and Carbon Storage Driven by Natural and Anthropogenic Processes in Yancheng City, China. Estuarine Coastal Shelf Sci. 2025, 325, 109466. [Google Scholar] [CrossRef] [Scilit]
- Yu, T.; Jia, S.; Zhang, Y.; Cui, X. How Can Urban Expansion and Ecological Preservation Be Balanced? A Simulation of the Spatial Dynamics of Production-Living-Ecological Spaces in the Huaihe River Eco-Economic Belt. Ecol. Indic. 2025, 171, 113192. [Google Scholar] [CrossRef] [Scilit]
- Shi, P.; Zhou, D.; Jiang, J.; Huang, X.; Zhang, J.; Dong, Q.; Jia, Y. Spatiotemporal Evolution Pattern of Water Yield Service of Ecosystems in the Shule River Basin, Northwest China, Integrating Future Climate and Land Use Changes. Ecol. Indic. 2025, 181, 114452. [Google Scholar] [CrossRef] [Scilit]
- Hu, Y.; Gao, M.; Batunacun. Evaluations of Water Yield and Soil Erosion in the Shaanxi-Gansu Loess Plateau under Different Land Use and Climate Change Scenarios. Environ. Dev. 2020, 34, 100488. [Google Scholar] [CrossRef] [Scilit]
- Liang, Z.; Liang, X.; Jiang, X.; Li, T.; Guan, Q. Balancing Simulation Performance and Computational Intensity of CA Models for Large-Scale Land-Use Change Simulations. Environ. Modell. Softw. 2025, 185, 106293. [Google Scholar] [CrossRef] [Scilit]
- Ma, L.; Wang, Q.; Zhu, Y.; Liu, Z. The Impact and Mechanism of New-Type Urbanization on High-Quality Forestry Development: A Case Study of the Yellow River Basin in China. Diversity 2025, 17, 7. [Google Scholar] [CrossRef] [Scilit]
- Yu, Y.; Zhao, K.; Du, Y. Nexus between New-Type Urbanization, Economic Development, and Haze Pollution in China: A Spatial Analysis. J. Urban Plann. Dev. 2024, 150, 04024043. [Google Scholar] [CrossRef] [Scilit]
- Li, T.; Nie, J.; Qiu, G.; Li, Z.; Ji, C.; Li, X. Time Series Forecasting via an Elastic Optimal Adaptive GM(1,1) Model. Electronics 2025, 14, 2071. [Google Scholar] [CrossRef] [Scilit]
- Li, D.; Qiu, M.; Yang, S.; Wang, C.; Luo, Z. An Optimal Fractional-Order Accumulative Grey Markov Model with Variable Parameters and Its Application in Total Energy Consumption. AIMS Math. 2023, 8, 26425–26443. [Google Scholar] [CrossRef] [Scilit]
- Xie, G.; Zhang, C.; Zhang, C.; Xiao, Y.; Lu, C. The Value of Ecosystem Services in China. Resour. Sci. 2015, 37, 1740–1746. (In Chinese) [Google Scholar]
- Wu, J.; Luo, J.; Zhang, H.; Qin, S.; Yu, M. Projections of Land Use Change and Habitat Quality Assessment by Coupling Climate Change and Development Patterns. Sci. Total Environ. 2022, 847, 157491. [Google Scholar] [CrossRef] [Scilit]
- Men, D.; Pan, J. Ecological Network Identification and Connectivity Robustness Evaluation in the Yellow River Basin under a Multi-Scenario Simulation. Ecol. Modell. 2023, 482, 110384. [Google Scholar] [CrossRef] [Scilit]
- Luan, C.; Liu, R. Integrated Ecological and Environmental Spatial Soft Constraint Mechanism: Urban Multi-Objective Land Use Optimization under Multiple Scenarios. J. Environ. Manag. 2025, 385, 125661. [Google Scholar] [CrossRef] [Scilit]
- Zhang, X.; Ren, W.; Peng, H. Urban Land Use Change Simulation and Spatial Responses of Ecosystem Service Value under Multiple Scenarios: A Case Study of Wuhan, China. Ecol. Indic. 2022, 144, 109526. [Google Scholar] [CrossRef] [Scilit]
- Yu, B.; Zang, Y.; Wu, C.; Zhao, Z. Spatiotemporal Dynamics of Wetlands and Their Future Multi-Scenario Simulation in the Yellow River Delta, China. J. Environ. Manag. 2024, 353, 120193. [Google Scholar] [CrossRef] [Scilit]
- Cartier, C.; Oakes, T. Introduction: Vast Land of Borders: Empire, State, and Territory in China. Eurasian Geogr. Econ. 2024, 65, 709–729. [Google Scholar] [CrossRef] [Scilit]
- Grillitsch, M.; Sotarauta, M. Trinity of Change Agency, Regional Development Paths and Opportunity Spaces. Prog. Hum. Geogr. 2020, 44, 704–723. [Google Scholar] [CrossRef] [Scilit]
- GB/T 21010-2017; Current Land Use Classification. Standards Press of China: Beijing, China, 2017.



| Data Category | Data Name | Year | Source |
|---|---|---|---|
| Statistical data | Basic Economic Data of the Study Area | 2015–2020 | Zhengzhou Statistical Yearbook (2015–2020); Xinzheng Statistical Yearbook (2015–2020); Socioeconomic statistics provided by Longhu Town Government (2015–2020) |
| Land use data | Land use data | 2015–2020 | Data provided by the Xinzheng Municipal Bureau of Natural Resources and Planning (2015–2020) |
| Natural Environment Data | DEM elevation | 2020 | Geospatial Data Cloud, Computer Network Information Center, Chinese Academy of Sciences https://www.gscloud.cn |
| Slope | 2020 | ||
| Slope direction | 2020 | ||
| Water Area Spatial Data | 2020 | ||
| Transportation Network Data | Distance to a highway, Distance to a railway | 2020 | Geospatial Data Cloud, Computer Network Information Center, Chinese Academy of Sciences https://www.gscloud.cn |
| Distance to a town center | 2020 | ||
| Socio-economic Data | GDP density | 2020 | Geospatial Data Cloud, Computer Network Information Center, Chinese Academy of Sciences https://www.gscloud.cn |
| Population density | 2020 |
| Constraint Category | Factor | Expression (Unit: hm2) | Explanation |
|---|---|---|---|
| Total Area | Total Land Area | S1 + S2 + ……. S9 = 9800 | Total area consistency |
| Planning Targets | Cropland | 666.97 ≤ S1 ≤ 806.76 | Mandatory targets |
| Garden Land | 2110.03 ≤ S2 ≤ 2353.31 | Mandatory targets | |
| Forest Land | 1720.42 ≤ S3 ≤ 2006.79 | Mandatory targets | |
| Urban-Industrial-Mining Land | 2948.45 ≤ S4 ≤ 4709.17 | Mandatory targets | |
| Scenic and Special-Use Land | 54.30 ≤ S5 ≤ 386.82 | Mandatory targets | |
| Transportation and Water Conservancy Land | 656.43 ≤ S6 ≤ 667.68 | Mandatory targets | |
| Village Land | 978.20 ≤ S7 ≤ 998.8 | Mandatory targets | |
| Grassland | 47.57 ≤ S8 ≤ 101.09 | Mandatory targets | |
| Water and Tidal Flats | 117 ≤ S9 ≤ 161 | Mandatory targets | |
| Intensive Dev | Coordination Index | 0.15 ≤ S6/S4 ≤ 0.25 | Development patterns |
| Urban-Rural Ratio | 0.28 ≤ S7/S4 ≤ 0.34 | Development patterns | |
| Dev. Intensity | 0.46 ≤ (S4 + S6 + S7)/9800 ≤ 0.55 | Development patterns |
| Scenario | Economic Weight | Ecological Weight | Core Focus |
|---|---|---|---|
| EPS | 0.8 | 0.2 | Maximizing land utilization efficiency within minimal regulatory limits. |
| EcPS | 0.2 | 0.8 | Prioritizing ecological security within strict ecological carrying capacities. |
| BDS | 0.5 | 0.5 | Balancing development and protection through refined spatial governance. |
| Land-Use Type | 2020 Area (hm2) | EPS (2030) | EcPS (2030) | BDS (2030) | ||||||
|---|---|---|---|---|---|---|---|---|---|---|
| Area | Change | % | Area | Change | % | Area | Change | % | ||
| S1 Cropland | 806.73 | 666.97 | −139.76 | −17.32 | 806.7 | −0.03 | 0 | 806.7 | −0.03 | 0 |
| S2 Garden Land | 2353.32 | 2110.03 | −243.29 | −10.34 | 2343.21 | −10.11 | −0.43 | 2343.31 | −10.01 | −0.43 |
| S3 Forest Land | 1720.42 | 1720.42 | 0 | 0 | 1811.11 | +90.69 | +5.27 | 1762.48 | +42.06 | +2.44 |
| S4 Urban-Industrial-Mining Land | 2948.45 | 3437.83 | +489.38 | +16.60 | 2948.45 | 0 | 0 | 2969.6 | +21.15 | +0.72 |
| S5 Scenic and Special-Use Land | 54.3 | 54.3 | 0 | 0 | 88.23 | +33.93 | +62.48 | 64.3 | +10.00 | +18.41 |
| S6 Transportation and Water Conservancy Land | 656.43 | 667.68 | +11.25 | +1.71 | 656.43 | 0 | 0 | 656.43 | 0 | 0 |
| S7 Village Land | 998.26 | 978.2 | −20.06 | −2.01 | 981.3 | −16.96 | −1.7 | 979.09 | −19.17 | −1.92 |
| S8 Grassland | 101.09 | 47.57 | −53.52 | −52.94 | 47.57 | −53.52 | −52.94 | 101.09 | 0 | 0 |
| S9 Water and Tidal Flats | 161 | 117 | −44 | −27.33 | 117 | −44 | −27.33 | 117 | −44 | −27.33 |
Disclaimer/Publisher’s Note: The statements, opinions and data contained in all publications are solely those of the individual author(s) and contributor(s) and not of MDPI and/or the editor(s). MDPI and/or the editor(s) disclaim responsibility for any injury to people or property resulting from any ideas, methods, instructions or products referred to in the content. |
© 2026 by the authors. Licensee MDPI, Basel, Switzerland. This article is an open access article distributed under the terms and conditions of the Creative Commons Attribution (CC BY) license.
Share and Cite
Ma, Y.; Shi, G.; Guo, Y. Multi-Scenario Simulation Analysis of Land Use Based on Geographical Processes: A Case Study of Longhu Town, China. Land 2026, 15, 340. https://doi.org/10.3390/land15020340
Ma Y, Shi G, Guo Y. Multi-Scenario Simulation Analysis of Land Use Based on Geographical Processes: A Case Study of Longhu Town, China. Land. 2026; 15(2):340. https://doi.org/10.3390/land15020340
Chicago/Turabian StyleMa, Yubo, Guoqing Shi, and Yitong Guo. 2026. "Multi-Scenario Simulation Analysis of Land Use Based on Geographical Processes: A Case Study of Longhu Town, China" Land 15, no. 2: 340. https://doi.org/10.3390/land15020340
APA StyleMa, Y., Shi, G., & Guo, Y. (2026). Multi-Scenario Simulation Analysis of Land Use Based on Geographical Processes: A Case Study of Longhu Town, China. Land, 15(2), 340. https://doi.org/10.3390/land15020340