Article

Establishing Linear Cultural Heritage Corridors by Integrating Cultural and Ecological Values: A Case Study of the Jinzhong Section of the Great Tea Road


School of Architecture, Tianjin University, Tianjin 300072, China
*
Author to whom correspondence should be addressed.
Land 2026, 15(2), 293; https://doi.org/10.3390/land15020293
Submission received: 29 December 2025 / Revised: 30 January 2026 / Accepted: 6 February 2026 / Published: 10 February 2026

Abstract

To address the challenge of disconnection between cultural and ecological values in Linear Cultural Heritage (LCH) conservation, this study examines the Jinzhong section of the Great Tea Road to develop a dual-dimensional framework for corridor identification and collaborative governance. The research establishes a dual-value evaluation system encompassing cultural and ecological dimensions, applied to grade 422 heritage sites. A potential corridor network is subsequently generated using the Minimum Cumulative Resistance (MCR) model. The study innovatively integrates the Multiple Centrality Analysis (MCA) model, employing heritage site values as network weights to identify and classify two primary corridor types: “culture-dominant” and “ecology-dominant” corridors. Through spatial overlay analysis, a ‘culture–ecology composite corridor’ network is ultimately constructed. The results demonstrate that the cultural value network exhibits a “monocentric” clustering pattern, whilst the ecological value network displays a “multicentric, networked” configuration, revealing significant spatial disjunction between the two systems. This analysis enables the identification of three corridor typologies—culturally dominant, ecologically dominant, and composite corridors integrating both values—alongside the positioning of key connectivity hubs and network vulnerability points across distinct value zones. The proposed “dual-dimension Multiple Centrality Analysis analytical framework” transforms the abstract concept of cultural–ecological value coupling into a quantifiable spatial analysis pathway, thereby addressing existing research gaps. This framework provides refined decision-making support for both conservation practices and World Heritage nomination processes of the Jinzhong section of the Great Tea Road, whilst offering a replicable scientific methodology for conserving comparable linear heritage sites globally.

1. Introduction

Linear Cultural Heritage (LCH) represents a distinctive heritage category characterised by ribbon-like spatial morphology that spans large-scale geographical regions whilst connecting diverse cultural nodes. Following the establishment of the global heritage conservation framework through the 1972 Convention Concerning the Protection of World Cultural and Natural Heritage [1], prominent LCH typologies—including canal systems [2], pilgrimage routes [3], and trade corridors [4]—have attracted increasing international recognition. LCH exhibits four defining characteristics: substantial spatial scale [5], extensive geographical coverage [6], pronounced landscape heterogeneity along corridors [7], and complex environmental compositions [8]. These attributes collectively constitute a chain-like cultural heritage system that functions as a cultural repository of significant humanistic value. With spatial and cultural continuity forming its foundational value framework, LCH’s cultural significance depends critically upon pathway-node accessibility, network connectivity, and the integrity of sequential place relationships. This continuity is spatially underpinned by ecological foundations and landscape environments. Consequently, LCH inherently embodies dual attributes wherein cultural narratives and ecological values are intrinsically interwoven [9].
The preservation of historical and cultural heritage has long encompassed consideration of surrounding natural environments, with its core approach promoting organic integration between heritage sites and their environmental contexts, transitioning from isolated site-based management towards regionalised, comprehensive conservation paradigms [10]. As a theoretical foundation, Julian H. Steward’s seminal “cultural ecology” concept, proposed in 1955, emphasised dynamic coupling between culture and environment [11], providing theoretical grounding for LCH given its linear structure and trans-regional attributes. Building upon this framework, scholarship at systemic scales has diversified across multiple strands, including heritage corridor organisation and construction [12], ecological network planning and optimisation [13], heritage conservation area zoning and management [14], traditional village cultural landscape identification and mapping [15], and cultural landscape security pattern determination [12], gradually establishing a consensus on advancing heritage–environment synergy through a systemic perspective. At the practical level, certain linear heritage sites have begun to explore cross-regional governance structures. The Appalachian National Scenic Trail in the United States [16,17] has coordinated natural resource conservation and recreational demands through “Management Zoning”; European Cultural Routes [18] similarly emphasise fostering cross-regional collaboration by establishing shared assessment frameworks. These empirical experiences indicate that governance of linear heritage is shifting from singular administrative control towards “Collaborative Governance” [19]. However, effective collaboration and public participation are highly dependent on scientific and transparent “spatial decision support systems” [9,20]. Without fine-grained spatial characterisation of heritage cultural and ecological values, stakeholder negotiations often lack objective foundations, making it difficult to reach consensus between conservation and development. Therefore, developing a quantifiable and visualised tiered zoning tool constitutes a prerequisite and foundation for achieving the complex governance objectives of linear heritage.
However, in LCH-specific research and practice, existing single-dimensional paradigms have proved inadequate for addressing its large spatial span, pronounced heterogeneity, and complex functions. At present, constructing an accurate spatial decision support system requires overcoming three prominent methodological and managerial challenges:
  • Fragmentation between cultural and ecological value assessment systems. Current heritage assessment largely takes authenticity and integrity as core indicators [21], whereas ecological assessment emphasises habitat quality [22], structural connectivity [23], and ecological risk [24]. The two systems lack a unified, comparable, and overlayable pathway in terms of indicator sets, weighting schemes, and spatial representation, resulting in the separation of cultural heritage conservation from ecological–environmental management and constraining fine-grained characterisation of LCH’s complex spatial attributes [25].
  • Homogenised management of corridor types. In management practice, existing studies on linear heritage and regional corridors commonly adopt a typological logic of “zoning–grading–differentiated control”. On the one hand, research on Linear Cultural Heritage stresses route-based organisation to link nodes, builds interpretive systems, and—under multi-actor participation [26] and cross-jurisdictional coordination frameworks—develops governance arrangements for segments with different functions. On the other hand, ecological and landscape studies often identify ecological corridors [27] and regulatory zones [28] guided by ecological security patterns [6], ecological risk [29], and suitability for use [8], and apply them to inform the adaptive use of Linear Cultural Heritage [6] and delineation of conservation boundaries [9]. In addition, studies defining cultural–ecological corridors [10,30] have proposed corridor construction and spatial delineation models for regional systems [31], providing methodological references for corridor zoning and grading [32]. Overall, existing “typological” outputs mostly serve a single objective (cultural display or ecological security) or evaluate culture and ecology in parallel; they still lack a comparable and overlayable “dual-value corridor” within a shared spatial network framework. Consequently, they cannot directly support fine-grained trade-offs among conservation, utilisation, and ecological carrying capacity in linear heritage governance.
  • Dynamic imbalance between development utilisation and ecological carrying capacity. From the perspective of sustainable landscape management [33], many LCH nodes face pressures from high-intensity tourism development [34] and capital involvement to stimulate along-corridor economic growth. This development model generates internal conflicts in governance: cultural tourism development seeks improved spatial accessibility [35,36] and facility convenience [37], whereas ecological conservation goals [35] require limiting the intensity of human disturbance. Hence, there is an urgent need for operational zoning-and-grading and differentiated control tools that match resource sensitivity and carrying capacity across different segments and that can be reasonably transferred to shared governance contexts of trans-regional linear heritage such as canals, ancient roads, and trade corridors.
Methodologically, international approaches to spatial identification have gradually evolved from using Landscape Character Assessment (LCA) [38] to delineate culture–nature synergistic units [39] towards cost-connectivity models based on the Minimum Cumulative Resistance (MCR) model [40] or cost distance [41], in which multi-factor overlays are used to characterise the corridor backbone that is “most traversable”. In the heritage field, MCR has also been used to simulate experiencers’ route choices and corridor construction under environmental resistance, often focusing on the cost of individual paths rather than the structure of the network [42,43]. However, pursuing only the shortest or lowest-cost paths may overlook the criticality, redundancy, and disturbance resistance of the overall network structure: corridors with similar “accessibility” may play entirely different intermediary roles and exhibit different structural vulnerabilities within the network. Ecological connectivity research has shown that urban expansion and land use change can reshape connectivity network structures and the importance of key nodes [44,45]. Therefore, to meet LCH’s composite demands of “continuous presentation–efficient organisation–resilience maintenance”, it is necessary to integrate the “passability” of cost connectivity with the “robustness” of network structure.
Against this background, spatial network analysis and centrality metrics provide methodological supplementation for corridor grading. Multiple Centrality Analysis (MCA) [46,47] and related network indices can characterise the structural roles of nodes and corridors within the overall network across dimensions such as closeness, betweenness, and straightness, and have been applied to scenarios including accessibility assessment and backbone identification in tourism-attraction networks. Compared with approaches that only output an “optimal path”, centrality metrics can identify key channels that undertake major circulation and connectivity functions, as well as potential bottlenecks and fragile links, thereby providing an evidence base for hierarchical management. This logic is highly consistent with the LCH emphasis on the “complete presentation of the route–node sequence”: introducing MCA into LCH research helps reveal, at the level of topology, the composite characteristics of corridors that are “accessible–more efficient–more robust”.
The Great Tea Road, a historic trade corridor connecting China, Mongolia, and Russia to European markets, has advanced its UNESCO World Heritage nomination through transnational cooperation in recent years. Traversing regions characterised by complex geographical variations, rich natural landscapes, and abundant cultural heritage, it possesses considerable historical, cultural, and ecological significance [48]. The Jinzhong section occupies the core of the historic Shanxi merchant network, distinguished by traditional banking institutions (piaohao), guild halls, courtyard architectural complexes, and distinctive settlement morphologies. This section is deeply integrated within the ecological framework encompassing the Fen River basin, Loess plateau terrain, and Taihang Mountain systems, thereby providing a natural spatial foundation where cultural narratives and ecological processes converge. However, accelerated urbanisation, intensive transportation development, and escalating tourism pressures have cumulatively compromised the continuity between cultural nodes and ecological substrates. Administrative boundaries further compound governance complexities in cross-regional coordination. In practice, there is a need for a corridor identification and grading method that can simultaneously respond to dual cultural–ecological objectives and provide quantitative support for both World Heritage nomination justification (highlighting Outstanding Universal Value (OUV), integrity, and heritage–environment interdependence) and spatial governance (zoning-based regulation, buffer systems, and coordinated implementation) [49].
To address these challenges, this study aims to develop a “dual-dimension Multiple Centrality” analytical framework integrating cultural and ecological values, so as to enable accurate identification and refined grading of Linear Cultural Heritage corridors. This framework seeks to move beyond the limitations of a single-value perspective: it not only provides quantitative evidence for constructing the spatial configuration of heritage corridors, but also offers an operational, graded inventory to support management decision-making under multi-objective conflicts.
Accordingly, the Great Tea Road (Jinzhong section)—a representative regional-scale Linear Cultural Heritage—is selected as the empirical case. This study focuses on the following three key scientific questions:
  • How can an evaluation system integrating cultural and ecological multidimensional values be constructed to quantitatively identify Linear Cultural Heritage corridors, thereby bridging the current disconnect between heritage conservation and ecological management?
  • How can the “dual-dimension Multiple Centrality” analytical framework be applied to deconstruct and grade the corridor network of the Great Tea Road (Jinzhong section)?
  • How can the outcomes of corridor classification and heritage site spatial analysis ultimately provide scientific and refined decision-making support for World Heritage nomination assessment, cross-regional spatial governance, and sustainable development of local communities in the Great Tea Road’s Jinzhong section?

2. Research Framework

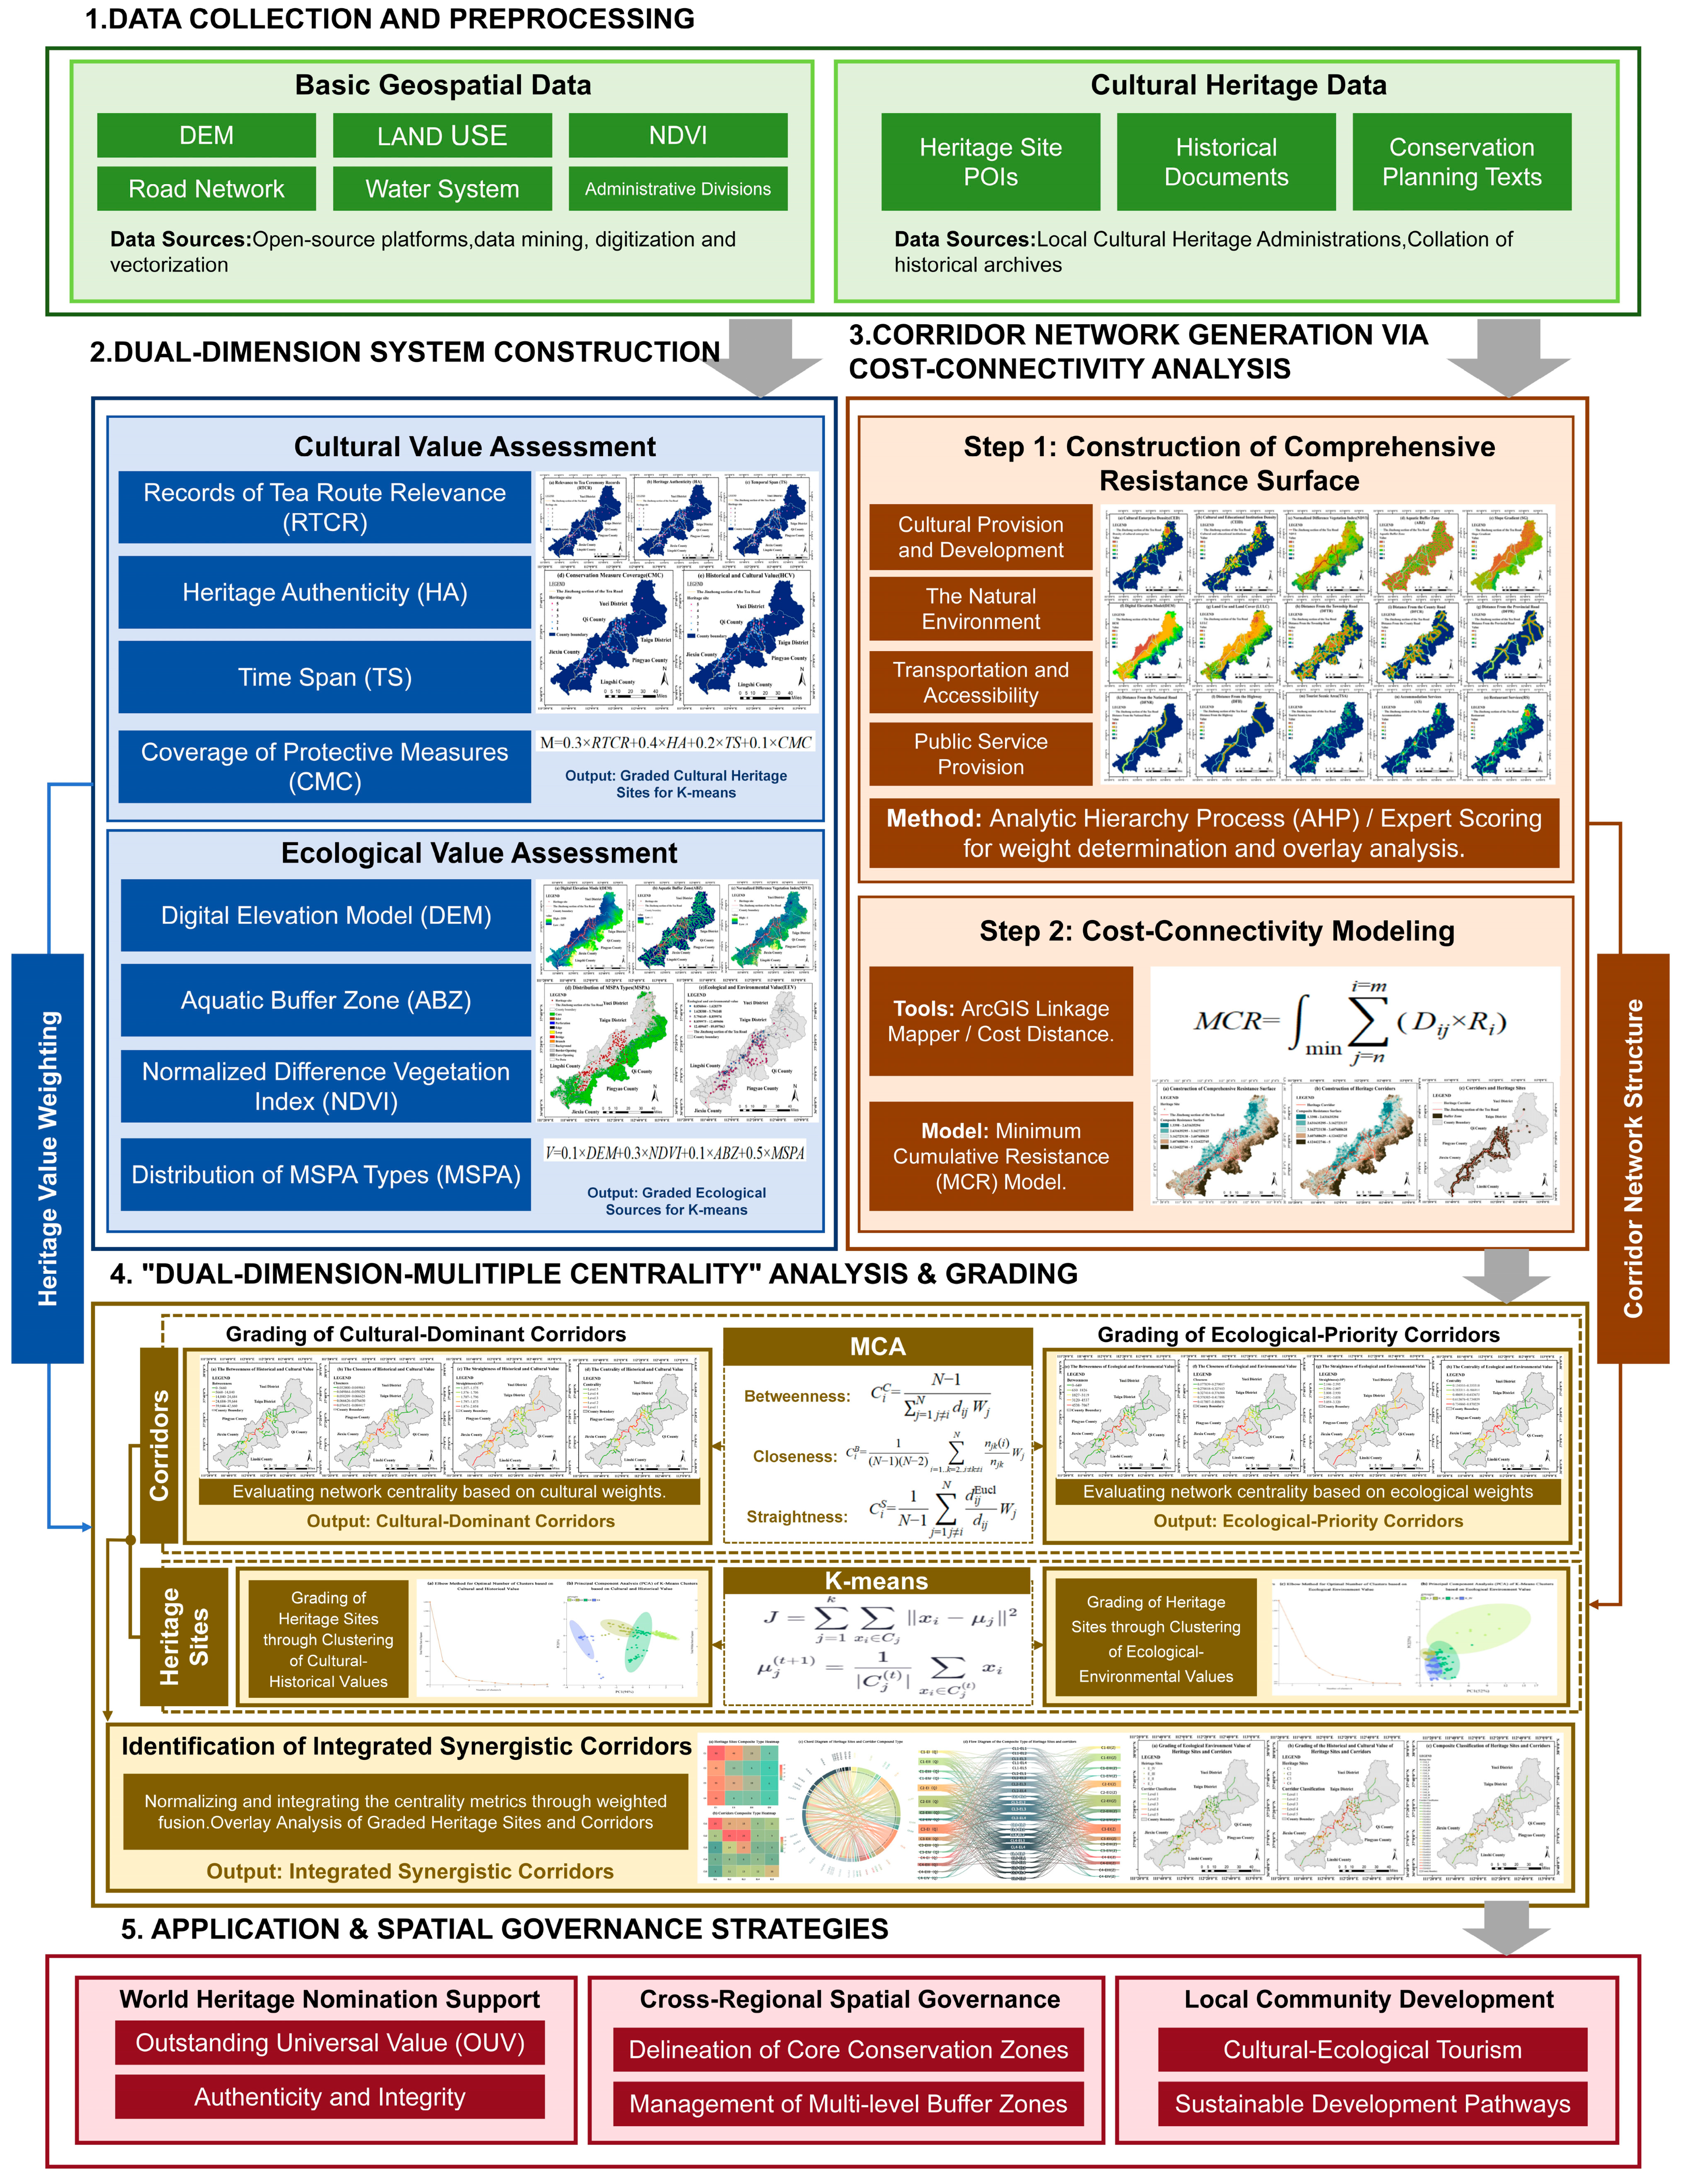
This study develops a “dual-dimension Multiple Centrality” spatial analytical framework integrating “value assessment–network construction–structural deconstruction–spatial governance” (Figure 1). Its logical workflow comprises four key stages:
  • Dual-Weight System Construction. Based on multi-source geospatial datasets and cultural heritage data, two indicator systems are established for cultural and ecological values, respectively.
For cultural value assessment, four quantitative indicators are adopted: Road–Tea Cultural Relevance (RTCR), Heritage Authenticity (HA), Time Span (TS), and Conservation Measures Coverage (CMC). Weighted aggregation is used to identify core heritage nodes.
For ecological value assessment, elevation (DEM), aquatic buffer zones (ABZs), vegetation cover (NDVI), and Morphological Spatial Pattern Analysis (MSPA) are selected to identify key ecological sources.
These two sets of results serve not only as inputs for subsequent K-means clustering, but also as the baseline weight parameters for later network centrality analyses.
2.
Corridor Network Generation (Cost-Connectivity-Based Physical Network). Using the ArcGIS platform, factors including elevation, slope, land use, distance to water systems, and transportation networks are overlaid. Weights are determined via the Analytic Hierarchy Process (AHP) to construct an integrated resistance surface. The Minimum Cumulative Resistance (MCR) model is then applied to simulate optimal low-cost paths between heritage sites, generating a baseline candidate corridor network and establishing the physical spatial connectivity of corridors.
3.
“Dual-Weight Multi-Centrality” Analysis. This is the core analytical module, aiming to deconstruct structure at both point and line levels:
Point level (Heritage Sites): Based on the cultural and ecological scores computed in Stage 1, K-means clustering is conducted to classify heritage sites into graded clusters, identifying cultural core areas and ecologically sensitive areas.
Line level (Corridors): Multiple Centrality Assessment (MCA) is introduced to calculate corridor betweenness, closeness, and straightness within the network. Distinct from conventional approaches, this study separately applies the cultural and ecological weight systems for weighted computation, thereby enabling precise identification and grading of cultural-value-dominant corridors and ecological-value-dominant corridors.
4.
Application and Governance (Multi-Dimensional Overlay and Collaborative Strategies). Finally, graded heritage sites and corridor networks are spatially overlaid and coupled to identify Integrated Synergistic Corridors featuring both strong cultural linkage and high ecological value. Based on this graded inventory, differentiated spatial governance strategies are proposed from three dimensions: World Heritage nomination justification, cross-regional spatial regulation, and community sustainable development.

2.1. Study Area

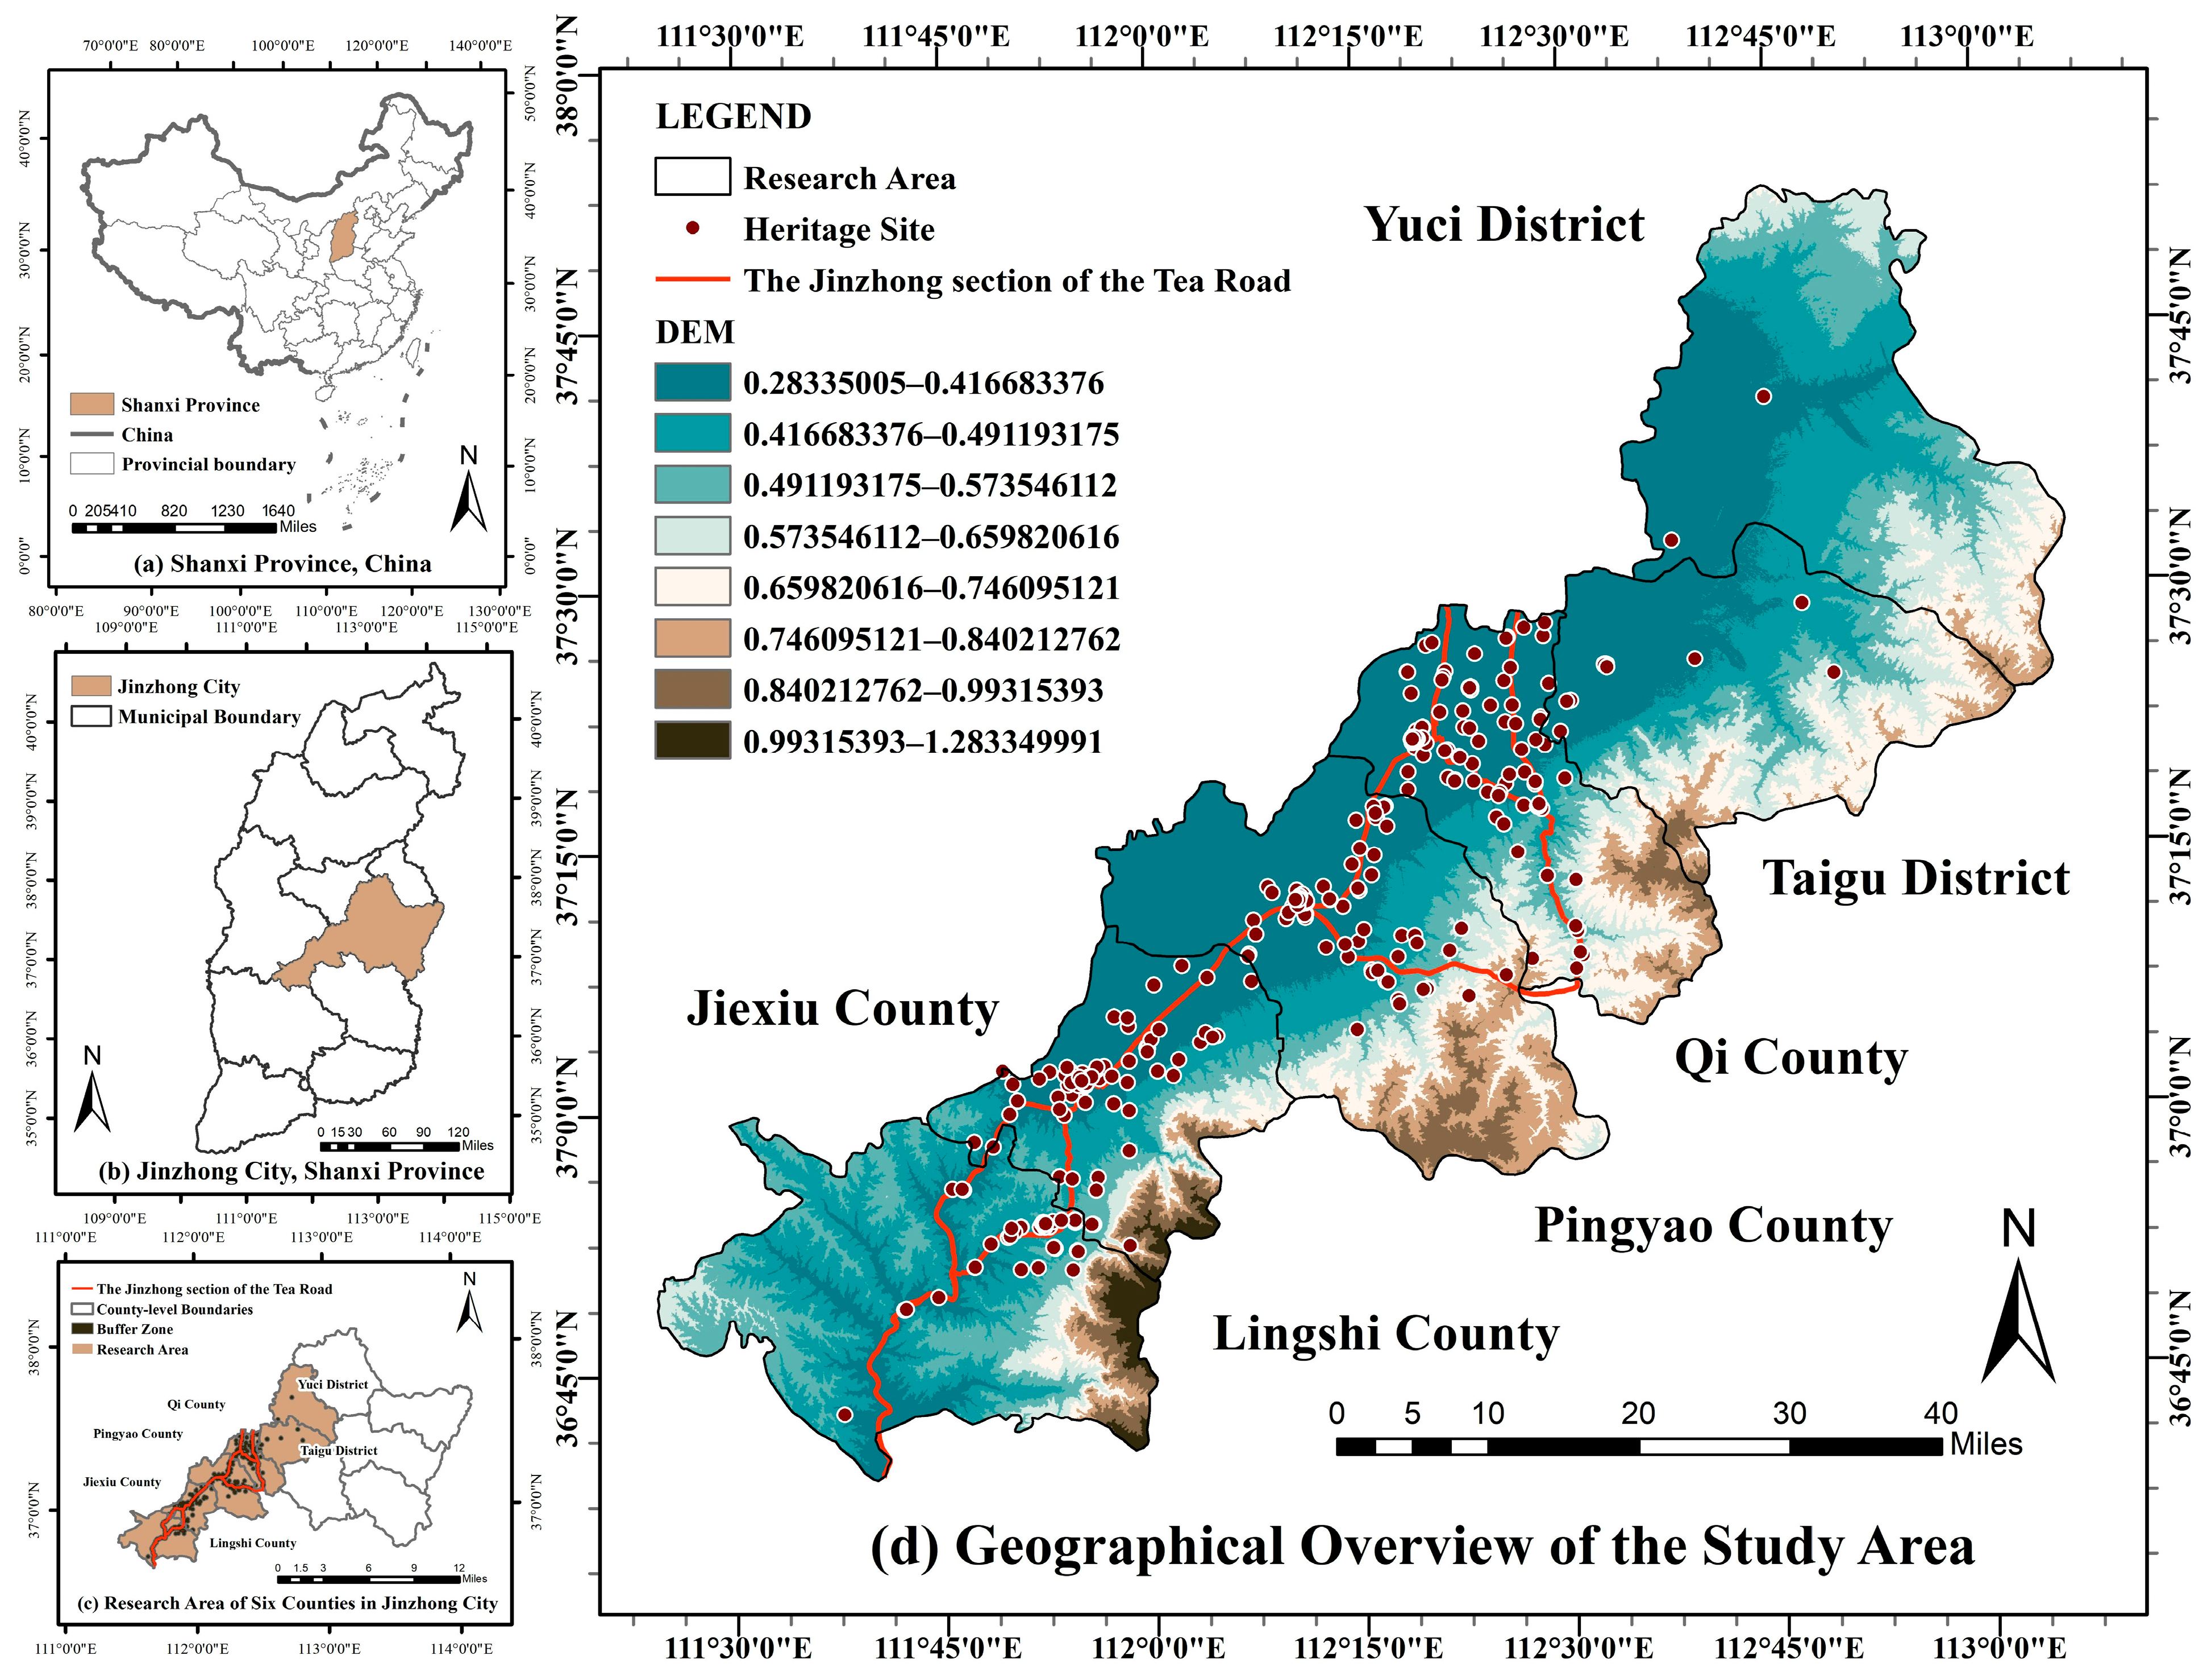
The Jinzhong section, as a vital component of the Great Tea Road, spans six administrative units within Jinzhong City, Shanxi Province: Jiexiu City, Lingshi County, Pingyao County, Qi County, Taigu District, and Yuci District. Its geographical coordinates range between 111°19′–112°20′ E longitude and 36°40′–37°10′ N latitude, covering a total area of approximately 6414 km2. From a physical–geographical perspective, the region’s topography is predominantly characterised by mountains, hills, and plains, experiencing a warm temperate continental monsoon climate with distinct seasons: cold, dry winters and hot, rainy summers. Spring and autumn exhibit significant temperature variations, with an annual average temperature of approximately 10.4 °C and annual precipitation of around 540 mm. The predominant vegetation types comprise forests, grasslands, shrublands, and herbaceous plants, featuring rich botanical diversity and varied ecosystems. Regarding the socio-cultural context, the region has a current population of approximately 2.6 million, predominantly Han Chinese, with 26 ethnic minorities including Hui, Manchu, and Mongol populations. The economic structure is dual-driven by industry and tourism. During the Ming and Qing dynasties, tea merchants rose to prominence, dominating trade along the Great Tea Road (Figure 2).
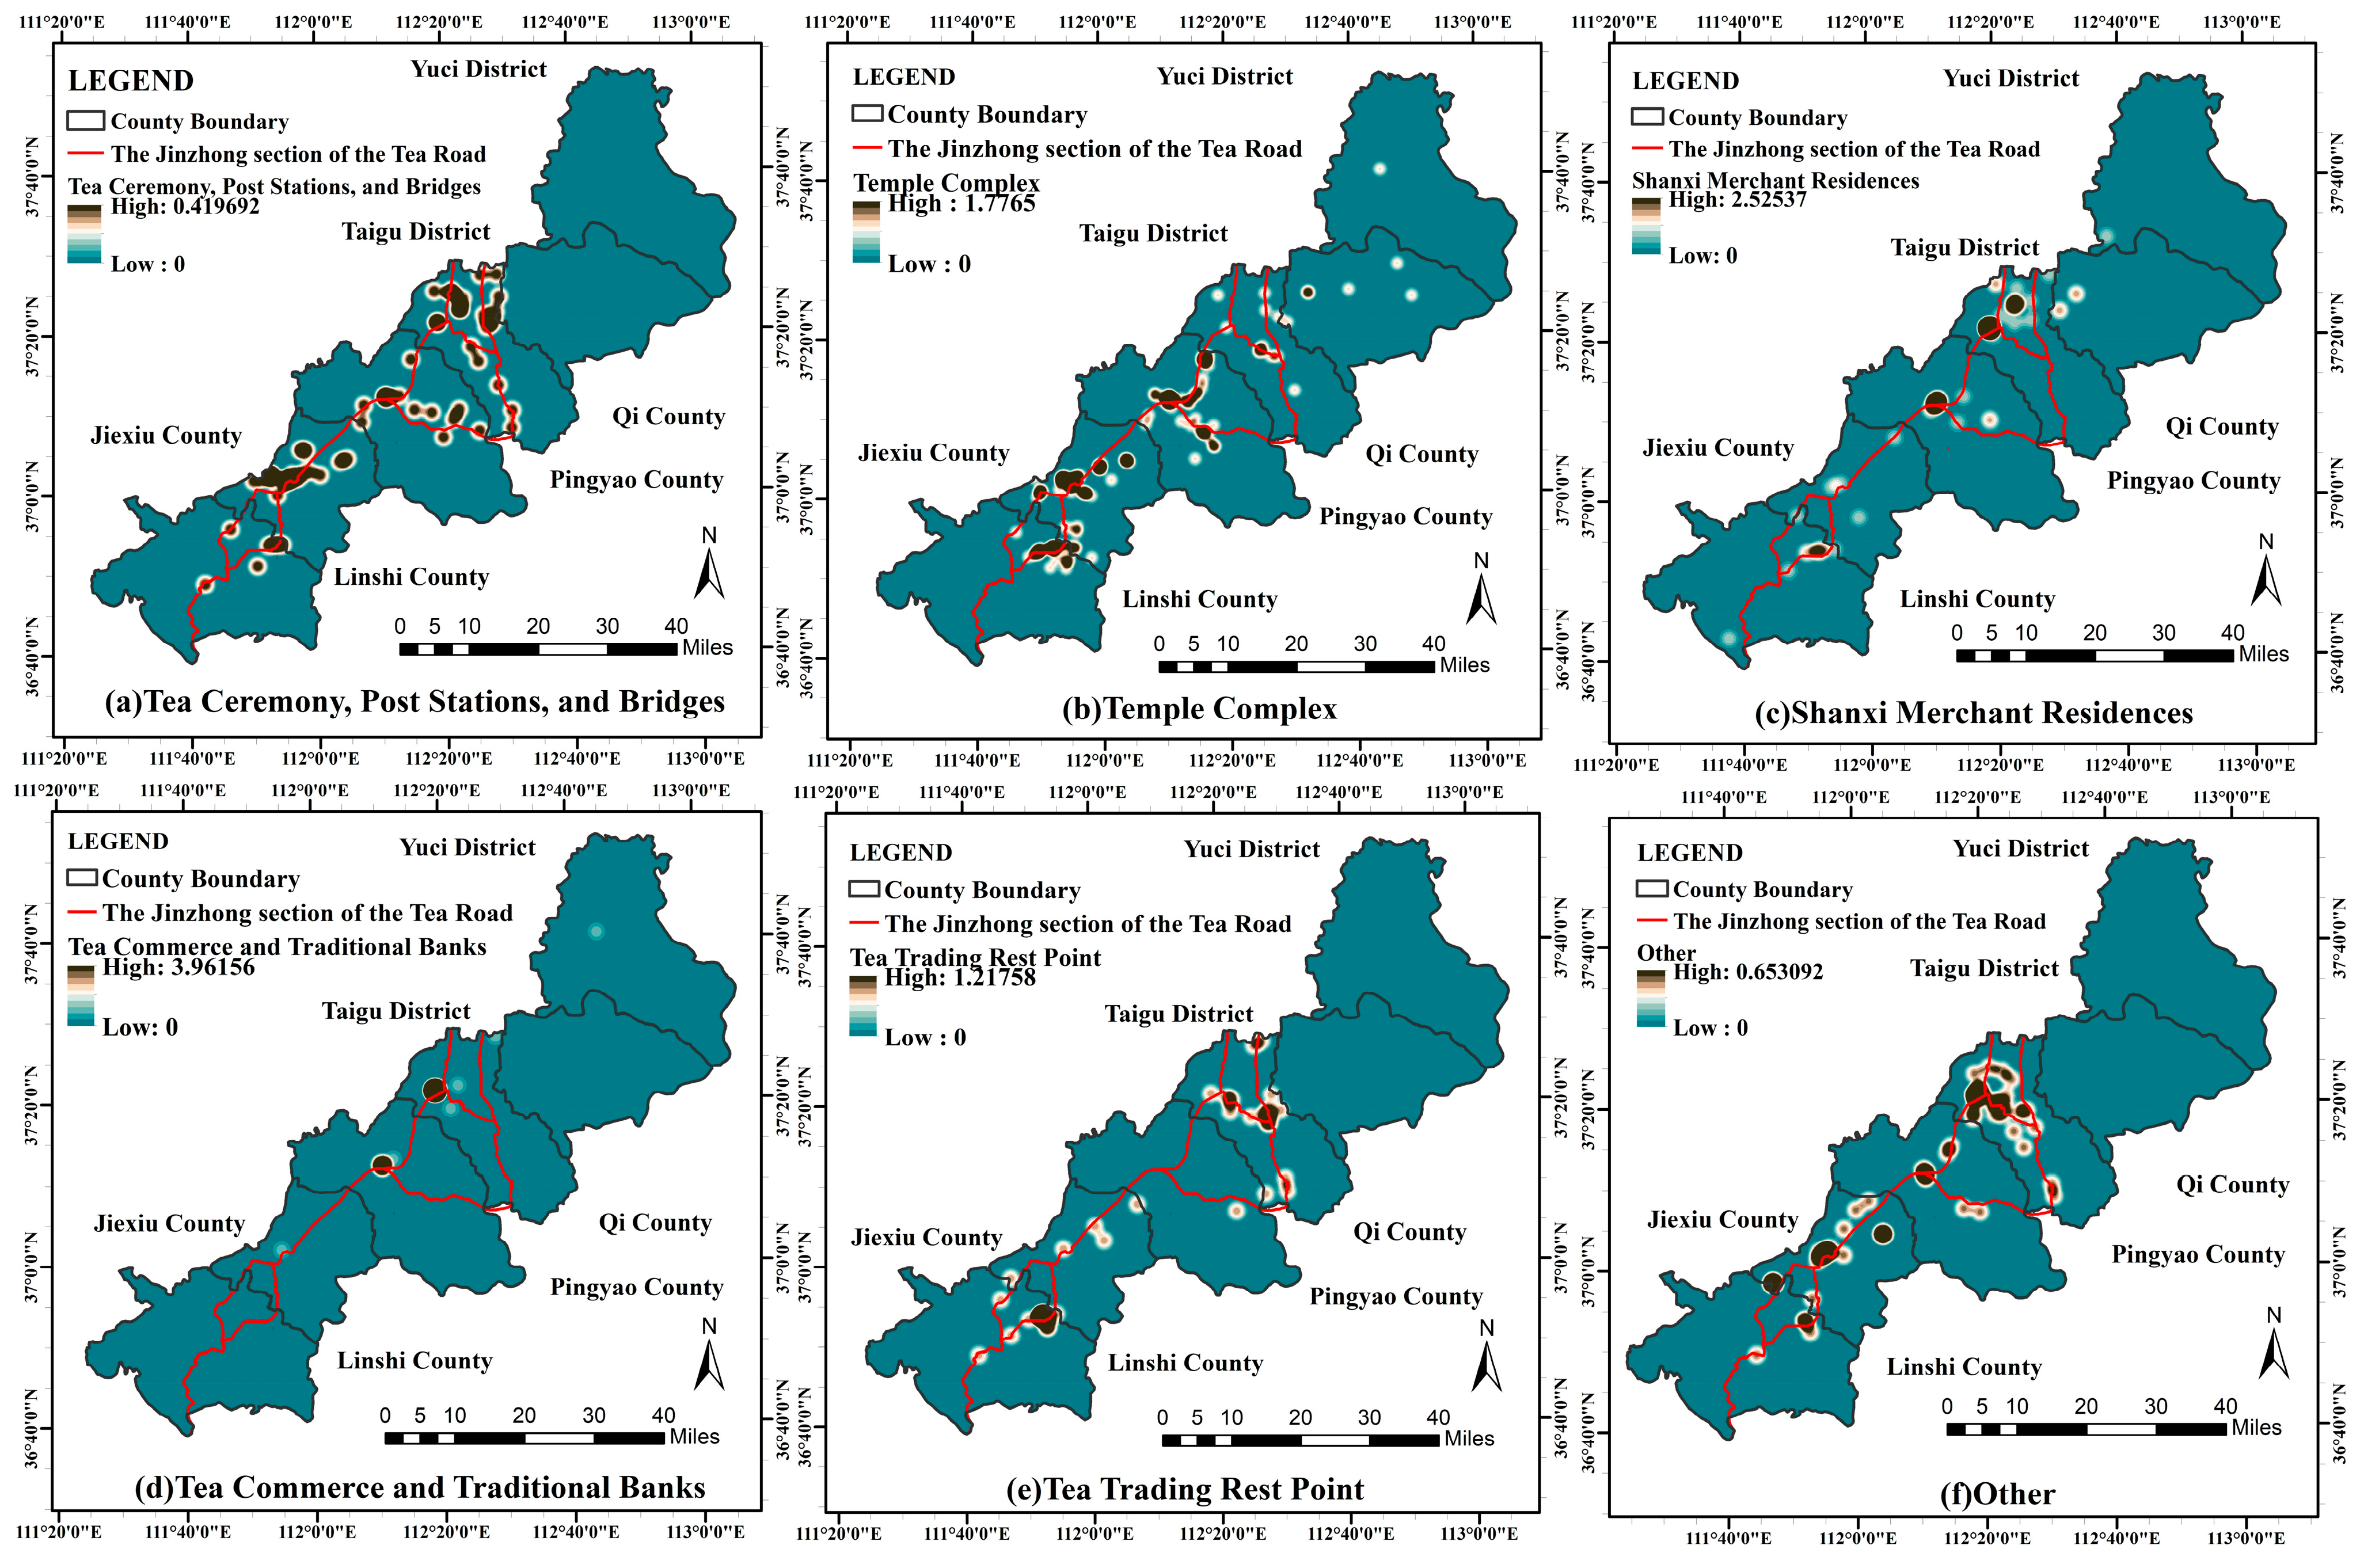
A total of 422 identified Tea Road heritage sites within the region encompass various categories: Tea Ceremony Sites, Post Stations and Bridges, Shanxi Merchant Residences, Tea Commerce and Traditional Banks, Tea Trading Rest Points, Temple Complexes, and Other heritage sites. These heritage sites are predominantly concentrated along the Fen River valley and densely populated commercial hubs, with their distribution influenced by topographical factors (Fen River valley corridor), transportation networks (ancient routes and post stations), and commercial demand (Figure 3).

2.2. Indicator Selection and Data Sources

Within Shanxi Province, The Great Tea Road is primarily divided into two major routes: the West Route and the Great West Route. These two routes converge in Qixian County, Jinzhong City, before extending northward together [50,51]. In this study, we determined the route data for the Jinzhong Section through a multi-method approach [52,53,54,55], combining historical records from the Qing Dynasty merchant manuscript Essentials for Traveling Merchants (Xingshang Yiyao) and the relevant academic literature, alongside semi-structured interviews and field surveys conducted from February to July 2024 with 12 descendants of Jin merchants and local heritage conservation experts.
Heritage-site data were collected via three channels. Field surveys conducted from November 2023 to August 2024 verified 232 heritage sites with clear documentary evidence [51,56]; 108 additional sites were supplemented based on local heritage protection inventories and the reconstructed route data; and 82 more sites were further confirmed through in-depth interviews with heritage experts and Jin merchant descendants. After preliminary screening, a total of 422 historical remains along the Jinzhong section were identified and geocoded.
Two indicator models were then established. Model 1 supports weighted valuation of heritage sites: Historical and Cultural Value (HCV) focuses on historical authenticity and current conservation status, while Ecological and Environmental Value (EEV) captures habitat quality and landscape connectivity potential of heritage settings (Table 1). Model 2 is used to construct the integrated resistance surface, with four categories of resistance variables: Natural Environment (NE), Transportation Networks (TNs), Public Services (PSs), and Cultural Development (CD) (Table 2).
To enhance specificity and accuracy, the entropy weight method was employed to assign indicator weights based on their data variation, reducing subjectivity associated with manual weighting and improving the transparency and rigour of the computation process.

2.3. Research Methods

2.3.1. Identification of Ecological Sources Based on MSPA

The MSPA model serves as a structural connectivity assessment tool, aiding in the identification of sources and the construction of resistance surfaces [57]. Within the study area, land types including woodlands, shrublands, grasslands, and water bodies were analysed using the MSPA method. This analysis categorised them into seven distinct green landscape structural types: core areas, islands, perforated areas, edges, loops, bridges, and branches. Using landscape indices such as the integral connectivity index (IIC), connectivity probability (PC), and PC increment (dPC), we quantitatively assessed patches within core areas [23]. This assessment aids in identifying primary ecological sources within the study area.
IIC = i = 1 n j = 1 n a i   ×   a j 1 + n l ij A L 2
PC = i = 1 n j = 1 n a i   ×   a j   × P ij * A L 2
dPC = PC     P C remove PC   ×   100 %
In the formula, n is the total number of patches; a i and a j are the areas of patch i and j , respectively; n l ij is the number of links on the shortest path between patch i and patch j ; P ij * represents the maximum probability of species dispersal between patch i and j ; A L is the total area of the landscape; and P C remove represents the PC value after removing one patch from the study area. For the IIC, 0     IIC   <   1 , where IIC   =   0 indicates no connectivity between patches and IIC   =   1 indicates the landscape is fully connected. When 0   <   PC   <   1 , a larger PC value indicates a greater degree of connectivity for the patch. A larger dPC value indicates greater importance of the patch.

2.3.2. Minimum Cumulative Resistance (MCR) Model

The MCR model was initially applied to studies of species dispersal processes. Lin et al. adapted it for analysing the suitability of heritage corridors [58], simulating the spatial movement of participants along defined routes to reach various heritage sites. The formula is as follows:
MCR = min j = n i = m ( D ij   ×   R i )
In the formula: MCR is the minimum cumulative resistance value; D ij is the spatial distance for an experiencer from environmental element i to heritage source j ; and R i is the resistance coefficient of environmental element i to the experiencer’s spatial movement process.

2.3.3. Multi-Centre Assessment (MCA) Model

Based on the MCA model [59], utilising the Urban Network Analysis tool (UNA), the road centrality of the candidate corridor network for the Jinzhong section of the Great Tea Road was measured using proximity, intermediary and directness metrics.
(1) Closeness centrality refers to the degree of nearness between a given heritage site and other heritage sites, specifically the composite distance proximity experienced by visitors. It is measured as the reciprocal of the average distance from a given node to all other nodes. A higher value indicates greater proximity to other nodes and a more central position. The formula is as follows:
C i C = N     1 j = 1   j i N d ij W j
In the formula: C i C is the closeness centrality of node i ; N is the number of nodes in the road network; d ij is the shortest distance between node i and j ; and W j is the weight of node j .
(2) Betweenness centrality denotes the sum of the proportion of shortest paths between any two heritage sites that pass through a given heritage site. This serves to measure the traffic flow value of a network node: the higher the value, the greater the number of shortest paths traversing that heritage site, indicating a high traffic value. The formula is as follows:
C i B = 1 ( N     1 ) ( N     2 ) j = 1 ,   k = 2 ,   j k i N n jk ( i ) n jk W j
In the formula: C i B is the betweenness centrality of node i ; n jk is the number of shortest paths between node j and k ; n jk ( i ) is the number of shortest paths between node j and k that pass through node i .
(3) Straightness centrality refers to the ratio of the Euclidean distance from a heritage site to all network nodes to the actual geographical distance within the network. It measures the deviation between the shortest path and the direct route between two nodes. The closer the ratio approaches 1, the higher the transport efficiency, meaning visitors can reach destinations more directly. The formula is as follows:
C i S = 1 N     1 j = 1   j i N d ij Eucl d ij W j
In the formula: C i S is the straightness of node i ; d ij Eucl and d ij are the Euclidean distance and the shortest distance between node i and j , respectively.

2.3.4. K-Means Clustering

K-Means is a classical unsupervised clustering algorithm designed to objectively partition a dataset into a predetermined number of clusters. In this study, the method was employed to automatically and quantitatively grade the cultural and ecological value scores of heritage sites. The core principle of K-Means involves iterative optimisation to identify a partitioning scheme that minimises the “within-cluster sum of squares” (WCSS) across all clusters. Employing the K-Means approach enables the identification of intrinsic structures based on the inherent distribution characteristics of the value data itself, thereby forming an objective hierarchical classification. This avoids the subjectivity inherent in manually setting thresholds within traditional grading systems, significantly enhancing the scientific rigour and reproducibility of the heritage site grading framework [60]. Its objective function is defined as:
J = j = 1 k x i C j x i     μ j 2
where C j represents the j -th cluster; x i is the value vector of a heritage site within the cluster; and μ j is the centroid (mean vector) of that cluster. The algorithm works by repeatedly executing the two steps of “assigning data points to the nearest centroid” and “updating the centroid’s position” until convergence, ultimately grouping heritage sites with similar features into a single class.

3. Results

3.1. Heritage Site Value Weighting

3.1.1. Weighting for Historical and Cultural Value

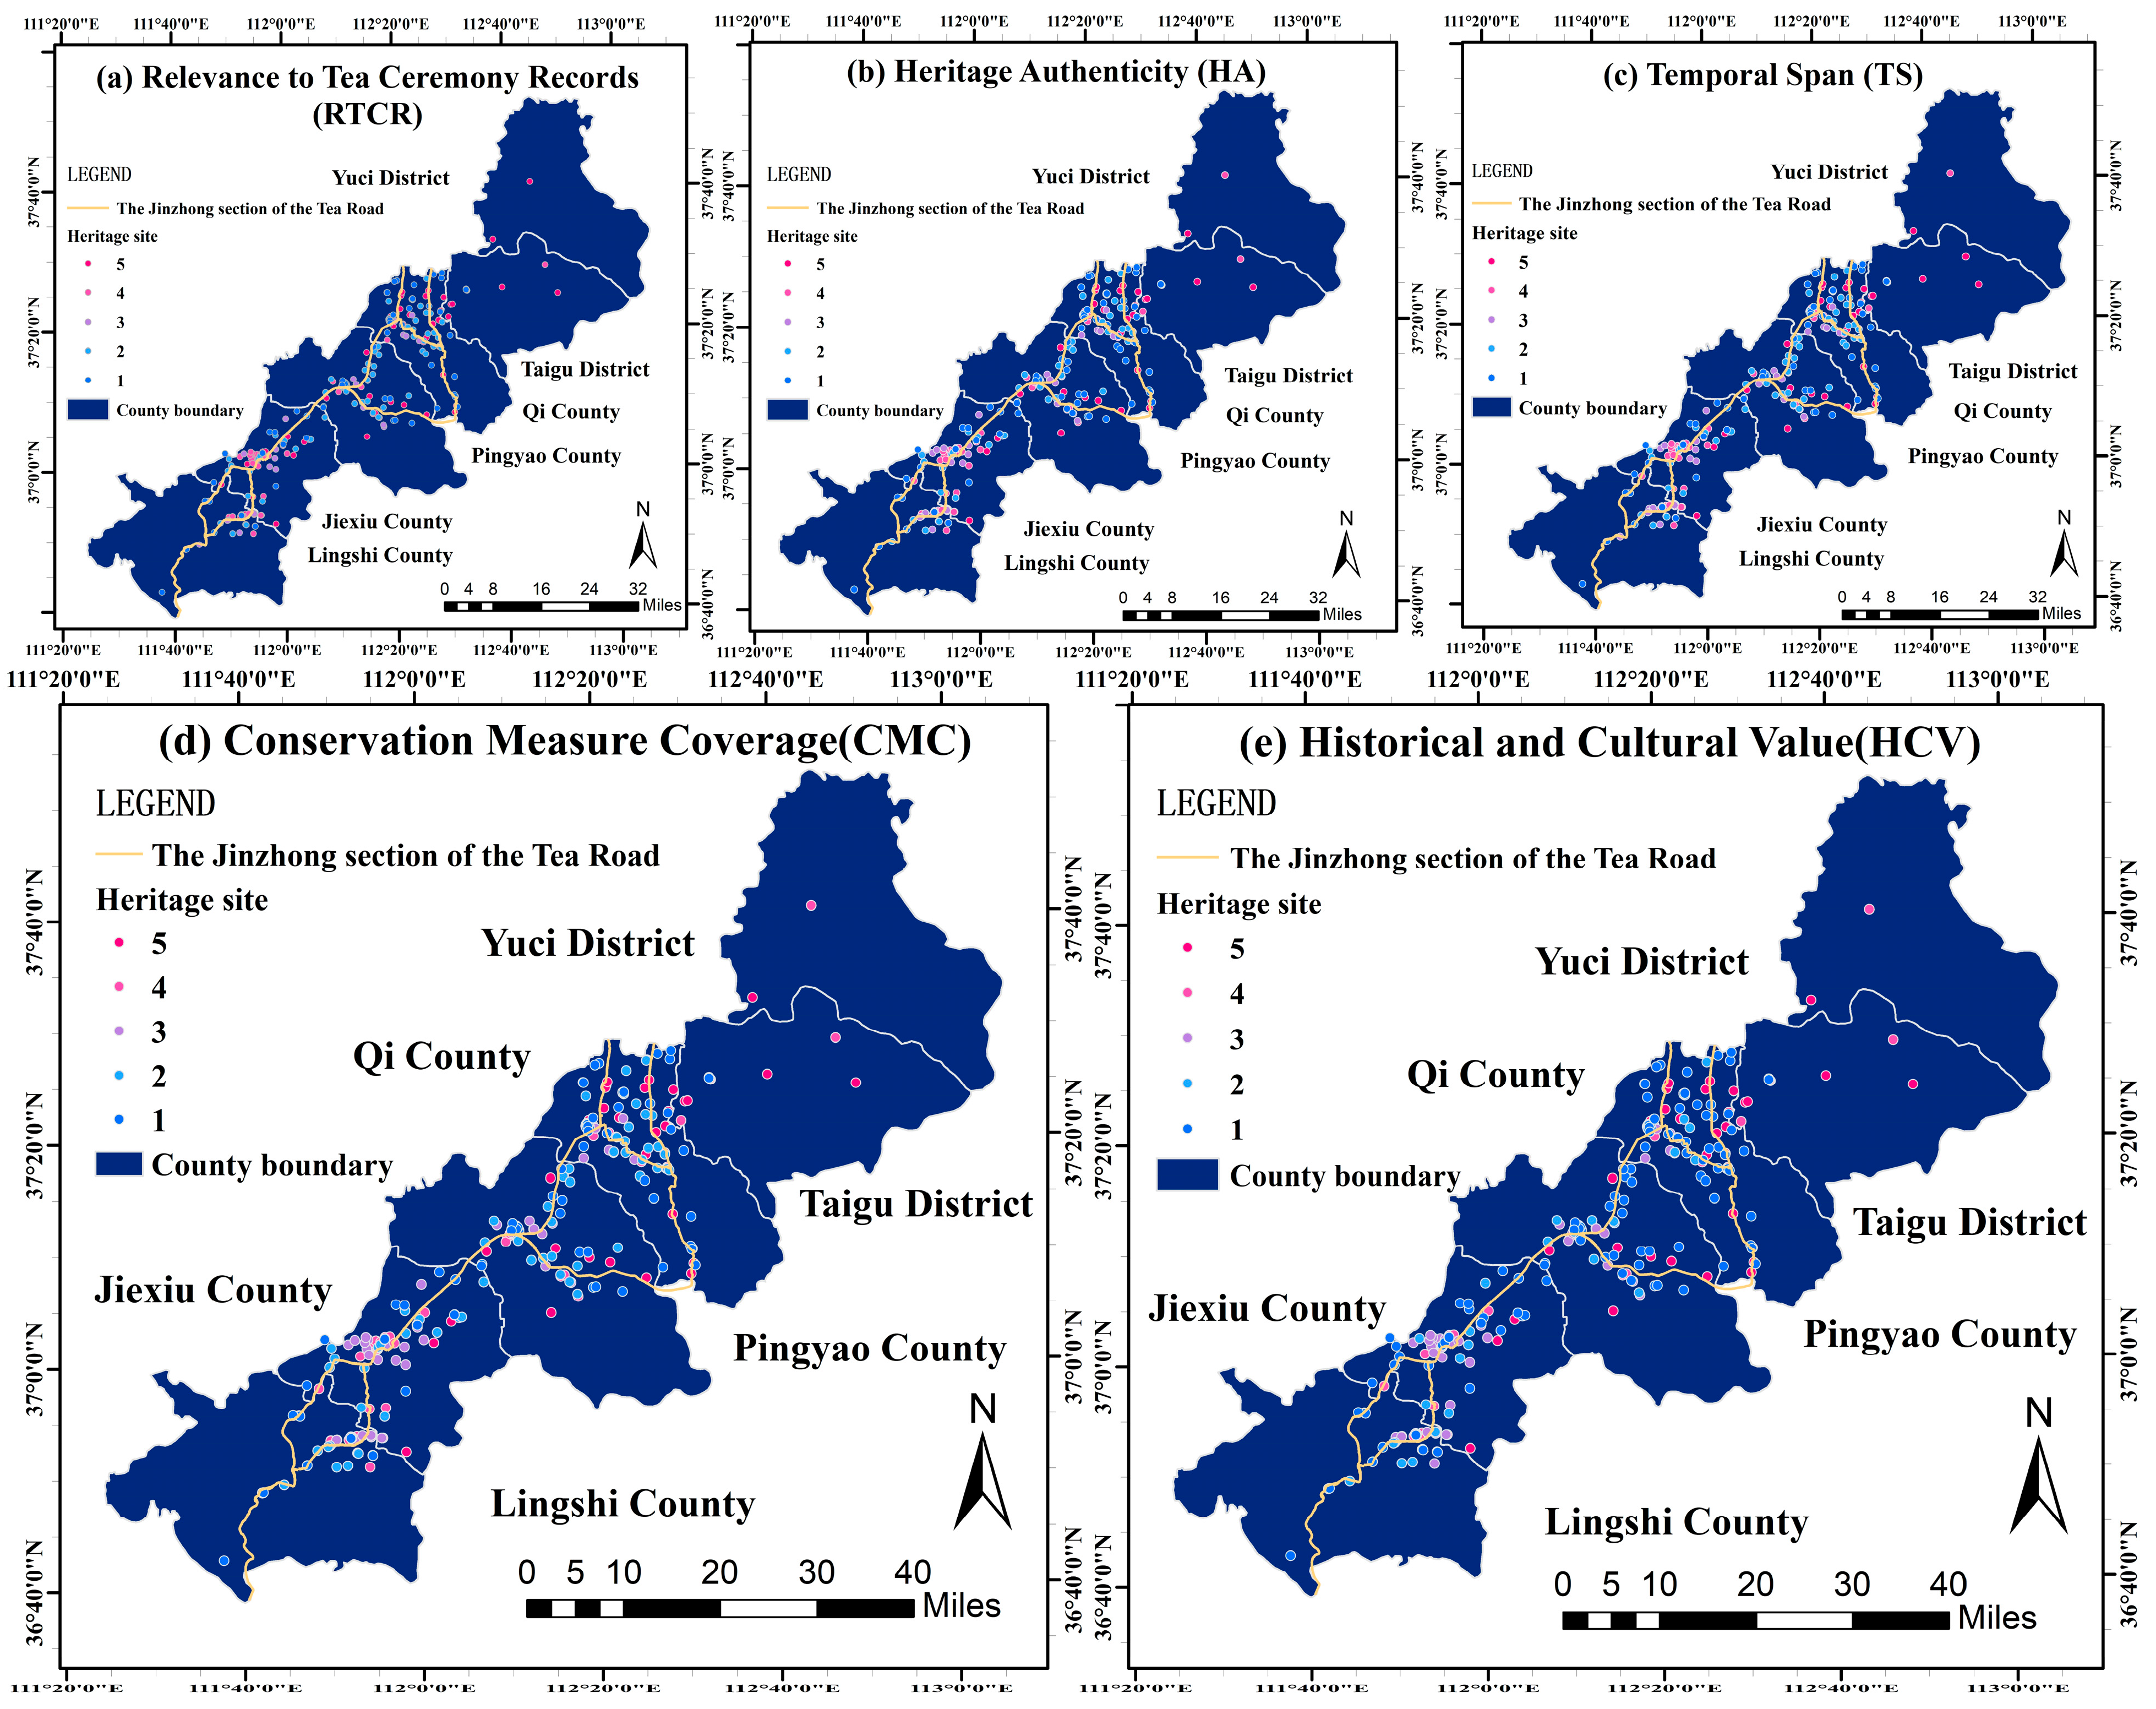
Based on the objective of evaluating historical and cultural value, a weighted linear model was applied to each heritage site to obtain the final composite Historical and Cultural Value (HCV) score (Figure 4). Overall, heritage sites exhibit a belt-shaped clustered pattern along both sides of the Great Tea Road (Jinzhong section), with the most prominent high-value core formed around the Qixian–Taigu–Pingyao area. By contrast, sites in the northern Yuci segment and the southern Jiexiu–Lingshi segment are more dispersed and dominated by medium-to-low values.
At the single-factor level: RTCR high-value sites lie closest to the reconstructed route alignment, forming a relatively continuous high-value strip along the corridor; HA high values are concentrated in a small number of core nodes, showing a stronger point-based dominance; TS displays a comparatively even spatial pattern while still maintaining a corridor-oriented tendency; and CMC shows more pronounced high values in the middle segment where management capacity and urban resources are concentrated, with lower values more common in peripheral areas. After weighted aggregation, high values further converge toward the corridor and the mid-section node clusters, reinforcing the core–periphery differentiation of the Jinzhong corridor.

3.1.2. Ecological and Environmental Value Weighting

Results from identifying ecological source areas using the Morphological Spatial Pattern Analysis (MSPA) model indicate that the core landscape area of the Great Tea Road’s Jinzhong section spans 2502.28 km2. The study area exhibits significant landscape integrity and connectivity. The Core zone represents the dominant type, covering 39.37% of the total study area, indicating the presence of large-scale, continuous natural substrates and relatively stable core habitats within the region. By contrast, zones performing transitional and connecting functions—Core-Opening and Edge—account for only 3.41% and 2.54% respectively. Other landscape types (such as Islet and Bridge) constitute approximately 1% or less of the total area. Collectively, these findings reveal low landscape fragmentation, good patch connectivity, intact landscape structure, and high ecological–environmental value within the study area.
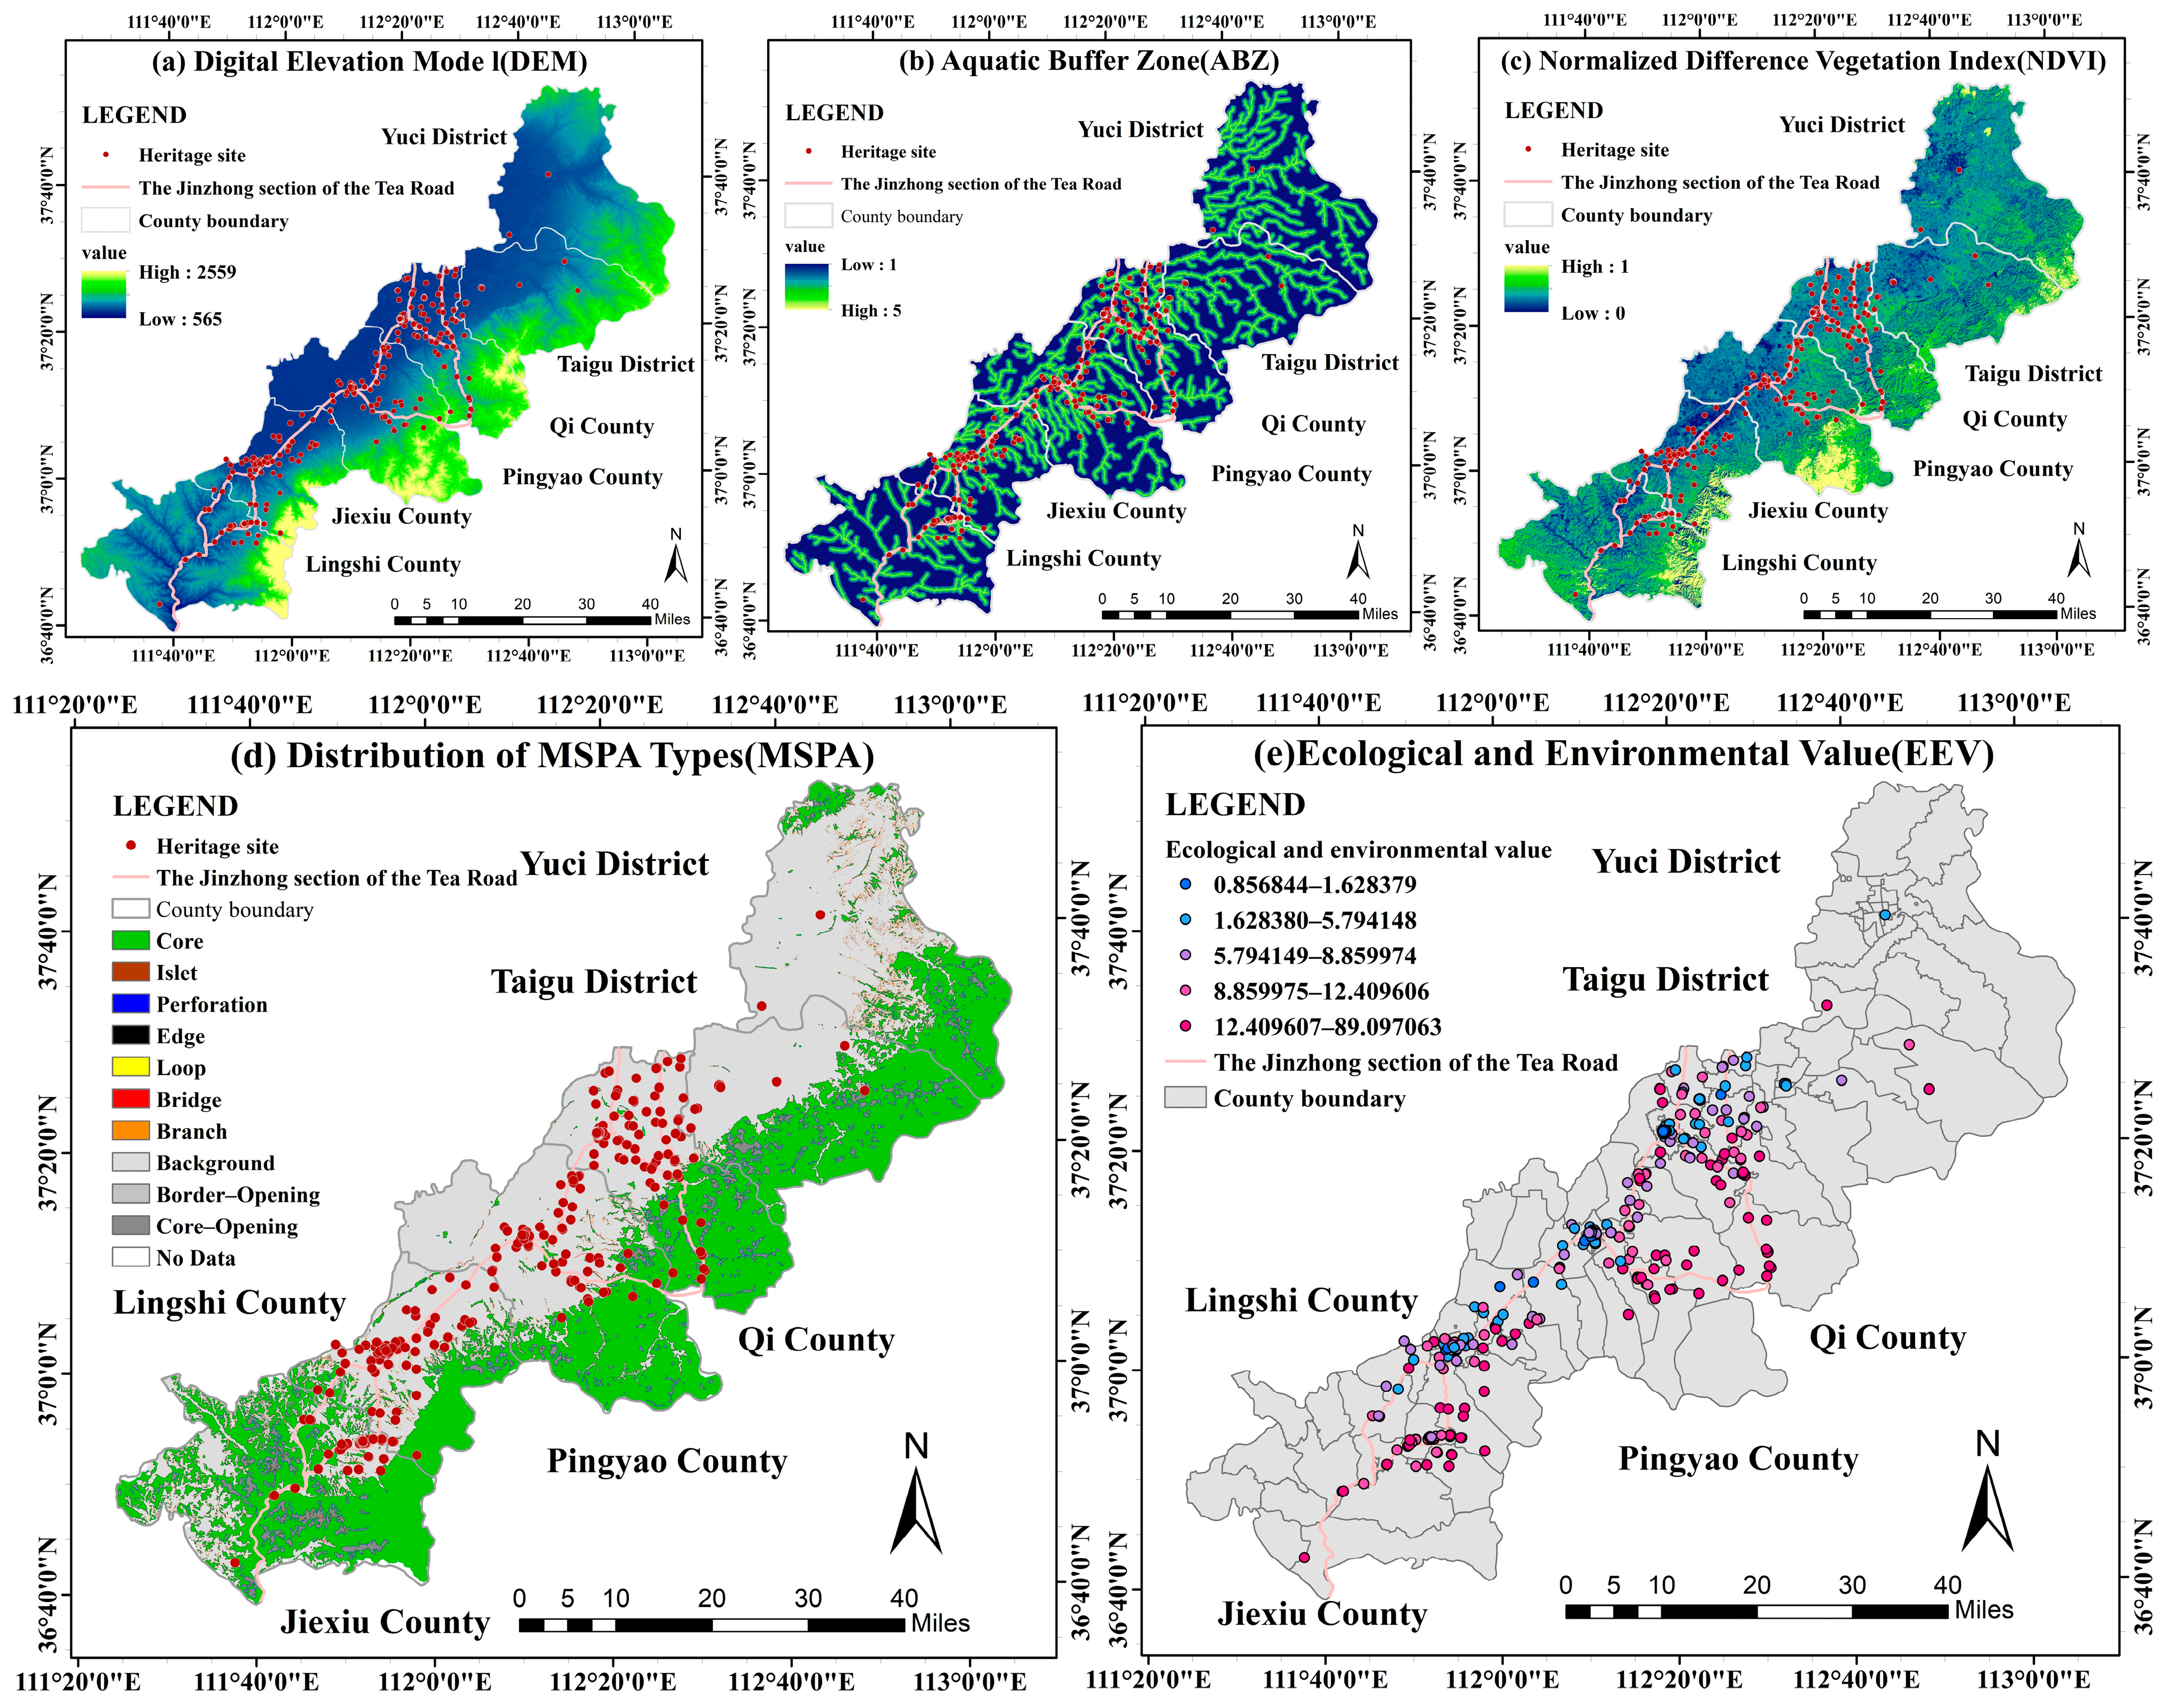
Building upon this foundation, the following indicators were employed to represent ecological–environmental value: Digital Elevation Model (DEM), Normalised Difference Vegetation Index (NDVI), Aquatic Buffer Zone (where proximity to water bodies carries higher value), and Distribution of MSPA Types. MSPA types were assigned weighted values to emphasise the relative importance of core areas and connectivity elements in ecological processes: Core (10), Bridge (0.9), Loop (0.8), Islet (0.7), Perforation (0.6), Edge (0.5), and Branch (0.4). Subsequently, all indicators underwent normalisation processing (Figure 5).
At the eco-environmental factor level (Figure 6), the spatial patterns of each indicator are clearly differentiated and jointly shape the Ecological and Environmental Value (EEV) of heritage sites:
DEM shows a topographic gradient rising from the central corridor toward the surrounding mountains, with higher elevations mainly located along the peripheral mountain belts of the study area. ABZ expands in a strip-like/network-like form along the river system; heritage sites closer to major waterways receive higher buffer-zone grades. NDVI is higher in the peripheral areas where mountain forests/grasslands are better preserved, while it is relatively lower across the central plains/urban and cultivated areas traversed by the route. In MSPA, “Core” patches are concentrated in contiguous ecological lands on the periphery; along the route, heritage sites are mostly distributed at the edges of core patches and within transitional zones connected to ecological corridors.
Accordingly, the weighted EEV results indicate that high-value heritage sites preferentially cluster in segments adjacent to contiguous ecological cores, within river-network buffer belts, and with better vegetation conditions. In contrast, sites located in the central area—where human activities are more intensive, vegetation is relatively weaker, and locations are farther from ecological cores/major waterways—are dominated by medium-to-low values. Overall, EEV still forms a belt-like distribution along the Great Tea Road, with clustering at several key nodes.

3.2. Heritage Corridor Construction Based on the MCR Model

3.2.1. Construction of the Resistance Surface

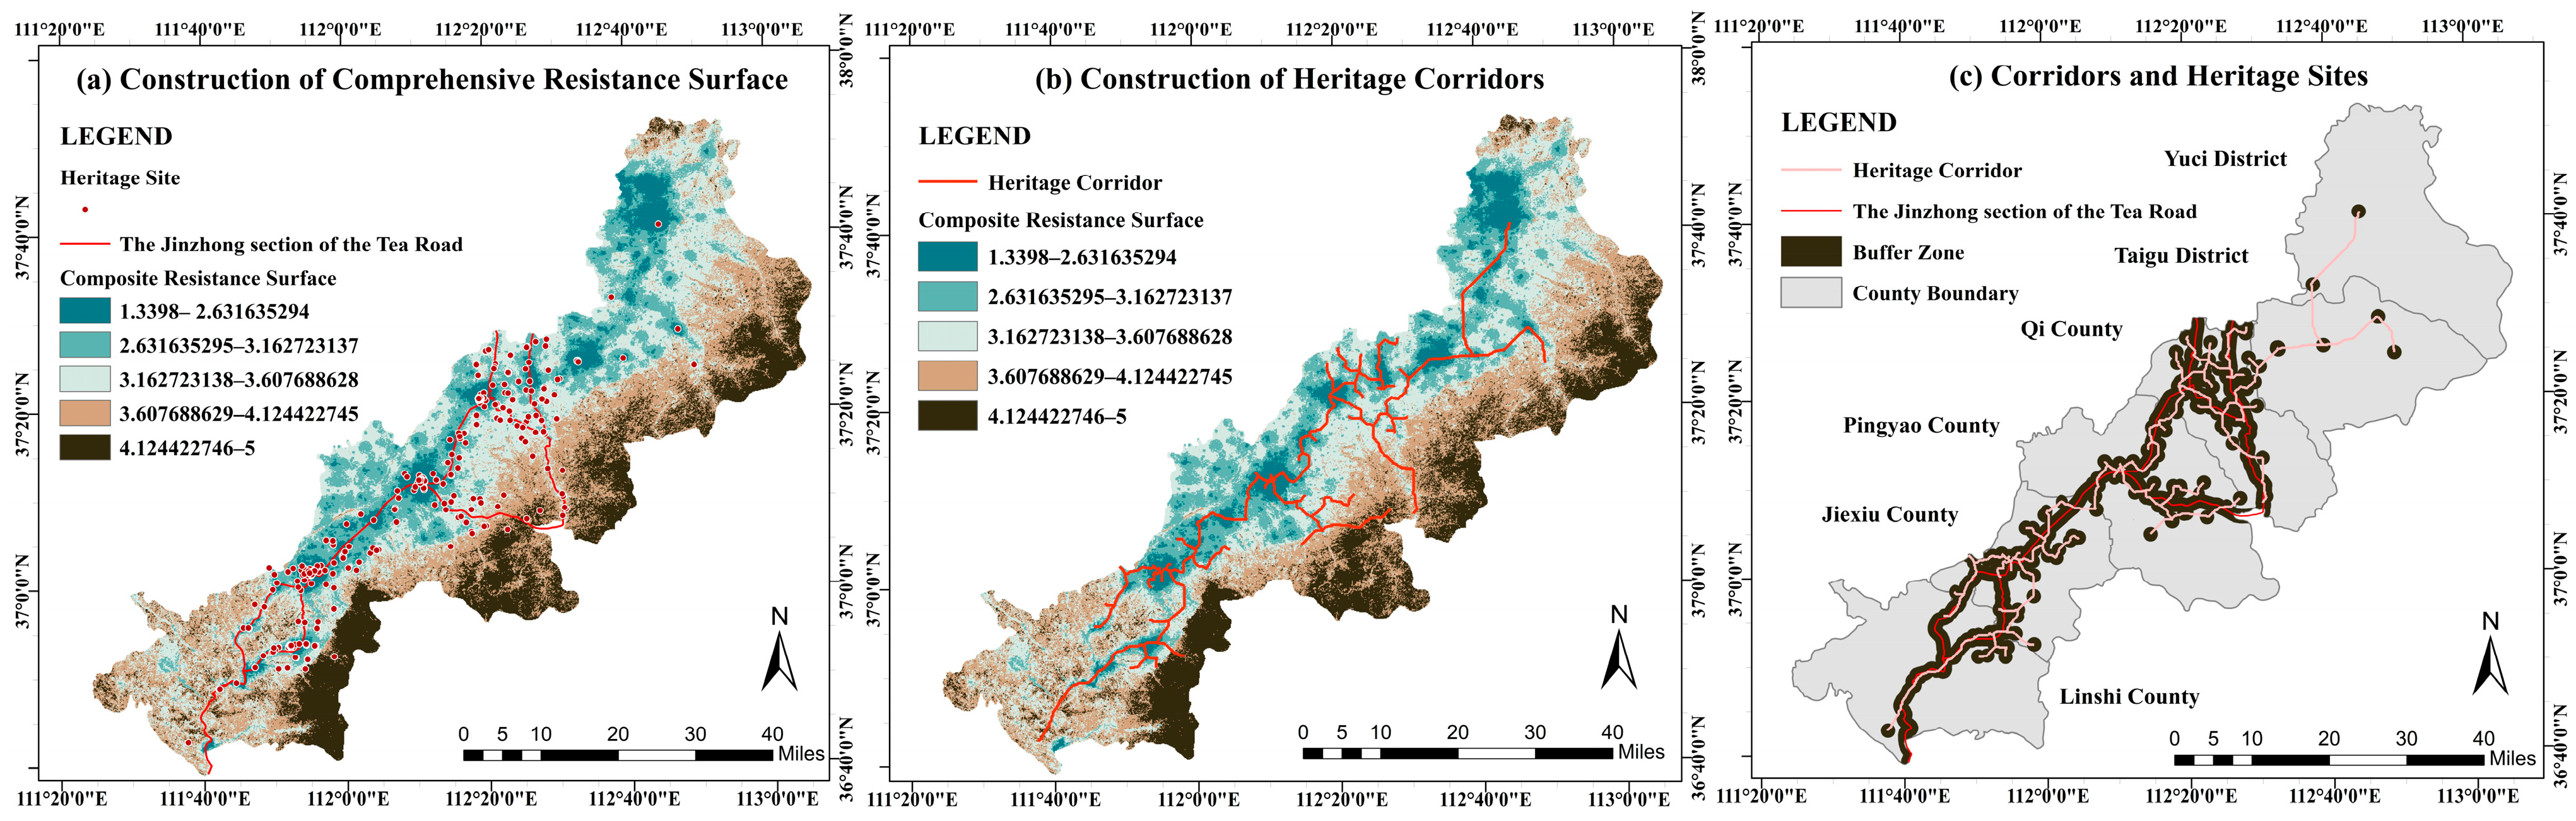
Drawing upon the 422 Tea Road heritage sites along the Great Tea Road’s Jinzhong section as heritage sources, and synthesising extensive research findings in related fields, 15 types of resistance factors were identified, constituting a comprehensive cost resistance surface across four dimensions: natural environment, transportation networks, public services, and cultural development. To scientifically determine resistance factor weights for heritage corridors, ten experts from professional fields including cultural heritage studies, tourism studies, urban and rural planning, ecology, and landscape architecture were invited. Based on the cultural heritage characteristics and current ecological–environmental conditions of the Great Tea Road’s Jinzhong section, experts scored the resistance factor weights for heritage corridors. Following multiple rounds of deliberation and verification, the final weight for each resistance factor was determined (Table 3).
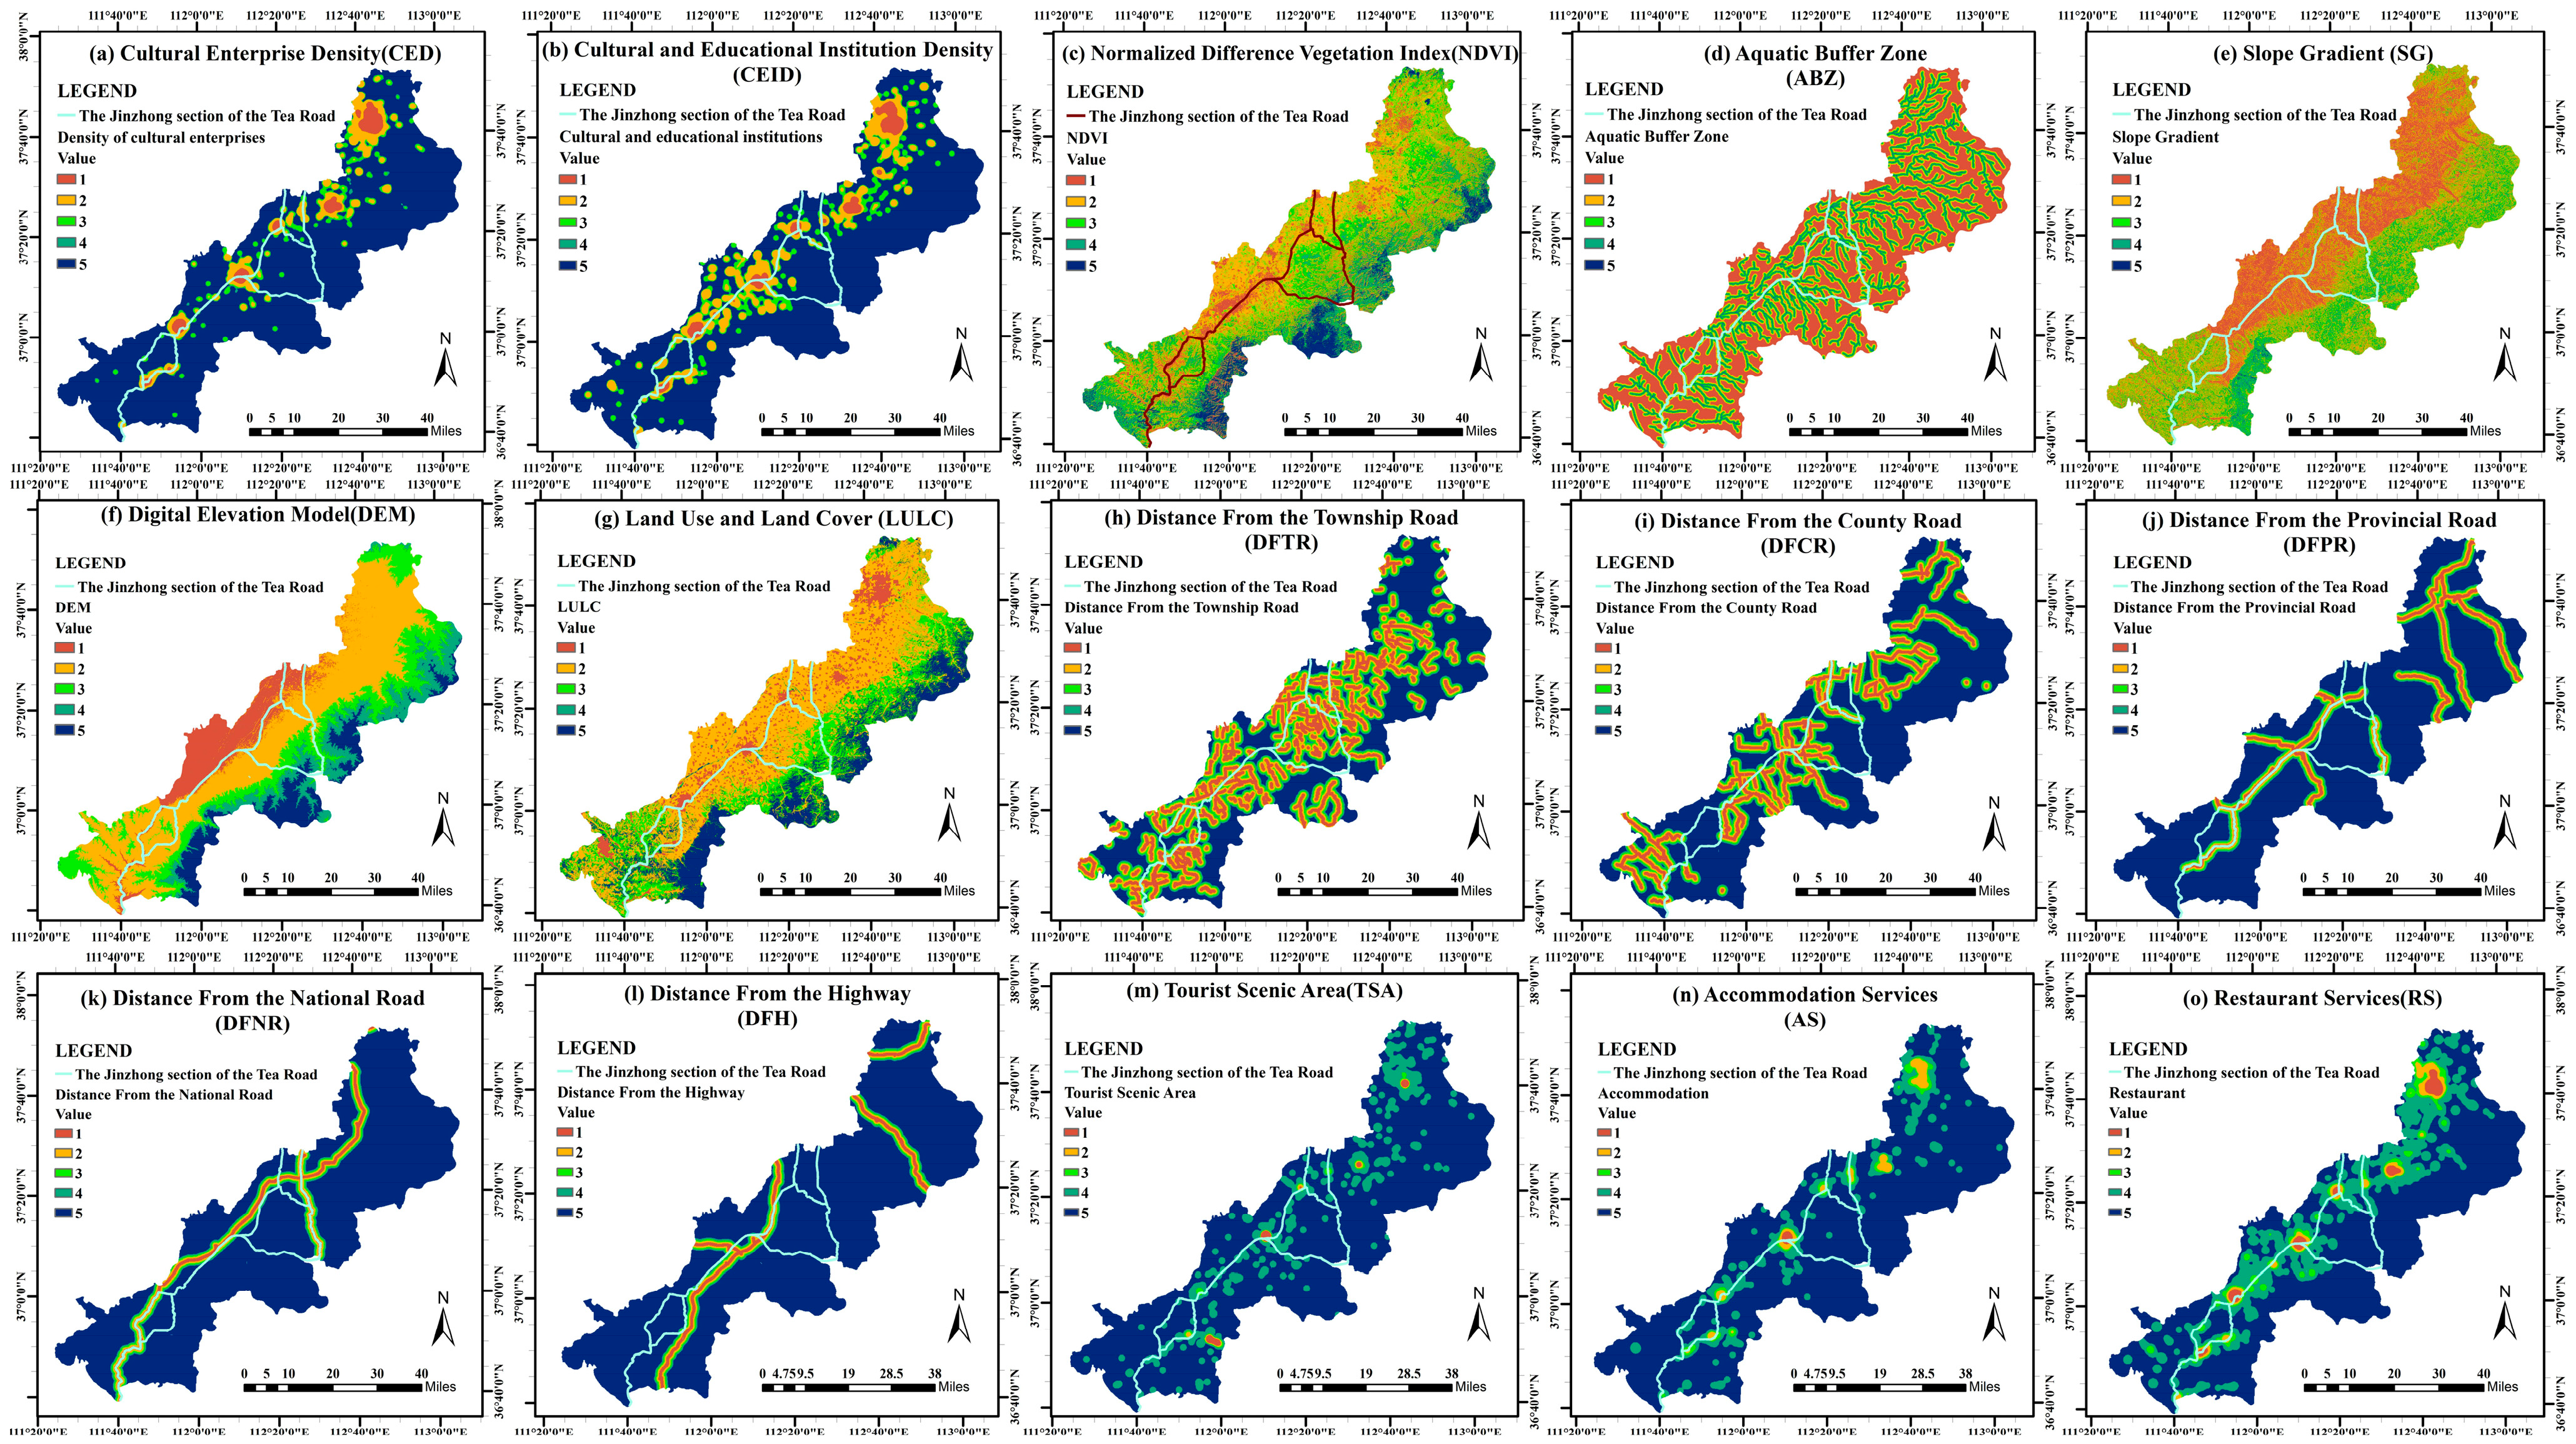
For cultural development, density of cultural enterprises and cultural and educational institutions were selected, with resistance surfaces constructed using kernel density estimation (Figure 6a,b). Areas with high density values indicate superior cultural development services, making them suitable for heritage activities. For natural environment, Digital Elevation Model (DEM), Slope Gradient, Land Use and Land Cover (LULC), Aquatic Buffer Zone, and Normalised Difference Vegetation Index (NDVI) were selected. Considering the actual conditions of the Jinzhong section of the Great Tea Road, resistance values were assigned to each resistance factor and resistance surfaces constructed (Figure 6c–g). Higher elevation, steeper slopes, and greater vegetation coverage correspond to higher resistance values. Land use resistance values were categorised according to human activity intensity, with areas more accessible to human activities exhibiting lower resistance values. For transportation networks, distance from Township Roads, County Roads, Provincial Roads, National Roads, and Highways was selected, employing Euclidean distance algorithms to construct resistance surfaces (Figure 6h–l). Closer proximity to roads indicates greater transportation convenience, enhanced accessibility, and lower resistance values. For public services, Tourist Scenic Areas, Accommodation, and Restaurants were selected, with resistance surfaces constructed using kernel density estimation (Figure 6m–o). Areas with higher density values indicate superior public service provision, making them suitable for heritage leisure activities and thus exhibiting lower resistance values.

3.2.2. Corridor Construction

Employing the WeightedSum function within ArcGIS to weight and overlay resistance value distribution polygons for 15 resistance factors, a comprehensive cost resistance surface for heritage corridors was generated. Based on statistical histogram information from ArcGIS, suitability zoning was conducted for the study area. Utilising cost connectivity analysis to generate minimum cost paths, 294 potential heritage corridors for the Great Tea Road were simulated, yielding a total corridor length of 484.7 km (Figure 7).
As shown in the figure, when the 2 km buffer constructed from the historic route and heritage sites [36] is overlaid with the heritage corridors identified in this study, the two exhibit a high degree of spatial consistency. The corridors overall extend along the orientation of the historic route and show marked overlapping clustering in key segments where heritage sites are densely distributed. Overlay statistics indicate that 92.37% of the corridor length falls within the buffer zone. The few corridor segments that deviate from the buffer mainly occur in areas with pronounced changes in resistance conditions, suggesting that—under the constraints of the integrated resistance surface—the corridors optimise for lower travel cost.

3.3. Heritage Sites and Corridor Grading

3.3.1. K-Means-Based Heritage Site Classification

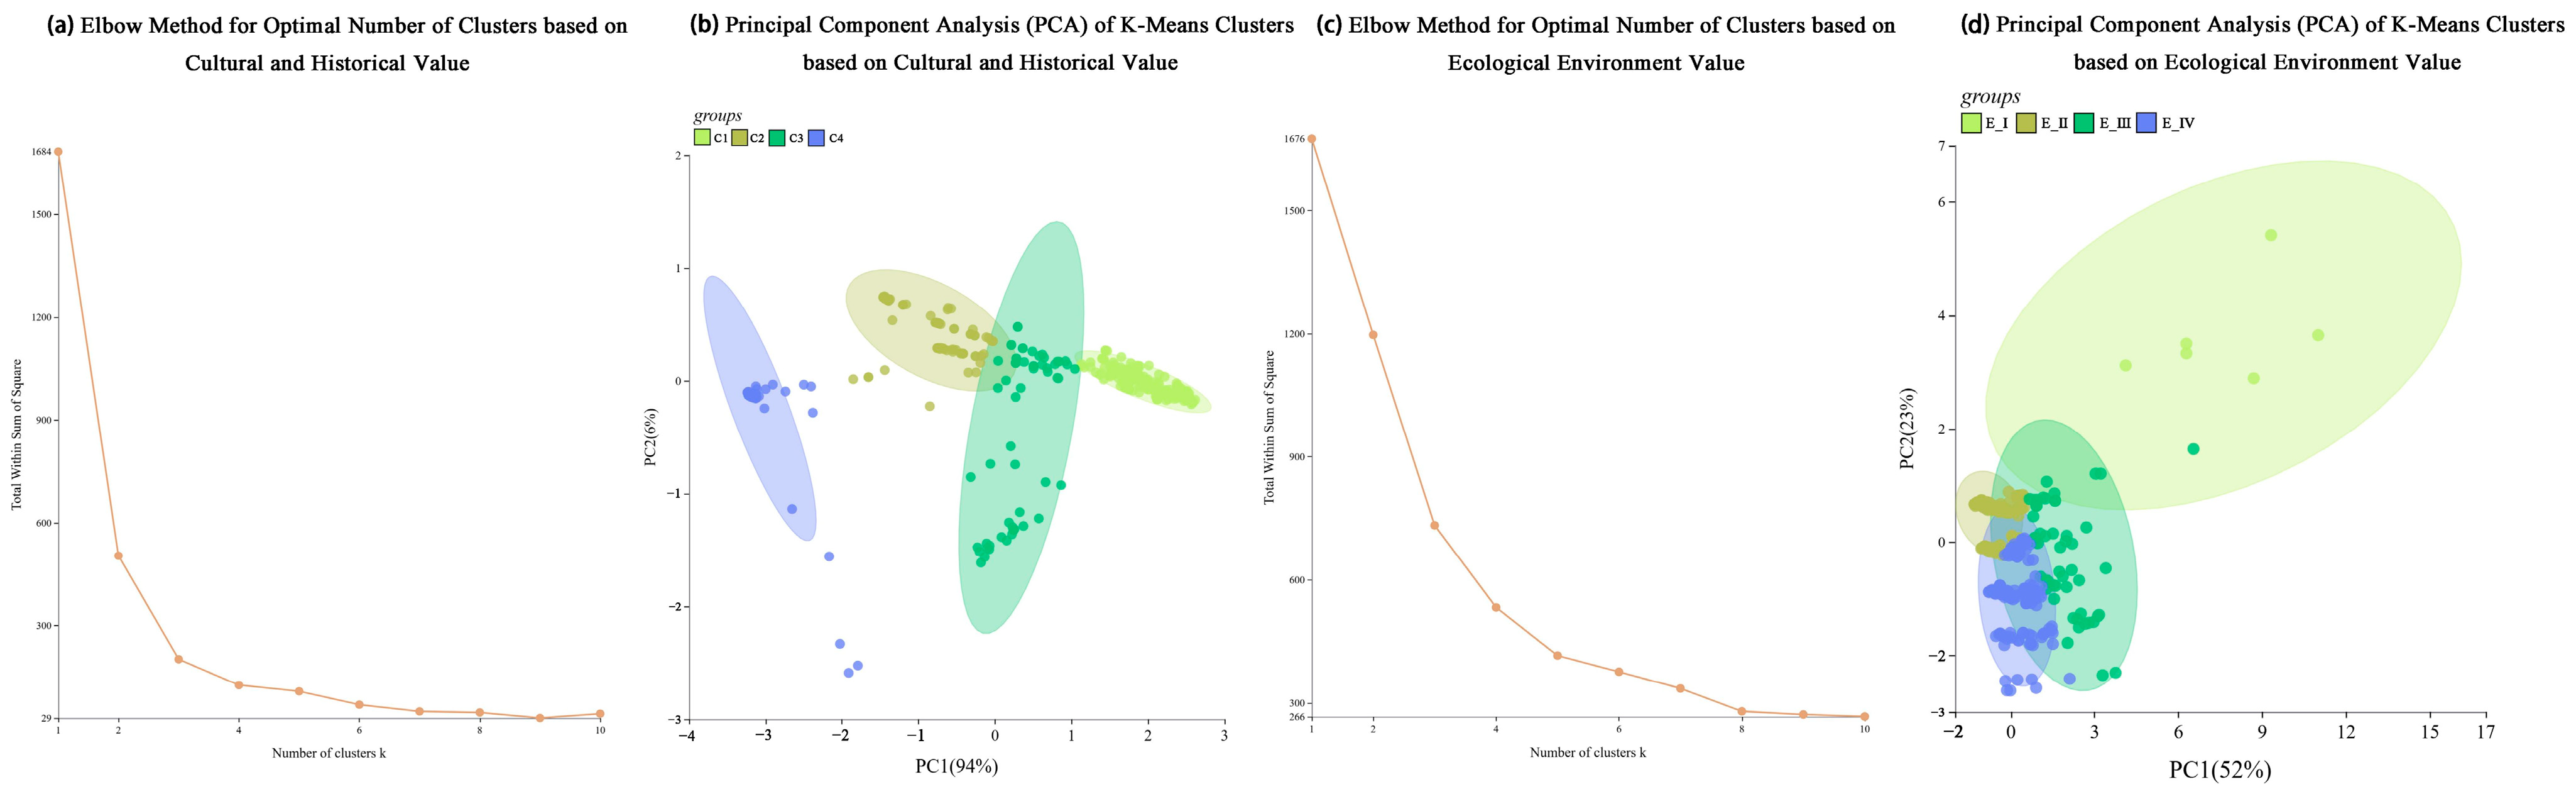
Regarding the historical and cultural value dimension of heritage sites, K-means clustering was employed to group samples based on collected indicators related to historical and cultural value of heritage sites. The mean characteristics of each cluster were used to delineate categorical gradients and distinctions. Results indicate continuous differentiation across four categories from low to high historical and cultural value (Figure 8a,b):
Category C1 exhibits the lowest overall performance across all indicators, defined as “General Heritage Areas” and positioned as targets for reserve enhancement and fundamental management;
Category C2 occupies an upper–middle level, possessing certain representativeness and revitalisation potential, designated as “Important Cultural Nodes” with emphasis on achieving balance between conservation and rational utilisation;
Category C3 exhibits moderate performance in historical age and authenticity, though with insignificant documented Tea Road relevance, termed “Historical Continuity Heritage Nodes” requiring enhanced recognition through narrative enrichment and display optimisation;
Category C4 approaches or achieves maximum values across all indicators, demonstrating significant historical authority and high authenticity, thus designated as “Core Traditional Conservation Areas”.
Regarding the ecological value dimension of heritage sites, based on K-means clustering results utilising DEM (elevation), NDVI (vegetation coverage), water body buffering, and MSPA (landscape structure) as feature variables, four scenarios were established (Figure 8c,d):
E-I ‘Lowland Vulnerability Scenario’ (low elevation–low vegetation coverage–low water buffer), characterised by low-lying terrain, sparse vegetation coverage, weak water connectivity, and loose landscape structure, presenting an overall lowland landscape with poor ecological foundation and limited environmental diversity;
E-II ‘Waterfront Heritage Context’ (riparian–low vegetation coverage–medium–high elevation), characterised by proximity to water bodies, high accessibility, and predominantly medium–high elevation terrain. Vegetation coverage is low and landscape structure simplified, presenting an open riparian-terrestrial transition interface;
E-III ‘Upland Heritage Landscape Context’ (high elevation–medium vegetation coverage–moderate water buffer–gentle slope), characterised by higher elevation and moderate vegetation coverage, moderate distance to water bodies, and landscape forms dominated by terraces or gentle slopes, exhibiting good visual continuity and distinct landscape belt characteristics;
E-IV ‘Ecological Core Scenario’ (high elevation–high vegetation coverage–high water buffer–high MSPA connectivity) simultaneously exhibits elevated terrain, dense vegetation coverage, and robust landscape structural integrity, while maintaining substantial buffer distances to water bodies. This scenario demonstrates a stable ecological pattern characterised by excellent connectivity and clearly defined patch–corridor–matrix relationships.

3.3.2. Heritage Corridor Grading Based on the MCA Model

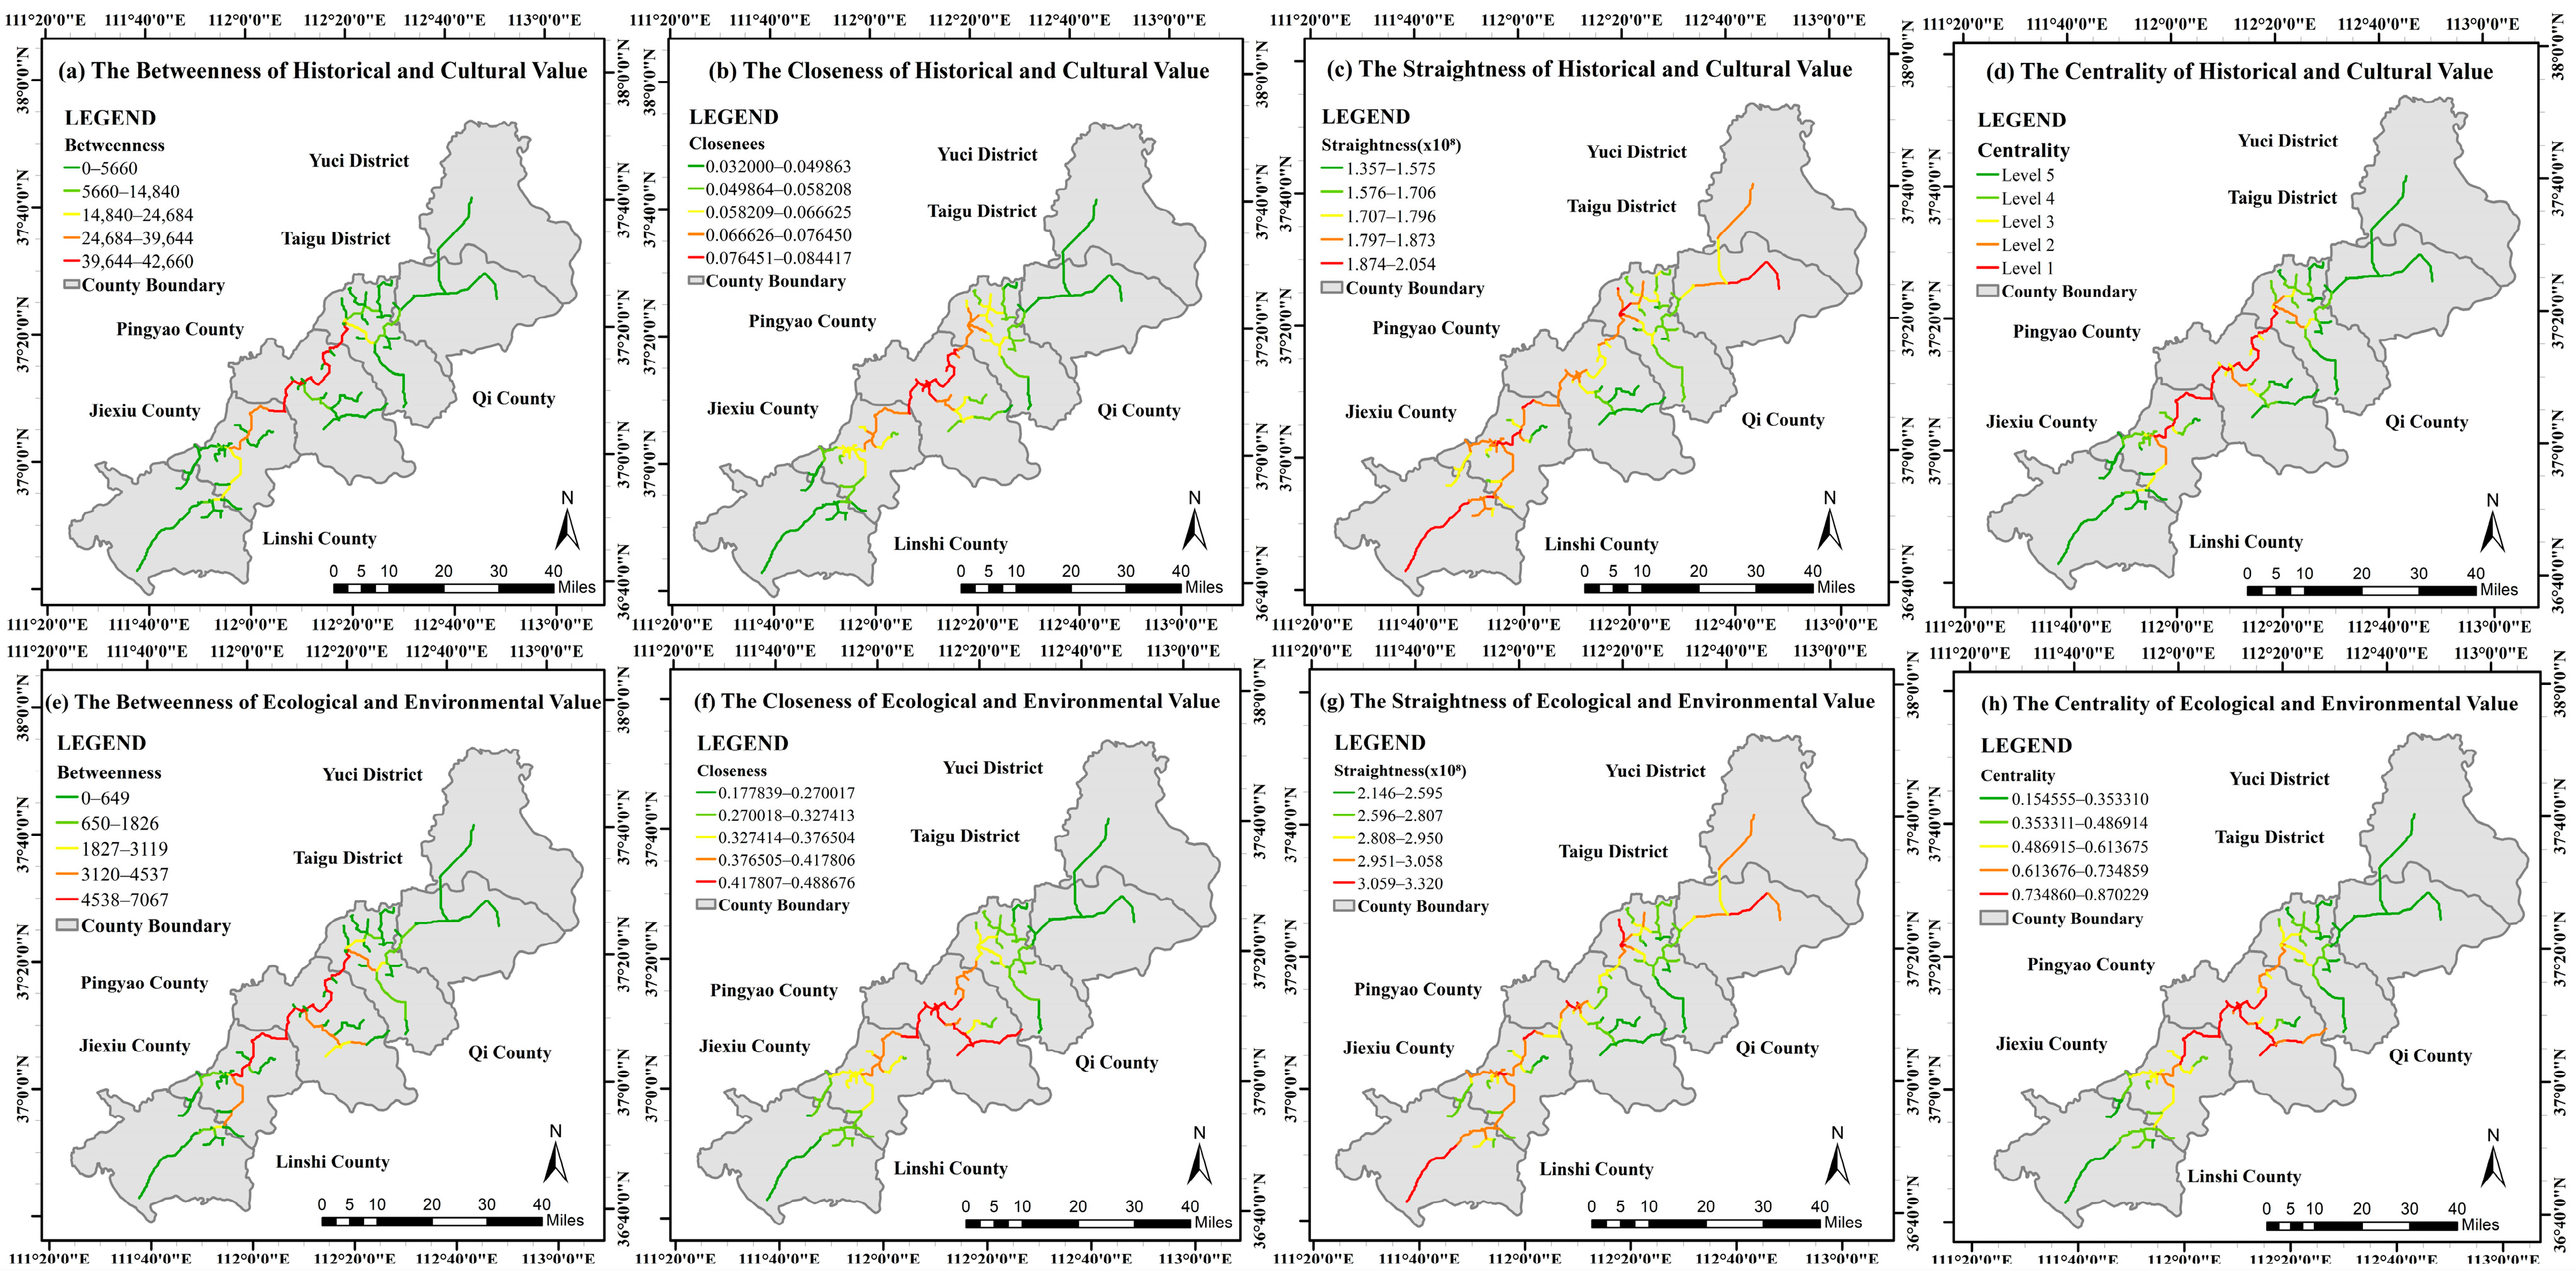
To improve the accuracy of corridor centrality measurement and reflect the influence of heritage value on corridor hierarchy, corridor value weights were defined as the arithmetic mean of heritage site values at both ends, with corridors weighted separately using cultural value and ecological value. Subsequently, three types of network centrality indicators were calculated, including betweenness (Figure 9a,e), closeness (Figure 9b,f), and straightness (Figure 9c,g). Based on the weighted combination model, overall corridor centrality was comprehensively characterised using the formula: S = 0.6 × Betweenness + 0.2 × Closeness + 0.2 × Straightness to derive corridor centrality indices, forming heritage corridor cultural value centrality (Figure 9d) and heritage corridor ecological value centrality (Figure 9h), thereby identifying key corridors that make outstanding contributions to network connectivity and functional transmission under different value dimensions.
The heritage corridor cultural value centrality (Figure 9a–d) exhibits a pronounced ‘monocentric clustering’ pattern. Whether measured by betweenness centrality (Figure 9a), closeness centrality (Figure 9b), or straightness centrality (Figure 9c), the high-value zones (red/orange corridors) are markedly concentrated within the core region of “Jiexiu City–Pingyao County–Qi County”. This characteristic is most pronounced in the comprehensive centrality map (Figure 9d): a highly ranked “core axis” runs distinctly through this area, forming a robust “core–periphery” structure. This indicates that within the cultural value network, this core zone serves as the undisputed “transportation hub” and “cultural value highland”, with the network’s critical functions being highly dependent on the connectivity of this main axis.
Heritage corridor ecological value centrality (Figure 9e–h) exhibits a more dispersed “multicentric, networked” pattern. High-value corridors for various centrality indicators are spatially distributed more widely, not confined to any specific area, but forming several significant “ecological connectivity clusters” across multiple counties and districts including Pingyao, Jiexiu, and Lingshi. The comprehensive centrality map (Figure 9h) clearly demonstrates that high-grade corridors do not form a single dominant axis but instead constitute a multi-branched, networked skeletal structure with concentrated southern extensions. This indicates that within the ecological value network, the functionality and resilience of the network are collectively supported by multiple key corridors and nodes, rather than relying on a single core.
The heritage corridor cultural value network constitutes a “main axis-driven monocentric system”, whose operational efficiency and stability are highly dependent upon the core corridor linking “Jiexiu City–Pingyao County–Qi County”. Conversely, the heritage corridor ecological value network operates as a “multi-point supported networked system”, whose functional realisation relies upon a more widely distributed and diversely connected corridor framework. This discovery holds crucial guiding significance for the subsequent formulation of differentiated heritage conservation management strategies.
This study finds that the cultural-value network exhibits a pattern of “single-centre, axis-belt clustering”, whereas the ecological-value network shows a “multi-centre, networked” configuration. This contrast reveals a structural regularity of Linear Cultural Heritage under the joint influence of urbanization and industrial agglomeration: high-cultural-value nodes rely more heavily on the accumulation of historic towns, commerce, and narrative resources, and therefore tend to form strong attractive centres in a small number of core counties. By comparison, high ecological value is more constrained by topography, vegetation, hydrological systems, and landscape connectivity, resulting in spatial continuity across administrative boundaries and support from multiple ecological source areas.
Such “value–space mismatch” is consistent with findings in other heritage-related studies [61,62], yet previous work has largely discussed it within a single dimension. The contribution of this study lies in using dual weighting and centrality-based network decomposition to transform this mismatch from a descriptive observation into quantifiable evidence of network structure, thereby providing an operational spatial basis for zoned and tiered governance.

3.4. Construction of Composite Heritage Sites and Corridors

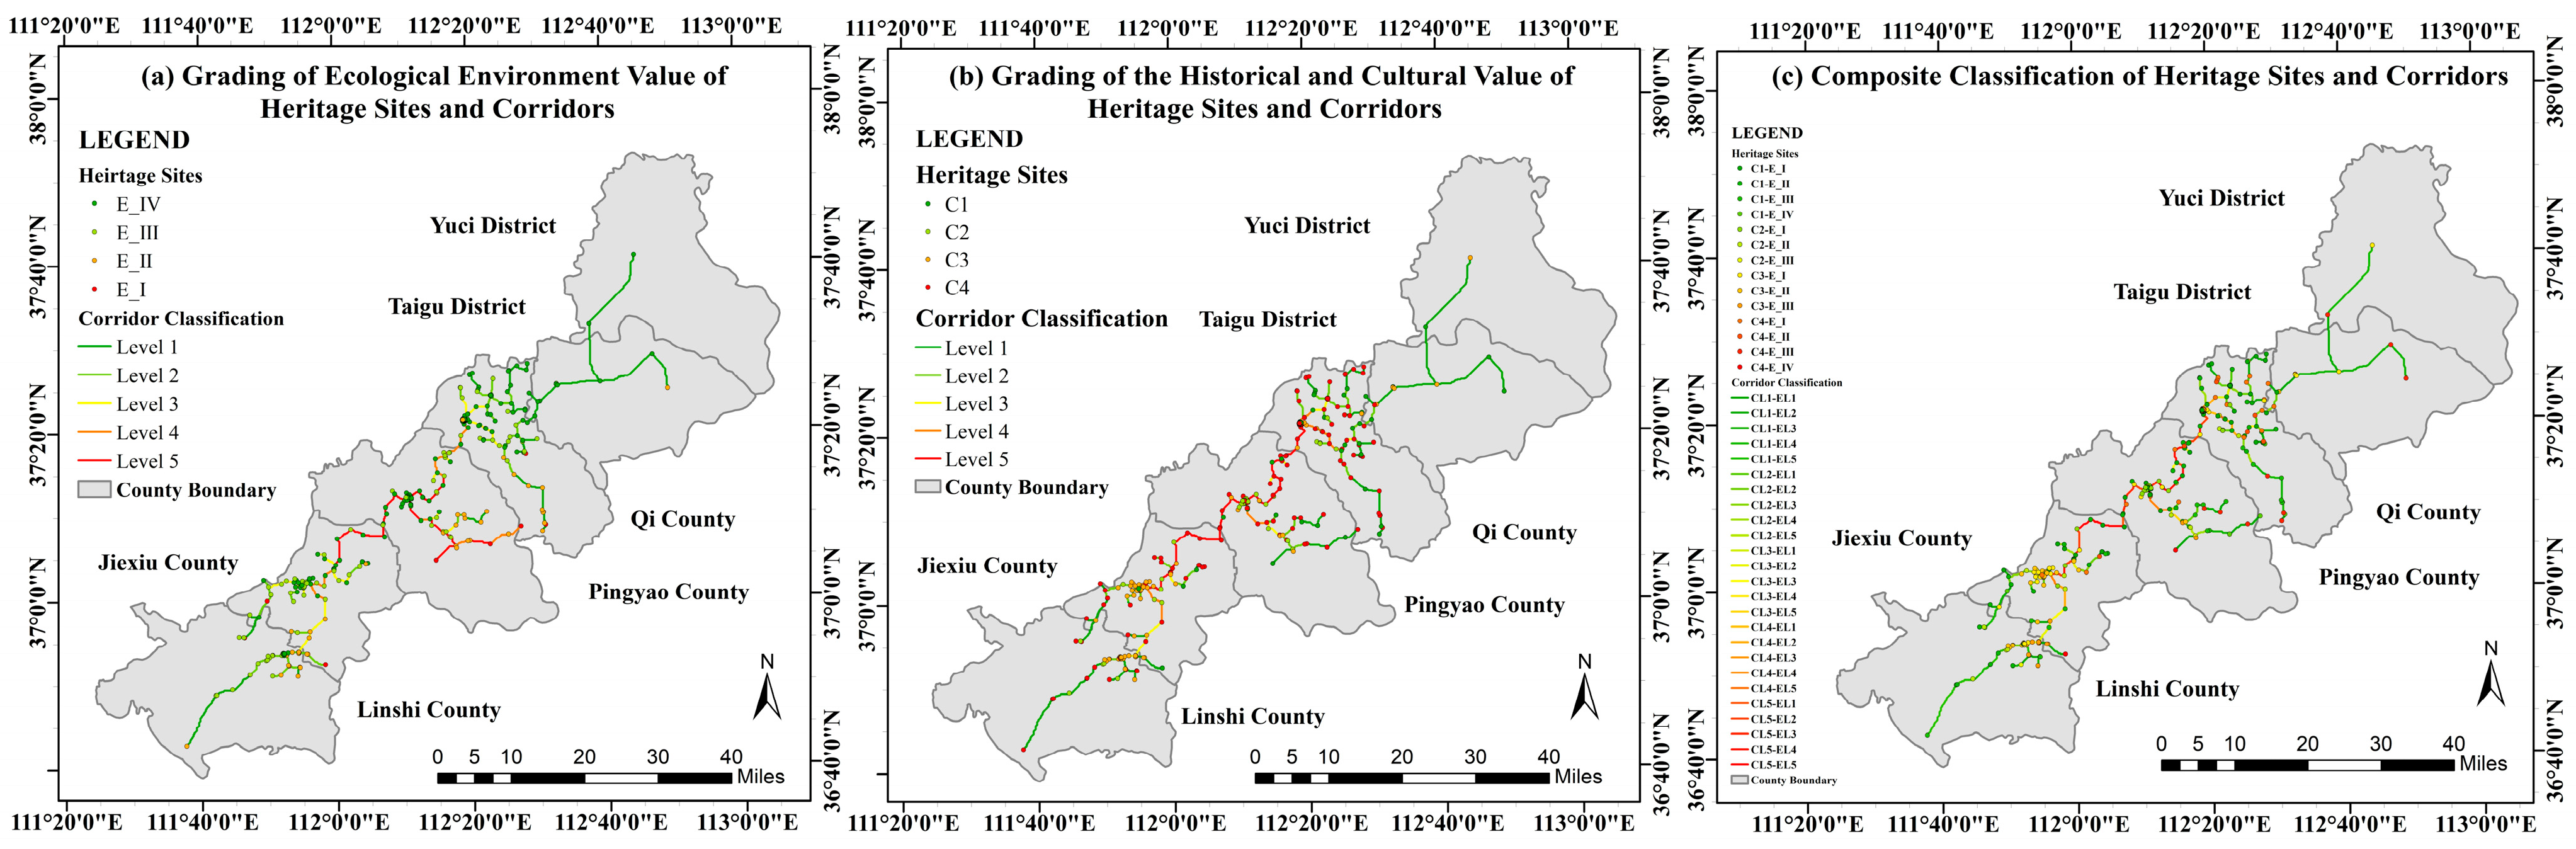
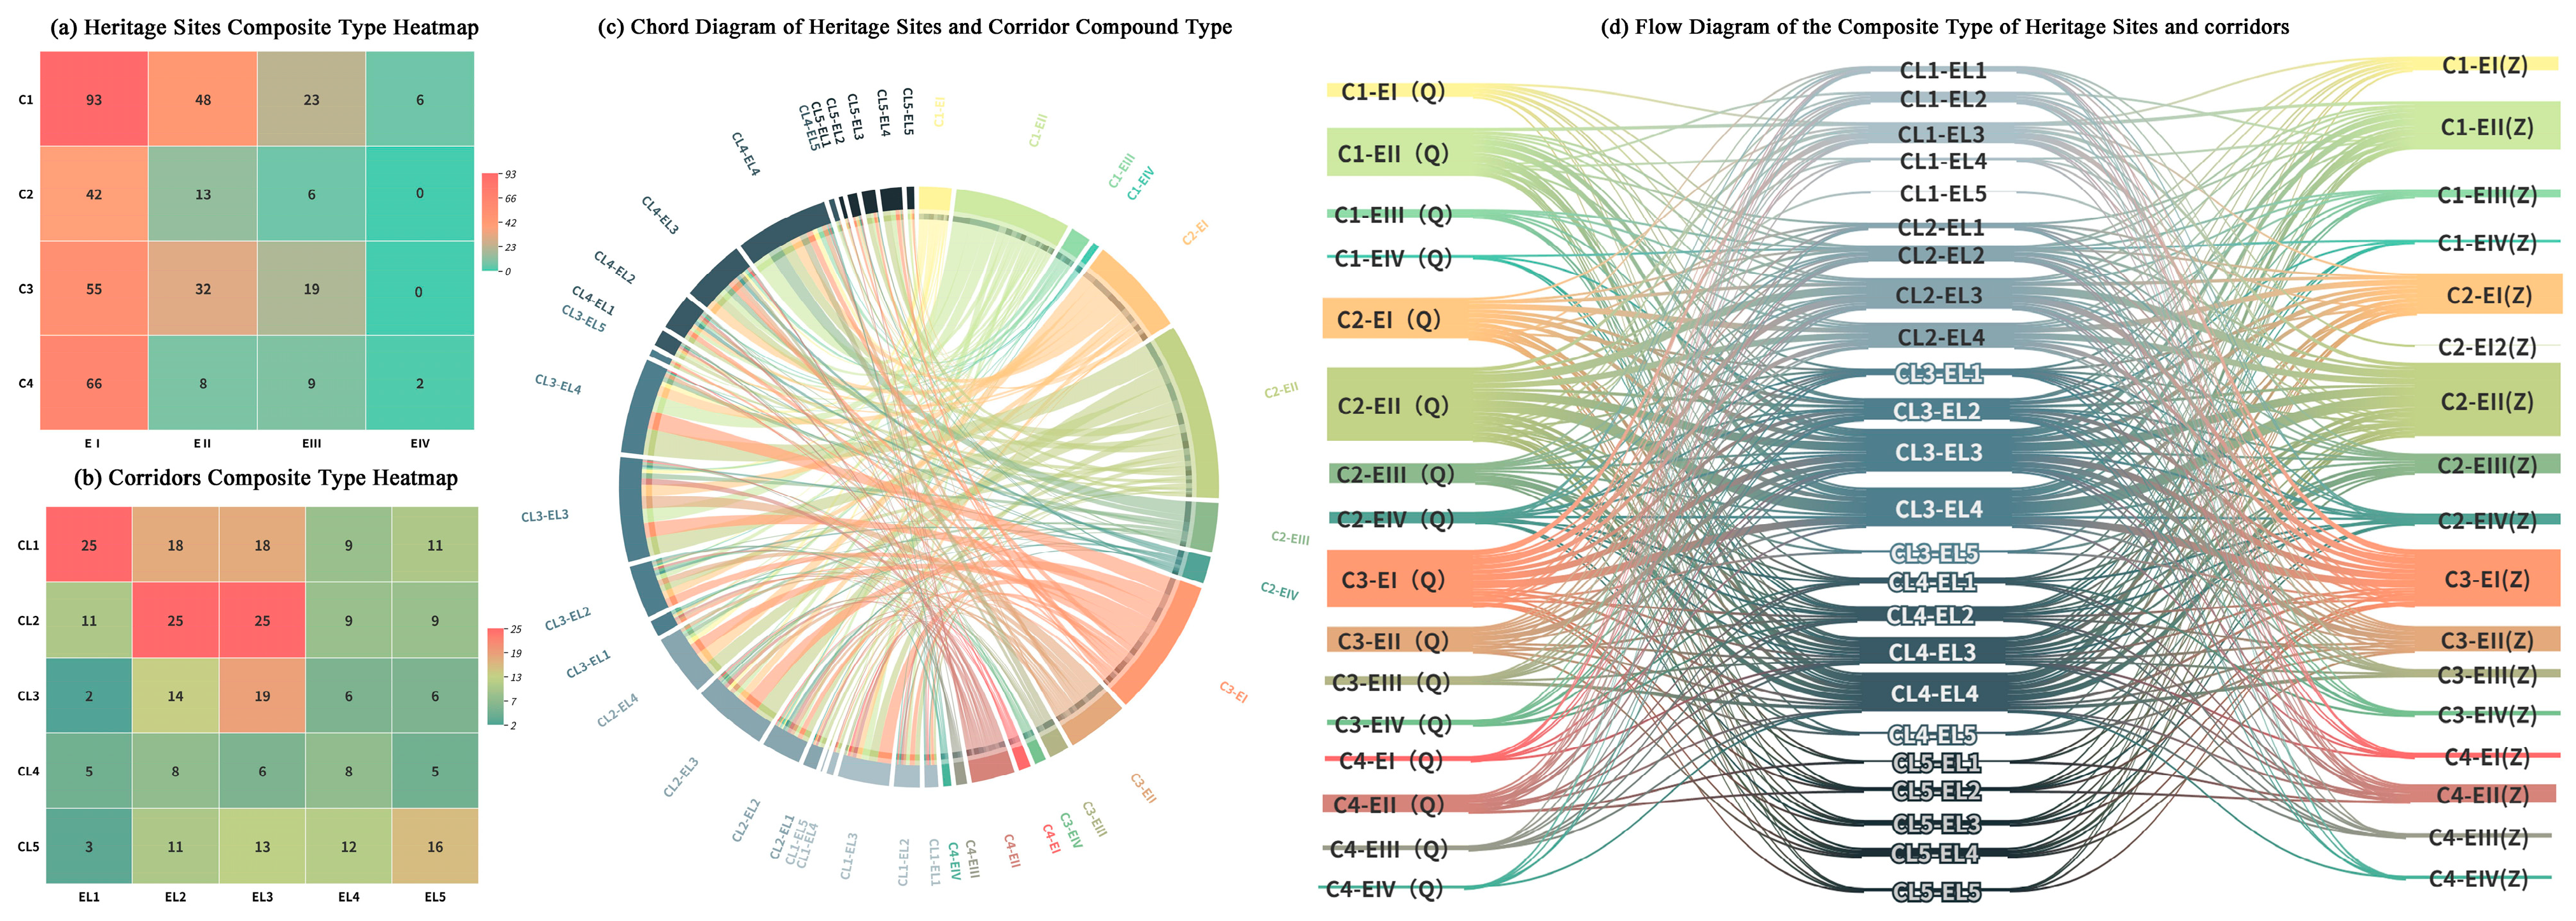
Each heritage site was first independently assessed for its cultural value (C1–C4) and ecological value (E-I to E-IV). The composite type of a heritage site is formed by combining these two independent ratings. For example, a heritage site rated as cultural value C4 and ecological value E-I is defined as “C4–E-I” (Supplementary Material S2). The same methodology was applied to heritage corridors. Each corridor segment was classified based on the aforementioned cultural and ecological value classifications, with its final composite type being the direct combination of these two classifications (e.g., forming “CL2–EL3”). Through this composite approach, the study transformed each analytical object from a single-dimensional entity into a complex unit possessing multiple attribute characteristics. Finally, the corridor network was deconstructed into connected data flows using the basic unit “Heritage Site A–Corridor–Heritage Site B”. Aggregate statistics were then calculated for these data flows to determine the frequency of connections between heritage sites of different composite types via heritage corridors of different composite types (Figure 10 and Figure 11).
From the structural characteristics of network components (Figure 10a,b), heritage sites exhibit a typical “bimodal” distribution. At one end lies the culturally dominant heritage represented by C4–E-I (high cultural value-low ecological value), typically corresponding to maturely developed, densely populated core towns. At the other end lies the ecologically foundational heritage represented by C1–E-II (low cultural value–medium ecological value), forming the extensive natural and rural backdrop of the heritage corridor network. Concurrently, the backbone of the heritage corridor network comprises medium-to-high-grade composite types represented by CL2–EL3 and CL3–EL3. These serve as the fundamental elements ensuring the network’s overall connectivity, rather than a few top-tier corridors.
The connectivity patterns of the heritage corridor network reveal its dynamic operational mechanisms (Figure 10c,d). Analyses of chord diagrams and Sankey diagrams jointly indicate that mid-to-high-level heritage corridors such as CL2–EL3, CL3–EL3, and CL4–EL4 function as “hubs” within the network. These corridors bear the greatest volume of cross-type connectivity flows, serving as critical intermediaries for the network’s efficient operation. The primary pathways clearly manifest as exchanges and integration between the “Cultural Core (C4–E-I)” and the “Ecological Base (C1–E-II)” through these pivotal corridors. However, the network exhibits a structural weakness of “value mismatch”: certain heritage sites of the highest cultural grade (C4) require access to the network via lower-grade corridors in localised segments. Although these “strong–weak” connections carry minimal flow volume, they constitute the most vulnerable links in the network’s resilience and represent potential risk points.
Analysis of spatial dimensions (Figure 11a–c). Separate mapping of ecological and cultural values reveals a pronounced “spatial disjunction”: heritage sites of high cultural value (Figure 11b, C3/C4 grade) are highly concentrated in historic towns such as Pingyao and Qi County, whereas those of high ecological value (Figure 11a, E-III/E-IV grade) are predominantly distributed in rural and natural environments distant from urban centres. This geographical divergence of values provides intuitive validation for the “bimodal” resource structure revealed by the distribution analysis. Despite the spatial disjunction in heritage site values, high-grade heritage corridors exhibit “spatial convergence”, collectively forming a north–south “main corridor”. This “main corridor”, clearly discernible in the composite classification map (Figure 11c), forms the core “axis” of the heritage corridor network’s “hub-and-spoke” spatial pattern. It represents not only the zone of highest value density but also the network’s most accessible core passageway, with secondary heritage corridors functioning as “spokes” extending from the main axis into the hinterland. This series of spatial pattern characteristics ultimately confirms that the heritage corridor network is an organic system with a clear hierarchical structure dominated by a core corridor.
In the composite flow analysis, we find that many high-value nodes can only access the network locally via lower-grade corridors, creating vulnerable mismatch segments characterised as “strong nodes–weak corridors.”. Existing studies often prioritise conservation resources for the high-value nodes themselves [40,63], while comparatively overlooking the continuity of connecting segments and overall system resilience. Our results suggest that for linear heritage, systemic risks frequently emerge on connecting segments rather than at core nodes. Accordingly, conservation priority should expand from point-based inventories to resilience-oriented governance across “nodes–corridors–networks.” This aligns with the advocacy of cultural–ecological corridors and regional integrated conservation paradigms [10,64], and also provides an additional pathway for organizing integrity evidence in World Heritage nominations.

4. Discussion

4.1. Effectiveness and Advantages of the “Dual-Dimension Multi-Centrality” Framework

The proposed “cultural–ecological dual-dimensional” framework translates the historical-cultural value and ecological–environmental value of heritage corridors into measurable parameters for network analysis. Compared with traditional Minimum Cumulative Resistance (MCR) approaches, it further incorporates Multiple Centrality Analysis (MCA) indicators—betweenness, closeness, and straightness—to evaluate corridors’ hub function, accessibility, and efficiency within the network. This enables the identification of principal axis corridors that undertake critical connectivity, redundant supporting corridors, and potential vulnerable breakpoints. Conventional LCH studies have largely focused on single least-cost path delineation [5]; even when ecological security patterns are considered [6], they rarely achieve a quantitative integration of cultural and ecological values. By contrast, the “culture-dominant”, “ecology-dominant”, and “culture–ecology composite” corridors identified through the MCA-based model provide more precise quantitative support for functionally differentiated management in LCH research [10,58].
From a global perspective, the transferable components of this framework include: (i) the construction logic of the dual-value indicator system (cultural value emphasising narrative association, authenticity, temporal span, and protection coverage; ecological value emphasising vegetation, proximity to water systems, and landscape structural connectivity); and (ii) an analytical chain of “value weighting–cost connectivity–network centrality decomposition–composite-type overlay”. Most of the required datasets are generic open data, which facilitates extension to other linear heritage types such as ancient trails, canals, and city walls. Notably, differences across countries/regions in inventory completeness, availability of narrative materials, and governance scales require local calibration of indicator weights and thresholds through collaboration between local experts and stakeholders, complemented by sample-based field verification and/or historical route cross-checking in sensitive segments to enhance credibility. Accordingly, the key contribution of this study is not the provision of “a fixed set of parameters”, but a reproducible and calibratable spatial analysis pathway that operationally translates value identification into corridor governance across diverse contexts.

4.2. Multi-Scale Governance for Sustainable Landscape Management

The “spatial misalignment” identified in this study—where high-cultural-value heritage is concentrated in historic towns such as Pingyao and Qixian, while high ecological-value areas are distributed in rural natural environments away from urban centres—reflects a typical tension between conservation and development. This finding is consistent with earlier observations of “conflicts between development and conservation” in World Heritage sites [4]. However, by identifying “culture–ecology composite corridors”, this study provides a spatial carrier through which this tension can be addressed. The three corridor types delineated in this study—namely culture-dominant corridors, ecology-dominant corridors, and culture–ecology composite corridors—offer a differentiated and fine-grained spatial governance framework to respond to the pervasive challenge in Linear Cultural Heritage (LCH) of a dynamic imbalance between development/use and ecological carrying capacity.
For culture-dominant corridors, their core function lies in linking the region’s highest-value, most narratively significant heritage site clusters. Management strategies should, therefore, focus on reinforcing their role as principal axes for cultural transmission and interpretation. This necessitates systematically enhancing the corridor’s cultural narrative capacity and accessibility while preserving the authenticity and integrity of the connected core heritage nodes, thereby establishing a comprehensive heritage value display network.
For ecology-dominant corridors, the strategic positioning is to safeguard regional ecosystem integrity and continuity. Heritage sites within such corridors typically exhibit low clustering density. Consequently, the core management principle is “ecological priority, cautious intervention” [25]. For heritage sites scattered within such corridors, strategies prioritising conservation and strictly controlling human disturbance should be adopted, ensuring that cultural preservation measures do not compromise the corridor’s overall ecological function.
For culture–ecology composite corridors, these represent highly interwoven cultural and ecological elements, constituting the most promising composite value zones. Connecting heritage sites of varying grades and types, they form multifunctional composite node areas. This provides a foundation for exploring synergistic conservation and development pathways in such regions. Management strategies should emphasise “adapting to local conditions and integrating innovation” [8]. Based on the specific combinations of heritage sites within these corridors, sustainable development models should be explored that achieve both cultural value revitalisation and ecological capital enhancement. This will enable them to become pioneering demonstration zones for resolving the contradiction between conservation and development.

4.3. Practical Implications for Heritage Nomination, Governance and Community Development

The quantitative outputs of this study provide direct support for ongoing practical work on the Jinzhong section of the Wanli Tea Road.
At the level of the transnational World Heritage nomination, the systematic corridor maps, hierarchical evaluation results, and identification of core clustering areas developed in this study offer strong spatial evidence for substantiating the “Outstanding Universal Value” (OUV) of the Wanli Tea Road. In particular, with regard to the key criterion of “Integrity”, the quantitative delineation of the corridor network visually demonstrates the overall interrelationships of the heritage and its inseparable dependence on the natural environment. The results indicate that the first-level high-centrality corridors physically connect the heritage clusters in Qixian, Pingyao County, and Jiexiu City into a coherent system. This confirms that the Jinzhong section is not a simple assemblage of isolated relics, but rather a cultural–ecological organism. Such objectively evidenced spatial continuity strongly supports the argument that heritage value extends from individual built elements to the surrounding landscape matrix, thereby providing a scientific basis for defining conservation boundaries.
At the level of cross-jurisdictional collaborative governance, replacing rigid administrative boundaries with functional cultural–ecological corridors provides a scientific basis for counties and county-level cities in Jinzhong to overcome administrative barriers and establish regionally coordinated conservation and development planning. The corridor network identified in this study spans multiple administrative borders, challenging conventional fragmented governance models. By overlaying the corridor hierarchy map with administrative boundary maps, decision-makers can pinpoint conflicts between high-value corridors and administrative development boundaries, and establish inter-county joint mechanisms to manage these key connections in a unified manner, preventing local development from severing the regional network.
At the level of local community participation, this study offers a fine-grained pathway for sustainable development. Local governments and communities can develop place-based cultural products and eco-tourism initiatives around these high-value areas. The dual-dimensional typology supports differentiated strategies: communities along culture-dominant corridors (e.g., near traditional towns) should primarily be supported in developing heritage tourism and cultural and creative industries; communities along ecology-dominant corridors (e.g., rural ecological buffer zones) should be incentivised to adopt ecological agriculture and provide ecosystem services, rather than pursuing high-intensity tourism indiscriminately. This zoning approach both prevents “overtourism” in fragile ecological areas and ensures that communities in remote ecological segments can share the benefits of heritage conservation through ecological compensation, so that conservation outcomes tangibly benefit local residents.

4.4. Research Limitations and Future Prospects

Despite establishing a relatively comprehensive analytical framework, this study retains certain limitations.
Firstly, the construction of resistance surfaces and weighting systems relies on the accuracy of existing data and expert judgement. While striving for objectivity, a degree of subjectivity persists. Future research may incorporate broader public participation (e.g., through participatory GIS) to calibrate weights, thereby enhancing the consensus-based nature of evaluations.
Secondly, in using K-means clustering to identify heritage clustering areas and corridor hierarchies, although the optimal number of classes was determined based on statistical criteria, the algorithm inherently requires a pre-specified k and is sensitive to initial centroids, with a tendency to detect spherical clusters. This may introduce bias when dealing with the complex and irregular spatial distribution characteristic of linear heritage. Future research could incorporate hierarchical clustering for comparative validation, thereby further improving the robustness and accuracy of the spatial classification results.
Thirdly, this study constitutes a static spatial analysis, failing to fully capture the long-term impacts of dynamic factors such as urbanisation and climate change on heritage corridor stability. Future research may develop spatiotemporal dynamic models to simulate heritage corridor evolution under various development scenarios.
Fourthly, heritage corridor construction emphasises physical spatial connectivity, with insufficient characterisation of the underlying human and social network flows (such as information and economic flows) within heritage corridors. Integrating social network analysis with spatial network analysis represents a promising avenue for future LCH research.

5. Conclusions

This study addresses the core challenge of the persistent disconnect between cultural and ecological value assessments, and the intractable tension between conservation and development in Linear Cultural Heritage (LCH). Using the Jinzhong section of the Great Tea Road as an empirical case, it successfully constructs and applies a composite heritage corridor identification and grading framework integrating a dual-dimensional value system for cultural–ecological values with Multiple Centrality Analysis (MCA). The research not only deepens theoretical understanding of the complex systemic nature of LCH but also provides an operational, quantitative pathway for its practical management.
The principal conclusions of this study are as follows:
Firstly, this study establishes a dual-dimensional evaluation system that promotes cultural–ecological synergy, effectively addressing the limitations of a single-value perspective. By integrating the Historical and Cultural Value (HCV) and Ecological and Environmental Value (EEV) indicator systems, qualitative heritage narratives and complex ecological attributes are translated into quantifiable parameters for spatial analysis, thereby forming a comprehensive assessment system that simultaneously accommodates cultural connectivity needs and ecological avoidance principles. This system moves beyond the conventional constraints of LCH studies that focus primarily on historical route reconstruction or a single ecological security pattern and establishes a quantifiable and reproducible logic for corridor identification.
Secondly, this study reveals the spatial mismatch of a “cultural monocentric–ecological multicentric” configuration in the Jinzhong section, and achieves refined grading of the corridor network. Using the “dual-dimension Multi-Centrality” analytical framework, the study not only identifies a potential physically connected corridor network, but also uncovers its deeper structural characteristics through K-means clustering: cultural value is highly concentrated in traditional town centres such as Pingyao and Qixian, whereas ecological value exhibits a multicentric, networked distribution across peripheral mountainous areas and rural landscapes. On this basis, the complex corridor network is further deconstructed into three functional corridor typologies—“culture-dominant”, “ecology-dominant”, and “culture–ecology composite (synergistic)” corridors. This grading outcome goes beyond simple route delineation by clarifying the key functional roles of different corridor segments within the regional network, and provides a clear spatial baseline for mitigating conservation–development tensions arising from “spatial mismatch”.
Thirdly, the research outputs provide multi-scale scientific decision support for World Heritage nomination, regional governance, and community development. (1) At the nomination level, the identified first-level high-centrality corridors verify functional physical linkages among the heritage clusters in Qixian, Pingyao, and Jiexiu, demonstrating that the Jinzhong section functions as a living “cultural–ecological organism” and providing critical physical spatial evidence for substantiating “Integrity”. (2) At the governance level, the corridor network map spanning administrative boundaries offers a scientific basis for overcoming administrative fragmentation, supporting the establishment of inter-county/city joint conservation mechanisms to prevent local development from severing overall regional connectivity. (3) At the community level, differentiated management strategies grounded in corridor typology (e.g., developing cultural tourism along culture-oriented corridors and promoting ecological agriculture along ecology-oriented corridors) provide targeted guidance for sustainable local livelihoods, facilitating heritage-for-people outcomes while safeguarding fragile ecological environments.
This study not only provides scientific decision-making support for the conservation and development of the Jinzhong section of the Great Tea Road, but more importantly, it offers a replicable paradigm and model for the systematic understanding, value interpretation, and spatial governance of other Linear Cultural Heritage sites worldwide facing similar challenges—such as ancient trails, canals, and frontier walls.

Supplementary Materials

The following supporting information can be downloaded at: https://www.mdpi.com/article/10.3390/land15020293/s1, Supplementary Material S1: Indicator Table for Historical and Cultural Value (HCV); Supplementary Material S2: Corridor Type Construction Table.

Author Contributions

Conceptualization, L.M.; software, L.M.; validation, L.M. and L.C.; formal analysis, L.M.; investigation, L.M.; resources, L.C.; data curation, L.M. and B.Z.; writing—original draft, L.M.; writing—review and editing, L.M. and B.Z.; visualisation, L.M. and B.Z.; supervision, L.C.; project administration, L.C.; funding acquisition, L.C. All authors have read and agreed to the published version of the manuscript.

Funding

This research was funded by the Major Program of National Fund of Philosophy and Social Science of China (CN) grant number 19ZDA193 and the APC was funded by the Major Program of National Fund of Philosophy and Social Science of China (CN).

Data Availability Statement

The datasets used and analysed during the current study are available from the corresponding author upon reasonable request.

Acknowledgments

The authors would like to thank the editor and reviewers for their insightful comments and suggestions.

Conflicts of Interest

The authors declare no conflicts of interest.

References

  1. Boda, G. The Convention Concerning the Protection of the World Cultural and Natural Heritage (Paris, 1972) and Romania. Plur. Hist. Cult. Soc. 1972, 6, 17–31. [Google Scholar]
  2. Bhati, H.V.; Epstein, Y. Protection of Biocultural Heritage in the Anthropocene: Towards Reconciling Natural, Cultural, Tangible and Intangible Heritage. J. Environ. Law 2023, 35, 353–375. [Google Scholar] [CrossRef] [Scilit]
  3. Huo, S. Protección y Gestión de Rutas Patrimoniales. Propuestas Para La “Ruta de La Seda: Red Viaria Del Corredor Chang’an-Tianshan”. Ph.D. Thesis, Universidad de Valladolid, Valladolid, Spain, 2021. [Google Scholar]
  4. Brumann, C. Shifting Tides of World-Making in the UNESCO World Heritage Convention: Cosmopolitanisms Colliding. Ethn. Racial Stud. 2014, 37, 2176–2192. [Google Scholar] [CrossRef] [Scilit]
  5. Zhang, S.; Liu, J.; Pei, T.; Chan, C.-S.; Wang, M.; Meng, B. Tourism Value Assessment of Linear Cultural Heritage: The Case of the Beijing–Hangzhou Grand Canal in China. Curr. Issues Tour. 2023, 26, 47–69. [Google Scholar] [CrossRef] [Scilit]
  6. Li, H.; Zhang, T.; Cao, X.; Yao, L. Active Utilization of Linear Cultural Heritage Based on Regional Ecological Security Pattern along the Straight Road (Zhidao) of the Qin Dynasty in Shaanxi Province, China. Land 2023, 12, 1361. [Google Scholar] [CrossRef] [Scilit]
  7. Zhou, W.; Cenci, J.; Zhang, J. Systematic Bibliometric Analysis of the Cultural Landscape. J. Asian Archit. Build. Eng. 2024, 23, 1142–1164. [Google Scholar] [CrossRef] [Scilit]
  8. He, D.; Hu, J.; Zhang, J. Assessment of Sustainable Development Suitability in Linear Cultural Heritage—A Case of Beijing Great Wall Cultural Belt. Land 2023, 12, 1761. [Google Scholar] [CrossRef] [Scilit]
  9. Li, L.; Feng, R.; Xi, J. Ecological Risk Assessment and Protection Zone Identification for Linear Cultural Heritage: A Case Study of the Ming Great Wall. Int. J. Environ. Res. Public Health 2021, 18, 11605. [Google Scholar] [CrossRef] [Scilit]
  10. Sun, Y.; Wang, Y.; Liu, L.; Wei, Z.; Li, J.; Cheng, X. Large-Scale Cultural Heritage Conservation and Utilization Based on Cultural Ecology Corridors: A Case Study of the Dongjiang-Hanjiang River Basin in Guangdong, China. Herit. Sci. 2024, 12, 44. [Google Scholar] [CrossRef] [Scilit]
  11. Steward, J.H. Theory of Culture Change; University of Illinois Press: Urbana, IL, USA, 1955. [Google Scholar]
  12. Severo, M. European Cultural Routes: Building a Multi-actor Approach. Mus. Int. 2017, 69, 136–145. [Google Scholar] [CrossRef] [Scilit]
  13. Yang, Y.; Feng, Z.; Wu, K.; Lin, Q. How to Construct a Coordinated Ecological Network at Different Levels: A Case from Ningbo City, China. Ecol. Inf. 2022, 70, 101742. [Google Scholar] [CrossRef] [Scilit]
  14. Tao, L.; Wang, H.; Li, J.; Zhang, L. Construction of CCSPM Model for Spatial Definition of Cultural Corridor: A Case Study of Cross-Border Cultural Corridor in Southwest Yunnan. Sci. Geogr. Sin. 2022, 42, 602–610. [Google Scholar]
  15. Yin, L.C.; Liu, P.L.; Li, B.H.; Qi, J.; Hu, Z.; Deng, Y.Y. Map of Traditional Settlement Landscape Morphology Gene: A Case Study of the Xiangjiang River Basin. Sci. Geogr. Sin. 2023, 43, 1053–1065. [Google Scholar]
  16. Manning, R.E.; Anderson, L.E.; Pettengill, P. Managing Outdoor Recreation: Case Studies in the National Parks, 2nd ed.; CABI: Wallingford, UK, 2017. [Google Scholar]
  17. Jongman, R.H.; Külvik, M.; Kristiansen, I. European Ecological Networks and Greenways. Landsc. Urban Plan. 2004, 68, 305–319. [Google Scholar] [CrossRef] [Scilit]
  18. Foster, G.; Saleh, R. The Adaptive Reuse of Cultural Heritage in European Circular City Plans: A Systematic Review. Sustainability 2021, 13, 2889. [Google Scholar] [CrossRef] [Scilit]
  19. Booher, D.E.; Innes, J.E. Governance for Resilience: CALFED as a Complex Adaptive Network for Resource Management. Ecol. Soc. 2010, 15, art35. [Google Scholar] [CrossRef] [Scilit]
  20. Zhao, S.; Yang, D.; Gao, C. Identifying Landscape Character for Large Linear Heritage: A Case Study of the Ming Great Wall in Ji-Town, China. Sustainability 2023, 15, 2615. [Google Scholar] [CrossRef] [Scilit]
  21. Wang, Y.; Huang, S.; Kim, A.K. Toward a Framework Integrating Authenticity and Integrity in Heritage Tourism. J. Sustainable Tourism 2015, 23, 1468–1481. [Google Scholar] [CrossRef] [Scilit]
  22. Yang, J.; Xie, B.; Zhang, D.; Mak-Mensah, E.; Pei, T. Habitat Quality Assessment and Multi-Scenario Prediction of the Gansu-Qinghai Section of the Yellow River Basin Based on the FLUS-InVEST Model. Front. Ecol. Evol. 2023, 11, 1228558. [Google Scholar] [CrossRef] [Scilit]
  23. Saura, S.; Pascual-Hortal, L. A New Habitat Availability Index to Integrate Connectivity in Landscape Conservation Planning: Comparison with Existing Indices and Application to a Case Study. Landsc. Urban Plan. 2007, 83, 91–103. [Google Scholar] [CrossRef] [Scilit]
  24. Hunsaker, C.T.; Graham, R.L.; Suter, G.W.; O’Neill, R.V.; Barnthouse, L.W.; Gardner, R.H. Assessing Ecological Risk on a Regional Scale. Environ. Manag. 1990, 14, 325–332. [Google Scholar] [CrossRef] [Scilit]
  25. Donati, G.F.A.; Bolliger, J.; Psomas, A.; Maurer, M.; Bach, P.M. Reconciling Cities with Nature: Identifying Local Blue-Green Infrastructure Interventions for Regional Biodiversity Enhancement. J. Environ. Manag. 2022, 316, 115254. [Google Scholar] [CrossRef] [Scilit] [PubMed]
  26. Aas, C.; Ladkin, A.; Fletcher, J. Stakeholder Collaboration and Heritage Management. Ann. Touris. Res. 2005, 32, 28–48. [Google Scholar] [CrossRef] [Scilit]
  27. Adriaensen, F.; Chardon, J.P.; De Blust, G.; Swinnen, E.; Villalba, S.; Gulinck, H.; Matthysen, E. The Application of ‘Least-Cost’ Modelling as a Functional Landscape Model. Landsc. Urban Plan. 2003, 64, 233–247. [Google Scholar] [CrossRef] [Scilit]
  28. Geneletti, D.; van Duren, I. Protected Area Zoning for Conservation and Use: A Combination of Spatial Multicriteria and Multiobjective Evaluation. Landsc. Urban Plan. 2008, 85, 97–110. [Google Scholar] [CrossRef] [Scilit]
  29. Shi, H.; ping Yang, Z.; Han, F.; ge Shi, T.; Li, D. Assessing Landscape Ecological Risk for a World Natural Heritage Site: A Case Study of Bayanbulak in China. Pol. J. Environ. Stud. 2015, 24, 269–283. [Google Scholar] [CrossRef] [Scilit]
  30. Xu, H.; Plieninger, T.; Primdahl, J. A Systematic Comparison of Cultural and Ecological Landscape Corridors in Europe. Land 2019, 8, 41. [Google Scholar] [CrossRef] [Scilit]
  31. Ge, Y.; Liu, Y.; Ma, Y.; Wang, Y.; Guo, Y.; He, J.; Mao, Y. Spatial Identification and Corridor Network Analysis of Cultural Heritage Based on Multi-Model Fusion: A Case Study of Western Henan. Ecol. Indic. 2025, 178, 113859. [Google Scholar] [CrossRef] [Scilit]
  32. Xu, H.; Zhao, G.; Fagerholm, N.; Primdahl, J.; Plieninger, T. Participatory Mapping of Cultural Ecosystem Services for Landscape Corridor Planning: A Case Study of the Silk Roads Corridor in Zhangye, China. J. Environ. Manag. 2020, 264, 110458. [Google Scholar] [CrossRef] [Scilit]
  33. Wu, J. Landscape Sustainability Science: Ecosystem Services and Human Well-Being in Changing Landscapes. Landsc. Ecol. 2013, 28, 999–1023. [Google Scholar] [CrossRef] [Scilit]
  34. Milano, C.; Cheer, J.M.; Novelli, M. Overtourism: Excesses, Discontents and Measures in Travel and Tourism; CABI: Wallingford, UK, 2019. [Google Scholar]
  35. Kosmas, P.; Galanakis, G.; Constantinou, V.; Drossis, G.; Christofi, M.; Klironomos, I.; Zaphiris, P.; Antona, M.; Stephanidis, C. Enhancing Accessibility in Cultural Heritage Environments: Considerations for Social Computing. Univers. Access Inf. Soc. 2020, 19, 471–482. [Google Scholar] [CrossRef] [Scilit]
  36. Meng, L.; Du, Z.; Jia, Z.; Cao, L. Spatial Mechanisms and Coupling Coordination of Cultural Heritage and Tourism along the Jinzhong Segment of the Great Tea Road. Heritage 2026, 9, 7. [Google Scholar] [CrossRef] [Scilit]
  37. Huang, X.; Li, C.; Zhao, J.; Chen, S.; Gao, M.; Liu, H. Investigating Spatial Heterogeneity Patterns and Coupling Coordination Effects of the Cultural Ecosystem Service Supply and Demand: A Case Study of Taiyuan City, China. Land 2025, 14, 1212. [Google Scholar] [CrossRef] [Scilit]
  38. Tudor, C. An Approach to Landscape Character Assessment. Nat. Engl. 2014, 65, 101716. [Google Scholar]
  39. Gumiero, B.; Mant, J.; Hein, T.; Elso, J.; Boz, B. Linking the Restoration of Rivers and Riparian Zones/Wetlands in Europe: Sharing Knowledge through Case Studies. Ecol. Eng. 2013, 56, 36–50. [Google Scholar] [CrossRef] [Scilit]
  40. Wang, Q.; Yang, C.; Wang, J.; Tan, L. Tourism in Historic Urban Areas: Construction of Cultural Heritage Corridor Based on Minimum Cumulative Resistance and Gravity Model—A Case Study of Tianjin, China. Buildings 2024, 14, 2144. [Google Scholar] [CrossRef] [Scilit]
  41. Zhou, J.; He, J.; Tan, L.; Yan, S. Integrity Protection of the Chang Zhen Great Wall Heritage Corridor Based on Minimum Cumulative Resistance. NPJ Herit. Sci. 2025, 13, 479. [Google Scholar] [CrossRef] [Scilit]
  42. Liu, Y.; Ma, X. Heritage Corridor Construction in the Sui–Tang Grand Canal’s Henan Section Based on the Minimum Cumulative Resistance (MCR) Model. Land 2025, 14, 2128. [Google Scholar] [CrossRef] [Scilit]
  43. Wu, Y.; Jiang, Y.; Wu, Y.; Miao, M. Heritage Corridor Construction of Classical Gardens of Suzhou Using Minimum Cumulative Resistance Model. NPJ Herit. Sci. 2025, 13, 530. [Google Scholar] [CrossRef] [Scilit]
  44. LaPoint, S.; Balkenhol, N.; Hale, J.; Sadler, J.; van der Ree, R. Ecological Connectivity Research in Urban Areas. Funct. Ecol. 2015, 29, 868–878. [Google Scholar] [CrossRef] [Scilit]
  45. Liu, S.; Xia, Y.; Ji, Y.; Lai, W.; Li, J.; Yin, Y.; Qi, J.; Chang, Y.; Sun, H. Balancing Urban Expansion and Ecological Connectivity through Ecological Network Optimization—A Case Study of Changsha County. Land 2023, 12, 1379. [Google Scholar] [CrossRef] [Scilit]
  46. Ms, M.; Katpatal, Y.B.; Londhe, D.S. Analyzing the Impact of Floods on Vehicular Mobility along Urban Road Networks Using the Multiple Centrality Assessment Approach. ASCE-ASME J. Risk Uncertain. Eng. Syst. A Civ. Eng. 2022, 8, 5022001. [Google Scholar]
  47. Al-Saaidy, H. A Comparative Study in Measuring Street Networks (Space Syntax SS and Multiple Centrality Assessment MCA) a Literature Review. Preprints 2023. [Google Scholar] [CrossRef] [Scilit]
  48. Zhang, T.; Chen, X.; Liu, T. Linear Cultural Heritage Eco-Cultural Spatial System: A Case Study of the Great Tea Route in Shanxi. Front. Archit. Res. 2025, 14, 1063–1075. [Google Scholar] [CrossRef] [Scilit]
  49. Nor, A.N.M.; Corstanje, R.; Harris, J.A.; Grafius, D.R.; Siriwardena, G.M. Ecological Connectivity Networks in Rapidly Expanding Cities. Heliyon 2017, 3, e00325. [Google Scholar] [CrossRef] [Scilit]
  50. Wang, W.; Shi, Q.; Wang, G. Exploration of the Landscape Gene Characteristics of Traditional Villages along the Jinzhong Section of the Wanli Tea Road from the Perspective of the Village Temple System. Land 2024, 13, 1602. [Google Scholar] [CrossRef] [Scilit]
  51. Li, X. Heritage Perspective of the Great Tea Route in China. Acad. J. Humanit. Soc. Sci. 2024, 7, 110–118. [Google Scholar] [CrossRef] [Scilit]
  52. Jiang, W. Research on the Land Journey of Shanxi Merchants’ Tea Road Based on ArcGIS. J. Jinzhong Univ. 2023, 40, 50–53,58. [Google Scholar]
  53. Li, N.; Dong, J. Historical Evolution and Influence of the Shanxi Section of the Tea Road. J. Shanxi Inst. Social. 2024, 2, 73–80. [Google Scholar]
  54. Zhang, Y. Market Towns, Tea Trade and Historical Significance of the Shanxi Section of the Tea Road. Agric. Archaeol. 2022, 2, 266–270. [Google Scholar]
  55. An, W. Formation and Discussion of the Shanxi Section Route of the Tea Road. Agric. Archaeol. 2022, 2, 256–260. [Google Scholar]
  56. Xue, X. Research on the Development of Shanxi Merchant Cultural Industry in the Shanxi Section of the Tea Road; Economic Management Press: Beijing, China, 2018. [Google Scholar]
  57. Vogt, P.; Riitters, K.H.; Estreguil, C.; Kozak, J.; Wade, T.G.; Wickham, J.D. Mapping Spatial Patterns with Morphological Image Processing. Landsc. Ecol. 2007, 22, 171–177. [Google Scholar] [CrossRef] [Scilit]
  58. Lin, F.; Zhang, X.; Ma, Z.; Zhang, Y. Spatial Structure and Corridor Construction of Intangible Cultural Heritage: A Case Study of the Ming Great Wall. Land 2022, 11, 1478. [Google Scholar] [CrossRef] [Scilit]
  59. Nicolosi, A.; Laganà, V.R.; Cortese, L.; Privitera, D. Using the Network and MCA on Tourist Attractions. The Case of Aeolian Islands, Italy. Sustainability 2018, 10, 4169. [Google Scholar] [CrossRef] [Scilit]
  60. Dong, L.; Kang, M. Quantitative Comparison of Geographical Color of Traditional Village Architectural Heritage Based on K-Means Color Clustering—A Case Study of Southeastern Hubei Province, China. Buildings 2025, 15, 748. [Google Scholar] [CrossRef] [Scilit]
  61. Visser, G. The Spatial Mismatch between Cities and Heritage Tourism Sites in Africa. In Cultural Heritage and Tourism in Africa; Routledge: London, UK, 2023; pp. 104–115. [Google Scholar]
  62. Hu, H. Spatial Synergy between Cultural Heritage and Metro Networks: A Case Study of Distribution Patterns and Value Assessment in Beijing. Sustainability 2025, 17, 1666. [Google Scholar] [CrossRef] [Scilit]
  63. Chen, Y.; Dang, A.; Peng, X. Building a Cultural Heritage Corridor Based on Geodesign Theory and Methodology. J. Urban Manag. 2014, 3, 97–112. [Google Scholar] [CrossRef] [Scilit]
  64. Li, Y.; Wang, X.; Dong, X. Delineating an Integrated Ecological and Cultural Corridor Network: A Case Study in Beijing, China. Sustainability 2021, 13, 412. [Google Scholar] [CrossRef] [Scilit]
Figure 1. Technical Roadmap.
Land 15 00293 g001
Figure 2. Location map of the research area. (a) Shanxi province, China; (b) Jinzhong city, Shanxi province; (c) research area of six counties Jinzhong city; (d) geographical overview of the study area.
Land 15 00293 g002
Figure 3. Kernel density estimation of different heritage types. (a) Tea Ceremony, Post Stations, and Bridges; (b) Temple Complex; (c) Shanxi Merchant Residence; (d) Tea Commerce and Traditional Banks; (e) Tea Trading Rest Point; (f) Other.
Land 15 00293 g003
Figure 4. Historical and cultural value—distribution of indicators. (a) RTCR; (b) HA; (c) TS; (d) CMC; (e) HCV.
Land 15 00293 g004
Figure 5. Ecological and environmental value—distribution of indicators. (a) DEM; (b) ABZ; (c) NDVI; (d) MSPA; (e) EEV.
Land 15 00293 g005
Figure 6. Construction of single-factor resistance surface. (a) CED; (b) CEID; (c) NDVI; (d) ABZ; (e) SG; (f) DEM; (g) LULC; (h) DETR; (i) DFCR; (j) DFPR; (k) DFNR; (l) DFH; (m) TSA; (n) AS; (o) RS.
Land 15 00293 g006
Figure 7. Generated corridors based on the MCR model. (a) Construction of comprehensive resistance surface; (b) construction of heritage corridors; (c) corridors and heritage sites.
Land 15 00293 g007
Figure 8. (a) Elbow method for optimal number of clusters based on CHV; (b) principal PCA of K-means clusters based on CHC; (c) elbow method for optimal number of clusters based on EEV; (d) principal PCA of K-means clusters based on EEV.
Land 15 00293 g008
Figure 9. Hierarchical classification of heritage corridors based on the MCA model. (a) The betweenness of HCV; (b) the closeness of HCV; (c) the straightness of HCV; (d) the centrality of EEV; (e) the betweenness of EEV; (f) the closeness of EEV; (g) the straightness of EEV; (h) the centrality of EEV.
Land 15 00293 g009
Figure 10. (a) Heritage sites composite type heatmap; (b) corridors composite type heatmap; (c) chord diagram of heritage sites and corridor compound type; (d) flow diagram of the composite type of heritage sites and corridors.
Land 15 00293 g010
Figure 11. (a) Grading of EEV of heritage sites and corridors; (b) grading of HCV of heritage sites and corridors; (c) composite classification of heritage sites and corridors.
Land 15 00293 g011
Table 1. Indicators, weights, and data processing for heritage value assessment.
Value DimensionIndicator TypeData Processing MethodWeight
Historical and cultural value (HCV)Relevance to Tea Ceremony Records (RTCR)Scores were assigned to each heritage site and normalised (see Supplementary Material S1 for detailed criteria).0.3
Heritage Authenticity (HA)0.4
Temporal Span (TS)0.2
Conservation Measure Coverage (CMC)0.1
Ecological and environmental value (EEV)Digital Elevation Model (DEM)Multi-values were extracted to points in ArcGIS10.8 and used as the value indicator.0.1
Normalised Difference Vegetation Index (NDVI)0.3
Aquatic Buffer Zone (ABZ)0.1
Morphological Spatial Pattern Analysis (MSPA)MSPA classification based on LULC; core patches were extracted and connectivity indices (IIC, PC, dPC) were calculated to identify ecological source areas.0.5
Table 2. Indicators and Data Sources for Comprehensive Resistance Surface Construction.
Primary IndicatorSecondary IndicatorData SourceData Processing MethodWeight
Natural Environment
(NE)
Land Use and Land Cover (LULC)ESA WorldCover:
https://esa-worldcover.org/en
(accessed on 1 March 2025)
Direct application0.0684
Normalised Difference Vegetation Index (NDVI)NASA Earthdata
https://earthdata.nasa.gov/
(accessed on 1 March 2025)
Direct application0.1207
Digital Elevation Model (DEM)Direct application0.0546
Slope Gradient (SG)Derived from processing DEM data0.2067
Aquatic Buffer Zone (ABZ)0.0439
Transportation Network (TN)Vector Road Network
(VRN)
OSM road data
https://www.openstreetmap.org/
(accessed on 1 March 2025)
Derived using the Euclidean Distance tool in ArcGIS10.80.1992
Public Services (PS)Restaurant Services (RSs)Baidu Map POI open
Data https://lbsyun.baidu.com/
(queried and
compiled in 1 March 2025)
Derived using the Kernel Density tool in ArcGIS10.80.0367
Accommodation Services (ASs)0.0879
Tourist Scenic Areas (TSAs)0.0795
Cultural Development (CD)Cultural Enterprise Density (CED)Baidu Map POI open
Data https://lbsyun.baidu.com/
(queried and
compiled in 1 March 2025)
Derived using the Kernel Density tool in ArcGIS0.0533
Cultural and Educational Institution Density (CEID)0.0491
Table 3. Weights of resistance factors.
Resistance FactorWeightResistance Value
12345
Natural EnvironmentDigital Elevation Model (DEM)0.49430.0684<0.20.2–0.40.4–0.60.6–0.8>0.8
Slope Gradient (SG)0.1207<88–1515–2525–45>45
Normalised Difference Vegetation Index (NDVI)0.0546<0.400.40–0.600.60–0.750.75–0.85>0.85
Land Use and Land Cover (LULC)0.2067Construction LandArable LandGrasslandWater BodyForest Land
Aquatic Buffer Zone (ABZ)0.0439>800600–800400–600200–400<200
Transportation NetworksDistance From Highway (DFH)0.19920.0654<0.50.5–11–1.51.5–2>2
Distance From National Road (DFNR)0.0479<0.50.5–11–1.51.5–2>2
Distance From Provincial Road (DFPR)0.0371<0.50.5–11–1.51.5–2>2
Distance From County Road (DFCR)0.0281<0.50.5–11–1.51.5–2>2
Distance From Township Road (DFTR)0.0207<0.50.5–11–1.51.5–2>2
Public ServicesRestaurant Services (RSs)0.20410.0367>187–180.5–70.3–0.5<0.3
Accommodation Services (ASs)0.0879>42.5–41.5–2.50.2–1.5<0.2
Tourist Scenic Areas (TSAs)0.0795>0.350.25–0.350.15–0.250.08–0.15<0.08
Cultural DevelopmentCultural Enterprise Density (CED)0.10240.0533>42.5–41.5–2.50.2–1.5<0.2
Cultural and Educational Institution Density (CEID)0.0491>42.5–41.5–2.50.2–1.5<0.2
Disclaimer/Publisher’s Note: The statements, opinions and data contained in all publications are solely those of the individual author(s) and contributor(s) and not of MDPI and/or the editor(s). MDPI and/or the editor(s) disclaim responsibility for any injury to people or property resulting from any ideas, methods, instructions or products referred to in the content.