Article

Monitoring Changes in Urban–Agricultural–Ecological Space Competition and Assessing Its Impact on Ecosystem Service Value in China’s Key Agricultural Regions


College of Landscape Architecture, Henan Agricultural University, Zhengzhou 450002, China
*
Authors to whom correspondence should be addressed.
Land 2026, 15(2), 260; https://doi.org/10.3390/land15020260
Submission received: 26 December 2025 / Revised: 30 January 2026 / Accepted: 31 January 2026 / Published: 3 February 2026
(This article belongs to the Section Land Use, Impact Assessment and Sustainability)

Abstract

Human activity-driven territorial spatial competition profoundly affects ecosystem service value (ESV). However, the spatiotemporal patterns of “urban–agricultural–ecological space” (UAES) competition in China’s key agricultural regions and their quantitative effects on ESV have not been systematically investigated. Therefore, this study first constructed a “UAES competition–ESV response” analytical framework and selected Henan Province, a representative key agricultural region in China, as the study area. Subsequently, utilizing land-use remote sensing monitoring data from five periods (1980 to 2020), this study systematically analyzed the spatiotemporal competition characteristics of UAES in Henan Province and its impact on ESV using GIS spatial analysis method, the Geo-informatic Tupu method, and improved ESV evaluation model. The results indicate that from 1980 to 2020, Henan Province experienced a gradual shrinkage of agricultural space, rapid urban expansion, and a slight decline in ecological space. Urban encroachment on agricultural land is the primary spatial competition manifestation, which is most pronounced in the core area of the Central Plains Urban Agglomeration. This urban expansion and subsequent agricultural encroachment on ecological land are key ESV loss drivers, causing losses of USD 812.41 million and USD 1663.24 million, respectively. The indirect ESV loss from cropland displacement substantially exceeded direct losses from urban expansion. This study provides critical insights into the trade-offs between urban expansion, agricultural development, and ecological protection in agricultural regions undergoing urbanization. The findings inform spatial planning and ecological conservation strategies in Henan Province and other similar agricultural regions.

1. Introduction

Ecosystem services are crucial for natural resource availability, human well-being, and sustainable development [1]. As the foundation for human survival and development, territorial space provides the basis for the sustainable management of ecosystem services and human well-being [2,3]. With the continuous growth of the global population and the rapid development of urbanization, competition among various types of global land use has intensified significantly. This competition profoundly influences the scale and spatial patterns of ecological service land, agricultural production land, and urban development land, which often expand or contract at each other’s expense. By altering the structure of land use and land cover, such competition further reshapes the biogeochemical structure and functions of the Earth, as well as the cycles of matter and energy within the Earth system. Ultimately, these changes lead to the degradation of terrestrial ecosystem structures and the decline of their service functions [4,5,6,7,8,9]. Balancing competing territorial spatial uses and their impacts on ecosystem services has become a key issue in global sustainable development research [10,11].
Since its reform and opening-up, China has achieved remarkable progress in urbanization and industrialization. However, this rapid development has also created serious challenges, including disorderly spatial development [12,13], the extensive expansion of urban and industrial land [14,15], the loss of prime agricultural land [16,17], and the continuous encroachment on ecological spaces [18,19]. These challenges not only threaten China’s food and ecological security but also pose a serious challenge to sustainable development, both within China and globally. In response, the Chinese government has introduced a spatial governance framework centered on the “Three Zones and Three Lines” strategy, which comprises three functional zones (urban–agricultural–ecological space (UAES)) and three control lines (urban development boundaries, permanent basic farmland, and ecological conservation redlines). The spatial governance framework aims to guide national land use and create a balanced new pattern for territorial development and protection [2]. Urban space refers to areas primarily designated for urban construction and residential life; agricultural space denotes regions chiefly dedicated to agricultural production and rural livelihood; while ecological space encompasses natural areas focused mainly on providing ecological products and services [2]. The UAES concept directly aligns with the functional divisions for urbanization, food security, and ecological security as defined in China’s Major Function-Oriented Zone Planning. This framework serves as a crucial link between macro-scale (Major Function-Oriented Zone Planning) and micro-scale (land use planning) strategies, providing a key means to optimize the national spatial pattern [20]. Therefore, within China’s new spatial governance framework, exploring the regional heterogeneity of competition among UAES and the corresponding impacts on ecosystem services is crucial. This research is essential for optimizing land use patterns to balance urban development, food security, and ecological protection, ultimately promoting the sustainable management of territorial space.
A substantial body of research now exists on territorial spatial competition in China. Traditionally, these studies have examined spatial competition and conflict through the lens of micro-level land use transformation, with an emphasis on land-element management [13,18,21,22,23]. The 2012 report from the 18th National Congress of the Communist Party of China introduced a goal for territorial space optimization: to “promote intensive and efficient production space, comfortable and moderate living space, and clear and beautiful ecological space.” In response to this policy, numerous studies have investigated territorial spatial competition from the “Production–Living–Ecological” (PLE) land function perspective. This research has concentrated on typical areas with prominent human-land conflicts, such as mountainous regions [24,25,26], watersheds [27,28,29,30], and urban agglomerations [31,32,33]. This facilitates understanding of the spatiotemporal evolution of territorial spatial structure from a functional perspective. However, within the “Production–Living–Ecological” (PLE) spaces research framework, living space is distributed in both urban and rural areas. Moreover, urban living space and production space are complementary and difficult to separate, leading to a degree of overlap and intersection among the boundaries of the three spatial types [2,20]. However, studying territorial spatial competition through UAES framework holds greater policy and practical significance, as it directly aligns with the current spatial planning and governance initiatives promoted by the Chinese government. The UAES framework not only focuses on the functional attributes of land but also emphasizes the ownership of dominant spatial functions and the delineation of regulatory boundaries. Its spatial units—urban, agricultural, and ecological—are relatively complete and contiguous, allowing for clear, non-overlapping regulatory boundaries to be defined. This provides a direct and integrated interface for the on-the-ground implementation of territorial spatial planning. Responding to these new national guidelines, some scholars have investigated the dynamics and driving mechanisms of UAES competition at both the national [34,35,36,37] and regional scales [38,39,40,41,42,43]. Competition for scarce land among agricultural, construction, and ecological uses is widespread. This is driven by socioeconomic factors like population growth and urbanization, as well as land policies and climate change. The most significant forms of this competition occur between urban and agricultural spaces, and between agricultural and ecological spaces. The former (urban–agricultural) competition is most prevalent in China’s eastern and central plains, while the latter (agricultural–ecological) is more prominent in the arid northwest and the mountainous regions of the south. Methodologically, research on UAES follows two main approaches. One involves constructing a functional indicator evaluation system [38,44]. The more common approach, however, identifies these functional spaces by mapping land use/land cover (LUCC) categories to their dominant functions [26,27,29,34,36,42]. This method offers the advantages of multi-scale integration and multi-resolution, spatially explicit representation. Consequently, it has been widely applied in studies of spatial competition at various scales. The land use data for these studies primarily come from two sources: national land surveys [35] and LUCC data derived from remote sensing images [26,34,36,41]. The former (national land surveys) provides the most accurate data but is difficult to obtain and cannot support long-term time-series analyses. In contrast, the latter (remote sensing LUCC data) is multi-scale, multi-temporal, easily obtainable, and low-cost. Therefore, it is widely used in this field of research.
Territorial spatial competition profoundly affects ecosystem service supply and human well-being [9]. The assessment of ecosystem service value (ESV) provides a common monetary metric to aggregate and compare diverse ecosystems, thereby informing effective spatial planning and ecological management decisions [1]. The primary method currently used to evaluate ESV is the equivalent factor method. This method is widely used due to its efficiency, low data collection costs, and broad feasibility [45,46,47,48,49]. In 1997, Costanza et al. first used this method to assess the value of ecological systems on a global scale [1]. Building on the work of Costanza et al. [1], Chinese scholar Xie et al. developed an ESV equivalent factor table for China by adapting it to the country’s specific conditions through an expert survey [50]. This work sparked a surge of interest in ESV assessment across China. However, Xie et al. later emphasized that localizing this equivalent factor table is essential for improving the accuracy of regional ESV assessments [48]. Numerous studies have explored the regional competition within PLE spaces and the corresponding impacts on ESV. Human activities influence regional ESV by altering the production, living, and ecological functions of land. The response of ESV to competition within PLE spaces is complex and exhibits significant regional heterogeneity [26,28,29]. However, the impact of competition among UAES on regional ESV in China remains unclear. Particularly, there is a dearth of quantitative research linking the two over extended time periods. Addressing this knowledge gap is particularly important and urgent within the context of China’s new territorial spatial governance system.
As economically underdeveloped parts of China, key agricultural areas are typically defined by flat topography, a population dominated by farmers, and an agriculture-based economy. Consequently, their levels of urbanization and industrialization are relatively low [51]. Key agricultural areas must balance the crucial responsibility of ensuring national food security with the pressures of local economic development and environmental protection [52]. Therefore, their spatial development processes and challenges are representative. The competitive dynamics among UAES in these areas and their impact on ESV remain poorly understood. Therefore, these regions serve as critical case studies for investigating this relationship.
This study aims to evaluate the spatiotemporal dynamics of competition among UAES and its impact on terrestrial ESV in Henan Province from 1980 to 2020. Henan Province was selected as the study area, as it is a representative example of China’s key agricultural regions. The analysis utilizes 30 m resolution land use data for five periods: 1980, 1990, 2000, 2010, and 2020. Methodologically, we employed the Geo-informatic Tupu method, an improved ESV equivalent table, and the ESV Atlas method. This study aims to provide new insights for optimizing regional patterns of territorial development and protection from the perspective of ecosystem services. It also seeks to offer scientific basis for optimizing territorial space management and formulating ecological protection policies in key agricultural areas of China, as represented by Henan Province. Specifically, this study addresses the following objectives for Henan Province between 1980 and 2020: (1) to examine the spatiotemporal evolution of UAES; (2) to analyze the dynamics of competition among these zones; (3) to assess the impact of this spatial competition on terrestrial ESV; (4) to propose policy recommendations for optimizing spatial management and ecological protection based on the findings.

2. Materials and Methods

2.1. Study Area

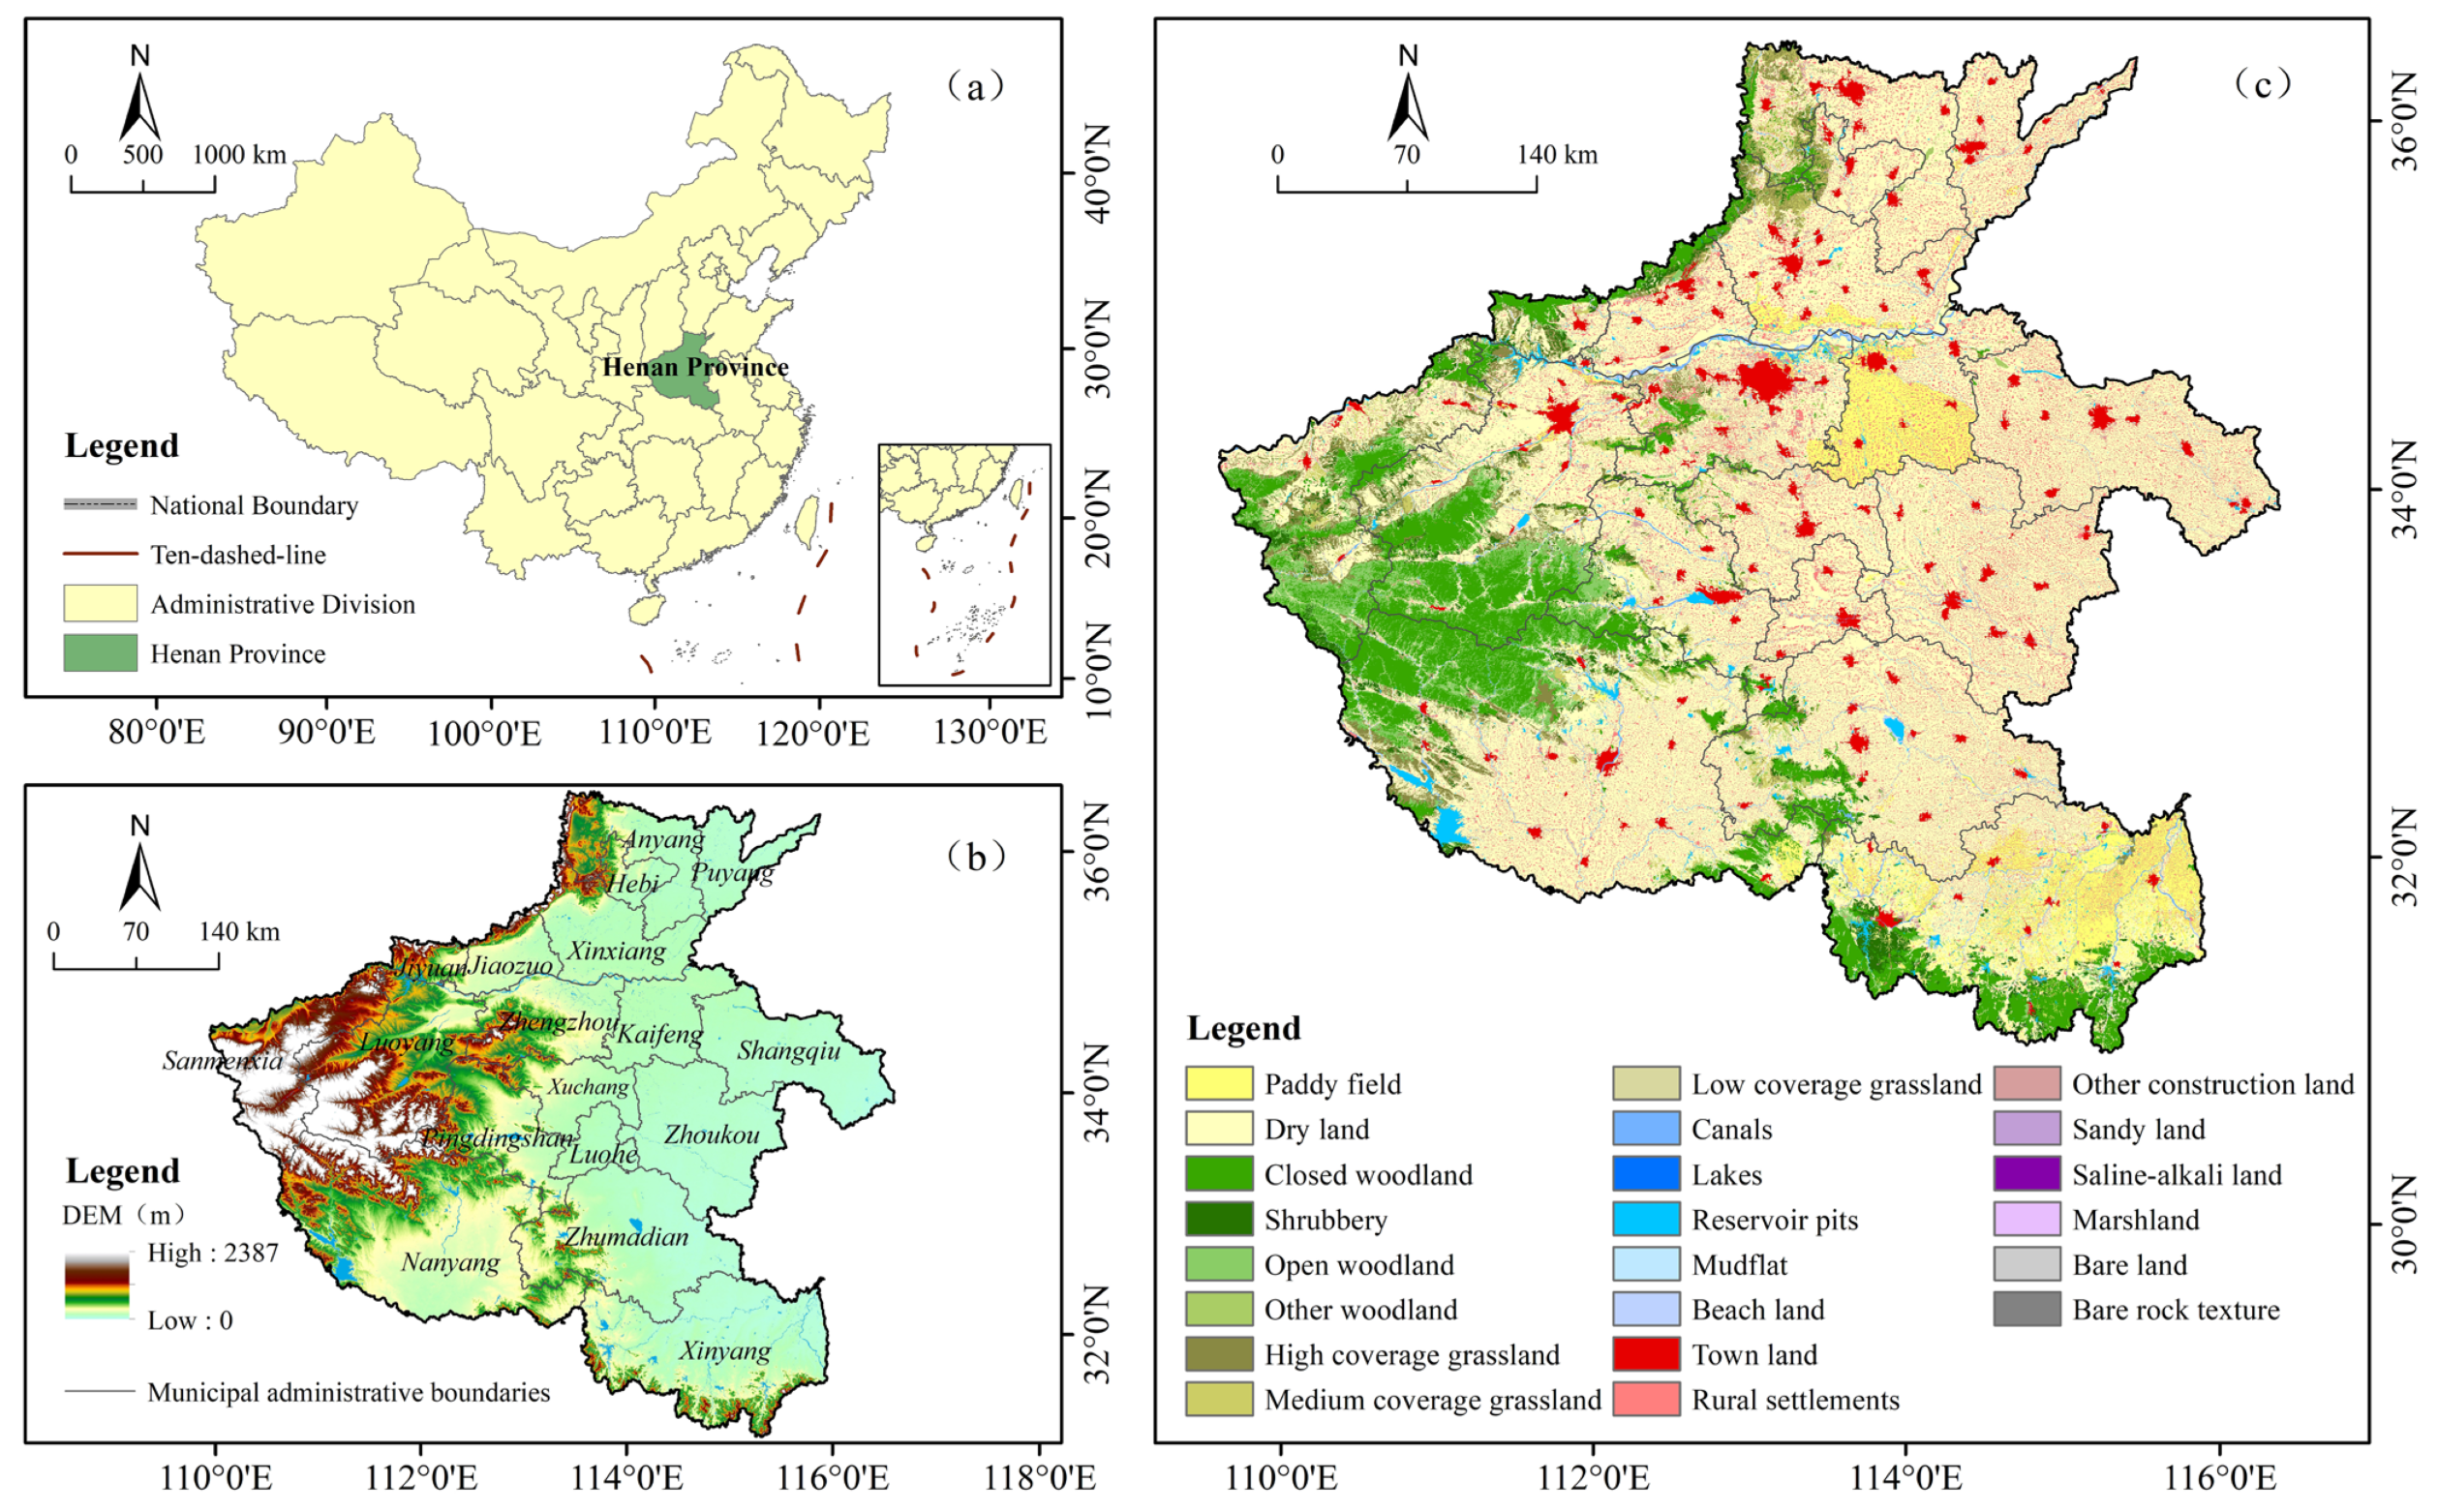
Henan Province is located in central China, along the middle and lower reaches of the Yellow River. The province is bounded by latitudes 31°23′–36°22′ N and longitudes 110°21′–116°39′ E, covering a total area of 167,000 km2. Administratively, it comprises 18 prefecture-level cities. The terrain is higher in the west and lower in the east. The province is surrounded by mountains on its northern, western, and southern sides: the Taihang, Funiu, and Tongbai-Dabie Mountains, respectively. The central and eastern parts are dominated by the Huang-Huai-Hai Alluvial Plain, while the Nanyang Basin lies in the southwest (Figure 1). Henan has a continental monsoon climate. Its climatic, soil, and water conditions are well-suited for crop cultivation.
Henan is a populous province in China and a major national grain producer. The province also plays a key role in China’s national strategy for ecological protection and high-quality development in the Yellow River Basin. As of the end of 2020, Henan’s total population was 115.26 million (ranking third in China), its GDP reached 5.43 trillion yuan (ranking fifth), and its urbanization rate was 55.43% (ranking twenty-sixth). Henan Province contains 6% of China’s total cultivated land and produces 10% of the nation’s grain. Since its reform and opening up, Henan has experienced dramatic growth. Between 1980 and 2020, its urbanization rate rose from 14.01% to 55.43% (a nearly fourfold increase), while its per capita GDP surged from 317 to 54,691 yuan (a 173-fold increase). Rapid urbanization and industrialization have drastically altered the territorial space in Henan Province. Consequently, conflicts among land uses for urban development, food security, and ecological protection have intensified, seriously threatening the region’s sustainable development. Therefore, as a representative case of China’s key agricultural regions, it is particularly relevant and necessary to explore the spatiotemporal dynamics of UAES competition and its impact on terrestrial ESV in Henan Province.

2.2. Data Sources

The land use/land cover (LULC) data was sourced from the Resource and Environmental Science and Data Center, Chinese Academy of Sciences (CAS) (https://www.resdc.cn/). The dataset includes five periods—1980, 1990, 2000, 2010, and 2020—at a spatial resolution of 30 m. Digital Elevation Model (DEM) data was sourced from the Geospatial Data Cloud (https://www.gscloud.cn/). Administrative boundary vector data was sourced from the 1:1,000,000 scale China Basic Geographic Database, provided by the China Geographic Information Resources Catalog Service System (CGIDRSS). Data on population size, urbanization rates, major grain crop production, and sown area were sourced from the Henan Provincial Statistical Yearbook. Market prices for major grain crops were obtained from the China Agricultural Products Price Survey Yearbook.

2.3. Research Methods

2.3.1. Research Framework

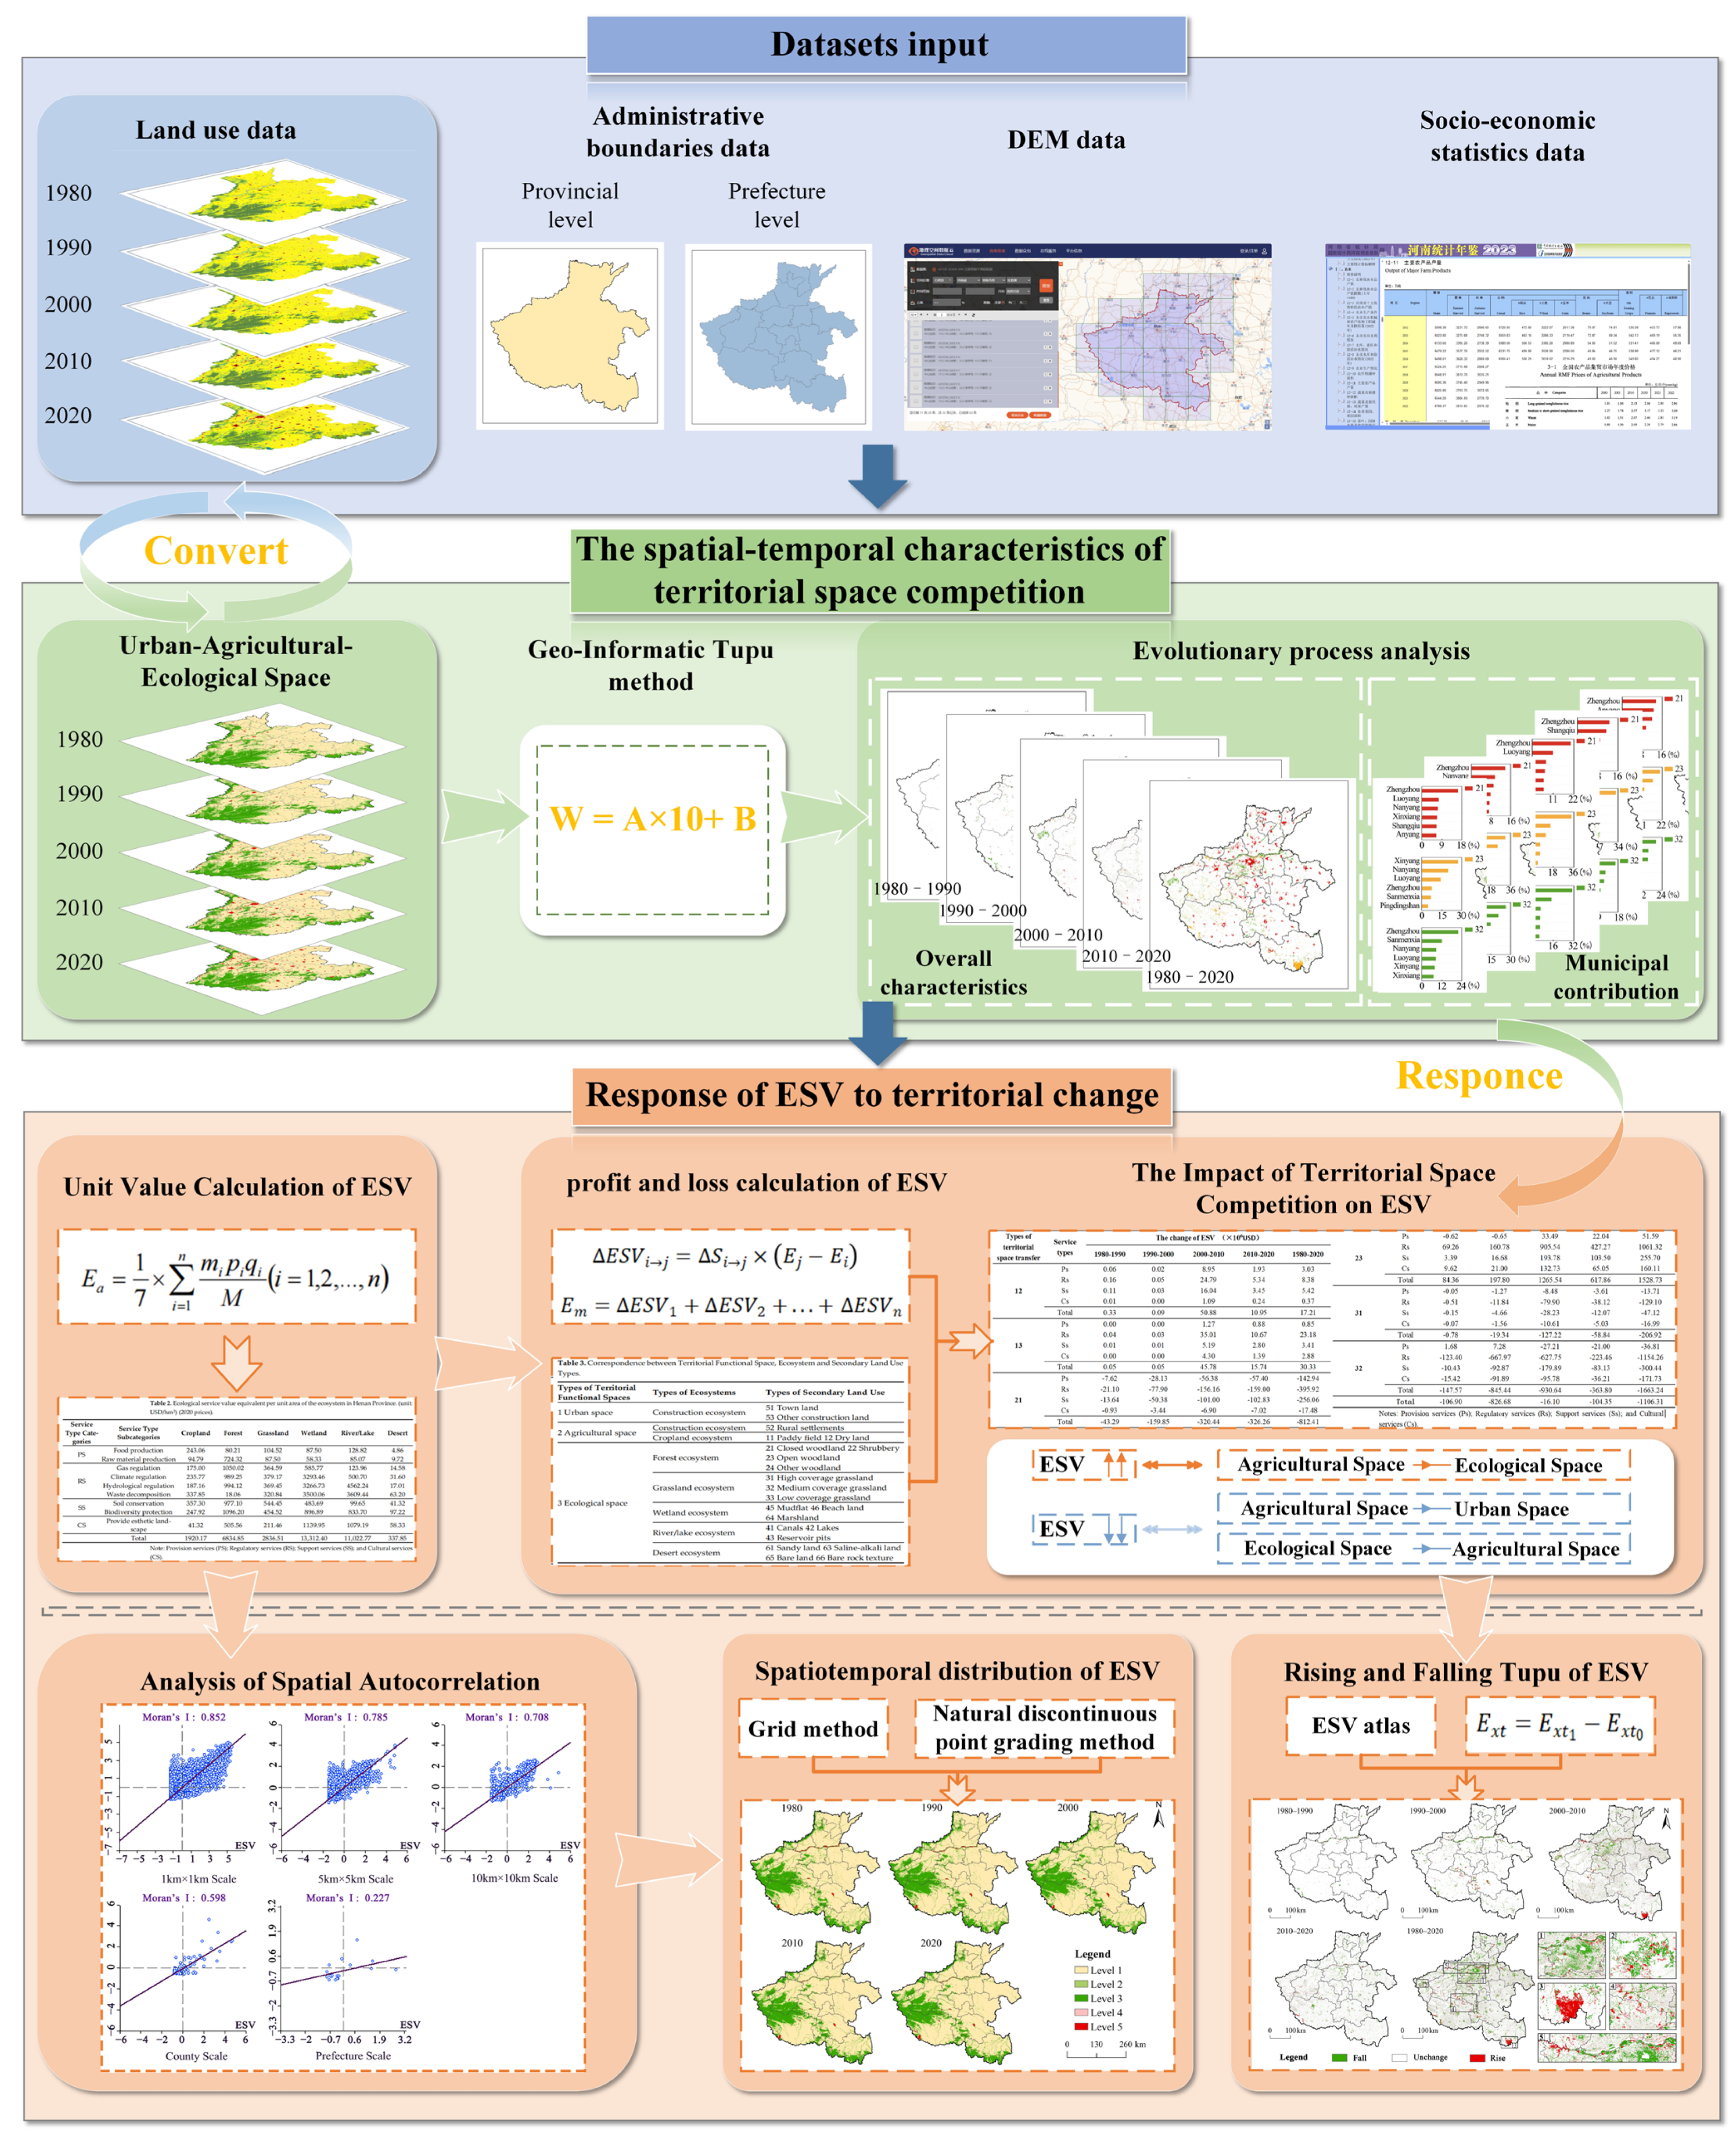
The research framework for this study comprises three main phases (Figure 2): (1) Data Collection and Preprocessing: First, we collected and processed all relevant data for the study area to establish a comprehensive database. (2) Spatial Competition Analysis: Second, we identified the UAES by mapping LUCC data to their corresponding territorial functions, generating distribution maps for each period. We then used the Geo-informatic Tupu method to analyze the spatiotemporal dynamics of competition among these zones and their heterogeneity at the prefecture-level city scale from 1980 to 2020. (3) ESV Impact Assessment: Finally, we developed a revised ESV evaluation model tailored to the study area’s local conditions. This model was used to calculate ESV gains and losses resulting from spatial competition in Henan Province during the study period.

2.3.2. Analysis Methods of Territorial Spatial Competition

  • The connotation and division of UAES
This functional classification is closely related to land use types [34,42]. According to the definitions in the Chinese government’s territorial spatial planning, urban space refers to areas where urban construction and residential life serve as the dominant functions; agricultural space denotes regions primarily dedicated to agricultural production and rural livelihood; and ecological space encompasses natural areas mainly focused on providing ecological products and services [2]. The land use data in this study consists of six primary types (cropland, forestland, grassland, water bodies, built-up land, and unutilized land) and 25 secondary types [13] (Table 1). Following the methodology of previous studies [34,36,41,42], we generated a base map of the UAES by merging these land use types based on their dominant functions, as detailed in Table 1.
  • The Geo-informatic Tupu method
The Geo-informatic Tupu is a spatiotemporal analysis method that employs mapping units to effectively examine the internal structure of geographical elements, as well as to analyze the spatiotemporal evolution and spatial differentiation of geographical phenomena. The process of territorial spatial competition involves dynamic conversions among urban, agricultural, and ecological spaces, including both gains (conversion into) and losses (conversion out) of each spatial type. By fully utilizing Tupu units to record composite spatiotemporal information of different functional spaces, this approach can quantitatively characterize territorial spatial patterns and temporal sequence features under diverse spatiotemporal conditions. As a result, it enhances the authenticity and accuracy of research on changes in the quantity and type of territorial spaces [21,41,53]. Using the Raster Calculator tool in ArcGIS 10.8, we overlaid the territorial space classification maps for several intervals: 1980–1990, 1990–2000, 2000–2010, 2010–2020, and the overall 1980–2020 period (Formula (1)). This process generated maps illustrating the dynamics of spatial competition within the province.
W = A × 10 + B
In this formula, W represents the resulting map code, while A and B represent the territorial space type codes at the start and end of the study period, respectively. For example, if the code for agricultural space is “2” and for urban space is “1”, a change from agricultural to urban space is coded as “21”. Conversely, an area that remained unchanged as urban space would be coded as “11”.

2.3.3. Calculation Methods of ESV

  • Calculation of unit value of ecosystem services
The per-unit-area equivalent coefficient of ESV is fundamental to regional ESV assessment. In 1997, Costanza et al. pioneered this method to assess global ecosystem service value [1]. Building on the work of Costanza et al. [1], Chinese scholar Xie et al. adapted the framework for China’s specific ecological characteristics [50]. They reclassified the nation’s ecosystems into six types (cropland, forest, grassland, wetland, river/lake, and desert) and four service categories (provisioning, regulating, supporting, and cultural services). They developed the Chinese ESV equivalent table based on a survey of ecologists [50]. Xie et al. proposed the following formula to calculate the economic value of natural grain output per unit area of cropland [50]:
E a = 1 7 × i = 1 n m i p i q i M i = 1,2 , . . . , n
In this formula, Ea is the natural economic value of grain production services per unit area of farmland (yuan/hm2); i denotes the crop type; pi is the average price of crop i (yuan/ton); qi is the per-unit-area yield of crop i (t/hm2); mi is the sown area of crop i (hm2); and M is the total sown area of all grain crops (hm2). Additionally, 1/7 represents the ratio of the economic value provided by the natural ecosystem without human input to the economic value of grain production service provided by the per unit cropland area [50].
China’s vast territory leads to significant regional variations in crop types, farmland productivity, and market prices [45]. Therefore, following the method of Xie et al. [50] (Formula (2)), we calculated the economic value of individual farmland ecosystem services in the study area by incorporating local data on grain production and prices from Henan Province. According to the Henan Provincial Statistical Yearbook, the province’s main food crops are wheat and maize. From 2000 to 2020, the average annual sown areas were 4.97 million ha for wheat and 2.55 million ha for maize. During the same period, their respective average annual yields were 4.67 t/ha and 4.64 t/ha. According to the China Agricultural Price Survey Yearbook, the 2020 market prices in Henan for wheat and maize were 2.66 and 2.24 yuan/kg, respectively. In 2020, the average exchange rate was 6.8974 Chinese yuan (RMB) to the US dollar. Using the aforementioned data and Equation (2), we calculated the benchmark ESV for Henan Province to be 243.06 USD ha−1 yr−1. We then multiplied this benchmark value by the coefficients in the ESV equivalent table [50] to determine the corrected, per-unit ESV for each ecosystem type in Henan Province (Table 2).
  • Calculation of the gains and losses of ESV caused by territorial spatial competition
Because natural ecosystems are land-based, changes in land use alter vegetation and landscape patterns, which in turn causes changes in ESV. Therefore, a widely used proxy method for evaluating ESV changes involves matching land use types with equivalent biological communities. Thus, land use types are often used as proxies for ecosystem services [49,54]. To analyze the impact of territorial spatial competition on ESV, this study adopted a proxy-based approach. We first matched secondary land use types with corresponding ecosystem types and then linked these to the broader territorial spatial classifications. Subsequently, we established a corresponding relationship among three territorial functional spaces, eight ecosystem types, and 22 secondary land use types (Table 3). Additionally, following the findings of Costanza et al., the ESV coefficient for construction ecosystem is set to zero [1].
The ESV gains and losses resulting from territorial spatial competition are calculated using the following formula:
E S V i j = S i j × E j E i
E m = E S V 1 + E S V 2 + . . . + E S V n
In Formula (3), ∆ESVi→j is the change in ESV when ecosystem type i transforms into type j; ∆Si→j is the area transformed from ecosystem type i to type j; and Ei and Ej are the per-unit ESV of ecosystem types i and j. In Formula (4), Em represents the change in ESV caused by the conversion of territorial spatial types; for example, the change in ESV caused by the conversion of agricultural space to urban space is equal to the sum of the changes in ESV caused by the conversion of cropland ecosystem to construction ecosystem (1) and the conversion of construction ecosystem (2) to construction ecosystem (1).
  • The spatial manifestation and rise and fall map of ESV
Selecting an appropriate spatial scale is critical when studying the spatial patterns of ESV, as it significantly influences the research outcomes [55]. To better characterize the spatial distribution and variation in ESV, this study analyzed five spatial scales: 1 km × 1 km, 5 km × 5 km, and 10 km × 10 km grids, as well as the county and city levels. Following previous studies [22,49,56], we then used the global Moran’s I to test the spatial autocorrelation of ESV at each scale. This analysis allowed us to determine the most appropriate scale for examining the spatial patterns of ESV in the study area. The Global Moran’s I is calculated using the following formula [22]:
I = i = 1 , j = 1 n W i j x i x x j x / T 2 i = 1 , j = 1 n W i j
T 2 = 1 n i = 1 n x i x ¯ 2
In this formula, n is the number of spatial units; xi and xj are the ESV of spatial units i and j, respectively; x ¯ is the average ESV across all units; and Wij is the spatial weight matrix. The value of Moran’s I indicates the nature of the spatial correlation: A value greater than 0 (I > 0) indicates a positive spatial correlation, with larger values signifying a more pronounced clustering of ESV. A value less than 0 (I < 0) indicates a negative spatial correlation, with smaller values signifying greater spatial dispersion. A value of 0 (I = 0) indicates a random spatial distribution.
A map illustrating ESV gains and losses was generated using the Raster Calculator tool in ArcGIS 10.8. The calculation was performed using the following formula:
E x t = E x t 1 E x t 0
In the formula, Ext is the change in ESV for grid cell x during period t; Ext1 and Ext0 are the ESV of grid cell x at the end and beginning of period t, respectively. Based on the value of Ext, each grid cell is classified as follows: If Ext < 0, it is an ESV decreasing area. If Ext = 0, it is an ESV constant area. If Ext > 0, it is an ESV increasing area.

3. Results and Analysis

3.1. The Evolution Characteristics of the Territorial Spatial Structure in Henan Province

3.1.1. Overall Characteristics

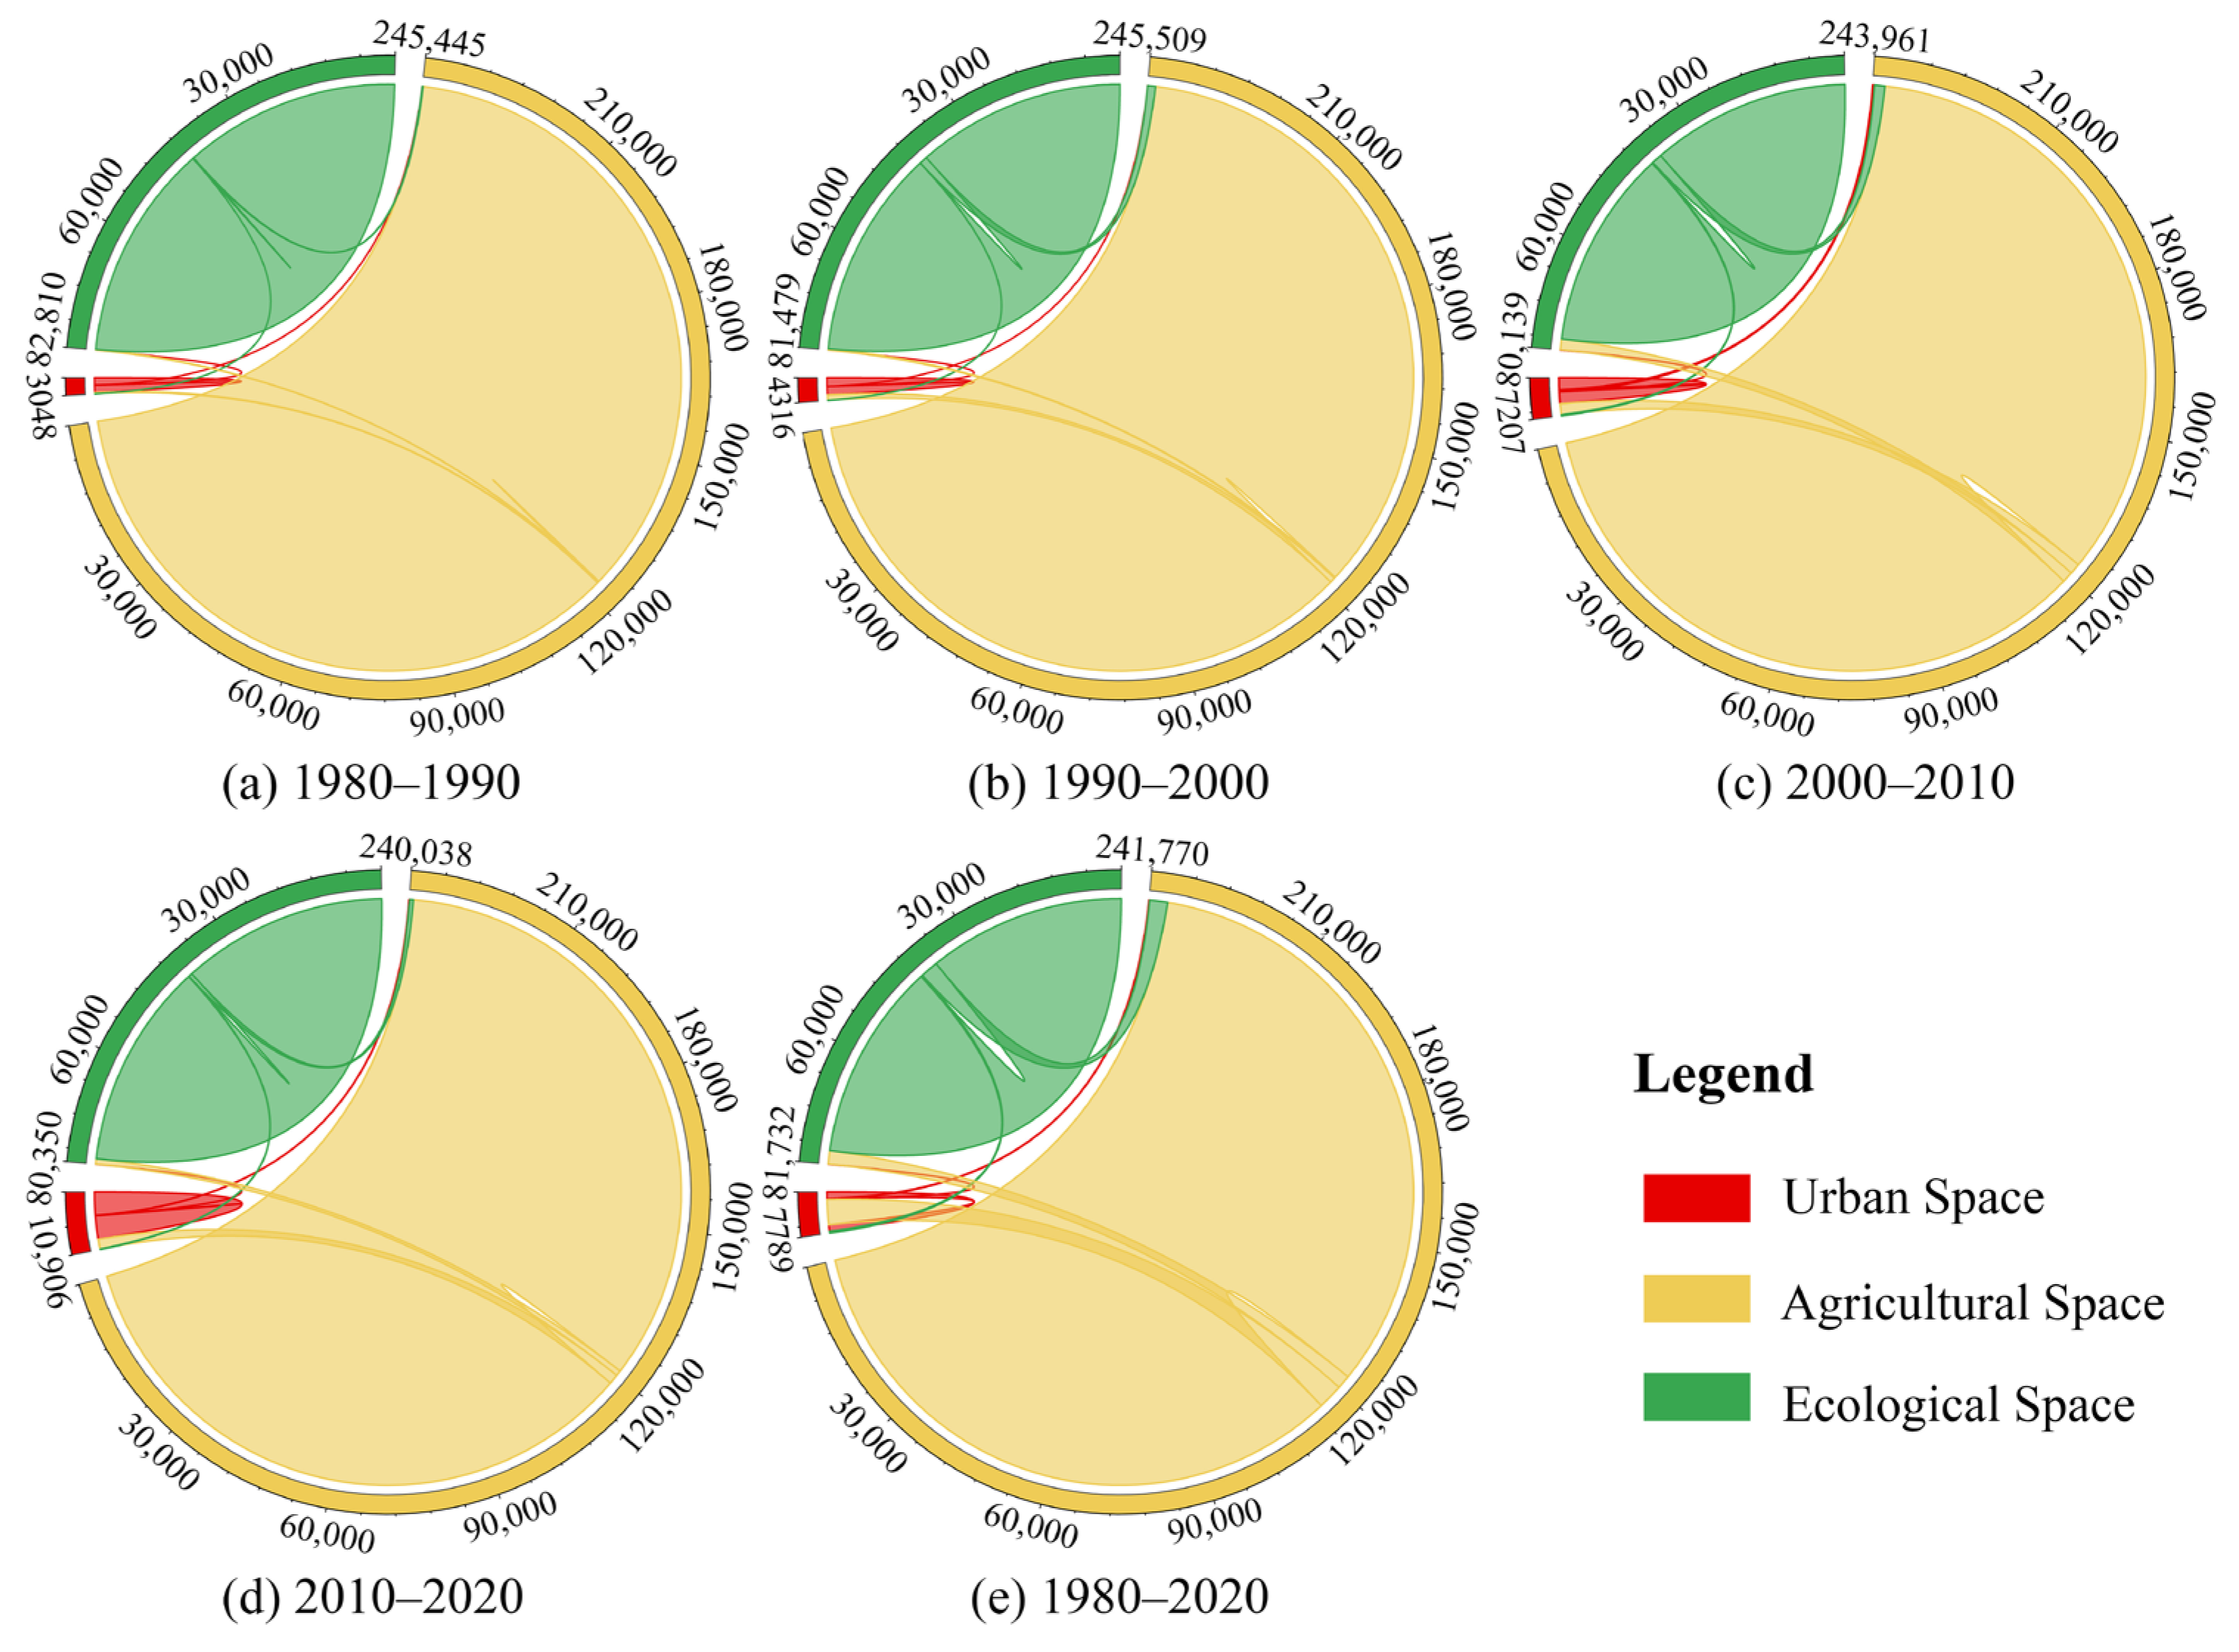
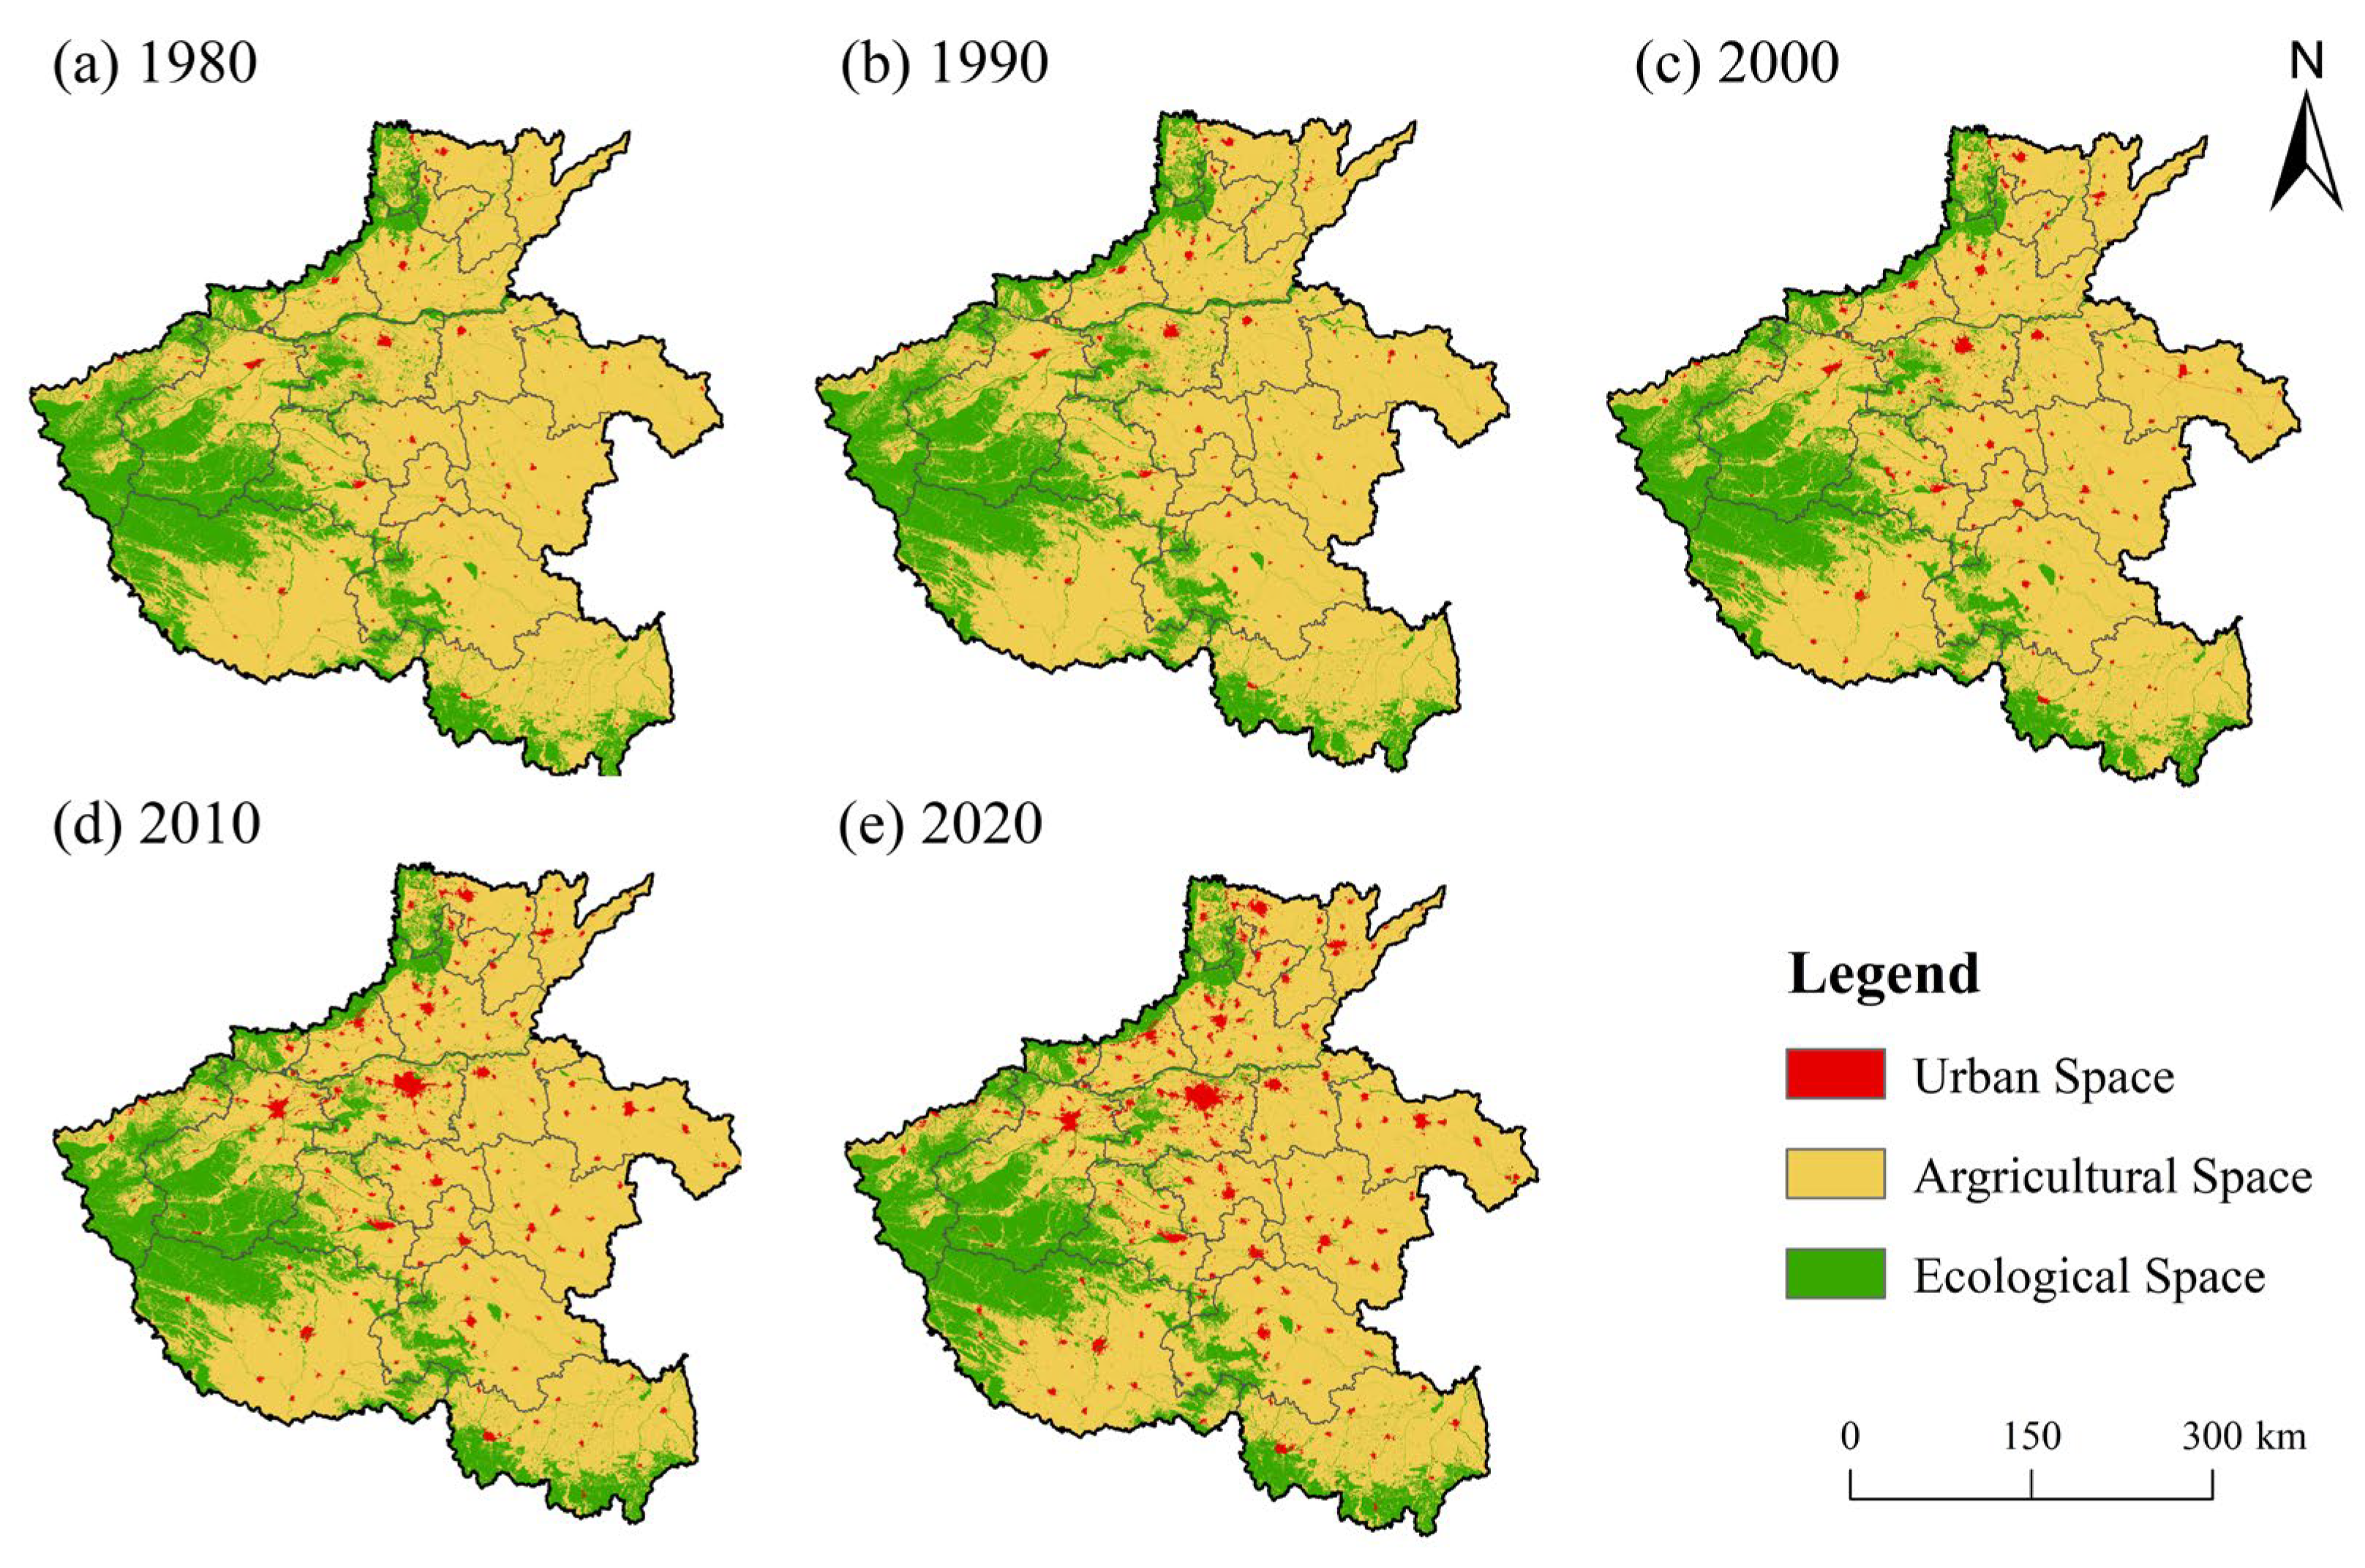
Table 4 and Figure 3 show the structural evolution of the UAES in Henan Province. From 1980 to 2020, Henan’s territorial space was dominated by agricultural space. However, this period was characterized by a gradual shrinkage of agricultural areas, a rapid expansion of urban space, and a slight decline in ecological space. Specifically, over these 40 years, the agricultural space decreased by a net 3849.75 km2, with its share of the total provincial area falling from 74.14% to 71.82%. Spatially, agricultural land was concentrated in the plains and basins across the northern, central, and southern parts of the province. Urban space increased by a net 4965.88 km2, a relative expansion of approximately 4.5 times. Its share of the total provincial area grew from 0.85% to 3.85%. Spatially, urban areas were concentrated around central cities and established towns, appearing as scattered clusters within the vast agricultural landscape. Ecological space decreased by a net 1116.13 km2, and its share of the total provincial area declined from 25.01% to 24.33%. Spatially, the ecological space was mainly distributed in the southern foothills of the Taihang Mountains in the north, the Funiu Mountains in the west, and the Tongbai-Dabie Mountains in the south of Henan Province.

3.1.2. The Differences Among Various Prefecture-Level Cities

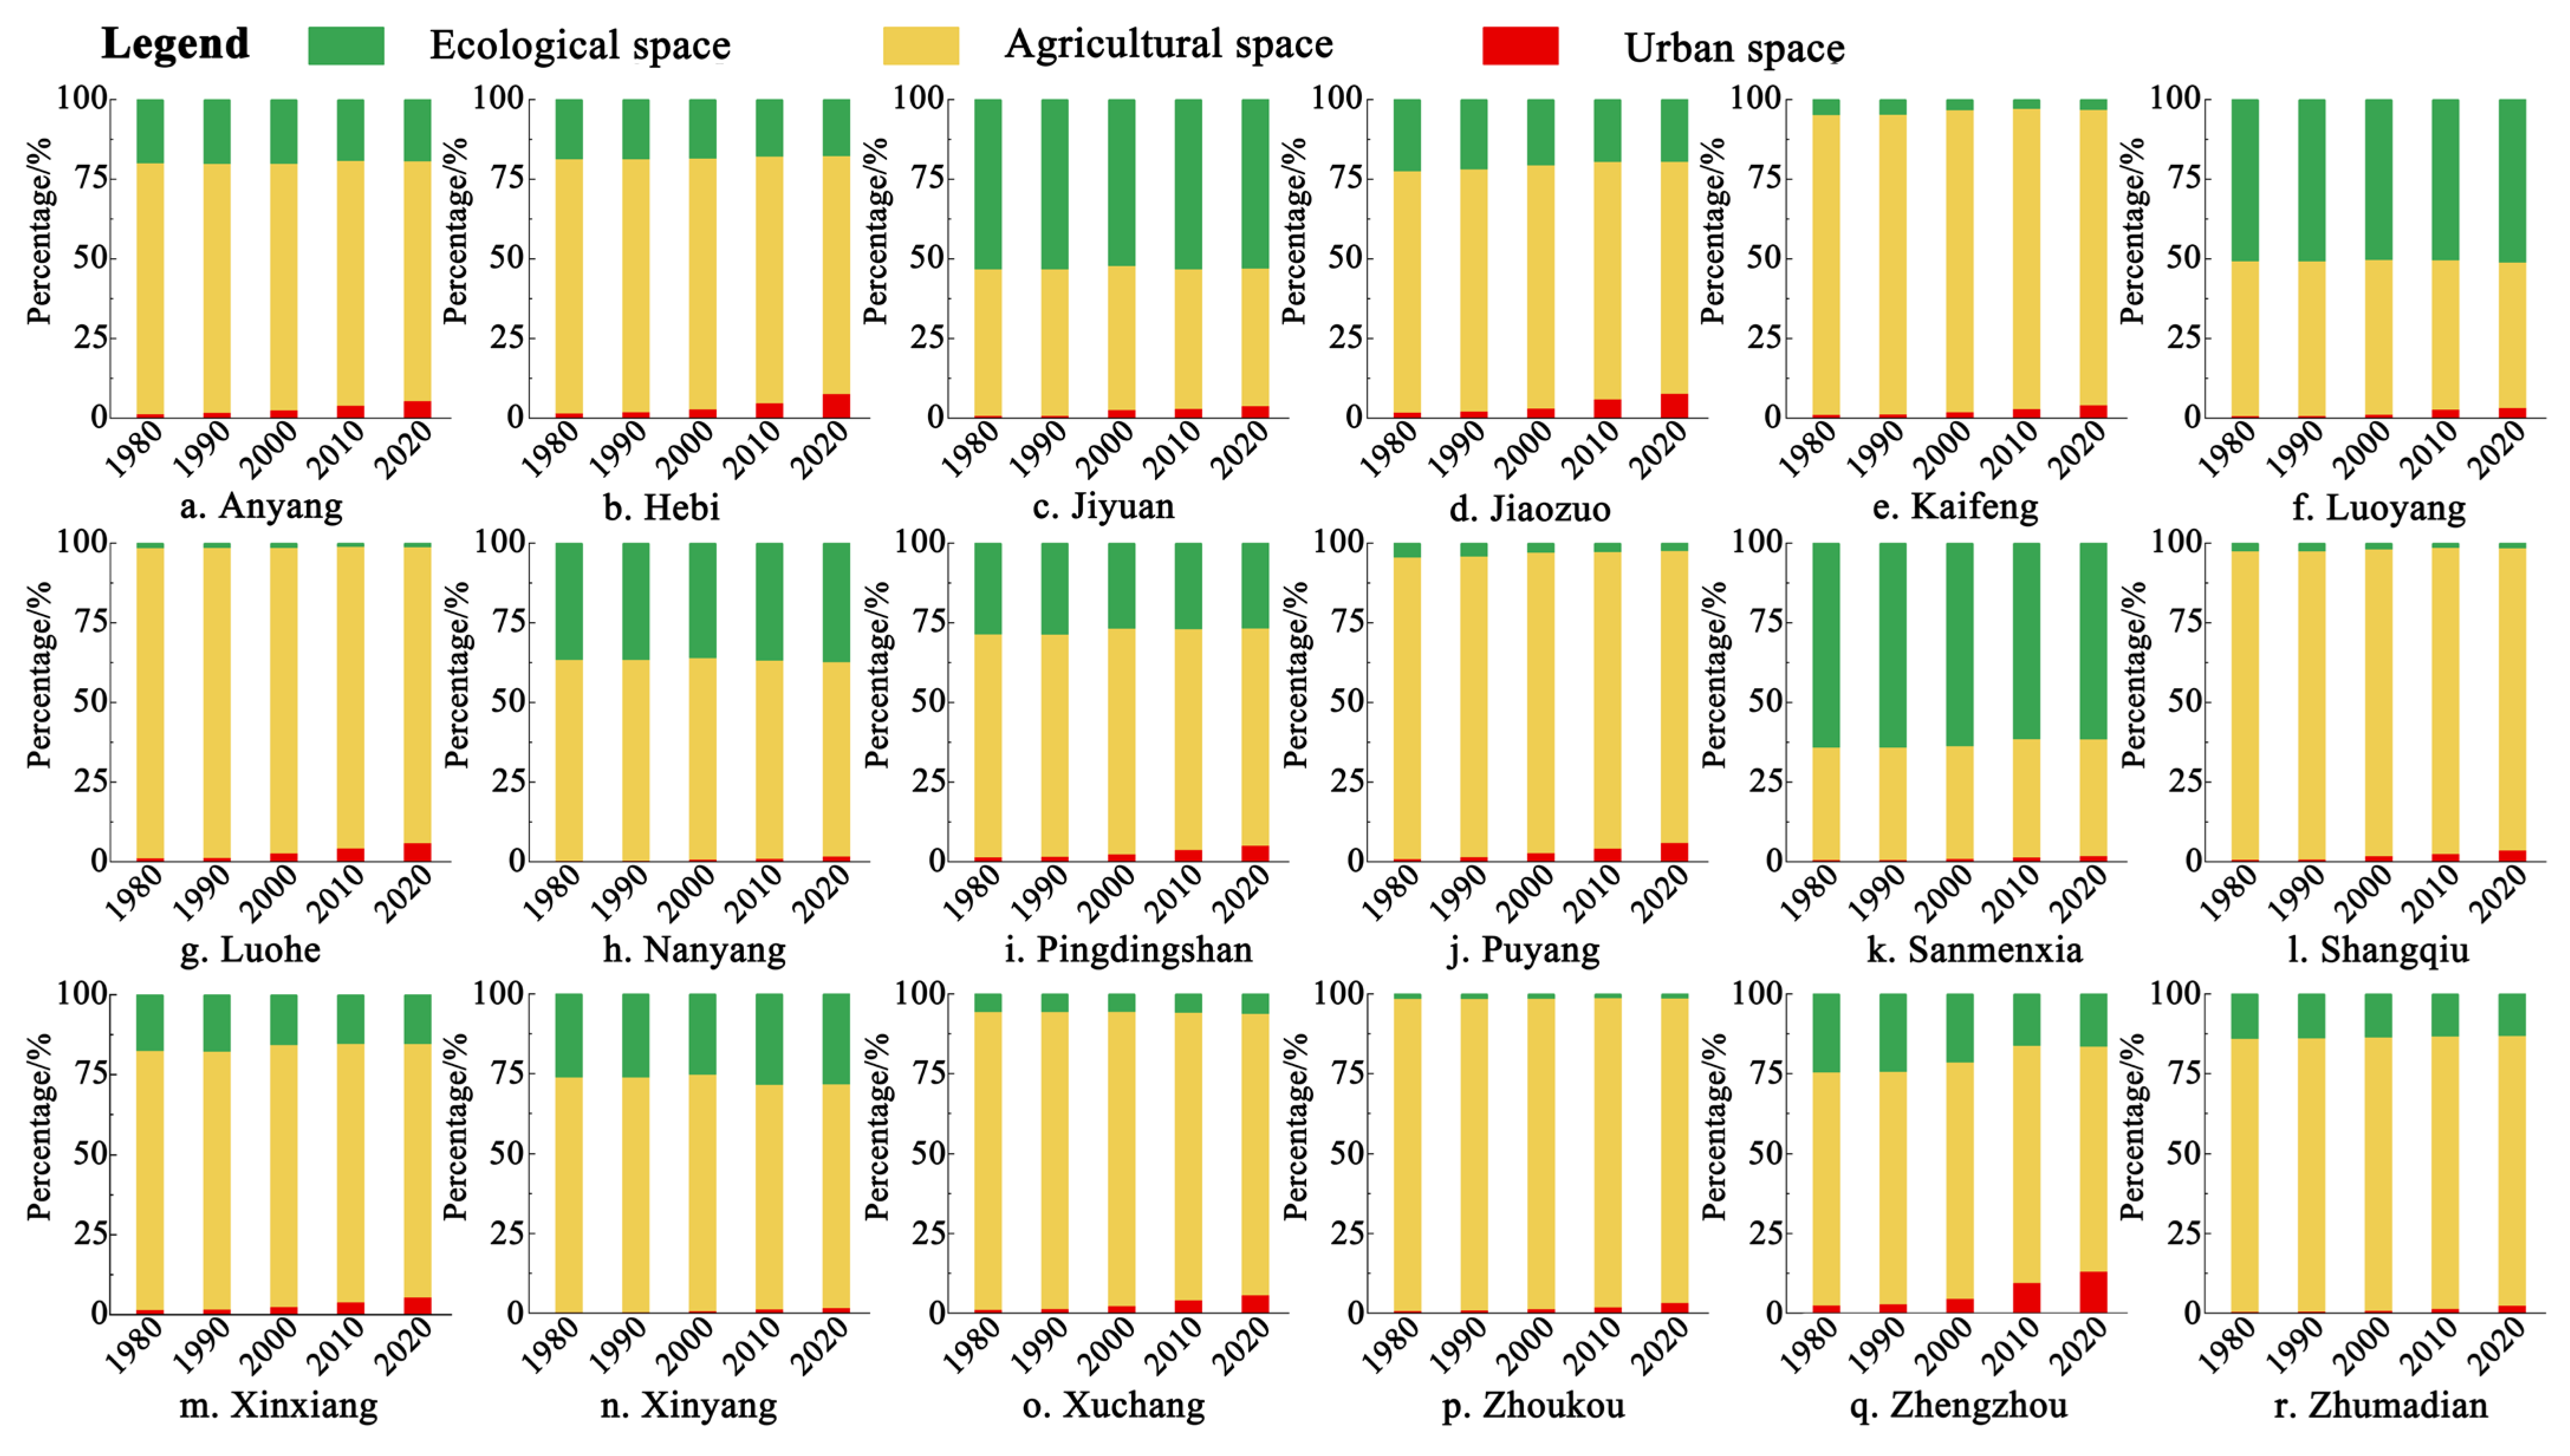
Between 1990 and 2020, the structural changes of UAES exhibited significant heterogeneity among prefecture-level cities in Henan Province (Figure 4). Urban space expanded across all prefecture-level cities, with the most prominent growth occurring in Zhengzhou. Changes in ecological space, however, varied regionally: only four cities (Xinyang, Nanyang, Luoyang, and Xuchang) saw an increase, while the remaining 14 experienced declines of varying degrees. Although the proportion of urban space has increased significant, agricultural space remains the dominant territorial space type in Henan Province. During the study period, agricultural space accounted for over 60% of the area in 15 prefecture-level cities. Notably, it exceeded 80% in seven of these: Zhoukou, Shangqiu, Luohe, Kaifeng, Puyang, Xuchang, and Zhumadian. These cities are primarily concentrated in the plain regions of eastern, northern, and central Henan. In sharp contrast, the territorial patterns of three cities in the western mountainous regions—Sanmenxia, Jiyuan, and Luoyang—are dominated by ecological space, which accounts for 61.49%, 52.93%, and 51.06% of their respective areas.

3.2. The Spatio-Temporal Competition Process of Territorial Space in Henan Province

3.2.1. Quantitative Analysis

According to the results derived from the Geo-informatic Tupu method (Figure 5), the competition and conversion among UAES in Henan Province from 1980 to 2020 were characterized by urban expansion as the dominant process, accompanied by continuous encroachment on agricultural space. The most significant form of this dynamic was the conversion of agricultural land to urban use, which accounted for 4806.04 km2, representing 42.40% of the total converted area. This process served as the core driver reshaping the spatial pattern of the region. Temporally, the encroachment of urban space on agricultural space initially accelerated and then slowed, with the converted area measuring 225.48 km2, 1007.88 km2, 2067.64 km2, and 1873.07 km2 in the four respective time periods.
Another significant form of competition was the mutual conversion between agricultural and ecological spaces. Agricultural space encroached on 3401.38 km2 of ecological space, while ecological space reclaimed 2602.17 km2 from agricultural land. In contrast, conversions among other functional space types were relatively limited.

3.2.2. Spatial Tupu Analysis

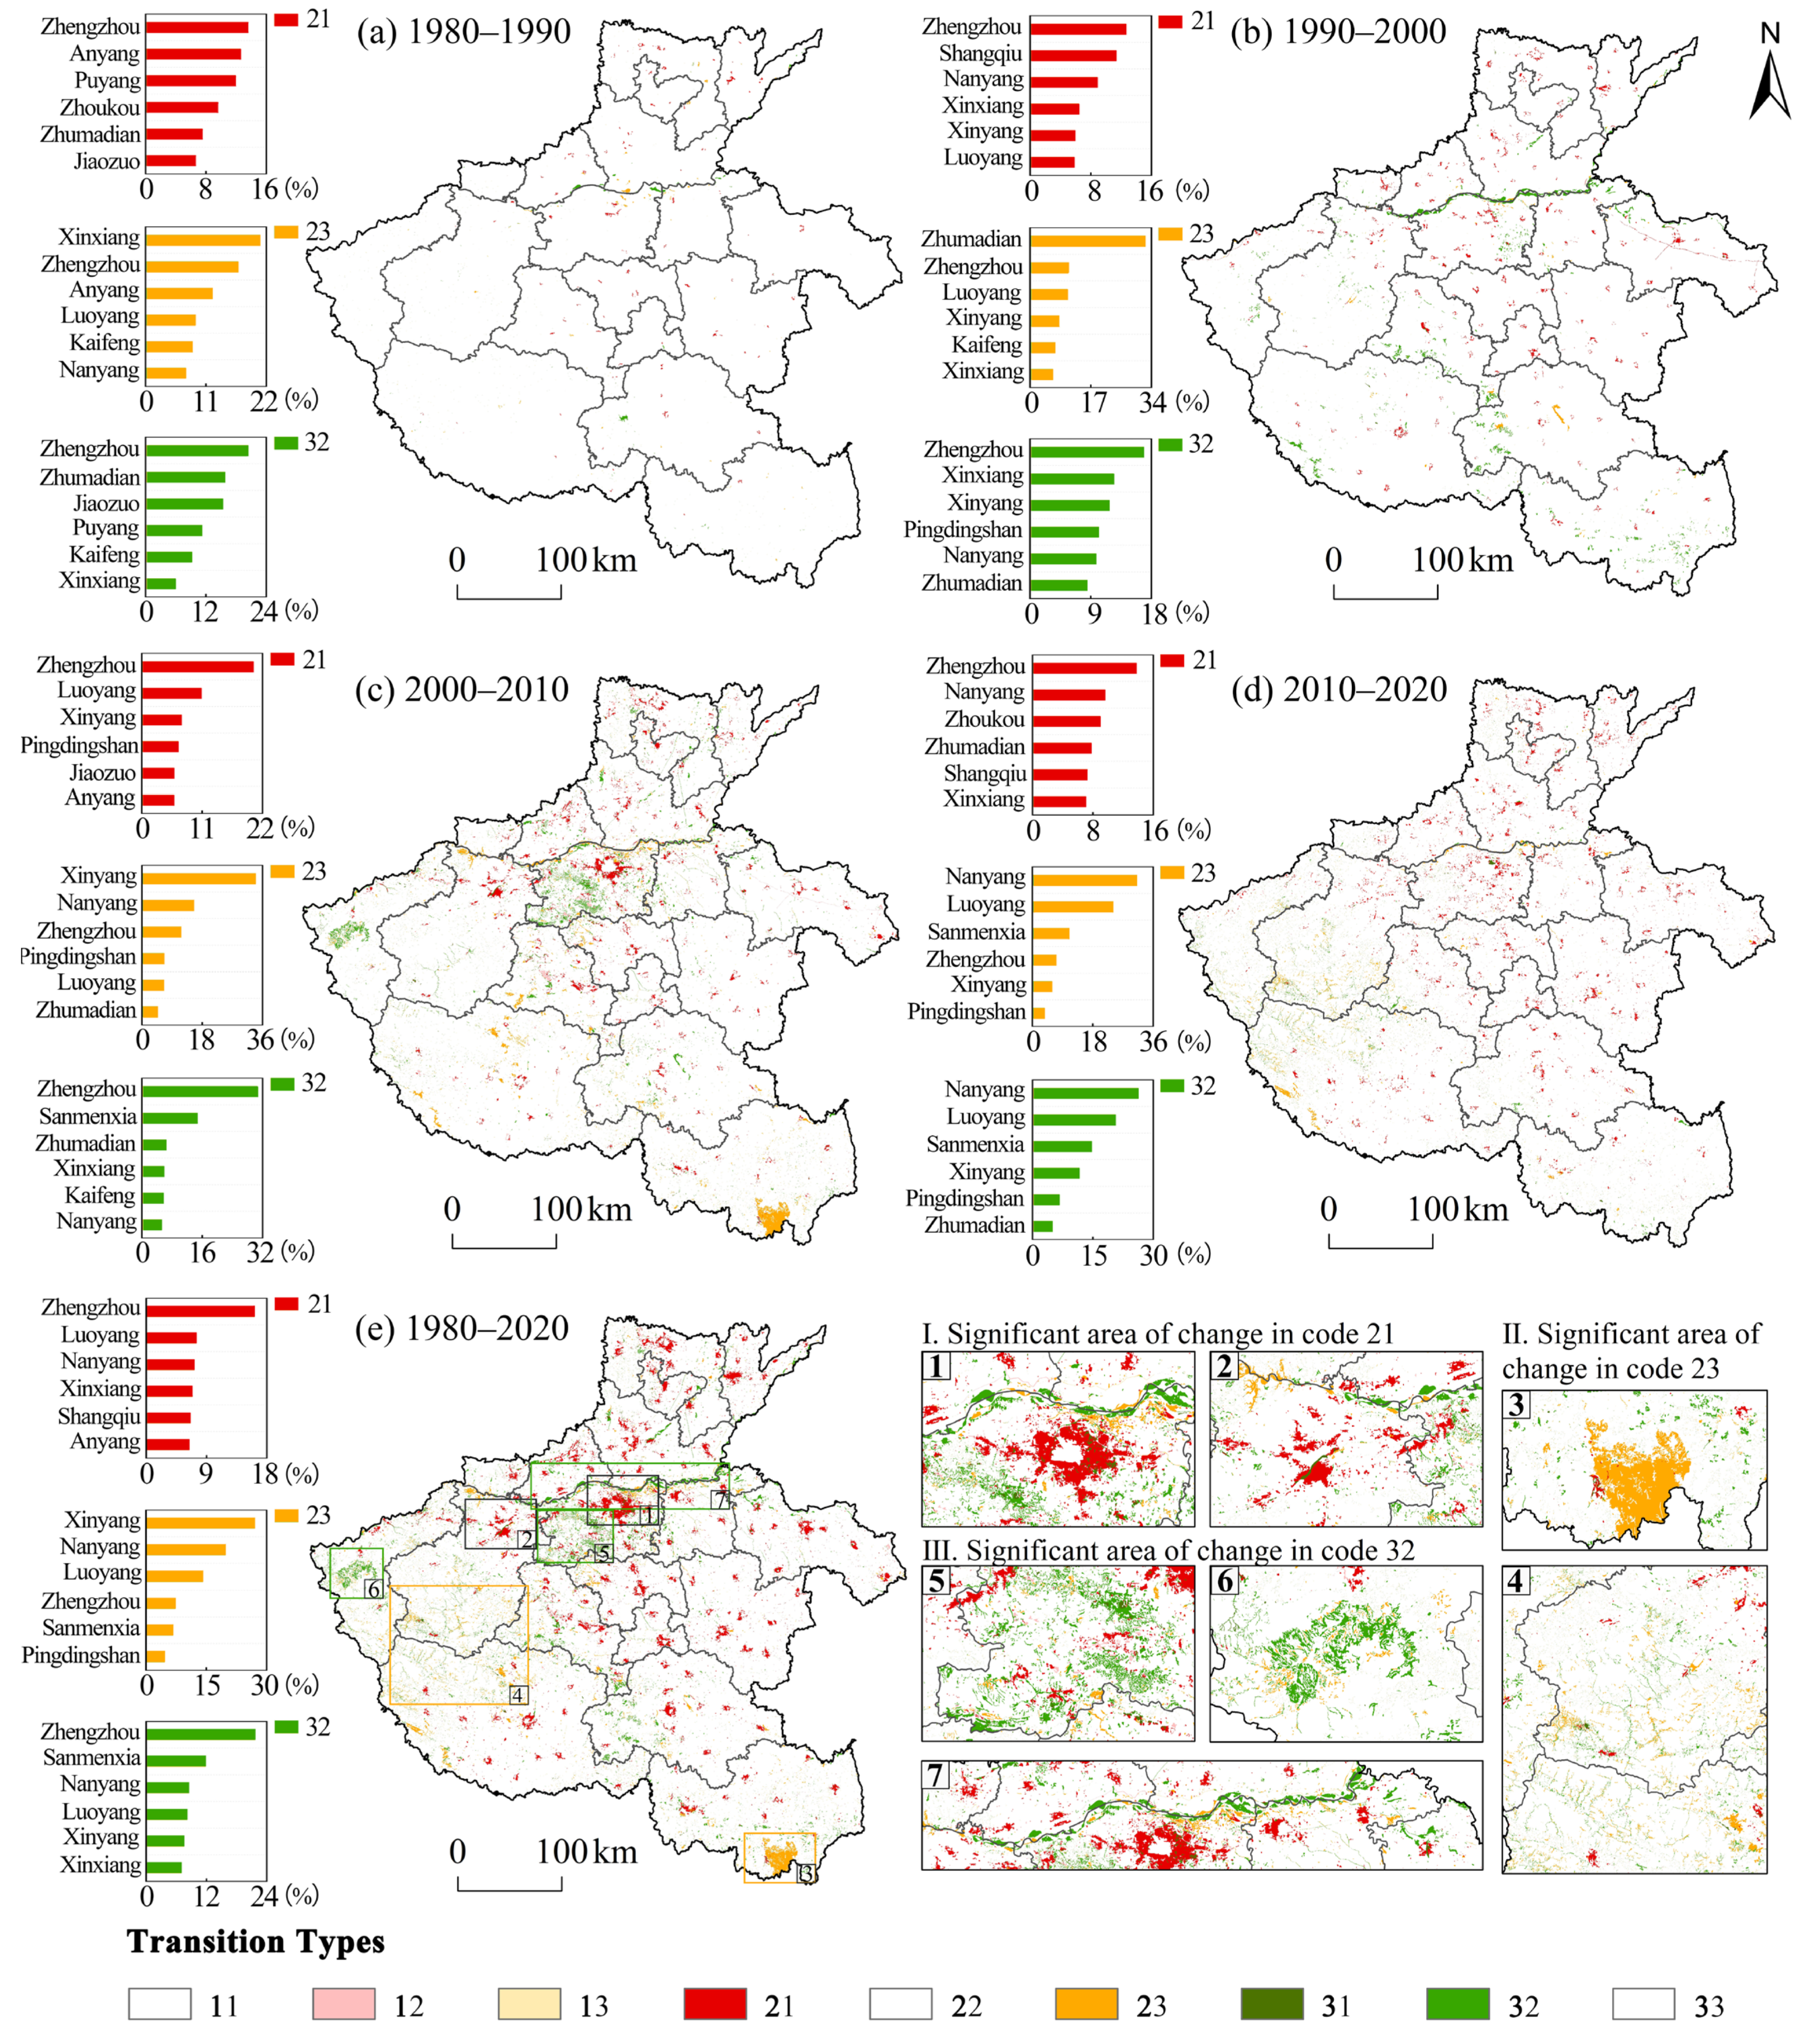
The spatial transfer mapping further reveals the geographical differentiation of UAES competition patterns, particularly highlighting the significant spatial agglomeration and sprawl characteristics of urban encroachment into agricultural areas (Figure 6).
The conversion from agricultural to urban space (Code 21) was predominantly concentrated around the peripheries of prefectural and county-level built-up areas, often exhibiting ring-shaped or clustered spatial forms. From the perspective of prefectural contributions, urban expansion hotspots were highly concentrated in the core area of the Central Plains urban agglomeration. Six cities—Zhengzhou (16.15%), Luoyang (7.48%), Nanyang (7.19%), Xinxiang (6.88%), Shangqiu (6.61%), and Anyang (6.41%)—collectively accounted for 50.71% of this conversion, clearly reflecting the intensity of urbanization and its pressure on agricultural production within the core zone of the Central Plains urban agglomeration.
The conversion from agricultural to ecological space (Code 23) was mainly distributed in the southern Tongbai-Dabie Mountain region and the western Funiu Mountain area. Three cities—Xinyang (27.01%), Nanyang (19.73%), and Luoyang (14.08%)—collectively contributed 60.82%, indicating that the outcomes of farmland-to-forest/grassland projects were more pronounced in the mountainous regions of southern and western Henan.
Conversely, the conversion from ecological to agricultural space (Code 32) was notably clustered in the Songshan hilly belt west of Zhengzhou, the low mountainous and hilly areas of the Funiu Mountains, and the floodplains along the Yellow River corridor in the north. Five cities—Zhengzhou (21.68%), Sanmenxia (11.82%), Nanyang (8.47%), Luoyang (8.16%), and Xinyang (7.56%)—together contributed 57.70%, revealing the complex interplay between agricultural land balance and ecological conservation in the hilly and mountainous areas of Henan under ongoing urbanization pressures.

3.3. The Impact of Territorial Space Competition in Henan Province on ESV

3.3.1. The Impact of Territorial Space Competition on the Changes in ESV Quantity

The competitive pattern of territorial space in Henan Province significantly impacted the ESV (Table 5). From 1980 to 2020, spatial competition led to a cumulative decline of USD 1106.31 million in the total terrestrial ESV of Henan Province. The most significant loss occurred between 1990 and 2000 (a decline of USD 826.68 million).
Analyzing the impacts of specific competition types reveals the following (Table 5): the conversion of ecological space to agricultural land (Code 32) constitutes the primary source of ESV loss, resulting in a cumulative reduction of USD 1663.24 million in Ecosystem Service Value. Urban encroachment into agricultural areas (Code 21) follows as the secondary contributor, leading to an ESV loss of USD 812.41 million. In contrast, the conversion from agricultural to ecological space (Code 23) contributes most significantly to ESV enhancement, generating a cumulative gain of USD 1528.74 million. Other types of spatial competition exhibit relatively minor impacts on ESV changes.
Analyzing the impact on each ecosystem service category (Table 5) shows that the encroachment of urban space on agricultural space (Code 21) reduced the value of all four types: provisioning, regulating, supporting, and cultural services. The most significant losses were observed in regulating services (a decline of USD 395.92 million) and supporting services (a decline of USD 256.06 million). The conversion of agricultural space to ecological space (Code 23) generally led to a significant increase in ESV. The only exception was a brief decline in provisioning services from 1980 to 2000. The most notable increase was in regulating services, which gained USD 1061.32 million in value. Conversely, the conversion from ecological to agricultural space (Code 32) resulted in a general decline in the value of all four service types, with the exception of a slight increase in provisioning services between 1980 and 2000. Regulating services were the most affected, experiencing a loss of USD 1154.26 million.

3.3.2. The Impact of Territorial Space Competition on the Changes in ESV Spatial Pattern

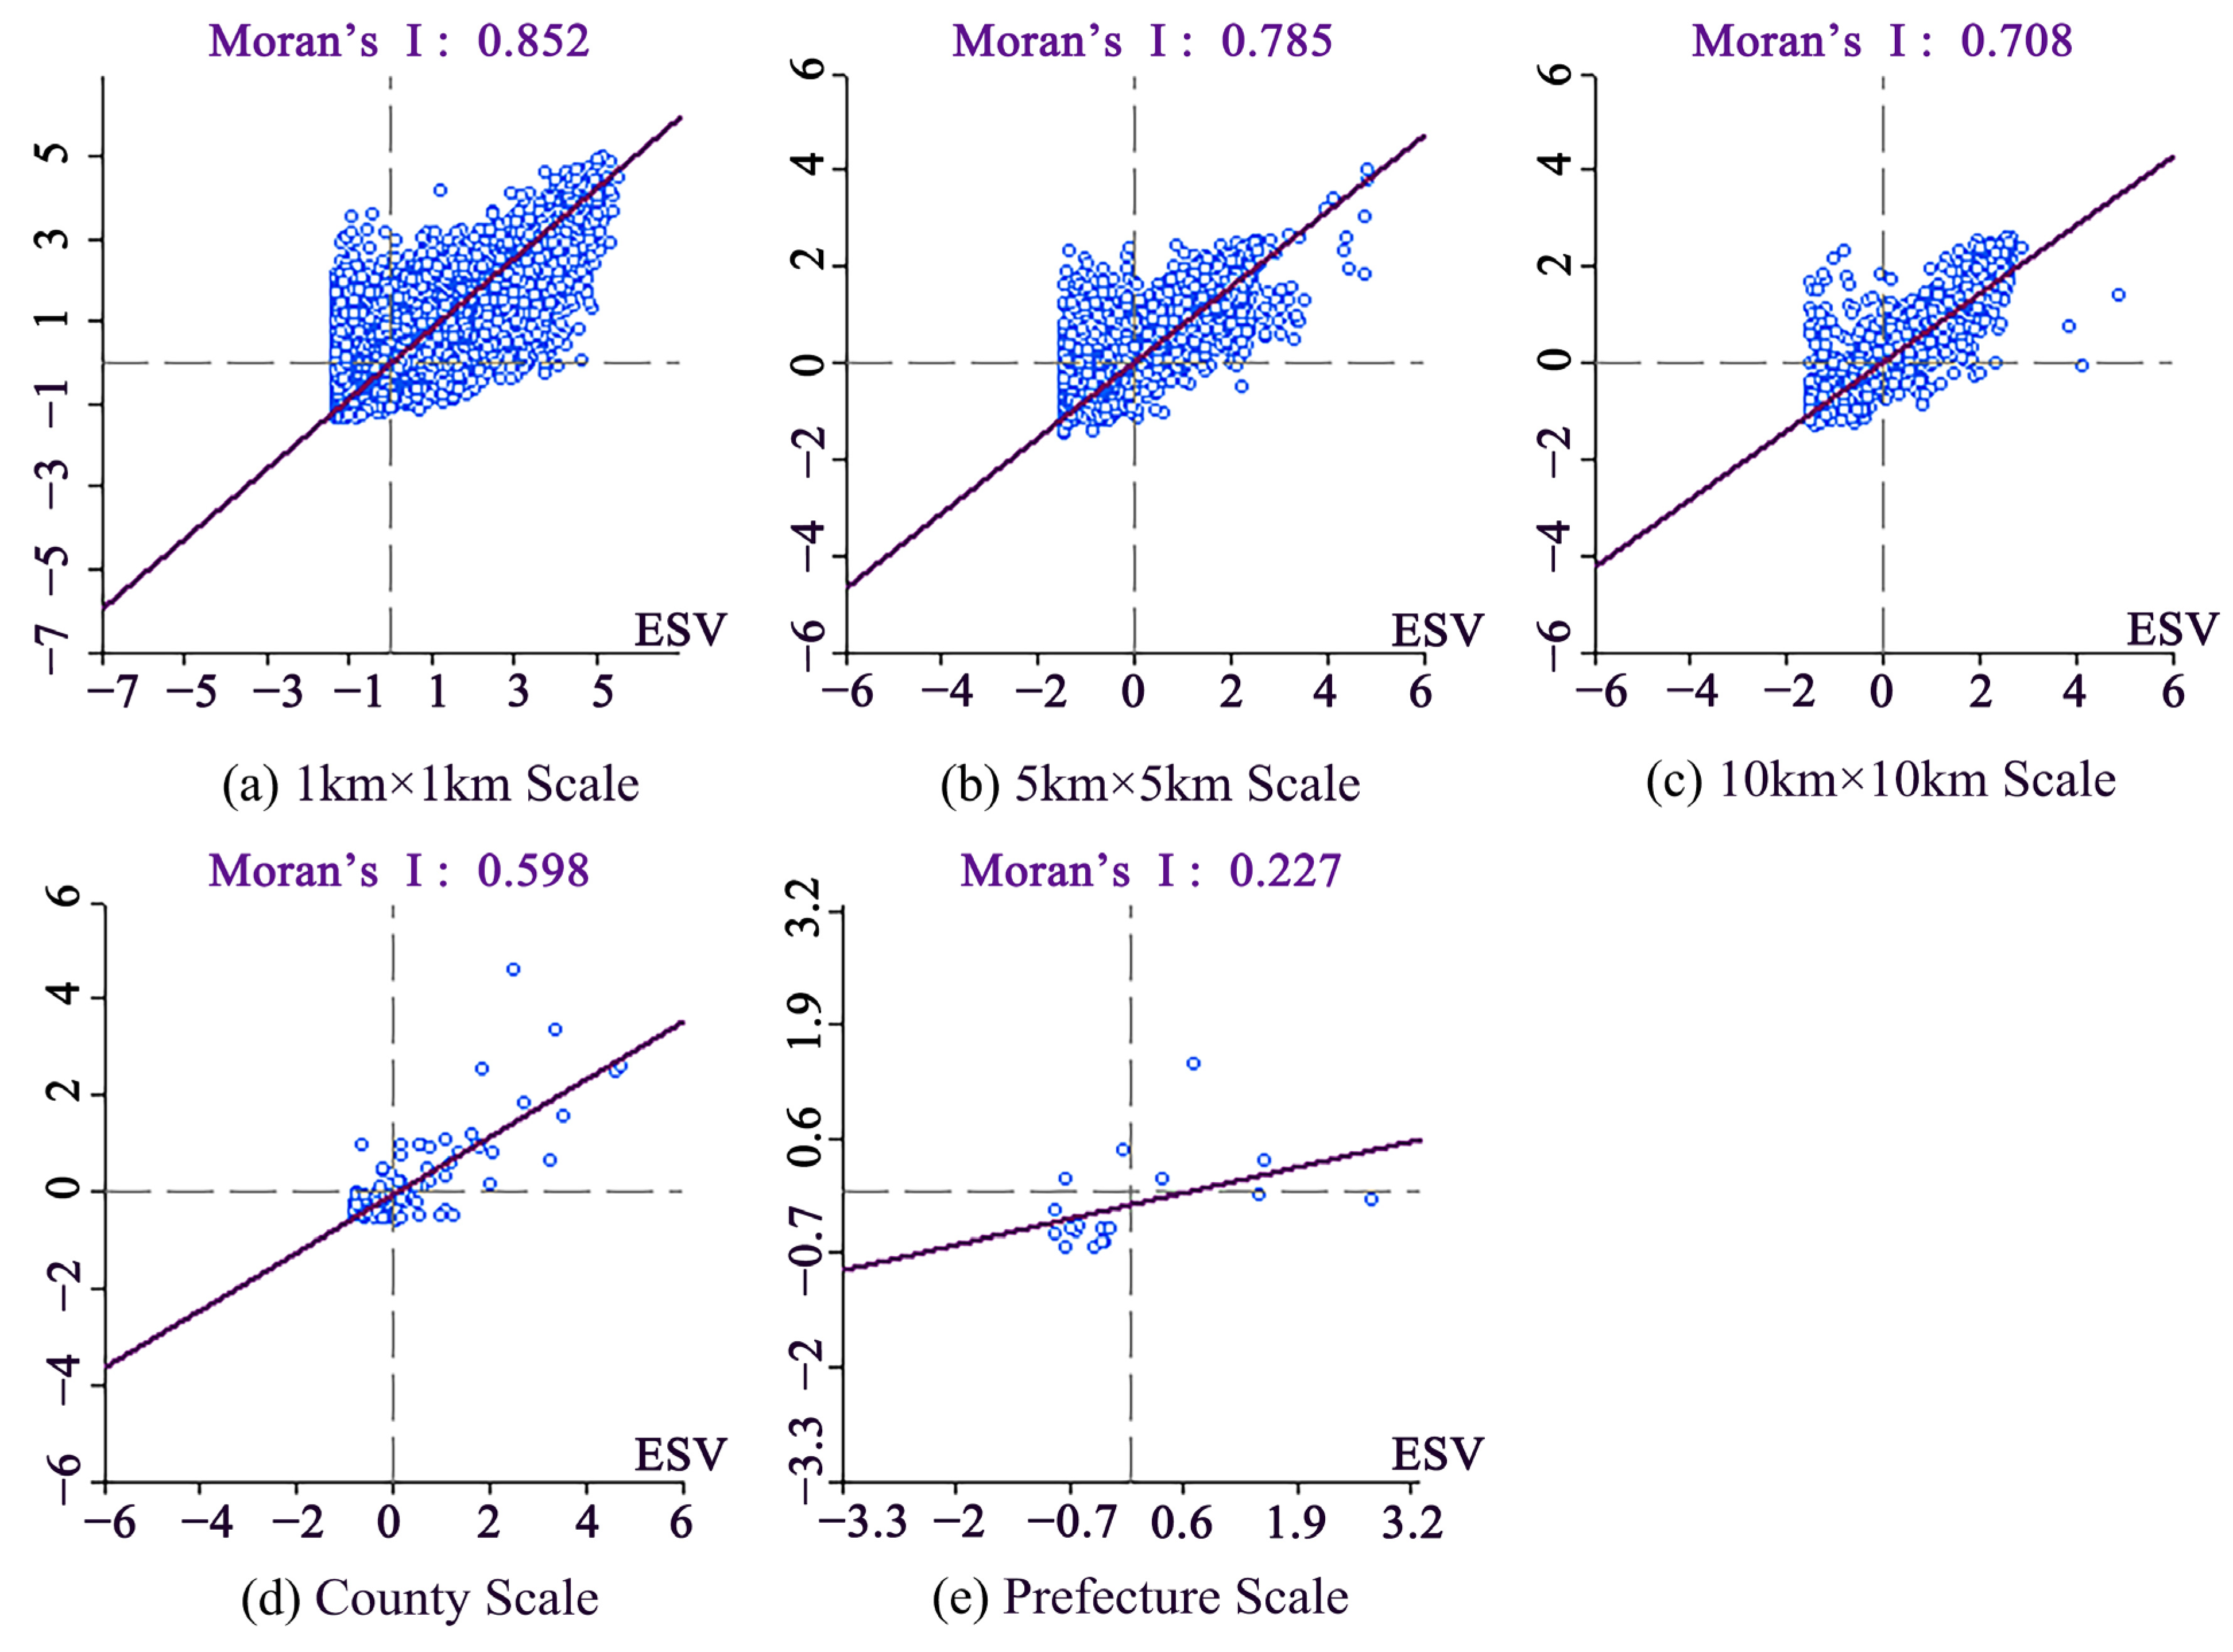
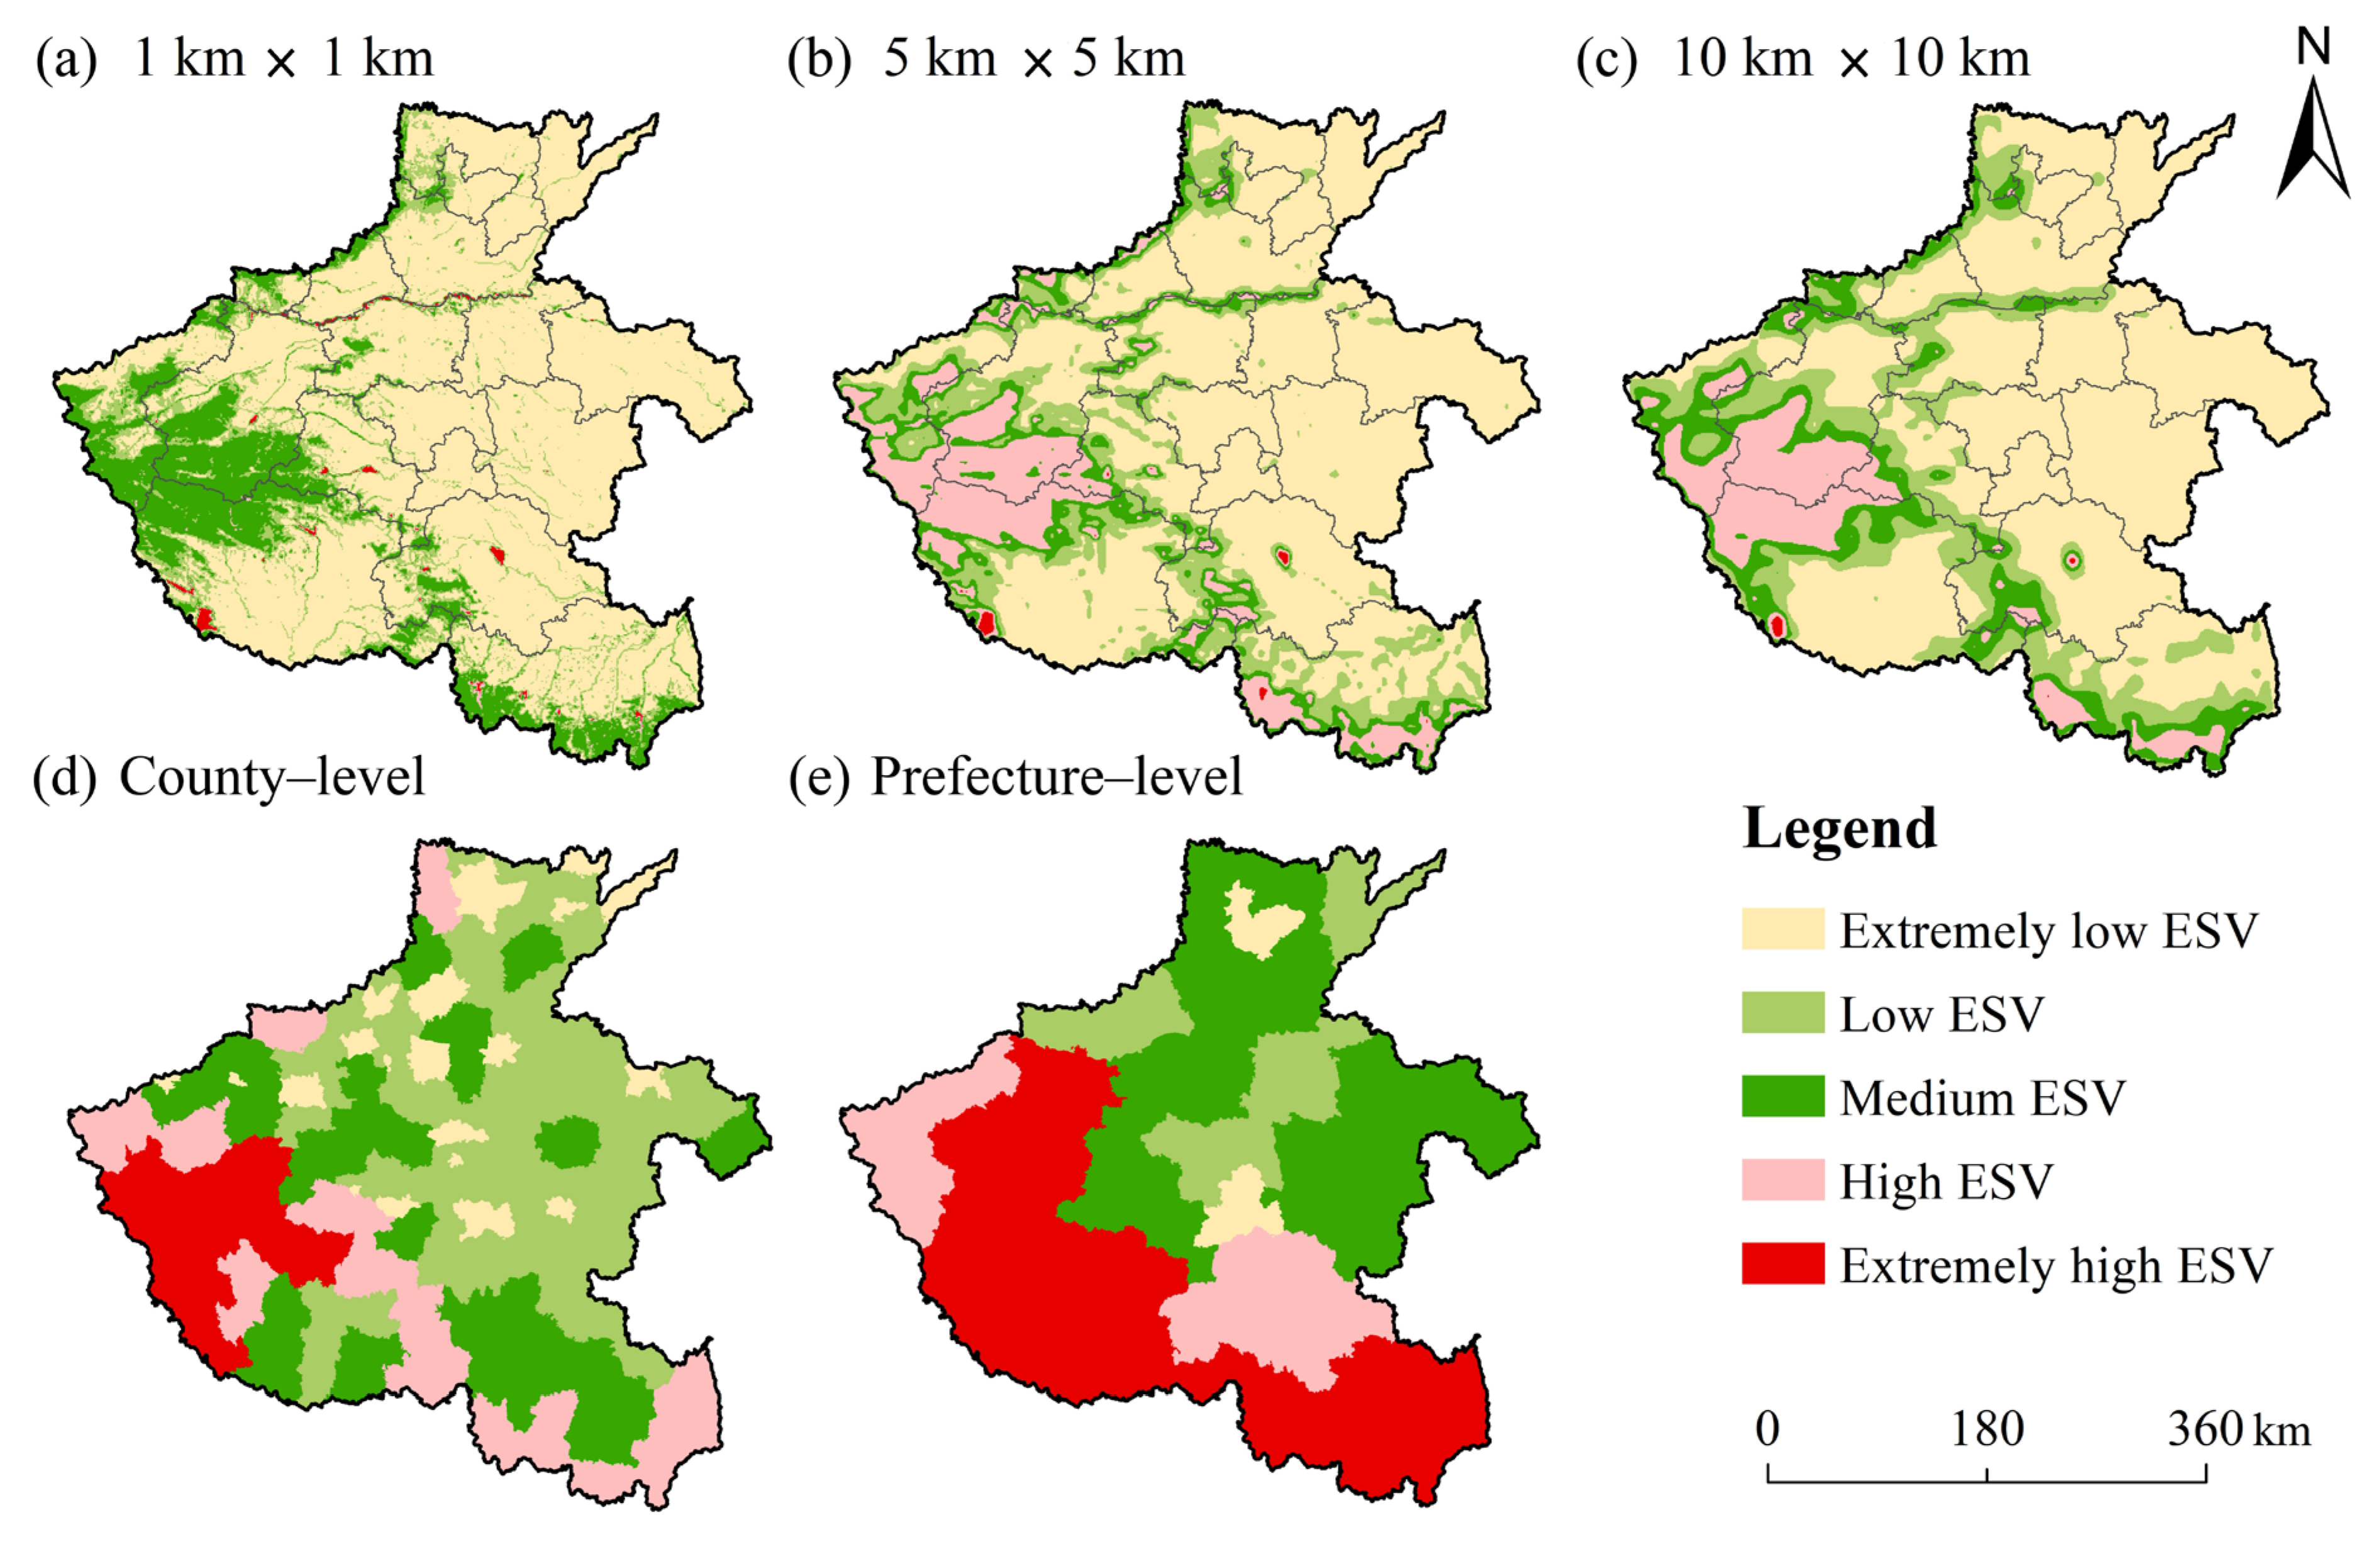
Using ArcGIS 10.8 and GeoDa 1.16.0.12 software, we calculated the Moran’s I of ESV at five spatial scales: 1 km × 1 km, 5 km × 5 km, and 10 km × 10 km grids, as well as the county and city levels (Figure 7). Based on these results, we created spatial distribution maps of ESV (Figure 8). The Moran’s I value for the five scales were 0.852, 0.785, 0.708, 0.598, and 0.227, respectively. This indicates that the spatial clustering of ESV weakens as the analysis scale becomes coarser. As illustrated in Figure 8, using a coarser evaluation scale obscures important local variations in ESV. Therefore, we selected the 1 km × 1 km grid scale to analyze the spatial distribution of ESV in Henan Province.
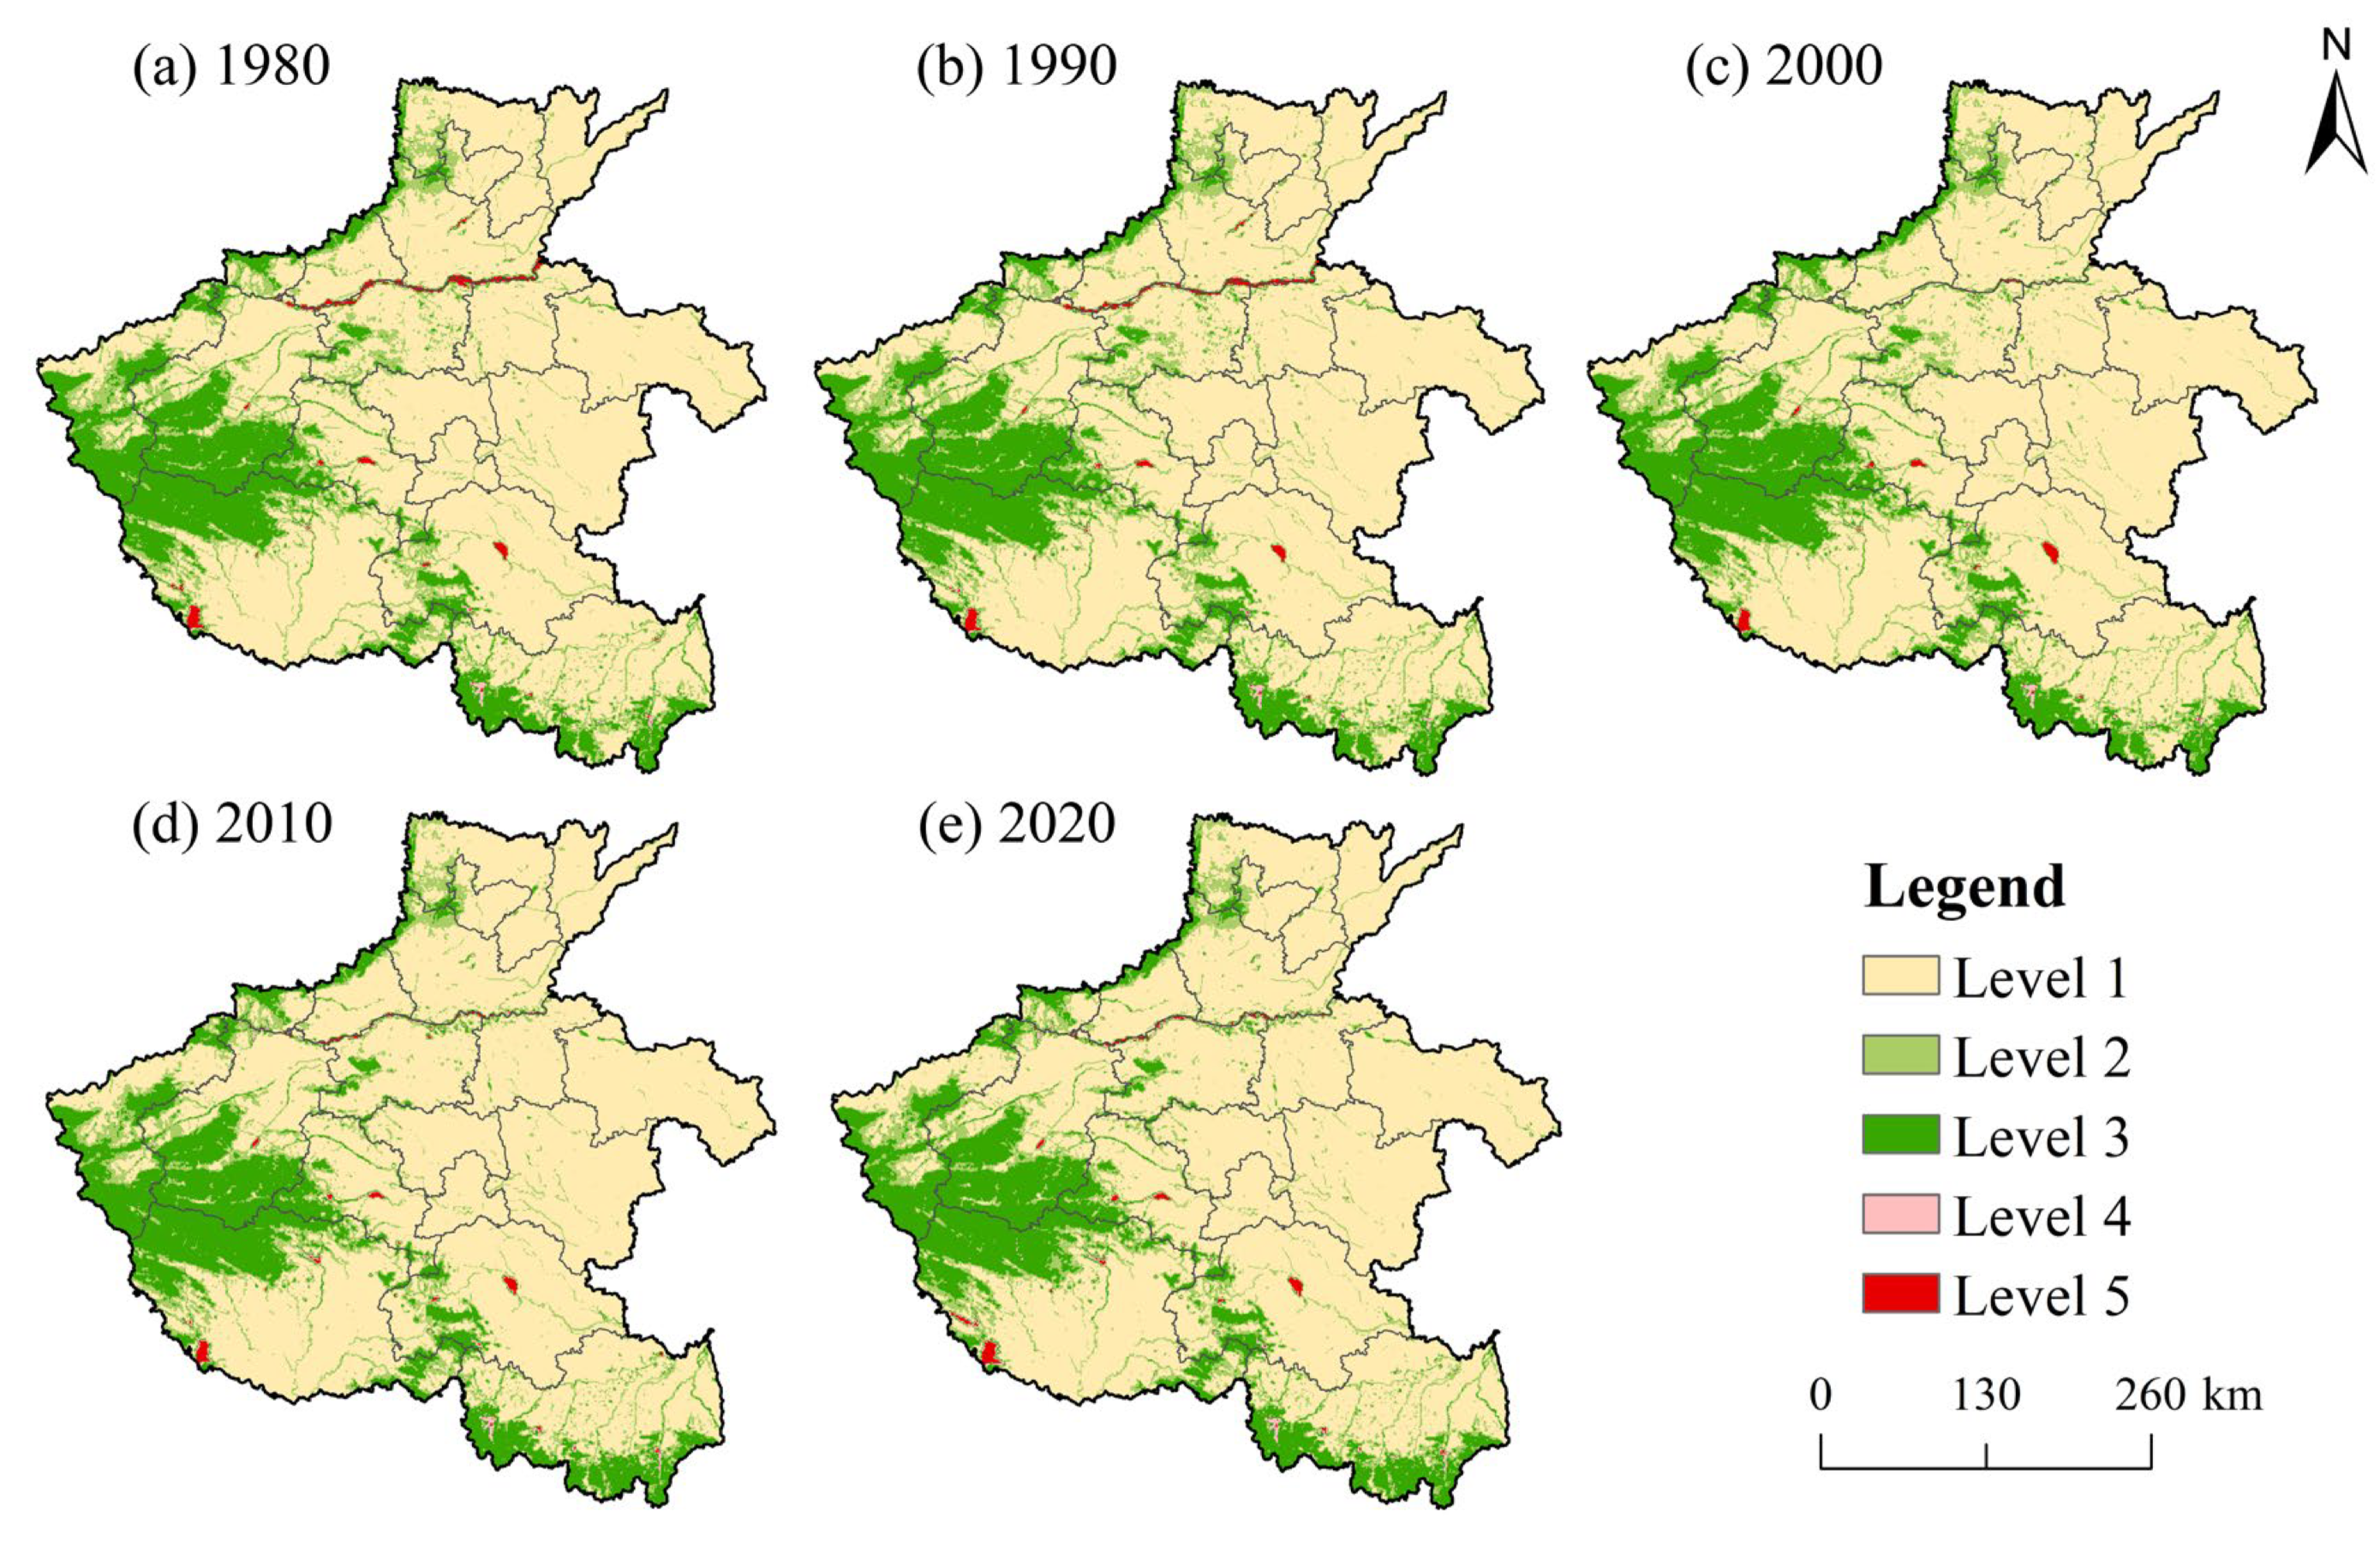
Using the Natural Breaks (Jenks) classification method in ArcGIS 10.8, we classified the ecosystem service value (ESV) into five levels: Level 1 (0–USD 259,000), Level 2 (USD 259,000–USD 486,000), Level 3 (USD 486,000–USD 751,000), Level 4 (USD 751,000–USD 1,027,000), and Level 5 (>USD 1,027,000) (Figure 9).
From 1980 and 2020, the ESV distribution in Henan Province was characterized by significant spatiotemporal heterogeneity, generally following a “high in the west, low in the east” spatial pattern. Specifically, (1) the area of high-value ESV regions (Levels 4 and 5) decreased by 12.2%, shrinking from 1826.93 km2 to 1604.67 km2. These regions were primarily located in river and lake ecosystems, such as the ecological corridors along the Yellow River and major reservoirs (Danjiangkou, Baiguishan, and Suyahu). (2) The area of medium-value ESV regions (Levels 2 and 3) decreased by 3.4%, shrinking from 48,647.10 km2 to 46,995.10 km2. These regions were mainly concentrated in mountainous and hilly areas. Specifically, they formed a contiguous block in the western Funiu Mountains, while exhibiting a belt-like pattern in the northern Taihang and southern Tongbai-Dabie Mountains. (3) The area of low-value ESV regions (Level 1) increased by 1.6%, expanding from 115,344.86 km2 to 117,213.16 km2. These regions were mainly concentrated in the agricultural areas of the central and eastern plains and the Nanyang Basin.
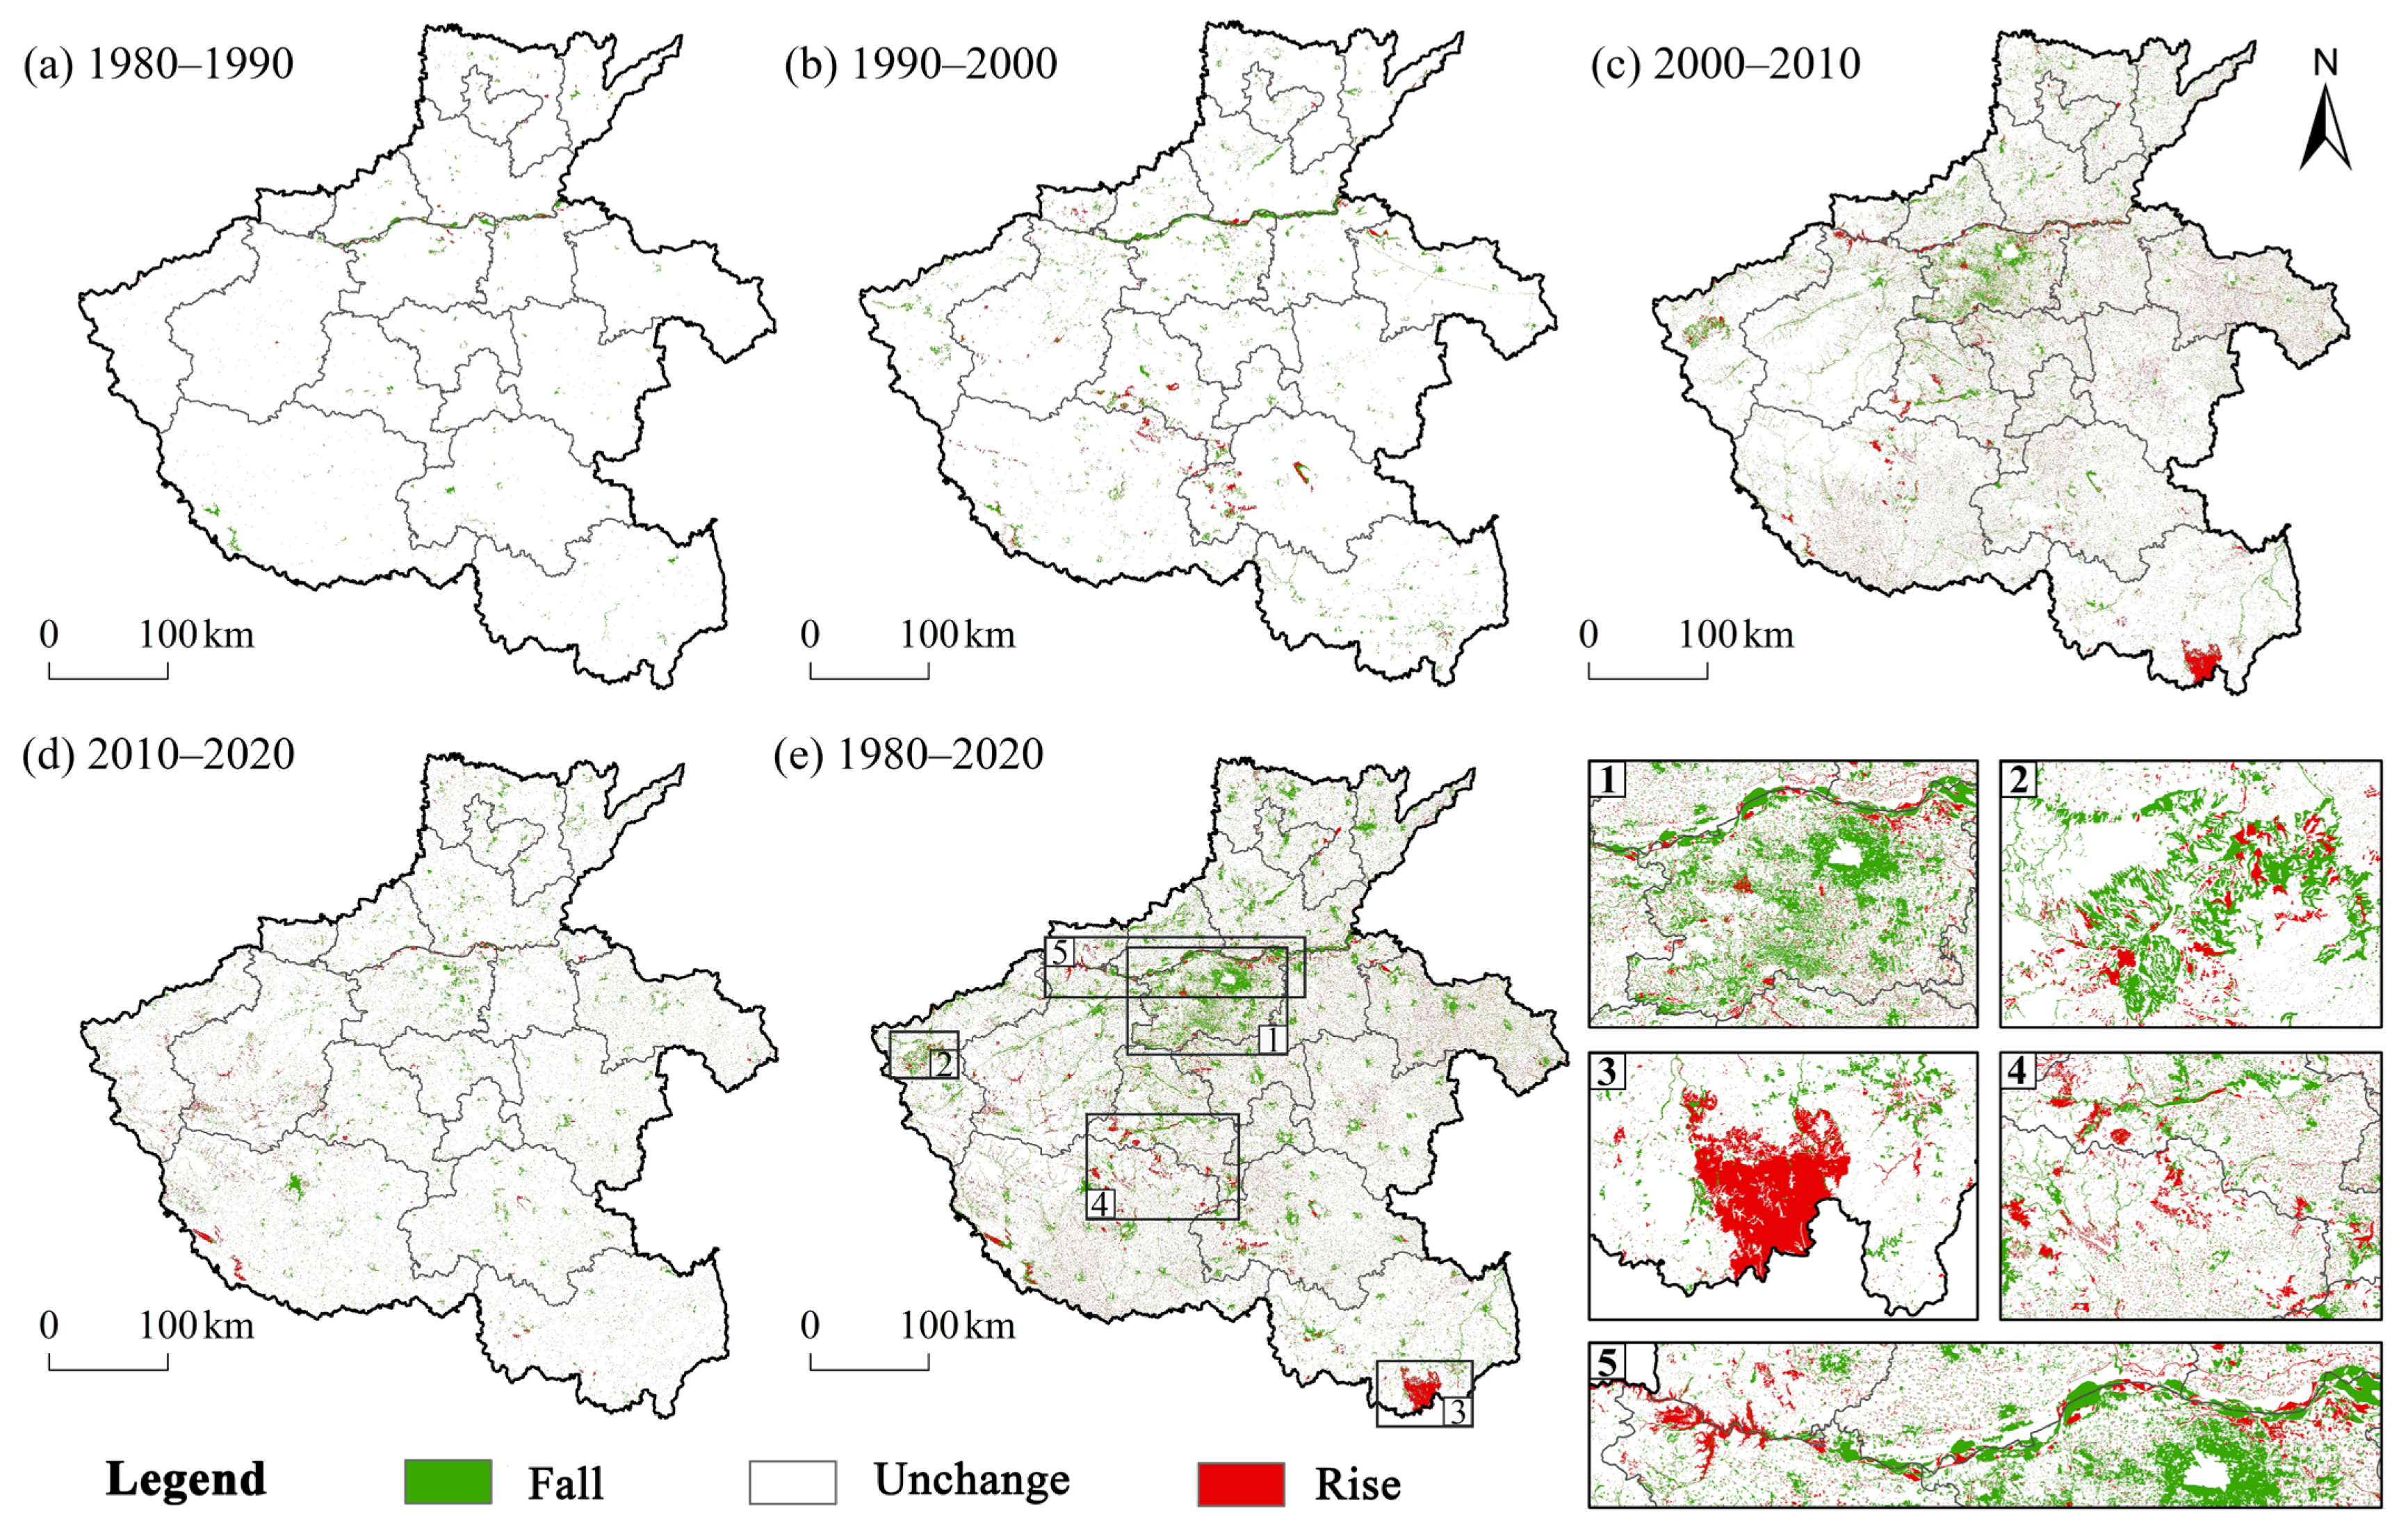
The map of ESV changes in Henan Province reveals clear spatial differentiation (Figure 10). From 1980 to 2020, the total area where ESV increased was 7086.03 km2 (4.28% of Henan province’s total area), while the area where ESV decreased was significantly larger, at 14,363.60 km2 (8.67% of Henan province’s total area). Areas of ESV increase were mainly concentrated in several key regions: the Dabie Mountains (southern Xinyang), the Tongbai Mountains (southern Nanyang), the mountainous areas south of Pingdingshan, and the Yellow River Corridor within Luoyang and Zhengzhou. This spatial pattern closely aligns with the distribution of cities that had high contribution rates to the conversion of agricultural land to ecological space, as mentioned earlier. Areas of ESV reduction exhibited a wide and dispersed spatial distribution and can be divided into two main types. The first type was concentrated around the built-up areas of cities and counties. The second category of ESV reduction was mainly found in low-mountain and hilly areas.

4. Discussion

4.1. Comparison Between This Study and Existing Literature

This study innovatively constructs an analytical framework of “UAES competition-ESV response”. Through this framework, we focus on analyzing the spatiotemporal competition characteristics of UAES and their quantitative impact on ESV in Henan Province—a representative key agricultural region in China—from 1980 to 2020.
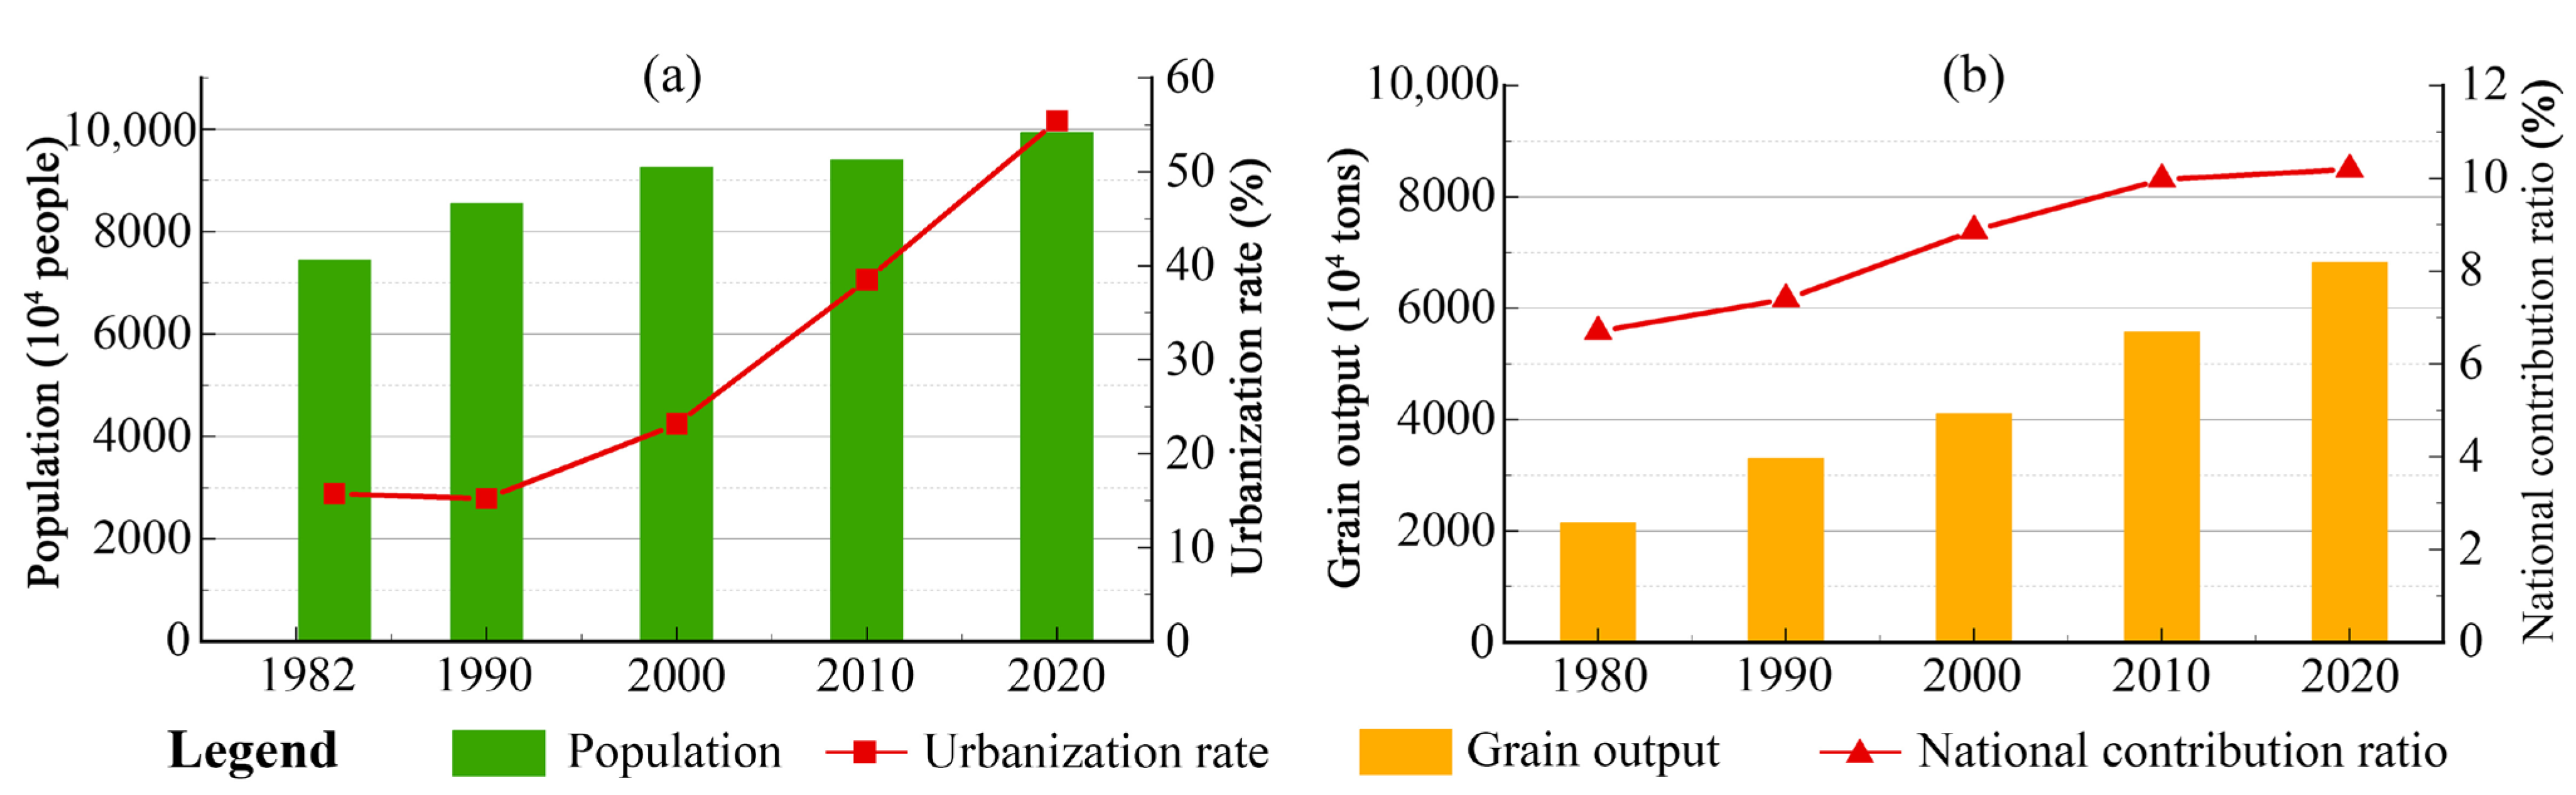
This study found that from 1980 to 2020, the territorial spatial structure of Henan Province was characterized by the continuous contraction of agricultural space, the rapid expansion of urban space, and a slight decline in ecological space. The primary driver of these changes was the encroachment of urban space on agricultural land, which emerged as the dominant form of spatial competition. This trend is consistent with the “urban expansion, agricultural and ecological contraction” model observed in China’s eastern plains [34,36,37]. However, it differs from the pattern in the northwest oasis areas, which are characterized by a “dual expansion of urban and agricultural space alongside ecological contraction” [43,45]. It also contrasts with the model found in southern hilly areas, described as “ecological and urban expansion with agricultural contraction” [34,35,42]. This disparity profoundly reflects the spatial conflict between urbanization and farmland protection in key agricultural areas, driven primarily by the underlying constraints of topography and natural conditions, which closely align with territorial spatial characteristics at the prefecture-city level. Except for the mountainous and hilly areas in the north, west, and south, most of Henan Province features a plain topography (Figure 1b). This topographical variation directly leads to significant regional differentiation in the territorial space of each prefecture-level city. In the eastern and central plain areas, such as Zhoukou, Shangqiu, and Luohe, the flat terrain, fertile soil, and convenient irrigation conditions have sustained the proportion of agricultural space above 80% for an extended period (Figure 4). The flat terrain in these areas is suitable for both agricultural development and urban construction, resulting in a high overlap between land suitable for farming and land suitable for development. This overlap provides a natural foundation for urban encroachment on farmland. In contrast, prefecture-level cities in the western, northern, and southern mountainous and hilly regions, such as Sanmenxia, Jiyuan, and Luoyang, face greater challenges in agricultural development due to topographic constraints. These areas exhibit a higher proportion of ecological space, which dominates the regional territorial spatial structure. In addition, as a populous agricultural province (permanent population > 99.41 million in 2020), Henan faces the challenge of urbanizing a large rural population (Figure 11a). This rural-to-urban shift continually increases the demand for construction land, further exacerbating the trade-offs between urban and agricultural space.
Previous studies indicate that geographical conditions, stages of socioeconomic development, and land policies are collective drivers of the spatiotemporal heterogeneity observed in territorial spatial competition [34,35,37,45]. The findings of this study support this viewpoint. For instance, from 1980 to 2000, Henan’s urbanization level was relatively low (Figure 11a), and human activities had a correspondingly weak influence on its spatial structure. In contrast, the period from 2000 to 2010 saw a dramatic intensification of UAES competition (Figure 5). This was driven by a combination of national strategies (e.g., “Rise of Central China”, “Grain for Green”) and local development initiatives (e.g., the Central Plains Urban Agglomeration, construction of the Zhengdong New District). After 2010, the intensity of spatial competition eased significantly. This was driven by the advancement of national policies such as “new-type urbanization” and “ecological civilization”, particularly the strategy for ecological protection and high-quality development in the Yellow River Basin. This shift indicates that the country’s macro-level governance policies have begun to take effect. Spatially, the competition of UAES in Henan Province presented a dual pattern of plains and mountainous and hilly areas: the cities in the plain regions generally exhibited a competitive model of “urban encroachment on agriculture”, with the cities in the core area of the Central Plains Urban Agglomeration being the most typical. In contrast, the mountainous and hilly areas in the west and south were characterized by competing pressures between agricultural and ecological land uses. On one hand, ecological land was converted into new cropland to compensate for farmland lost to urbanization. On the other hand, ecological restoration projects, such as the ‘Grain for Green’ policy, were also being implemented. This reflects the complex dilemma these regions face in balancing the “cropland occupation–compensation” policy with ecological protection goals amidst ongoing urbanization. This phenomenon is also quite common in other mountainous and hilly areas of China [23,34,42]. In response to the dual pattern of spatial competition between plains and mountainous/hilly regions in Henan Province, it is essential to respect their spatial heterogeneity in territorial spatial ecological governance and implement differentiated management strategies for each zone.
Balancing the competing demands of urban development, food security, and ecological protection has become a core issue for China’s sustainable development and territorial spatial governance [2,3,30]. Previous studies have typically approached spatial competition through the lens of micro-level land use transformations, emphasizing the protection and governance of land elements [13,18,21,23,57]. Based on UAES framework from China’s territorial spatial planning [2], this study aggregated individual land use types into broader functional units: urban, agricultural, and ecological spaces. The analysis focused on changes in the intensity of core regional functions and the spatial trade-offs among these three zones. This approach provides a more integrated analytical framework for understanding the complexity of human–environment systems. Furthermore, it supports the ongoing transformation of territorial governance from “single-element management” to “multi-objective coordination”. Compared to existing studies on the competition of PLE spaces [24,26,28,29,33], this research avoids the issue of overlapping and ambiguous boundaries between functional spaces. Instead, it aligns directly with the “three zones and three lines” regulatory framework and couples UAES competition with changes in terrestrial ecosystem service value, thereby enhancing the policy relevance and decision-support value of the findings. Additionally, the “UAES competition–ESV response” analytical framework proposed in this study links territorial spatial competition with ESV response, deepening the cognitive perspective of human–environment system complexity from a “process–effect” dimension. By quantifying the impact of different spatial transitions on ESV, it clarifies the spatial distribution of key transition types and their associated loss values, providing threshold references and prioritized intervention pathways for establishing future dynamic territorial monitoring and ecological risk early-warning systems. Although this study is based on the context of China, the “UAES competition-ESV response” analytical framework it establishes and the zonal governance logic it proposes have universal applicability, providing a methodological reference for sustainable spatial planning in global agricultural regions undergoing urbanization.

4.2. The Impact of Territorial Spatial Competition on ESV

Previous studies have shown that the accuracy of equivalent factors, precision of land use data, and the scale of evaluation units critically influence ESV assessment outcomes [48,49,55]. This study adopted the five-phase 30 m high-resolution fine-classification land use remote sensing monitoring data provided by the Resources and Environmental Sciences and Data Center of the Chinese Academy of Sciences [13], and revised the ESV equivalent factor table (Table 2) based on the actual grain output and price level in Henan Province. When determining the assessment scale, we comprehensively considered the spatial autocorrelation indicated by the Moran’s I index (Figure 7) and the practical requirements of territorial spatial planning and ecological management. We ultimately selected the 1 km grid as the basic unit for spatial evaluation, which not only ensures a sensitive capture of spatial heterogeneity but also aligns with the policy shift from “administrative unit management” to “spatial unit governance.” This allows our findings to accurately inform the formulation and optimization of policies such as the delineation of “three zones and three lines,” the balance of cultivated land occupation and compensation, and the planning of ecological restoration projects. In contrast, coarser scales (e.g., city or county levels) tend to obscure the internal spatial variability of ESV, making it difficult to accurately identify high-value, low-value, and change hotspot areas, thereby hindering the targeted implementation of spatial governance policies. Our results show that the overall ESV in Henan Province exhibits a distinct spatial pattern: high in the west and low in the east. Specifically, the ESV in the western and southern mountainous regions was significantly higher than in the eastern plains. This finding is consistent with previous research [49], suggesting that the results of our study are reliable.
Multiple studies have confirmed the significant impact of territorial spatial competition on ESV. However, the specific effects vary depending on regional differences in the intensity of human activity and ecosystem type [21,26,28,29,46,49]. This study found that competition among UAES in Henan Province significantly impacted its ESV from 1980 to 2020. Specifically, the conversion of agricultural land to ecological space led to an ESV increase, with a cumulative gain of USD 1528.74 million. This finding indicates that government-led ecological protection and restoration policies, such as the “Grain for Green” program, have played a crucial role in stabilizing the regional ESV. Both the encroachment of urban space on agricultural space and of agricultural space on ecological space had negative impacts on ESV. However, the loss from agricultural encroachment on ecological space (−USD 1663.24 million) was much greater than that from urban encroachment on agricultural space (−USD 812.41 million). A possible explanation for this lies in Henan’s critical role in agriculture. As one of China’s 13 major grain-producing regions, the province accounts for approximately 10% of the national grain output and shoulders the significant responsibility of ensuring national food security (Figure 11b). However, the urbanization process inevitably encroaches on large amounts of farmland. To offset these losses, the “cropland occupation–compensation balance” policy is often adopted. This mechanism leads to the expansion of urban space encroaching on agricultural space, and at the same time, agricultural space further encroaches on ecological space, thereby resulting in significant superimposed negative effect on ESV. Construction land generally has a low ESV [1]. As its expansion often replaces cropland (which has a higher ecological value), this conversion consequently leads to an overall decline in regional ESV. In Henan Province, agricultural expansion primarily occurs at the expense of forests and water bodies, which have a higher ecological value than the cropland they replace (Table 2). Therefore, the encroachment of agriculture on ecological space results in a particularly significant negative impact on the overall ESV. Existing research suggests that the indirect ecological losses from urban expansion—specifically, the displacement of cropland—far outweigh the direct impacts [6]. Our results, analyzed from an ESV perspective, support this assertion. Therefore, the future implementation of the “dynamic balance between farmland occupation and compensation” policy in Henan Province must shift from a singular focus on static quantitative balance toward achieving a dynamic trinity of “quantity–quality–ecology” in cultivated land. Concurrently, a systematic ESV impact assessment mechanism should be established within the territorial spatial planning system, and its variations should be integrated into the spatial governance framework. This will provide a more sustainable planning and management tool for synergistically realizing the multiple objectives of food security, ecological security, and urbanization development.
This study also found that the ESV changes resulting from territorial spatial competition in Henan Province exhibited clear spatial patterns (Figure 10). Areas of ESV increase were mainly distributed in the southern mountainous regions of Xinyang, Nanyang, and Pingdingshan, and along the Yellow River Corridor. These locations correspond to the key ecological barrier zones of Henan Province, which include the northern Taihang Mountains, the western Funiu Mountains, the southern Tongbai-Dabie Mountains, and the Yellow River Ecological Corridor [52]. The implementation of ecological restoration projects in these regions, such as initiatives to return farmland to forests and grasslands, has significantly improved both vegetation coverage and ecosystem quality. This indicates that targeted measures in ecologically sensitive areas are an effective strategy for enhancing regional ESV. This result is highly consistent with the distribution of cities with high contribution rates of ecological space encroachment on agricultural space (Figure 6), further confirming the necessity and effectiveness of implementing strict protection and restoration policies in key ecological areas. Areas where ESV declined were more spatially scattered, though they were primarily concentrated around urban built-up areas and in low-mountain and hilly regions. The loss of ESV around cities was particularly significant in the core of the Central Plains Urban Agglomeration. This reflects the continuous encroachment of construction land on prime cropland during the region’s rapid urbanization. This trend not only causes ESV loss but also poses a dual threat to regional food and ecological security [58]. In low mountain and hilly areas, the decline in ESV is more related to the implementation method of the “cropland occupation-compensation balance” policy: to make up for the loss of cultivated land in the plain area due to urbanization, the potential cultivated land in the mountain and hilly areas is often developed to achieve a balance in quantity. Although this spatial replacement maintains the total cropland area, it often does so at the expense of reducing ecological lands like forests and grasslands in fragile areas. This, in turn, significantly weakens the ecosystem’s overall service-providing capacity [23]. These spatial patterns reflect the complex impacts of human activities and ecological policies on the regional environment. Furthermore, they provide a crucial basis for understanding the trade-offs among urban expansion, agricultural development, and ecological protection, particularly in agricultural areas undergoing rapid urbanization.

4.3. Limitations and Prospects

This study has several limitations. Firstly, the equivalent factor method used in this study is a static assessment [48], which fails to account for the interannual dynamic variations in biomass or the effects of monetary inflation in grain prices. This may introduce potential biases into the ESV evaluation. Future research could improve accuracy by revising the ESV equivalent factor table to incorporate the spatiotemporal dynamics of biomass and factors like monetary inflation, thereby reducing uncertainty. Secondly, the use of land cover types as a proxy for ESV assessment in heterogeneous agricultural areas and urban-rural fringes has limitations, as it may not adequately capture the spatially continuous variations in actual ecosystem functions. Future studies are recommended to integrate remote sensing spectral indices with field observations to improve the accuracy of ESV assessments. Thirdly, this study adopted the method of Costanza et al. by setting the ESV coefficient for construction land to 0 [1]. While this simplification facilitates macro-scale comparisons, it may introduce estimation biases. In reality, urban spaces include land with ecological functions, such as parks, green spaces, and water bodies, whose values in climate regulation, environmental purification, and cultural-recreational services should not be overlooked. Future research could develop a more refined ecological classification system for construction land and assign differentiated value coefficients to more comprehensively assess the ecological effects of urban spatial transformation. Finally, this study does not provide a quantitative analysis of the mechanisms linking UAES competition to ESV changes. A deeper investigation into these complex human-land relationships is a valuable direction for future work. Future research could introduce quantitative models to further analyze the correlation and response mechanisms between UAES competition and ESV changes.

5. Conclusions and Policy Recommendations

5.1. Conclusions

This study selected Henan Province as its study area, a representative case of China’s key agricultural regions. Using 30 m resolution LUCC data from 1980 to 2020, we applied a combination of the Geo-informatic Tupu method and an ESV assessment model to explore the spatiotemporal dynamics of UAES competition and its impact on ESV. The main conclusions are as follows:
(1) From 1980 to 2020, Henan’s territorial space was dominated by agricultural space. However, this period was characterized by a gradual shrinkage of agricultural areas, a rapid expansion of urban space, and a slight decline in ecological space. Consequently, the structural ratio of UAES evolved from 0.85:74.14:25.01 in 1980 to 3.85:71.82:24.33 in 2020. The primary form of competition was the encroachment of urban space on agricultural space, accounting for approximately 4806.04 km2 of conversion. Additionally, the mutual conversion between agricultural and ecological spaces was also intense. Temporally, the competition among UAES exhibited distinct phases: it was relatively weak from 1980 to 1990, intensified from 1990 to 2000, peaked between 2000 and 2010, and then eased somewhat after 2010. Spatially, the encroachment of urban space on agricultural space was concentrated in the core areas of the Central Plains urban agglomeration. The encroachment of agricultural space on ecological space occurred mainly in the western low-mountain and hilly regions and the northern Yellow River floodplains. The ecological encroachment on agricultural space was mainly located in the southern Tongbai-Dabie Mountain area and the western Funiu Mountain area.
(2) Different types of spatial competition in Henan Province had significantly different impacts on ESV. Specifically, the encroachment of urban space on agricultural space resulted in an ESV loss of USD 812.41 million, while the encroachment of agricultural space on ecological space caused a much larger loss of USD 1663.24 million. The conversion of agricultural land to ecological space generated a significant ESV gain, totaling USD 1528.74 million. Spatially, the pattern of ESV change was significantly correlated with the competition among the UAES during the same period. Areas of ESV increase were mainly distributed in the southern mountainous regions of Xinyang, Nanyang, and Pingdingshan, and along the Yellow River Corridor. In contrast, areas of ESV reduction were more scattered, though they were primarily concentrated around urban built-up areas and in low-mountain and hilly regions.
This study innovatively develops an integrated “UAES competition-ESV response” analytical framework. This framework elevates the study of spatial competition to a value-oriented plane, emphasizing human well-being and sustainable development. Furthermore, it provides a critical foundation for understanding the trade-offs between urban expansion, agricultural development, and ecological protection in agricultural regions undergoing urbanization. The research findings can serve as a spatial governance reference for Henan and other agricultural regions facing similar urbanization pressures.

5.2. Policy Recommendations

Based on our empirical findings on UAES spatial competition and its ESV impacts in Henan Province, we propose the following policy recommendations. These recommendations aim to foster synergy among urban development, food security, and ecological protection, thereby achieving sustainable territorial management:
First, fully leverage the “Three Zones and Three Lines” framework to shape the territorial spatial pattern. This study indicates that the competition of UAES in Henan Province reflects the realistic trade-off between ensuring national food security and promoting local development in agricultural areas. Therefore, we suggest that provincial, municipal, and county-level spatial planning in Henan fully utilize the “Three Zones and Three Lines” framework. This will help to clearly define and implement the primary functions at the municipal and county levels [20]. The ultimate goal is to promote a scientific and orderly spatial pattern that optimizes the structure and complements the functions of urbanization, agricultural development, and ecological security.
Second, the implementation of the “cropland occupation–compensation balance” policy should be optimized. This study shows that in Henan Province, agricultural space has expanded into ecological land to compensate for cropland lost to urban encroachment. This process has resulted in significant ESV losses. On one hand, we recommend shifting the goal of the cropland occupation-compensation policy from a simple “quantity balance” to a “quantity–quality–ecology” triple balance [59]. This would help alleviate the pressure that urbanization in agricultural areas places on food security. On the other hand, when implementing the ‘cropland occupation-compensation balance’ policy, the importance and vulnerability of local ecosystems must be comprehensively evaluated [23]. Furthermore, cultivating new farmland in ecologically sensitive areas should be strictly prohibited to mitigate the negative impacts of agricultural development on ESV.
Third, differentiated regional spatial governance strategies should be implemented. Given the dual pattern of spatial competition between Henan’s plains and mountainous regions, a differentiated management approach is required. In plain areas, the primary focus should be on strictly protecting permanent basic farmland. Furthermore, the production capacity of existing cropland should be enhanced through comprehensive land consolidation and the development of high-standard farmland, thereby promoting the green and low-carbon use of agricultural space. Cities in the core area of the Central Plains Urban Agglomeration should adhere to the constraint of urban development boundaries, promote compact and stock urbanization, and facilitate the integration of urban and rural areas and high-quality development. For the mountainous areas in the west, north, and south, the priority should be strengthening ecological protection and restoration to establish a robust ecological security barrier. This includes building upon the success of the “Grain for Green” program and focusing on enhancing forest ecosystem quality and water conservation functions. For areas along the Yellow River, the priority is to fully implement the “Ecological Protection and High-Quality Development of the Yellow River Basin“ strategy [49]. Key actions should include constructing ecological corridors, strengthening the restoration of wetlands and tidal flats, and enhancing the river’s ecosystem services.
Finally, a dynamic monitoring and ecological impact early-warning mechanism for territorial spatial transformations should be established. We recommend building a three-tiered (provincial, municipal, and county-level) monitoring and early-warning platform for Henan. This platform should integrate multi-source remote sensing technology, ecosystem service assessments, and policy performance models to monitor the relationship between UAES competition and its ESV response. Regular spatial flow accounting and ESV assessment should be carried out to provide a basis for policy optimization and spatial governance.

Author Contributions

Conceptualization, T.C.; methodology X.C. and H.H.; software, X.C. and Z.X.; validation, H.H.; formal analysis, H.H.; data curation, H.H. and Z.X.; writing—original draft preparation, X.C.; writing—review and editing, X.C., H.H. and T.C.; visualization, X.C. and H.H.; supervision, T.C.; project administration, T.C.; funding acquisition, T.C. All authors have read and agreed to the published version of the manuscript.

Funding

This research was funded by the Key Scientific Research Projects of Henan Province Higher Education Institutions in 2026 (Grant No. 26B170007).

Data Availability Statement

All data used in this study are detailed in Section 2.2 of the submitted manuscript and are openly available for download.

Acknowledgments

The authors sincerely thank the providers and contributors of all datasets used in this study, including the Henan’s DEM data, Land-Use/Cover dataset, administrative boundary vector data, as well as the Henan Statistical Yearbook, for their valuable data support that was critical to this research.

Conflicts of Interest

The authors declare no conflicts of interest. The funders had no role in the design of the study; in the collection, analyses, or interpretation of data; in the writing of the manuscript; or in the decision to publish the results.

Abbreviations

The following abbreviations are used in this manuscript:
ESVEcosystem service value
UAESUrban–Agricultural–Ecological space
PLEProduction-Living-Ecological
USDUS dollar

References

  1. Costanza, R. The Value of the World’s Ecosystem Services and Natural Capital. Nature 1999, 387, 253–260. [Google Scholar] [CrossRef] [Scilit]
  2. Liu, Y.; Zhou, Y. Territory spatial planning and national governance system in China. Land Use Policy 2021, 102, 105288. [Google Scholar] [CrossRef] [Scilit]
  3. Qu, Y.; Dong, X.; Su, D.; Jiang, G.; Ma, W. How to balance protection and development? A comprehensive analysis framework for territorial space utilization scale, function and pattern. J. Environ. Manag. 2023, 339, 117809. [Google Scholar] [CrossRef] [Scilit] [PubMed]
  4. Huang, Q.; Liu, Z.; He, C.; Gou, S.; Bai, Y.; Wang, Y.; Shen, M. The occupation of cropland by global urban expansion from 1992 to 2016 and its implications. Environ. Res. Lett. 2020, 15, 084037. [Google Scholar] [CrossRef] [Scilit]
  5. Song, X.P.; Hansen, M.C.; Stehman, S.V.; Potapov, P.V.; Tyukavina, A.; Vermote, E.F.; Townshend, J.R. Global land change from 1982 to 2016. Nature 2018, 560, 639–643. [Google Scholar] [CrossRef] [Scilit] [PubMed]
  6. van Vliet, J. Direct and indirect loss of natural area from urban expansion. Nat. Sustain. 2019, 2, 755–763. [Google Scholar] [CrossRef] [Scilit]
  7. Winkler, K.; Fuchs, R.; Rounsevell, M.; Herold, M. Global land use changes are four times greater than previously estimated. Nat. Commun. 2021, 12, 2501. [Google Scholar] [CrossRef] [Scilit]
  8. Costanza, R.; de Groot, R.; Sutton, P.; van der Ploeg, S.; Anderson, S.J.; Kubiszewski, I.; Farber, S.; Turner, R.K. Changes in the global value of ecosystem services. Glob. Environ. Change 2014, 26, 152–158. [Google Scholar] [CrossRef] [Scilit]
  9. Sannigrahi, S.; Bhatt, S.; Rahmat, S.; Paul, S.K.; Sen, S. Estimating global ecosystem service values and its response to land surface dynamics during 1995–2015. J. Environ. Manag. 2018, 223, 115–131. [Google Scholar] [CrossRef] [Scilit]
  10. Gao, L.; Bryan, B.A. Finding pathways to national-scale land-sector sustainability. Nature 2017, 544, 217–222. [Google Scholar] [CrossRef] [Scilit]
  11. Heck, V.; Hoff, H.; Wirsenius, S.; Meyer, C.; Kreft, H. Land use options for staying within the Planetary Boundaries—Synergies and trade-offs between global and local sustainability goals. Glob. Environ. Change 2018, 49, 73–84. [Google Scholar] [CrossRef] [Scilit]
  12. Guan, X.; Wei, H.; Lu, S.; Dai, Q.; Su, H. Assessment on the urbanization strategy in China: Achievements, challenges and reflections. Habitat Int. 2018, 71, 97–109. [Google Scholar] [CrossRef] [Scilit]
  13. Liu, J.; Kuang, W.; Zhang, Z.; Xu, X.; Qin, Y.; Ning, J.; Zhou, W.; Zhang, S.; Li, R.; Yan, C.; et al. Spatiotemporal characteristics, patterns, and causes of land-use changes in China since the late 1980s. J. Geogr. Sci. 2014, 24, 195–210. [Google Scholar] [CrossRef] [Scilit]
  14. Kuang, W.; Liu, J.; Dong, J.; Chi, W.; Zhang, C. The rapid and massive urban and industrial land expansions in China between 1990 and 2010: A CLUD-based analysis of their trajectories, patterns, and drivers. Landsc. Urban Plan. 2016, 145, 21–33. [Google Scholar] [CrossRef] [Scilit]
  15. Wei, Y.D.; Li, H.; Yue, W. Urban land expansion and regional inequality in transitional China. Landsc. Urban Plan. 2017, 163, 17–31. [Google Scholar] [CrossRef] [Scilit]
  16. Li, Z.; Ding, M.; Xie, K.; Li, J.; Chen, L. Spatio-temporal characteristics of farmland occupation of construction land expansion and its spatial relationship with grain yield in China for 2000–2020. J. Geogr. Sci. 2024, 34, 855–870. [Google Scholar] [CrossRef] [Scilit]
  17. Liu, F.; Zhang, Z.; Zhao, X.; Wang, X.; Zuo, L.; Wen, Q.; Yi, L.; Xu, J.; Hu, S.; Liu, B. Chinese cropland losses due to urban expansion in the past four decades. Sci. Total Environ. 2019, 650, 847–857. [Google Scholar] [CrossRef] [Scilit]
  18. Kuang, W.; Liu, J.; Tian, H.; Shi, H.; Dong, J.; Song, C.; Li, X.; Du, G.; Hou, Y.; Lu, D.; et al. Cropland redistribution to marginal lands undermines environmental sustainability. Natl. Sci. Rev. 2022, 9, nwab091. [Google Scholar] [CrossRef] [Scilit]
  19. Wang, J.; Lin, Y.; Zhai, T.; He, T.; Qi, Y.; Jin, Z.; Cai, Y. The role of human activity in decreasing ecologically sound land use in China. Land Degrad. Dev. 2018, 29, 446–460. [Google Scholar] [CrossRef] [Scilit]
  20. Fan, J.; Zhou, K. Theoretical thinking and approach exploration on deepening the implementation of Major Function Zoning Strategy with “Three-zones and Three-lines”. China Land Sci. 2021, 35, 1–9. (In Chinese) [Google Scholar]
  21. Chen, W.; Zhao, H.; Li, J.; Zhu, L.; Wang, Z.; Zeng, J. Land use transitions and the associated impacts on ecosystem services in the Middle Reaches of the Yangtze River Economic Belt in China based on the geo-informatic Tupu method. Sci. Total Environ. 2020, 701, 134690. [Google Scholar] [CrossRef] [Scilit] [PubMed]
  22. Quan, L.A.; Jin, S.; Chen, J.; Li, T. Evolution and Driving Forces of Ecological Service Value in Anhui Based on Landsat Land Use and Land Cover Change. Remote Sens. 2024, 16, 269. [Google Scholar] [CrossRef] [Scilit]
  23. Wang, S.; Jin, X.; Han, B.; Liu, J.; Song, J.; Zhou, Y. Understanding the process and mechanism of agricultural land transition in China: Based on the interactive conversion of cropland and natural ecological land. J. Environ. Manag. 2025, 376, 124585. [Google Scholar] [CrossRef] [Scilit] [PubMed]
  24. Lu, Q.; Sun, J.; Xiao, Y.; Zhu, S.; Zhu, G.; Liu, J.; Li, X.; Liu, H. The progression traits of spatial conflicts within the production–living–ecological space among varying geomorphological types of mountain–basin areas in karst regions, China. Ecol. Indic. 2024, 166, 112324. [Google Scholar] [CrossRef] [Scilit]
  25. Shi, Z.; Deng, W.; Zhang, S. Spatio-temporal pattern changes of land space in Hengduan Mountains during 1990–2015. J. Geogr. Sci. 2018, 28, 529–542. [Google Scholar] [CrossRef] [Scilit]
  26. Zhang, L.; Hu, B.; Zhang, Z.; Liang, G. Research on the spatiotemporal evolution and mechanism of ecosystem service value in the mountain-river-sea transition zone based on “production-living-ecological space” —Taking the Karst-Beibu Gulf in Southwest Guangxi, China as an example. Ecol. Indic. 2023, 148, 109889. [Google Scholar] [CrossRef] [Scilit]
  27. Li, J.; Sun, W.; Li, M.; Linlin, M. Coupling coordination degree of production, living and ecological spaces and its influencing factors in the Yellow River Basin. J. Clean. Prod. 2021, 298, 126803. [Google Scholar] [CrossRef] [Scilit]
  28. Wang, A.; Liao, X.; Tong, Z.; Du, W.; Zhang, J.; Liu, X.; Liu, M. Spatial-temporal dynamic evaluation of the ecosystem service value from the perspective of “production-living-ecological” spaces: A case study in Dongliao River Basin, China. J. Clean. Prod. 2022, 333, 130218. [Google Scholar] [CrossRef] [Scilit]
  29. Xu, C.; Wei, B.; Hu, Y.; Zhu, Z.; Geng, X.; Chen, F. Spatiotemporal conversion and mechanism between production-living-ecological space and ecosystem service in the canal area. Ecol. Indic. 2024, 167, 112689. [Google Scholar] [CrossRef] [Scilit]
  30. Yu, T.; Jia, S.; Zhang, Y.; Cui, X. How can urban expansion and ecological preservation be balanced? A simulation of the spatial dynamics of production-living-ecological spaces in the Huaihe River Eco-Economic Belt. Ecol. Indic. 2025, 171, 113192. [Google Scholar] [CrossRef] [Scilit]
  31. Yang, X.; Chen, X.; Qiao, F.; Che, L.; Pu, L. Layout optimization and multi-scenarios for land use: An empirical study of production-living-ecological space in the Lanzhou-Xining City Cluster, China. Ecol. Indic. 2022, 145, 109577. [Google Scholar] [CrossRef] [Scilit]
  32. Yang, Y.; Bao, W.; Li, Y.; Wang, Y.; Chen, Z. Land Use Transition and Its Eco-Environmental Effects in the Beijing–Tianjin–Hebei Urban Agglomeration: A Production–Living–Ecological Perspective. Land 2020, 9, 285. [Google Scholar] [CrossRef] [Scilit]
  33. Zhu, Z.; Peng, S.; Ma, X.; Lin, Z.; Ma, D.; Shi, S.; Gong, L.; Huang, B. Identification of potential conflicts in the production-living-ecological spaces of the Central Yunnan Urban Agglomeration from a multi-scale perspective. Ecol. Indic. 2024, 165, 112206. [Google Scholar] [CrossRef] [Scilit]
  34. Wang, D.; Fu, J.; Xie, X.; Ding, F.; Jiang, D. Spatiotemporal evolution of urban-agricultural-ecological space in China and its driving mechanism. J. Clean. Prod. 2022, 371, 133684. [Google Scholar] [CrossRef] [Scilit]
  35. Wang, J.; He, T.; Lin, Y. Changes in ecological, agricultural, and urban land space in 1984–2012 in China: Land policies and regional social-economical drivers. Habitat Int. 2018, 71, 1–13. [Google Scholar] [CrossRef] [Scilit]
  36. Yin, L.; Wei, W.; Li, H.; Xia, J.; Bo, L. Spatio-temporal differentiation and influencing factors of territorial spatial pattern evolution in China’s land area: A parative analysis based on the Hu Huanyong Line and the Bole-Taipei Line. Geogr. Res. 2025, 44, 552–576. (In Chinese) [Google Scholar]
  37. Zong, S.; Xu, S.; Jiang, X.; Song, C. Identification and dynamic evolution of land use conflict potentials in China, 2000–2020. Ecol. Indic. 2024, 166, 112340. [Google Scholar] [CrossRef] [Scilit]
  38. Huang, X.; Wang, H.; Yan, X.; Wang, C.; Wu, J.; Yi, S. Spatiotemporal mismatch between land use functions and land use efficiencies and its influencing factors in Xinjiang: Implications for sustainable land management. J. Clean. Prod. 2025, 519, 146011. [Google Scholar] [CrossRef] [Scilit]
  39. Li, S.; Zhao, X.; Pu, J.; Miao, P.; Wang, Q.; Tan, K. Optimize and control territorial spatial functional areas to improve the ecological stability and total environment in karst areas of Southwest China. Land Use Policy 2021, 100, 104940. [Google Scholar] [CrossRef] [Scilit]
  40. Ouyang, X.; Xu, J.; Li, J.; Wei, X.; Li, Y. Land space optimization of urban-agriculture-ecological functions in the Changsha-Zhuzhou-Xiangtan Urban Agglomeration, China. Land Use Policy 2022, 117, 106112. [Google Scholar] [CrossRef] [Scilit]
  41. Qu, Y.; Wang, S.; Zhu, W.; Ping, Z. Spatial-temporal differentiation characteristics and driving force of territorial space evolution in the Yellow River Delta. Trans. Chin. Soc. Agric. Eng. 2021, 37, 252–263. (In Chinese) [Google Scholar]
  42. Wei, W.; Wang, N.; Yin, L.; Guo, S.; Bo, L. Spatio-temporal evolution characteristics and driving mechanisms of Urban–Agricultural–Ecological space in ecologically fragile areas: A case study of the upper reaches of the Yangtze River Economic Belt, China. Land Use Policy 2024, 145, 107282. [Google Scholar] [CrossRef] [Scilit]
  43. Yin, L.; Wei, W.; Bo, L.; Xia, J. Evolution of “Three-function spaces” in Xinjiang based on Major Function-oriented Zoning Strategy. Econ. Geogr. 2023, 43, 52–64. (In Chinese) [Google Scholar]
  44. Fan, Y.; Jin, X.; Gan, L.; Jessup, L.H.; Pijanowski, B.C.; Yang, X.; Xiang, X.; Zhou, Y. Spatial identification and dynamic analysis of land use functions reveals distinct zones of multiple functions in eastern China. Sci. Total Environ. 2018, 642, 33–44. [Google Scholar] [CrossRef] [Scilit]
  45. Cai, T.; Luo, X.; Fan, L.; Han, J.; Zhang, X. The Impact of Cropland Use Changes on Terrestrial Ecosystem Services Value in Newly Added Cropland Hotspots in China during 2000–2020. Land 2022, 11, 2294. [Google Scholar] [CrossRef] [Scilit]
  46. Gao, R.; Pan, Z.; Li, H.; Bi, P.; Huang, Z.; Zhang, F.; Liu, X.; Jing, Y.; Men, J.; Huang, N.; et al. The effectiveness and drivers of ecological cropland conversion for sustainable land management in the agro-pastoral ecotone of northern China. Ecol. Eng. 2025, 221, 107773. [Google Scholar] [CrossRef] [Scilit]
  47. Han, Q.; Li, L.; Wei, H.; Wu, X. Identifying the Relationships between Landscape Pattern and Ecosystem Service Value from a Spatiotemporal Variation Perspective in a Mountain-Hill-Plain Region. Forests 2023, 14, 2446. [Google Scholar] [CrossRef] [Scilit]
  48. Xie, G.; Zhang, C.; Zhang, L.; Chen, W.; Li, S. Improvement of the evaluation method for ecosystem service value based on per unit area. J. Nat. Resour. 2015, 30, 1243–1254. (In Chinese) [Google Scholar]
  49. Zhao, Y.; Zhang, X.; Wu, Q.; Huang, J.; Ling, F.; Wang, L. Characteristics of spatial and temporal changes in ecosystem service value and threshold effect in Henan along the Yellow River, China. Ecol. Indic. 2024, 166, 112531. [Google Scholar] [CrossRef] [Scilit]
  50. Xie, G.; Zhen, L.; Lu, C.; Xiao, Y.; Chen, C. Expert knowledge based valuation method of ecosystem services in China. J. Nat. Resour. 2008, 23, 911–919. (In Chinese) [Google Scholar]
  51. Li, Y.; Fan, P.; Liu, Y. What makes better village development in traditional agricultural areas of China? Evidence from long-term observation of typical villages. Habitat Int. 2019, 83, 111–124. [Google Scholar] [CrossRef] [Scilit]
  52. Fan, L.; Cai, T.; Wen, Q.; Han, J.; Wang, S.; Wang, J.; Yin, C. Scenario simulation of land use change and carbon storage response in Henan Province, China: 1990–2050. Ecol. Indic. 2023, 154, 110660. [Google Scholar] [CrossRef] [Scilit]
  53. Pengfei, G.; Fangfang, Z.; Haiying, W. The response of ecosystem service value to land use change in the middle and lower Yellow River: A case study of the Henan section. Ecol. Indic. 2022, 140, 109019. [Google Scholar] [CrossRef] [Scilit]
  54. Song, W.; Deng, X. Land-use/land-cover change and ecosystem service provision in China. Sci. Total Environ. 2017, 576, 705–719. [Google Scholar] [CrossRef] [Scilit] [PubMed]
  55. Xiong, C.; Ren, H.; Xu, D.; Gao, Y. Spatial scale effects on the value of ecosystem services in China’s terrestrial area. J. Environ. Manag. 2024, 366, 121745. [Google Scholar] [CrossRef] [Scilit]
  56. Hu, J.; Qiu, S.; Luo, N.; Qing, G.; Huang, C. Multi-Dimensional Spatial and Temporal Variations of Ecosystem Service Values in the Li River Basin, 1990–2020. Remote Sens. 2023, 15, 2996. [Google Scholar] [CrossRef] [Scilit]
  57. Cai, T.; Zhang, X.; Xia, F.; Zhang, Z.; Yin, J.; Wu, S. The Process-Mode-Driving Force of Cropland Expansion in Arid Regions of China Based on the Land Use Remote Sensing Monitoring Data. Remote Sens. 2021, 13, 2949. [Google Scholar] [CrossRef] [Scilit]
  58. Jiang, Z.; Li, Y.; Wu, H.; Mohamed Shariff, A.R.B.; Zhou, H.; Fan, K. Unveiling the impacts of climate change and human activities on land-use evolution in ecologically fragile urbanizing areas: A case study of China’s Central Plains urban agglomeration. Ecol. Indic. 2024, 169, 112936. [Google Scholar] [CrossRef] [Scilit]
  59. Zu, J.; Hao, J.; Chen, L.; Zhang, Y.; Wang, J.; Kang, L.; Guo, J. Analysis on trinity connotation and approach to protect quantity quality and ecology of cultivated land. J. China Agric. Univ. 2018, 23, 84–95. (In Chinese) [Google Scholar]
Figure 1. Overview of the study area. (a) The location of Henan Province in China. (b) The administrative divisions of prefectural cities and DEM in Henan Province. (c) The current situation of land use in Henan Province in 2020.
Land 15 00260 g001
Figure 2. Technical flowchart. Note: 1. The symbol “#” in the table indicates that the corresponding data is an important component of the total or aggregate. For example, under the major category of “Cereal”, the items marked as “#Rice” and “#Wheat” represent key components of cereal, and their data are included in the total figure for “Cereal”. 2.The interfaces corresponding to “DEM data” and “socio-economic statistics data” in the figure are sourced from the pages of the Geospatial Data Cloud website (http://www.gscloud.cn) and the official platform of Henan Statistical Yearbook (https://tjj.henan.gov.cn/tjfw/tjcbw/tjnj/), respectively. These platform interfaces contain content in Chinese.
Land 15 00260 g002
Figure 3. The evolution of spatial and temporal patterns of UAES in Henan Province from 1980 to 2020.
Land 15 00260 g003
Figure 4. The structural evolution of UAES in various prefecture-level cities of Henan Province from 1980 to 2020.
Land 15 00260 g004
Figure 5. The transfer string diagram of UAES in Henan Province from 1980 to 2020.
Land 15 00260 g005
Figure 6. The transfer map of UAES competition in Henan Province from 1980 to 2020 and the contribution rate of prefecture-level cities to its transfer. Note: Codes 1–3 represent urban space, agricultural space, and ecological space, respectively. Two-digit codes indicate a change in the type of national land space from the former to the latter. For example, code “21” indicates a change in national land space from agricultural space to urban space, the same applies in the following text. Numbers 1–7 represent the 7 regions in Henan Province where the spatial transformation of the three zones is relatively significant.
Land 15 00260 g006
Figure 7. The Moran’s I scatter plot of ESV in Henan Province at different spatial scales.
Land 15 00260 g007
Figure 8. Distribution differences of ESV in Henan Province at different spatial scales.
Land 15 00260 g008
Figure 9. Spatial distribution of ESV in Henan Province from 1980 to 2020.
Land 15 00260 g009
Figure 10. The rise and fall chart of ESV in Henan Province from 1980 to 2020. Note: Numbers 1–5 in the figure represent the five regions in Henan Province where the changes in ecosystem service value (ESV) are most prominent.
Land 15 00260 g010
Figure 11. Changes in resident population and grain production in Henan Province from 1980 to 2020. (a) Trends in resident population and urbanization rate; (b) Trends in grain output and its national contribution ratio.
Land 15 00260 g011
Table 1. UAES classification system.
Types of Territorial Functional SpacesTypes of Secondary Land Use
Urban space51 Town land
53 Other construction land
Agricultural space52 Rural settlements
11 Paddy field, 12 Dry land
Ecological space21 Closed woodland, 22 Shrubbery
23 Open woodland, 24 Other woodland
31 High coverage grassland
32 Medium coverage grassland, 33 Low coverage grassland
41 Canals, 42 Lakes, 43 Reservoir pits
45 Mudflat, 46 Beach land
61 Sandy land, 63 Saline-alkali land, 64 Marshland
65 Bare land, 66 Bare rock texture
Table 2. Ecological service value equivalent per unit area of the ecosystem in Henan Province. (unit: USD/hm2) (2020 prices).
Service
Type Categories
Service Type
Subcategories
CroplandForestGrasslandWetlandRiver/LakeDesert
PSFood production243.0680.21104.5287.50128.824.86
Raw material production94.79724.3287.5058.3385.079.72
RSGas regulation175.001050.02364.59585.77123.9614.58
Climate regulation235.77989.25379.173293.46500.7031.60
Hydrological regulation187.16994.12369.453266.734562.2417.01
Waste decomposition337.8518.06320.843500.063609.4463.20
SSSoil conservation357.30977.10544.45483.6999.6541.32
Biodiversity protection247.921096.20454.52896.89833.7097.22
CSProvide esthetic landscape41.32505.56211.461139.951079.1958.33
Total1920.176834.852836.5113,312.4011,022.77337.85
Note: Provision services (PS); Regulatory services (RS); Support services (SS); and Cultural services (CS).
Table 3. Correspondence between Territorial Functional Space, Ecosystem and Secondary Land Use Types.
Types of Territorial Functional SpacesTypes of EcosystemsTypes of Secondary Land Use
1 Urban spaceConstruction ecosystem51 Town land
53 Other construction land
2 Agricultural spaceConstruction ecosystem52 Rural settlements
Cropland ecosystem11 Paddy field
12 Dry land
3 Ecological spaceForest ecosystem21 Closed woodland
22 Shrubbery
23 Open woodland
24 Other woodland
Grassland ecosystem31 High coverage grassland
32 Medium coverage grassland
33 Low coverage grassland
Wetland ecosystem45 Mudflat
46 Beach land
64 Marshland
River/lake ecosystem41 Canals
42 Lakes
43 Reservoir pits
Desert ecosystem61 Sandy land
63 Saline-alkali land
65 Bare land
66 Bare rock texture
Note: (1) Cultivated land in agricultural space belongs to Cropland ecosystem, while rural residential land belongs to construction ecosystem. (2) The dataset of land use remote sensing monitoring provided by the Resource and Environmental Science and Data Center of Chinese Academy of Sciences includes 25 secondary land use types, but only 22 of them are involved in Henan province.
Table 4. Statistics on the structural change of UAES in Henan Province from 1980 to 2020.
Type of SpaceUrban SpaceAgricultural SpaceEcological Space
Area
(km2)
Percentage
(%)
Area
(km2)
Percentage
(%)
Area
(km2)
Percentage
(%)
19801411.840.85122,815.8974.1441,427.4025.01
19901636.410.99122,634.1874.0341,384.5424.98
20002679.301.62122,880.7574.1840,095.0824.20
20104527.982.73121,081.9373.0940,045.2224.17
20206377.723.85118,966.1471.8240,311.2724.33
Table 5. Changes in ESV caused by UAES competition in Henan Province from 1980 to 2020.
Types of Territorial Space TransferService TypesThe Change of ESV (×106 USD)
1980–19901990–20002000–20102010–20201980–2020
12PS0.060.028.951.933.03
RS0.160.0524.795.348.38
SS0.110.0316.043.455.42
CS0.010.001.090.240.37
Total0.330.0950.8810.9517.21
13PS0.000.001.270.880.85
RS0.040.0335.0110.6723.18
SS0.010.015.192.803.41
CS0.000.004.301.392.88
Total0.050.0545.7815.7430.33
21PS−7.62−28.13−56.38−57.40−142.94
RS−21.10−77.90−156.16−159.00−395.92
SS−13.64−50.38−101.00−102.83−256.06
CS−0.93−3.44−6.90−7.02−17.48
Total−43.29−159.85−320.44−326.26−812.41
23PS−0.62−0.6533.4922.0451.59
RS69.26160.78905.54427.271061.32
SS3.3916.68193.78103.50255.70
CS9.6221.00132.7365.05160.11
Total84.36197.801265.54617.861528.73
31PS−0.05−1.27−8.48−3.61−13.71
RS−0.51−11.84−79.90−38.12−129.10
SS−0.15−4.66−28.23−12.07−47.12
CS−0.07−1.56−10.61−5.03−16.99
Total−0.78−19.34−127.22−58.84−206.92
32PS1.687.28−27.21−21.00−36.81
RS−123.40−667.97−627.75−223.46−1154.26
SS−10.43−92.87−179.89−83.13−300.44
CS−15.42−91.89−95.78−36.21−171.73
Total−147.57−845.44−930.64−363.80−1663.24
Total−106.90−826.68−16.10−104.35−1106.31
Disclaimer/Publisher’s Note: The statements, opinions and data contained in all publications are solely those of the individual author(s) and contributor(s) and not of MDPI and/or the editor(s). MDPI and/or the editor(s) disclaim responsibility for any injury to people or property resulting from any ideas, methods, instructions or products referred to in the content.