Analysis of Spatiotemporal Changes and Driving Forces of Ecological Environment Quality in the Chang–Zhu–Tan Metropolitan Area Based on the Modified Remote Sensing Ecological Index

Abstract
1. Introduction
2. Materials and Methods
2.1. Research Area
2.2. Data Sources and Preprocessing
2.3. Research Methods
2.3.1. MRSEI Model
- (1)
- Greenness: Represents vegetation coverage and serves as an indicator of urban green space and plant health, typically measured by the Normalized Difference Vegetation Index (NDVI).
- (2)
- Humidity: Reflects the moisture content in the landscape, which is crucial for understanding environmental resilience and the health of urban ecosystems. It is represented by the third component of the K-T transformation (K-T transformation).
- (3)
- Dryness: Reflects the water stress in urban areas, highlighting regions that may be more vulnerable to drought or water scarcity. It is comprehensively represented by the Building Index (IBI) and the Soil Index (SI).
- (4)
- Heat: Pertains to the urban heat island effect, focusing on understanding extreme temperature values and their impact on human health and ecosystem well-being. This is represented by the Land Surface Temperature (LST).
- (5)
- Purity: Indicates the concentration of PM2.5 particulate matter in urban areas. It is represented by the difference between the red light and near-infrared bands.
2.3.2. MRSEI Trend Analysis
2.3.3. Optimal Parameter-Based Geographical Detectors Model
3. Results and Analysis
3.1. Rationale Analysis for MRSEI
3.2. Comparative Analysis of MRSEI and RSEI
3.3. Spatiotemporal Changes in EEQ
3.4. Trend Analysis of EEQ
3.5. Analysis of MRSEI–Influencing Factors
4. Discussion
4.1. Applicability Evaluation of the MRSEI Model
4.2. Spatiotemporal Variation Characteristics of EEQ
4.3. Driving Factors of EEQ
5. Conclusions
- (1)
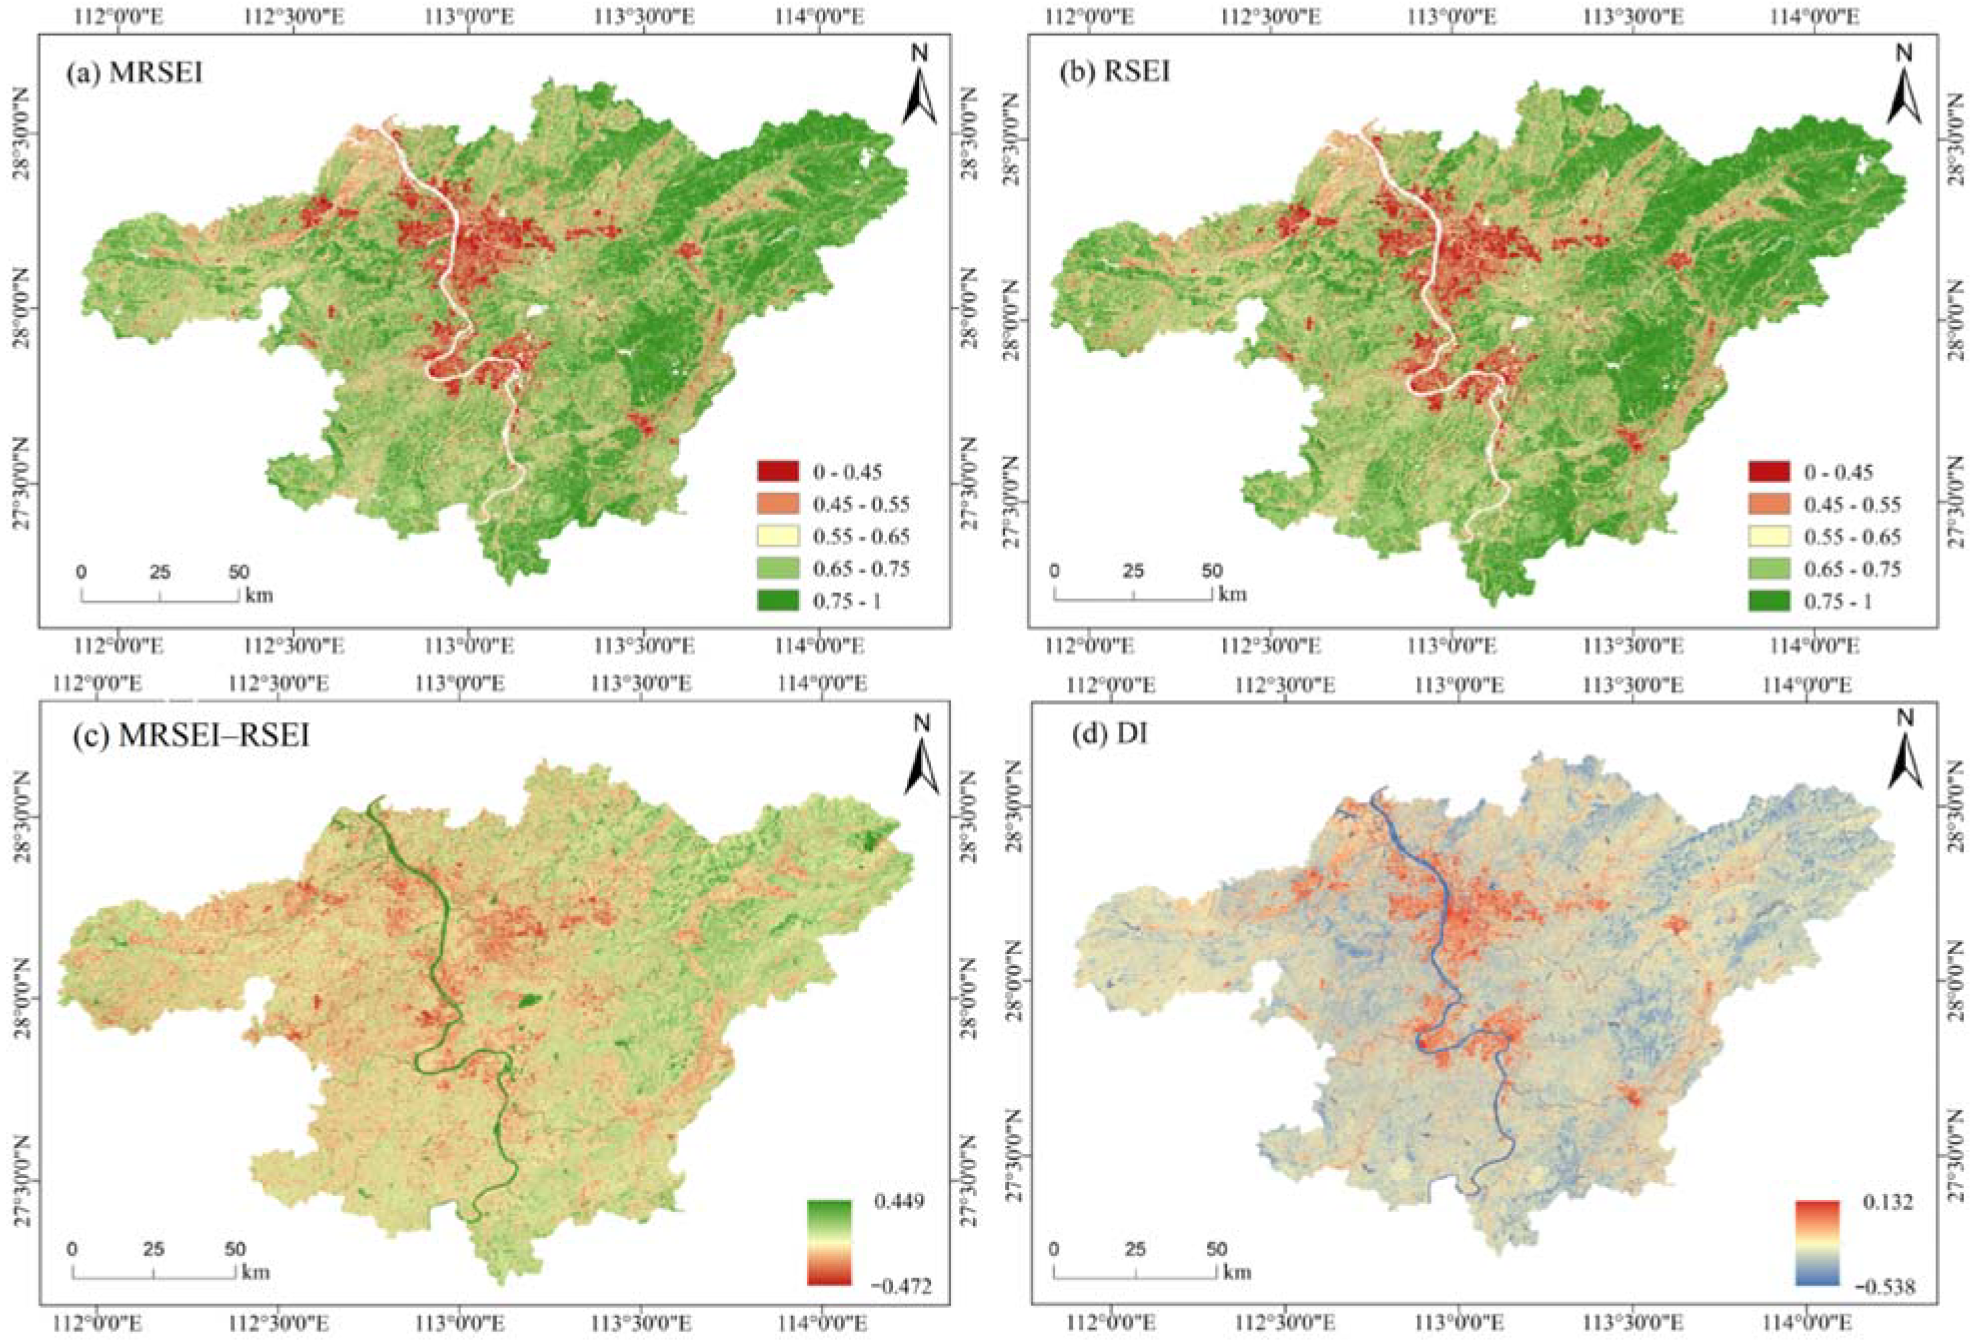
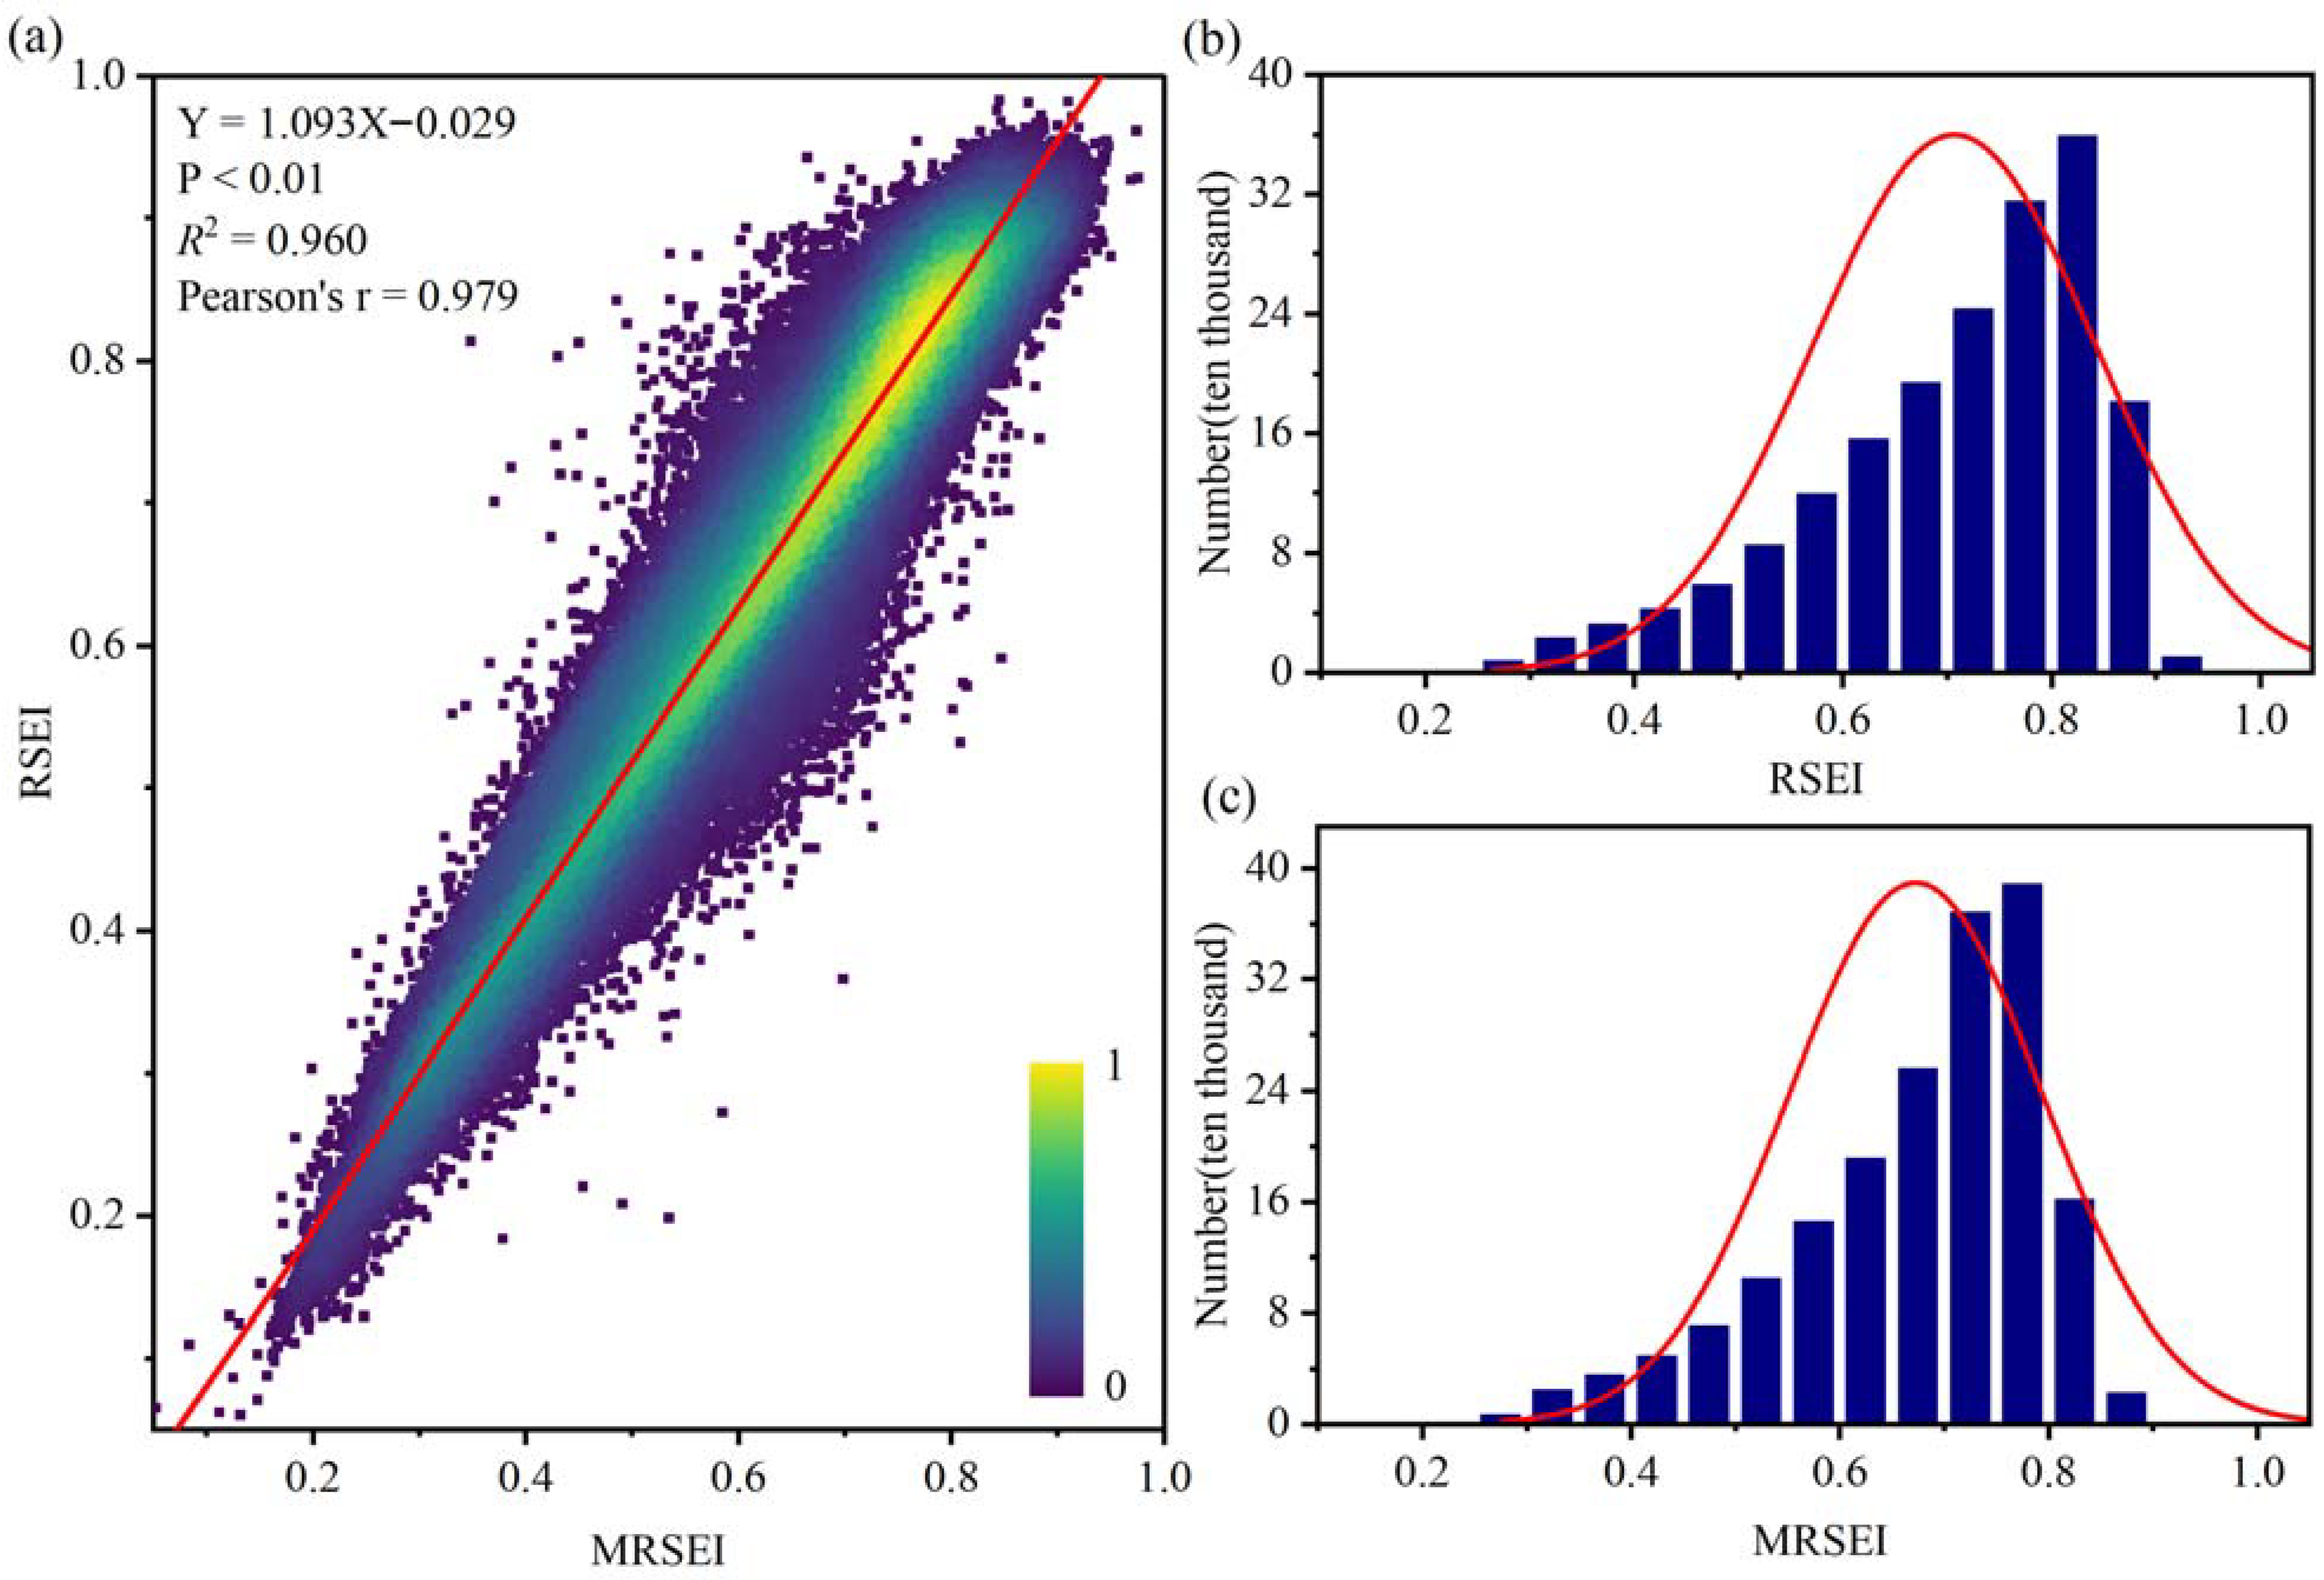
- The MRSEI effectively integrates five key indicators: greenness, humidity, dryness, heat, and purity. It not only maintains a high correlation with RSEI but also mirrors the overall ecological status of the Chang–Zhu–Tan Metropolitan Area more clearly. Particularly in regions with frequent human activity, its evaluation results are more consistent with the actual situation. These findings demonstrate good applicability in ecological assessments at the metropolitan and urban cluster scale.
- (2)
- From 2002 to 2022, the EEQ remained overall good in the Chang–Zhu–Tan Metropolitan Area. The spatial distribution generally followed a pattern of “better in peripheral areas, worse in central areas”. The area of the Chang–Zhu–Tan Metropolitan Area with “excellent” and “good” EEQ accounted for more than 60% on average. The shift to a green development concept has transformed the city’s unregulated expansion model, ultimately leading to an overall MRSEI trend of decline followed by recovery in the study area.
- (3)
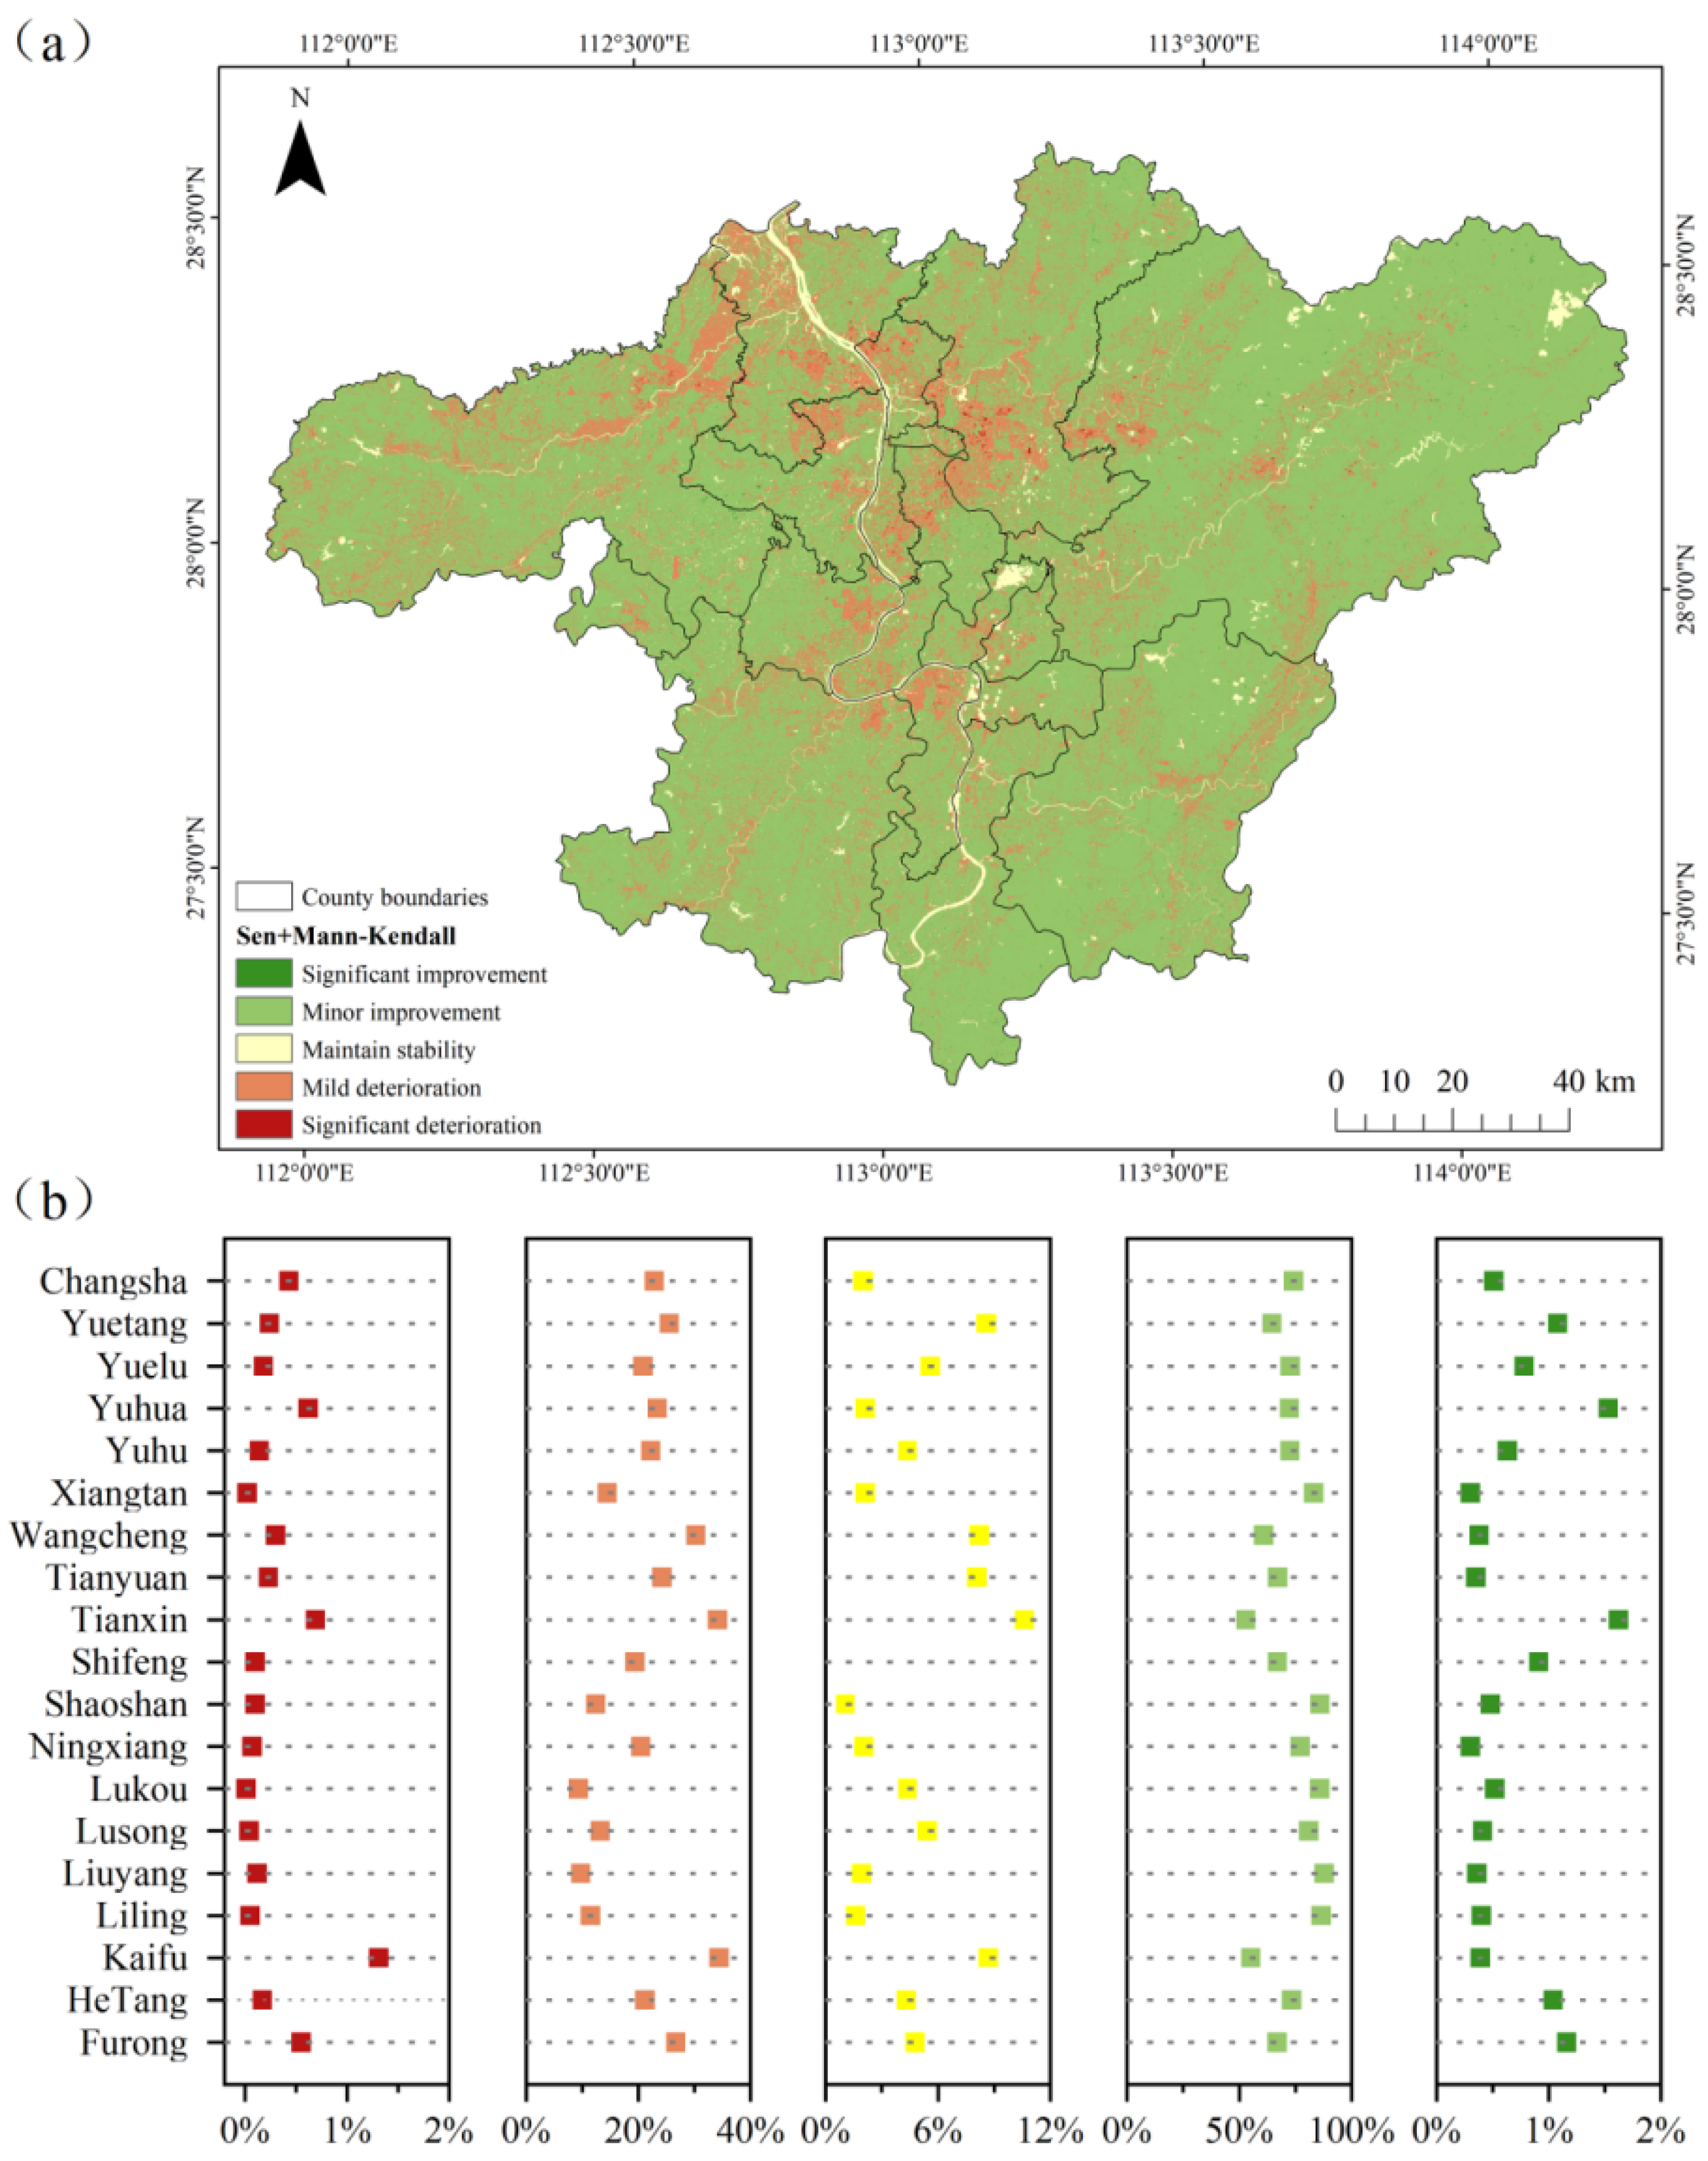
- Although some localized degradation has occurred, linear regression analysis suggests that the ecological environment of the study area has primarily ameliorated. Significant degradation is predominantly concentrated in the central urban areas with high levels of urbanization, large population density, and intensive industrial and agricultural activities. Ecological stability in these areas is characterized by high volatility and poor quality.
- (4)
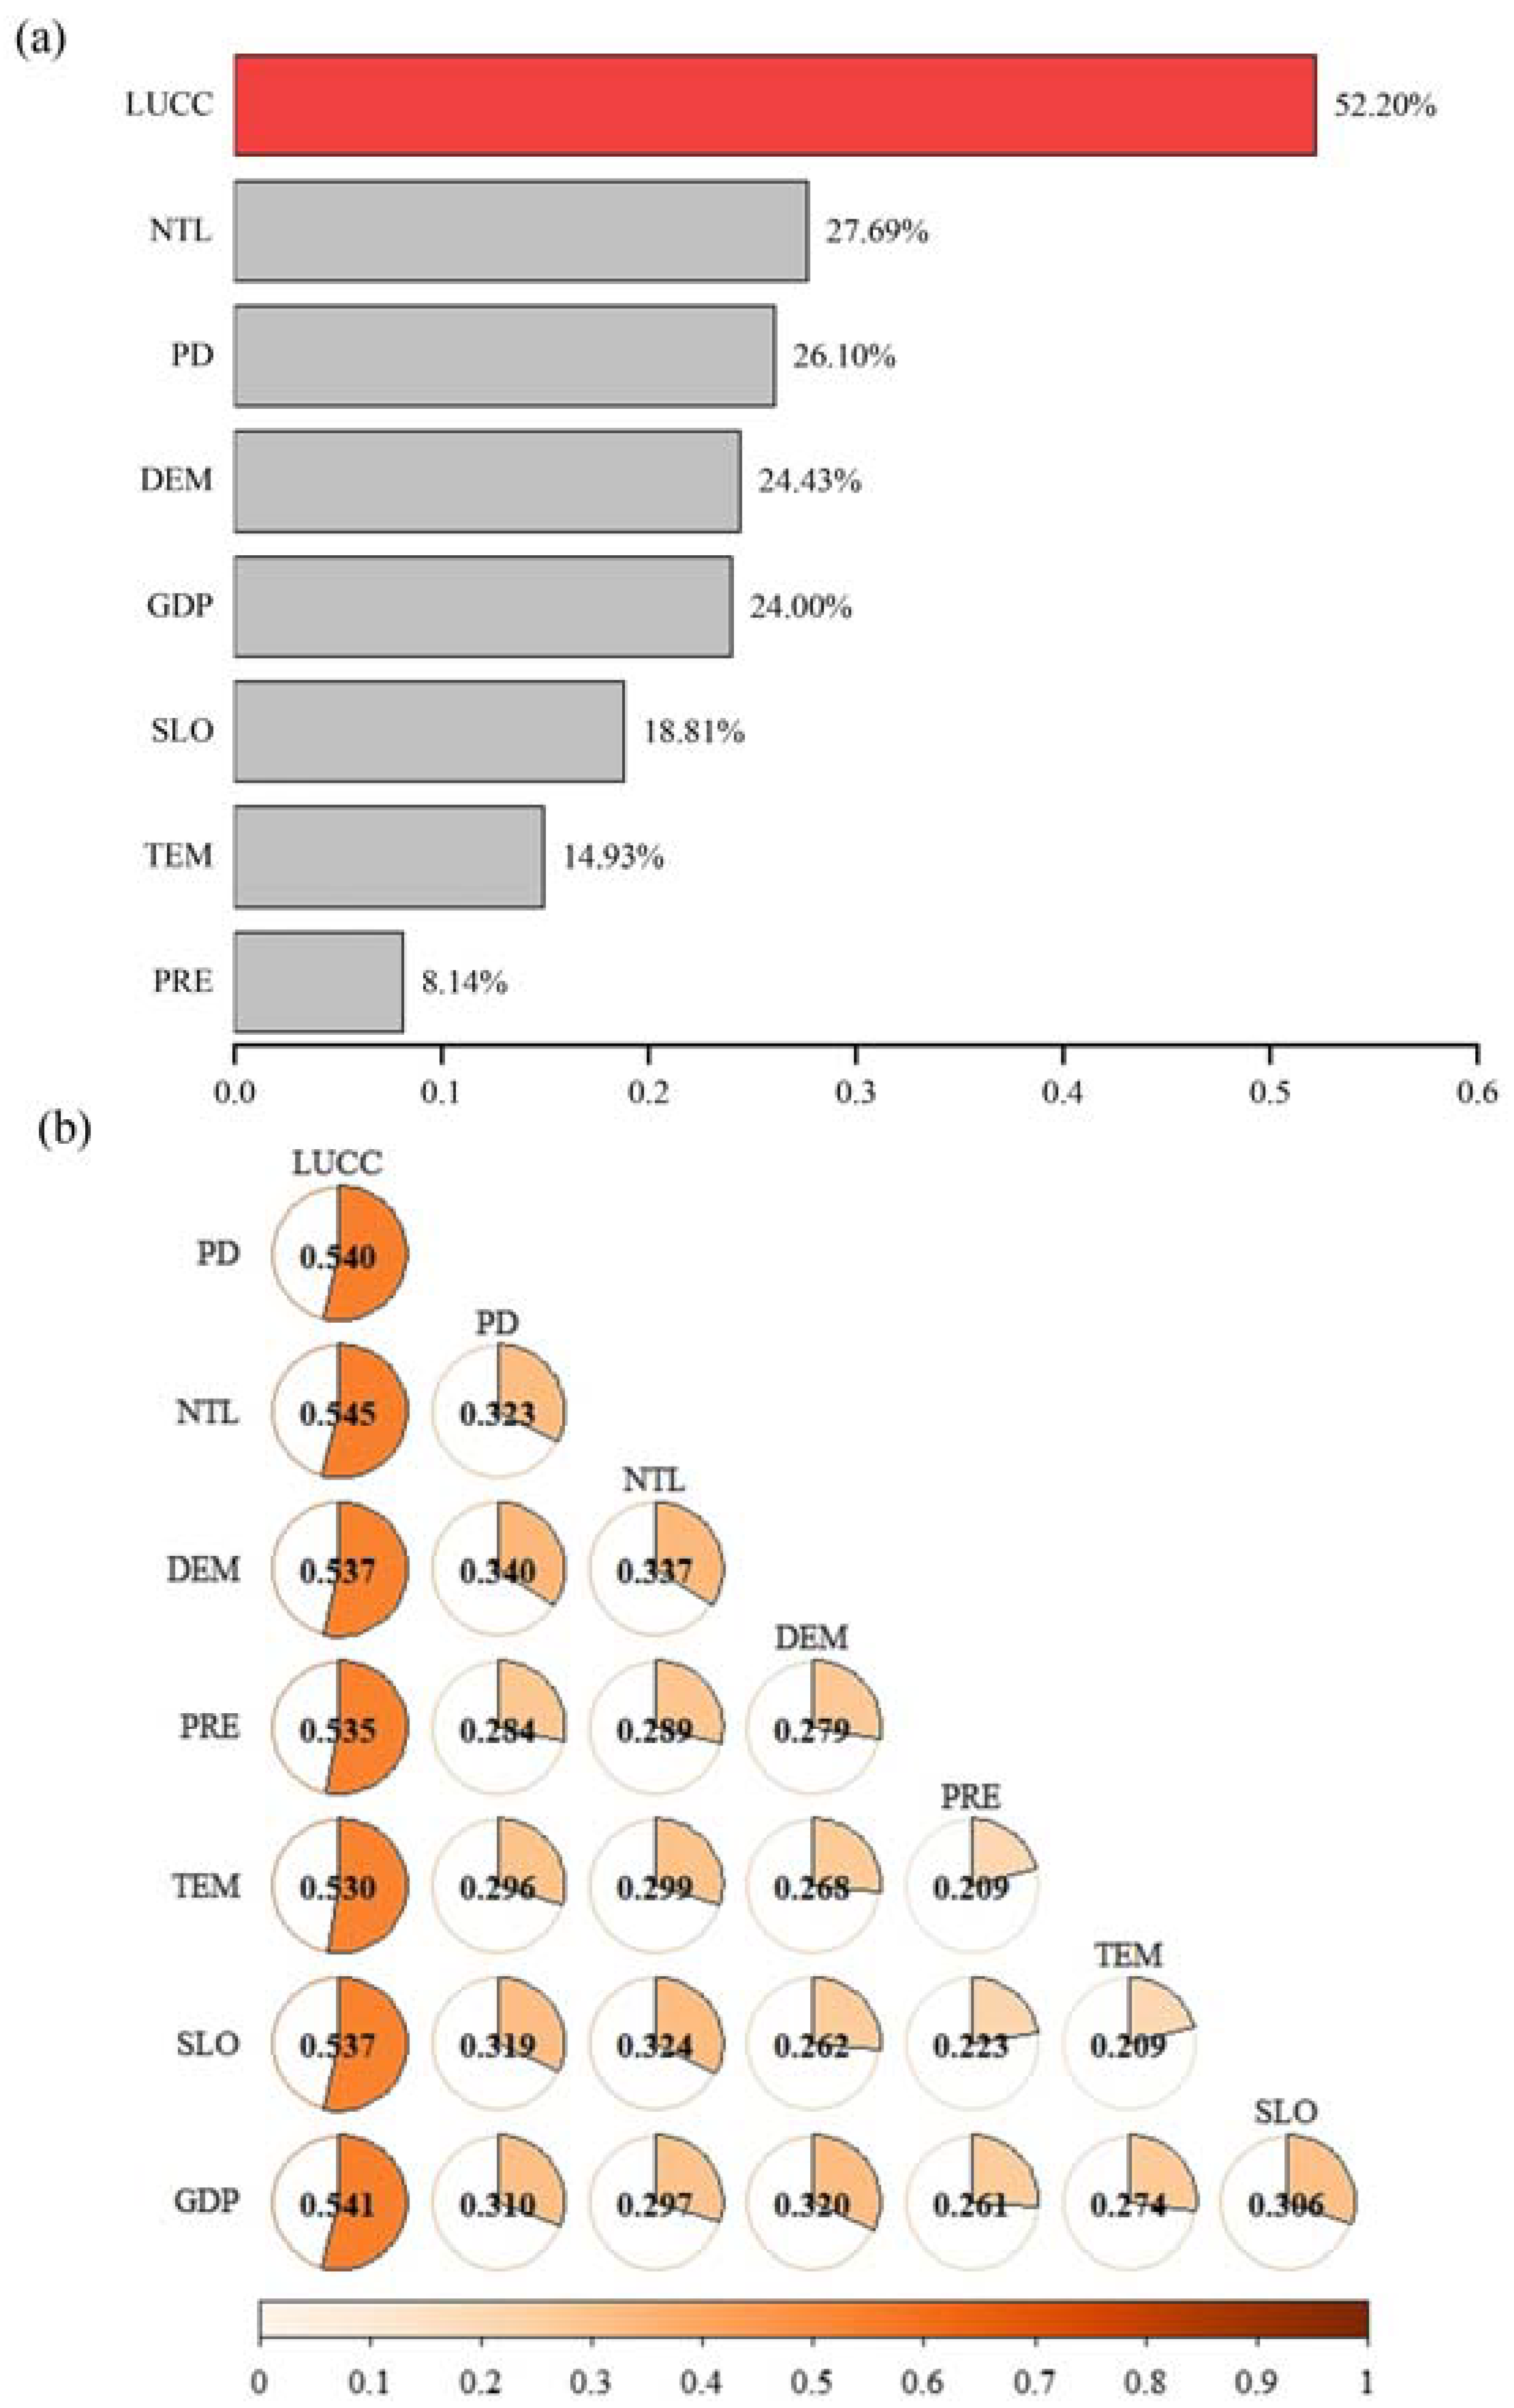
- The OPGD analysis identified a 2 km grid as the optimal spatial scale for this study. This determination accounted for variations in the discretization methods and classification numbers of the driving factors. There is a significant difference in the contribution of driving factors to the evolution of EEQ. Notably, the interaction between natural and human factors has been increasingly pronounced, thereby amplifying their combined impact on ecological quality. Grounded in this finding, it is essential to adequately harness human agency, accurately balance ecological protection with economic development, and leverage projects such as comprehensive land remediation to optimize land spatial structures. This endeavor will be advantageous for us to facilitate gradual reinforcements and systematic restoration of regional ecological environments.
Author Contributions
Funding
Data Availability Statement
Acknowledgments
Conflicts of Interest
References
- Mathivanan, M.; Duraisekaran, E. Identification and quantification of localized urban heat island intensity and footprint for Chennai Metropolitan Area during 1988–2023. Environ. Monit. Assess. 2024, 197, 91. [Google Scholar] [CrossRef] [Scilit] [PubMed]
- Jin, A.; Li, H. Spatiotemporal assessment of ecological quality and driving mechanisms in the Beijing metropolitan area. Sci. Rep. 2025, 15, 13136. [Google Scholar] [CrossRef] [Scilit] [PubMed]
- Luo, W.; Bai, H. Urbanization-induced ecological degradation in Midwestern China: An analysis based on an improved ecological footprint model. Resour. Conserv. Recycl. 2018, 137, 113–125. [Google Scholar] [CrossRef] [Scilit]
- Bao, C.; He, D. Scenario Modeling of Urbanization Development and Water Scarcity Based on System Dynamics: A Case Study of Beijing–Tianjin–Hebei Urban Agglomeration, China. Int. J. Environ. Res. Public Health 2019, 16, 3834. [Google Scholar] [CrossRef] [Scilit]
- Huang, H.; Chen, W. Analysis of ecological quality in Lhasa Metropolitan Area during 1990–2017 based on remote sensing and Google Earth Engine platform. J. Geogr. Sci. 2021, 31, 265–280. [Google Scholar] [CrossRef] [Scilit]
- Li, J.; Gong, J. Assessment of Urban Ecological Quality and Spatial Heterogeneity Based on Remote Sensing: A Case Study of the Rapid Urbanization of Wuhan City. Remote Sens. 2021, 13, 4440. [Google Scholar] [CrossRef] [Scilit]
- Xu, C.; Li, B. Spatial-temporal variation, driving mechanism and management zoning of ecological resilience based on RSEI in a coastal metropolitan area. Ecol. Indic. 2024, 158, 111447. [Google Scholar] [CrossRef] [Scilit]
- Elmqvist, T.; Andersson, E. Sustainability and resilience for transformation in the urban century. Nat. Sustain. 2019, 2, 267–273. [Google Scholar] [CrossRef] [Scilit]
- Guo, M.; Zheng, H. Developing multiscale landscape planning to mitigate ecological risks: A case study in Nanjing metropolitan area, China. Environ. Impact Assess. Rev. 2024, 108, 107601. [Google Scholar] [CrossRef] [Scilit]
- Zhang, T.; Hu, Y. Spatiotemporal changes and influencing factors of ecosystem services in the Nanchang metropolitan area, China. Front. Ecol. Evol. 2024, 12, 1470912. [Google Scholar] [CrossRef] [Scilit]
- Ermida, S.L.; Soares, P. Google Earth Engine Open-Source Code for Land Surface Temperature Estimation from the Landsat Series. Remote Sens. 2020, 12, 1471. [Google Scholar] [CrossRef] [Scilit]
- Estoque, R.C. A Review of the Sustainability Concept and the State of SDG Monitoring Using Remote Sensing. Remote Sens. 2020, 12, 1770. [Google Scholar] [CrossRef] [Scilit]
- Xu, H.; Wang, M. Prediction of ecological effects of potential population and impervious surface increases using a remote sensing based ecological index (RSEI). Ecol. Indic. 2018, 93, 730–740. [Google Scholar] [CrossRef] [Scilit]
- Peng, W.; Kuang, T. Quantifying influences of natural factors on vegetation NDVI changes based on geographical detector in Sichuan, western China. J. Clean. Prod. 2019, 233, 353–367. [Google Scholar] [CrossRef] [Scilit]
- Huang, S.; Tang, L. A commentary review on the use of normalized difference vegetation index (NDVI) in the era of popular remote sensing. J. For. Res. 2021, 32, 2719. [Google Scholar] [CrossRef] [Scilit]
- Wang, J.; Wang, W. Soil Moisture and Salinity Inversion Based on New Remote Sensing Index and Neural Network at a Salina-Alkaline Wetland. Water 2021, 13, 2762. [Google Scholar] [CrossRef] [Scilit]
- Hu, X.; Xu, H. A new remote sensing index for assessing the spatial heterogeneity in urban ecological quality: A case from Fuzhou city, China. Ecol. Indic. 2018, 89, 11–21. [Google Scholar] [CrossRef] [Scilit]
- Jiang, J.; Tian, G. Analysis of the impact of Land use/Land cover change on Land Surface Temperature with Remote Sensing. Procedia Environ. Sci. 2010, 2, 571–575. [Google Scholar] [CrossRef] [Scilit]
- Li, Z.-L.; Tang, B.-H. Satellite-derived land surface temperature: Current status and perspectives. Remote Sens. Environ. 2013, 131, 14–37. [Google Scholar] [CrossRef] [Scilit]
- Wang, J.; Liu, D. Development of a large-scale remote sensing ecological index in arid areas and its application in the Aral Sea Basin. J. Arid. Land 2021, 13, 40–55. [Google Scholar] [CrossRef] [Scilit]
- Lu, Y.; Li, J. Evaluating Sustainable Development in the Middle and Lower Reaches of the Yellow River Basin Using Multiple Data Sources. IEEE Trans. Geosci. Remote Sens. 2025, 63, 4502116. [Google Scholar] [CrossRef] [Scilit]
- Chen, W.; Wang, J. Detecting Long-Term Series Eco-Environmental Quality Changes and Driving Factors Using the Remote Sensing Ecological Index with Salinity Adaptability (RSEISI): A Case Study in the Tarim River Basin, China. Land 2023, 12, 1309. [Google Scholar] [CrossRef] [Scilit]
- Cai, C.; Li, J. Long-Term Ecological and Environmental Quality Assessment Using an Improved Remote-Sensing Ecological Index (IRSEI): A Case Study of Hangzhou City, China. Land 2024, 13, 1152. [Google Scholar] [CrossRef] [Scilit]
- Zhang, X.; Fan, H. Identifying regional eco-environment quality and its influencing factors: A case study of an ecological civilization pilot zone in China. J. Clean. Prod. 2024, 435, 140308. [Google Scholar] [CrossRef] [Scilit]
- Feng, H.; Feng, Z.; Feng, H. One New Method of PM2.5 Concentration Inversion Based on Difference Index. Spectrosc. Spectr. Anal. 2018, 38, 3012–3016. [Google Scholar] [CrossRef]
- Wang, Y.; Liu, P.; Liu, J.; Zhang, D.; Wang, L.; Huang, L. Analysis of spatiotemporal changes in ecological environment quality of the yellow river delta based on modified remote sensing ecological index. J. Ecol. Rural Environ. 2024, 40, 1179–1190. [Google Scholar] [CrossRef]
- Wang, J.-F.; Zhang, T.-L. A measure of spatial stratified heterogeneity. Ecol. Indic. 2016, 67, 250–256. [Google Scholar] [CrossRef] [Scilit]
- Geng, J.; Yu, K. Analysis of Spatiotemporal Variation and Drivers of Ecological Quality in Fuzhou Based on RSEI. Remote Sens. 2022, 14, 4900. [Google Scholar] [CrossRef] [Scilit]
- Wang, J.F.; Li, X.H. Geographical Detectors-Based Health Risk Assessment and its Application in the Neural Tube Defects Study of the Heshun Region, China. Int. J. Geogr. Inf. Sci. 2010, 24, 107–127. [Google Scholar] [CrossRef] [Scilit]
- Wang, J.-F.; Hu, Y. Environmental health risk detection with GeogDetector. Environ. Model. Softw. 2012, 33, 114–115. [Google Scholar] [CrossRef] [Scilit]
- Ju, H.; Zhang, Z. Driving forces and their interactions of built-up land expansion based on the geographical detector—A case study of Beijing, China. Int. J. Geogr. Inf. Sci. 2016, 30, 2188–2207. [Google Scholar] [CrossRef] [Scilit]
- Song, T.; Cheng, Y. Spatial difference and mechanisms of influence of geo-economy in the border areas of China. J. Geogr. Sci. 2017, 27, 1463–1480. [Google Scholar] [CrossRef] [Scilit]
- Zuo, S.; Dai, S. Determining the Mechanisms that Influence the Surface Temperature of Urban Forest Canopies by Combining Remote Sensing Methods, Ground Observations, and Spatial Statistical Models. Remote Sens. 2018, 10, 1814. [Google Scholar] [CrossRef] [Scilit]
- Gao, F.; Li, S. Understanding the modifiable areal unit problem in dockless bike sharing usage and exploring the interactive effects of built environment factors. Int. J. Geogr. Inf. Sci. 2021, 35, 1905–1925. [Google Scholar] [CrossRef] [Scilit]
- Liu, C.; Li, W. Quantitative spatial analysis of vegetation dynamics and potential driving factors in a typical alpine region on the northeastern Tibetan Plateau using the Google Earth Engine. CATENA 2021, 206, 105500. [Google Scholar] [CrossRef] [Scilit]
- Song, Y.; Wang, J. An optimal parameters-based geographical detector model enhances geographic characteristics of explanatory variables for spatial heterogeneity analysis: Cases with different types of spatial data. GISci. Remote Sens. 2020, 57, 593–610. [Google Scholar] [CrossRef] [Scilit]
- Yi, C.; Wang, Z. Study on the Coupling Degree of Urban Virtual and Substantive Vitality from the Perspective of “Scale-Vitality”—Taking the Changsha-Zhuzhou-Xiangtan Metropolitan Area as an Example. Sustainability 2025, 17, 5059. [Google Scholar] [CrossRef] [Scilit]
- Ghosh, S.; Kumar, D. Cloud-based large-scale data retrieval, mapping, and analysis for land monitoring applications with Google Earth Engine (GEE). Environ. Chall. 2022, 9, 100605. [Google Scholar] [CrossRef] [Scilit]
- Liu, L.; Jensen, M.B. Green infrastructure for sustainable urban water management: Practices of five forerunner cities. Cities 2018, 74, 126–133. [Google Scholar] [CrossRef] [Scilit]
- Yang, X.; Meng, F. Spatiotemporal change and driving factors of the Eco-Environment quality in the Yangtze River Basin from 2001 to 2019. Ecol. Indic. 2021, 131, 108214. [Google Scholar] [CrossRef] [Scilit]
- Shi, C.; Zhu, X. Assessment of urban ecological resilience and its influencing factors: A case study of the Beijing-Tianjin-Hebei urban agglomeration of China. Land 2022, 11, 921. [Google Scholar] [CrossRef] [Scilit]
- Chai, H.; Zhao, Y. Analysis of Ecological Environment in the Shanxi Section of the Yellow River Basin and Coal Mining Area Based on Improved Remote Sensing Ecological Index. Sensors 2024, 24, 6560. [Google Scholar] [CrossRef] [Scilit] [PubMed]
- Yan, J.; Zhang, G. Comparison of time-integrated NDVI and annual maximum NDVI for assessing grassland dynamics. Ecol. Indic. 2022, 136, 108611. [Google Scholar] [CrossRef] [Scilit]
- Estoque, R.C.; Murayama, Y. Effects of landscape composition and pattern on land surface temperature: An urban heat island study in the megacities of Southeast Asia. Sci. Total Environ. 2017, 577, 349–359. [Google Scholar] [CrossRef] [Scilit]
- Zheng, Z.; Wu, Z. Exploration of eco-environment and urbanization changes in coastal zones: A case study in China over the past 20 years. Ecol. Indic. 2020, 119, 106847. [Google Scholar] [CrossRef] [Scilit]
- An, M.; Xie, P. Local and tele-coupling development between carbon emission and ecologic environment quality. J. Clean. Prod. 2023, 394, 136409. [Google Scholar] [CrossRef] [Scilit]
- Li, W.; Samat, A. Spatiotemporal Pattern, Evolutionary Trend, and Driving Forces Analysis of Ecological Quality in the Irtysh River Basin (2000–2020). Land 2024, 13, 222. [Google Scholar] [CrossRef] [Scilit]
- Zhang, X.; Gao, Z. Eco-Environment Quality Response to Climate Change and Human Activities on the Loess Plateau, China. Land 2023, 12, 1792. [Google Scholar] [CrossRef] [Scilit]
- Ding, Y.; Zhang, M. Using the geographical detector technique to explore the impact of socioeconomic factors on PM2.5 concentrations in China. J. Clean. Prod. 2019, 211, 1480–1490. [Google Scholar] [CrossRef] [Scilit]
- Luo, L.; Mei, K. Assessment of the Geographical Detector Method for investigating heavy metal source apportionment in an urban watershed of Eastern China. Sci. Total Environ. 2019, 653, 714–722. [Google Scholar] [CrossRef] [Scilit]
- Duan, Q.; Tan, M. Using a geographical detector to identify the key factors that influence urban forest spatial differences within China. Urban For. Urban Green. 2020, 49, 126623. [Google Scholar] [CrossRef] [Scilit]
- Zhao, X.; Tan, S. Quantitative analysis of fractional vegetation cover in southern Sichuan urban agglomeration using optimal parameter geographic detector model, China. Ecol. Indic. 2024, 158, 111529. [Google Scholar] [CrossRef] [Scilit]
- Zhu, L.; Meng, J. Applying Geodetector to disentangle the contributions of natural and anthropogenic factors to NDVI variations in the middle reaches of the Heihe River Basin. Ecol. Indic. 2020, 117, 106545. [Google Scholar] [CrossRef] [Scilit]




| Data Type | Datasets | Time Periods | Resolution | Source |
|---|---|---|---|---|
| Remote sensing data | Landsat5 | 2002/2007/2012 | 30 m | (http://developers.google.cn/earth-engine/) |
| Landsat8 | 2017/2022 | 30 m | ||
| Topography | SLO | / | 30 m | (http://www.gscloud.cn) |
| DEM | / | 30 m | ||
| Climate | PRE | 2022 | 1 km | (http://www.geodata.cn) |
| TEM | 2022 | 1 km | ||
| Social-economic factors | LUCC | 2022 | 30 m | (http://www.resdc.cn) |
| NTL | 2022 | 1 km | (http://www.geodata.cn) | |
| GDP | 2022 | 1 km | (http://www.resdc.cn) | |
| PD | 2020 | 1 km | (https://www.worldpop.org/) |
| MRSEI Indices | Equations | Reference | ||
|---|---|---|---|---|
| Humidity index | WET | / | WETTM = 0.0315Bblue + 0.2021Bgreen + 0.3102Bred + 0.1594BNIR − 0.6806BSWIR1 − 0.6109BSWIR2 WETOLI = 0.1511Bblue + 0.1973Bgreen + 0.3283Bred + 0.3407BNIR − 0.7117BSWIR1 − 0.4559BSWIR2 | [16] |
| Greenness index | NDVI | Normalized Difference Vegetation Index | NDVI = (BNIR − Bred)/(BNIR + Bred) | [43] |
| Heat index | LST | Land Surface Temperature | LST = Tb/{1 +(λTb/ρ)Inε} − 273.15 | [44] |
| Dryness index | NDBSI | Normalized Difference Built-up and Soil Index | NDBSI = (SI + IBI)/2 SI = [(BSWIR1 + Bred) − (BNIR + Bblue)]/[(BSWIR1 + Bred) + (BNIR + Bblue)] IBI = [2BSWIR1/(BSWIR1 +BNIR) − (BNIR/(BNIR + Bred) + Bgreen/(Bgreen + BSWIR1))]/[2BSWIR1/(BSWIR1 + BNIR) + (BNIR/(BNIR + Bred) + Bgreen/(Bgreen + BSWIR1))] | [17,45] |
| Purity index | DI | Difference Index | DI = Bred − BNIR | [46] |
| Year | PC1 | Eigenvalues | Contribution Rate (%) | ||||
|---|---|---|---|---|---|---|---|
| NDVI | WET | NDBSI | LST | DI | |||
| 2002 | 0.6662 | 0.1540 | −0.4472 | 0.0150 | 0.5765 | 0.0149 | 77.73 |
| 2007 | 0.7077 | 0.0359 | −0.3352 | −0.1013 | −0.6126 | 0.0176 | 80.14 |
| 2012 | 0.8259 | 0.0763 | −0.5055 | −0.0744 | −0.2257 | 0.0188 | 80.78 |
| 2017 | 0.6505 | 0.1082 | −0.0111 | −0.2308 | −0.7154 | 0.0168 | 80.08 |
| 2022 | 0.5901 | 0.1061 | −0.5787 | −0.1930 | −0.5181 | 0.0275 | 83.79 |
Disclaimer/Publisher’s Note: The statements, opinions and data contained in all publications are solely those of the individual author(s) and contributor(s) and not of MDPI and/or the editor(s). MDPI and/or the editor(s) disclaim responsibility for any injury to people or property resulting from any ideas, methods, instructions or products referred to in the content. |
© 2025 by the authors. Licensee MDPI, Basel, Switzerland. This article is an open access article distributed under the terms and conditions of the Creative Commons Attribution (CC BY) license.
Share and Cite
Wang, T.; Chen, B.; Wang, X.; Wang, H.; Song, Z.; Cheng, M. Analysis of Spatiotemporal Changes and Driving Forces of Ecological Environment Quality in the Chang–Zhu–Tan Metropolitan Area Based on the Modified Remote Sensing Ecological Index. Land 2026, 15, 79. https://doi.org/10.3390/land15010079
Wang T, Chen B, Wang X, Wang H, Song Z, Cheng M. Analysis of Spatiotemporal Changes and Driving Forces of Ecological Environment Quality in the Chang–Zhu–Tan Metropolitan Area Based on the Modified Remote Sensing Ecological Index. Land. 2026; 15(1):79. https://doi.org/10.3390/land15010079
Chicago/Turabian StyleWang, Tao, Beibei Chen, Xiying Wang, Hao Wang, Zhen Song, and Ming Cheng. 2026. "Analysis of Spatiotemporal Changes and Driving Forces of Ecological Environment Quality in the Chang–Zhu–Tan Metropolitan Area Based on the Modified Remote Sensing Ecological Index" Land 15, no. 1: 79. https://doi.org/10.3390/land15010079
APA StyleWang, T., Chen, B., Wang, X., Wang, H., Song, Z., & Cheng, M. (2026). Analysis of Spatiotemporal Changes and Driving Forces of Ecological Environment Quality in the Chang–Zhu–Tan Metropolitan Area Based on the Modified Remote Sensing Ecological Index. Land, 15(1), 79. https://doi.org/10.3390/land15010079