1. Introduction
The southwestern United States (US) is predicted to become hotter and drier in the future, with decreased snowpack and precipitation leading to lower soil moisture levels [
1]. More recent predictions for the southwestern US build on this earlier prediction by suggesting increased variability in precipitation, with amplification of summer droughts and winter pluvials [
2]. In fact, a mega-drought appears to be developing for the region based on a 1200-year tree ring reconstruction of summer soil water content, which indicated that 2000–2018 was the second driest 19-year period since 800 CE in North America [
3]. How plants will respond to these changes are not entirely clear, especially in deserts such as the hotter and drier Mojave Desert [
4,
5]. North American deserts are characterized by high plant functional diversity, ranging from fast-growing annuals and ephemerals to highly stress-tolerant evergreen shrubs [
6]. Future work should address this functional diversity and also identify how seedlings and shallow-rooted plants respond to altered precipitation [
7]. During wetter periods in the Intermountain West, deep soil water availability favors deeply rooted woody plants [
8]. However, if precipitation frequency were to become more pulse dominant, or less rainfall occurs more often, grasses and shallower-rooted plants would be favored [
8]. Other studies have assessed the impact of potential increased monsoonal moisture on plant communities by providing supplemental water (irrigations). These studies suggest that seasonal variation in rainfall is important, with plant growth responding mainly to winter precipitation in the summer-dry Mojave Desert [
9], but in the Sonoran Desert, with a distinct summer monsoon, stem elongation was shown to increase with increased summer rainfall [
10].
Some physiological responses of desert plants have been shown to vary with soil types and water availability, with stomatal conductance higher in finer-textured soils than sandy substrates early in the summer [
11]. Plant morphology also contributes to the water use of plants and how plants respond to changes in water availability [
12], with larger tree canopy volumes losing more water to the atmosphere than smaller tree canopies, with the amount of water the trees received affecting their morphology and subsequently their water use. In a similar fashion,
Larrea tridentata (creosote bush) was shown to grow larger when it received more water [
9]. The larger growth requires more water to sustain it, and significant canopy die-back and/or plant mortality could occur if inadequate precipitation continued over a prolonged period. The morphology of roots may also impact how plants use water under varying precipitation regimes.
Larrea tridentata has been reported to produce roots up to three to five meters deep [
13], with these deep roots maintaining physiologically viable vascular tissue during times of drought. Such a deep root system probably contributed to Sandvig and Phillips [
14] observing no downward movement of water moving past the root zone of
Larrea.
Wet winters typically support greater growth during the following spring and summer in the Mojave Desert [
15]. However, if extended drought occurs after wet periods, are plants with larger canopies more vulnerable to stress and mortality if they respond favorably to the rise in water availability associated with wetter periods? Bunting et al. [
16] stressed the importance of identifying legacy effects of precipitation on ecosystem dynamics, demonstrating that the plant response would be directly linked to antecedent climate conditions.
Predictions for precipitation in the southwestern US have great uncertainty attached to them [
17]. Although CMIP6 models predict increasing precipitation in the southwest during the period between 2024 and 2100 [
18], the intensity and frequency of precipitation events have not been adequately characterized. However, a bimodal seasonal distribution pattern is expected to continue to exist in the southwest. Our approach was to apply supplemental water following actual precipitation events, imposing treatments of −25%, 0%, 100% and 200% of actual precipitation while maintaining the bimodal distribution.
A controlled precipitation study (sprinkler irrigation) was conducted to determine desert perennial shrub adjustments to a range in supplemental water under high environmental demand. Four native shrub species of the Mojave Desert were selected for the study: the evergreen shrub Larrea tridentata, and drought-deciduous shrubs Encelia farinosa, Ambrosia dumosa and Ambrosia salsola. Specifically, this study focused on the physiological and morphological responses of native Mojave Desert shrubs to varying water regimes. It was hypothesized that increased amounts of water would impact plant morphology and physiology in a positive way. These simulated precipitation events varied relative to actual precipitation over the two-year period (additional water applied within 24 h of an actual rainfall event), so the timing and frequency of precipitation were the same, with only total amounts varying. We expected that the plants would show a negative response to treatments with less total water added (rain shelters) by decreasing growth, and leaf xylem water potentials and that this would impact how the four perennial shrub species allocated resources between aboveground biomass and seed production, expecting seed production to be reduced under water limiting conditions. The expectation was that plants would down-regulate reproductive growth under water-limiting conditions, with smaller changes in height and canopy volume.
We maintained the experimental plots that received two years of water treatments for an additional 3.8-year period, after the addition of all supplemental water had ended, with plants only receiving actual precipitation during the extended multi-year dry period. We asked the question: Does a wet period have a legacy effect on plant response after an extended low water availability period? To determine if a legacy effect was occurring, we assessed if plants were still alive after the 3.8-year dry period, what level of stress they were under and if the previous supplemental water treatments were influencing the plant response.
2. Methods
A field experiment was conducted to determine the morphological and physiological response of Mojave Desert native shrubs to altered precipitation regimes. We planted four shrub species in April 2018 at the UNLV Center for Urban Water Conservation in North Las Vegas (36.314 N, −115.203 W, 712.41 m elevation). Seeds were obtained from the USGS for the Las Vegas valley ecoregion. Seeds were collected in 2016. Seeds were germinated in 3.8-L nursery containers filled with a soil mix of 60% sand and 40% compost. Seedlings were established under greenhouse conditions (3 months) and then moved outdoors where they received weekly irrigations to support growth and avoid stress. Eighteen-month-old seedlings were transplanted in the field plots in November of 2018 and irrigated weekly during a 2-month establishment period to avoid any plant water stress. Soil at the site was a Las Vegas loam (loamy carbonitic, thermic, shallow, typic petrocalcid). All seedlings survived establishment without replacement The experiment began on 1 January 2019 and was maintained under experimental conditions for a two-year period.
Larrea tridentata, Encelia farinosa, Ambrosia dumosa, and Ambrosia salsola were planted in outdoor experimental gardens in a three-by-four random arrangement with plants spaced 1.5 m apart, with each species replicated three times. Each 3 × 4 plant arrangement plot was surrounded by chicken wire (6.2 m × 6.2 m) to a height of 90 cm to reduce herbivory from Lepus californicus (jack rabbits). All plots were spaced 8 m apart. We assigned twelve plots a percentage of rainfall (−25%, 0, +100%, +200%) with three replicates of each treatment. To achieve the minus 25% rainfall, we constructed rainout shelters consisting of wooden frames (open top and open sides) built over three plots. The wooden structures consisted of wooden posts (3) evenly placed at a height of 1.5 m in the center of the plot and at 1.2 m (3) on the N/S edge of the east and west sides of the plots. Cross beams connected the posts to secure the open framework, which allowed large tarps to be placed over them to intercept rainfall events. The tarps were deployed prior to rainfall events but only if the running total was less than 25% interception. Tarps were never left on for more than one day at a time. The tarps (15 m × 15 m) were secured with concrete blocks. Water trapped on the tarps were removed with a wet dry vacuum system and discharged over 25 m away from the plots. The tarps were 1.3 mm in thickness and glossy white in color reducing incoming PAR by 76%. The 0% treatment received ambient rainfall. The plots receiving additional water (+100% and +200%) were watered by overhead sprinklers the day after a rainfall event. Water used in the experiment was provided from a local well. The electrical conductivity of the well water was 0.4 dSm−1. A tipping bucket rain gage with data logger (CR1000, Campbell Scientific, Logan, UT, USA) measured rainfall, located approximately 50 m to the south of the irrigated plots in a large turfgrass area. During irrigations, five catch-cans were placed on the ground between plants in each plot to catch applied water to assess uniformity. Individual calibration curves (water volume (meter) vs. time) were established for each plot (R2 > 0.90, p < 0.001) for the purpose of applying the irrigation volume to impose the +100% and +200% supplemental water treatments. An additional plot was maintained as a well-watered plot, irrigated three times per week during summer months with adjustments made based on canopy temperatures and leaf xylem water potentials. Plants growing under non-water stressed conditions were required for the plant water stress index calculations.
Plant physiological measurements were taken weekly at midday (1100–1300 h). Canopy temperatures (T
c, 39800 Infrared Thermometer, Cole Palmer, Vernon Hills, IL, USA) were measured along with ambient temperatures (T
a) to obtain T
c − T
a values. Vapor pressure deficits, wind speed, relative humidity, solar radiation, and reference evapotranspiration (Penman-Monteith, Campbell Scientific, Logan, UT, USA) were obtained from the weather station on site. Chlorophyll index values (Field Scout CM1000 Chlorophyll Meter, (unitless), Spectrum Technologies, Aurora, IL, USA) were also taken weekly at midday Leaf xylem water potential (Pressure Chamber, PMS Instruments, Albany, OR, USA) was measured monthly on one plant of each species per plot at midday (1100–1300). Outer most leaves that received direct sunshine were selected for measurement. Unfortunately leaf xylem water potential could not be measured on
Encelia farinosa because of stem succulence which led to stem crushing under pressure within the chamber. A Plant Water Stress Index PWSI [
15] also referred to as a crop water stress index was calculated based on establishing a T
c − T
a vs. VPD curve defining plants under stress and a separate curve for plants not under stress (irrigated). The PWSI (unitless) was calculated following the steps outlined by Wynne-Sison [
15]. Morphological measurements (plant height and canopy width) occurred on a monthly basis. We harvested the seed from each plant every other day for as long as the seeds matured. The seeds were placed in paper bags air dried for 6 months and then weighed on a top loading balance.
Soil water in storage was calculated from soil moisture measurements taken with a PR2 Theta Probe (Dynamax, Houston, TX, USA). The probe was inserted into fiberglass access tubes allowing for soil volumetric water contents to be estimated at depths of 10, 20, 30, 40, 60 and 100 cm next to L. tridentata and E. farinosa plants. Measurements were only taken in one plot of each treatment during the second year (ten times). Volumetric water contents at each depth were assigned a depth increment to calculate soil water in storage over a depth of 120 cm (15 cm, 10 cm, 10 cm, 15 cm, 30 cm, 40 cm). All six storage estimates with depth were then combined to obtain total soil water in storage. Evapotranspiration (ET) was estimated using a hydrologic balance approach; Input minus Output minus change in soil water in Storage. We assumed no drainage because when the soil was sampled on two separate occasions to a depth of 2 m, no elevated soil moisture or roots below one meter were found, as a distinct wetting front was only observed in the 80–100 cm depth (at deeper depths the soil was very light in color with a powder dry consistency).
At the end of two years of imposing the water treatments on the four native desert shrub species, the plants were allowed to continue to live for an additional 3.8-year period with no water treatments imposed. At the end of the extended dry period all plants were assessed if they were dead or alive. Plants were deemed alive if they possessed green leaves within the canopies but also if green tissue was observed when using a razor blade on multiple branches and roots. Because of the 1.5 m spacing, allelopathy was assessed [
19] to determine if the results were being influenced by neighboring plants. As such, the height of each plant and the chlorophyll index relative to the distance from each species to all three Larrea plants in all 12 plots were assessed. Because of time limitations and lack of funding to harvest all of the plants in the 12 experimental plots (144 plants), we selected one plot of each treatment and harvested all 12 plants at the end of the 3.8-year dry period (48 plants), separating aboveground plant material from excavated roots. We recognize that we did not recover all roots (0–75 cm depth) from the perspective of root length and root surface area but we did believe we captured the majority of roots from a mass weight perspective. Only in one case did we have extended roots of
Larrea near the canopy of an adjacent plant. Canopy volumes were assessed at the end of the wet period and at the end of the 3.8-year dry period by measuring height and canopy width [
20]. A single healthy branch from each plant growing in the 12 experimental plots was marked with tape at 10 cm from the tip of the branch at the end of the supplemental water period and replaced as needed over time. 3.8 years later we measured stem elongation past the tape markings. Leaf xylem water potential and chlorophyll index was measured at mid-day in October after the extended dry period.
Data were analyzed using descriptive statistics. In addition, the data were analyzed using analysis of variance to compare treatments and dates for each variable. Normality and equal variance were checked using the Shapiro test and Levene’s test. Tukey HSD was assessed for multiple comparisons to identify significant differences. The Kruskal–Wallis test was performed when the assumption of normality was not met. The Dunn test was used for multiple comparisons on nonnormal data. Linear and multiple regression analysis was used to assess correlations between variables (Sigma plot 12.5, Systat Software 13.2, San Jose, CA, USA; R Core Team 2020). Parameters were included in a backward stepwise regression analysis only if variance inflation factors were less than two and the sum total was less than ten (Systat software 2004). If the variance inflation factor exceeded two, parameters were eliminated, and the regression analysis was rerun.
3. Results
3.1. Growing Conditions
The amount of precipitation occurring in the calendar year of 2019 was 17.1 cm and in 2020 it was 7.4 cm (2.3 times higher in 2019), with the long-term annual average for precipitation of 10.6 cm [
21]. The second year, 2020, had a six-month period from April until October with almost no measurable precipitation, just one event of 0.05 cm. In the −25% treatment, tarps were deployed to intercept 25% of the precipitation on a running total basis. We achieved a 23% reduction in precipitation in 2019 and a 21% reduction in 2020 (
Table 1). The plots with 100% and 200% supplemental water received additional water within 24 h of actual precipitation events using calibration curves established for each plot. We recognize that wind and emitter performance may have contributed to some variation in sprinkler distribution. We were consistent in the approach taken to impose the −25%, 100% and 200% treatments, which enabled us to separate the data based on treatments to run Analysis of Variance.
3.2. Soil Volumetric Water Content
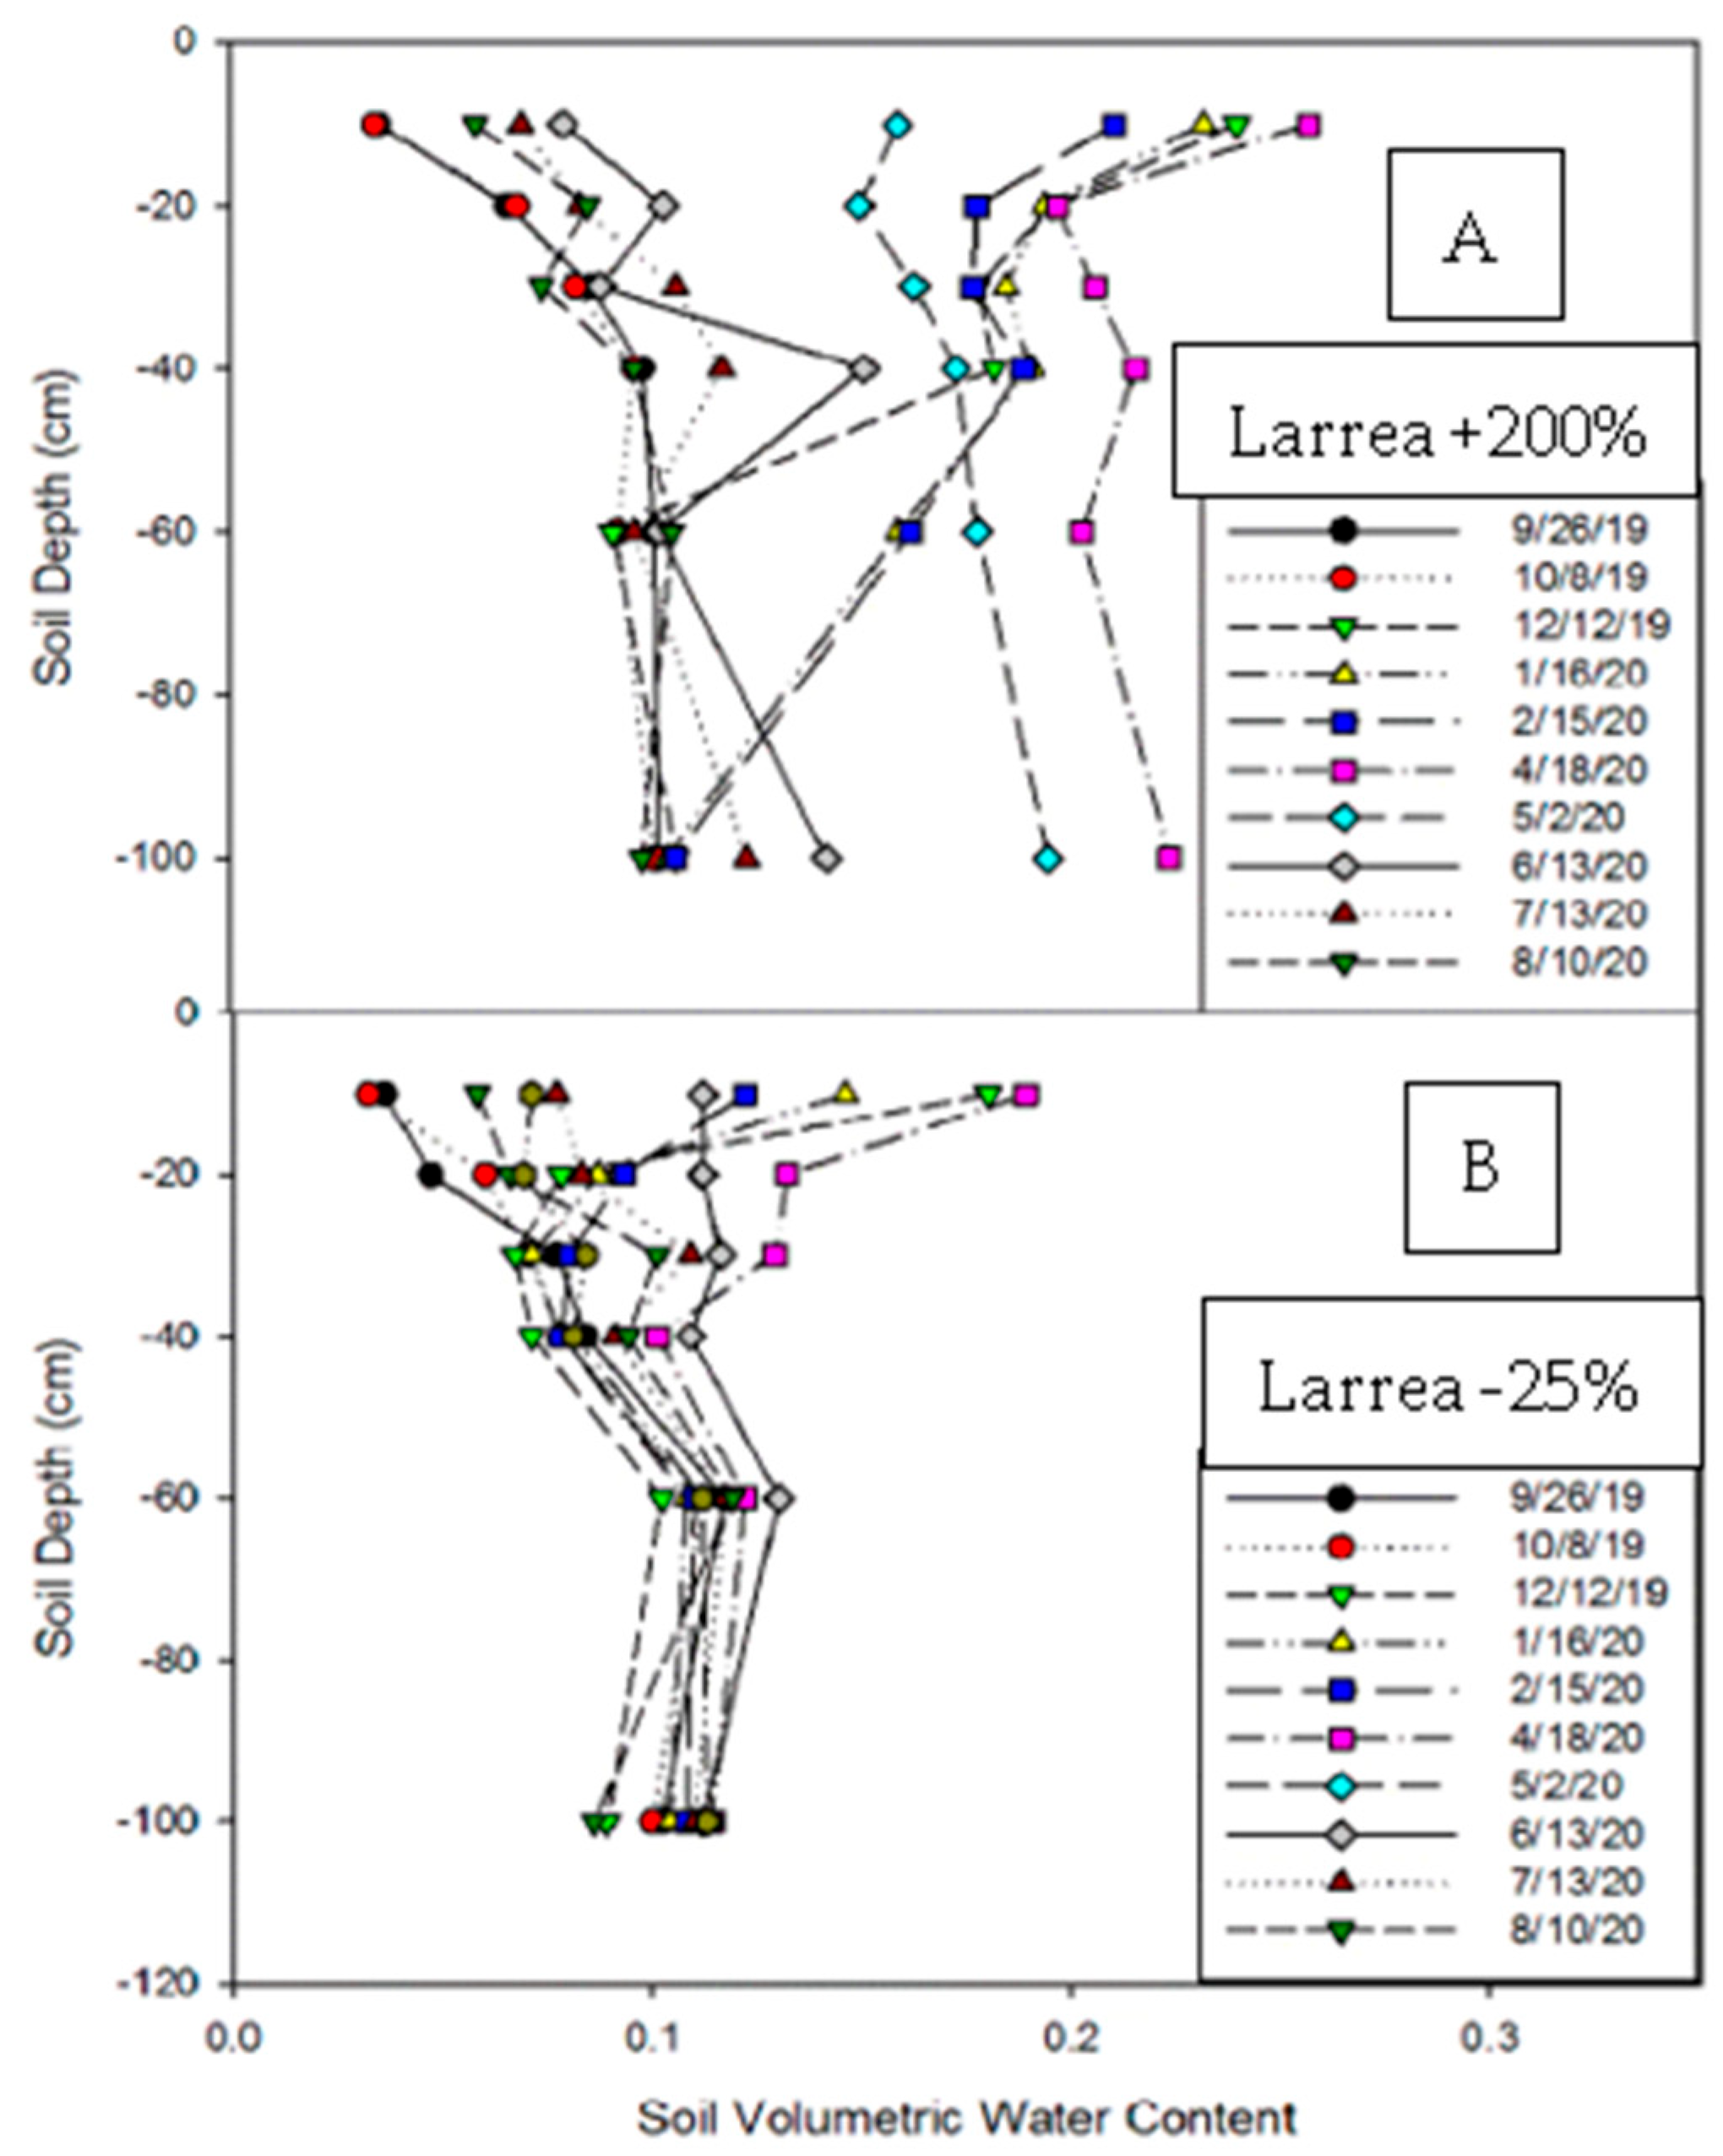
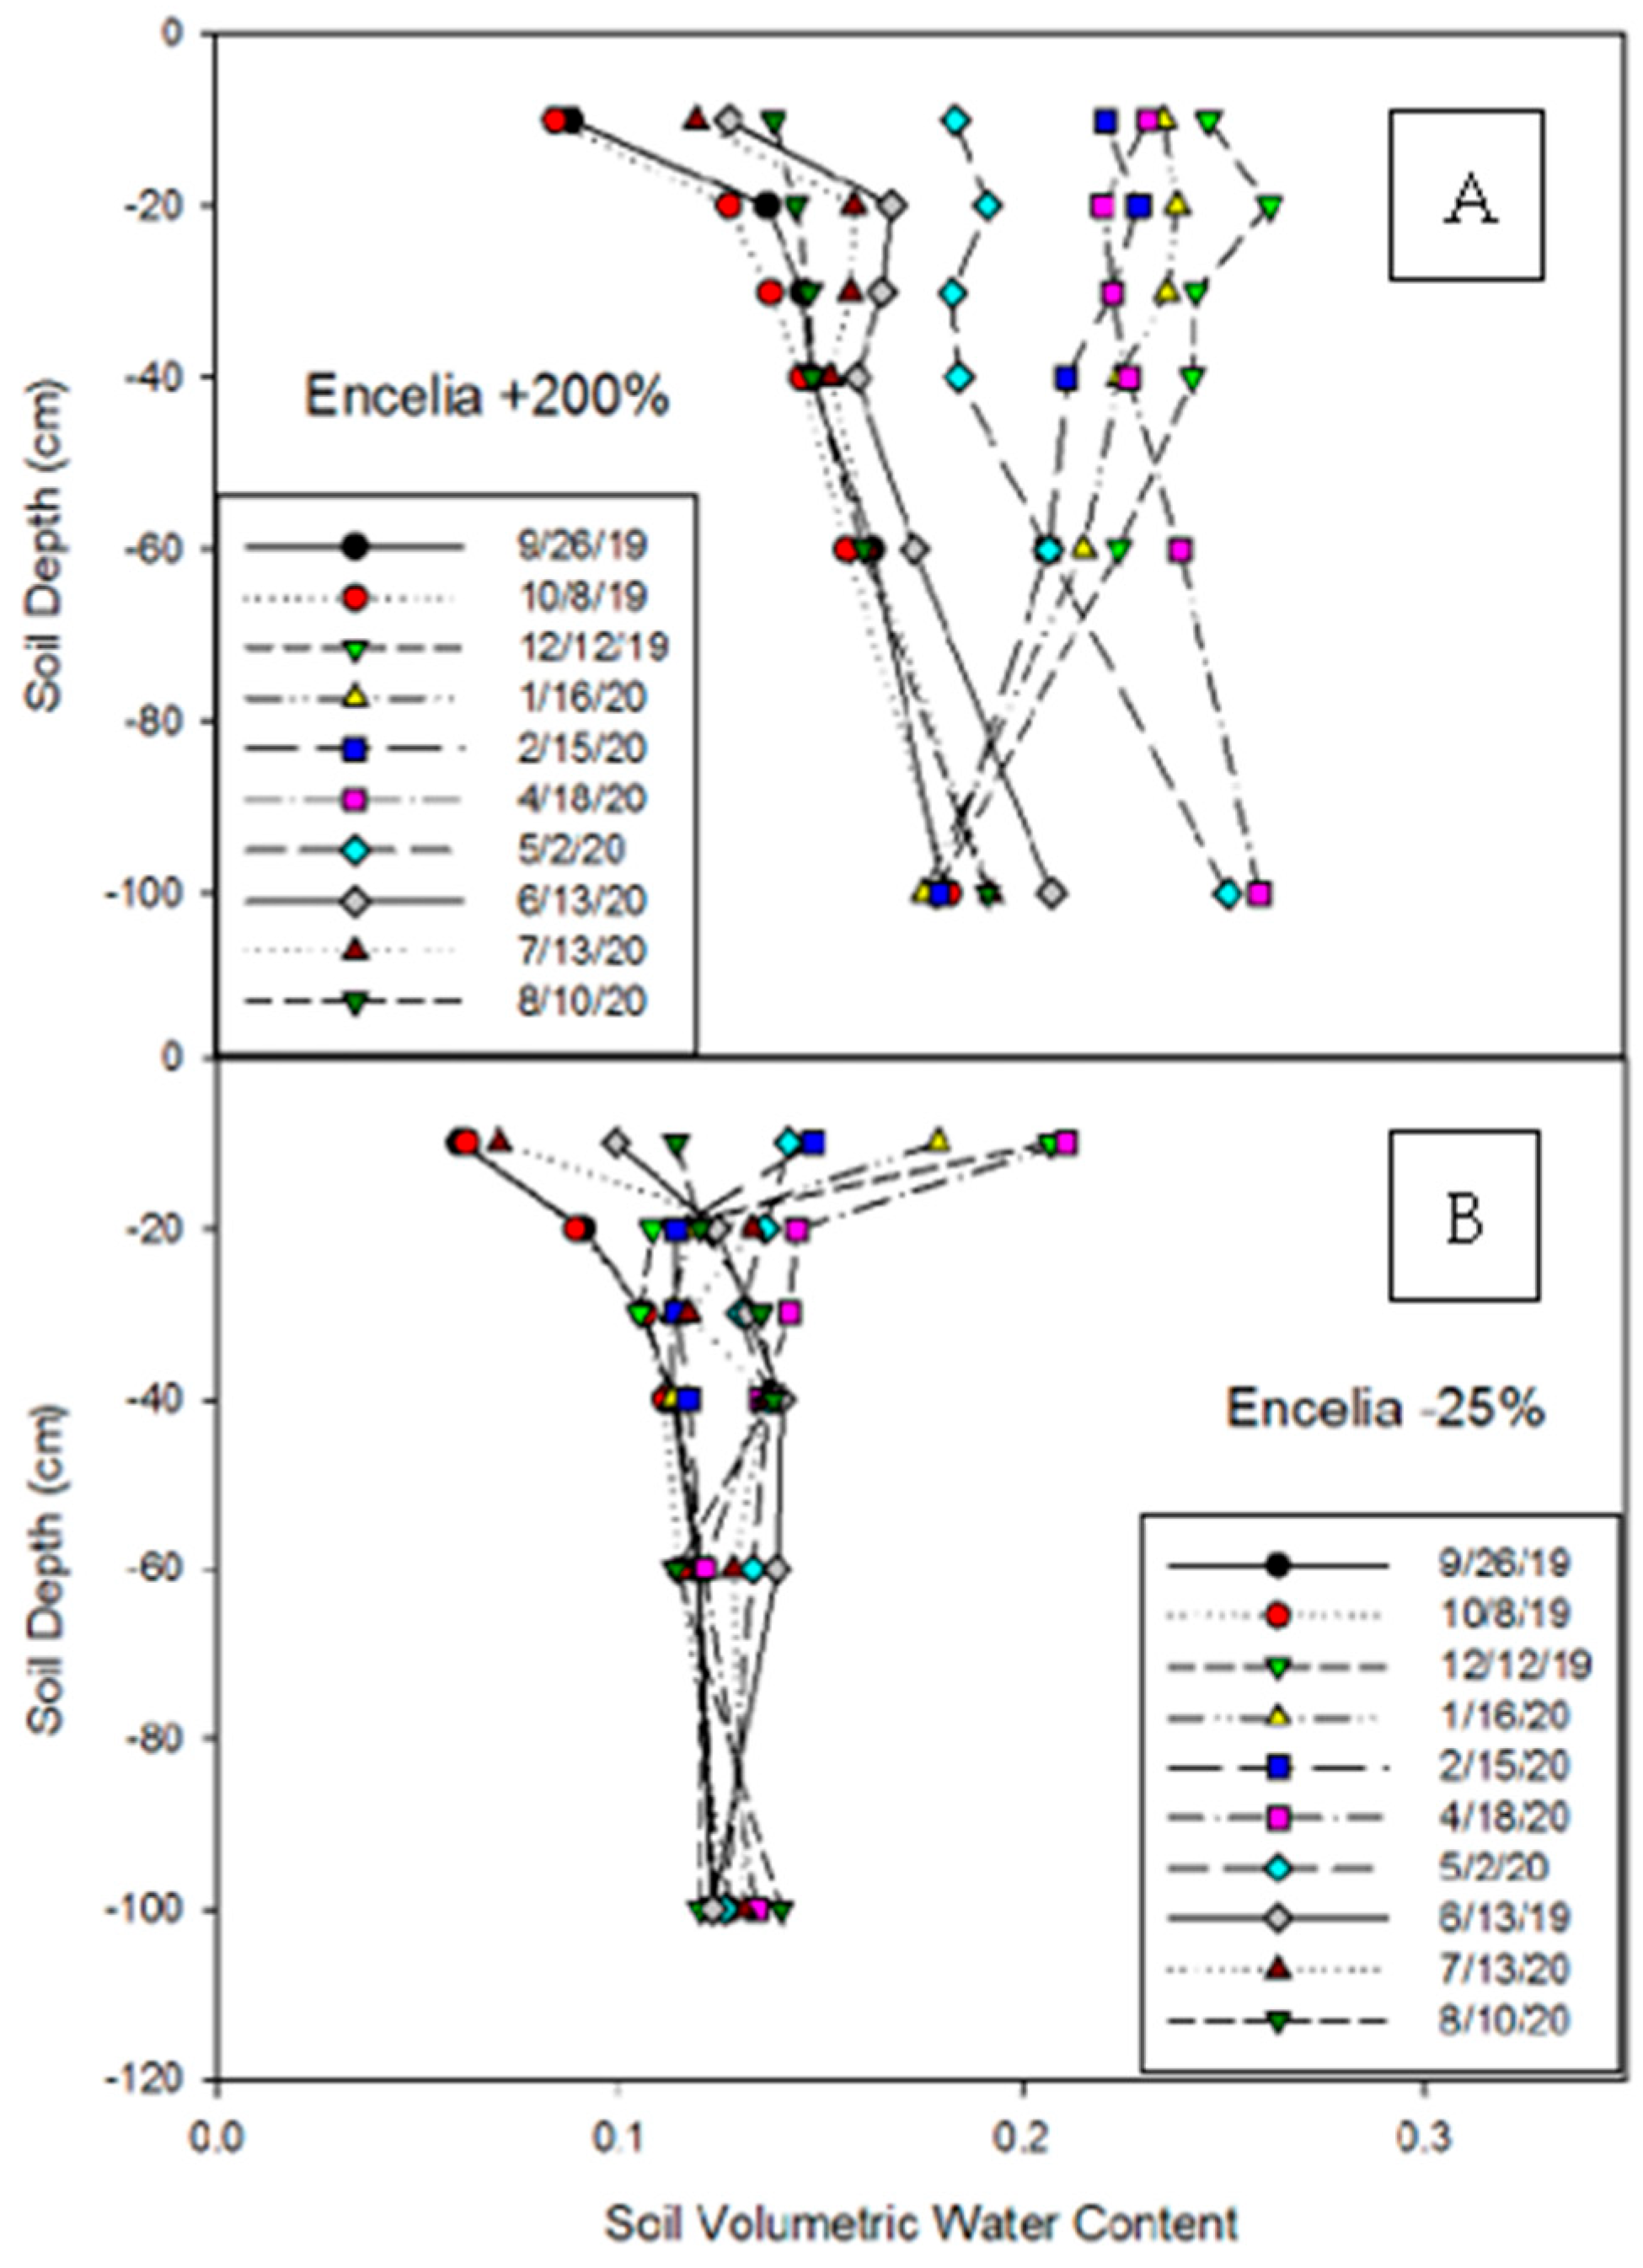
In
Figure 1 the soil water content with depth is shown for the −25% treatment and the 200% treatment measured next to
L. tridentata plants and in
Figure 2 for soil water content next to
E. farinosa plants (note no access tubes were placed adjacent to
A. dumosa or
A. salsola plants). In the −25% treatment for both plants there was variation within the upper 40 cm with water content at the 10 cm depth decreasing from 0.18 cm to 0.04 next to
L. tridentata and 0.22 to 0.06 next to
E. farinosa plants. In the +200% treatment we observed soil moisture reaching the 80–100 cm depth increment, with soil water contents over 0.18 at all depths up to one meter after the rainy period next to
L. tridentata and greater than 0.20 next to
E. farinosa plants. However, by the end of August 2020 soil water contents were similar to what was observed in the −25% treatment at all depths because of plant water extraction and the lack of measurable precipitation. The results were very similar for
E. farinosa plants, suggesting that the available soil moisture limited plant water extraction for both species in a similar fashion.
In
Figure 3, the soil water in storage (cm) is reported for all treatments for
L. tridentata and
E. farinosa. Larrea tridentata in the +200% treatment had over 11 cm more water in storage by April of 2020 than was found in the −25% treatment compared to 9 cm more soil water in storage in
Encelia. These two treatments had significant differences (
p < 0.001) in storage, however the 0% and +100% plots had few differences, with all treatments converging on 12 cm of storage by the end of summer 2020. The fact that the soil water profiles were similar, yet significant differences existed between water input and storage changes suggest that plants receiving the +100% water treatment must have supported significantly greater evapotranspiration rates than the 0% plants that led to similar soil water in storage totals (
p > 0.05), supporting a water balance closure driven by evapotranspiration. In addition, in
Figure 3, the wet period of April and May 2020 had significantly higher soil water in storage than the dry period of June and July 2020 (
p < 0.001). This was also true when the two species were separated; both
E. farinosa and
L. tridentata showed statistically higher soil water content in the wet period (
p < 0.001).
The slope associated with the large decline in soil water storage (
Figure 3) from April 2020 to June 2020 reflected the response to an extended dry period after a rise in the soil water in storage (cm) from significant rain (6 cm) that occurred in March and April of 2020. Soil water in storage peaked 49 days earlier with Encelia plants in the +200% treatment, suggesting that Encelia became more active earlier in terms of soil water extraction. However, once soil water depletion started to occur the rate of depletion/extraction was similar for the two species (0.27 cm per day for Encelia vs. 0.29 cm per day for Larrea).
The amount of water applied, including precipitation and irrigation, had a positive relationship with evapotranspiration (ET) for L. tridentata (R2 = 0.81, p < 0.001) and E. farinosa (R2 = 0.95, p < 0.001). Because soil moisture in storage declined to levels measured before the wet period, this would suggest that ET was confined/driven simply by the water additions, indicating that water input and ET were very similar under our experimental conditions.
3.3. Growth, Final Height, Canopy Volume and Seed Yield
Encelia farinosa and A. dumosa both had significantly larger canopy volumes in the well-watered plot (p = 0.02 and p < 0.001) than in other treatment plots; however, in L. tridentata and A. Salsola, canopy volumes did not reveal any treatment effects (p > 0.05). However, there was a significant difference in canopy volume between species (p < 0.001) reflecting size differences in the species in their native habitat of the Mojave Desert. All species except L. tridentata showed a treatment effect with final plant height. Ambrosia dumosa was significantly taller in the well-watered plot (weekly irrigated) compared to the −25% and +100% treatments (p = 0.02). Ambrosia salsola was taller in the +100% and +200% treatments compared to the −25% treatment (p = 0.007). Encelia farinosa was taller in the +200% and well-watered plots (p = 0.002) compared to all other treatments. Unlike with plant height, a clear statistical separation in canopy volume based on treatment did not occur, a trend based on average volumes did exist suggesting that separation may require years of imposed wet conditions to impact canopy volume and size in a statistically significant way. There was a positive correlation between height and volume for all species combined (R2 = 0.22, p < 0.001) reflecting a general relationship between taller plants and larger canopy volumes.
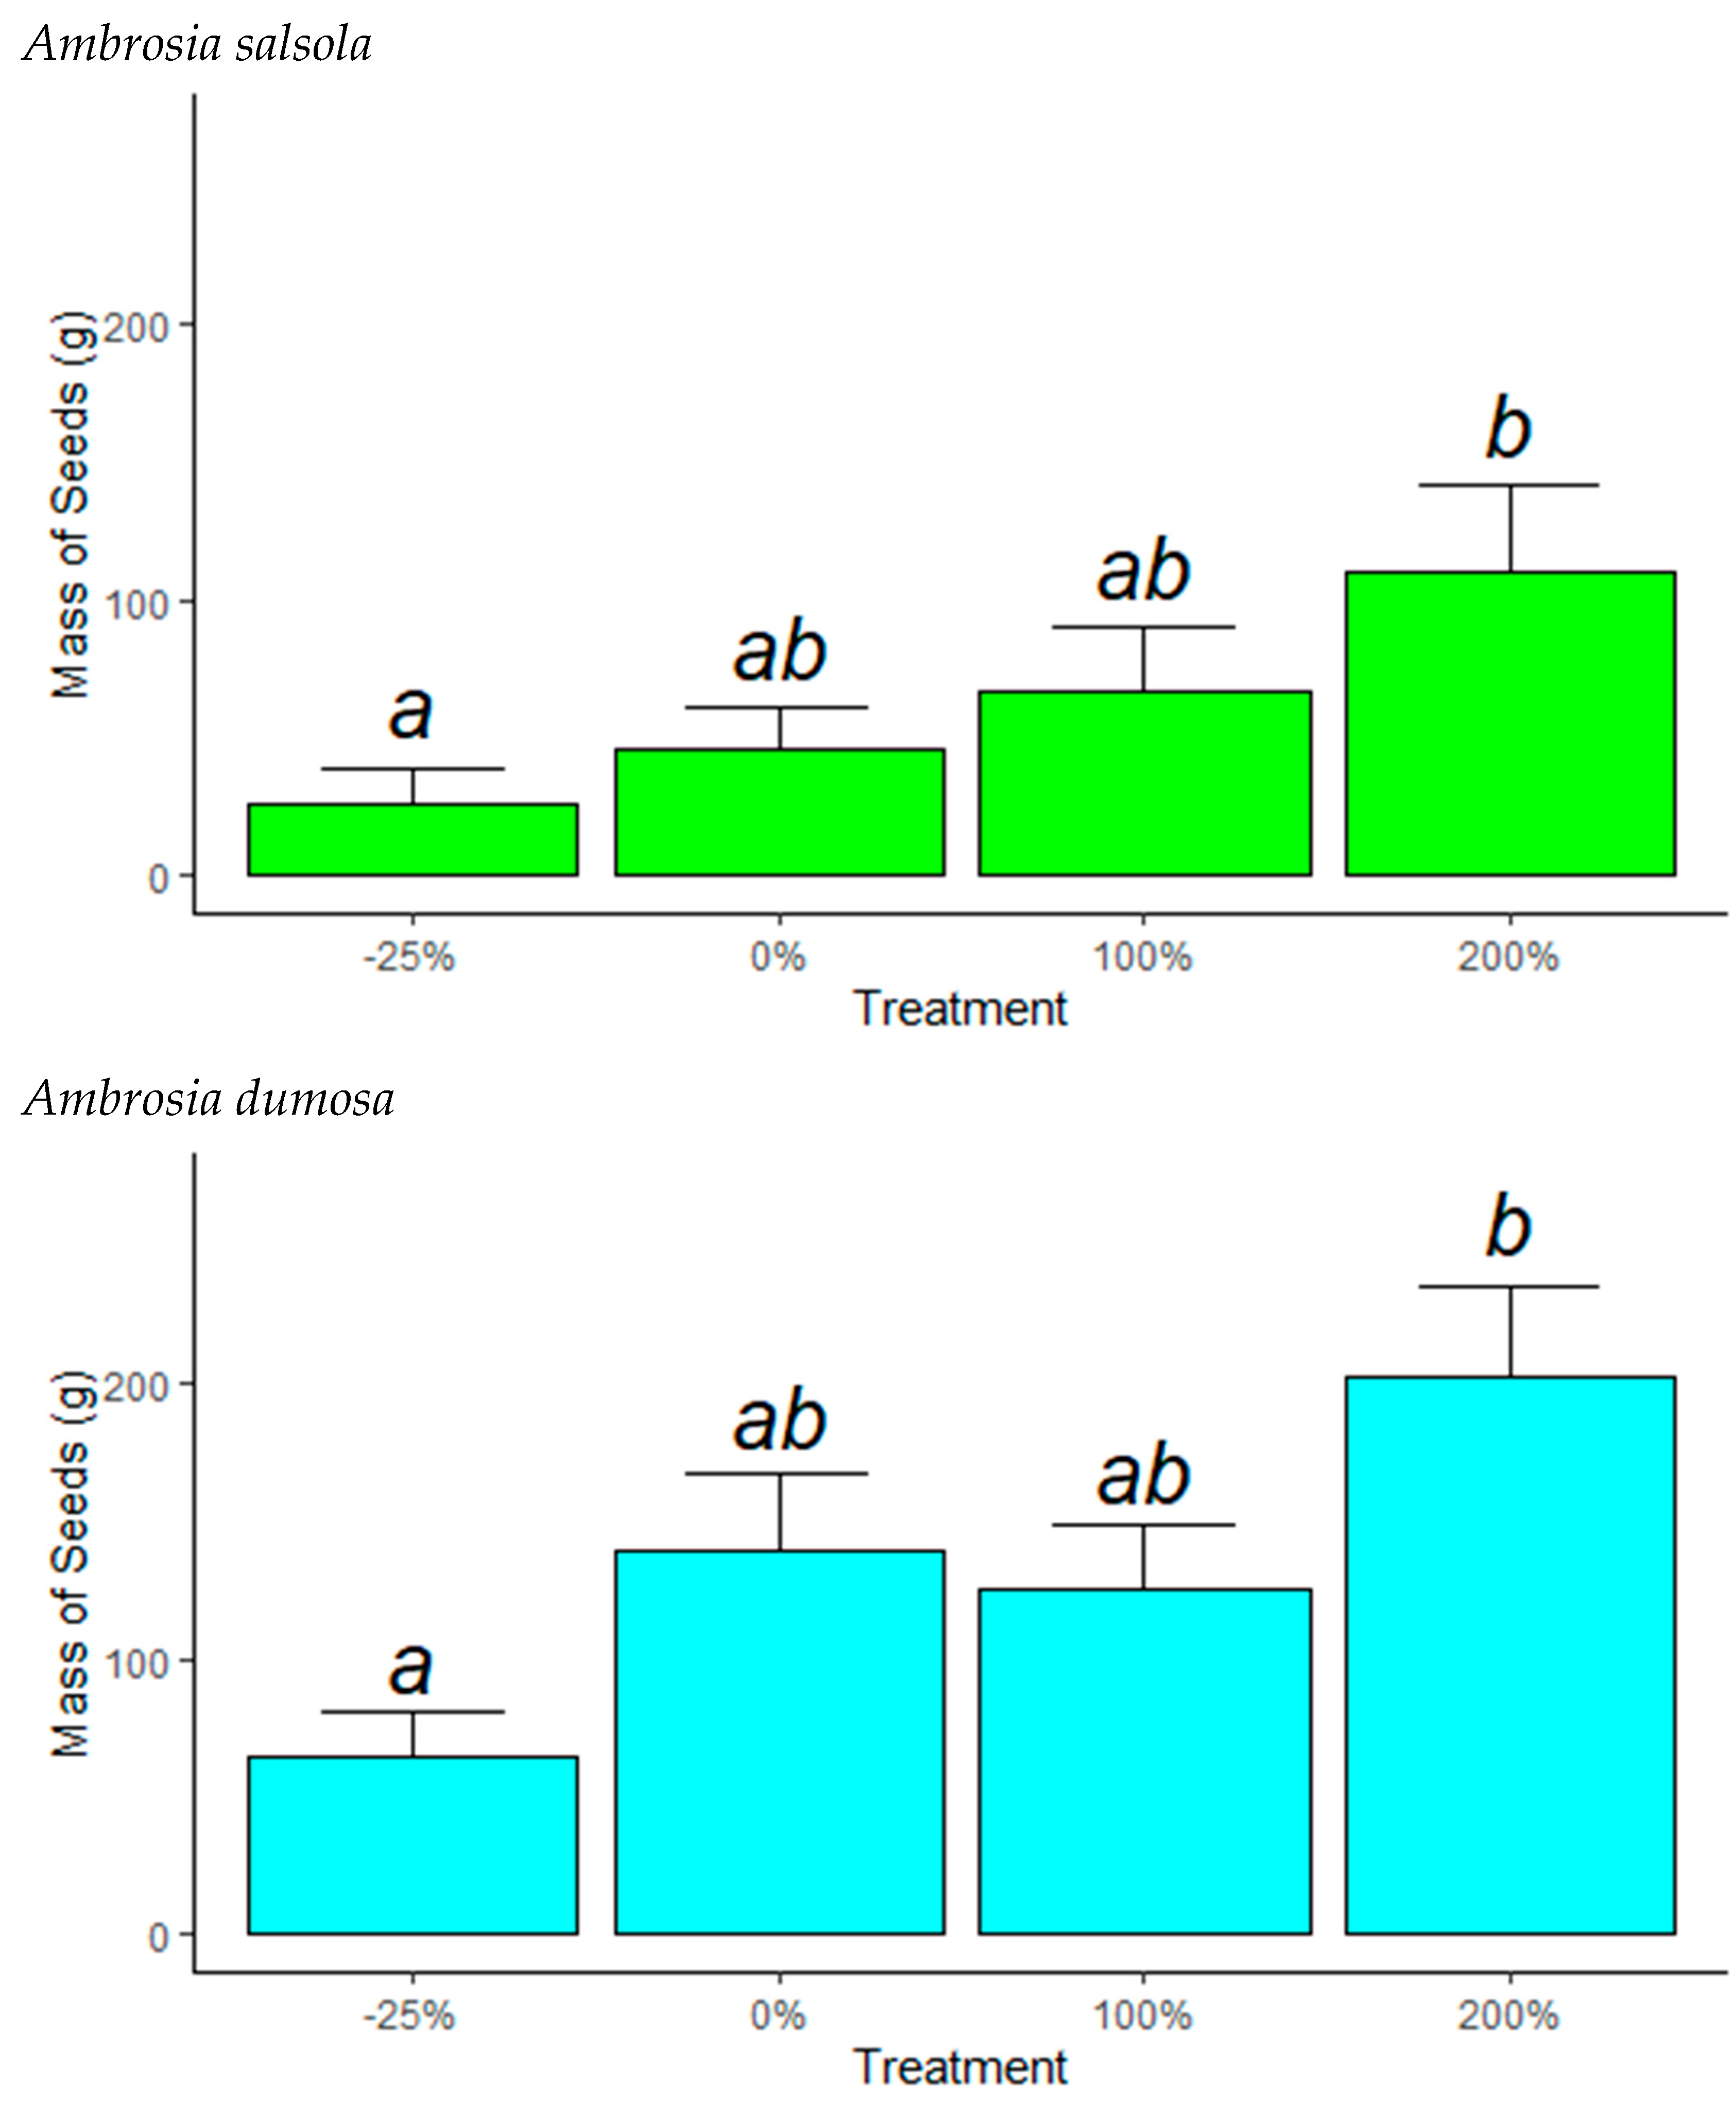
Seed yield (a summation of all the seeds collected during each year) differed significantly between species (
Table 2 p < 0.001).
Ambrosia dumosa had the largest production of seeds (198 g in +200%), whereas
L. tridentata had the lowest production of seed (0.4 g −25%).
Larrea tridentata had 0.2% of the total mass of
A. dumosa seeds in the +200% treatment. The Mojave Desert is a creosote-bursage community and based on the seed results
A. dumosa responded to treatment while
L. tridentata did not. This low seed production of
L. tridentata may be associated with
L. tridentata’s propensity to reproduce clonally [
22].
Ambrosia dumosa and
A. salsola responded with more seeds in the +200% treatment compared to all other treatments (
Figure 4,
p = 0.004,
p = 0.039).
Ambrosia dumosa had three times the total seed weight in the +200% treatment compared to the −25% treatment. Seed weight of
A. dumosa was found to be significantly correlated with water input (including the well-watered plot) (Y = 93.68 + 0.66 Treatment, R
2 = 0.78,
p < 0.001). In the well-watered plants of
A. dumosa,
A. salsola and
L. tridentata seed mass was lower than in any of the other treatments, which may have been due to a shift in carbon allocation to growth over seed production under well-watered conditions.
3.4. Leaf Xylem Water Potential
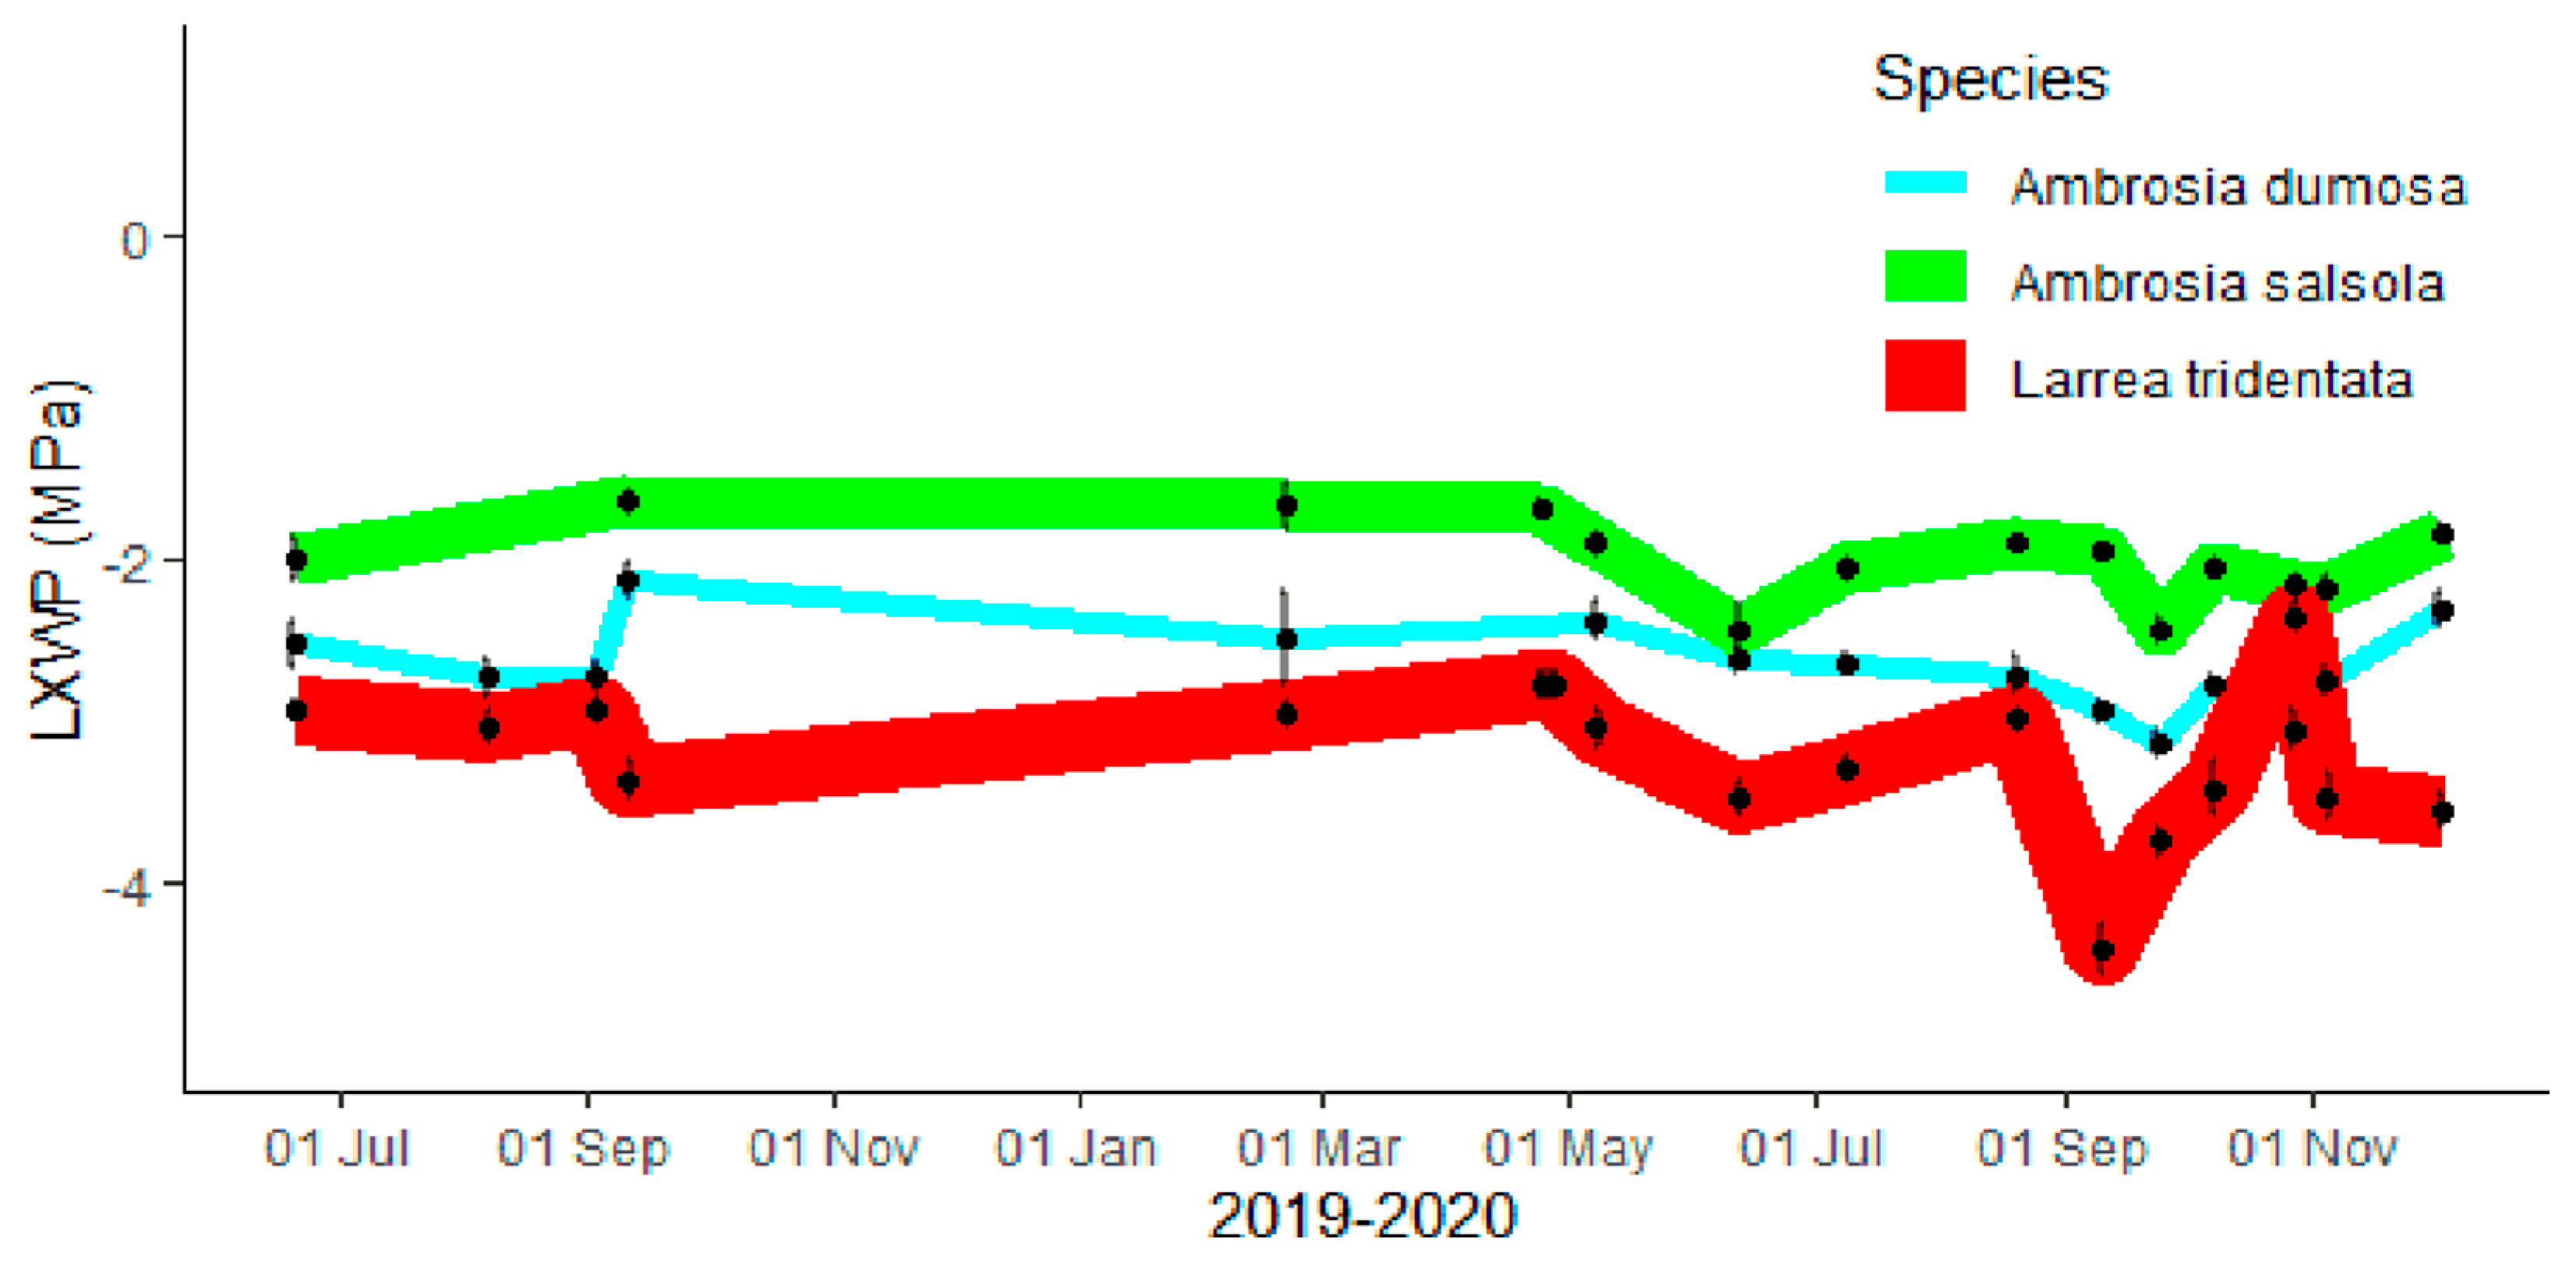
Leaf xylem water potential (ΨL) at midday differed significantly between species (
p < 0.001,
Figure 5), with
L. tridentata having the lowest (more negative) values,
A. dumosa intermediate, and
A. salsola with the highest (more positive) values. However, each species did not show a significant treatment effect (
p > 0.05). It was not possible to measure the ΨL of
E. farinosa due to stem succulence and stem crushing under pressures imposed in the chamber. The fact that each species did not show significant differences between treatments suggested that each species regulated midday ΨL within a tight range despite changes in the water content of the soil. Although water availability and soil water storage varied statistically by treatment, ΨL revealed a very consistent pattern changing little over the two-year period. The three-way ANOVA showed no significant difference between season or treatment, just a higher value for
A. salsola (
p < 0.05) compared to other species. The means and standard deviations of each species throughout the year were calculated with all the treatments combined. The coefficient of uniformity was greater than 0.80 for the three species monitored, indicating low variation over time, suggesting an isohydric response at mid-day.
3.5. Canopy Temperature Minus Ambient Temperature (Tc − Ta)
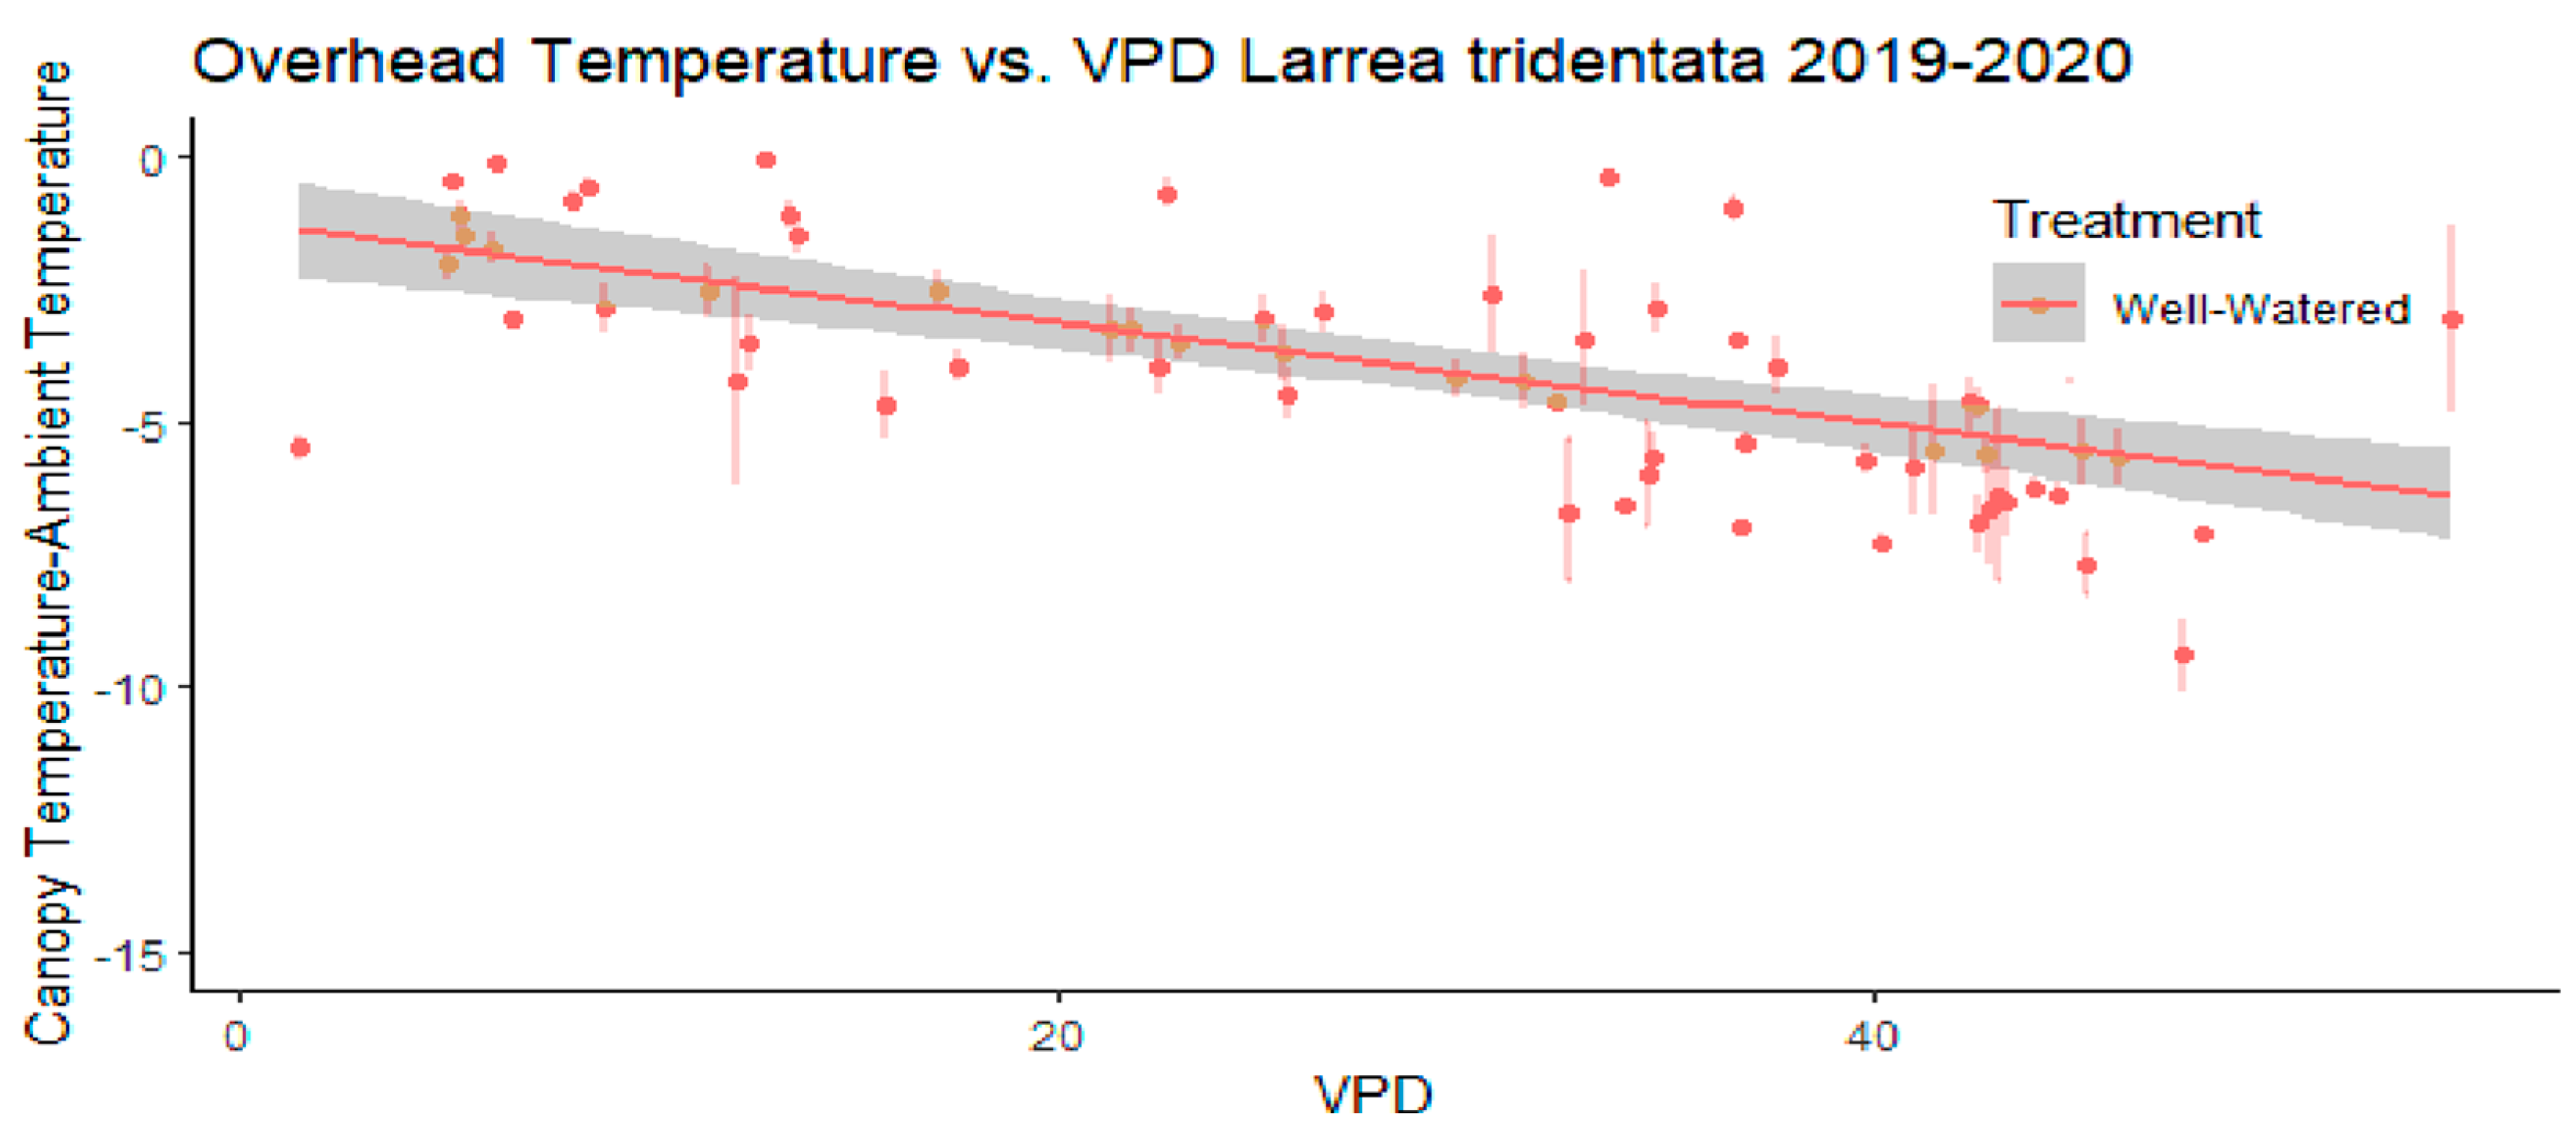
Canopy temperature minus ambient temperature is shown in
Figure 6 for
L. tridentata, in the well-watered (non-stress) treatment revealing a linear relationship with the vapor pressure deficit (
p < 0.001) with the R
2 ranging from 0.36 to 0.64 for all species. This analysis was critical in generating the plant water stress index. In
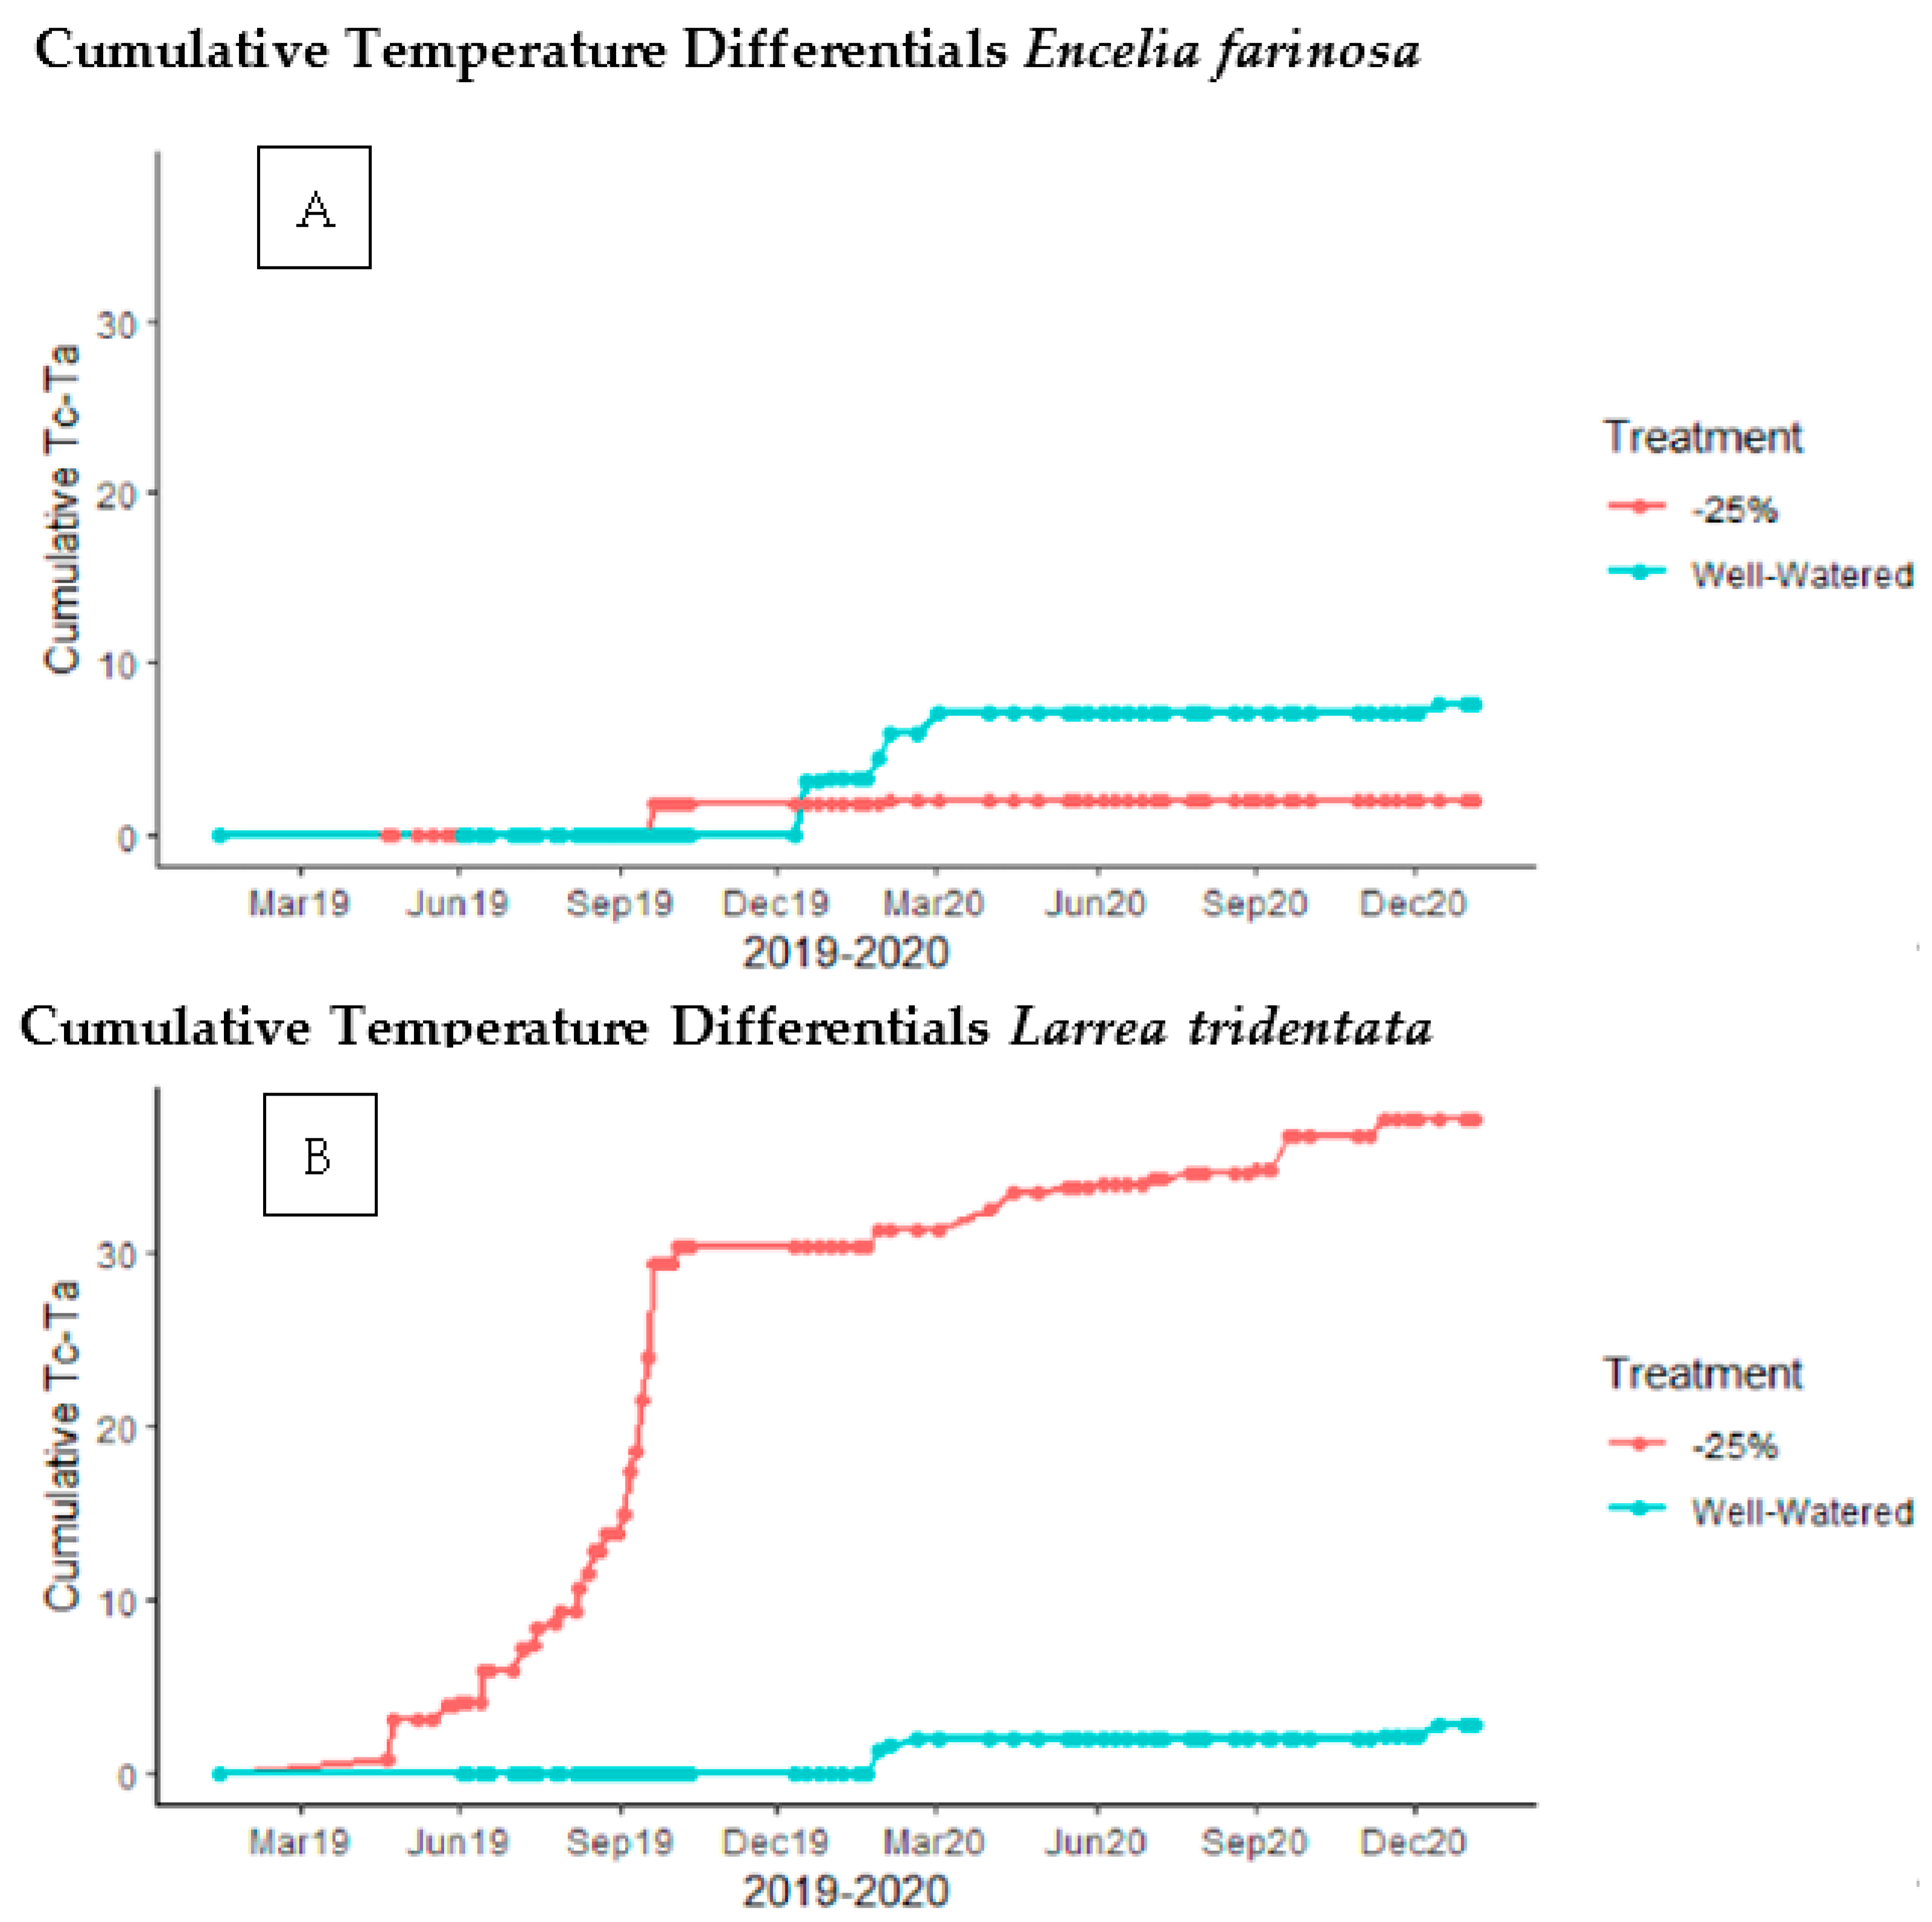
Figure 6 the temperature differentials remained very constant for each species from August to December. The well-watered plants remained at zero or very close to it for most of the year in all species, substantiating that these plants in the weekly irrigated plots were not under stress. The cumulative T
c − T
a for
E. farinosa and
A. dumosa was 20–25 degrees lower than that of
L. tridentata even under the −25% treatment (
p < 0.001,
Figure 7).
Larrea tridentata only had large changes in T
c − T
a during the June-to-September period of 2019 (
Figure 7). Cumulative T
c − T
a of
E. farinosa in the −25% treatment was not statistically different from the well-watered weekly irrigated plants, indicating minimal stress during the study period. In contrast, the cumulative T
c − T
a of
L. tridentata in the −25% treatment was significantly higher than in the irrigated well-watered plants, especially during the summer of 2019, indicating that the plants were subjected to significant stress. When all the data was assessed to determine the percentage of T
c − T
a values that were negative during the two-year period (indicative of low levels of stress),
Encelia farinosa had 90% of all its T
c − T
a values as negative,
A. dumosa 74%,
A. salsola 66% and
L. tridentata 54%.
3.6. Chlorophyll Index
The chlorophyll index (unitless) is a vegetation index based on light reflected by plants and is a dependable indicator of the total chlorophyll content in plants. The chlorophyll index was significantly different between treatments in all species in December 2020 (
p < 0.001). The species were also significantly different from each other (
p < 0.001) except for
E. farinosa vs.
A. salsola.
Ambrosia salsola had higher chlorophyll index values in the −25% treatment compared to the +200% treatment and in the well-watered plot (
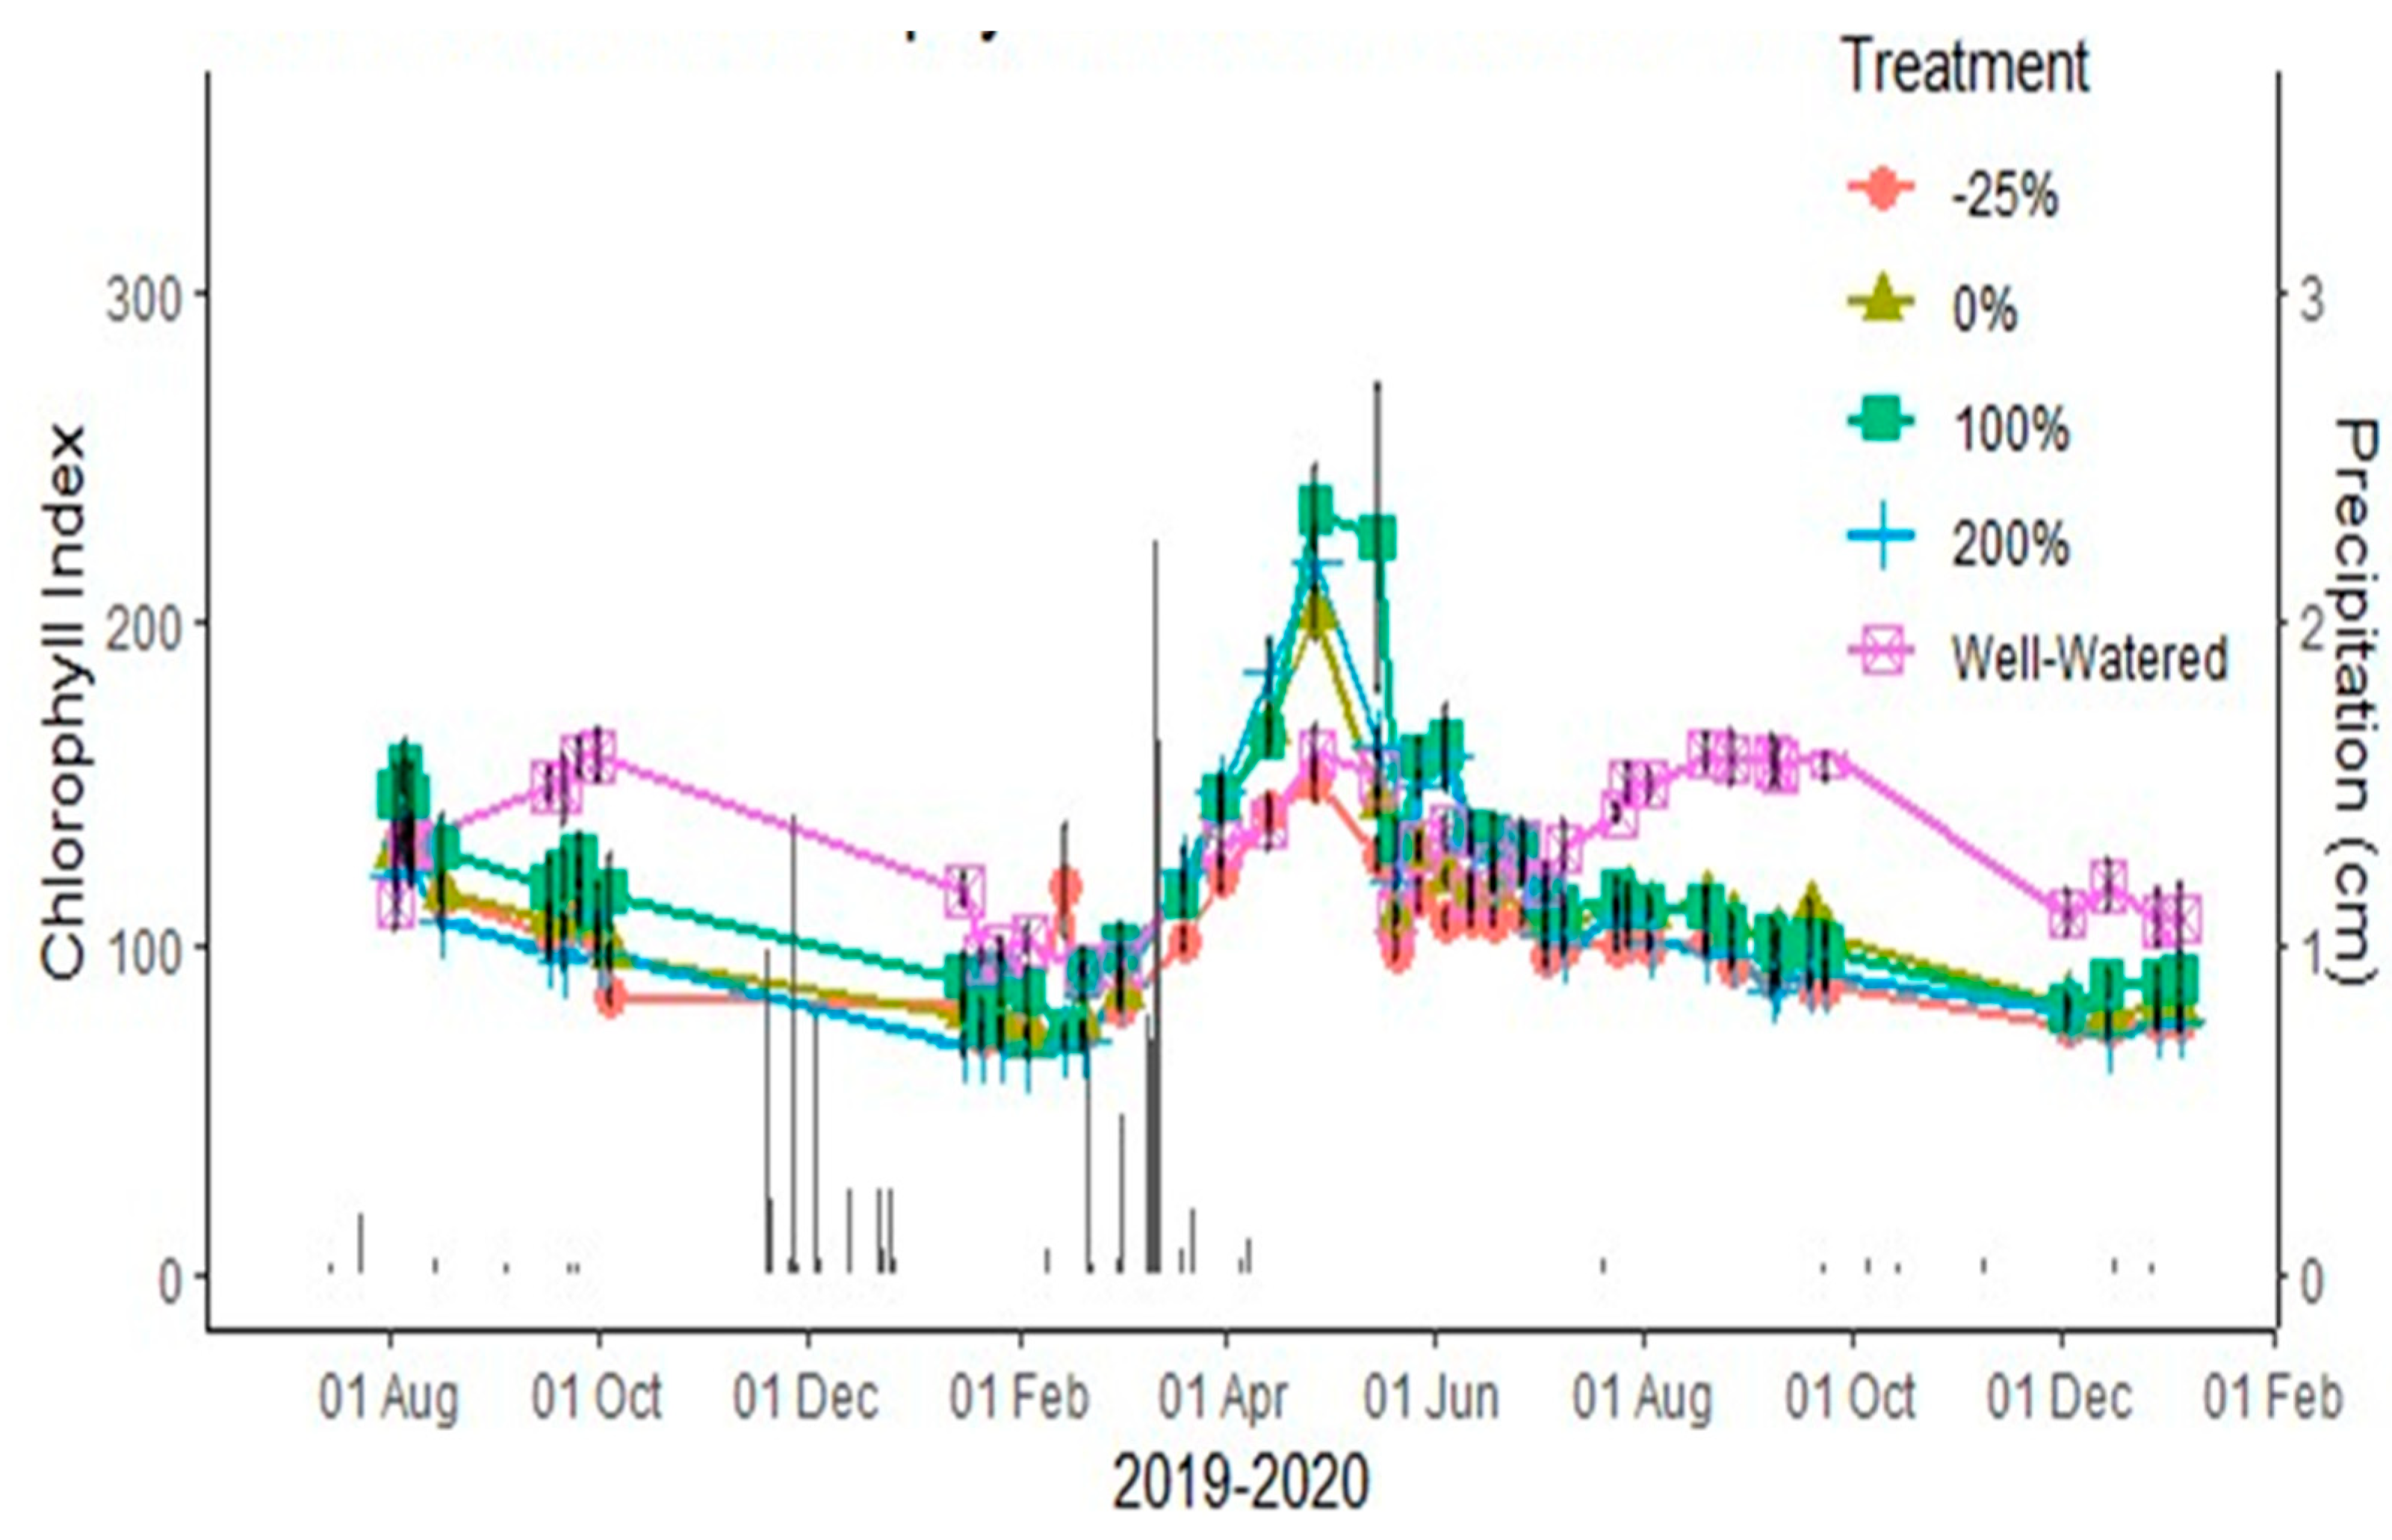
p = 0.037). In
Ambrosia dumosa (
Figure 8), the well-watered plot had higher chlorophyll index than all other treatments (
p < 0.001). In
Encelia farinosa, the chlorophyll index of the −25% treatment was significantly lower when compared to the 0% and +100% treatments.
Larrea tridentata leaves had higher chlorophyll index in the +200% treatment compared to the −25% and +100% treatments. All treatments and all species responded to larger rainfall events in March 2020 by increasing their chlorophyll index values. After this green up, the chlorophyl index of the leaves returned to a level similar to that measured before the rains in December 2019, with the well-watered plants maintaining higher values before and after the wet winter of 2019. Soil water content positively predicted the chlorophyll index during a dry down period of May 2020–September 2020 in both
E. farinosa (
p = 0.03, R
2 = 0.46) and
L. tridentata (
p = 0.03, R
2 = 0.45) in the +200% treatment. Also, during the same time in the 100% treatment,
E. farinosa (
p = 0.002, R
2 = 0.71) and
L. tridentata (
p = 0.009, R
2 = 0.60) soil water content and chlorophyll index values were positively correlated. The results indicated that the chlorophyll index meter could detect subtle changes in chlorophyll status, especially as the soil moisture declined.
3.7. Plant Water Stress Index (PWSI)
The Plant Water Stress Index (unitless) is a quantitative measure used to assess the level of water stress in plants using canopy and ambient temperatures along with vapor pressure deficits. The PWSI was based on establishing a T
c − T
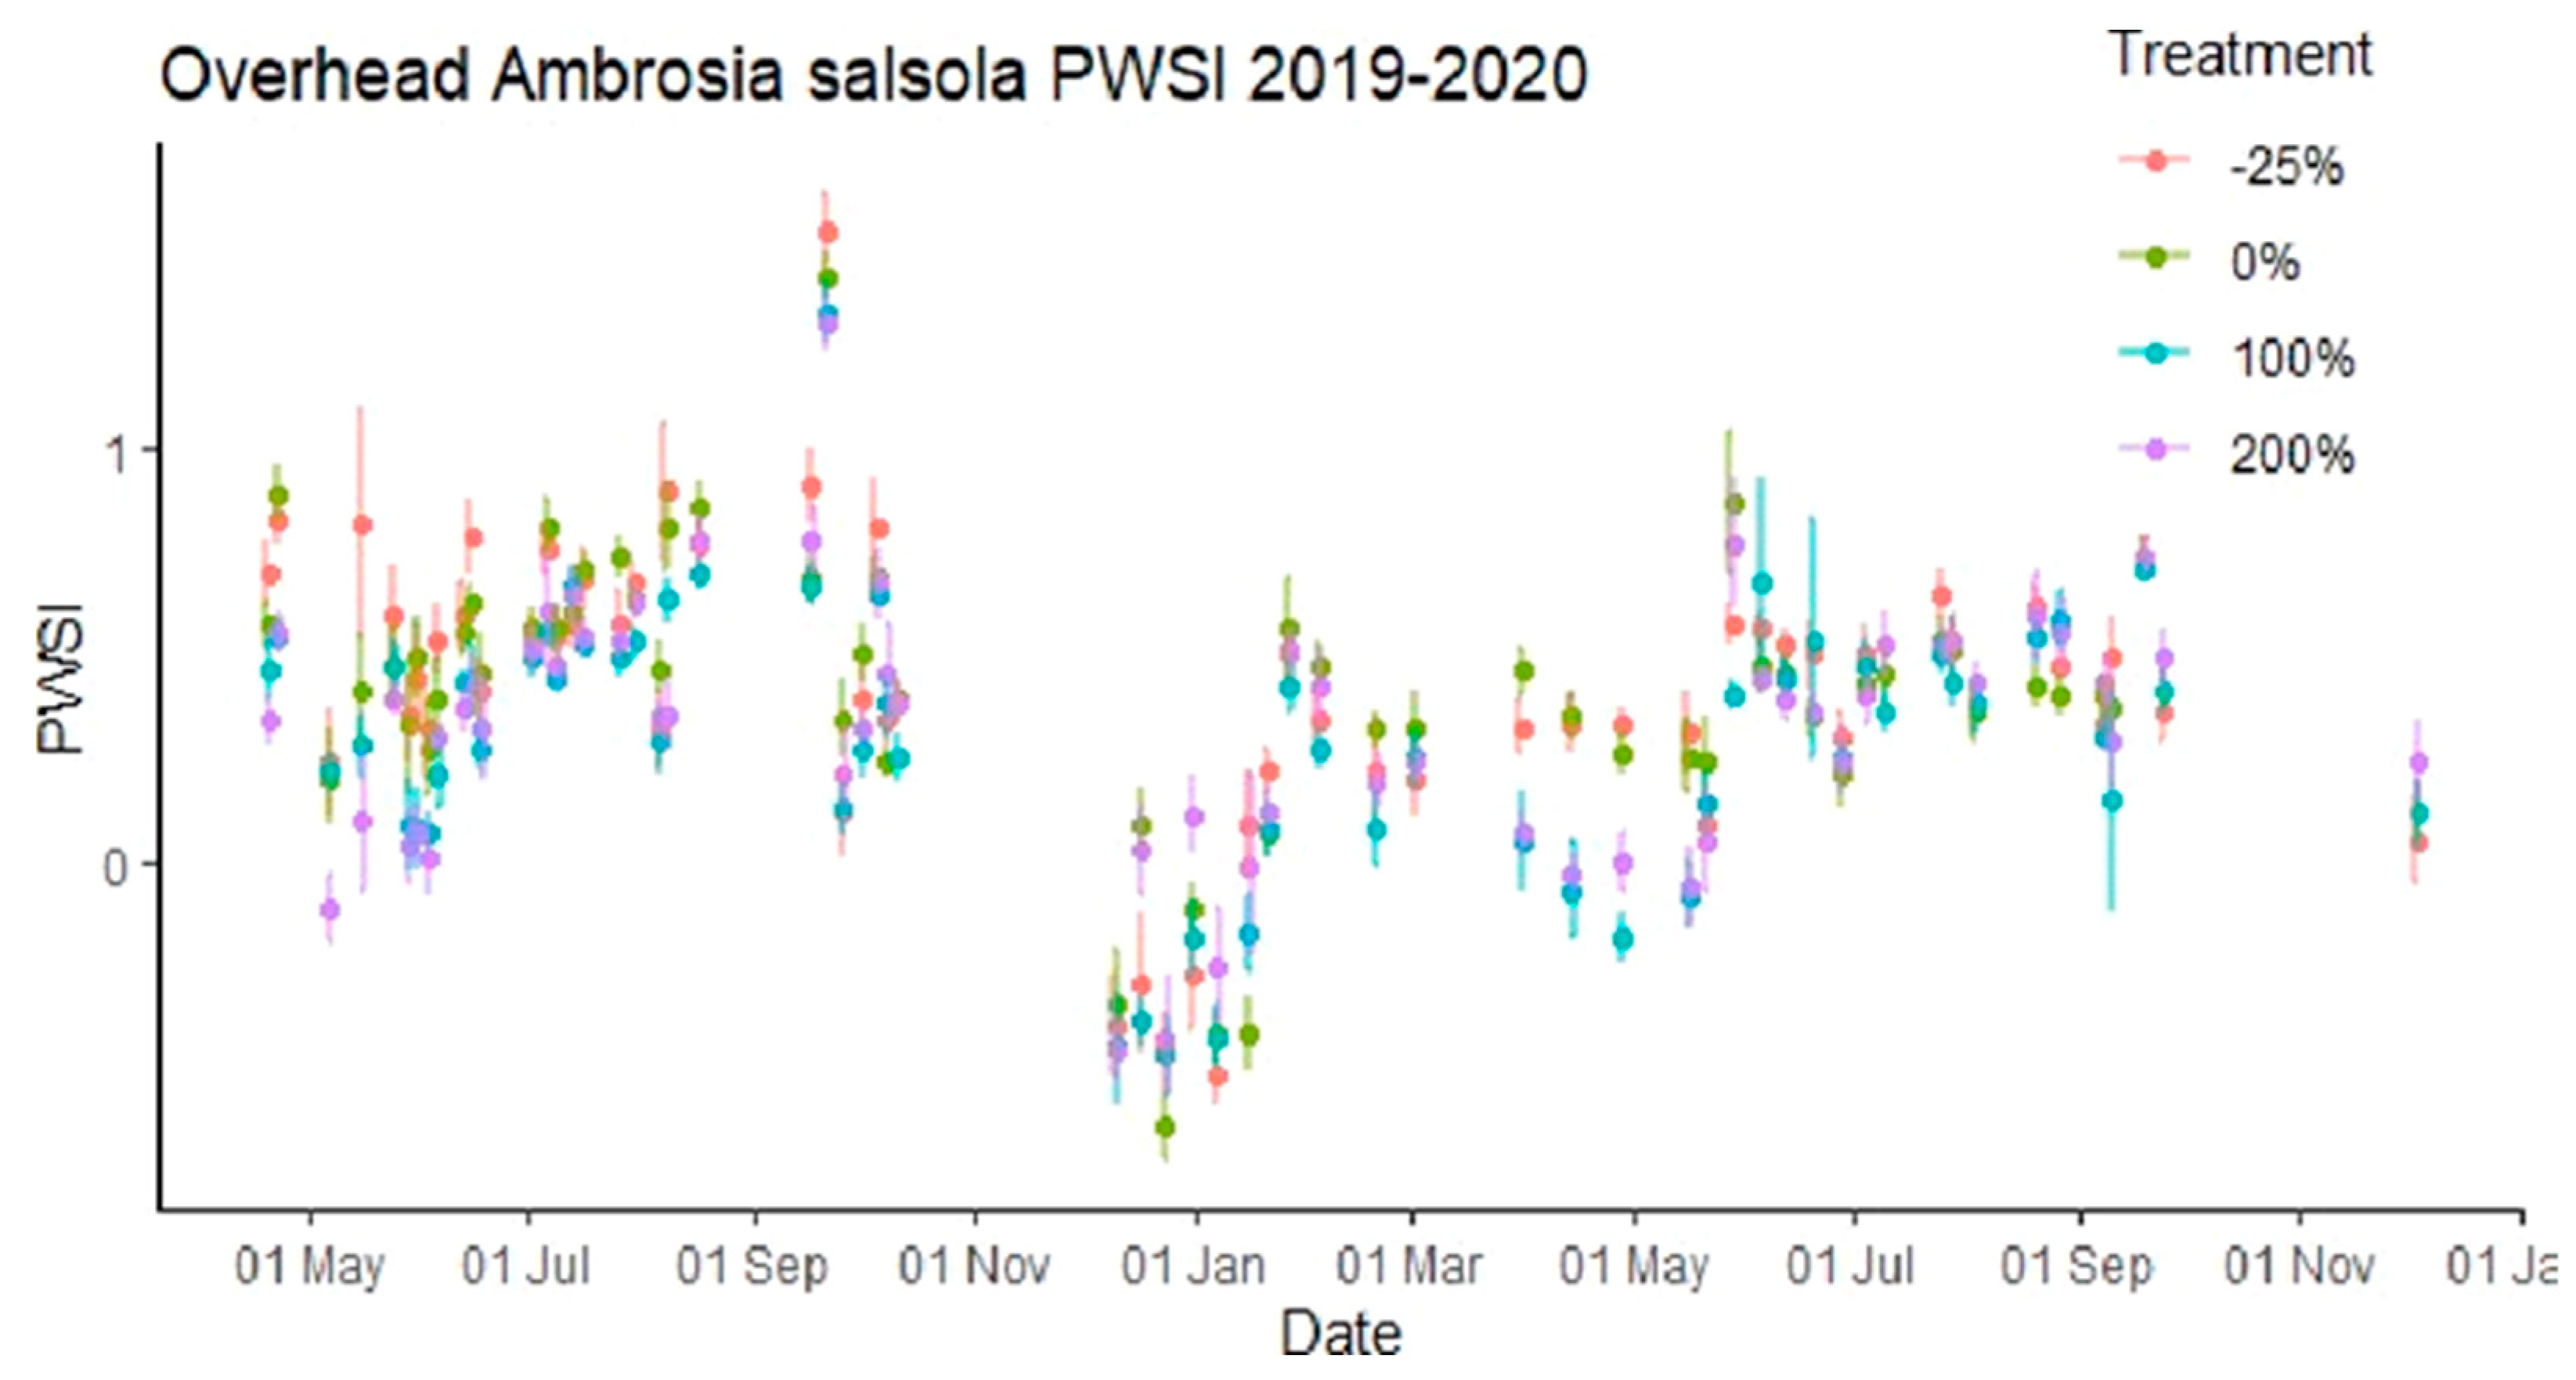
a vs. VPD curve, defining plants under stress and a separate curve for plants not under stress (irrigated). All species had significantly higher PWSI when comparing the −25% treatment with the +200% treatments (
p < 0.001). The PWSI was significantly higher in the 0 and −25% treatments compared to +100% and +200% in
A. salsola (
Figure 9,
p < 0.001). The integrated area under the PWSI curve of
E. farinosa and
A. dumosa differed significantly from the other species (
p < 0.001). For the 0% treatment, all species except
L. tridentata had significant
p values and R
2 values when comparing the area under the curve of PWSI with height of plants (
p < 0.05, R
2 ranging between 0.6 and 0.7).
Ambrosia salsola and
L. tridentata had a significant negative relationship between the −25% treatment integrated PWSI and plant height (
p = 0.02, R
2 = 0.60,
p = 0.05, R
2 = 0.45).
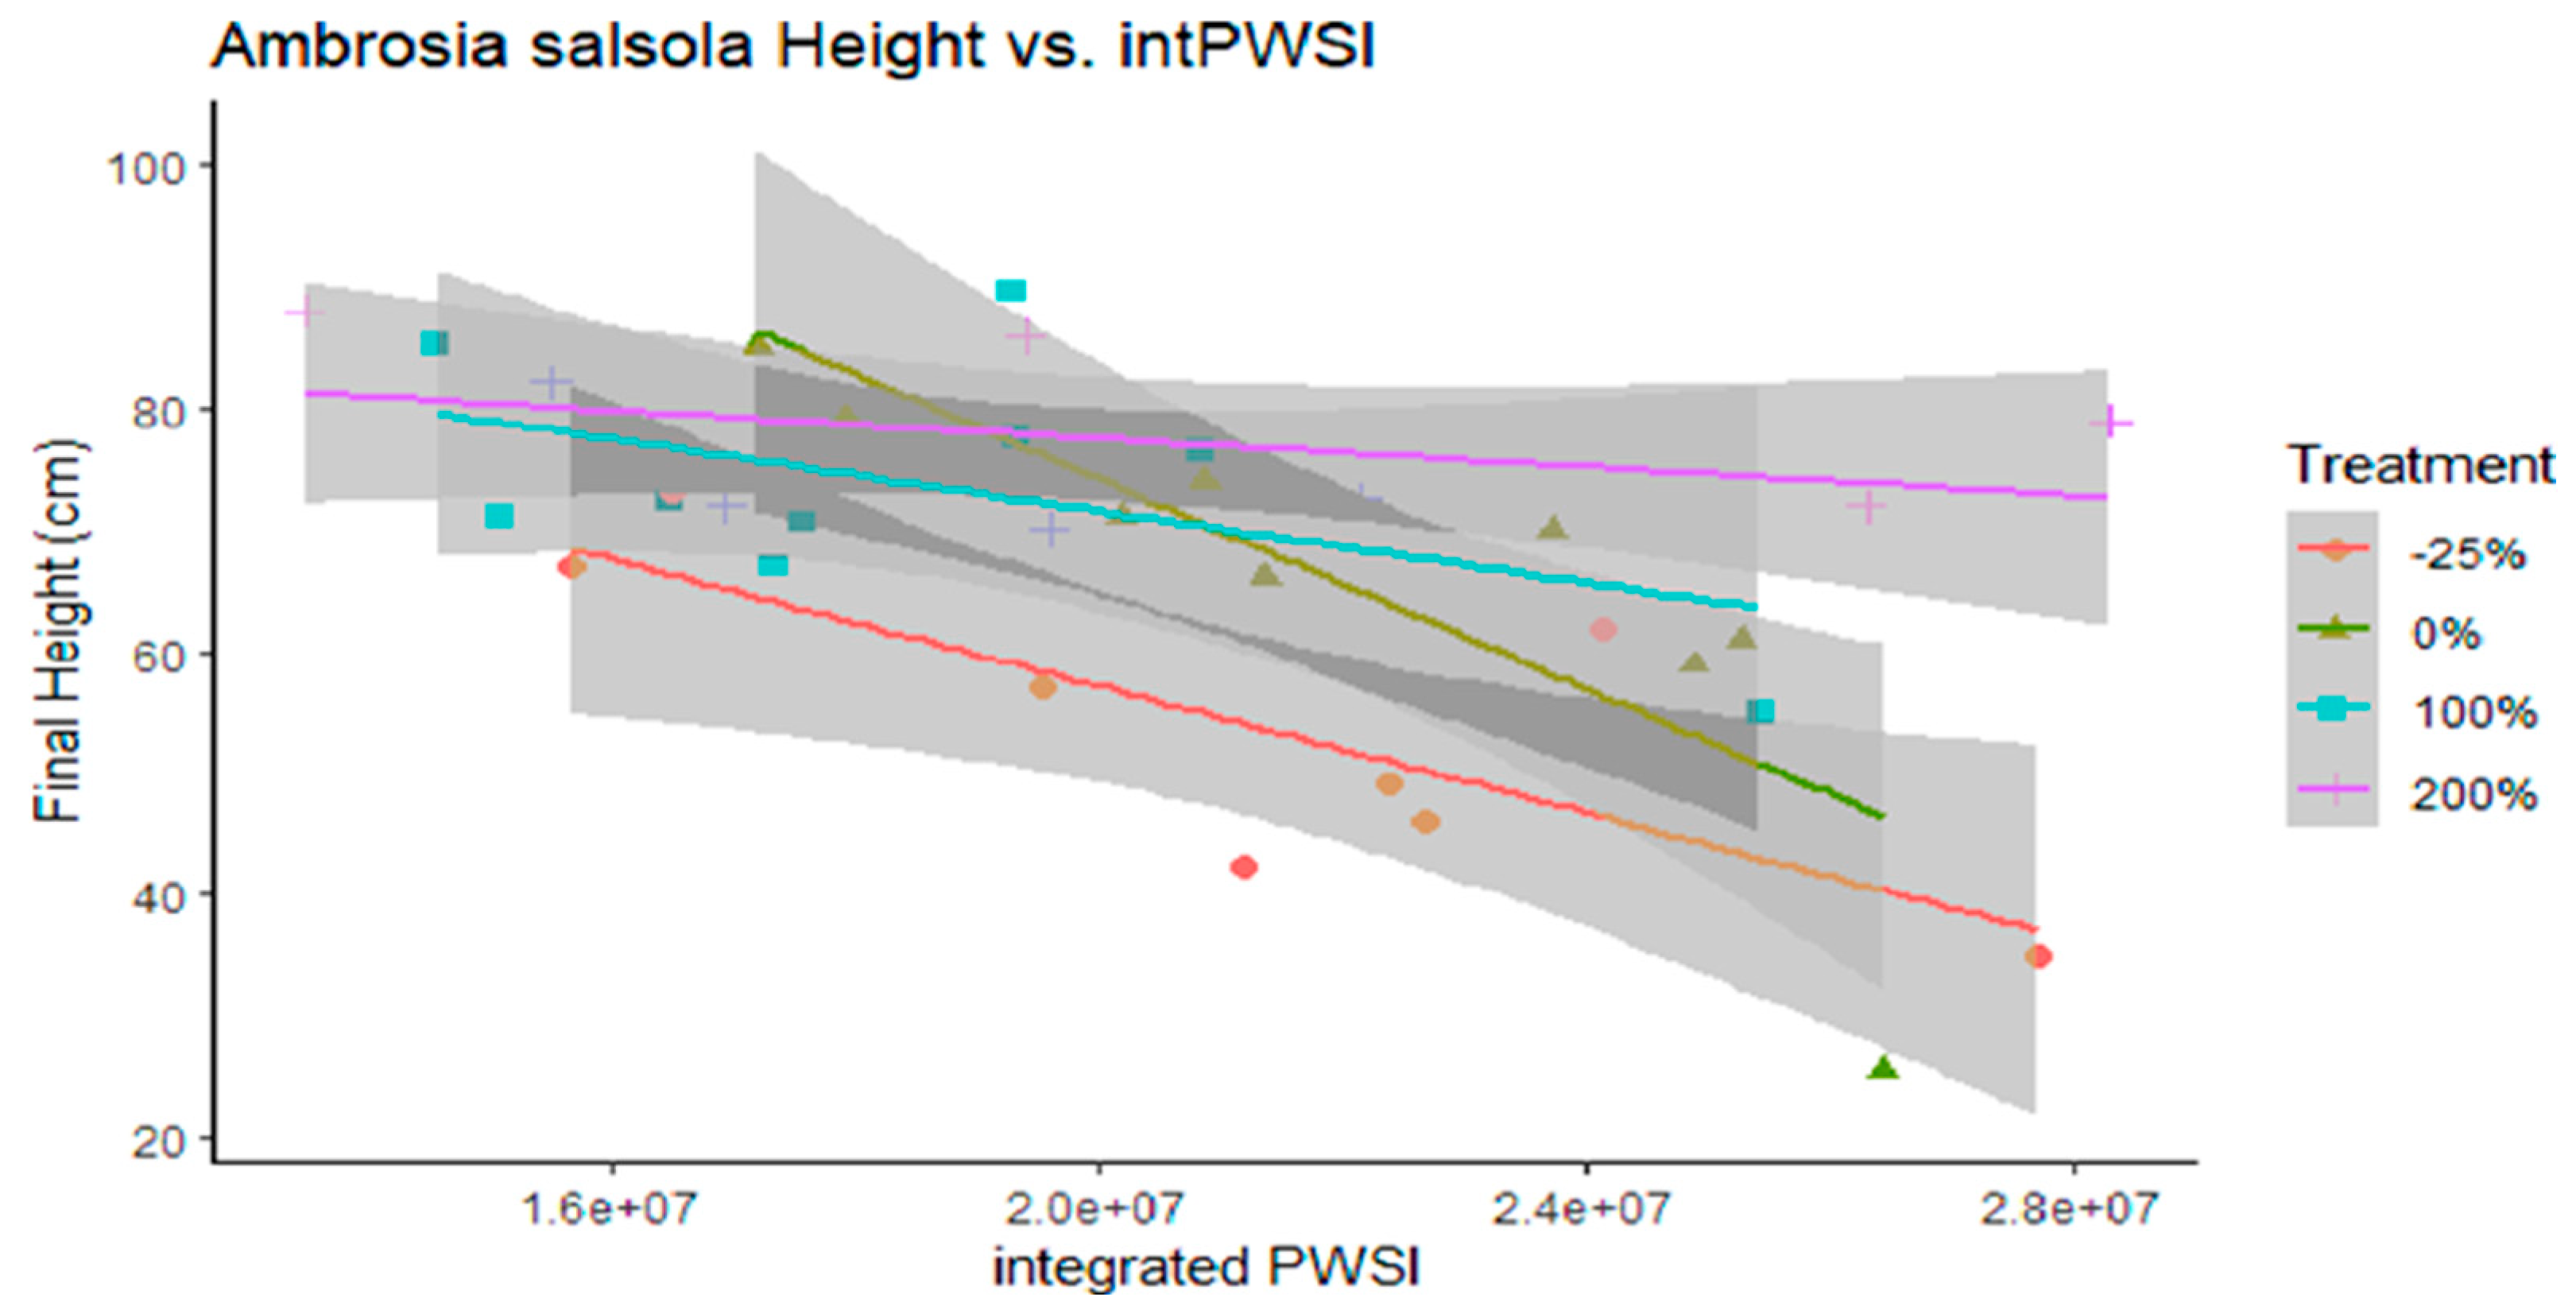
Encelia farinosa,
A. dumosa, and
A. salsola had significant negative relationships between plant height and integrated PWSI in the 0% treatment (
p = 0.01, R
2 = 0.60,
p < 0.001, R
2 = 0.63,
p = 0.01, R
2 = 0.68, respectively,
Figure 10). All species except
A. salsola had a significant correlation between integrated PWSI in the 0% treatment and final canopy volume (
p < 0.05 and R
2 ranging between 0.45 and 0.69). Finally, there was a negative correlation between PWSI and soil water content for
E. farinosa (
p = 0.02, R
2 = 0.97). However, there was no statistical relationship between
L. tridentata, PWSI and soil water content.
3.8. Plant Response 3.8 Years After All Supplemental Water Was Last Applied
When the two-year experiment in which supplemental water was provided to the four desert shrub species ended, the plots remained intact for a 3.8-year period in which the plots only received precipitation (2021–2024 precipitation totals in cm; 5.18, 5.23, 13.51 and 6.32). All plants were assessed if they were dead or alive at the end of the 3.8-year dry period.
A. salsola and
E. farinosa had 97% survival while
L. tridentata and
A. dumosa had 100% survival 3.8 years after all supplemental water had ended. To assess if allelopathy [
18] might have influenced results, we measured the height of each plant and the chlorophyll index relative to the distance from each species to all three larrea plants in all 12 plots. In all three cases (
E. farinosa,
A. dumosa and
A. salsola) there were no significant correlations (
p > 0.05) between height, chlorophyll index and distance to indicate that
Larrea plants might have had a negative impact on the growth of non-Larrea plants. However, we recognize that the plants in our study would not be considered as mature plants and that a physiological response may have occurred that was not assessed. Further research would need to be conducted to truly rule out an allelopathic response. However, a visual assessment of size, canopy density and color did not reveal any visual response.
At the end of the supplemental water period, we waited 3.8 years to measure stem elongation. Thirty-three of the 36 Larrea plants revealed elongation whereas only 5 of 36 A. dumosa plants revealed elongation, 4 of 35 A. salsola plants and only 3 of 35 E. farinosa plants revealed positive elongation over the extended dry period (totals < 36 was associated with mortality during the wet period). ANOVA associated with the Larrea elongation data set indicated a significant separation based on treatment (p = 0.019) with the −25% treatment having the highest average stem elongation (33.1 cm, SEM 4.8) with separation from the 0% (15.2 cm, SEM 2.3) and +100% (15.4 cm, SEM, 1.7) treatments but not with the +200% treatment (20.9 cm, SEM 5.2). Although the results were somewhat mixed, it should be noted that the −25% treatment was released from a more stressful condition when the plants were allowed to receive only precipitation during the 3.8-year dry period.
Leaf xylem water potential was measured at mid-day after the extended dry period (October 2024). Water potentials were separated based on species (p < 0.001) and based on treatment (p = 0.002). An approximate −1.0 MPa separation occurred based on species (E. farinosa not assessed because of stem succulence) with A. salsola averaging −2.12 MPa vs. A. dumosa at −3.37 MPa and L. tridentata at −4.34 MPa (Std Err of LS mean −0.087). A clear statistical separation (October 2024) based on treatments imposed during the wet period revealed the −25% (−3.08 MPa) and 0% (−3.01 MPa) were statistically different from the +100% (−3.5 MPA) and +200% (−3.51 MPa) treatments (Std Err LS Mean −0.101). A multiple comparison procedure (Holm–Sidak method) revealed statistical separation (p < 0.05) between the wetter treatments; +200% and +100% (more negative) vs. the drier treatments; −25% and 0% (more positive).
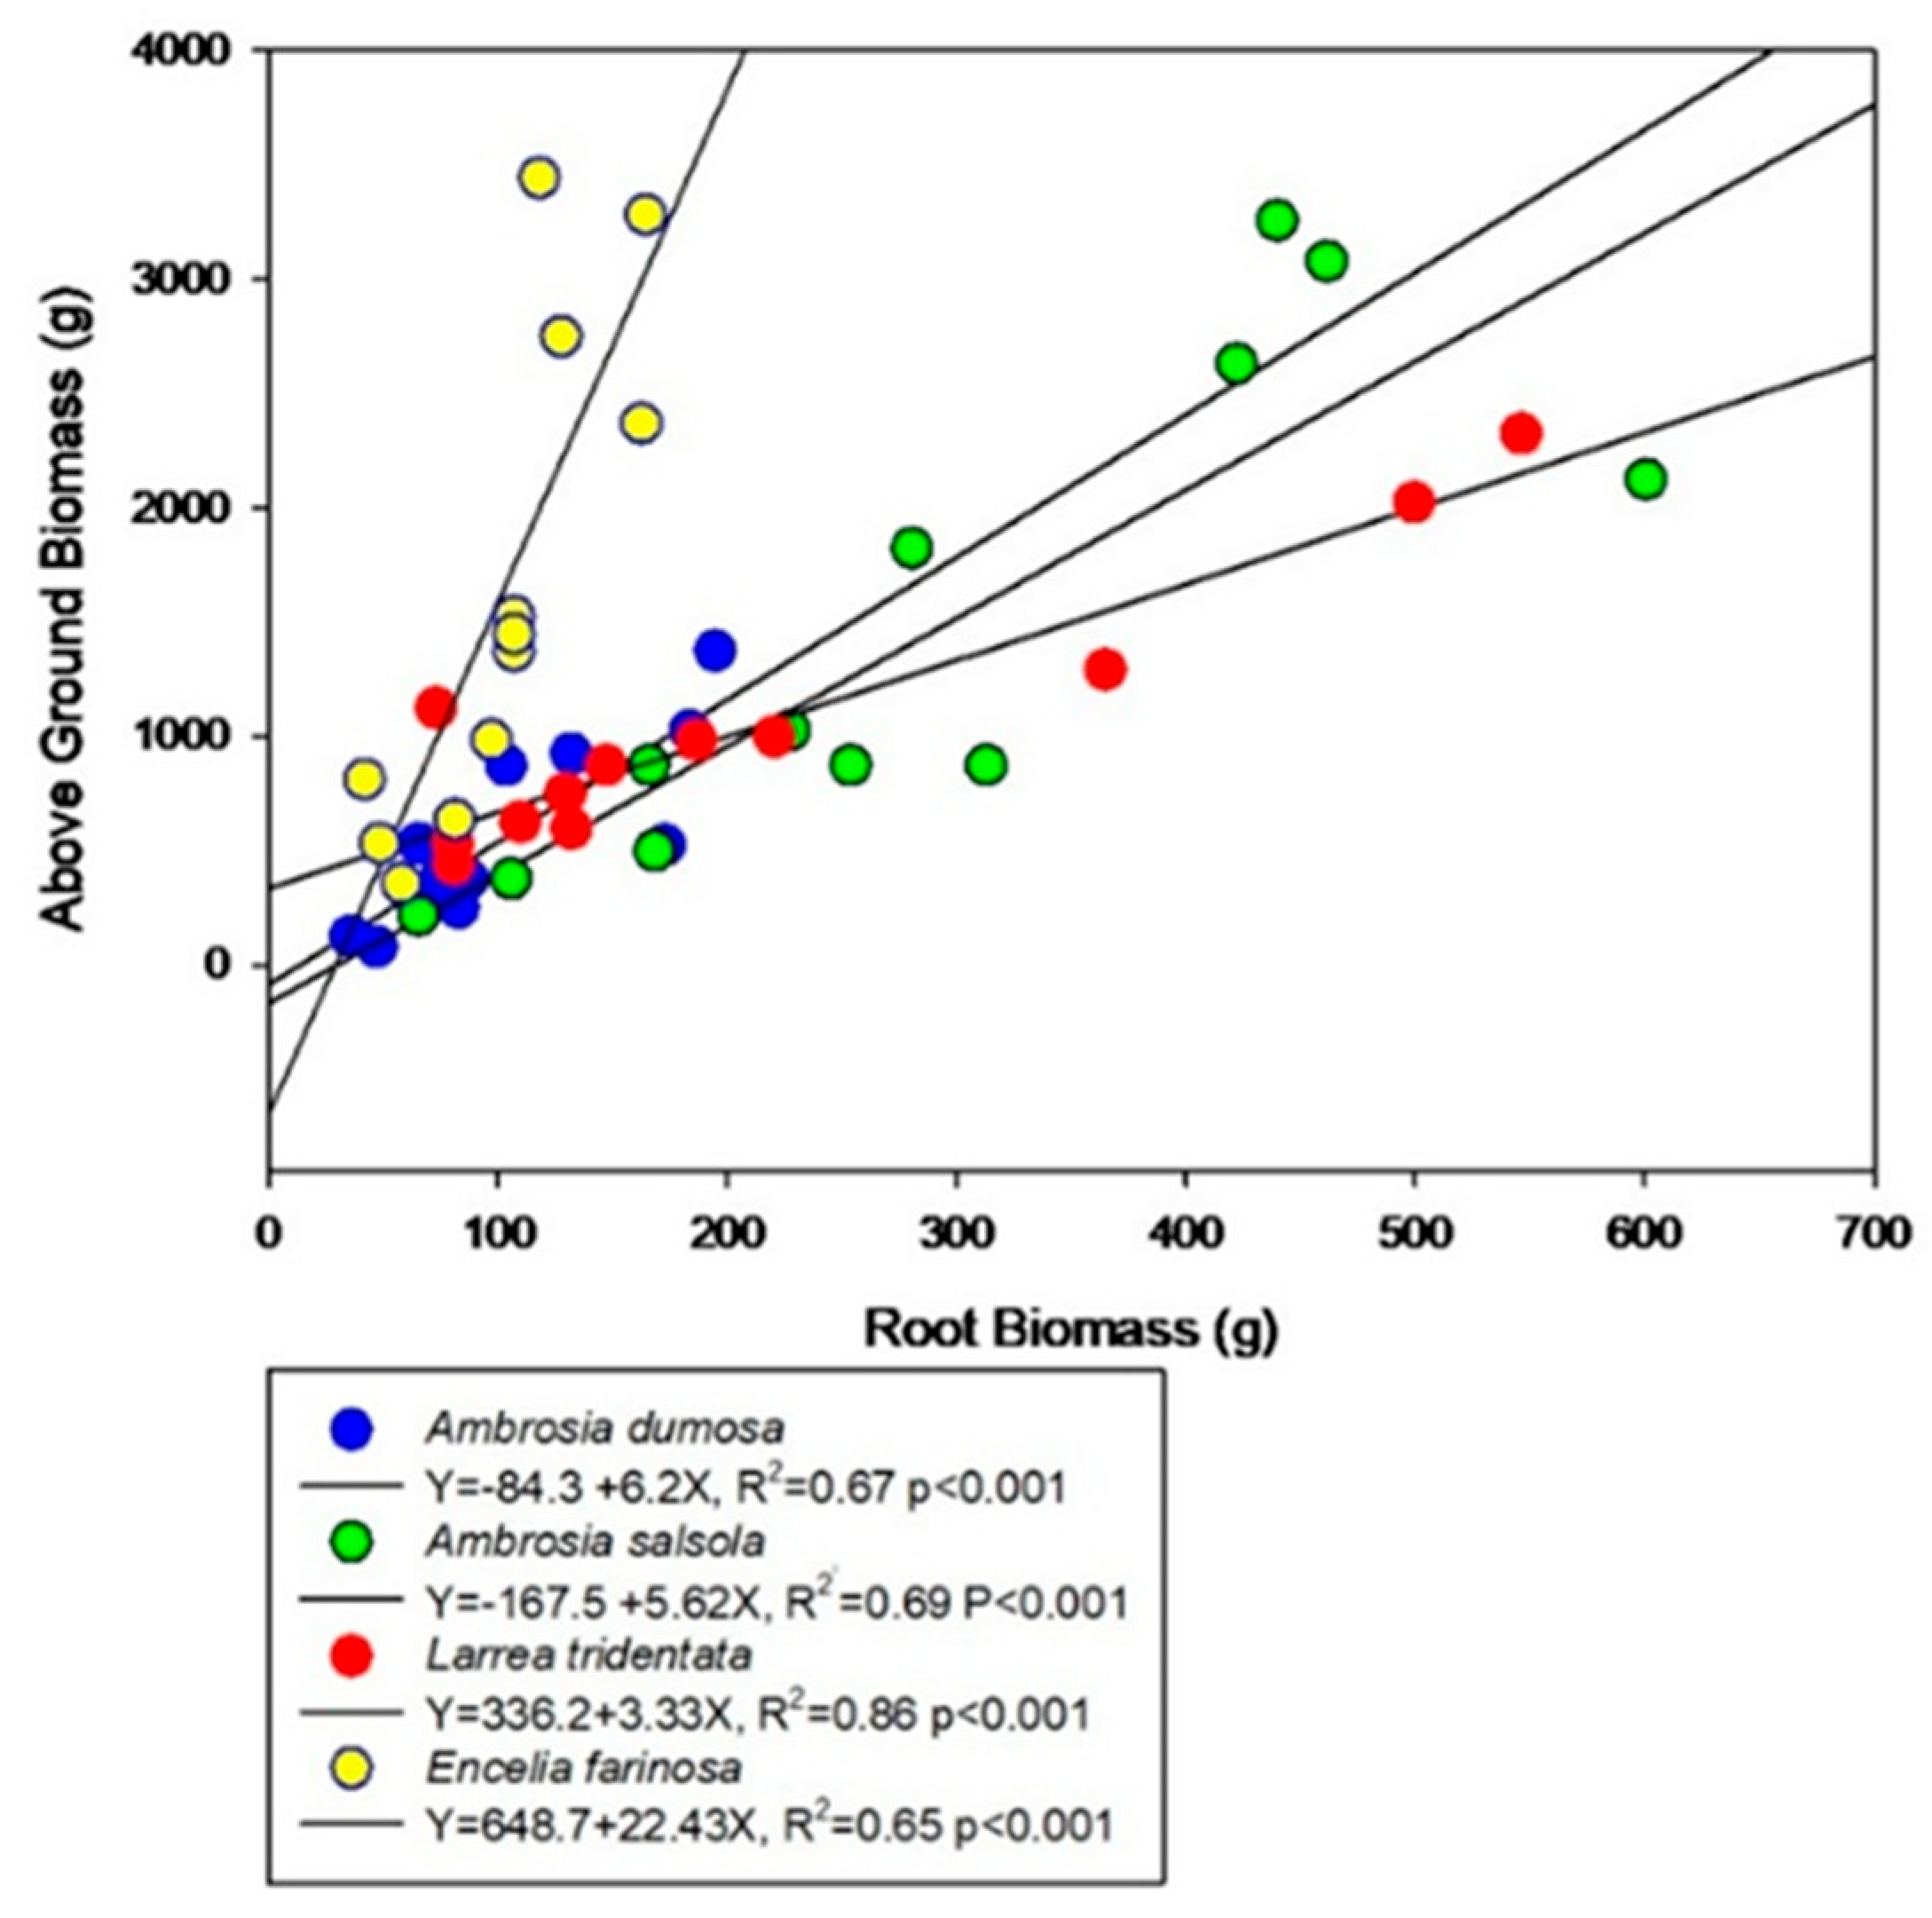
Because we did not have time nor funding to harvest all of the plants in the 12 experimental plots, we selected one plot of each treatment and harvested all 12 plants at the end of the 3.8-year dry period (48 plants), separating above ground plant material from excavated roots (
Table 3). We recognize that we did not recover all roots from the perspective of root length and root surface area but we believe we did capture the majority of roots from a mass weight perspective. Root mass (g) was found to be highly correlated in a positive way with shoot mass (g,
Figure 11) in all four species (
E. farinosa R
2 = 0.65,
p < 0.001,
A. salsola R
2 = 0.69
p < 0.001 and
A. dumosa (R
2 = 0.69,
p < 0.001)).
Encelia farinosa revealed a steeper slope than the other species in the change in root biomass associated with a change in above ground biomass (smaller root mass supporting a larger above ground biomass). In the case of
L. tridentata we could account for about 18% more of the variation in shoot mass based on root mass (shoot mass (g) = 336.2 + 3.3 Roots(g), R
2 = 0.86,
p < 0.001). Two-way ANOVA’s revealed a statistical separation based on treatment (
Table 3,
p < 0.001) and species (
p < 0.001) with root mass 3.5 times larger when comparing the +200% treatment (284.3 g) vs. the −25% treatment (80.1 g) and 2.9 times larger when comparing
A. salsola (291.8 g) with
E. farinosa (101.5 g) and
A. dumosa (104 g). Above ground plant tissue (referred to as shoots) separated based on treatment (
p < 0.001) and by species (
p < 0.001) with the +200% shoots (2206 g) 3.8 times larger than the −25% treatment plants (584.8 g). Whereas,
E. farinosa (1627 g)
A. salsola (1472 g) and
L. tridentata (1048 g) were all significantly different from
A. dumosa (564 g). Root/shoot ratios also separated statistically based on treatment (
p = 0.02) and species (
p < 0.001). However, the results were more mixed with the +100% treatment revealing separation from the other treatments and only the
E. farinosa plants (0.08) revealing separation based on species (
L. tridentata 0.19,
A. salsola 0.24 and
A. dumosa 0.24).
Canopy volumes were assessed at the end of the wet period and at the end of the 3.8-year dry period. Change in volume was calculated for each of the plants harvested for roots and shoots. Change in canopy volumes revealed statistical differences based on species (p < 0.001) and treatment (p < 0.001) with only Larrea revealing an increase (33.8%) in canopy volume over the 3.8 year post supplemental water period, whereas canopy volumes of E. farinosa (−47.2%), A. salsola (−35.6%) and A. dumosa (−32.2%) all decreased in canopy volume over this same period. Interestingly, canopy volumes decreased under the wetter treatments (+100%, −38.1% and +200%, −23.4%) but increased under the drier treatments (0%, +15.8% and −25%, +4.6%). Change in canopy volumes of L. tridentata could be described by a change in treatment (Δ Canopy volume = 1.151 − 0.009 Trmt, R2 = 0.62, p = 0.01) whereas E. farinosa change in canopy volume could be described by differences in root mass (Δ canopy volume = −1.055 + 0.005 Roots (g), R2 = 0.74, p < 0.001) with higher canopy volume changes associated with higher root mass. In the case of A. dumosa, change in canopy volume was directly influenced by treatment and root/shoot ratios (Δ canopy volume = 0.193 − 0.002 Trmt − 1.45 R/S, R2 = 0.60, p = 0.04) but only R/S ratios in A. salsola influenced change in canopy volume (Δ canopy volume = 0.136 − 1.959 R/S, R2 = 0.26, p = 0.05).
4. Discussion
Droughts and mega-droughts are predicted to be more prevalent in the future for southwestern North America [
3,
23], including the already hot and arid Mojave Desert. Deserts exist in a permanent state of aridity, receiving less than 25 cm of precipitation per year [
24]. Under such harsh conditions, native plants must be able to maintain a tight water balance to grow, reproduce and survive. Xeric ecosystems, however, are described as areas that have prolonged periods of water stress that are only intermittently alleviated [
25]. Even though total precipitation is low in deserts, how that water is distributed on both a spatial and temporal basis directly impacts how much water plants will be able to access, which in turn directly impacts long-term growth and survivability. In the case of the Mojave Desert, the majority of precipitation occurs in the cooler months of the year [
26], resulting in clear wet and dry periods. Climate change has already been shown to impact plants in the Mojave Desert through changes in precipitation amount and the seasonal timing of precipitation [
25]. Growth of Mojave Desert shrubs varies based on wet vs. dry years [
9], and whether seasonal precipitation predominates in the cool season or after summer monsoons [
4]. In our study, a ± experimental manipulation of water inputs over two growing seasons, we observed a 58% decrease in ambient annual precipitation, with little precipitation over a 6-month period in year two. Diffenbaugh et al. [
27] defined climate change in terms of extreme values, such as the 58% decrease in precipitation we observed in our study. The extent of these wet and dry periods and the sequence of these periods must also be taken into consideration as it has been shown to lead to complex dynamic responses at the ecosystem level [
16], with plant growth responding not only to water availability but also to longer antecedent climate conditions.
If significant growth occurs during a wet period and a subsequent dry period occurs, greater growth and leaf area during the wet period may lead to greater vulnerability of the plants to elevated levels of stress and even possible catastrophic hydraulic failure, depending on how long the dry period lasts. McAuliffe and Hamerlynck [
28] stressed the importance of the cumulative effects of successive drought years in the Mojave Desert on shrub mortality. Of course, each species may respond differently by employing a diverse range of strategies, such as enhanced root development, a slowing of growth and even the downsizing of plant canopies [
29,
30,
31,
32].
In our study, we provided a range in supplemental water from −25% to +200% of ambient rainfall over a two-year period followed by a 3.8-year dry period in which no supplemental water was added. Precipitation in 2023 during that intervening dry period was 13.5 cm which was about twice as high as that which occurred during 2021, 2022 or 2024 (5.18, 5.23 and 6.32 cm), but still significantly less than the 25 cm threshold for arid regions. Our data helps fill the gap in knowledge about how Mojave Desert plants respond to wet and dry periods, how such periods impact soil moisture, and how that impacts the morphology and physiology of the plants [
33]. Our results compliment the work of Hamerlynck et al. [
34], who showed
Larrea tridentata to be photosynthetically active during lengthy dry periods. In fact, all four shrub species in our study (the evergreen
Larrea tridentata and deciduous
Ambrosia dumosa,
Ambrosia. salsola, and
Encelia farinosa) remained active (chlorophyll Index, T
c − T
a, ΨL), during an extended 6-month dry period in which almost no precipitation occurred. We also report that all four species maintained tight control over leaf xylem water potential during the wet period, as we observed no significant response to water treatments. At the same time, we observed significant soil water extraction in the higher water treatments at greater depths (60–100 cm) that are typically more seasonally constant [
6]. This deeper extraction prevented deep redistribution and drainage from occurring. Under such dry conditions, evapotranspiration was equal to the sum total of precipitation plus supplemental water. No deep percolation has been reported [
13,
35] in the Mojave Desert, indicating that shrub species differentially increase or decrease water uptake based on how much water is available in the soil.
The deep-rooted
Larrea had no significant differences in height or canopy volume based on water treatments. However,
Ambrosia dumosa,
A. salsola, and
E. farinosa all had significant changes in height associated with the water treatments, demonstrating variability in plant sensitivity. There was not a consistent pattern of positive plant response to the enhanced water treatments based on species, including: increased canopy volume (
A. dumosa,
E. farinosa); increased chlorophyll index (
A. dumosa,
E. farinosa,
L. tridentata) and increased seed weight (
A. dumosa,
A. salsola). Leaf xylem water potential did not vary based on treatment, differing only across species. This led us to concur with others [
6,
13] that
L. tridentata relies heavily on deeper roots to maintain physiologically viable tissue water potentials while remaining active even during dry periods of the year.
Ambrosia dumosa also maintains similar leaf xylem water potential throughout the year [
36], but this is probably more related to its seasonal deciduous habit rather than deeper root water uptake [
35]. Smith et al. [
6] found
Ephedra nevadensis and
Haplopappus cooperi from the northern Mojave Desert had higher leaf xylem water potentials in soils with higher soil water in storage, while our research showed no difference in leaf xylem water potentials based on treatment. However, changes in soil moisture a week or more before water potential measurements can affect leaf water potential and the influence of vapor pressure deficit on leaf water potential [
33]. The lack of a clear response of leaf xylem water potential to soil moisture in our study may have been because our measurements were not taken on a frequent enough basis.
We assessed plant stress with a plant water stress index. A crop water stress index (CWSI, same as our PWSI) has been used in an agricultural setting [
37] and also in a natural environment setting, where the stress index was found to be a reliable technique to asses stress at the ecosystem level [
38]. We also saw PWSI to be a good indicator of stress. All plants had a higher stress index in the −25% treatment compared to the +200% treatment. Most species revealed a negative relationship between height and PWSI, as lower levels of stress (lower PWSI) were associated with taller plants. We found that plants with higher chlorophyll index values were also associated with a lower stress index value. CWSI has been reported [
38] to have an exponential negative relationship with soil water content, with higher CWSI values as soil water content declined. The results of our study showed a negative correlation between PWSI and soil water in storage for
E. farinosa, revealing that as soil moisture decreased PWSI increased.
5. Conclusions
The long-term effects of altered precipitation due to possible climate change are not yet fully known, but plants in our study responded to the higher water treatments by increasing their water use and increasing various aspects of growth that were species dependent. The ability to down-regulate growth in dry years has the potential to allow plants to be better positioned to endure extended dry periods in the future. It is also not fully clear how Mojave Desert shrubs will react to stronger wet/dry cycles, although the response observed in our study to supplemental amounts of water followed by an almost 4-year dry period suggest they were well adapted to such conditions, as all four species had percent survival between 97 and 100% after the 3.8-year dry period. However, only L. tridentata revealed significant stem elongation rates (33 of 36 plants) measured after the dry period. A clear legacy effect associated with high water availability during a two-year wet period revealed that the plants growing in the wetter treatments had more negative leaf xylem water potentials after the 3.8-year dry period (−3.5 MPa) than measured in plants that were subjected to the drier treatments (−3.1 MPa). Only in the case of L. tridentata did plants increase in canopy volume after the 3.8-year dry period. Canopy volumes measured at the end of the dry period were shown to decrease if plants were grown under the wetter treatments imposed during the first two years, whereas they increased if grown under the drier treatments with change in canopy volume varying based on species but also based on water treatment, root mass and/or root shoot ratios. Based on our findings, more research is needed on root water extraction patterns and root growth and die-back under varying wet dry cycles.
Although desert plants are well adapted to live in hot and dry conditions, all plants have thresholds (such as soil water potential and canopy and ambient temperatures) which if exceeded can lead to elevated levels of stress and possible mortality. If provided enough time many desert plants may be capable of adaptive adjustments,
Encelia farinosa leaves have been reported to undergo substantial acclimation in the Mojave Desert in response to long-term climate change [
5]. However, if climate change accelerates and PWSI values continue to rise, high mortality may be inevitable. We agree with others [
28] that
L. tridentata possesses a unique ability to shift growth when water and climate are more favorable and to even increase growth once released from stress in a compensatory manner. At the same time, the three deciduous species also demonstrated drought tolerance, but not compensatory growth after the extended dry period, suggesting that they may be more vulnerable to increasing drought cycles than the evergreen
Larrea.