Article

Urban Remote Sensing Ecological Quality Assessment Based on Hierarchical Principal Component Analysis and Water Factor Enhancement: A Case Study of Linyi City, Shandong Province, China


1
School of Artificial Intelligence, China University of Geosciences (Beijing), Beijing 100083, China
2
The 7th Institute of Geology and Mineral Exploration of Shandong Province, Linyi 276006, China
3
School of Land Science and Technology, China University of Geosciences (Beijing), Beijing 100083, China
4
Technology Innovation Center for Territory Spatial Big-Data, Ministry of Natural Resources of the People’s Republic of China, Beijing 100036, China
5
Technical Centre for Soil, Agricultural and Rural Ecology and Environment, Ministry of Ecology and Environment, Beijing 100012, China
*
Authors to whom correspondence should be addressed.
Land 2026, 15(1), 196; https://doi.org/10.3390/land15010196
Submission received: 12 November 2025 / Revised: 15 January 2026 / Accepted: 19 January 2026 / Published: 21 January 2026
(This article belongs to the Special Issue GeoAI Application in Urban Land Use and Urban Climate)

Abstract

Rapid urbanization has significantly affected urban ecological environments, necessitating accurate and scientific quality assessments. In this study, we develop an enhanced remote sensing ecological index (WRSEI) for water network cities using Linyi City, China, as a case study. Key innovations include (1) introducing a water–vegetation index to better represent aquatic ecosystems; (2) incorporating nighttime light data to quantify the intensity of human activity; and (3) employing hierarchical PCA to rationally weight ecological endowment and stress indicators. The model’s effectiveness was rigorously validated using independent land use data. The results show that (1) the WRSEI accurately captures Linyi’s “water–city symbiosis” pattern, increasing the assessed ecological quality of water bodies by 15.78% compared to the conventional RSEI; (2) hierarchical PCA provides more ecologically reasonable indicator weights; and (3) from 2000 to 2020, ecological quality exhibited a pattern of “central degradation and peripheral improvement”, driven by urban expansion. This study establishes a validated technical framework for ecological assessment in water-rich cities, offering a scientific basis for sustainable urban management.

1. Introduction

As one of the most profound human-induced land transformations, urbanization has fundamentally reshaped the relationship between human societies and natural ecosystems. While cities are engines of socioeconomic development, they also place significant pressure on the environment, leading to challenges such as habitat fragmentation, urban heat islands, and water resource degradation [1,2]. The scientific and accurate assessment of urban ecological quality is therefore essential in guiding sustainable urban planning and management, particularly in rapidly developing regions.
Remote sensing technology provides a powerful tool for large-scale and dynamic ecological monitoring. The remote sensing ecological index (RSEI), which synthesizes greenness (NDVI), wetness, dryness, and heat indicators via principal component analysis (PCA), has been widely adopted for regional ecological assessment due to its objectivity and efficiency [3,4,5]. However, its application in water network cities has several limitations: (1) it often masks water bodies to calculate wetness, inadvertently neglecting their positive ecological contributions [6,7]; (2) it fails to incorporate pressure due to human activity, which is a key driver of urban ecological change [8]; (3) standard PCA treats all indicators equally, which could result in overlooking their differing ecological roles and lead to biased weight assignments [9,10]. These shortcomings necessitate further refinement of the RSEI framework to enable more accurate assessments in complex urban environments.
To address the above gaps, this study proposes a water-enhanced remote sensing ecological index (WRSEI) with three key improvements: (1) introducing a water–vegetation index (NDWVI) to better represent the ecological role of water bodies within the greenness component [11]; (2) integrating nighttime light (NTL) data as a proxy for the human activity intensity (HAI) [12]; and (3) employing hierarchical PCA (HPCA) to group indicators (ecological endowment vs. stress) for more rational weighting. Taking Linyi City—a typical water network city in China that is undergoing rapid urbanization—as a case study, we apply the WRSEI to evaluate its spatiotemporal ecological quality from 2000 to 2020. This study establishes a novel technical framework that enhances the accuracy of ecological assessments for water-rich cities, providing a scientific reference for urban ecological management and planning.

2. Materials and Methods

2.1. Study Area

Linyi City is located in the southeastern part of Shandong Province within the Yishu River Basin and serves as the central city in the Southern Shandong–Northern Jiangsu region. Several rivers, including the Yi, Beng, Su, and Liuqing Rivers, flow through the urban area. Since the 1990s, multiple dams have been constructed across these rivers, creating large water surfaces and positioning the area as a “water city”. With the acceleration of urbanization, both the ecological deficit and ecological pressure index in Linyi have increased annually, indicating an imbalance among population growth, environmental management, resource utilization, and economic development [13,14]. Accurately assessing the combined effects of urban construction and expanded surface water on ecological quality is therefore essential for future urban development planning.
The study area encompasses the main urban districts of Linyi (Figure 1), including Lanshan, Luozhuang, and Hedong, as well as their closely connected suburban zones. The region has a temperate monsoon climate with four distinct seasons. The Yi River, known as the “Mother River” of Linyi, runs through the city center, while its tributaries, such as the Beng, Su, and Liuqing Rivers, jointly create a unique urban landscape and ecosystem. Since the beginning of the 21st century, rapid economic development has taken place alongside the construction of hydraulic facilities and accelerated urbanization; these factors position Linyi as an ideal case to study the interactions between urbanization and the ecological environment in water network cities.

2.2. Data Collection

Landsat 7 ETM+ imagery from 2000 and 2011 and Landsat 8 OLI/TIRS imagery from 2020, acquired during the summer under low cloud cover, were selected as the primary data sources (Table 1). All images were obtained from the Geospatial Data Cloud of the Computer Network Information Center, Chinese Academy of Sciences (https://www.gscloud.cn/). The data were Level 2 products that had been preprocessed for radiometric calibration and atmospheric correction. Subsequent image clipping for the study area, land surface temperature (LST) retrieval using the atmospheric correction method, and Kauth–Thomas (KT) transformation to extract the wetness component were performed in ENVI 5.6.
SLC-Off Data Restoration: For the Landsat 7 ETM+ imagery acquired in 2011, the Scan Line Corrector (SLC) failure resulted in data gaps. To address this, we employed the Landsat 7 SLC-Off Gap Fill Tool in ENVI to restore the missing data. This enabled us to effectively reduce striping artifacts, ensuring the spatial continuity and reliability of the derived ecological indicators for the 2011 analysis.
The NTL data used in this study were obtained from the global long-term nighttime light (LongNTL) dataset and the global urban extent dataset provided jointly by Tsinghua University and Beijing Normal University [15,16]. The dataset is based on the harmonized global NTL dataset (1992–2020), which served as the primary data source in mapping the temporal evolution of global urban expansion. It was generated under an integrated global framework combining DMSP/OLS and VIIRS data, in which advanced algorithms were applied to eliminate inter-sensor inconsistencies. The dataset has provided continuous and comparable high-quality NTL information since 1992. In addition, transient light sources such as wildfires and industrial flares, as well as background noise, were removed through masking procedures, ensuring long-term consistency and reliability. This dataset accurately reflects stable nighttime lighting from human settlements and can therefore be used to characterize the intensity of human activity.

2.3. Methods

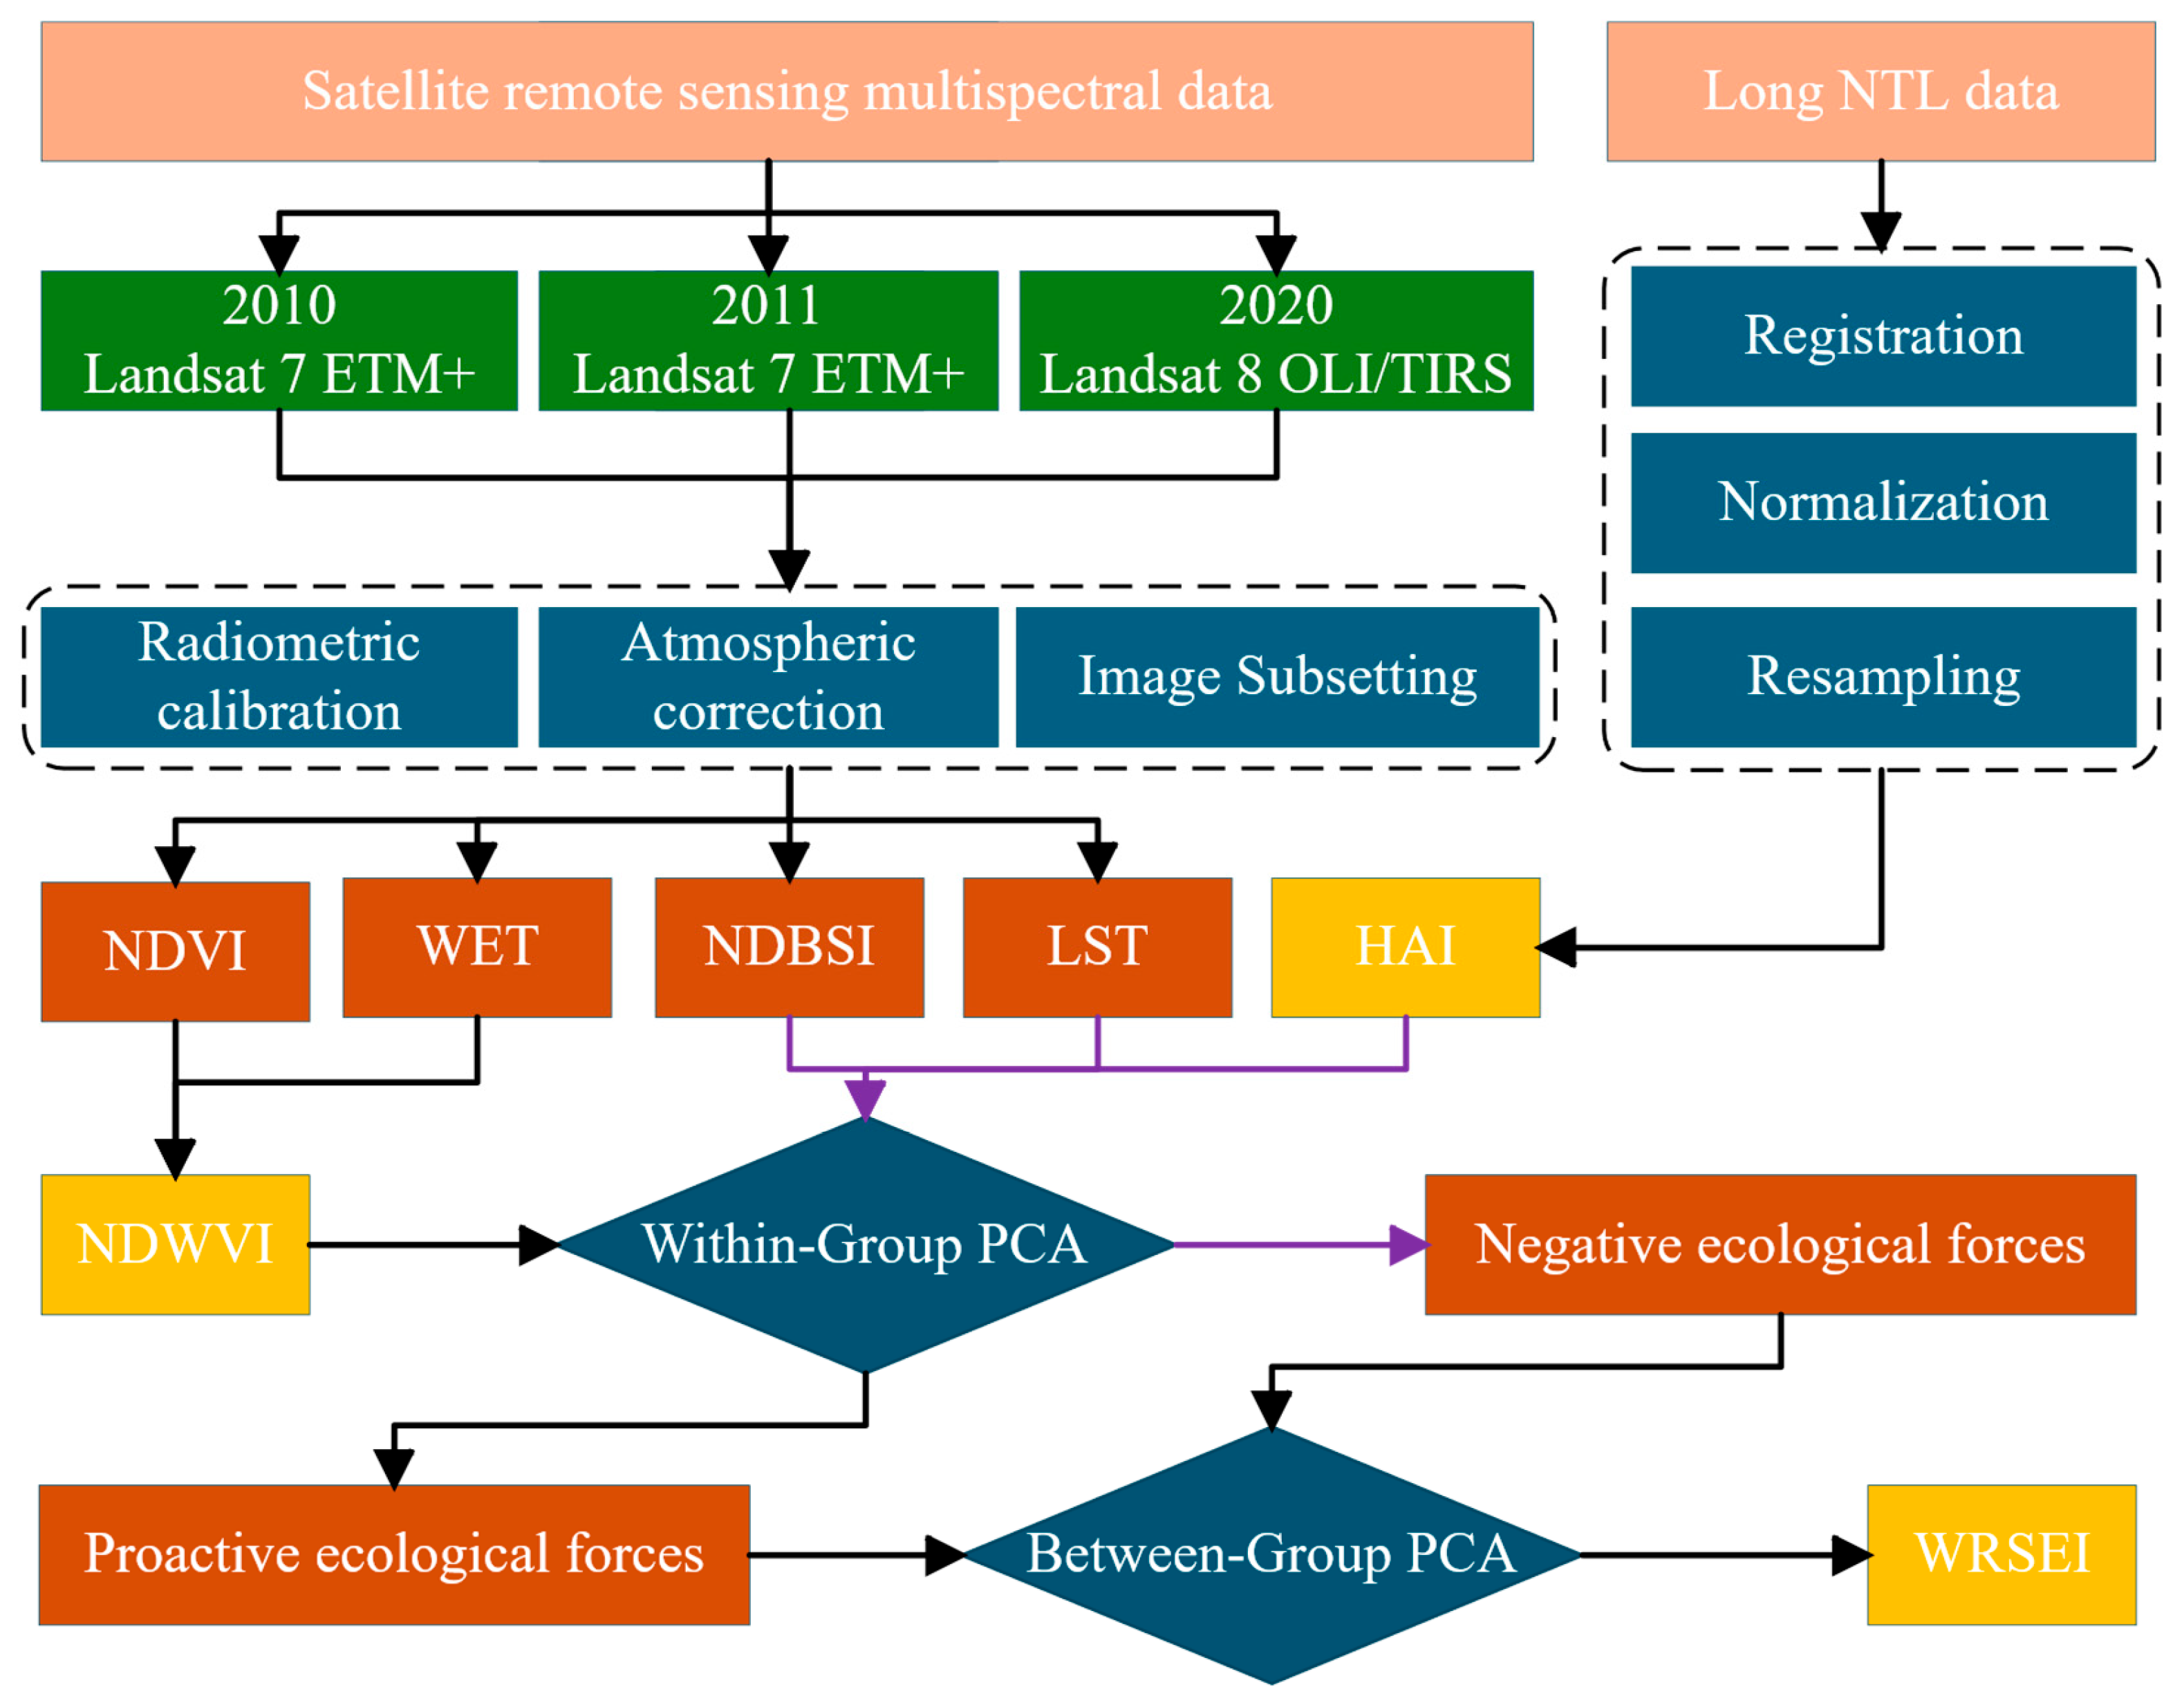
The core focus of this study lies in the construction of the WRSEI, which innovatively incorporates water factor enhancement [17], human activity intensity (HAI) [12], and HPCA. First, all remote sensing datasets were preprocessed, and the initial ecological indicators were calculated. Second, water factor enhancement was applied. Areas with normalized wetness (LSM_nor) values greater than 0.8 were identified as initial water bodies. Within these areas, the arithmetic mean of the normalized difference vegetation index (NDVI_nor) and LSM_nor was defined as the normalized difference water–vegetation index (NDWVI), which replaced NDVI_nor with regard to water body regions in order to generate a greenness indicator that better reflected aquatic ecological characteristics. Meanwhile, the NTL data were normalized to introduce a new indicator representing the human activity intensity. Finally, the NDWVI, LSM_nor, NDBSI, LST_nor, and NTL_nor were grouped into two dimensions: ecological endowment and ecological pressure. These indicators were integrated using HPCA to construct the WRSEI. The resulting index was subsequently used for spatiotemporal analysis and validation.
The construction process is illustrated in Figure 2. First, multispectral remote sensing data from different years were processed into four indicators: NDVI, WET, NDBSI, and LST; then, after spatial registration, resampling, and normalization, LongNTL data were used to determine the HAI. These five indicators were categorized into ecological endowment indicators (NDVI, WET) and ecological stress indicators (NDBSI, LST, HAI). Finally, the two groups of indicators were separately subjected to within-group PCA, followed by between-group PCA on their respective principal components, to derive the WRSEI.
Furthermore, to scientifically validate the selection of the LSM threshold (0.8) in the water enhancement algorithm, this study conducted a systematic sensitivity analysis. A gradient of threshold values (0.70, 0.75, 0.80, 0.85, 0.90) was established, and the areas identified as water bodies under each threshold, along with the corresponding mean WRSEI values, were calculated accordingly. This analysis aimed to (1) evaluate the impact of threshold variation on the water body identification results; (2) confirm the appropriateness of the 0.8 threshold in accurately identifying water bodies while avoiding the inclusion of moist non-aquatic surfaces; and (3) verify the rationality of threshold selection. The calculations were performed using ENVI IDL scripts for batch processing, and the results were comprehensively evaluated based on three indicators: the area (hectares), the area proportion (%), and the mean ecological quality index (WRSEI).

2.4. Ecological Index

This study builds upon the ecological indicator framework proposed by Xu Hanqiu [3] and Mukesh Singh Boori [4], retaining the indicators of wetness, dryness, and heat while enhancing the greenness component through water factor adjustment and introducing the HAI. These modifications resulted in the construction of five environmental indicators for the WRSEI (Table 2). All indicators and the final index were linearly normalized to constrain their values within the range of [0, 1]. The normalization formula was as follows:
X _ nor = ( X X min ) / ( X max X min )
where X is the original data value, Xmin is the minimum value of the original data, Xmax is the maximum value of the original data, and X_nor is the normalized value.

2.4.1. Wetness

The wetness component was obtained using the KT transformation. The KT transformation is a linear transformation designed for specific sensors; it enables the conversion of multispectral data into a set of components with clear physical meanings [18,19]. For the Landsat 7 ETM+ sensor, the KT coefficients are nearly identical to those of the earlier Landsat 5 TM sensor but differ from those of the Landsat 8 OLI sensor. In this study, the classical KT coefficients established by Crist and Cicone [19] for the Thematic Mapper series sensors, and those established by Baig et al. [20] for the Operational Land Imager sensor, were applied to calculate the wetness component. The calculation formula is as follows:
Landsat 7 ETM+:
LSM   =   0.2626 ρ β + 0.2141 ρ g + 0.0926 ρ r + 0.0656 ρ nir 0.7629 ρ sw 1 0.5388 ρ sw 2
Landsat 8 OLI:
LSM   =   0.1511 ρ β + 0.1973 ρ g + 0.3283 ρ r + 0.3407 ρ nir 0.7117 ρ sw 1 0.4559 ρ sw 2
In the above formulas, ρβ, ρg, ρᵣ, ρnir, ρsw1, and ρsw2 represent the reflectance of the blue, green, red, near-infrared, shortwave infrared 1, and shortwave infrared 2 bands, respectively.

2.4.2. Greenness

Traditionally, greenness is represented by NDVI_nor [21]. This index reflects the abundance and vigor of vegetation based on the difference in reflectance between the near-infrared and red bands, and it is one of the most commonly used indicators in assessing surface vegetation coverage [22]. The calculation formula is as follows:
NDVI   =   ( ρ nir ρ r )   /   ( ρ nir + ρ r )  
where ρnir and ρr represent the reflectance of the near-infrared and red bands, respectively. NDVI_nor ranges from −1 to 1, and higher values indicate better vegetation coverage.
Considering the widespread distribution of water bodies in the study area, the traditional greenness index masks water pixels, failing to reflect the positive ecological contribution of water, and this may lead to distortions in subsequent calculations [23]. To address this issue, in this study, the NDWVI was introduced to enhance the greenness component through water factor adjustment.
The calculation process was as follows. To optimize the identification of water bodies while minimizing misclassification or confusion with moist soil, water enhancement regions were determined based on a systematically validated threshold. A sensitivity analysis was performed across a range of normalized LSM_nor thresholds (0.70, 0.75, 0.80, 0.85, 0.90) to assess their effects on water area extraction and the corresponding ecological index values. The threshold of 0.8 was selected as it resulted in an optimal balance between the accurate delineation of major water bodies (e.g., the main channels of the Yi River) and the exclusion of non-aquatic moist surfaces. Within these enhancement regions, the normalized difference water–vegetation index (NDWVI) was calculated as the arithmetic mean of NDVI_nor and LSM_nor, thereby integrating both vegetation greenness and surface wetness into a composite aquatic ecological indicator. For other areas, NDVI_nor was retained. The NDWVI did not require additional normalization. The calculation formula was as follows:
NDWVI = ( NDVI _ nor + LSM _ nor ) / 2 , LSM _ nor 0.8 NDVI _ nor , LSM _ nor < 0.8
This operation aimed to eliminate the noise of water bodies in the greenness indicator and reflect their positive contribution to the remote sensing ecological quality index. Accordingly, a water factor-enhanced NDWVI component was constructed to replace the traditional greenness component in the ecological indicator system.

2.4.3. Dryness

Dryness is represented by the NDBSI. This index integrates the built-up index (IBI_nor) and the soil index (SI_nor) [3,24,25] and effectively characterizes dry surface features such as bare soil and urban built-up areas. The NDBSI did not require additional normalization. Higher NDBSI values indicate a greater proportion of bare soil or impervious surfaces, corresponding to poorer ecological conditions. The calculation formula is as follows:
NDBSI   =   ( IBI _ nor + SI _ nor )   /   2
SI = [ ( ρ sw 1 + ρ r ) ( ρ nir + ρ β ) ] / [ ( ρ sw 1 + ρ β ) + ( ρ nir + ρ β ) ]
IBI = 2 ρ sw 1 ρ sw 1 + ρ nir ρ nir ρ nir + ρ r + ρ g ρ g + ρ sw 1 / 2 ρ sw 1 ρ sw 1 + ρ nir + ρ nir ρ nir + ρ r + ρ g ρ g + ρ sw 1
where ρβ, ρg, ρᵣ, ρnir, and ρsw1 represent the reflectance of the blue, green, red, near-infrared, and shortwave infrared bands, respectively.

2.4.4. Heat

Heat is represented by the land surface temperature (LST). For the Landsat 7 ETM+ data used in this study, the LST was retrieved using the single-window algorithm proposed by Artis and Carnahan (1982) [26], based on the thermal infrared band (band 6) [27]. For the Landsat 8 TIRS data, the LST was retrieved using the single-channel algorithm developed by Jiménez-Muñoz et al. [28]. In this algorithm, the imagery is first radiometrically calibrated to calculate the brightness temperature. Then, the surface emissivity estimated via the NDVI threshold method is combined with the brightness temperature to obtain the actual LST (°C) according to Equation (9):
LST   =   Tb   /   1 + λ Tb / ρ   ln ε 273.15
where λ is the central wavelength of the thermal infrared band (λ ≈ 11.45 μm for ETM+ band 6 and λ = 10.9 μm for TIRS band 10); ρ = hoc/σ ≈ 1.438 × 10⁻² m·K, where σ is the Stefan–Boltzmann constant, h is Planck’s constant, and c is the speed of light. ε represents the land surface emissivity. In this study, ε was estimated using the NDVI threshold method. The vegetation fraction Pv was first calculated as follows:
Pv   =   [ ( NDVI     NDVI _ soil )   /   ( NDVI _ veg     NDVI _ soil ) ] 2
where NDVI_soil and NDVI_veg represent the NDVI values of pure soil and pure vegetation, which were empirically set to 0.05 and 0.7, respectively. Subsequently, the land surface emissivity (ε) was estimated according to the land cover type. The following equation is applicable to mixed pixels containing both vegetation and soil:
ε   =   0.9625   +   0.0614   Pv     0.0461   Pv 2

2.4.5. Human Activity Index

NTL data have been widely demonstrated to be highly correlated with the population density, energy consumption, and the level of urbanization, making them an ideal proxy to represent the intensity of human activity [29]. In this study, the HAI component was constructed based on NTL data, seeking to quantify the intensity of anthropogenic pressure [30,31]. The NTL data were first resampled to a 30 m spatial resolution using bilinear interpolation and spatially registered to align with the Landsat imagery. All datasets were standardized to the WGS_1984_UTM_Zone_50N coordinate system. Subsequently, linear normalization (Equation (1)) was applied to remove dimensional effects and enhance their comparability. NTL_nor ranges from 0 to 1, with higher values indicating a stronger HAI.

2.5. Hierarchical Principal Component Analysis

PCA is a classical technique for data dimensionality reduction and feature extraction [32]. It is used to transform a set of possibly correlated variables into a new set of linearly uncorrelated composite variables through an orthogonal linear transformation. These composite variables, known as principal components, retain the maximum intrinsic variance of the original dataset [33].
In PCA, multiple potentially correlated indicators are converted into a smaller number of uncorrelated comprehensive indicators through orthogonal transformation. It has been widely applied in remote sensing-based ecological and environmental assessments [3,25]. However, in the traditional PCA method, all indicators are synthesized at the same level, without considering their ecological orientations (positive or negative). In this study, to overcome this limitation, we improve the traditional PCA and propose the HPCA approach. In this method, indicators are first grouped according to their ecological meanings, followed by intragroup and intergroup PCA integration. This hierarchical structure allows the weight distribution to better align with ecological logic and indicator relationships [34].

2.5.1. Indicator Grouping

According to their ecological significance, the five indicators were divided into two groups: ecological endowment indicators and ecological stress indicators. The ecological endowment indicators included the NDWVI and WET_nor, while the ecological stress indicators consisted of the NDBSI, LST_nor, and NTL_nor.

2.5.2. Within-Group PCA

In traditional evaluation methods, the determination of indicator weights often depends on expert judgment, which introduces subjectivity. In PCA, the weights of indicators are objectively determined based on their intrinsic variability (variance). Indicators with larger variance contribute more information and therefore usually have higher weights in the first principal component. In this study, PCA was performed separately within each indicator group, and the first principal component of each group (PC1a and PC1b) was extracted. PC1a represents the comprehensive effect of ecological endowment indicators, while PC1b represents that of ecological stress indicators. This step was intended to integrate the intragroup information of ecological endowment and ecological stress.

2.5.3. Intergroup PCA

PC1a and PC1b were further subjected to PCA, and the first principal component (PC1_final) was extracted. Through this procedure, the weight assignment process was shifted from focusing on a single-layer “indicator–composite index” to a two-layer structure consisting of “indicator–within-group synthesis–between-group synthesis”, allowing the weight distribution to better reflect ecological logic. The resulting value served as the basis for the calculation of the WRSEI.

2.5.4. WRSEI Calculation

PC1_final was linearly normalized (Equation (1)) to obtain the final WRSEI values. A higher WRSEI value indicates better ecological quality. Based on the WRSEI values, the ecological quality of the study area was classified into five levels for subsequent statistical analysis: very low (0.0–0.2), low (0.2–0.4), moderate (0.4–0.6), high (0.6–0.8), and very high (0.8–1.0).

2.5.5. Hierarchical PCA Weight Calculation and Statistical Outputs

Table 3 presents the complete statistical outputs of the HPCA, using the 2020 data as an example. In the first step, in the ecological endowment group, PC1a exhibited an eigenvalue of 0.1037, explaining 98.58% of the within-group variance, with loadings of 0.9555 (NDWVI) and −0.2949 (wetness), indicating nearly lossless information compression. In the second step, in the ecological stress group, PC1b showed an eigenvalue of 1.5922, explaining 53.07% of the within-group variance, with loadings of −0.6519 (NDBSI), −0.6797 (heat), and −0.3361 (NTL), achieving moderate information compression. In the third step, in the intergroup PCA, PC1_final demonstrated an eigenvalue of 1.5448, explaining 77.24% of the total variance, with equal loadings of 0.7071 for both PC1a and PC1b, indicating equal contributions of ecological endowment and stress to the final index.
Based on these statistical outputs, the final weights for each indicator were calculated through loading chain transmission (Table 4). Taking the 2020 data as an example, the final weight distribution was as follows: NDWVI (33.92%), Wetness (10.46%), NDBSI (23.13%), Heat (24.12%), and NTL (11.93%). This non-equal weight allocation reflects the relative importance of each indicator to the ecological quality of Linyi City, with Heat and the NDWVI being the most influential indicators.
Through its layered statistical transparency, the HPCA method enables researchers to precisely evaluate the information retention rate at each step (ecological endowment group: 98.58%; ecological stress group: 53.07%; overall synthesis: 77.24%), thereby avoiding the information loss inherent in conventional PCA.

3. Results and Discussion

3.1. Analysis of the Water Factor Enhancement Effect

To confirm the effectiveness and superiority of the proposed water factor enhancement algorithm, the main channels of the Yi, Beng, Su, and Liuqing Rivers within the urban area in 2020 were selected as typical regions for a comparison between the traditional NDVI and the enhanced NDWVI. The analysis was conducted from three perspectives: spatial distribution characteristics, statistical distribution characteristics, and ecological rationality.

3.1.1. Comparison of Spatial Distribution Characteristics

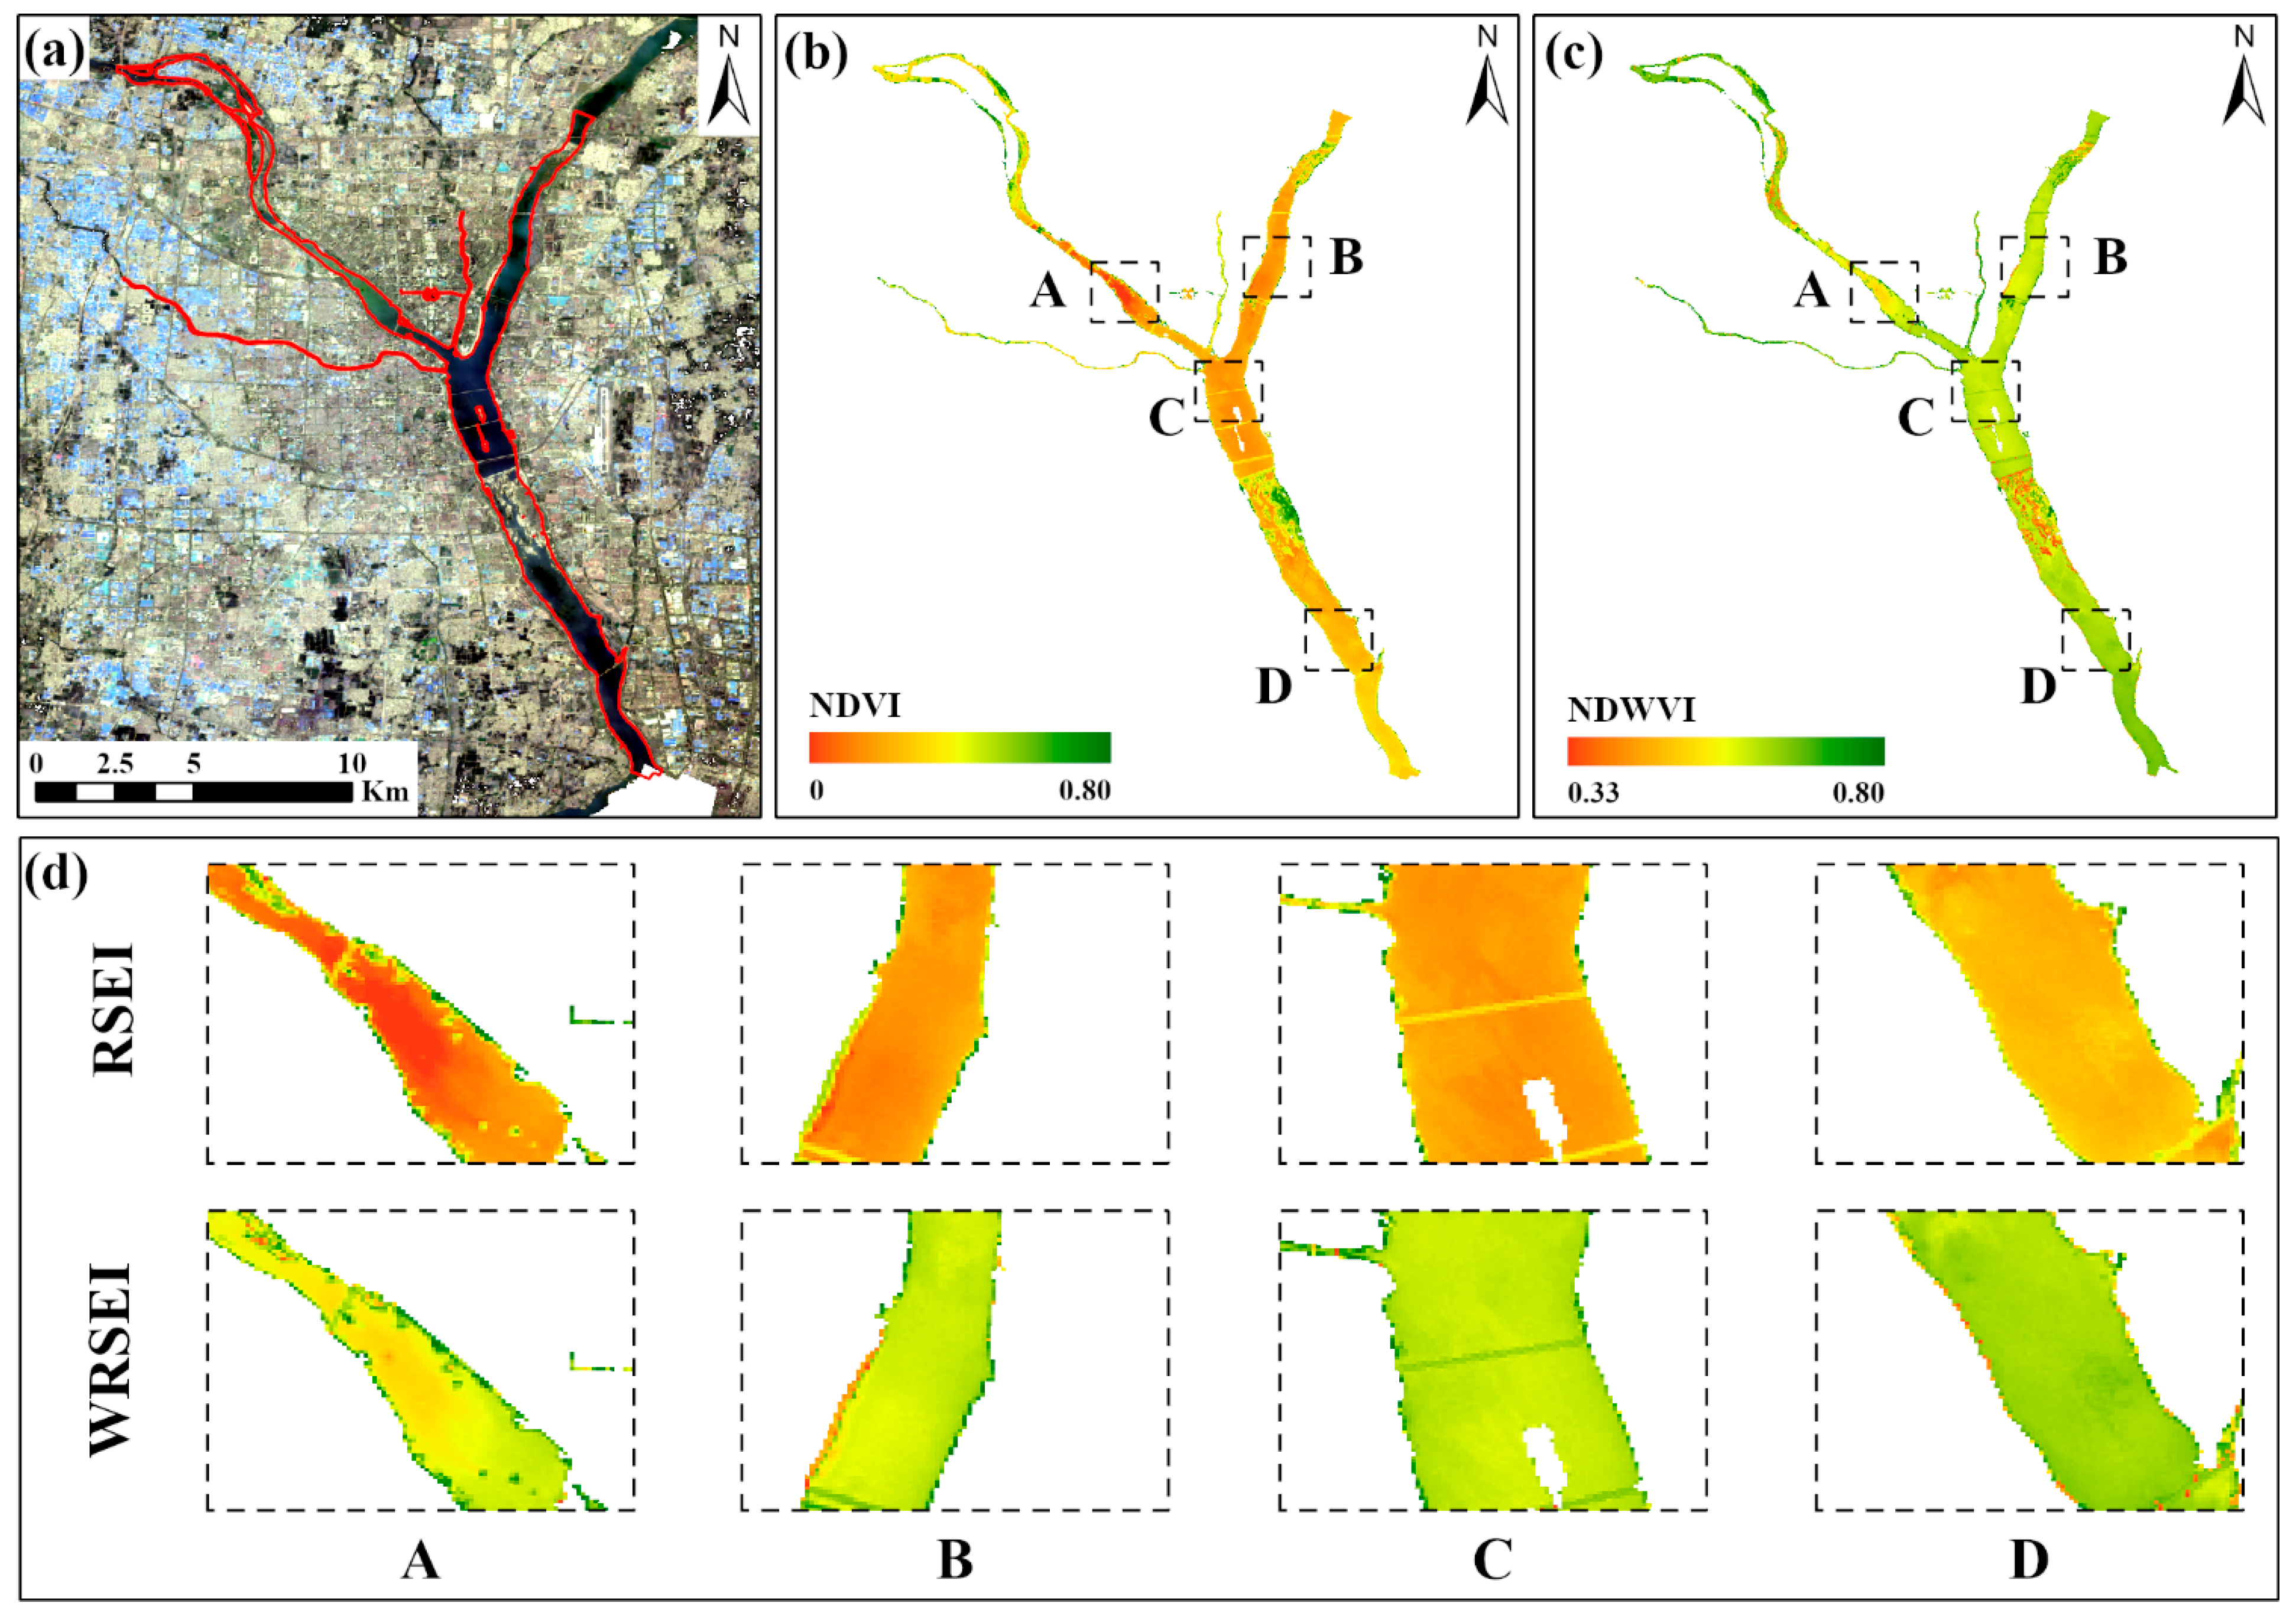
The composite imagery, NDVI_nor, and NDWVI distribution patterns of the representative area are shown in Figure 3. As illustrated in Figure 3b, the traditional NDVI_nor exhibits significant distortion over large water bodies. Because water surfaces have low reflectance in both the near-infrared and red bands, their NDVI_nor values are generally low and they appear as red or yellow areas in the map. As a result, rivers and reservoirs are often misclassified as “non-vegetated” or “low-ecological-quality” zones, failing to reflect their essential ecological functions in regulating the urban microclimate, maintaining ecological balance, and providing landscape and recreational services. Therefore, NDVI_nor alone is insufficient to accurately represent the ecological conditions in water-rich urban environments.
As shown in Figure 3c, the NDWVI derived from the water factor enhancement algorithm effectively corrects the distortions. Major water bodies, such as the Yi River, are clearly delineated and display medium-to-high values (light blue to blue areas), consistent with their ecological importance and the characteristics of adjacent wetlands. The NDWVI simultaneously captures both the “wetness” of water surfaces and the “greenness” of aquatic vegetation, producing a spatial distribution that aligns more closely with geographic reality and visual perception. This enhancement significantly improves the ecological representation of water areas and provides a more robust basis for WRSEI-based ecological quality assessment.

3.1.2. Comparison of Statistical Distribution Characteristics

To further quantify the enhancement effect, the NDVI_nor, NDWVI, RSEI, and WRSEI values were extracted from a representative area and subjected to descriptive statistical analysis (Table 5). As shown in Table 5, the mean NDVI_nor value of water pixels was 0.31, indicating a relatively low level and confirming the tendency to misclassify water bodies as “bare soil” or areas with “low vegetation coverage”. In contrast, the mean NDWVI value reached 0.57, which is significantly higher than that of the NDVI; it enables the clear identification of water bodies as areas with high ecological endowment.
Additionally, the standard deviation of NDVI_nor (0.11) was relatively large, suggesting considerable variation and instability among the values over water surfaces; this is likely caused by factors such as sun glint, suspended sediments, and sensor noise. While the NDWVI exhibited a smaller standard deviation (0.05), indicating a more concentrated and stable distribution that enhanced the robustness of water representation. Another notable finding is that the introduction of the NDWVI led to an increase in the mean ecological index of water body areas—from 0.38 in the RSEI to 0.44 in the WRSEI, representing an overall rise of 15.79%. This enhancement highlights the positive ecological effect of the water body distribution in the study area.

3.1.3. Ecological Rationality and Limitations of the Water Enhancement Mechanism

The distortion caused by traditional RSEI models in evaluating water bodies originates from their physical limitations, as these models fail to account for the unique spectral properties of water surfaces [35,36,37]. The ecological rationality of the water factor enhancement mechanism proposed in this study is mainly reflected in the correction of the physical mechanism and an improvement in the comprehensive evaluation accuracy.
The NDVI is based on the strong absorption of red light by chlorophyll and the strong reflection of near-infrared light by plant cell structures [38]. However, water bodies exhibit strong absorption in both the red and near-infrared bands, rendering the NDVI ineffective in aquatic environments. The NDWVI incorporates the water-sensitive wetness component and fuses it with NDVI_nor at the pixel level, thereby creating a new index that is highly responsive to “moist vegetation” or “water-rich environments”. This index comprehensively captures the positive ecological functions of water bodies, such as climate regulation, hydrological buffering, habitat provision, and the enhancement of ecological connectivity.
In subsequent integrated evaluations, the use of the unenhanced NDVI_nor tends to result in the underestimation of the ecological value of rivers, thereby lowering the overall RSEI. In contrast, the use of the NDWVI allows rivers and associated wetlands to be correctly represented as areas of high ecological value, ensuring that urban river ecological corridors are appropriately emphasized in the final results. Consequently, the ecological pattern of “water–city symbiosis” is more accurately characterized. This approach holds significant practical value for ecological planning, spatial optimization, and management in water-rich cities such as Linyi.
It is important to note that the proposed NDWVI and the WRSEI model primarily reflect the presence and hydrological influence of water bodies, exhibiting a positive ecological contribution based on their physical presence and the associated vegetation moisture. This approach does not directly account for variations in water quality, such as those due to pollution or eutrophication. While a severely polluted urban river may have high wetness, in reality, it may provide limited or negative ecological services. This represents a current limitation of the index. Future iterations could be strengthened by integrating water quality parameters derived from remote sensing (e.g., turbidity, chlorophyll-a concentration) to distinguish between healthy and degraded aquatic ecosystems, thereby providing a more nuanced assessment of urban water body ecology.

3.1.4. Sensitivity Analysis of LSM Threshold

Table 6 presents the results of the sensitivity analysis for different LSM thresholds. As the threshold was increased from 0.70 to 0.90, the area identified as water bodies exhibited an exponential decline, sharply decreasing from 115,289.02 ha to 3.33 ha—a reduction of 99.97%. Concurrently, the mean WRSEI values within the identified water areas displayed a unimodal pattern, initially rising and then falling: within the threshold range of 0.70–0.80, the mean WRSEI increased significantly from 0.257 to 0.482. When the threshold exceeded 0.80, although the mean WRSEI reached a peak of 0.516 at a threshold of 0.85, it dropped sharply to 0.271 at a threshold of 0.90.
The sensitivity analysis reveals three key findings. Firstly, excessively low thresholds (0.70–0.75) lead to the misclassification of a substantial number of non-water pixels, such as moist soil and farmland, as water bodies. Although the identified area is large, the mean ecological index remains low (0.257–0.293), failing to accurately reflect the true ecological contribution of water bodies. Secondly, a threshold of 0.80 results in the best balance between area and ecological quality. The identified water area of 9779.13 ha exhibits a relatively high mean WRSEI value (0.482), and this aligns well with the known distribution of major rivers, reservoirs, and other water bodies in Linyi City. Thirdly, while excessively high thresholds (0.85–0.90) can result in filtering out core water body regions with the highest ecological quality (with the WRSEI reaching 0.516), the identified area is too small (accounting for only 0.002–3.47% of the study area), resulting in the omission of numerous transitional zones with significant ecological functions, such as riparian zones and shallow-water areas.
The sensitivity analysis (Table 6) indicates that, with an LSM threshold of 0.80, the identified water body area amounts to 9779.13 ha, constituting approximately 5.05% of the total study area. This proportion is consistent with the spatial characteristics of Linyi City as the “Water City of the North”, encompassing major water systems such as the main channels of the Yi, Beng, and Liuqing Rivers, as well as urban water features such as surfaces formed by rubber dams.

3.2. Analysis of Contribution of Human Activity Intensity Indicator

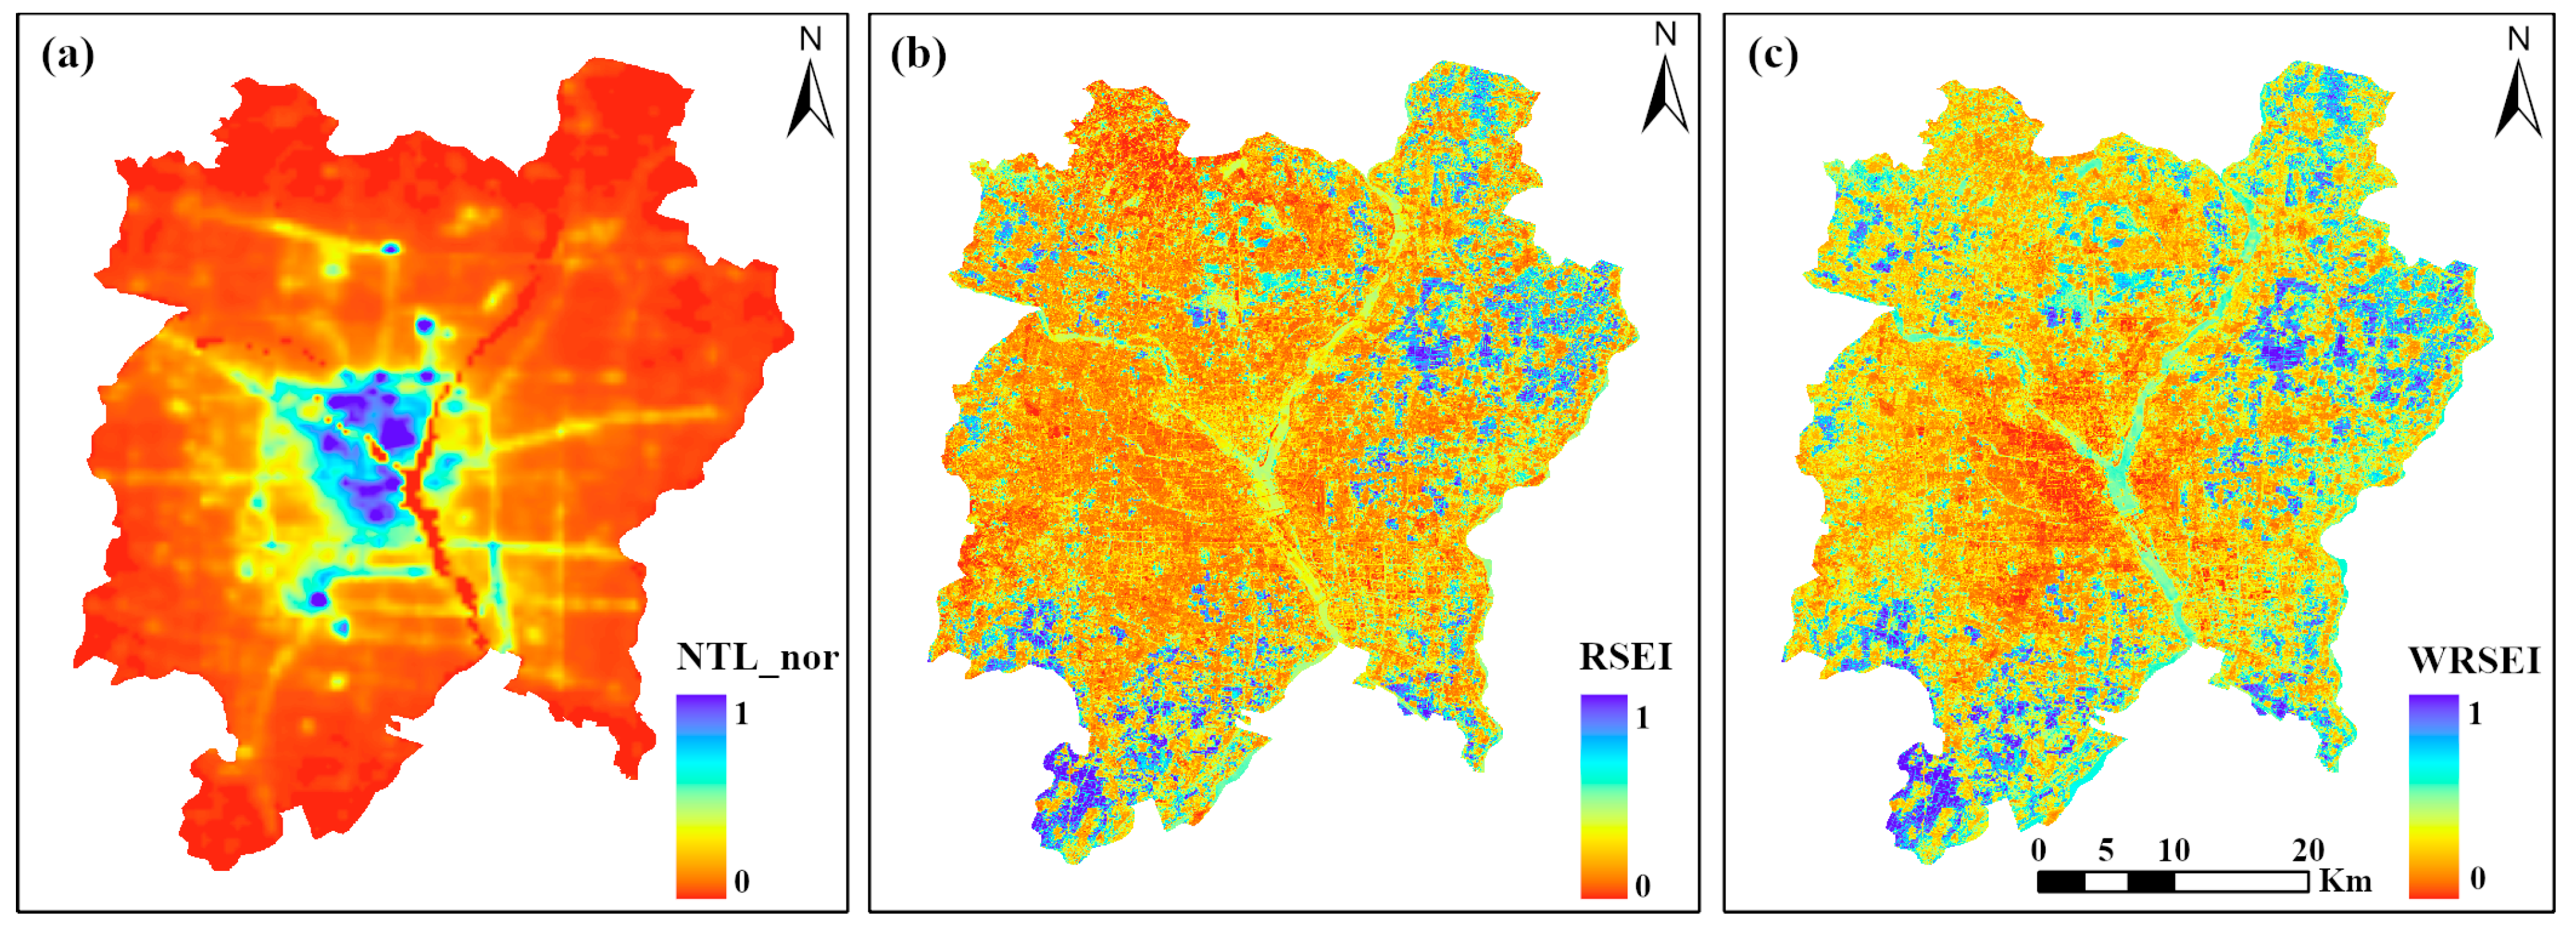
In constructing the WRSEI, this study incorporated normalized nighttime light data (NTL_nor) to represent the HAI. A comparison of the 2020 NTL_nor, RSEI, and WRSEI (Figure 4) reveals that the traditional RSEI produces a broadly homogeneous pattern of “moderate” or “poor” ecological quality across both the urban core and peripheral areas (Figure 4b), failing to capture the internal spatial heterogeneity within the city. In contrast, the WRSEI results (Figure 4c) clearly show that the lowest-ecological-quality zones (red patches) are spatially consistent with areas of intense human activity identified using NTL_nor, such as central business districts and industrial parks. These regions exhibit significantly lower WRSEI values than their surroundings, forming distinct “ecological depressions” that correspond closely to the distribution of impervious surfaces. This finding demonstrates that the WRSEI offers a more sensitive and accurate reflection of the ecological stress caused by high-intensity human activity, substantially improving the model’s ability to characterize urban ecological degradation patterns.
From the urban center to the suburban fringe, a clear pattern can be observed: the traditional RSEI exhibits a relatively gentle gradient in the urban–rural transition zone, whereas the WRSEI displays a much sharper gradient. The spatial pattern of the WRSEI closely aligns with the brightness distribution of the NTL and demonstrates a clear attenuation trend with increasing distances from the city center. This indicates that incorporating NTL data significantly enhances the model’s ability to simulate ecological quality variations along the urban–rural gradient.
Overall, the inclusion of NTL data to represent the human activity intensity contributes substantially to improving the performance of remote sensing-based ecological evaluation models. The WRSEI results show stronger spatial coupling with human activity patterns and provide a more refined depiction of urban–rural ecological structures. Mechanistically, the WRSEI more accurately reflects ecological stress induced by high-intensity human activities, such as industrialization and urbanization, resulting in evaluation outcomes that better correspond to the real-world ecological conditions.

3.3. Validation of Model Effectiveness

3.3.1. Comparative Analysis of WRSEI and RSEI

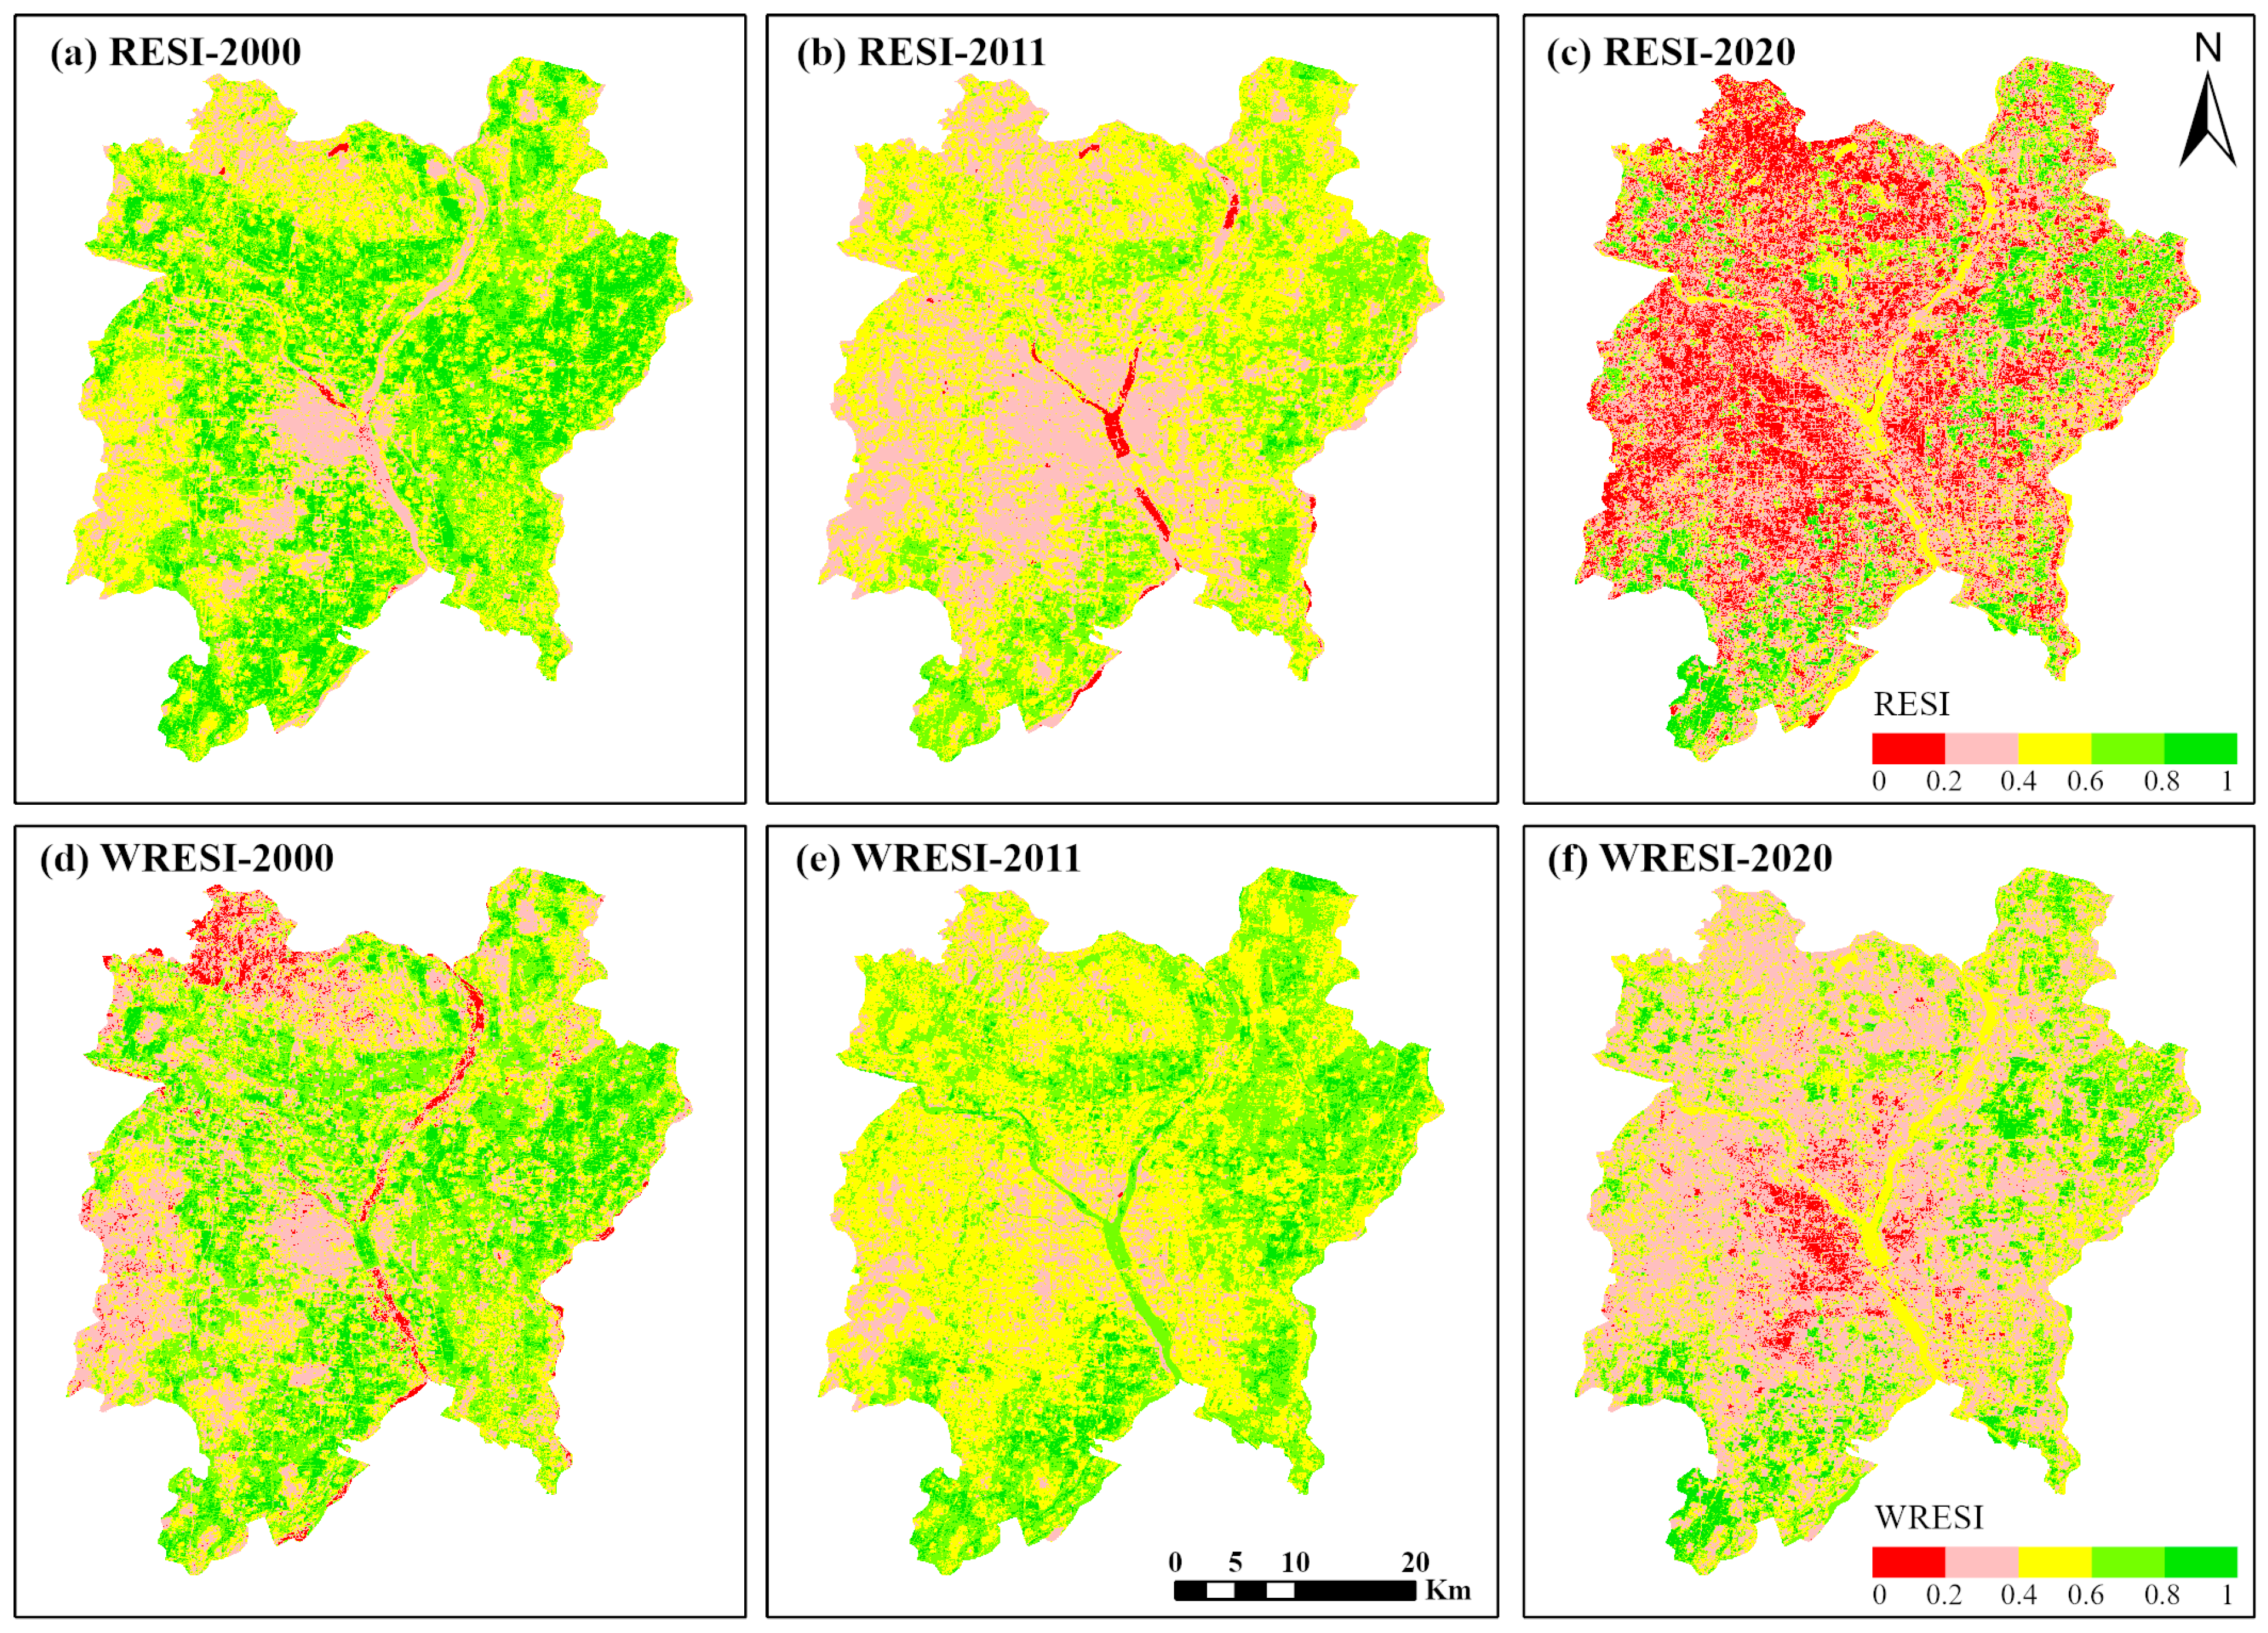
To verify the effectiveness of the improved model, the evaluation results of the RSEI and WRSEI for 2000, 2011, and 2020 were compared (Figure 5). Among the RSEI results, large water bodies such as the Yi and Beng Rivers exhibited low greenness values, resulting in the underestimation of their overall ecological indices. Some river segments were even classified as “very low” areas, failing to reflect the positive ecological functions of urban water systems. In contrast, the WRSEI results showed that the index values of water pixels increased significantly after water factor enhancement. River areas were placed in the “very high”, “high”, or “moderate” categories, corresponding well with the actual ecological roles of the “water ecological corridors” in Linyi City. This finding confirms the necessity and validity of incorporating the water factor enhancement mechanism into the model.
As mentioned earlier, incorporating the human activity intensity as an ecological stress indicator into the evaluation framework [39] enables the model to more accurately reflect the ecological quality differences between urban and rural areas. This improvement effectively addresses the deficiency of the traditional RSEI in representing “human activity”, which is one of the most critical ecological stress factors. Consequently, the WRSEI results better align with the objective patterns of the human–nature coupled system. The enhanced model demonstrates higher sensitivity and ecological rationality in reflecting the spatial impacts of human activity, providing a reliable basis for urban ecosystem quality assessment and sustainable management.

3.3.2. Validation of Index Effectiveness Based on Land Use Types

To objectively evaluate the ecological representational capabilities of the WRSEI and RSEI, and to address potential circular reasoning in the methodology, this study introduced the land use data of Linyi City as an independent validation benchmark. This dataset was revised and updated based on the Third National Land Survey Data (Linyi City) and was an internal dataset. For practical application, land use types were categorized into five classes: agricultural land, construction land, forests and grassland, water bodies, and unused land. Table 7 presents the statistical distribution of the two indices across these different land use types.
The WRSEI demonstrates a more rational ecological gradient. The order of its mean ecological quality values is as follows: water bodies > forests and grassland > agricultural land > unused land > construction land. This aligns perfectly with the established expectations regarding inherent ecosystem service values for various land use types [39]. In contrast, the order for the RSEI is agricultural land > water bodies ≈ forests and grassland, indicating the severe underestimation of the ecological contributions of urban water bodies and natural vegetation.
In addition, the WRSEI shows a significant improvement in representing key land cover types. For water bodies, the mean WRSEI value (0.48) is 14.3% higher than that yielded by the RSEI (0.42), providing direct evidence for the effectiveness of the water enhancement algorithm. For construction land, the lower mean WRSEI value indicates heightened sensitivity in capturing the ecological pressure exerted by high-intensity human activities.
Finally, the WRSEI exhibits greater intraclass discriminative power. With the exception of agricultural land, the variance of the WRSEI is higher than that of the RSEI across all land use categories (Table 7). This suggests that the WRSEI aids in reflecting subtle differences in ecological quality within the same land cover class, demonstrating higher index sensitivity.
In summary, the validation analysis based on independent land use data indicates that the WRSEI not only corrects the “underestimation” bias of the RSEI towards water bodies and vegetation but also yields a spatial pattern of ecological quality that is more consistent with the true ecological attributes of land surface cover. This explains the stronger spatial coupling observed between the WRSEI and NTL data—it stems from the WRSEI’s more accurate ecological representation capabilities, rather than from the circular influence of the input indicators.

3.4. Spatiotemporal Variation in Ecological Quality in the Main Urban Area of Linyi

Based on the results of the WRSEI analysis (Figure 5, Table 8), the ecological quality of the study area exhibited pronounced spatiotemporal differentiation from 2000 to 2020. The proportion of areas of “very low” ecological quality (red) increased continuously, from 9.34% to 31.75%, with a growth rate of 240%. The “low” category (pink) also expanded steadily, from 27.90% to 34.18%, becoming the dominant class. In contrast, the “moderate” category (yellow) was reduced significantly, from 37.67% to 18.14%, representing a 51.84% decline, while the proportion of “high” and “very high” types combined (green and light green) decreased from 25.09% to 15.93%.
During 2000–2011, areas of “moderate” ecological quality were rapidly transformed into “low” areas (a decline of 15.13%). Between 2011 and 2020, the “very low” category expanded further (an increase of 12.13%), while those in the “high” category markedly decreased (a decline of 8.53%). By 2020, “very low” and “low” zones accounted for 65.93% of the total area, constituting the dominant ecological classes, whereas “moderate” areas accounted for only 18.14% and high-quality zones were scarce, comprising just 7.27%.
Spatially, the ecological quality pattern exhibited an overall trend of “central degradation and peripheral expansion”. From 2000 to 2020, the mean WRSEI value of the study area decreased from 0.47 to 0.36, indicating a gradual overall decline in ecological quality. The global Moran’s I values for the WRSEI in 2000, 2011, and 2020 were 0.869, 0.942, and 0.890, respectively, demonstrating significant positive spatial autocorrelation [5]. The changes in ecological quality exhibited a distinct pattern of “center–periphery” spatial differentiation. Areas of significant degradation were mainly concentrated in the old urban core of Lanshan District, Beicheng New District, and the industrial zones of Luozhuang and Hedong Districts. These regions have undergone the most intense urban expansion and land development; here, the decline in the WRSEI grade spatially overlapped with a notable increase in nighttime light brightness. Areas of notable improvement were mainly distributed along the rehabilitated river corridors of the Yi and Beng Rivers and in the agricultural and forested lands on the urban periphery, benefiting from water conservation projects and sustained ecological restoration efforts. While these peripheral improvements can be reasonably linked to dedicated ecological restoration efforts, it is acknowledged that the predominantly agricultural nature of these areas introduces a potential confounding factor. Year-to-year variations in crop phenology and growth stages could influence spectral indices and thus the WRSEI values. In this study, restoration projects are identified as the primary driver due to the spatial concordance between improvement areas and specific restoration infrastructure, as well as the use of same-season imagery to minimize phenological disparities. Nevertheless, the influence of agricultural phenology cannot be entirely ruled out. Stable areas were primarily located in the southwestern mountainous regions and northeastern agricultural zones, where the ecological foundation remained relatively intact and changes in WRSEI levels were minimal.
The spatial pattern of “central degradation and peripheral improvement” in Linyi indicates that rapid, pancake-like urban sprawl has been the primary driver of ecological deterioration in the city center, while proactive hydraulic and ecological restoration projects such as dam construction and riverside greenbelt development have effectively improved the ecological quality in the peripheral areas.

4. Conclusions

This study proposed a water-enhanced remote sensing ecological index (WRSEI) to improve ecological quality assessment in water network cities. The WRSEI incorporates three key innovations: (1) a water–vegetation index (NDWVI) to better represent the ecological role of water bodies; (2) nighttime light (NTL) data as a proxy for human activity intensity (HAI) [8,30]; and (3) hierarchical principal component analysis (HPCA) to group indicators into ecological endowment and stress categories for more rational weighting [34]. Applying the model to Linyi City from 2000 to 2020 yielded the following main findings.
The WRSEI effectively corrects the systematic underestimation of water bodies inherent in the conventional RSEI [6,35]. By integrating wetness information into the greenness component, the mean ecological index value for water areas increased by 15.78%, providing a more accurate characterization of the “water–city symbiosis” pattern in Linyi. The incorporation of NTL data significantly enhanced the model’s sensitivity to anthropogenic pressure [15,29]. The resulting WRSEI maps show strong spatial coupling with human activity patterns, clearly identifying “ecological depressions” in high-intensity urban cores and improving the depiction of ecological gradients from urban to rural areas.
The HPCA approach provided a transparent, ecologically grounded weighting mechanism [9,34]. By performing PCA within and between indicator groups, the method assigned higher weights to the most influential indicators—heat and the NDWVI—while minimizing information loss from opposing ecological signals. Spatiotemporally, the WRSEI revealed a clear trend of “central degradation and peripheral improvement” in Linyi’s ecological quality from 2000 to 2020, driven by urban expansion in core areas and ecological restoration along river corridors [13,14].
Overall, the WRSEI framework offers a validated, transferable methodology for ecological monitoring in water-rich urban environments [3]. It provides a more scientifically robust basis for urban ecological management and sustainable planning.
Limitations and Future Perspectives: This study is constrained by the spatial resolution of Landsat and NTL data, which may obscure fine-scale ecological variations [40]. Phenological differences between images, though minimized, could also introduce bias [41]. Future research should integrate higher-resolution data, incorporate water quality parameters to distinguish healthy from degraded water bodies, and couple remote sensing indicators with socioeconomic datasets to enhance the model’s comprehensiveness and policy relevance.

Author Contributions

Conceptualization, X.L. (Xiaoyang Liu) and X.Z.; methodology, X.L. (Xiaocai Liu); software, X.L. (Xianglong Liu); validation, G.Y., F.J., and K.L.; formal analysis, X.L. (Xiaocai Liu) and K.L.; investigation, X.L. (Xiaocai Liu); resources, X.L. (Xiaocai Liu); data curation, G.Y., F.J., and K.L.; writing—original draft preparation, X.L. (Xiaocai Liu); writing—review and editing, X.L. (Xianglong Liu); visualization, X.L. (Xianglong Liu); supervision, X.L. (Xiaoyang Liu) and X.Z.; project administration, X.L. (Xiaocai Liu); funding acquisition, X.L. (Xiaocai Liu) All authors have read and agreed to the published version of the manuscript.

Funding

This work was supported by the Shandong Provincial Natural Science Foundation, China (Grant No. ZR2025QC382) and the Science and Technology Innovation Development Program of Lanshan District, Linyi City, Shandong Province, China (Grant No. 202301).

Data Availability Statement

The original contributions presented in the study are included in the article. Further inquiries can be directed to the corresponding authors.

Acknowledgments

We would like to thank all co-authors and reviewers for their valuable suggestions regarding this research.

Conflicts of Interest

The authors declare no conflicts of interest.

References

  1. Grimm, N.B.; Faeth, S.H.; Golubiewski, N.E.; Redman, C.L.; Wu, J.; Bai, X.; Briggs, J.M. Global Change and the Ecology of Cities. Science 2008, 319, 756–760. [Google Scholar] [CrossRef] [Scilit] [PubMed]
  2. Bai, X.; Dawson, R.J.; Ürge-Vorsatz, D.; Delgado, G.C.; Barau, A.S.; Dhakal, S.; Dodman, D.; Leonardsen, L.; Masson-Delmotte, V.; Roberts, D.C.; et al. Linking Urbanization and the Environment: Conceptual and Empirical Advances. Annu. Rev. Environ. Resour. 2017, 42, 215–240. [Google Scholar] [CrossRef] [Scilit]
  3. Xu, H. A Remote Sensing Index for Assessment of Regional Ecological Changes. China Environ. Sci. 2013, 33, 889–897. (In Chinese) [Google Scholar]
  4. Boori, M.S.; Choudhary, K.; Paringer, R.; Kupriyanov, A. Spatiotemporal Ecological Vulnerability Analysis with Statistical Correlation Based on Satellite Remote Sensing in Samara, Russia. J. Environ. Manag. 2021, 285, 112–138. [Google Scholar] [CrossRef] [Scilit]
  5. Hasan, M.M.; Ferdous, M.T.; Talha, M.; Mojumder, P.; Roy, S.K.; Zim, M.N.F.; Akter, M.M.; Nasher, N.M.R.; Hasher, F.F.B.; Boltižiar, M.; et al. Analyzing Ecological Environmental Quality Trends in Dhaka Through Remote Sensing Based Ecological Index (RSEI). Land 2025, 14, 1258. [Google Scholar] [CrossRef] [Scilit]
  6. Xu, H. Modification of Normalised Difference Water Index (NDWI) to Enhance Open Water Features in Remotely Sensed Imagery. Int. J. Remote Sens. 2006, 27, 3025–3033. [Google Scholar] [CrossRef] [Scilit]
  7. Xu, H.; Wang, M.; Shi, T.; Guan, H.; Fang, C.; Lin, Z. Detecting Ecological Changes with a Remote Sensing Based Ecological Index (RSEI) Produced Time Series and Change Vector Analysis. Remote Sens. 2019, 11, 2345. [Google Scholar] [CrossRef] [Scilit]
  8. Bolund, P.; Hunhammar, S. Ecosystem Services in Urban Areas. Ecol. Econ. 1999, 29, 293–301. [Google Scholar] [CrossRef] [Scilit]
  9. Cai, Z.; Zhang, Z.; Zhao, F.; Bo, L.; Wang, W. Assessment of Eco-Environmental Quality Changes and Spatial Heterogeneity in the Yellow River Delta Based on the Remote Sensing Ecological Index and Geo-Detector Model. Ecol. Inform. 2023, 77, 102203. [Google Scholar] [CrossRef] [Scilit]
  10. Yu, H.; Liu, D.; Zhang, C.; Liang, S.; Tu, W.; Chen, X. Research on Spatial-Temporal Characteristics and Driving Factors of Urban Development Intensity for Pearl River Delta Region Based on Geodetector. Land 2023, 12, 1673. [Google Scholar] [CrossRef] [Scilit]
  11. Zhang, L.; Hou, Q.; Duan, Y.; Ma, W. Spatial and Temporal Heterogeneity of Eco-Environmental Quality in Yanhe Watershed (China) Using the Remote-Sensing-Based Ecological Index (RSEI). Land 2024, 13, 780. [Google Scholar] [CrossRef] [Scilit]
  12. Ji, J.; Tang, Z.; Zhang, W.; Liu, W.; Jin, B.; Xi, X.; Wang, F.; Zhang, R.; Guo, B.; Xu, Z.; et al. Spatiotemporal and Multiscale Analysis of the Coupling Coordination Degree between Economic Development Equality and Eco-Environmental Quality in China from 2001 to 2020. Remote Sens. 2022, 14, 737. [Google Scholar] [CrossRef] [Scilit]
  13. Hou, L.; Ren, Z.Y.; Wang, L.X.; Zhang, Y. Dynamic Study on Ecological Footprint of Linyi City from 1996 to 2005. J. Shaanxi Norm. Univ. (Nat. Sci. Ed.) 2008, 36, 86–89+95. (In Chinese) [Google Scholar]
  14. Ni, Z.R.; Ren, G.Y.; Sun, Y.W.; Wang, S.J. Current Situation and Impact Assessment of Urban Ecological Water Conservancy Construction in Linyi City. China Water Resour. 2010, 12, 56–58. (In Chinese) [Google Scholar]
  15. Li, X.; Zhou, Y.; Zhao, M.; Zhao, X. A Harmonized Global Nighttime Light Dataset 1992–2018. Sci. Data 2020, 7, 168. [Google Scholar] [CrossRef] [Scilit]
  16. Zhao, M.; Cheng, W.; Zhou, C.; Li, M.; Wang, N.; Liu, Q. A Global Dataset of Annual Urban Extents (1992–2020) from Harmonized Nighttime Lights. Earth Syst. Sci. Data 2022, 14, 517–534. [Google Scholar] [CrossRef] [Scilit]
  17. Zhou, Y.; Cao, W.; Zhou, J. Dynamic Assessment of Eco-Environmental Quality in Xiong’an New Area, China Using WB-RSEI New Model. Sci. Rep. 2025, 15, 7592. [Google Scholar] [CrossRef] [Scilit] [PubMed]
  18. Kauth, R.J.; Thomas, G.S. The Tasseled Cap—A Graphic Description of the Spectral-Temporal Development of Agricultural Crops as Seen by Landsat. In Proceedings of the Symposium on Machine Processing of Remotely Sensed Data, West Lafayette, IN, USA, 29 June–1 July 1976; pp. 4B-41–4B-51. [Google Scholar]
  19. Crist, E.P.; Cicone, R.C. A Physically-Based Transformation of Thematic Mapper Data—The TM Tasseled Cap. IEEE Trans. Geosci. Remote Sens. 1984, GE-22, 256–263. [Google Scholar] [CrossRef] [Scilit]
  20. Baig, M.H.A.; Zhang, L.; Shuai, T.; Tong, Q. Derivation of a Tasselled Cap Transformation Based on Landsat 8 At-Satellite Reflectance. Remote Sens. Lett. 2014, 5, 423–431. [Google Scholar] [CrossRef] [Scilit]
  21. Tucker, C.J. Red and Photographic Infrared Linear Combinations for Monitoring Vegetation. Remote Sens. Environ. 1979, 8, 127–150. [Google Scholar] [CrossRef] [Scilit]
  22. Pettorelli, N.; Vik, J.O.; Mysterud, A.; Gaillard, J.M.; Tucker, C.J.; Stenseth, N.C. Using the Satellite-Derived NDVI to Assess Ecological Responses to Environmental Change. Trends Ecol. Evol. 2005, 20, 503–510. [Google Scholar] [CrossRef] [Scilit]
  23. Xu, H.; Deng, W. Rationality Analysis of the MRSEI and Its Difference from the RSEI. Remote Sens. Technol. Appl. 2022, 37, 1–7. [Google Scholar]
  24. Rikimaru, A.; Roy, P.S.; Miyatake, S. Tropical Forest Cover Density Mapping. Trop. Ecol. 2002, 43, 39–47. [Google Scholar]
  25. Wu, C.; Liu, H.; Meng, C.; Li., X.; Gan, D. Assessing ecological environmental quality and conservation effectiveness in the World’s largest urban green heart using the remote sensing ecological index (RSEI) and propensity score matching (PSM). Front. Environ. Sci. 2025, 13, 1626195. [Google Scholar] [CrossRef] [Scilit]
  26. Artis, D.A.; Carnahan, W.H. Survey of Emissivity Variability in Thermography of Urban Areas. Remote Sens. Environ. 1982, 12, 313–329. [Google Scholar] [CrossRef] [Scilit]
  27. Sobrino, J.A.; Jiménez-Muñoz, J.C.; Paolini, L. Land Surface Temperature Retrieval from LANDSAT TM 5. Remote Sens. Environ. 2004, 90, 434–440. [Google Scholar] [CrossRef] [Scilit]
  28. Jiménez-Muñoz, J.C.; Sobrino, J.A.; Skoković, D.; Mattar, C.; Cristóbal, J. Land Surface Temperature Retrieval Methods from Landsat-8 Thermal Infrared Sensor Data. IEEE Geosci. Remote Sens. Lett. 2014, 11, 1840–1843. [Google Scholar] [CrossRef] [Scilit]
  29. Li, X.; Zhao, L.; Li, D.; Xu, H. Automatic Intercalibration of Night-Time Light Imagery Using Robust Regression. Remote Sens. Lett. 2013, 4, 46–55. [Google Scholar] [CrossRef] [Scilit]
  30. Zheng, Q.; Seto, K.C.; Zhou, Y.; You, S.; Weng, Q. Nighttime Light Remote Sensing for Urban Applications: Progress, Challenges, and Prospects. ISPRS J. Photogramm. Remote Sens. 2023, 202, 125–141. [Google Scholar] [CrossRef] [Scilit]
  31. Jia, Y.; Wu, C.; Ying, X.; Meng, Q. Analysis of spatiotemporal evolution characteristics and driving forces of ecological environment quality in Xichang city based on RSEI and geodetector. Ind. Miner. Process. 2024, 53, 79–88. [Google Scholar] [CrossRef]
  32. Xu, H.; Li, C.; Lin, M. Should RSEI Use PCA or kPCA? Geom. Inf. Sci. Wuhan Univ. 2023, 48, 506–513. [Google Scholar] [CrossRef]
  33. Jolliffe, I.T. Principal Component Analysis, 2nd ed.; Springer: New York, NY, USA, 2002. [Google Scholar]
  34. Jolliffe, I.T.; Cadima, J. Principal Component Analysis: A Review and Recent Developments. Philos. Trans. R. Soc. A 2016, 374, 20150202. [Google Scholar] [CrossRef] [Scilit] [PubMed]
  35. Ren, X.; Yan, F.; Wang, Y.; Wang, Z.; Wang, H. A Water-Adapted Remote Sensing Ecological Index for Water Body Ecological Quality Assessment. Remote Sens. 2022, 14, 4289. [Google Scholar] [CrossRef] [Scilit]
  36. Zhang, P.; Qi, S.; Lai, J.; Wang, M.; Guo, Y.; Ma, L.; Liu, S. Spatiotemporal Changes and Driving Factors of Ecological Quality in the Jinsha River Basin Based on RSEI. Environ. Sci. 2026, 47, 408–419. (In Chinese) [Google Scholar] [CrossRef] [Scilit]
  37. Nițu, A.; Florea, C.; Ivanovici, M. NDVI and Beyond: Vegetation Indices as Features for Crop Recognition and Segmentation in Hyperspectral Data. Sensors 2025, 25, 3817. [Google Scholar] [CrossRef] [Scilit]
  38. Wu, M.; Li, Y. Spatial-temporal Evolution and Driving Factors of Ecological Environment Quality in Weihe River Basin Based on Remote Sensing Ecological Index. E3S Web Conf. 2025, 630, 02003. [Google Scholar] [CrossRef] [Scilit]
  39. De Groot, R.S.; Wilson, M.A.; Boumans, R.M.J. A Typology for the Classification, Description and Valuation of Ecosystem Functions, Goods and Services. Ecol. Econ. 2002, 41, 393–408. [Google Scholar] [CrossRef] [Scilit]
  40. Chen, Y.; Liu, A.; Zhang, Z.; Wang, Y.; Li, M. Sensitivity of Landsat Scale Data in Seasonal Land Cover Classification over Central Europe. Remote Sens. 2023, 15, 1234. [Google Scholar] [CrossRef] [Scilit]
  41. Rhif, M.; Ben Abbes, A.; Martinez, B.; de Jong, R.; Sang, Y.; Farah, I.R. Detection of Trend and Seasonal Changes in Non-Stationary Remote Sensing Data: Case Study of Tunisia Vegetation Dynamics. Ecol. Inform. 2022, 69, 101596. [Google Scholar] [CrossRef] [Scilit]
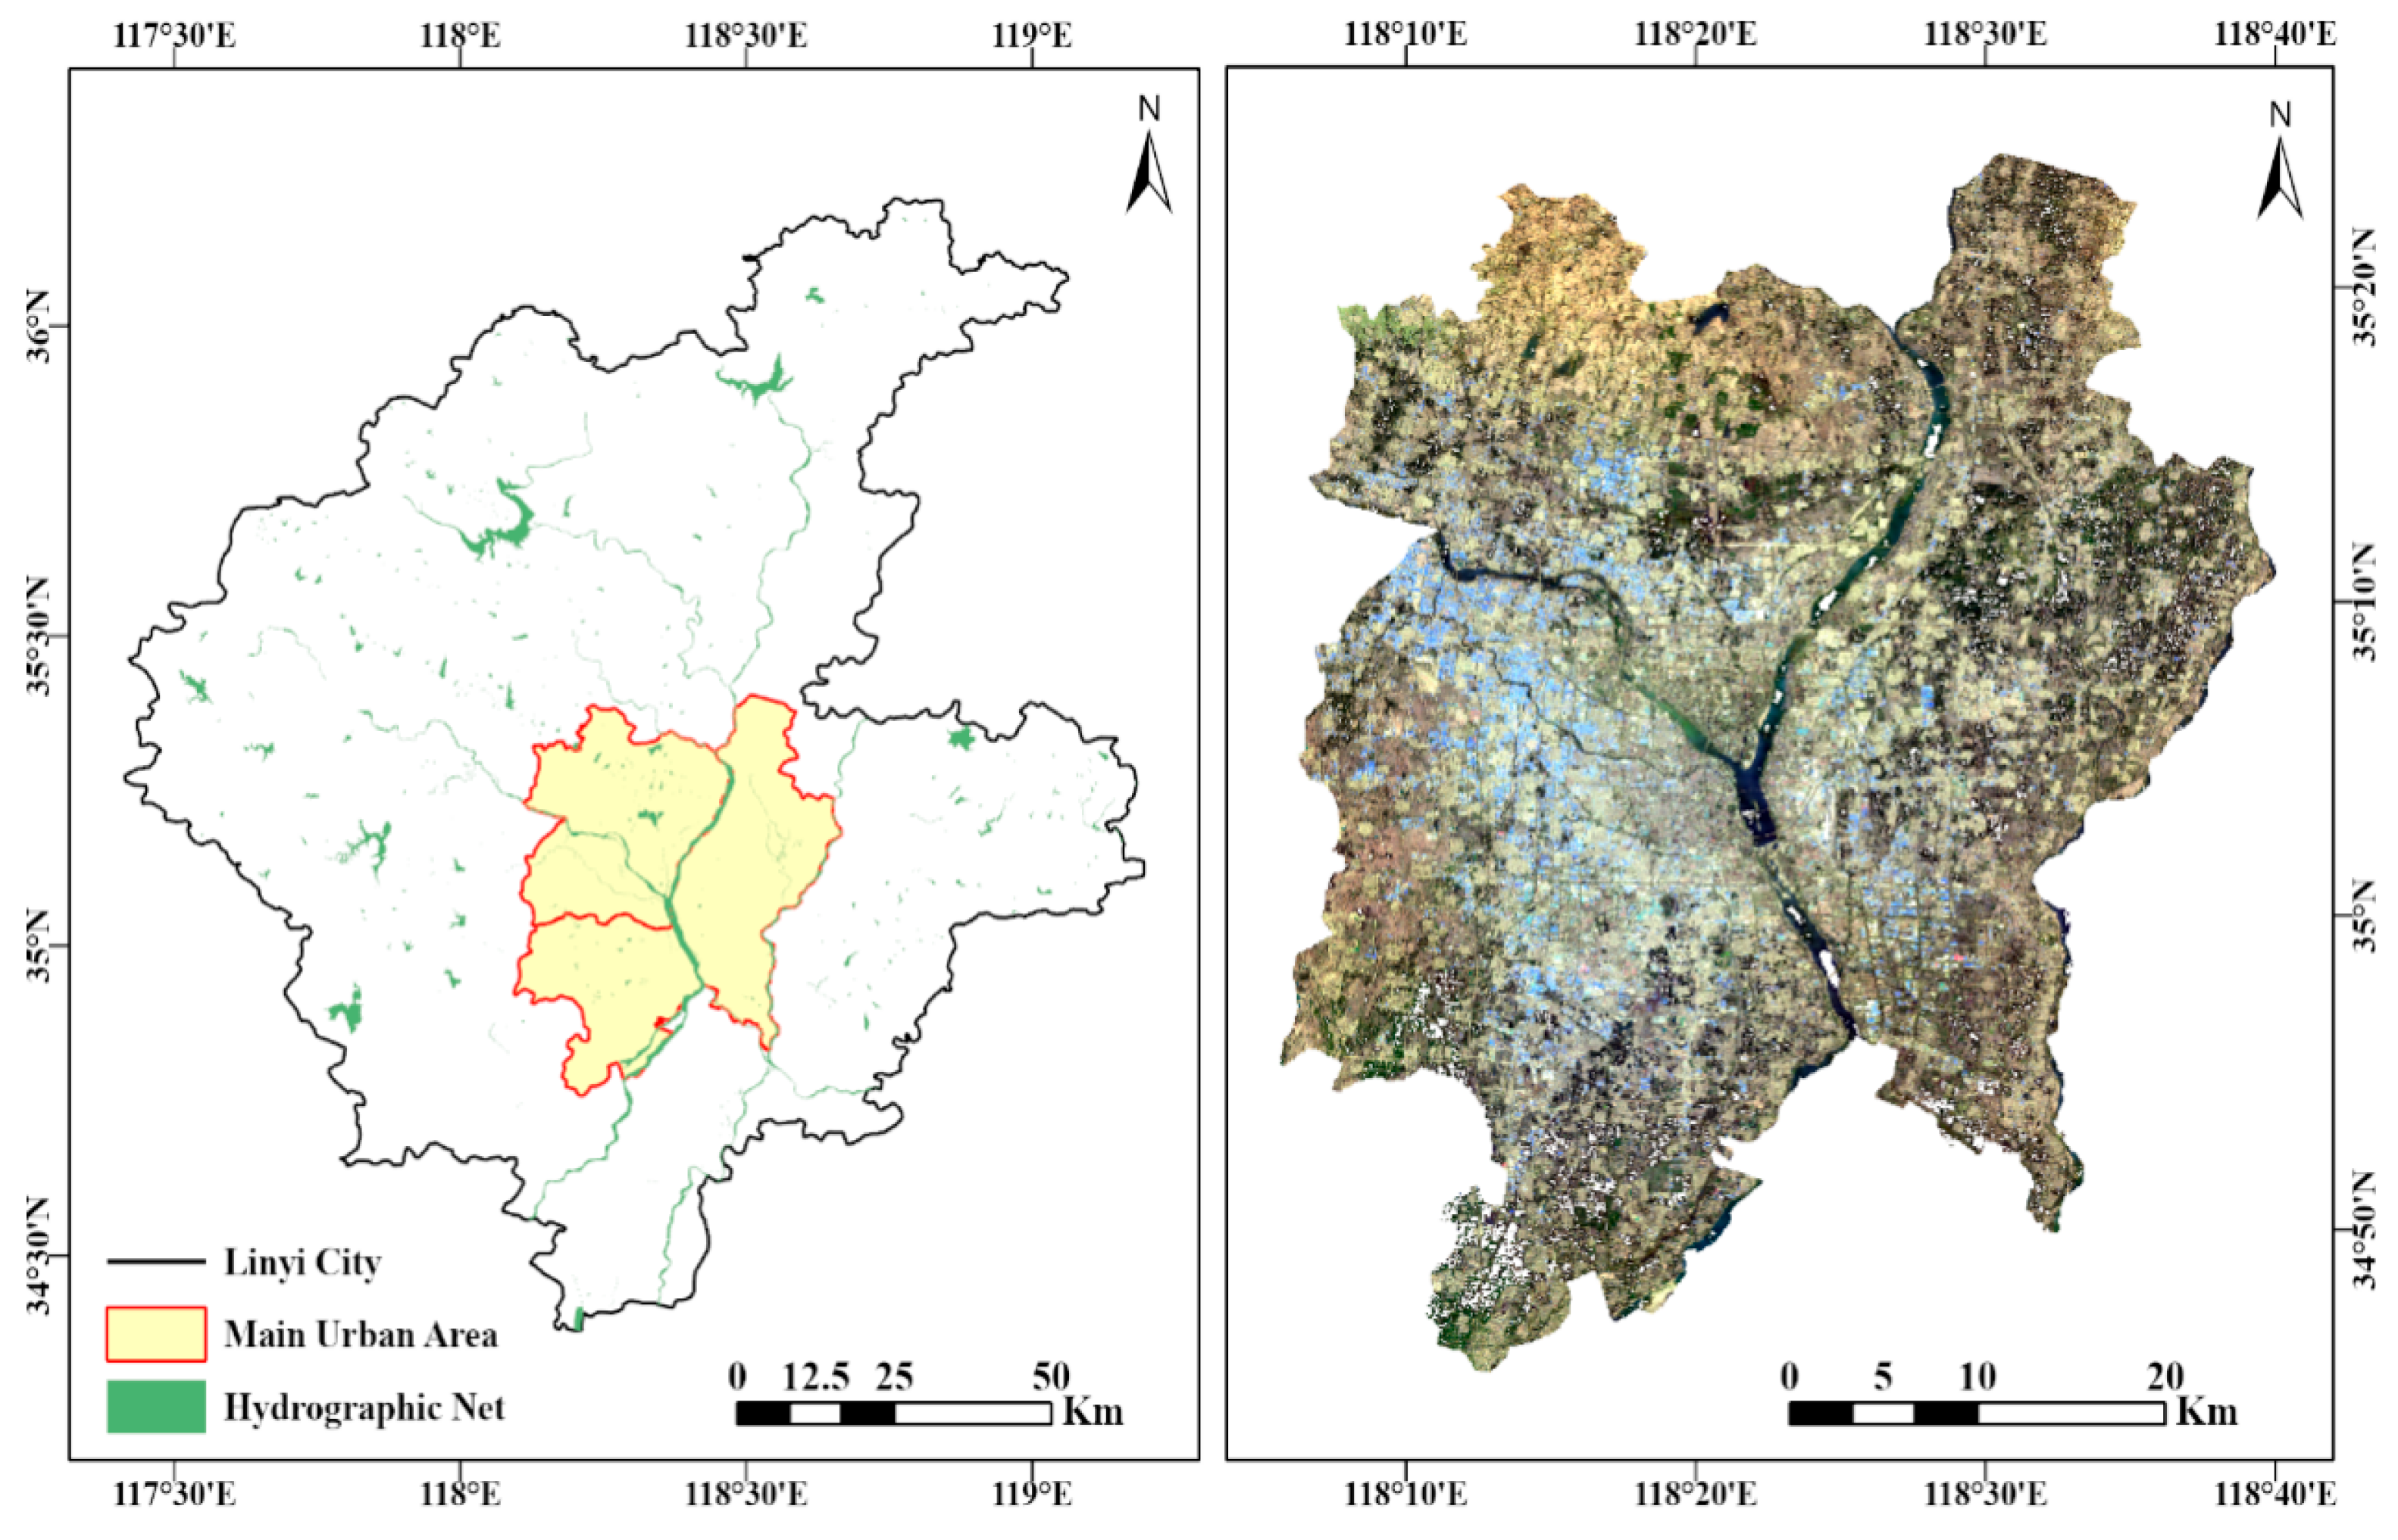
Figure 1. Location of the study area.
Land 15 00196 g001
Figure 2. Technical roadmap for the study.
Land 15 00196 g002
Figure 3. Comparison of water factor enhancement effect in typical areas: (a) false color composite, (b) NDVI_nor, (c) NDVWI, and (d) local match. The letters A–D indicate specific river segments: A and B are tributaries of the Yi River, C is the upper mainstream of the Yi River, and D is the downstream urban section of the Yi River.
Land 15 00196 g003
Figure 4. Comparative analysis of model results: (a) NTL_nor, (b) RSEI, and (c) WRSEI.
Land 15 00196 g004
Figure 5. Comparison between RSEI and WRSEI results in different years: (ac) RSEI for 2000, 2011, and 2020; (df) WRSEI for 2000, 2011, and 2020.
Land 15 00196 g005
Table 1. Overview of multispectral remote sensing imagery data for the study area.
SatelliteAcquisition DateCloud CoverBandsProcessing Level
Landsat 7 ETM+May 20000.008L2SP
Landsat 7 ETM+May 20114.008L2SP
Landsat 8 OLI/TIRSMay 20203.5911L2SP
Table 2. Comparison of indicators associated with RSEI and WRSEI.
RSEIWRSEI
IndicatorMetricIndicatorMetric
WetnessLSM_norWetnessLSM_nor
GreenNDVI_norGreenNDWVI_nor
DrynessNDBSIDrynessNDBSI
HeatLST_norHeatLST_nor
HAINTL_nor
Table 3. Statistical outputs of HPCA.
Statistical ItemEcological Endowment Group (PC1a)Ecological Stress Group
(PC1b)
Intergroup PCA
(PC1_Final)
Variables/ComponentsNDWVI, wetnessNDBSI, heat, NTLPC1a, PC1b
Eigenvalue (λ)0.10371.59221.5448
Variance Explained (%)98.5853.0777.24
Cumulative Variance (%)98.5853.0777.24
Component Loadings:
NDWVI0.9555
Wetness−0.2949
NDBSI−0.6519
Heat−0.6797
NTL−0.3361
PC1a (Synthetic)0.7071
PC1b (Synthetic)0.7071
Information Retention Rate *98.58%53.07%77.24%
* Information Retention Rate: The ratio of variance explained by the extracted principal component(s) to the total variance of the original indicators within that specific group (or stage). This metric quantifies how much of the original information is preserved after dimensionality reduction via PCA.
Table 4. Final indicator weights derived from HPCA (using 2020 data as an example).
IndicatorEcological
Category
Within-Group
Loading (PC1a/PC1b)
Intergroup Loading
(PC1_Final)
Raw Combined WeightFinal Normalized Weight (%)
NDWVIEcological
Endowment
0.95550.70710.675533.92
WetnessEcological
Endowment
–0.29490.7071–0.208510.46
NDBSIEcological Stress–0.65190.7071–0.460823.13
HeatEcological Stress–0.67970.7071–0.480524.12
NTLEcological Stress–0.33610.7071–0.237611.93
Total 99.56
Notes: (1) Weights were obtained through a three-step HPCA: (a) within-group PCA for ecological endowment and stress indicators, (b) intergroup PCA on the first principal components (PC1a and PC1b), and (c) normalization of absolute combined loadings to sum to 100%. (2) The final normalized weights reflect the relative importance of each indicator in the WRSEI model, with ecological stress indicators collectively accounting for 59.18% of the total weight. (3) The slight deviation from 100% is due to rounding; actual calculations ensure exact normalization.
Table 5. Comparison of statistical characteristics of NDVI, NDWVI, RSEI, and WRSEI in typical areas.
IndexMinMaxMeanStd
NDVI_nor0.000.820.310.11
NDWVI0.330.820.570.05
RSEI0.060.780.380.09
WRSEI0.000.790.440.12
Table 6. Sensitivity of water area and mean WRSEI to different LSM thresholds.
LSM ThresholdWater Area (ha)Area Proportion (%) *Mean WRSEIEcological Characterization
0.7115,289.0259.490.257Contains extensive moist
non-water surfaces
0.7525,493.9413.150.293Still exhibits overinclusion
0.89779.135.050.482Optimal balance state
0.856724.083.470.516Highest ecological quality but
insufficient area
0.93.33<0.010.271Omits important ecological
water bodies
* Note: The area proportion is calculated based on an estimated total study area of 193,800 ha.
Table 7. Statistical comparison of RSEI and WRSEI values across different land use types.
Land Use TypeRSEIWRSEI
MinMaxMeanVarianceMinMaxMeanVariance
Agricultural Land0.051.000.440.240.001.000.470.25
Water Bodies0.060.870.420.100.000.880.480.13
Forests and Grassland0.080.970.410.200.001.000.420.22
Construction Land0.000.800.270.130.001.000.240.15
Unused Land0.070.880.310.150.000.940.340.18
Table 8. Proportions of WRSEI levels from 2000 to 2020.
YearWRSEI ValueWRSEI Class (%)
MeanStdVery LowLowModerateHighVery High
20000.470.209.3427.9037.6720.244.85
20110.430.2419.6232.1722.5417.198.48
20200.360.2431.7534.1818.148.667.27
Disclaimer/Publisher’s Note: The statements, opinions and data contained in all publications are solely those of the individual author(s) and contributor(s) and not of MDPI and/or the editor(s). MDPI and/or the editor(s) disclaim responsibility for any injury to people or property resulting from any ideas, methods, instructions or products referred to in the content.