Article

Horizontal Ecological Compensation for Ecosystem Services Based on the Perspective of Flood-Sediment Transport, Eco-Environmental and Socio-Economic Subsystems

1
Business School, Hohai University, Nanjing 211100, China
2
School of Economics and Finance, Hohai University, Changzhou 213200, China
3
Yangtze River Protection and Green Development Research Institute, Nanjing 210098, China
*
Author to whom correspondence should be addressed.
Land 2026, 15(1), 111; https://doi.org/10.3390/land15010111
Submission received: 11 December 2025 / Revised: 30 December 2025 / Accepted: 5 January 2026 / Published: 7 January 2026

Abstract

The uncoordinated water–sediment relationship, fragile eco-environment and unbalanced economic development in the Wei River Basin (WRB) pose serious challenges to its high-quality development. Most existing studies focus on static structures or single elements, making it difficult to systematically reveal the complex interrelationships among ecosystem services (ESs) supply, transmission and demand. To address this issue, this paper innovatively combines the “system perspective” with the “flow network model”. From the perspective of flood-sediment transport, eco-environmental and socio-economic (FES) subsystems, we take the WRB as its research object and systematically analyzes the supply–demand relationship of ESs, the pathways of the ESs flows and ecological compensation (EC) strategies at multiple scales. By constructing a supply–demand assessment model for six types of ESs combined with the water-related flows model, the enhanced two-step floating catchment area method and the gravity model, this paper simulates the ESs flows driven by different transmission media (water, road and atmosphere). The results showed the following: (1) a significant spatial mismatch was observed between the high-supply areas at the northern foothills of the Qinling Mountains and the high-demand areas in the Guanzhong Plains. Furthermore, the degree of this mismatch increased with decreasing scale. (2) The pathways of different ESs flows were influenced by their respective transmission media. The water-related flows passed through areas along the Wei River and the Jing River. The carbon sequestration flows were identified in the upper reaches of the Luo River and between the core urban agglomerations of the Guanzhong Plains. The crop production flows were significantly influenced by the scale of urban crop demand, radiating outward from Xi’an City. (3) At the county and watershed scales, The EC fund pools of 7.5 billion yuan and 2.6 billion yuan were formed, respectively. These EC funds covered over 90% of the areas. These findings verify the applicability of the “FES subsystems” framework for multi-scale EC and provide a theoretical basis for developing an integrated EC mechanism across the entire basin.

1. Introduction

A basin is a complex system defined by the dividing ranges, integrating the hydrological cycles and ecological processes. It constitutes the fundamental geographical unit that sustains the existence and development of human civilization [1]. The basin not only undertakes important functions, such as water conservation, soil preservation and biodiversity maintenance, but also supports intensive agricultural production and urban development in surrounding areas through the flow of its services [2]. However, this has led to practical issues such as uneven water resource distribution and increased water environmental pressure. In this context, the EC mechanism is regarded as a key path for coordinating the development rights among different regions within the basin and enhancing the overall resilience of the ecosystem. Internationally, EC is often referred to as “payment for ESs”. Its core concept stems from the quantification and manifestation of the economic value of ESs, aiming to internalize environmental externalities through establishing a financial transfer mechanism between service beneficiaries and providers, thereby providing sustainable economic incentives for biodiversity conservation, watershed management and carbon sink enhancement [3,4]. Particularly in the field of watershed management, the application of ecological compensation has evolved and deepened from initially focusing on single goals such as water source protection and water quality purification, gradually expanding its focus to comprehensive goals, such as ecological function restoration and climate adaptation capacity building [5,6,7]. With the frequent occurrence of extreme climate events and the acceleration of urbanization, enhancing the resilience of the basin system to flood risks has received increasing attention [8,9], which further highlights the necessity of cross-administrative boundary collaborative governance and systematic ecological restoration. The Chinese government is also actively promoting the improvement of the comprehensive EC mechanism across the entire basin in recent years [10,11]. It requires that by 2027, the EC of basin should further promote the exploration of more environmental elements such as forests, water flow and farmland within the horizontal EC mechanism. By 2035, the EC of basin should fully cover the main river channels and important tributaries of the basin and expand to a broader scope, deeper connotation and richer forms. These policy orientations indicate that establishing an EC mechanism that combines basin characteristics, wide coverage and diversified compensation is of great significance for achieving the sustainable development of the basin.
Currently, many scholars have made active explorations in the field of EC for the basin. Especially, the ESs flows theory has attracted increasing attention from scholars in recent years because of its quantifiable and simulative characteristics, as well as its ability to reflect the dynamic and spatiotemporal changes in the supply and demand of ESs. For example, Wang et al. (2024) [12] selected five types of ESs, namely water retention, reducing sediment deposition and nonpoint source pollution, carbon sequestration, air purification and water purification, to construct the EC standard framework for Guangdong Province. An et al. (2025) [13] constructed a supply–demand model of ESs from the perspective of water–energy–food and proposed multi-scale EC strategies. Zhou et al. (2025) [14] evaluated the supply and demand of four ESs (carbon sequestration, flood production, soil retention and water yield) in the Luo River Basin and constructed an EC model that integrated natural differences, economic levels and social development coefficients. The aforementioned scholars, from a broad perspective (such as water–energy–food, water-related ESs, etc.), incorporate many ecological elements into the EC framework of the basin. However, the Yellow River Basin is confronted with multiple challenges such as flood threats, soil erosion and a fragile ecological environment [15]. Based on this background, Jiang et al. (2020) [16] proposed the watershed system science theory. They took the complex watershed system composed of FES subsystems as the research object. This approach provides a potentially useful research tool for the systematic governance of the basin. The current FES framework is still in the process of continuous development and improvement. There is very little research on the compensation of FES subsystems. Only two scholars further explore the issue of compensation within the framework of FES subsystems. Wang et al. (2022) [17] constructed an integrated optimization model from the flood-sediment perspective, aiming to balance the power generation and sediment transport interests of the upstream and downstream areas, and proposed a reasonable compensation plan for the redistribution of benefits. Based on emergy theory, Hu et al. (2023) [18] unified the benefits of FES subsystems into solar emergy and used the asymmetric Nash bargaining model to allocate the interests between the reservoir group and the urban agglomeration. These two studies define the compensation relationship within the scope of “reservoir–reservoir” and “reservoir–region”, but the dimension of “region–region” is overlooked. Zhao et al. (2024) [19] and Geng et al. (2025) [20] demonstrated the feasibility of the FES subsystems framework for “region–region” level research through the establishment of the FES index system. Therefore, based on existing research results, this paper introduces the FES subsystem framework into the field of service flow compensation and expands the compensation mechanism under this framework to multiple scales.
In terms of research methods, there are currently two major issues in the simulation of the ESs flows. Firstly, many scholars employ the gravity model to simulate the flows of ESs [21,22,23]. This single method overlooks the issue of the transmission media for the different ESs. For example, water bodies serve as important carriers for water-related ESs. The transmission paths of water-related ESs are significantly influenced by water flows [24]. The transmission paths of crop production services are often affected by transportation routes and costs [25]. And the transmission paths of the carbon sequestration service take place through the medium of the atmosphere [12]. Therefore, for different ESs, choosing the appropriate model to simulate the corresponding ESs flows is more conducive to depicting the imbalance between supply and demand. Secondly, in terms of determining the watershed scale, Zhao et al. (2018) [26] believed that different DEM resolutions resulted in different river network lengths and densities. And, the river networks directly extracted from DEM may be overly complex at high resolutions and too sparse and distorted at low resolutions. However, ArcSWAT can avoid extracting false or missing river channels by superimposing real rivers and adjusting the river network structure and flow direction [27]. Therefore, we use the national five-level standard river system as the input for the watershed delineation function in ArcSWAT tool. In this model, the inlet points of each sub-watershed are located at the starting point of the upstream runoff accumulation, while the outlet points are defined as the end node of the downstream river. This approach technically avoids the issue of scale uncertainty caused by threshold selection. This is significant for establishing a unified scale standard and has important implications for setting future compensation criteria of the watershed scale.
In response to these issues, this paper has achieved three innovations: (1) Based on the characteristics and functional positioning of the basin, an ESs research framework is constructed from the perspective of FES subsystems, and the spatiotemporal evolution of supply and demand within the study period is evaluated at multiple scales. (2) Due to the different transmission media for water-related services, crop production services and carbon sequestration services, this paper has abandoned the practice of using a single model for general simulation. Instead, it innovatively integrated and adapted three process models. The water-related ESs model, the enhanced two-step floating catchment area model and the gravity model are respectively adopted to simulate the ESs flows, and the characteristics of the ESs flows are explained, including flow paths, flow directions, flow values, etc. (3) Based on the county-level administrative divisions and the national five-level standard river system, this paper proposes a multi-scale comprehensive assessment framework that integrates administrative management units and basin natural units, providing a reference for subsequent theoretical research and scale standards. Furthermore, choosing the Wei River Basin as a case study holds significant strategic importance for applying and refining the FES-EC framework. Firstly, as the largest tributary of the Yellow River Basin, the flood threats, soil erosion and fragile ecological environment challenges faced by the WRB can all be reflected through the FES subsystems. Secondly, the WRB mainly covers the provinces of Shaanxi and Gansu. The relatively concentrated area of the basin reduces the complexity of cross-administrative coordination, making it a research unit suitable for exploring compensation mechanisms. Through conducting innovative research here, not only can solutions be provided for the WRB itself, but also practical experiences that can be promoted can be accumulated for the entire Yellow River Basin.

2. Materials and Methods

2.1. Study Area

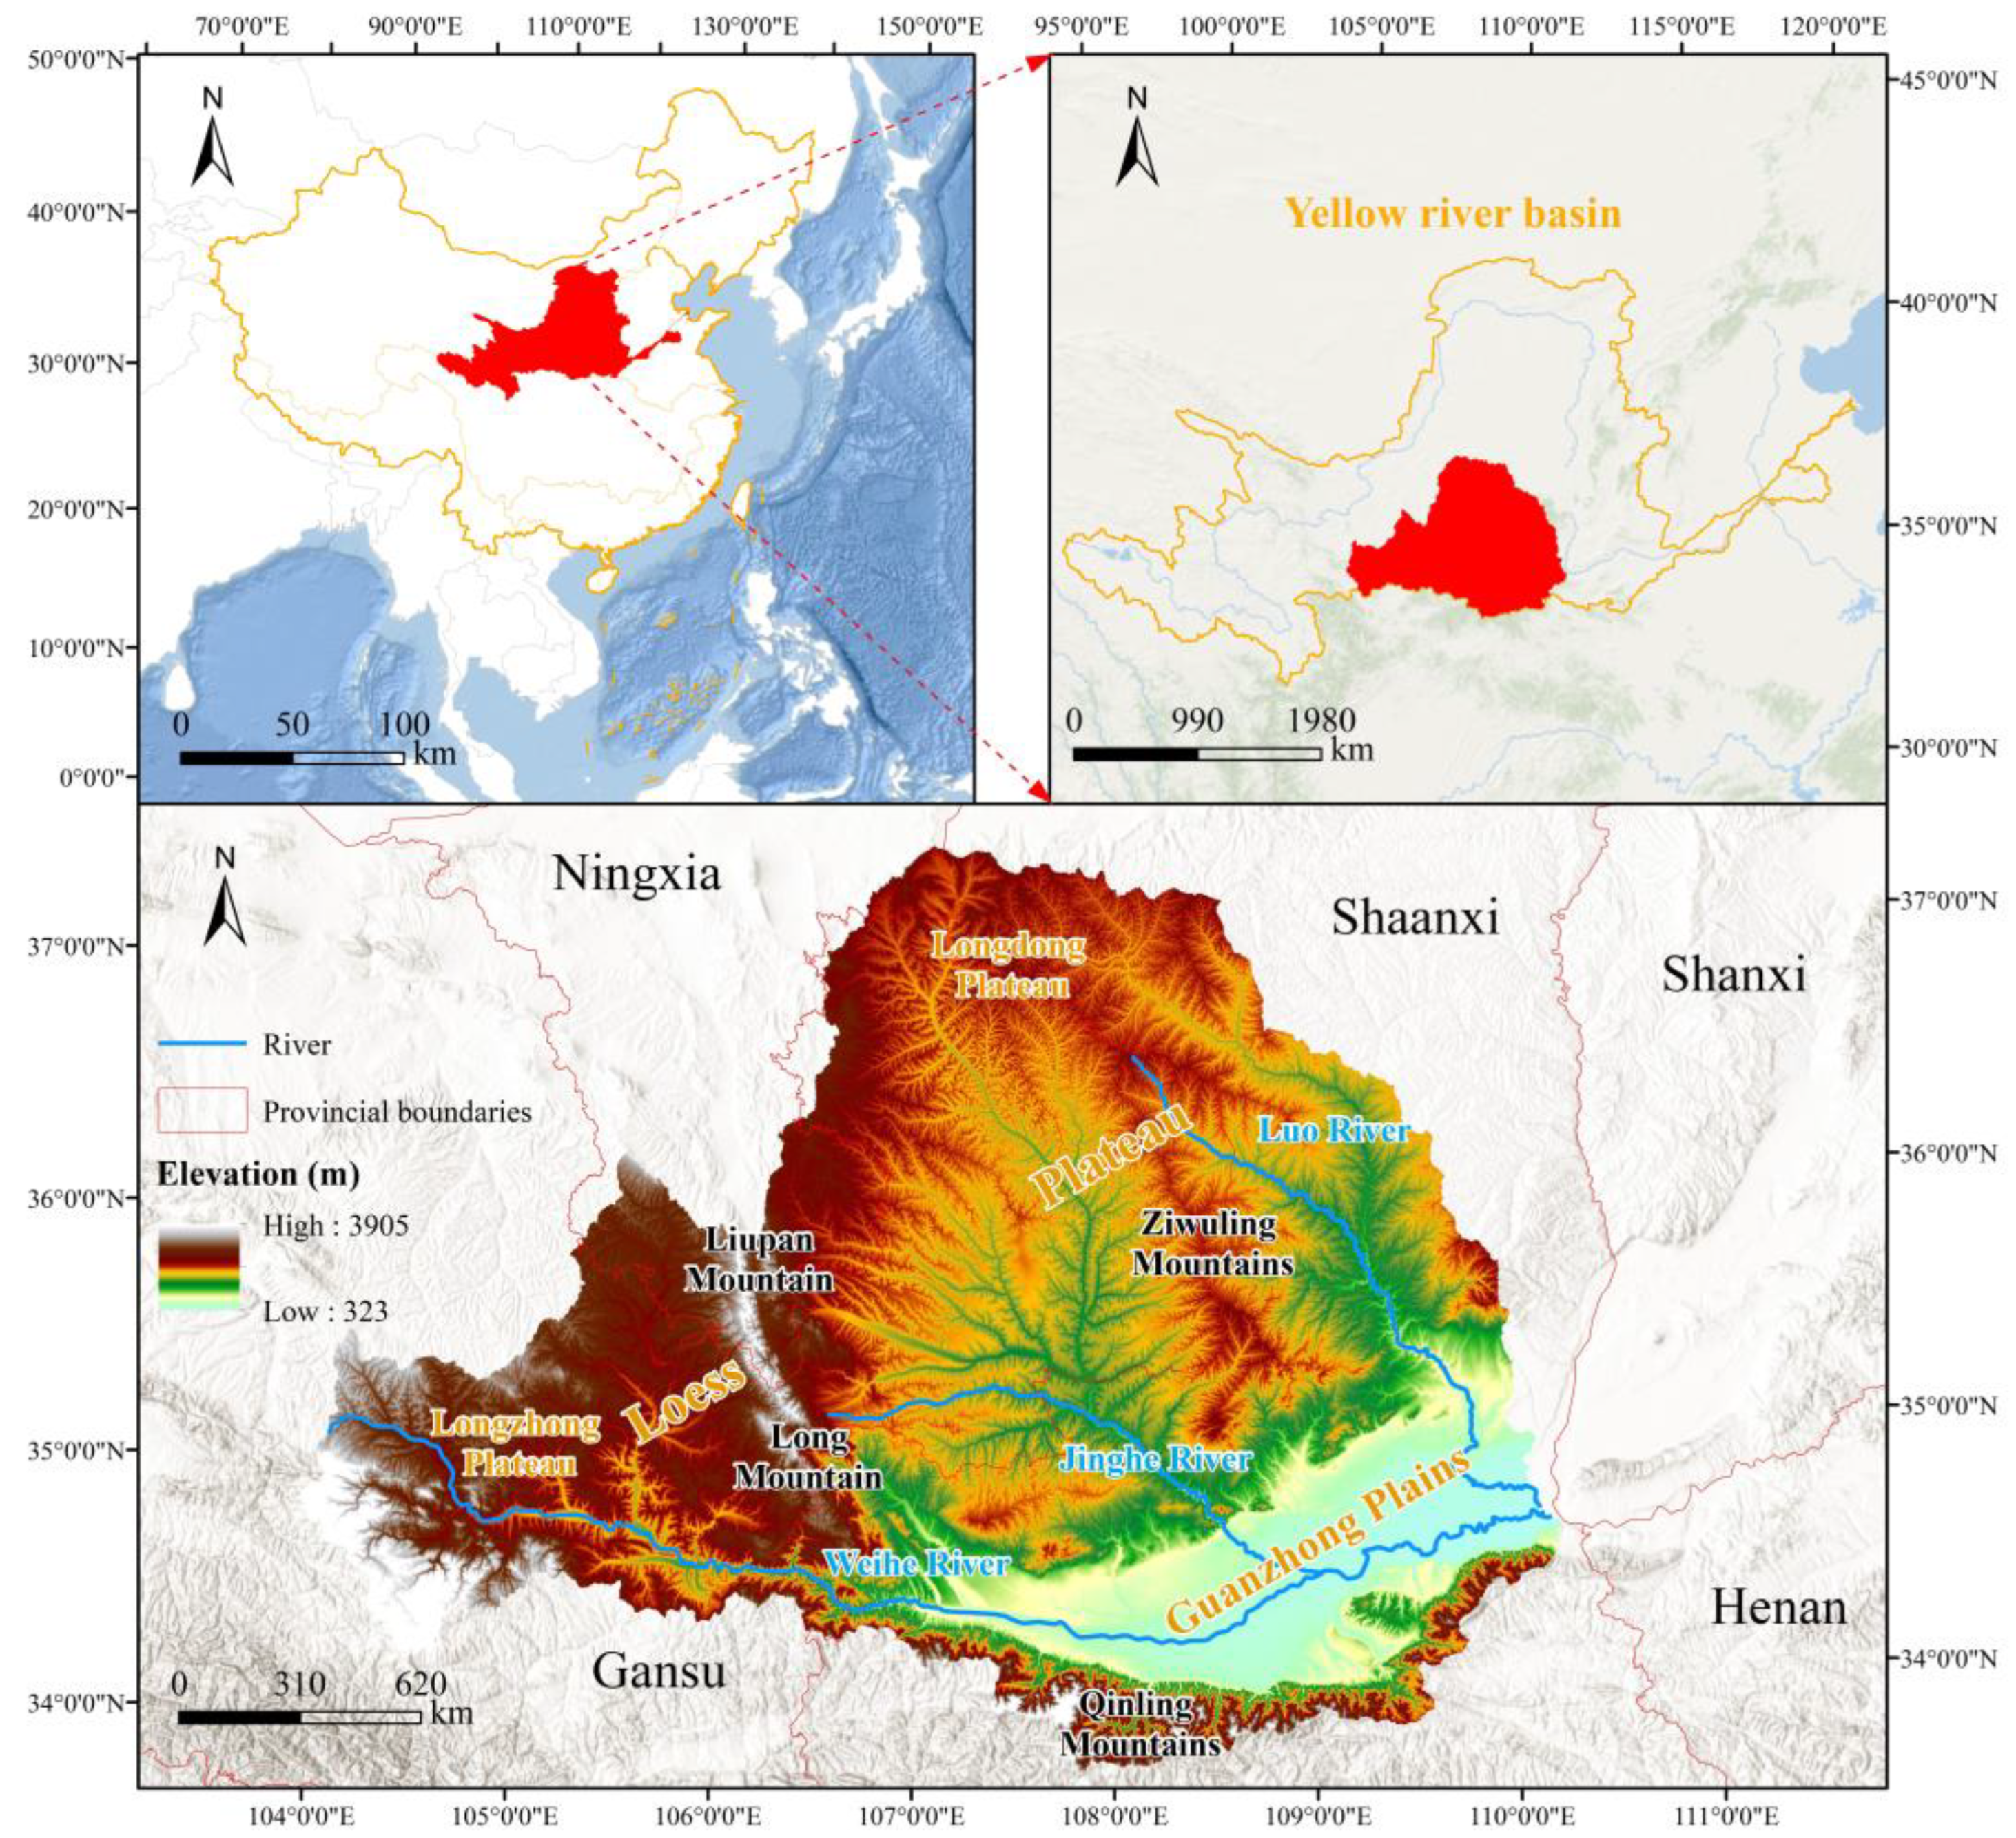
The WRB spans three provinces of Gansu, Ningxia and Shaanxi, with a total area of 134,800 km2 (Figure 1). The main river has a total length of 818 km. The WRB has a temperate continental monsoon climate. Influenced by the terrain, the spatial distribution of climatic elements is quite distinct. Annual precipitation exhibits high spatial variability, characterized by a “south wet and north dry” pattern. The precipitation center is located in the Qinling Mountains, with amounts reaching 800–1000 mm. In contrast, the Guanzhong Plains receives 550–650 mm, while the northern Loess Plateau and Longzhong Plateau receive only 400–500 mm. Precipitation is concentrated from July to September, with frequent heavy rainfall events that are the primary cause of floods and soil erosion. Owing to its vulnerable natural environment and intense human activities, the WRB also faces severe and complex ecological problems. The per capita water resources are only about 300 m3 [28], less than one-sixth of the national average and well below the internationally recognized threshold of 500 m3 for extreme water scarcity [29]. Poor water quality further exacerbates the water scarcity. Wastewater discharge from industries (e.g., chemical, papermaking, dyeing and food processing), along with urban domestic sewage and agricultural non-point source pollution, severely degrades the water quality across the basin. Nie et al. (2024) [30] suggest that the ecological problems in the WRB form a complex system centered on the water crisis, where issues like water pollution, soil erosion and ecological degradation are intertwined. This actually reveals a strong contrast between the limited ecosystem carrying capacity and the ever-increasing demands of socio-economic development [31]. Consequently, the uncoordinated water–sediment relationship, coupled with the imbalance between ecological supply and socio-economic demand, severely constrains the sustainable development of the WRB.

2.2. Methods

2.2.1. Methodological Framework

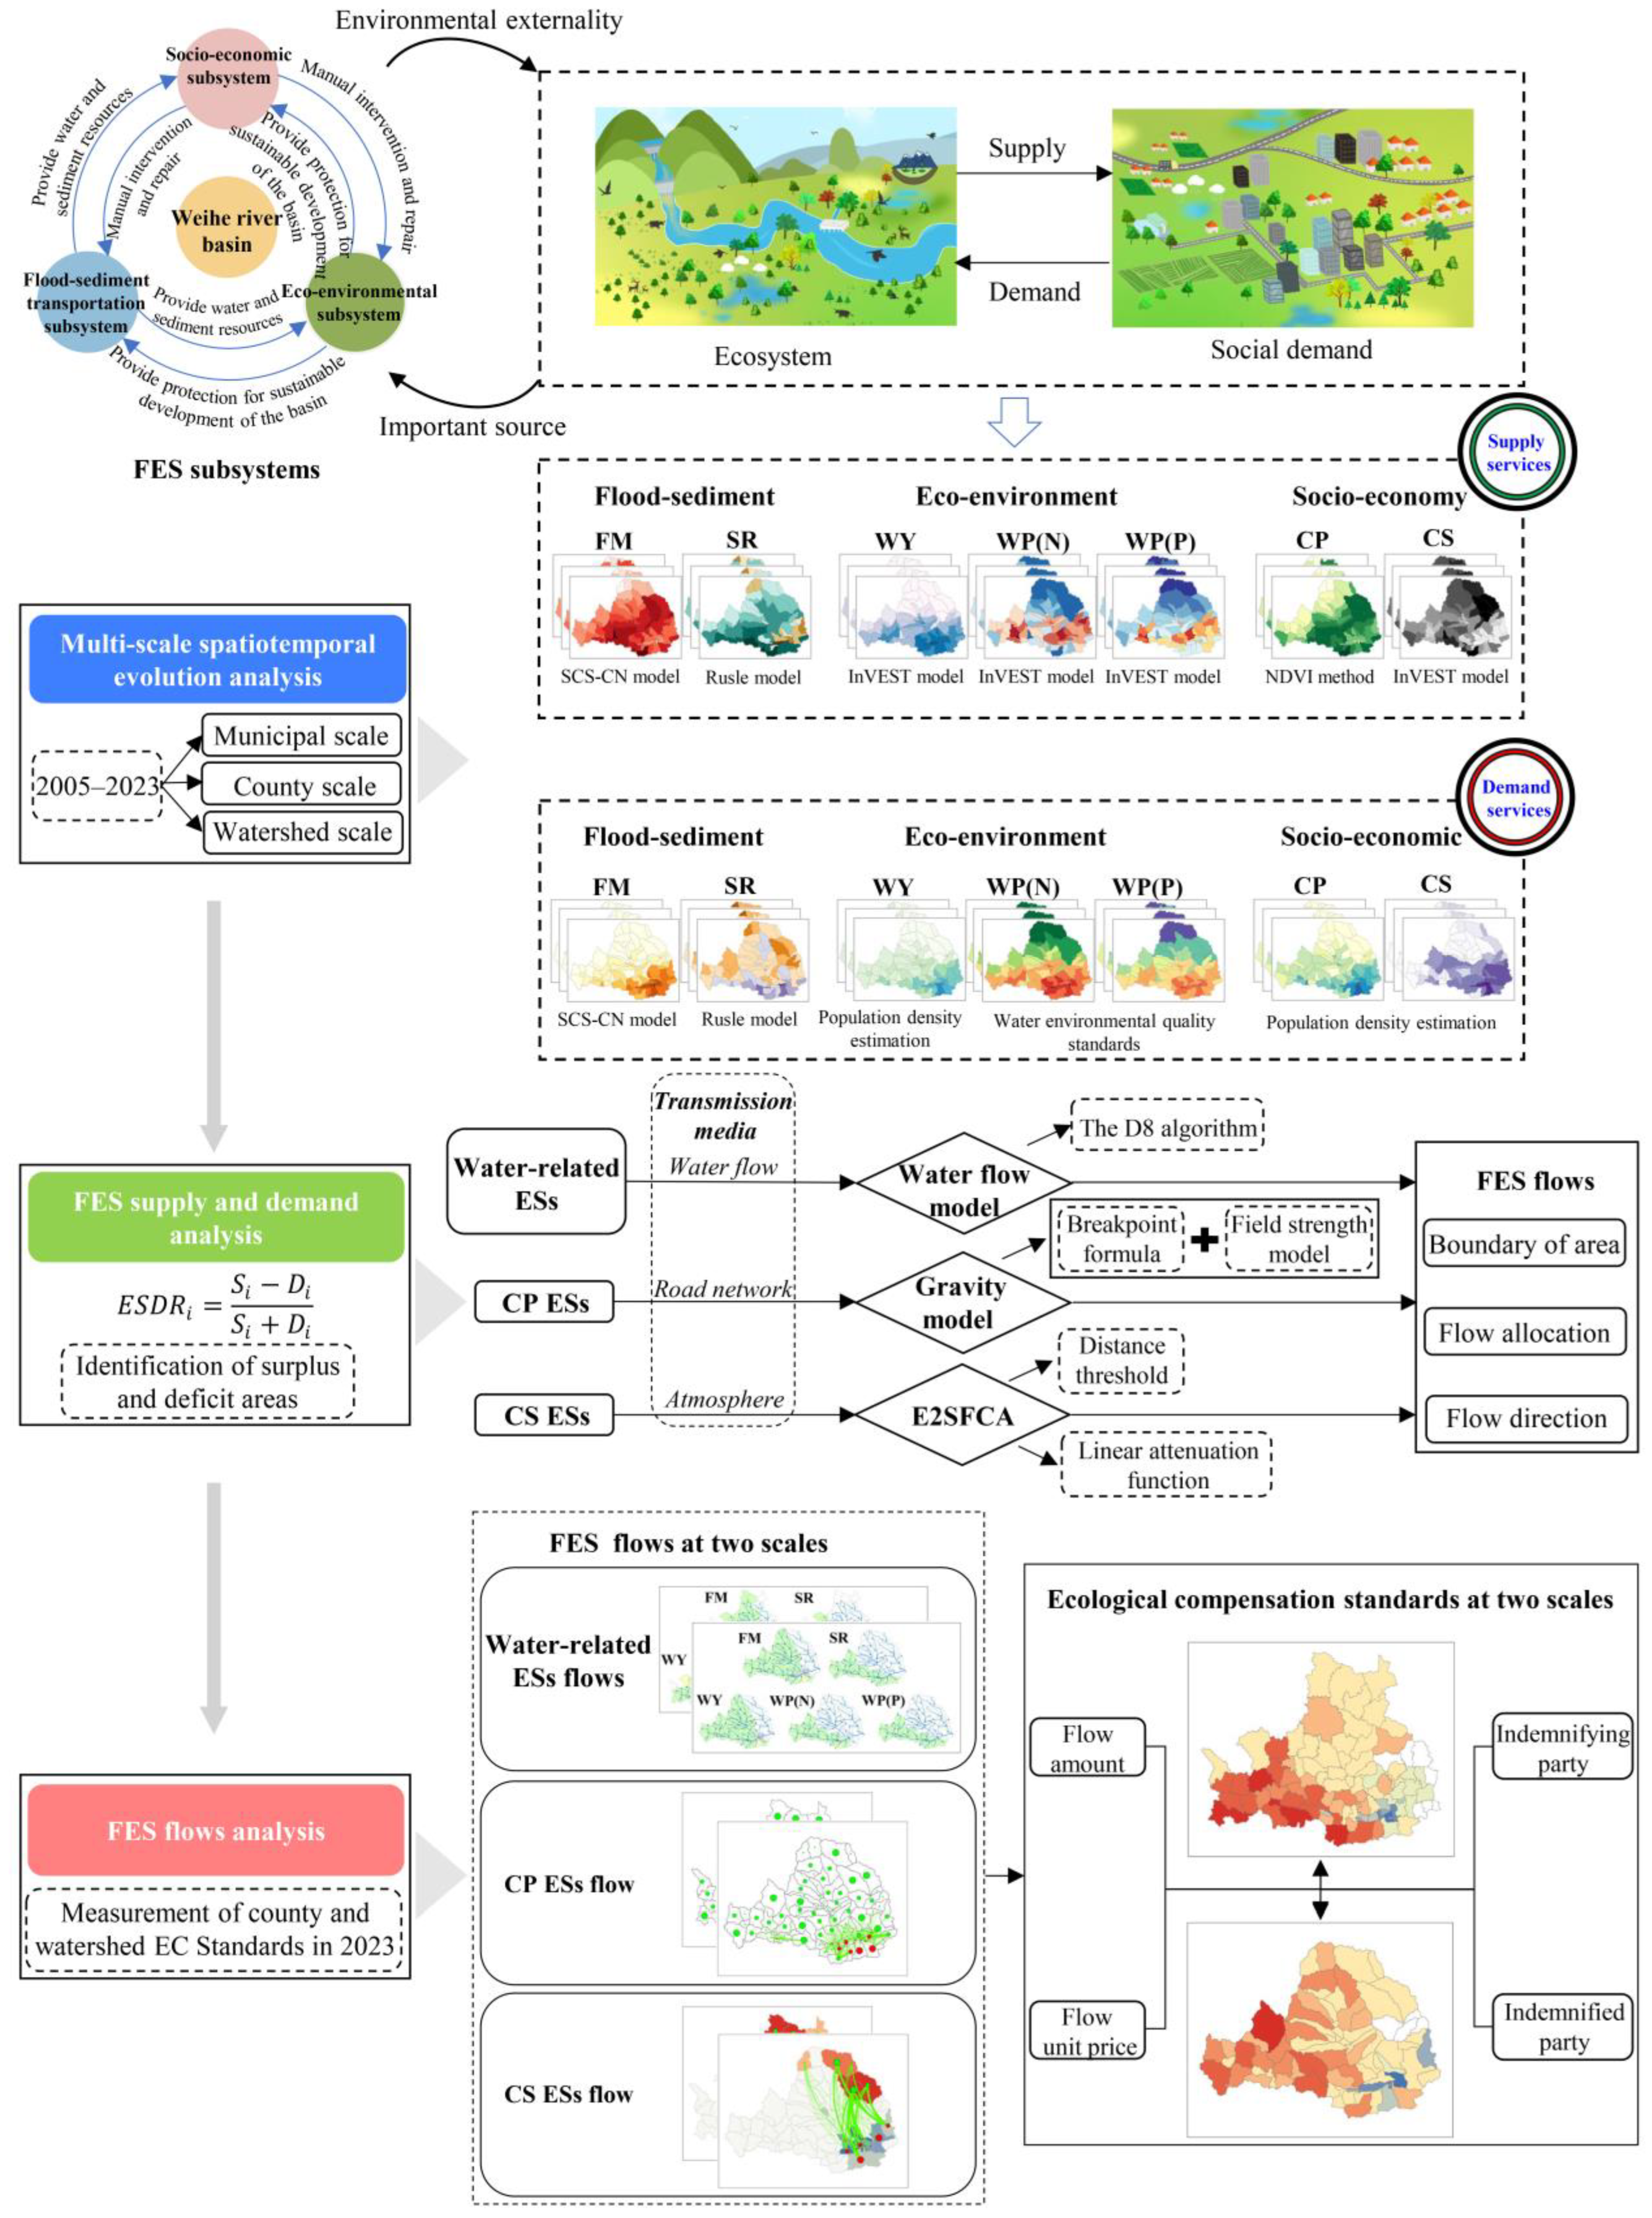
The theory of watershed system science divides watershed systems into three major subsystems. First, the safety of the main and tributary rivers of the WRB is the prerequisite for supporting sustainable socio-economic development. Its primary function is to ensure the safe transport of water and sediment and guarantee flood control safety, referred to as the “flood-sediment transport subsystem”. Second, the maintenance and function of the ecological environment within the basin involve the habitats and hydrological sediment processes required by the biological communities, as well as many water environment and water ecology elements related to human activities and socio-economic development. It is referred to as the “eco-environmental subsystem”. Third, the sustainable development of the basin’s society and economy requires the maintenance of the healthy life of the river and a good ecological environment as a foundation, and at the same time, it also exerts a reverse effect on the protection and benign maintenance of the river’s health and ecological environment. It is referred to as the “socio-economic subsystem”. Existing studies have confirmed through coupling coordination degree model that there have been uncoordinated relationships among the various subsystems within the basin for a long time [19,20,32]. That is, in the process of supply, demand and utilization, there are imbalances, competitions and even conflicts of mutual restraint among the subsystems. Especially, Hu et al. (2024) [32] revealed that this uncoordinated deep mechanism stemmed from the spatial imbalance in the supply and demand of ESs, mainly manifested as a severe spatial mismatch between the supply area in the upstream and the demand area in the downstream, resulting in a generally low overall coupling coordination degree of the entire basin. Based on this understanding, we believe that the current design logic of watershed EC should achieve a systematic shift: First, EC should not only focus on water quality and quantity or a single service, but rather compensate for the imbalance between supply and demand through systematic services, thereby achieving overall coordination of the watershed. Second, the spatial flow of EC should strictly follow the spatial pattern of ESs supply and demand, promoting the transfer of funds from the downstream “net consumption area” of ES to the upstream “net production area” of ES, to achieve precise EC. Therefore, this paper constructs a compensation framework for the FES subsystem to strive to go beyond the limitations of a single ecosystem service and design compensation schemes from a systemic perspective. To quantitatively analyze, we use key ecosystem services to represent the core functions of each subsystem: According to Maslow’s hierarchy of needs theory, safety needs encompass the demand for flood prevention and soil erosion control [33]. Taking into account the functional characteristics of the flood-sediment subsystem, we selected flood mitigation (FM) and soil retention (SR) to characterize the flood-sediment subsystem. The healthy and sustainable development of the flood-sediment subsystem requires the support of water environment and water ecological elements. Therefore, water yield (WY) and water purification (WP) were selected to represent the eco-environmental subsystem. The WRB is an area dominated by agriculture. It has been one of the important crop-producing areas in China since ancient times. As urbanization and industrialization in the WRB continue to accelerate, the demand for carbon emission reduction is intensifying. Additionally, we once considered using the natural accessibility indicator to represent the socio-economic subsystem, but the monetary value of it was difficult to determine. Ultimately, crop production (CP) and carbon sequestration (CS) were selected to represent the socio-economic subsystem. Three spatial scales were considered: municipal, county and watershed (See Supplementary Figure S1). The municipal and county boundaries are official administrative divisions, while the watershed scale is defined based on the national five-level river system. The research framework of this paper mainly comprises three components (Figure 2): (1) the analysis of the spatiotemporal evolution characteristics of the FES supply and demand at multiple scales; (2) the simulation of ESs flows within the FES subsystems using methods tailored to different transmission media; and (3) the development of EC standards at the county and watershed scales.

2.2.2. Data Sources

This paper analyzes the supply and demand of FES subsystems based on multi-source data, including geographical, statistical, climatic and remote sensing data. The time resolution of the data is 2005, 2010, 2015, 2020 and 2023. The detailed data sources are provided in Table 1. To ensure the consistency, comparability and analytical synchrony of multi-source data in the spatial and temporal dimensions, this paper carried out a systematic data coordination and preprocessing. All raster data were uniformly converted to the Albers_Conic_Equal_Area projection coordinate system and the spatial resolution was unified to 100 m through resampling. For time series data, rasterization processing was carried out using ArcGIS 10.8.2 to ensure the alignment of time and spatial data. In response to the differences in time resolution among different datasets, this paper unified aggregated dynamic time series data (such as precipitation, evapotranspiration and NDVI) to the annual scale by calculating annual averages, cumulative values or maximum values, in order to achieve temporal synchronization with annual land use changes and socio-economic statistics.

2.3. Measurement of the ESs Supply and Demand

2.3.1. Quantification of the ESs Supply and Demand

This paper uses the SCS-CN model, the RUSLE model, the InVEST model and the NDVI method to measure the supply capacity of six ESs. In terms of demand calculation, the demands of FM and SR were, respectively, calculated using the SCS-CN model and the RUSLE model. The other four ESs were calculated by multiplying the per capita physical quantities by the population density. The specific calculation method process is shown in Table 2 and Supplementary Table S1. The validation of the models is shown in Supplementary Section S3.

2.3.2. Identification of the Surplus and Deficit Areas

This paper uses the ESs supply–demand ratio (ESDR) to identify the supply and demand conditions of ESs [36]. By calculating the supply and demand values for each unit at multiple scales, the ESDR for each scale can be obtained. When the ESDR is less than 0, there is a deficit. When the ESDR = 0, the supply and demand are in balance. When the ESDR > 0, there is a surplus.
E S D R i t = S i t − D i t S i t + D i t
E S D R i t is the ESDR of the area i in the t -th year. S i t is the ESs supply of the area i in the t -th year. D i t is the ESs demand of the area i in the t -th year.

2.4. Measurement of the ESs Flows

2.4.1. The Water-Related Flows Model

The water-related services are different from other ESs. Affected by factors such as water bodies, terrain, landforms and gravity, the particularity of water-related ESs is mainly manifested as follows: (1) The transmission medium of water-related ESs flows is the river network and its flow is unidirectional, that is, it flows from the upstream to the downstream. (2) The water-related flows not only meet the local demands, but also benefit the downstream areas under the influence of terrain and gravity factors. (3) Referring to the previous study [12], this paper assumes that, under conditions of no loss, conversion or extraction, water-related flows do not diminish with the increase in distance. This assumption aims to establish a theoretical benchmark framework for revealing the structural correlations within the basin. To examine the impact of this assumption on the robustness of the research conclusions, we conducted a systematic sensitivity test i Supplementary Table S7. This assumption means that if there is a surplus of water-related services at one node, the surplus will flow to the adjacent nodes. On the contrary, if the water-related services provided by this node are in deficit and there is no surplus to flow downstream, then the upstream node and the adjacent downstream nodes will be disconnected [37,38]. The D8 algorithm is a classic method used in DEM to determine the direction of water flow. It is employed to address the issue of which adjacent cell water will flow to in each cell of a raster DEM [39,40]. Therefore, we use the D8 algorithm to determine the direction of water-related flows. Its calculation method is as follows:
When the net supply within the basin is greater than zero, it indicates that the supplies within the basin can meet all the demands within the basin. On the contrary, when the net supply within the basin is less than zero, it indicates that the supplies within the basin are insufficient to meet all the demands. The flow value was the net supply:
V i j = N V j × N V i / ∑ i = 1 n N V i
V i j represents the net transfer value of the flow from surplus area i to deficit area j . N V i represents the net value in surplus area i . N V j represents the net value in deficit area j .

2.4.2. The CP Flows Model

The transportation of crops relies on the road network as the carrier. The enhanced two-step floating catchment area (E2SFCA) method takes into account the spatial distribution between supply and demand, as well as their interaction, and incorporates the factor of supply capacity attenuation caused by the increase in distance into the model [41,42]. In this paper, the E2SFCA model was selected to simulate the CP flows, as this model effectively quantifies the spatial accessibility between supply and demand points and takes into account the competitive relationship between downstream population and upstream agricultural product supply [43,44]. Compared with the ordinary gravity model, the E2SFCA method is more suitable for simulating service flows, such as those of crops that need to be “obtained” and “consumed”, by introducing a distance attenuation function and a supply–demand ratio calculation. Based on the existing research and the tendency to reduce transportation costs, this paper makes assumptions about the CP flows in the WRB as follows: (1) Only the CP supply within the basin is considered, without taking into account the external CP supply. This paper mainly simulates the CP flows between adjacent cities within the basin. And the influence of external resistances, such as terrain on transportation, is not taken into account. Referring to the previous study [41], the threshold of spatial distance is set at 100 km. (2) This paper only identifies the flows from the surplus areas to the deficit areas. Given that the research area is extensive and aims to comprehensively grasp the spatial distribution pattern and service scope of supply and demand, this study initially employs the straight-line distance (Euclidean distance) to measure the spatial separation between supply points and demand points. (3) The CP surplus of the node will be used to meet its own CP demand first, and then it can be distributed to adjacent nodes. To verify the robustness of the core conclusion of this model, we conducted a systematic sensitivity test on the distance threshold parameter. We set the threshold at 80 km, 120 km and 150 km, respectively, for comparative analysis. The test results (see Supplementary Table S8) indicated that although the threshold change would adjust the density of flow connections and specific paths, the basic spatial flow pattern determined by the supply and demand situation, the main outflow/inflow nodes and the dominant flow directions remain highly stable. Based on the above assumption, the calculation steps are as follows:
Step 1: Create a service area centered around supply node i , ensuring that within the defined distance threshold, the accessibility of CP demand decreases linearly from supply node i to d r , ultimately reaching 0.
R i = S i ∑ D j · W r   k ∈ d j k ≤ d r
W r = 1 − d i j d r , d i j ≤ d r   0 ,   d i j > d r
where R i is the ratio of the supply nodes to all the demand nodes within the threshold range. S i and D j are the intensities of the supply and demand nodes, respectively. W r is the distance weight.
Step 2: Starting from the demand node j , within the threshold range, sum up the weighted supply ratios to obtain the supply–demand ratio for each demand node j .
R F = ∑ j ∈ d i j ≤ d r R j · W r
Step 3: Combine the results of the E2SFCA method with the CP demand, and calculate the CP share flowing into node j .
F = D j · R F
Based on the relationship between the total inflow intensity of the demand node j and the weight of distance, calculate the CP flows between all supply nodes and the demand node k within the service area.
F I = F j · W r ∑ W j r
Sum up the flows within the service range centered on the demand node, and calculate the inflows of the corresponding node.
F = ∑ F I j j ∈ 1,2 , 3 , … , n

2.4.3. The CS Flows Model

The CS flows are affected by distance attenuation due to the transmission in the atmosphere medium. Given the non-homogeneous spatial distribution of CS [36], this paper used the spatial autocorrelation analysis to identify the cold and hot spots of CS and used the gravity model to simulate the flow paths between the cold and hot spots. The cold and hot spots can be achieved through the Getis-Ord General G function in ArcGIS. In addition, at the micro scale, the disparity between supply and demand is more pronounced, resulting in areas with high demand but small size being unable to be effectively covered by the radiation range [45]. Therefore, in this paper, for the areas with a negative remaining quantity, the radiation distance is replaced with a straight-line distance to ensure that the high-demand and small-area regions still receive radiation from the surrounding areas.
Firstly, the breakpoint formula was used to measure the radiation distance from the hot spots to the cold spots:
d i j = D i j 1 + N j / N i
d i j is the radiation distance from hot spot i to the cold spot j . N i and N j are the remaining quantities of hot spot i to the cold spot j , respectively. The remaining quantity is the difference between the supply and demand of CS. If the remaining quantity of cold spot j is less than 0, then d i j = D i j .
Secondly, the field strength model was used to measure the CS flows from the hot spot to the cold spot.
F i j = N V i d i j 2
E i j = F i j × S i j × β
F i j is the average radiation value from hot spot i to the cold spot j . E i j is the flow from hot spot i to the cold spot j . S i j is the area of influence that the hot spot has on the cold spot. β is the spatial transformation coefficient. Referring to the previous scholars [46,47], the value in this paper is 0.6.

2.4.4. Measurement of the EC Standard

The monetary valuation method enables the aggregation of different ESs by converting their biophysical quantities into a common monetary unit. In this paper, the values of the six ESs were calculated using methods including the market value method, the shadow engineering method and the alternative cost method. The specific valuation methods are detailed in Supplementary Table S2. At each scale, the total paying fund (from deficit areas) and the total compensated fund (to surplus areas) were calculated as the aggregated monetary value of the six ESs.

3. Results

3.1. Measurement of the Supply and Demand at Multiple Scales

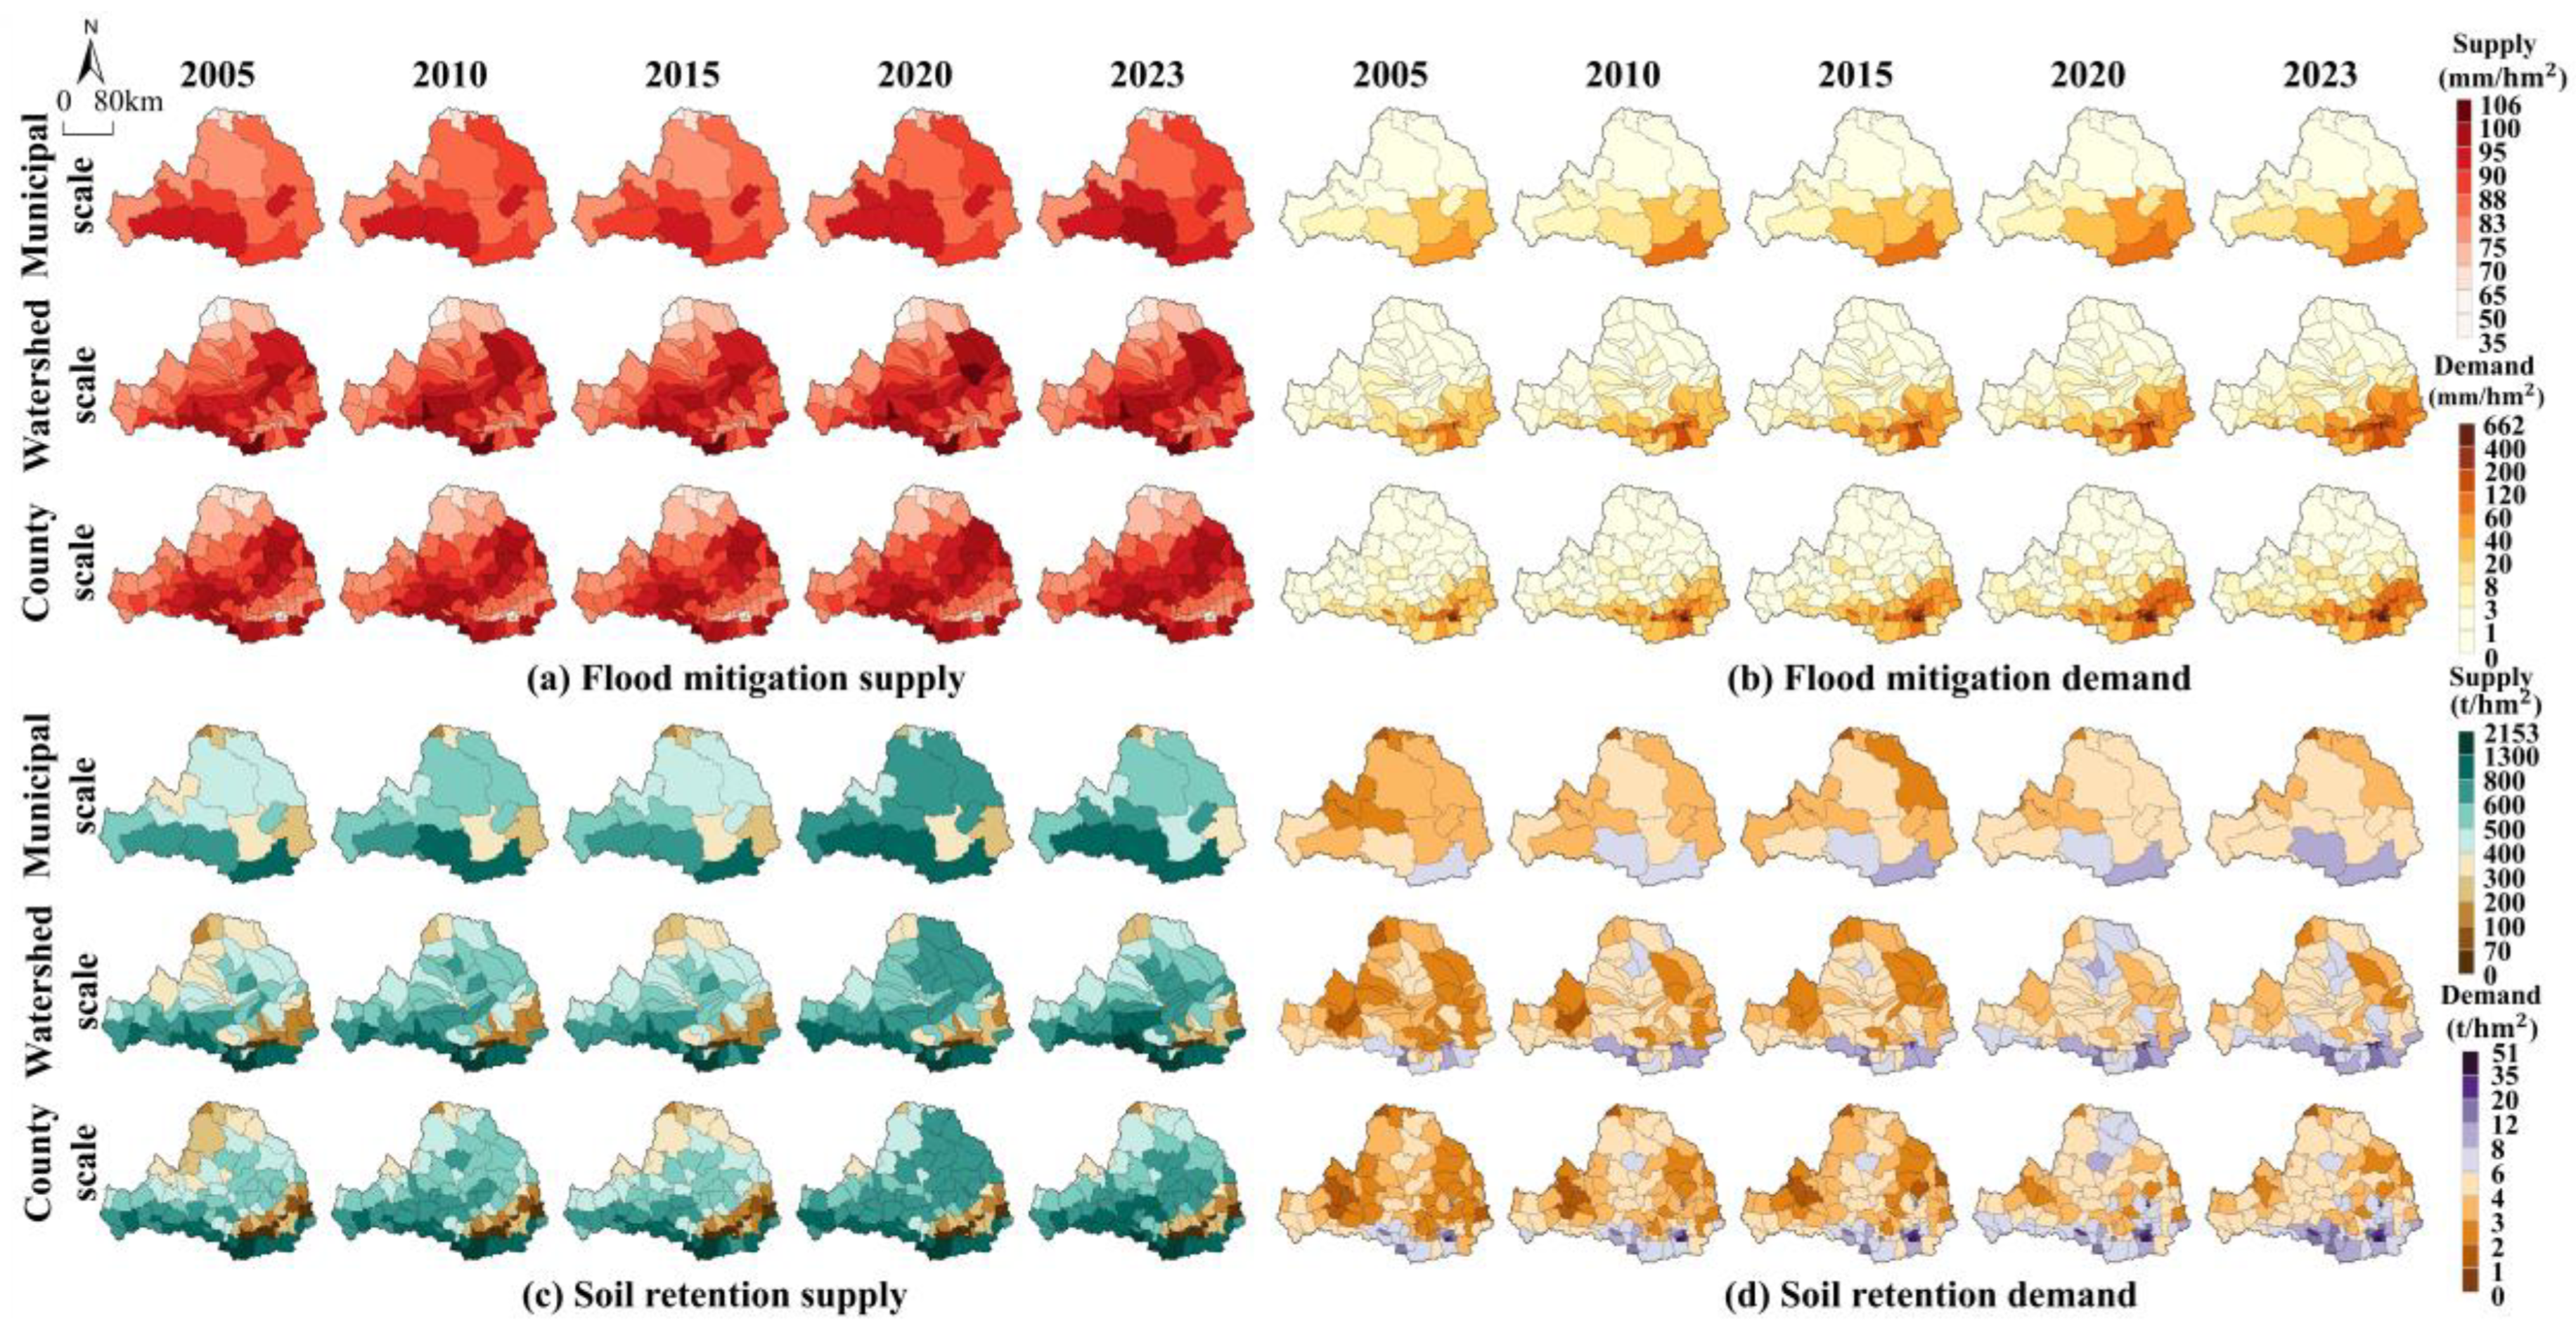
As shown in Figure 3a, the spatial distribution of the FM supply tended to be stable at the three scales. At the municipal scale, Baoji City had the highest supply (94.13–95.55 t / h m 2 ), followed by Tongchuan City (92.06–94.18 t / h m 2 ) and Tianshui City (89.89–90.95 t / h m 2 ). At the watershed scale, the high supply areas were concentrated in mountainous regions, such as sub-watershed 81 (100.99–102.03 t / h m 2 ) and sub-watershed 52 (99.39–101.04 t / h m 2 ). At the county scale, Taibai County had the highest supply (104.22–105.38 t / h m 2 ), while the urban core areas such as Xi’an City (35–42 t / h m 2 ) had the lowest. As shown in Figure 3b, the range of FM demand was showing an expanding trend. And the demand in the central cities of the Guanzhong Plains had increased significantly. The calculation results showed average growth rates in Xi’an City, Xianyang City and Weinan City were 17.69%, 23.45% and 19.30%, respectively. However, the average growth rate at the county scale was relatively low. Some high-demand areas, such as the Xincheng District, Beilin District and Lianhu District, had average growth rates of only 4.29%, 2.32% and 2.23%, respectively. This indicated that the growth in demand mainly came from the surrounding areas of the main urban districts. In the spatial distribution of the SR supply (Figure 3c), the high-value areas were concentrated in the southern bank of the Wei River, while the low-value areas were concentrated in the eastern part of the Guanzhong Plains and the northern part of the Loess Plateau. Compared with the FM, the regional disparities had further widened. For example, at the municipal scale, the annual supply of Xi’an City (953.83 t/hm2) was six times that of Wu Zhong City (156.67 t/hm2). At the county scale, the disparity between Taibai County (1904.29 t/hm2) and Lianhu District (0.15 t/hm2) exceeded four orders of magnitude. In addition, the high demand of SR was concentrated in the central cities of the Guanzhong Plains. The demand for SR (Figure 3d) was much smaller compared to its supply. Xi’an City had the highest annual demand (8.93 t / h m 2 ), and the demand in its central areas reached 36.11 t / h m 2 . This demonstrated that there was still a high demand in densely populated central areas. In conclusion, the Guanzhong Plains was the area with high supply and high demand for the flood-sediment subsystem. The gap between the high-value area and low-value area had further widened at the county scale. In comparison, the SR was more significant in this aspect than the FM.
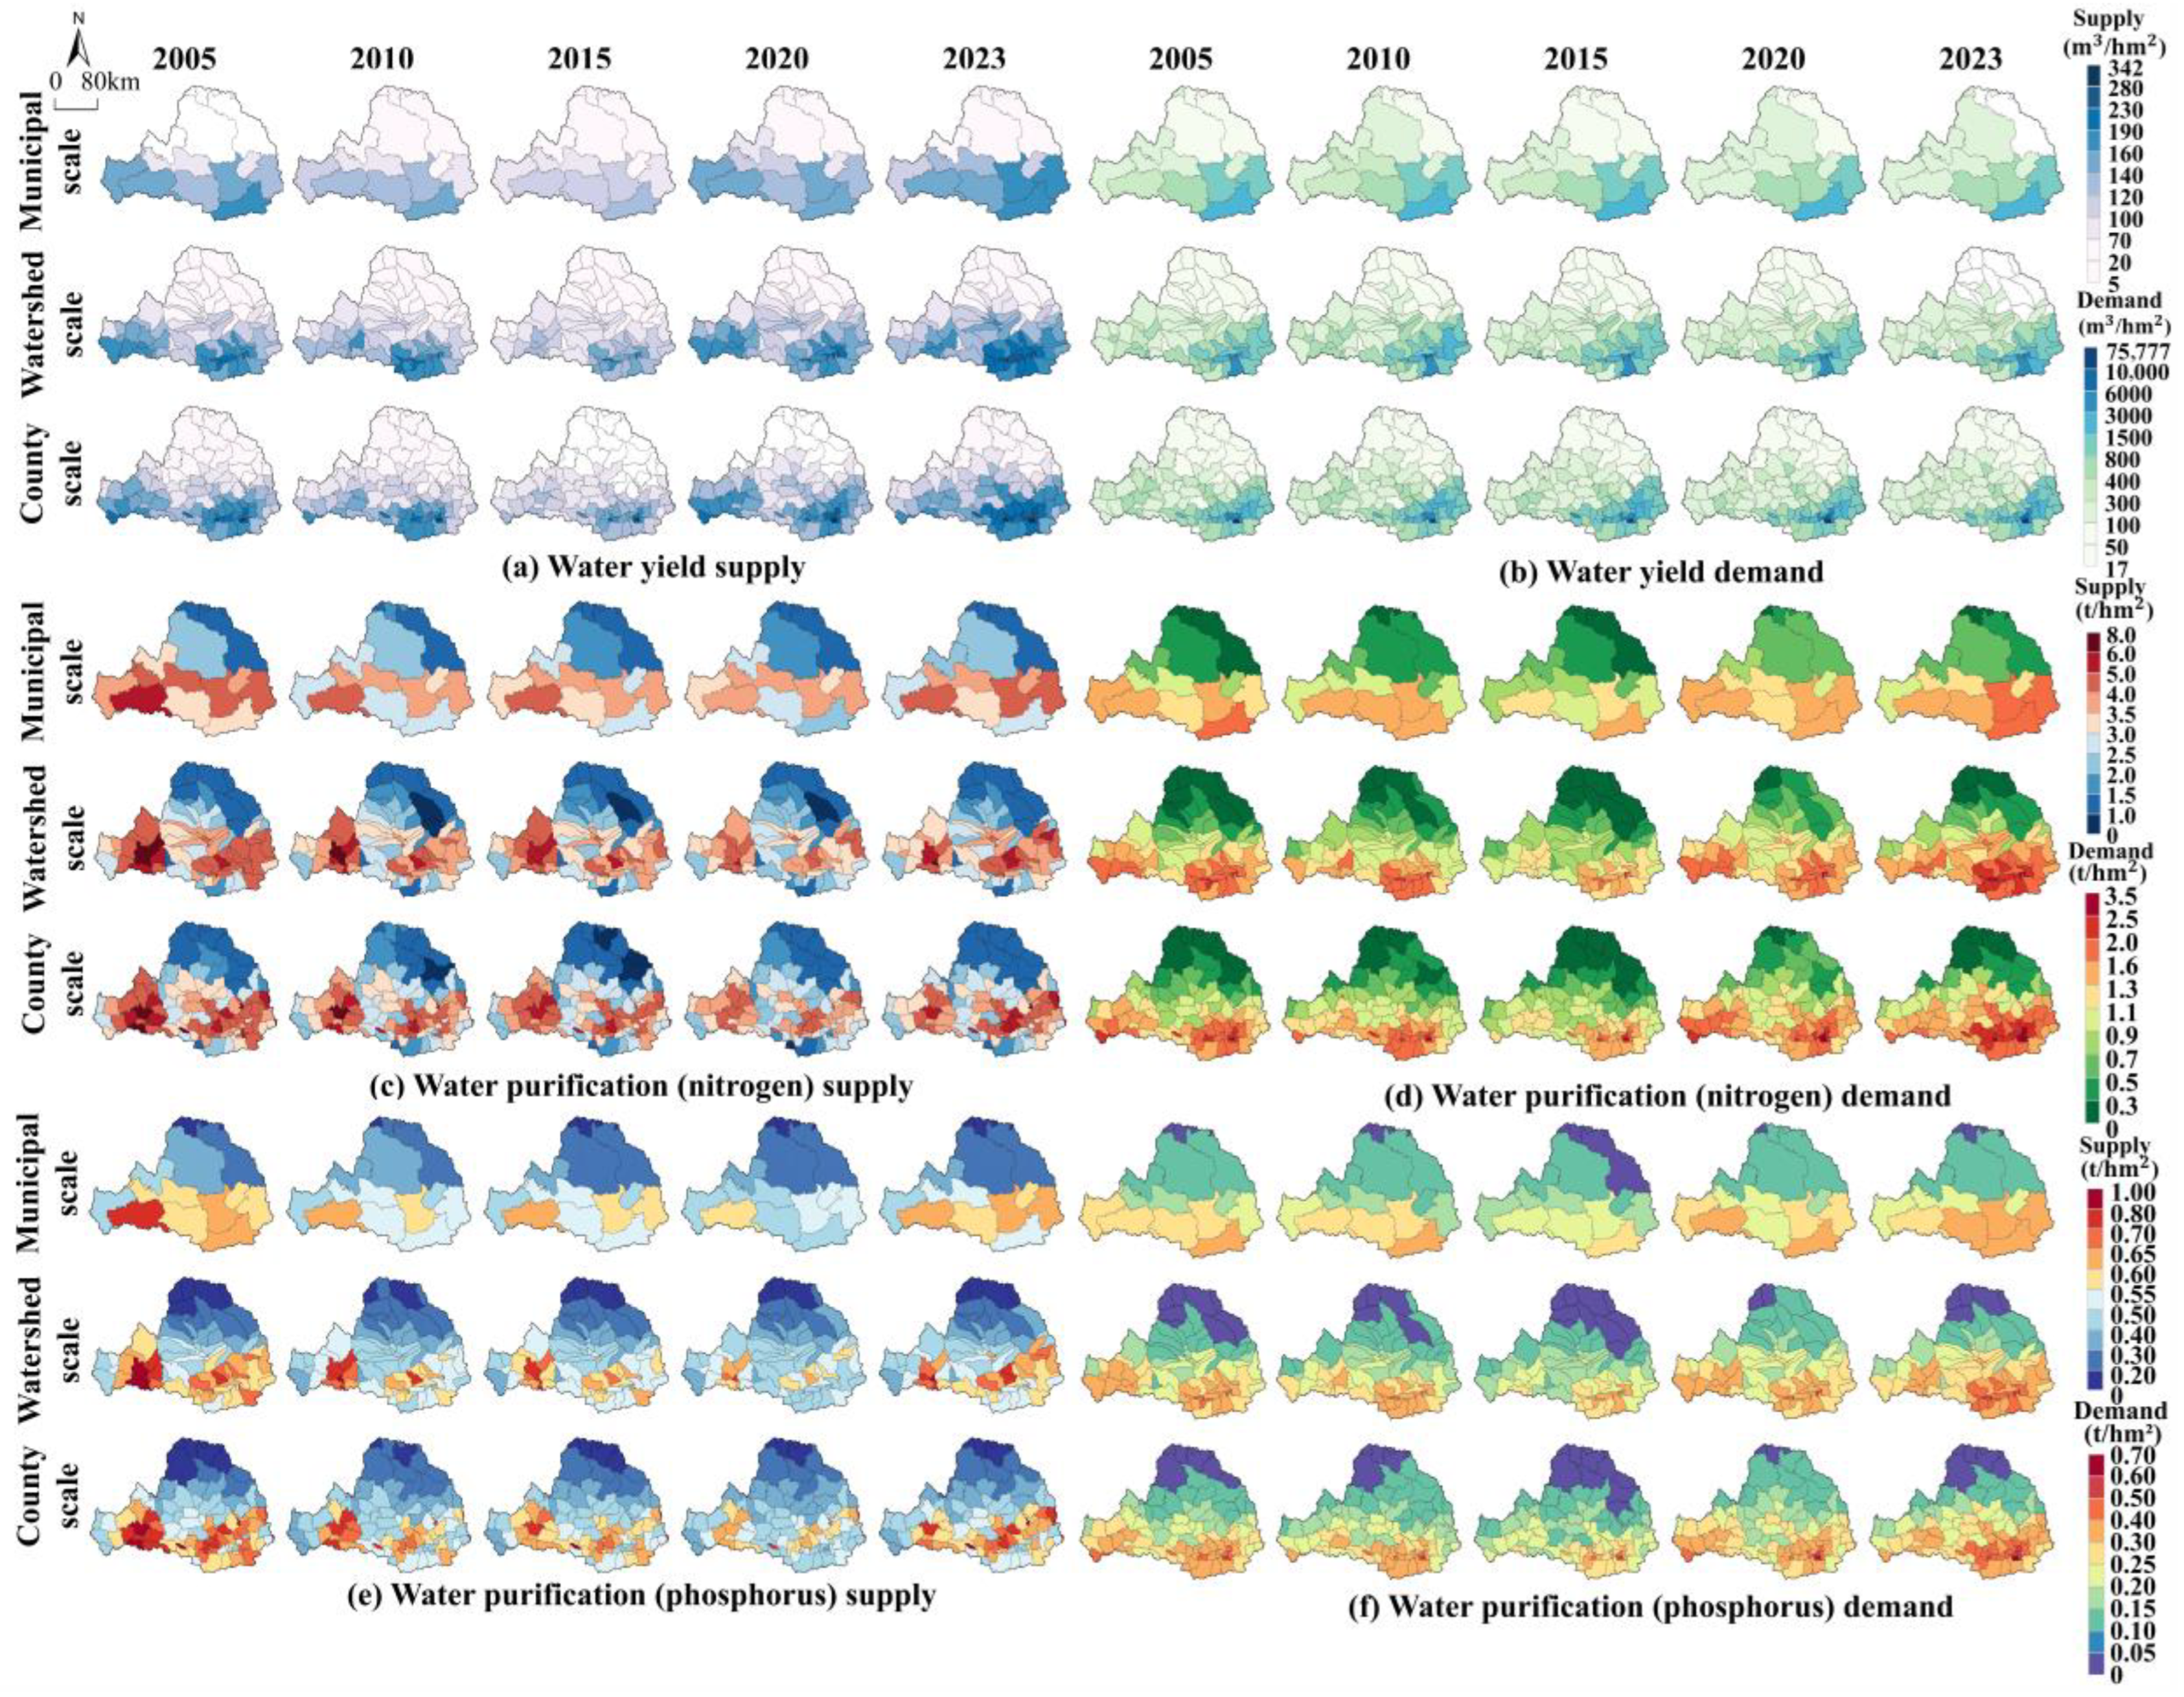
As shown in Figure 4a, the high supply areas of WY were concentrated in the Guanzhong Plains and the Longzhong Plateau, while the northern Loess Plateau was mostly of low value, with significant spatial heterogeneity. The annual supply in Xi’an City was 161.35 m 3 / h m 2 , while that in Wuzhong City was only 7.29 m 3 / h m 2 . The spatial heterogeneity at the micro scale was more significant. The annual supply in Xincheng District was 309.32 m 3 / h m 2 , while that in Yanchi County was only 7.29 m 3 / h m 2 . The annual supply in the sub-watershed 76 was 225.60 m 3 / h m 2 , and that in the sub-watershed 0 was only 8.54 m 3 / h m 2 . As shown in Figure 4b, the distribution of WY demand was mainly related to population density. In the centers of urban agglomerations, there was a higher water use demand than in the peripheries. The annual demand at the municipal, county and watershed scales was 459.55 m 3 / h m 2 , 2520.17 m 3 / h m 2 and 681.24 m 3 / h m 2 , respectively, with average growth rates of 2.59%, 4.96% and 1.35%, respectively. From 2005 to 2023, the spatial distribution of WP was generally characterized by a “high in the south and low in the north” pattern. In the southern part of the WRB, Tianshui City had the maximum supply of WP (nitrogen: 4.47 t / h m 2 and phosphorus: 0.63 t / h m 2 ). Qin’an County had the maximum supply of WP (nitrogen: 5.92 t / h m 2 and phosphorus: 0.72 t / h m 2 ) at the county scale. Sub-watershed 49 had the maximum supply of WP (nitrogen: 6.43 t / h m 2 and phosphorus: 0.83 t / h m 2 ) at the watershed scale. In the northern part of the WRB, Wuzhong City had the minimum demand of WP (nitrogen: 1.22 t / h m 2 and phosphorus: 0.18 t / h m 2 ). Yanchi County had the minimum demand of WP (nitrogen: 1.21 t / h m 2 and phosphorus: 0.18 t / h m 2 ). Sub-watershed 12 had the maximum supply of WP (nitrogen: 0.95 t / h m 2 and phosphorus: 0.27 t / h m 2 ) at the watershed scale. However, the demand for WP was calculated by multiplying the WY supply. The spatial distribution was consistent with the WY supply, with differences only in magnitude [48].
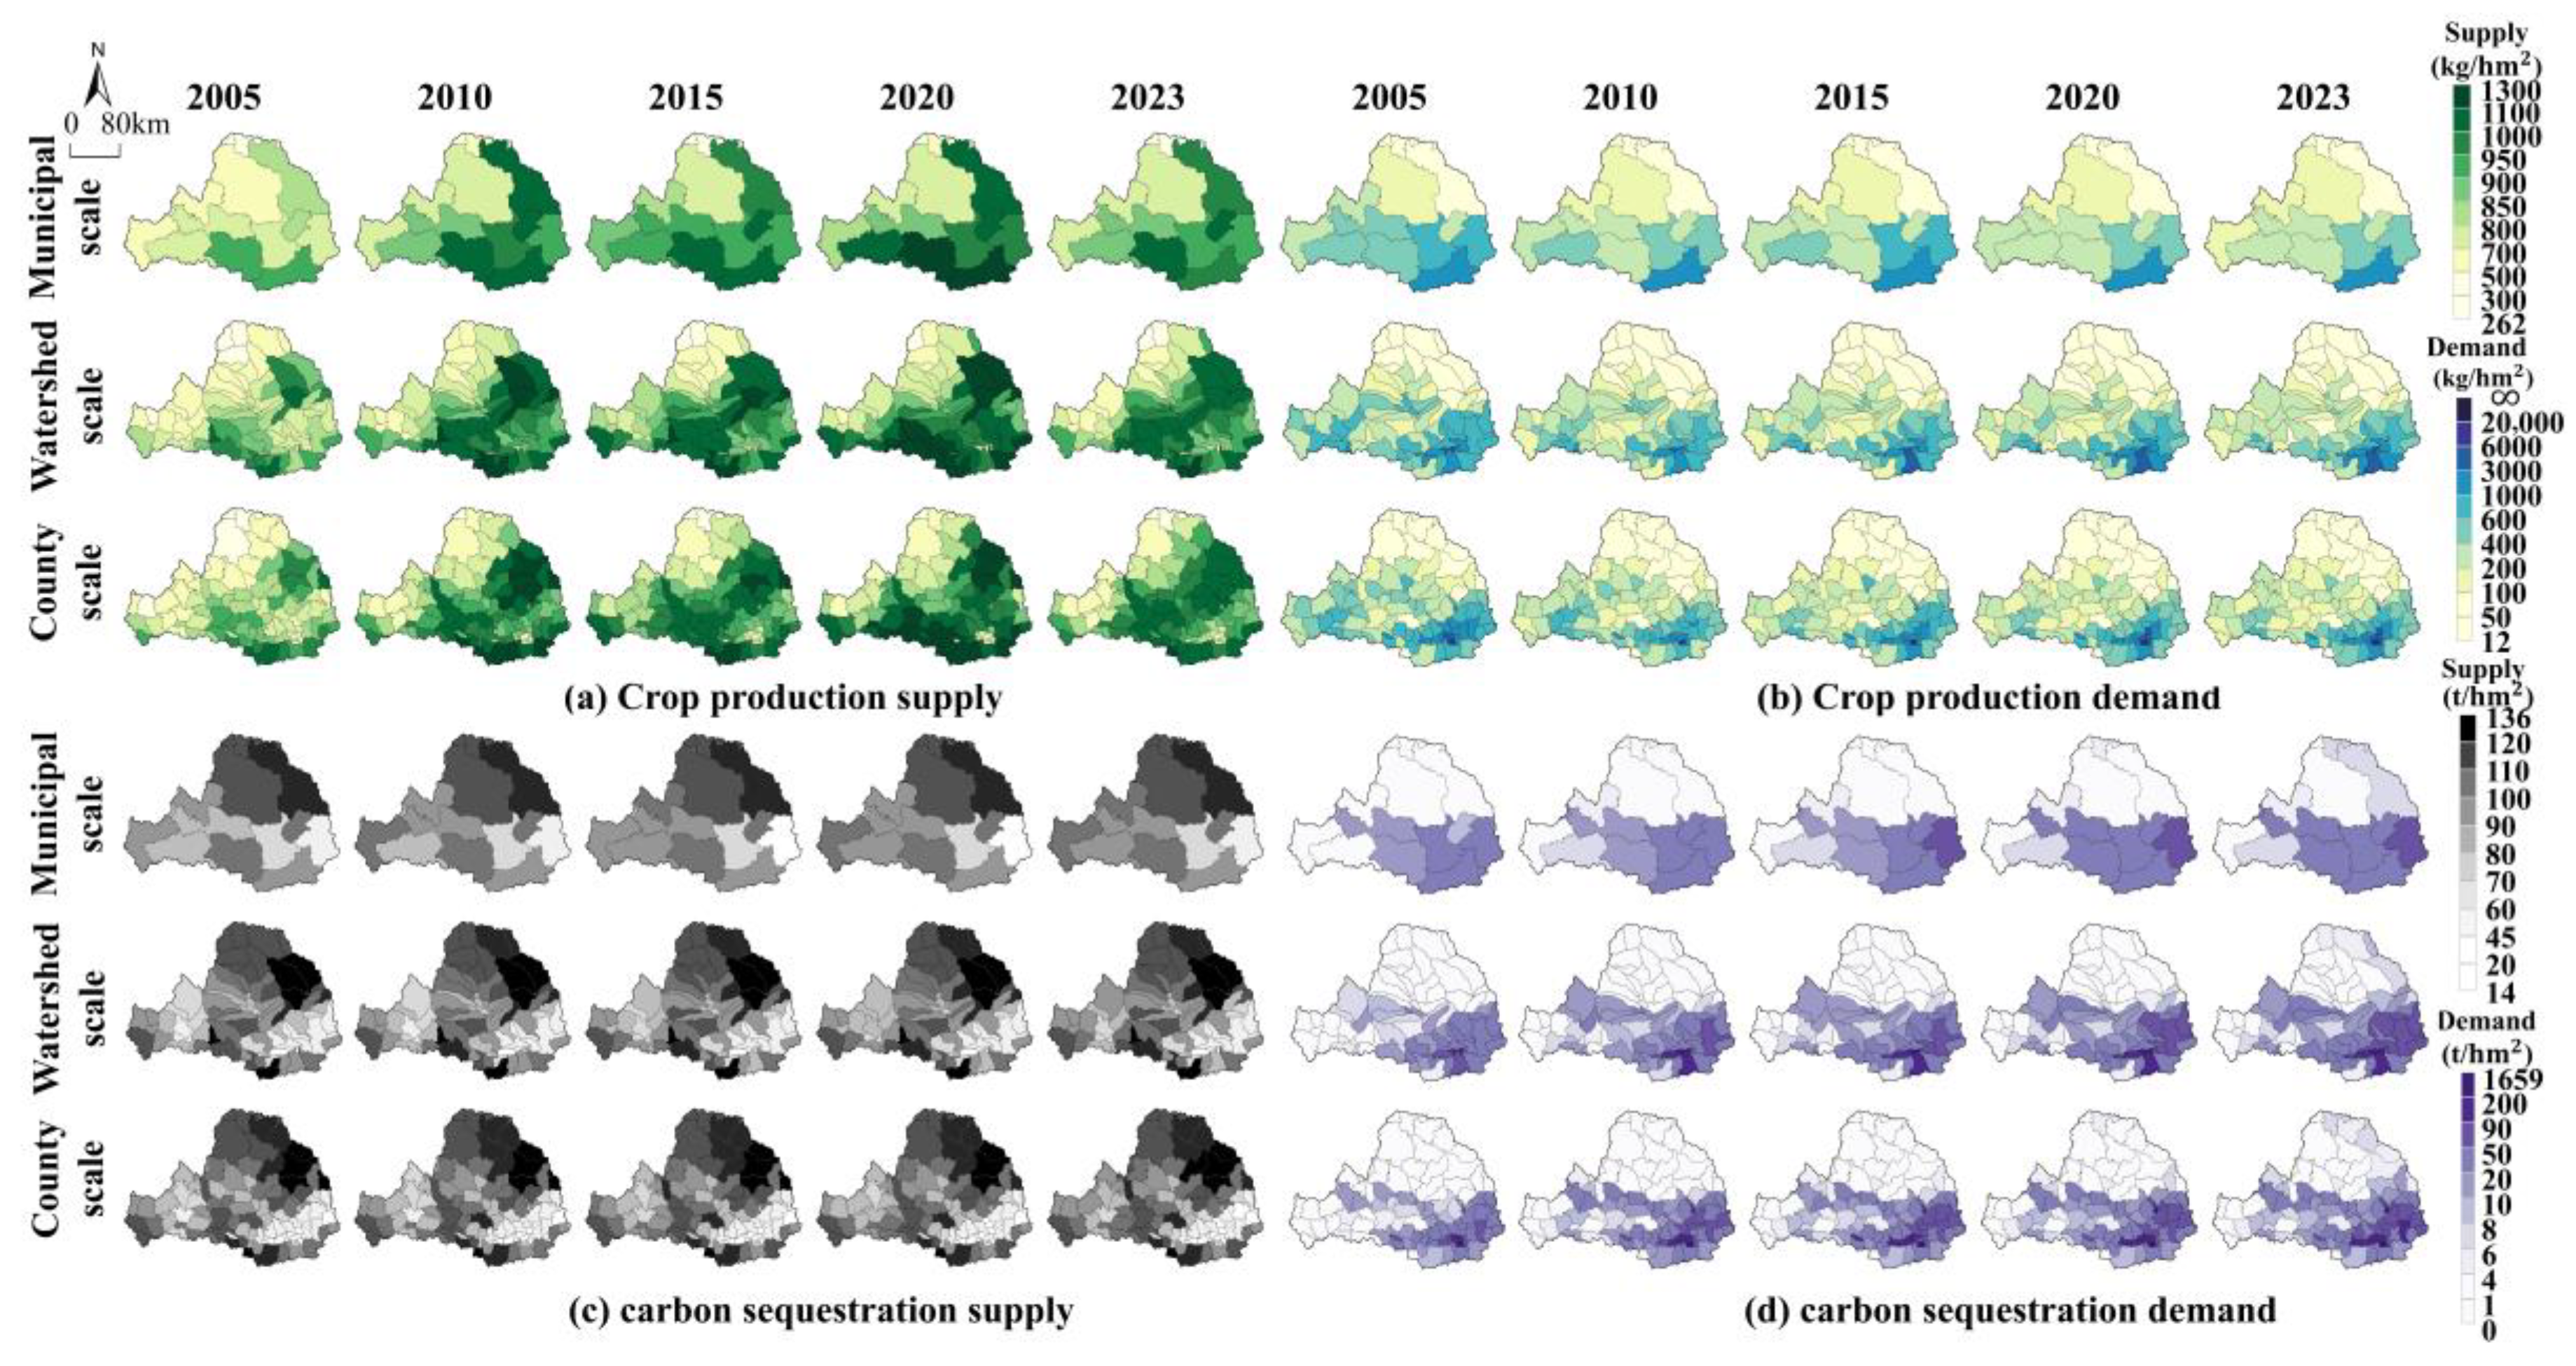
The spatial distribution of the socio-economic subsystem is shown in Figure 5. The high supply areas of CP (Figure 5a) were concentrated in the midstream of the Wei River and the Luo River, while the low supply areas of CP were concentrated in the Longzhong Plateau and Longdong Plateau. At the municipal scale, the annual supply in Xi’an City, Baoji City and Tongchuan City exceeded 1000 k g / h m 2 , while the minimum supply in Wuzhong City was 384 k g / h m 2 . At the county scale, the annual supply in Taibai County was the highest at 1167.71 k g / h m 2 , while that in Lianhu District and Yanxi County was less than 400 k g / h m 2 . At the watershed scale, the annual supply in sub-watershed 81 was the highest at 1159.19 k g / h m 2 , while those in sub-watersheds 0 and 1 were less than 500 k g / h m 2 . The overall CP demand (Figure 5b) showed a downward trend, but it exhibited a pattern of first decreasing and then increasing at multiple scales. This was because during the period from 2010 to 2023, the demand in the Guanzhong Plains Urban Agglomeration doubled, which pushed up the overall average value. Meanwhile, the demand in other regions generally declined during the same period. In spatial distribution, the spatial heterogeneity at multiple scales was extremely significant. For example, the annual demand in Xi’an City was 1482.87 k g / h m 2 , while in Beilin District, it reached as high as 52,225.76 k g / h m 2 . From 2005 to 2023, the CS supply (Figure 5c) showed a gradual upward trend. In spatial distribution, the high-value areas were concentrated in the upstream of the Luo River, while the low-value areas were concentrated in the Guanzhong Plains. The CS supply had not shown significant spatial differences at multiple scales. But the spatial differences in the CS demand (Figure 5d) at multiple scales were quite significant. For example, the demand in Weinan City was only 49.79 t / h m 2 , while that in Beilin District was 1327.64 t / h m 2 .

3.2. The ESs Flows at Multiple Scales

Given the insignificant differences in supply and demand observed at the municipal scale, this paper focuses on developing EC standards at the county and watershed scales. The most recent available data (for 2023) best represent the current ecological and socio-economic conditions. As an immediate and forward-looking policy tool, the EC mechanism requires compensation standards to be designed based on the latest information. This approach provides the most direct scientific basis for formulating future compensation budgets and negotiating new compensation agreements.

3.2.1. The ESs Flows at the County Scale

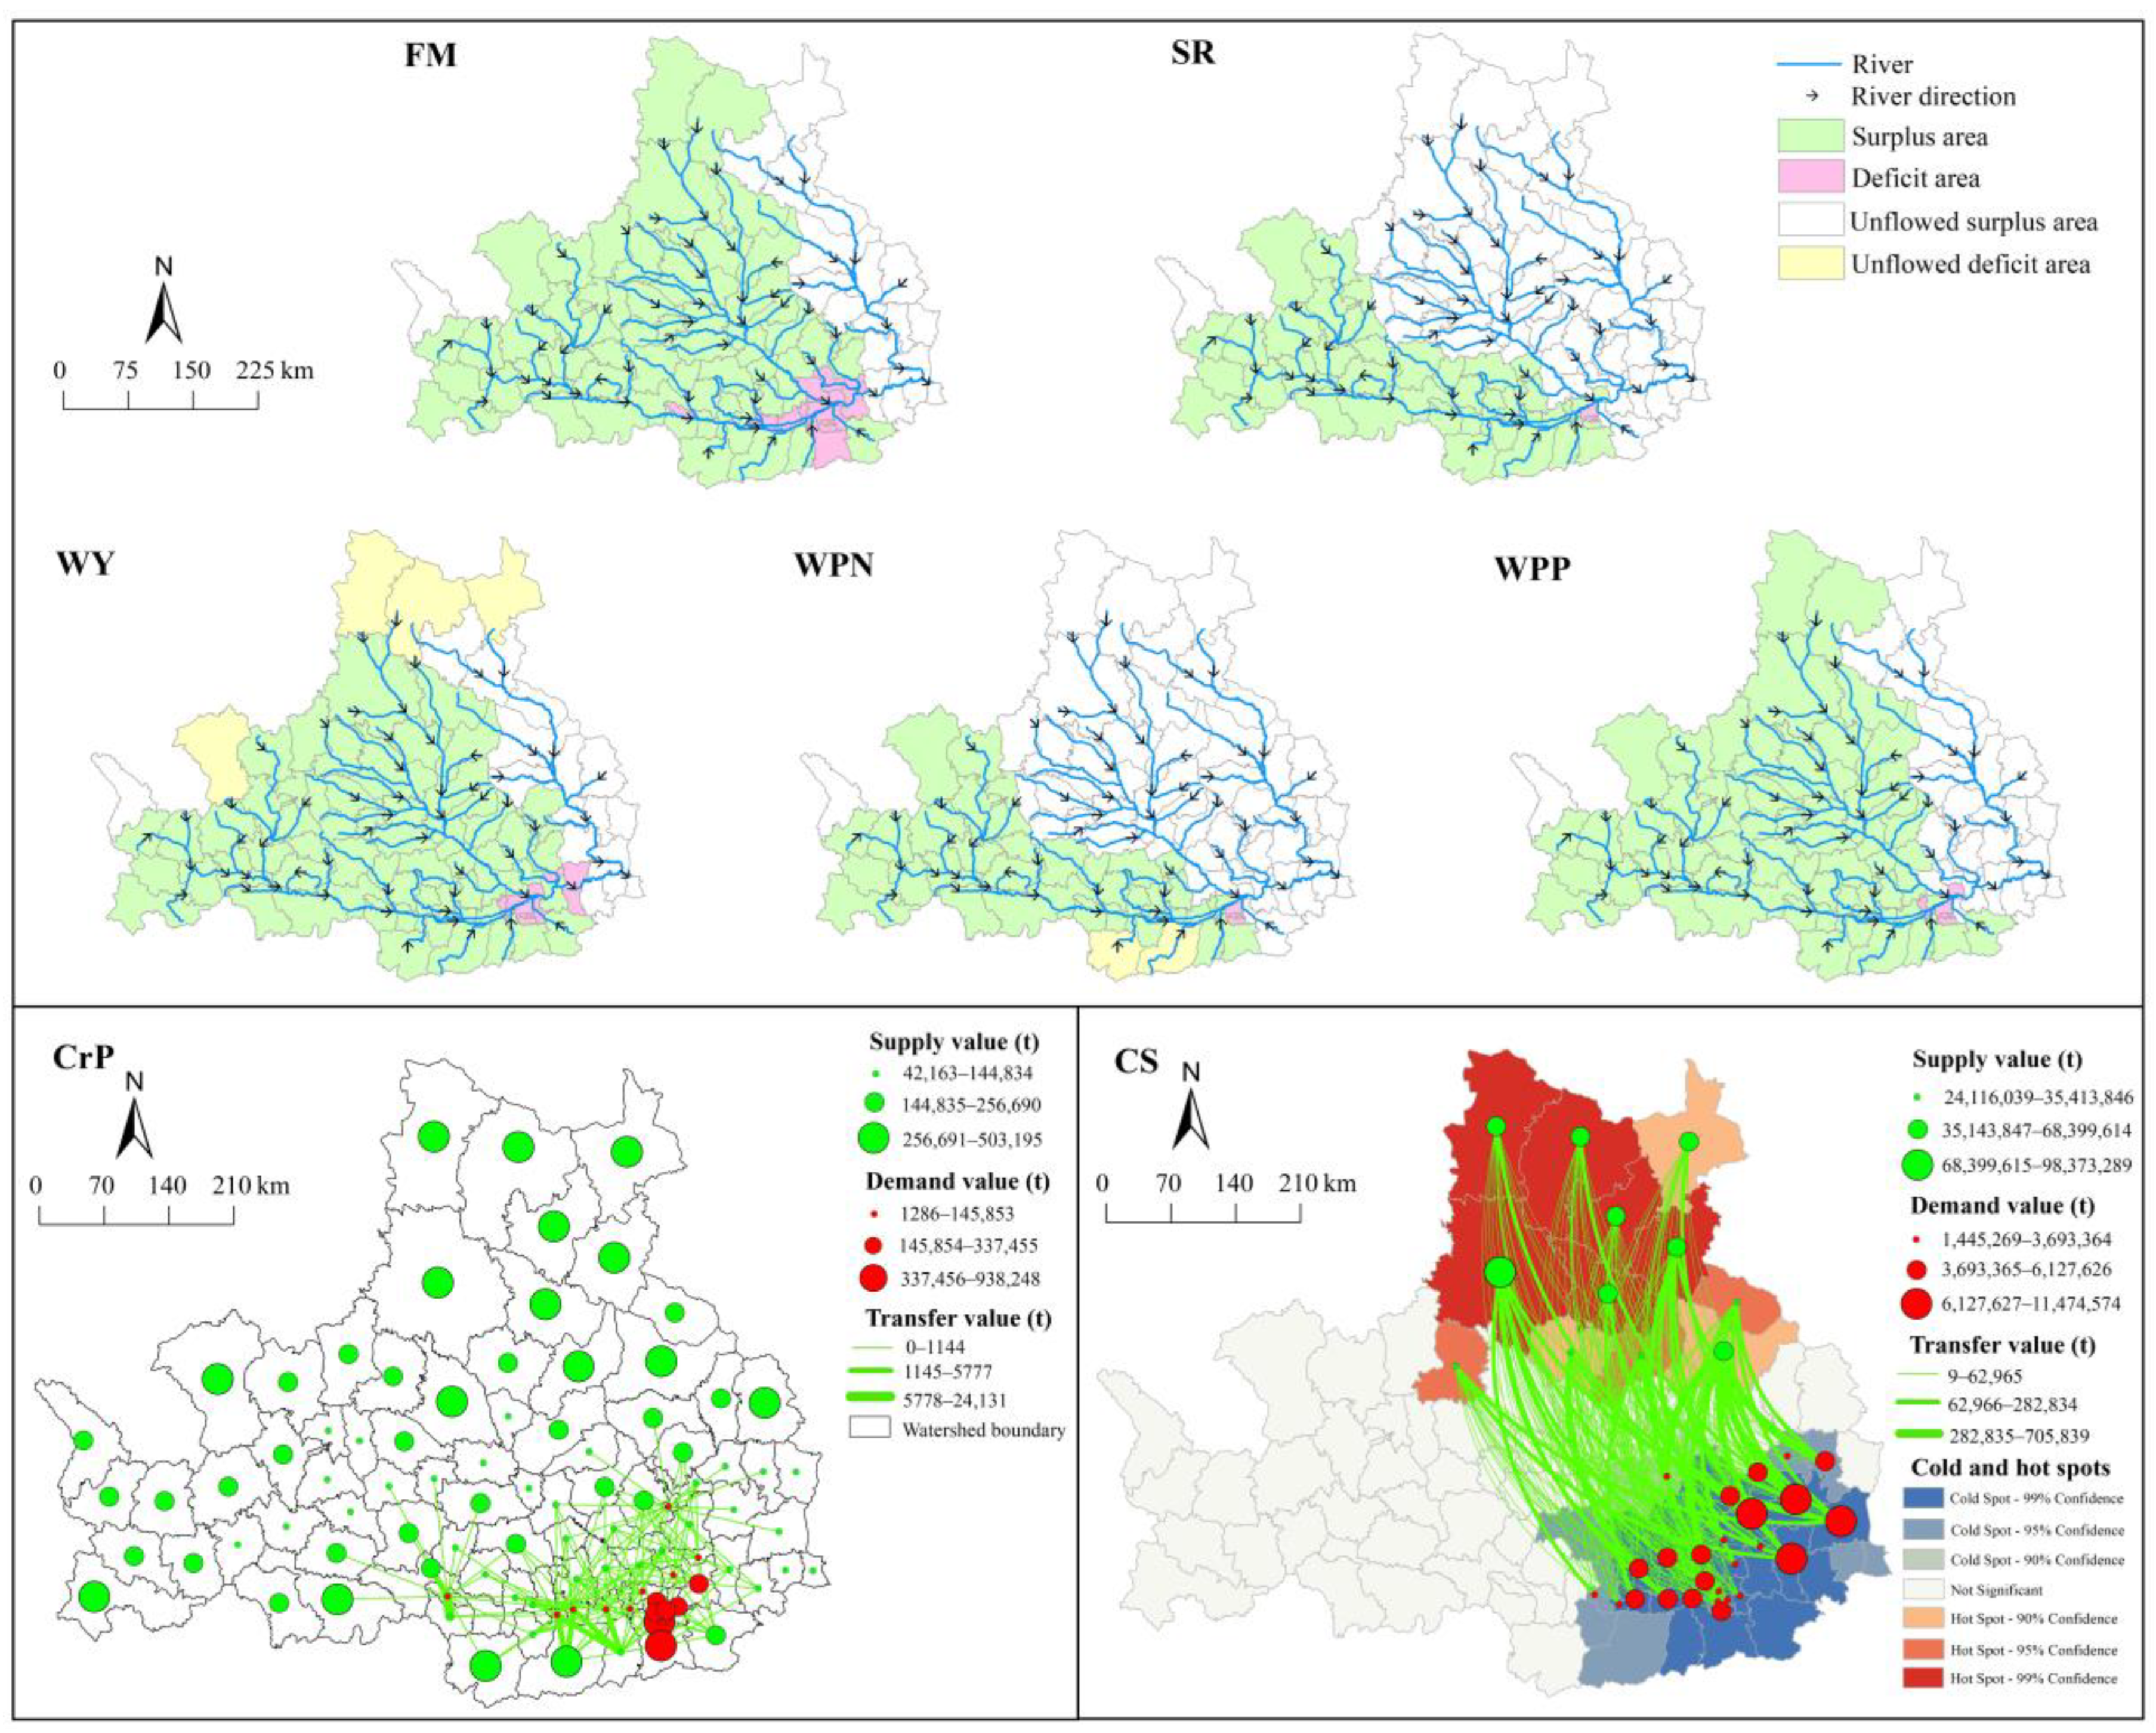
The simulation results of water-related flows are shown in Figure 6. The deficit areas of the FM, SR, WY and WP services were all concentrated in the central areas of the Guanzhong Plains, while the surplus areas were mainly concentrated in the counties or districts where the Wei River and Jing River flow through. The FM had the most, 18, deficit areas. Among them, the deficit value of Weiyang District was the largest, at 1.09 × 10 8   m 3 , accounting for 21% of the total deficit values. Sanyuan County had the smallest deficit, at 1.52 × 10 6   m 3 , accounting for 0.3% of the total deficit values. The deficit areas of SR were Xi’an City and some central areas of Weinan City, where the average value was 2.5 × 10 5   t . The value in the surplus areas varied significantly. The area of the maximum surplus was Taibai County, which was 1.5 × 10 5   t , while the area of the minimum surplus was Weicheng District, which was only 153 t . The deficit areas of WY were the main urban areas of Xi’an City, Weinan City and Xianyang City. Among them, the deficit value of Weiyang District was the maximum, at 1.09 × 10 8   m 3 , accounting for 29% of the total deficit values. The deficit value of Weicheng District was the maximum, at 8.39 × 10 6   m 3 , accounting for 0.86% of the total deficit values. The resource-dependent water-scarce areas in the north, such as Yanchi County and Dingbian County, had a total water shortage of 4.49 × 10 8   m 3 . However, they were located at the uppermost part of the river, so there was no inflow of WY. The deficit areas of WP were concentrated in the Xincheng District, Beiling District, Lianhu District, Weiyang District and Yanta District. Taibai County and Zhouzhi County were located at the boundary of the study area and the upstream of the tributary. Therefore, no inflow occurred. The flow paths of CP are determined by the supply and demand relationships. The surplus areas transfer their surplus to the surrounding deficit areas after meeting their own demands. The deficit areas mainly covered Xi’an City and the surrounding counties or districts. Through the analysis of hot and cold spots, the hot spots were mainly concentrated in the upstream of the Luo River, while the cold spots were concentrated in the Guanzhong Plains. A total of 284 flow paths were formed between the cold and hot spots.
In addition, we take the top three flow values as the key paths of ESs, as shown in Table 3. The key paths of water-related ESs are highly directed towards the core urban area of Xi’an City in the downstream. Among them, the maximum flow of FM is from Yaozhou District to Yanliang District. The key paths of WY and SR are from Min County and Taibai County to Yanta District and Weiyang District, respectively. And the key path of WPP is from upstream areas such as Huining County and Maiji District to Weiyang District. Due to the influence of model assumptions and thresholds, a total of 154 flow paths were formed for CP. The key path of CP flow was from Weibin District of Baoji City to Jintai District, while the secondary paths include from Huyi District to Wugong County and from Chencang District to Jintai District. The key path for CS was from Fu County to Pucheng County, and the secondary paths include from Fu County to Chengcheng County and from Fu County to Xunyi County.

3.2.2. The ESs Flows at the Watershed Scale

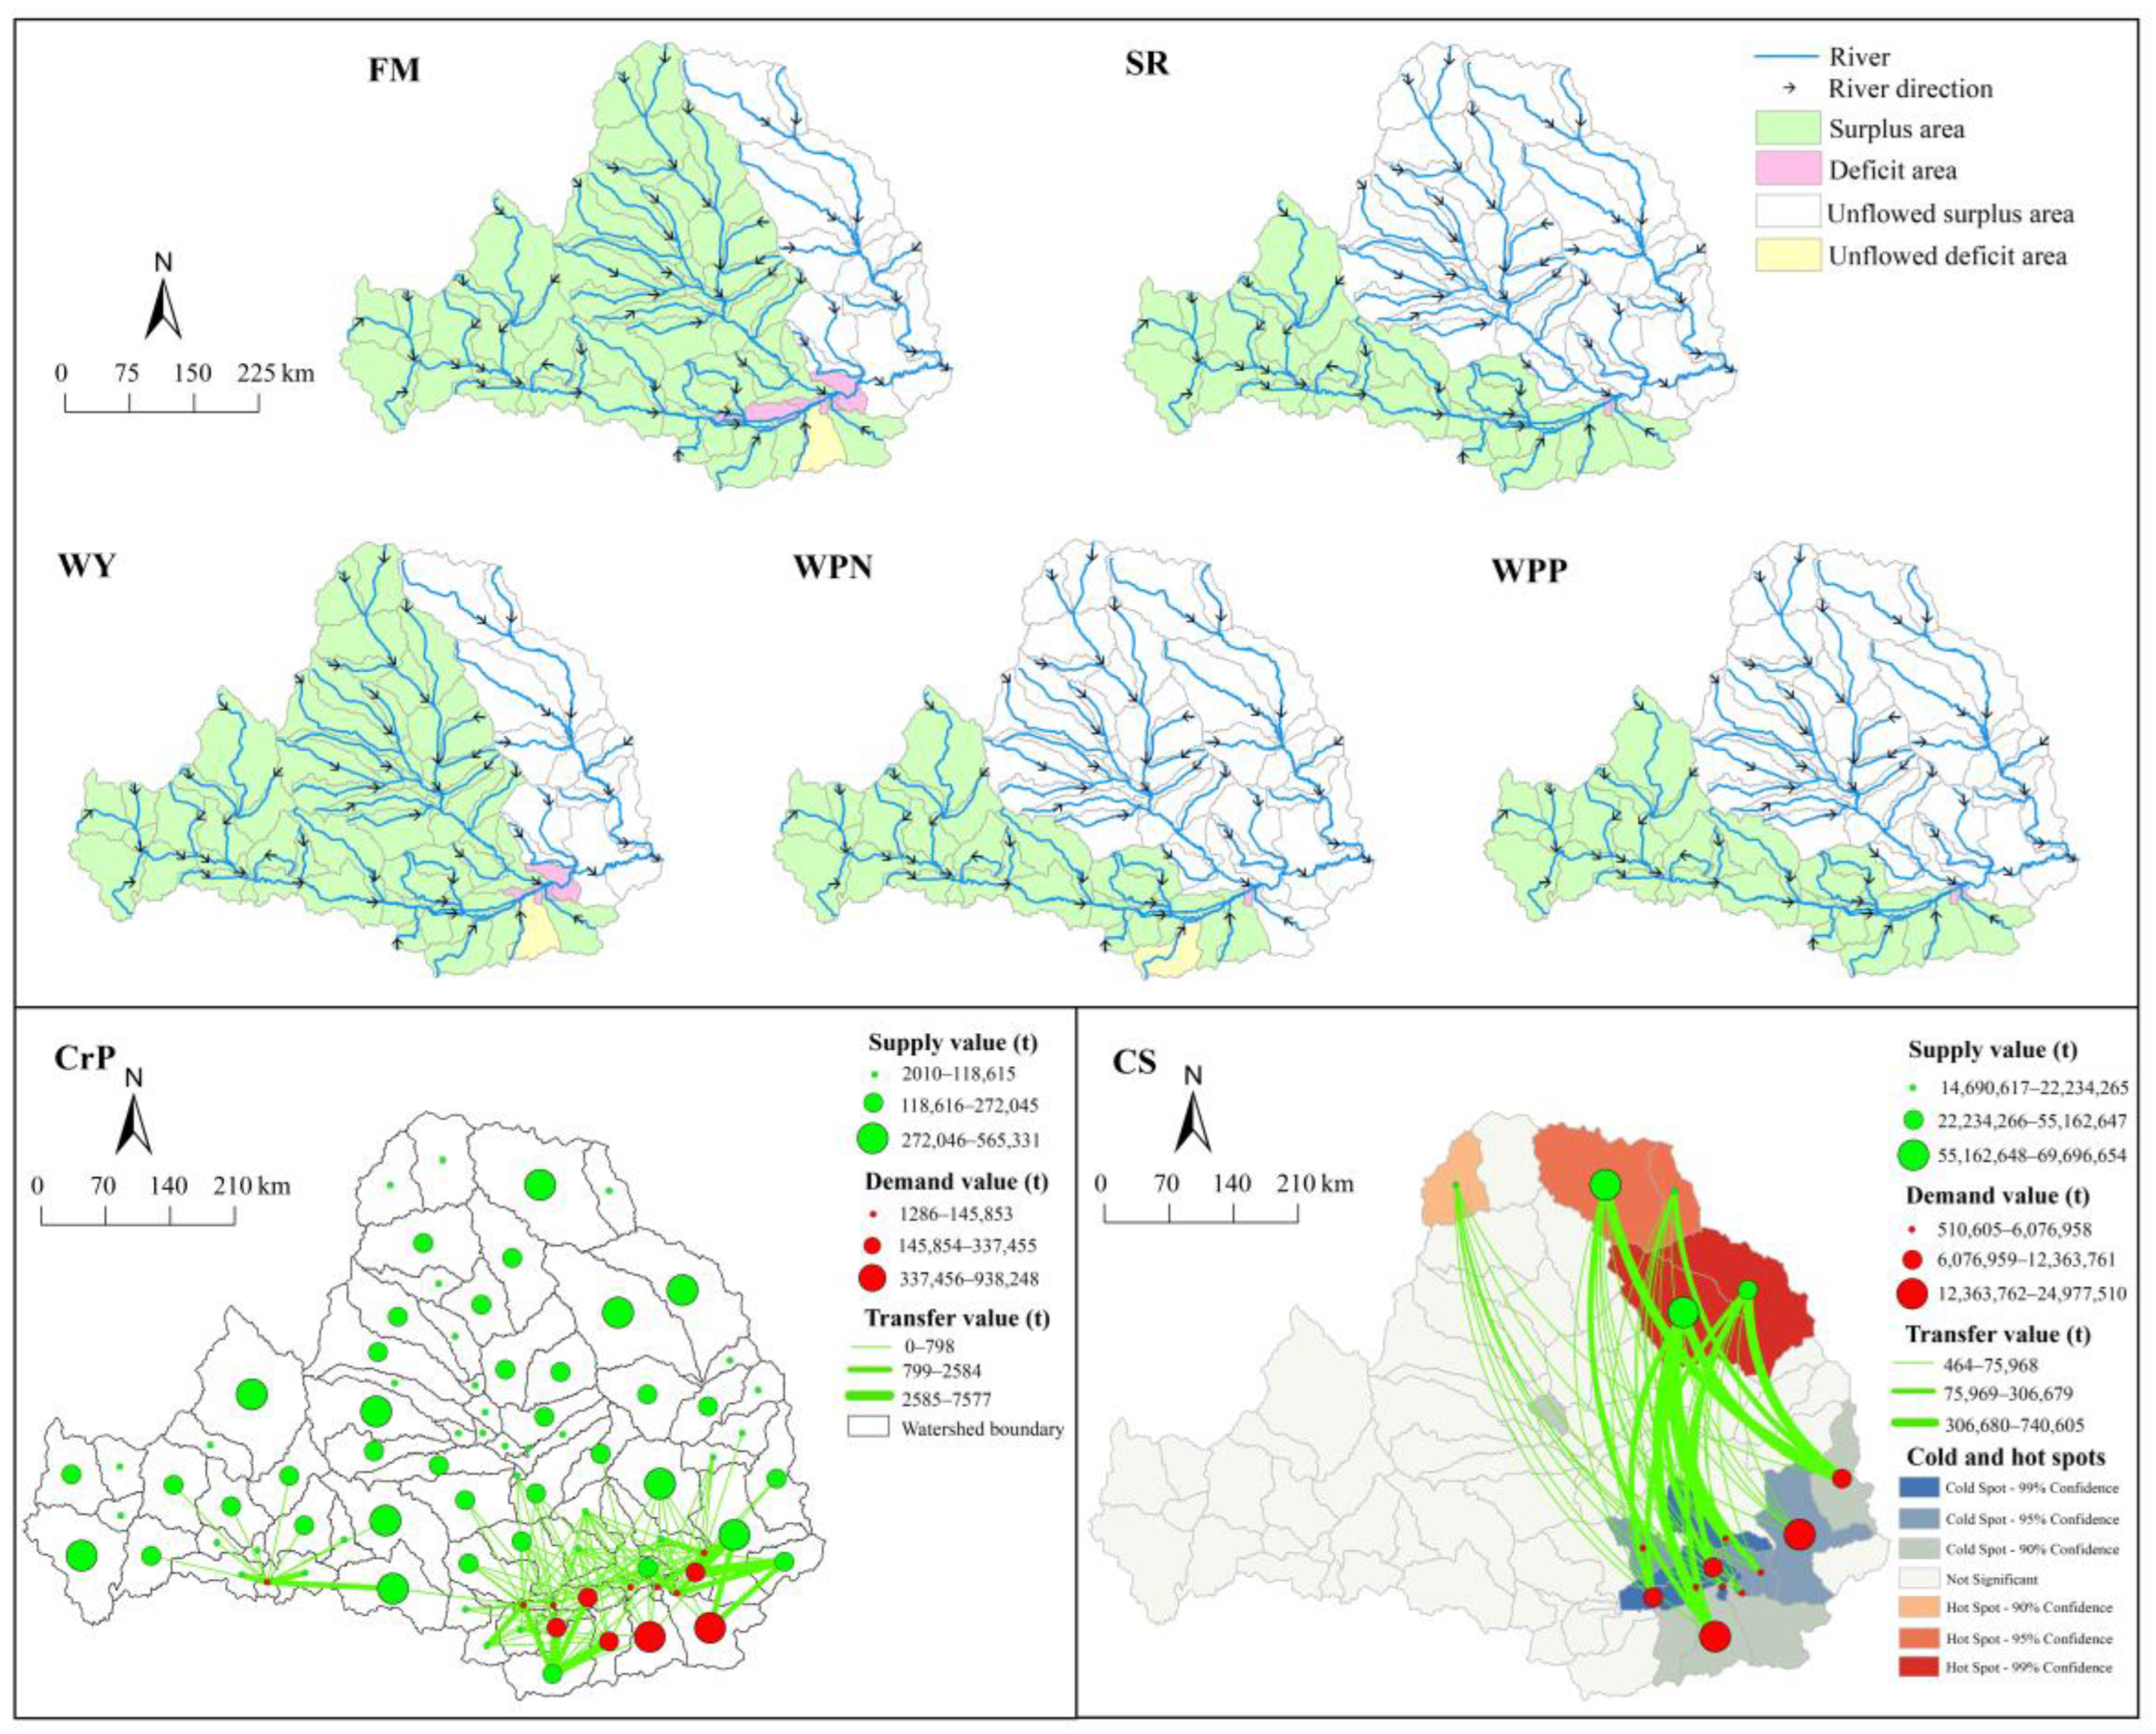
As shown in Figure 7, the flow paths of six ESs at the watershed scale were more concentrated than those at the county scale. There were only seven deficit areas in FM, among which the sub-watershed 67 had the maximum deficit value, at 5.26 × 10 7   m 3 , accounting for 25% of the total deficit values. In SR, only sub-watersheds 65 and 66 were deficit areas. In WY, the deficit value in sub-watershed 66 accounted for more than 50% of the total deficit values. Sub-watershed 40 had the highest surplus, accounting for 8.58% of the total surplus values. In WP, sub-watersheds 65 and 66 were deficit areas. And sub-watershed 63 was the surplus area providing the maximum nitrogen and phosphorus services. The CP service generated 128 flow paths. The five largest of these, with values ranging from 2585 to 7577 tons, accounted for 45.66% of the total flow values. Among all flows, the path from sub-watersheds 60 to 67 had the maximum value (7577 t), constituting 13.92% of the total flow values. The number of the CS flow paths at the watershed scale was less than 20% of that at the county scale. Four major flow paths, with values between 306,680 and 740,605 tons, accounted for 55.62% of the total CS flow values. The flow from sub-watersheds 13 to 55 was the largest (740,605 t), representing 12.85% of the total flow values.
As shown in Table 4, at the watershed scale, the key paths for water-related ESs are highly concentrated in sub-watershed 66. The maximum path for CP is from sub-watershed 60 to sub-watershed 67. The maximum path for CS is from sub-watershed 13 to sub-watershed 55. In summary, the flow paths of water-related services are largely confined to the corridors of the Wei River and the Jing River, whereas the Luo River basin plays a minimal role. The CP flows exhibit distance-decay characteristics, with their paths concentrated around deficit areas. The CS flows are primarily identified between the upstream of the Luo River and the Guanzhong Plains.

3.3. Determination of the EC Standard

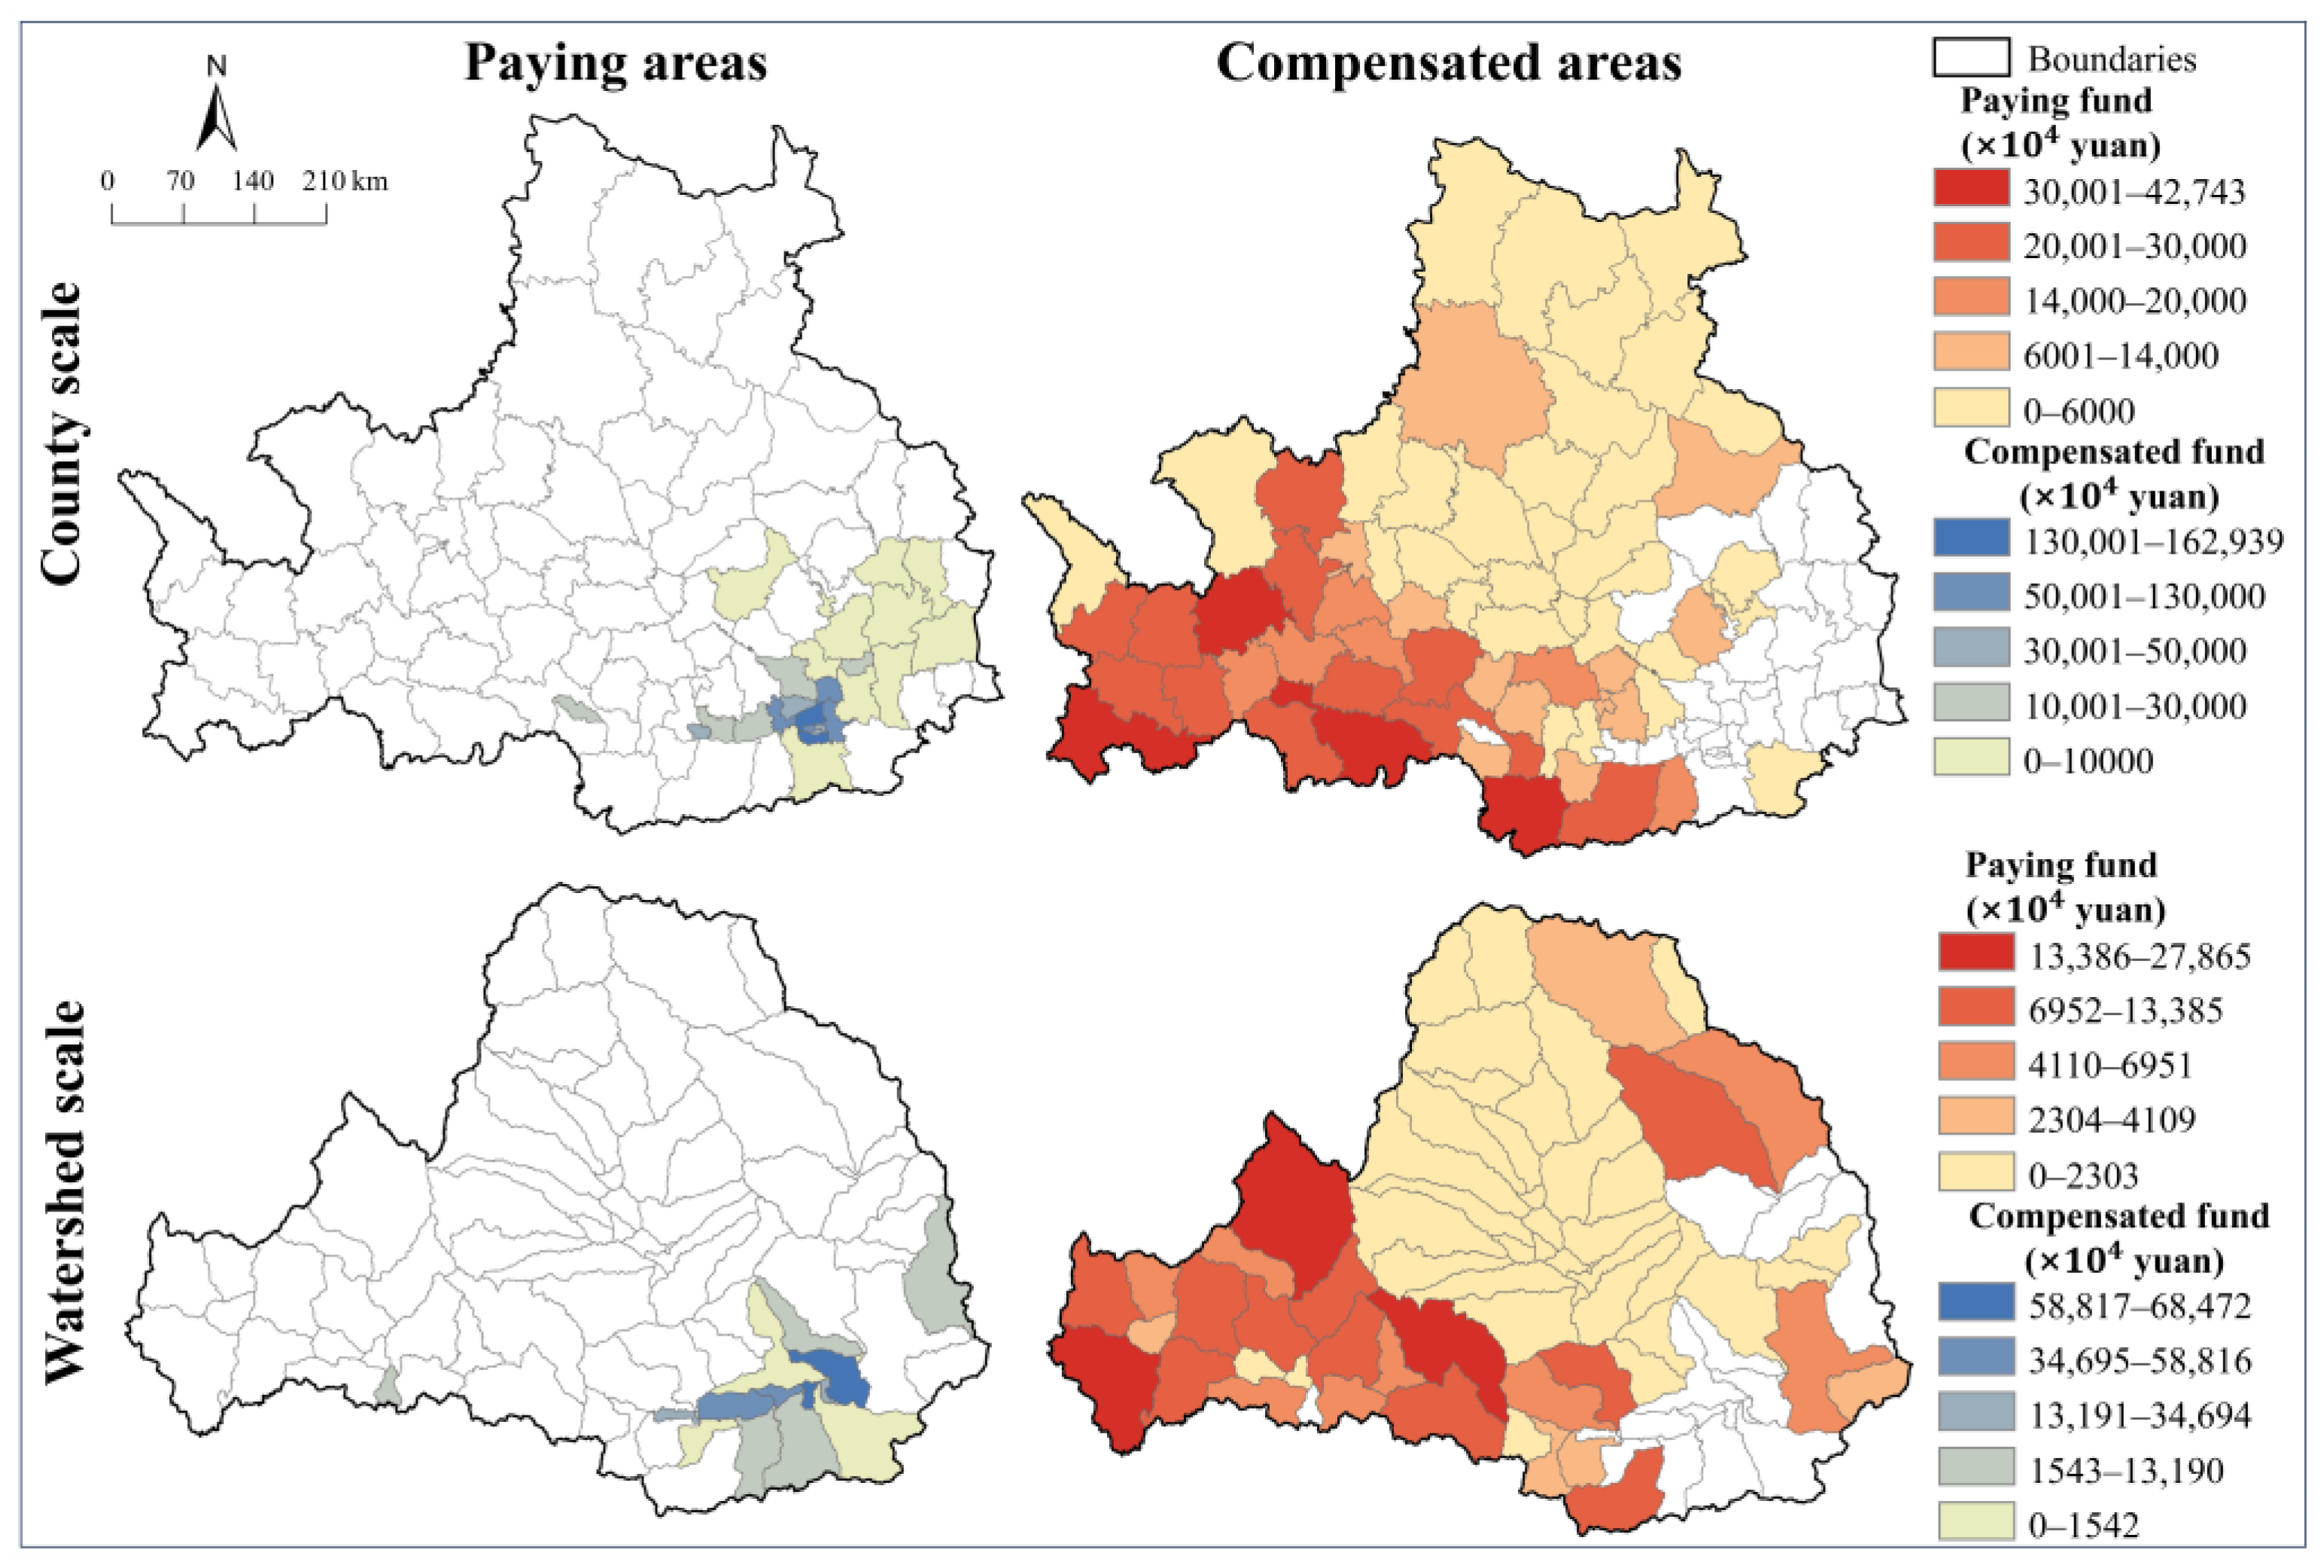
EC is not only a governance tool for paying for ESs, but also a “re-distribution” force that promotes coordinated regional development. As shown in Figure 8, at both the county and watershed scales, the EC scheme engages nearly the entire basin. The economically developed Guanzhong Plains regions act as the primary payers for ESs, while other regions are net recipients. This demonstrates that the proposed EC framework can effectively mobilize joint governance for ecological protection across the entire basin.
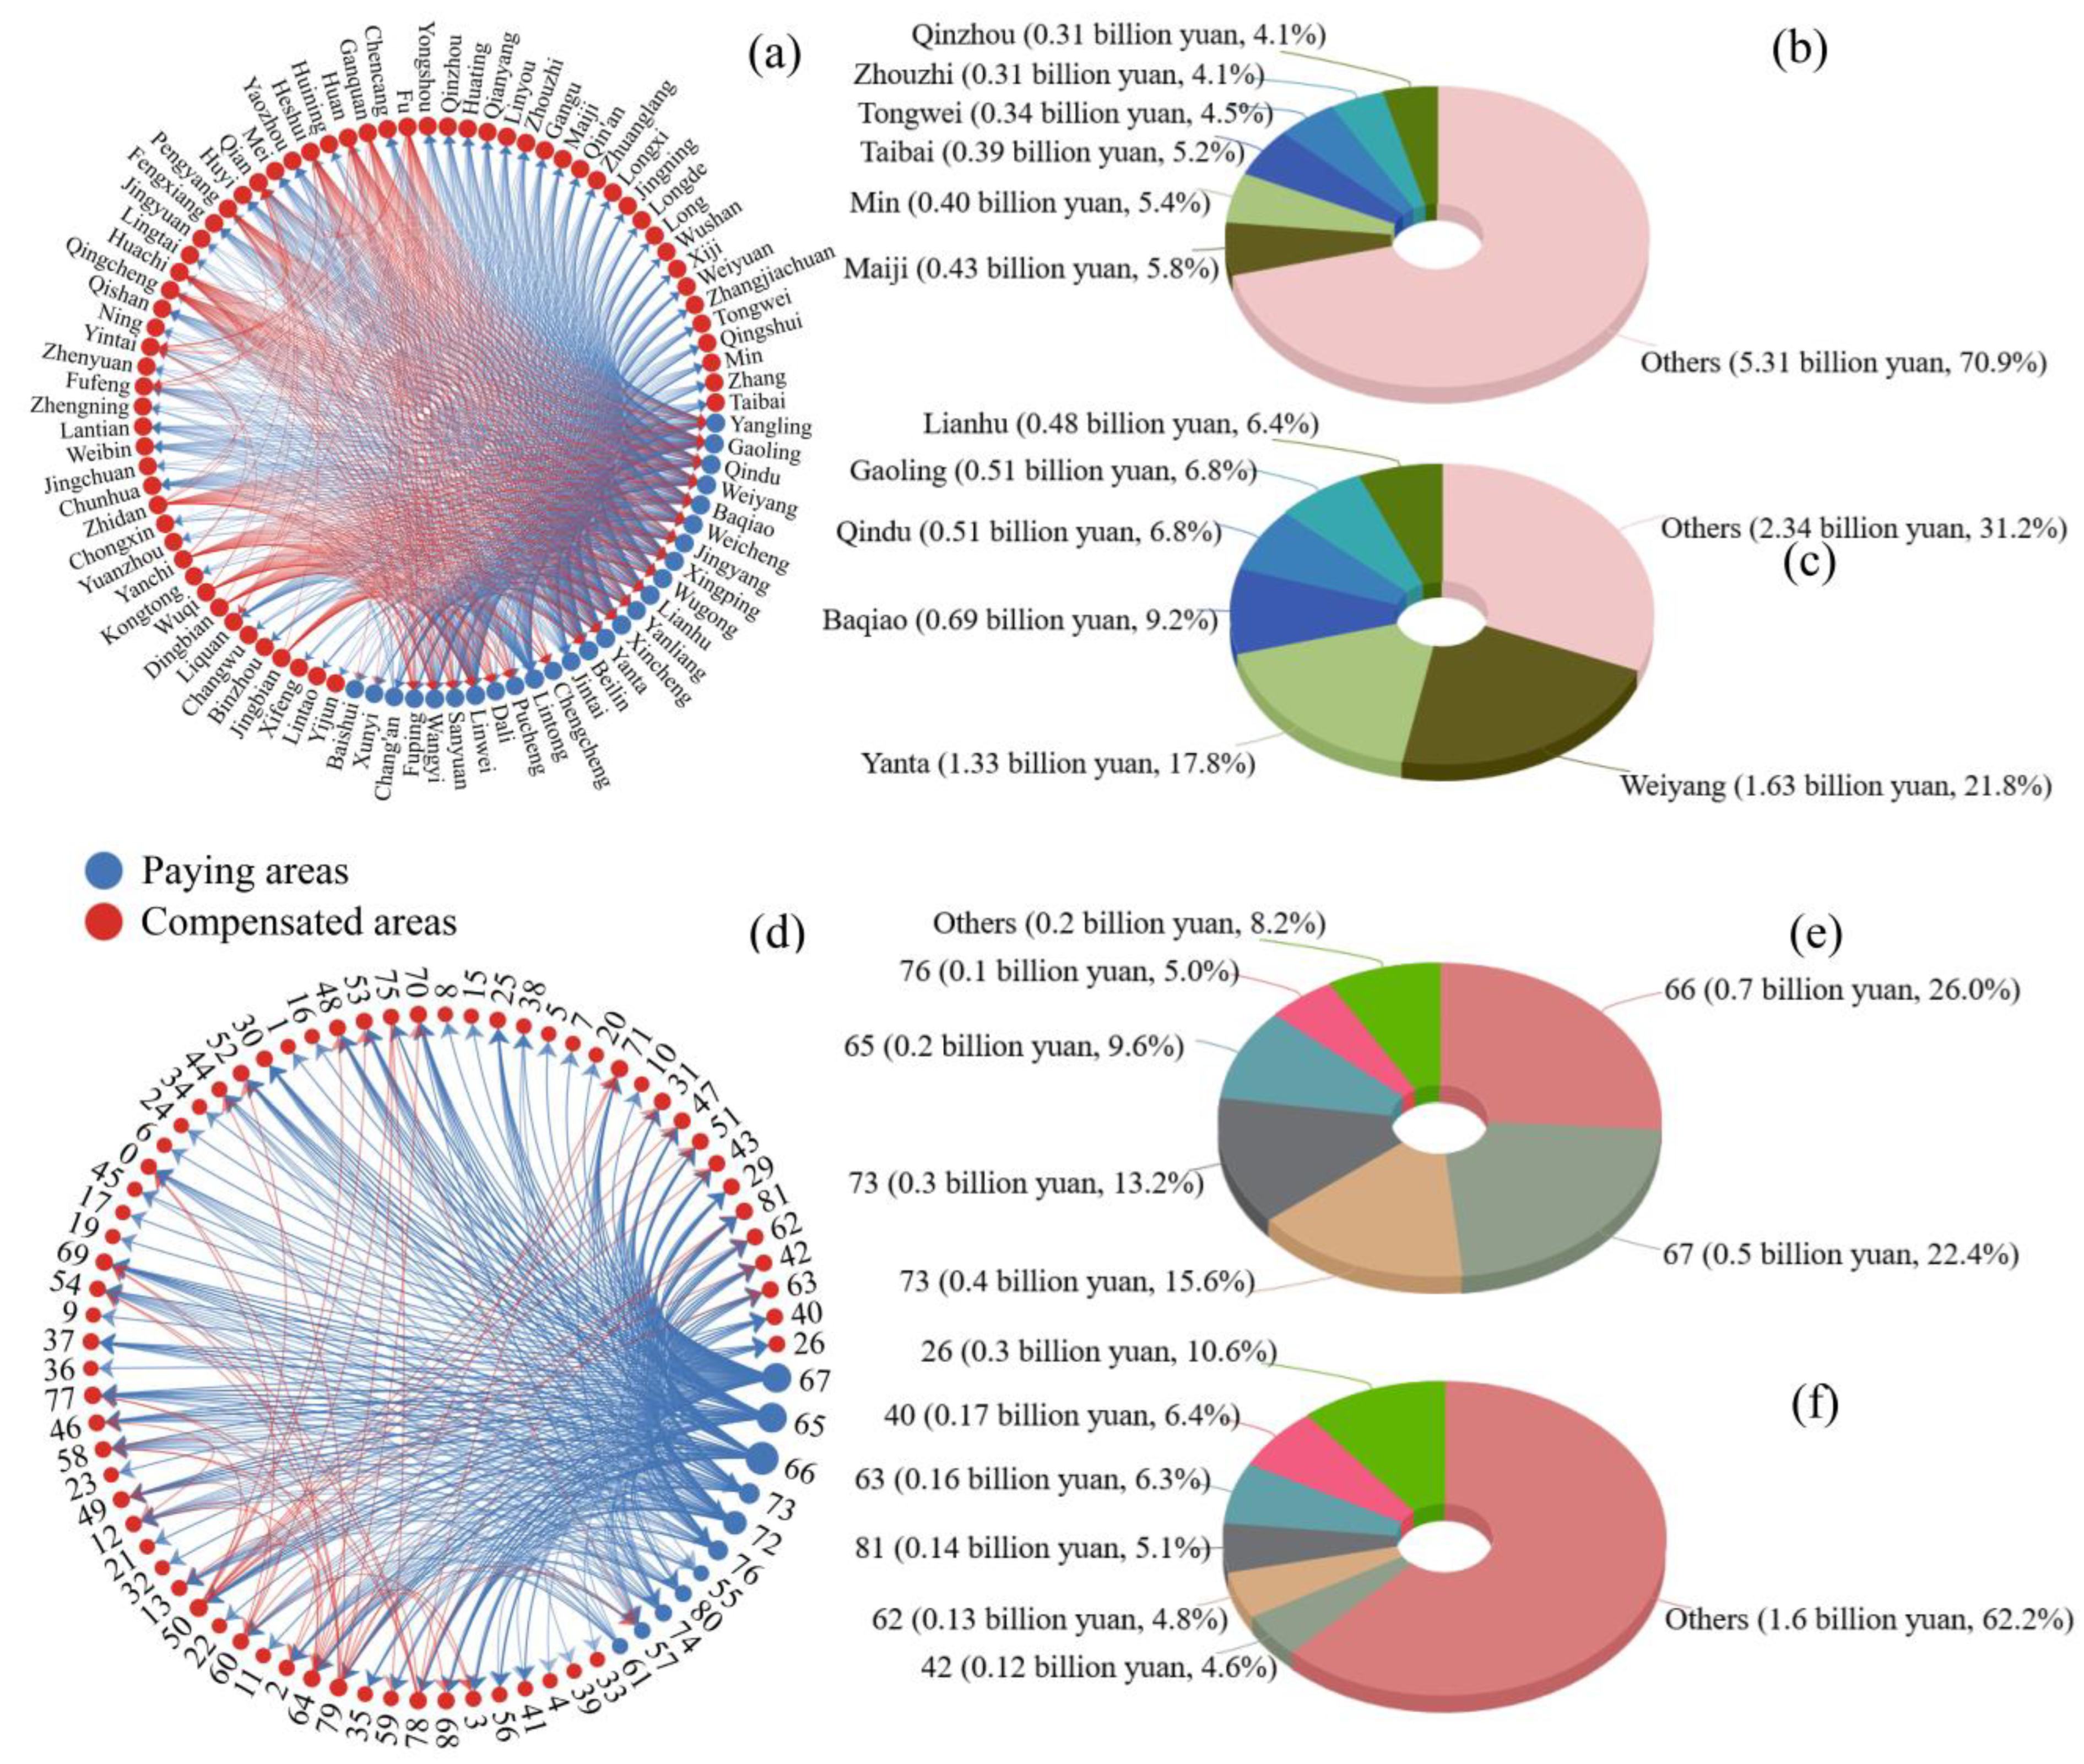
At the county scale, there were 26 paying areas, 63 compensated areas and 7 uncompensated areas within the WRB. Among the seven uncompensated areas, neither Heyang County nor Huanglong County received any flows. The net inflows in Huayin City, Tongguan County, Luochuan County, Huangling County and Huazhou District were negligible. The total fund flows between paying and compensated areas amounted to 7.5 billion yuan. As shown in Figure 9, Weiyang District was the largest payer, paying 1.6 billion yuan, which accounted for 21.8% of the total payments. Maiji District was the largest recipient, receiving 0.43 billion yuan (5.7% of the total compensation funds). At the watershed scale, there were 11 paying areas, 67 compensated areas and 4 uncompensated areas. The total fund flow reached 2.6 billion yuan. Notably, sub-watershed 73 was the largest payer, paying 0.4 billion yuan (15.6% of the total). In contrast, sub-watershed 26 was the largest recipient, receiving 0.3 billion yuan (10.6% of the total compensation funds).
At the county scale, the ratio of payment amounts to local GDP across paying areas ranged from 0.003% to 1.33%, while the ratio of compensation amounts to GDP across compensated areas ranged from 0.002% to 8.77%. At the watershed scale, however, both payment and compensation amounts constituted an even smaller proportion of sub-watershed GDP, averaging below 0.02%. These results indicates that, from the perspective of FES subsystems, the proposed EC scheme does not impose a substantial economic burden on paying areas. Instead, it enables compensation areas to access considerable development funds, thereby playing a positive role in reducing regional disparities.

4. Discussion

4.1. The Supply and Demand of FES Subsystems

Theoretically, the supply and demand of ESs often exhibit a spatial mismatch due to disparities in natural resource endowments and human interventions, demonstrating significant local heterogeneity and distinct scale effects [49]. Regarding FM, the supply remains relatively stable, whereas the demand grows rapidly, resulting in a persistent imbalance. This supply stability is largely attributed to forest restoration and wetland conservation policies [50], which enhance water retention and flood control capacities. However, the current equilibrium between the supply and demand remains fragile and is highly vulnerable to disruptions from extreme climate events and human activities [22,51]. Moreover, regions along the Wei River exhibit a highly concentrated socio-economic structure and rely heavily on the regulating services provided by upstream regions. Some regions with important water retention areas and upstream areas of tributaries, such as the mountainous areas in the west of Baoji City, the Qinling Mountains in the south of Xi’an City and the Taiyuan District in the east of Weinan City, provide crucial flood regulation functions for the downstream areas. The vegetation and landforms in these areas play a significant role in regulating runoff. But these areas themselves may also be threatened by mountain floods. The low-lying areas of cities and agricultural areas in the midstream and downstream of the Wei River, where the terrain is flat and the population and assets are concentrated, are highly vulnerable to flood inflow from the upstream. Therefore, these areas are both concentrated areas with high demand. Regarding SR, the supply is generally higher than its social demand. This conclusion is consistent with previous research results [52,53]. This is primarily attributed to the favorable natural conditions in the WRB. The first contributing factor is the substantial vegetation cover. Forests and grasslands in the middle and upper reaches effectively intercept rainwater and stabilize the soil through their canopies, litter layers and root systems, forming the primary defense line against soil erosion [54]. The second factor is the unique topographic combination. The flat plateaus and broad river valleys serve as natural “soil reservoirs”, while the densely vegetated and functionally efficient mountainous areas act as “soil conservation zones” [55]. Together, they create a natural protective structure. Furthermore, climatic conditions in recent years have also been favorable. Wang et al. (2025) [56] believed that although the precipitation in the WRB might become more extreme in recent years, the climate condition dominated by moderate rainfall and with relatively few extreme rainstorms remained the key to reducing erosion force. Overall, the positive interactions within the “vegetation–topography–climate” system of the WRB collectively establish the natural foundation for its soil conservation capacity to far exceed the actual erosion demand [57].
Regarding WY and WP, cities such as Xi’an and Xianyang exhibit both high supply and high demand, highlighting a structural contradiction in water security management. In recent years, the WRB has alleviated water scarcity through external measures like inter-basin water diversion projects (e.g., the Han River-to-Wei River Project) and integrated river-lake management. While effective in the short term, this strategy risks entrenching two deeper issues. First, it may trigger disputes over regional equity and EC due to the complex ecological and economic interdependencies within the basin. Second, it encourages cities to rely continuously on external resource input, potentially neglecting internal construction of resource recycling and regeneration capabilities, such as utilizing unconventional water sources. To resolve this dilemma, a systematic transformation of water governance is needed. This can be achieved, for example, by strengthening local capacity through reclaimed water reuse, wastewater recycling and rainwater harvesting; and by establishing mechanisms for water rights trading, industrial collaboration and ecological co-construction. These steps would foster a basin-wide governance community based on risk and benefit sharing, ultimately shifting from a model dependent on external water diversion to one that sustainably integrates both internal and external resources.
Regarding CP, the supply depends on agricultural production conditions, while the high demand is determined by population distribution [58]. The paper reveals that the supply and demand of CP are highly concentrated in the Guanzhong Plains. This is a result of regional agricultural specialization driven by both natural conditions and market mechanisms. However, this concentration pattern also implies dual systemic risks: First, it poses a risk of relying on key nodes, meaning that core production areas, once hit by climatic, ecological, or environmental shocks, directly threaten the stability of regional supply chains. Second, it exacerbates the spatial separation between production and consumption. Major cities like Xi’an rely heavily on external inputs, leading to longer and more complex supply chains, which in turn weaken overall supply resilience and emergency response capabilities. Niu and Mao (2025) [59] suggested that in water-scarce areas, stabilizing the foundation of grain production through high-standard farmland construction and water-restricted production is an effective way to mitigate this risk. Furthermore, establishing stable inter-governmental or inter-enterprise collaborative relationships with other major grain-producing regions in China, such as Henan Province and Northeast China, could diversify external input channels and prevent over-reliance on a single source. Regarding CS, the spatial separation between the CS deficit areas and the CS surplus areas revealed by the research is the result of the joint effect of the natural geographical pattern and the regional development model. On one hand, the CS supply is highly dependent on mountain forest ecosystems such as the Qinling and Ziwuling Mountains, and its formation is subject to rigid constraints from natural conditions such as terrain and climate. On the other hand, the carbon emission demand is closely attached to the Guanzhong Plains urban agglomeration centered on Xi’an City and the industrial corridors along the route. This may be the inevitable result of decades of industrialization and urbanization, involving energy consumption, industrial layout and population concentration. This structural mismatch means that the main carbon absorption functional units are not located in the areas with the greatest emission reduction pressure, thus spatially disconnecting the collaborative path of “emission reduction” and “carbon sequestration”. In addition, this mismatch also relates to the existing assessment models (such as the InVEST model framework based on land cover). The CS potential reflected by this model is based on theoretical assumptions and does not fully consider the dynamic processes such as actual management, interference and saturation. Without effective regional coordination mechanisms, this mismatch may lead to two major risks: First, the ecological supply zone, due to its distance from the demand center, faces insufficient protection and compensation incentives, and there is a risk that ecological functions will be occupied under the pressure of economic development. Second, the emission reduction pressure in the high-demand areas cannot be directly alleviated through the increment of local ecosystems and may overly rely on administrative emission reduction or external carbon markets, increasing social and economic costs. Therefore, it is necessary to establish cross-regional ecological compensation and collaborative governance mechanisms, enabling the CS deficit areas to support the carbon sequestration of the CS surplus areas through compensation, while spatially linking the “emission reduction” and “carbon sequestration” paths.

4.2. The Flow Paths of FES Subsystems

4.2.1. The Flow Paths of Water-Related Service

Rivers are important carriers of water-related ESs. This paper reveals that water-related ESs are highly distributed along the main stream of the Wei River. This is both the result of natural geographical processes and significantly influenced by human activities. On the one hand, all the tributaries (such as the Jing River, the Luo River and the rivers in the South Mountains and North Mountains) eventually flow into the Wei River, making the Wei River the core channel for the transport of water, sediment, nutrients and pollutants, and maintaining the connectivity of the entire river system. Compared with the rivers in the Loess Plateau, such as the Jing River and the Luo River, which have high sediment content, the Wei River receives more clean tributaries originating from the Qinling Mountains. Its water volume is more stable and the water quality is better, making it more suitable for the survival of aquatic organisms and human utilization. Relevant studies have shown that in recent years, the increase in runoff volume and the gradual decrease in sediment content in the upstream of the Wei River are closely related to the ecological landscape projects and water and sediment control projects within the basin [60,61]. On the other hand, the concentration of human society further reinforces this natural pattern. The large population and economic scale lead to high demands for water-related ESs, making the Guanzhong Plains simultaneously a region with high surplus and high deficit in water-related ESs. Therefore, external intervention and the design of fair systems to alleviate the mismatch between supply and demand is of vital importance for regional development.

4.2.2. The Flow Paths of CP Service

Identifying the supply–demand nodes and flow paths of the crop is of vital importance for ensuring crop security and optimizing the layout [62,63]. This paper reveals that the CP service in the WRB exhibits significant spatial concentration, with the main confluence areas concentrated in the Xi’an-Xianyang metropolitan area, forming a core-periphery structure centered around high demand. Under the assumption of distance attenuation, the demand quantities are the core driving force determining the flow values and paths. In addition, transportation, markets and policies function more as “channels” and “amplifiers” for efficient delivery [64,65]. However, this highly centralized model also tends to trigger systemic risks. The distant crop supplies are limited by distance and thus cannot effectively meet the core demands. Relevant studies have shown that digital technology, by optimizing logistics and information flow, could mitigate the distance attenuation effect and enhance the resilience of the supply chain [66]. Therefore, promoting the digitalization of CP in the basin can facilitate the direct connection of local specialty products to the core market and, at the same time, help reshape the flow pattern of the agricultural products in the WRB.

4.2.3. The Flow Paths of CS Service

This paper reveals that CS service exhibits significant spatial heterogeneity at different scales. This is mainly related to the type of land use. The hotspots are concentrated in forest land and cultivated land, while the cold spots are concentrated in areas with high human activity, such as construction land. Furthermore, at the county scale, there is a more extensive flow of supply and demand and a more obvious spatial mismatch compared to the watershed scale. This is because the small scale magnifies the differences in the distribution of supply and demand. In areas with high demand, such as Xi’an City, Xianyang City and Weinan City, due to the concentration of large amounts of arable land and construction land, the imbalance between supply and demand at a small scale has been further exacerbated.

4.3. Suggestions for Future Ecological Compensation

4.3.1. The Current Issues of EC in the WRB

We examine several cases of EC implemented in the WRB, such as Tianshui-Dingxi EC, Tianshui-Pingliang EC and Gan-Ning section horizontal EC. We identify several critical shortcomings in the current EC framework: First, the compensation scale is too broad. The current EC designs mainly rely on administrative units at the provincial and municipal scales for negotiation and implementation. There is a lack of more detailed EC designs specifically for county or sub-watershed units, resulting in a disconnection between policy implementation and the actual needs of the grassroots level. Second, the EC content is rather limited, with excessive focus on the compensation of water sources and water quality, while insufficient consideration is given to the systematic assessment of various ESs, which limits the comprehensive benefits of EC. Third, the subjects of EC usually focus on the upstream and downstream of the river, while the left and right banks, the entire basin and even broader areas are often overlooked. This is unfair for remote areas that have a positive surplus in ESs. It lacks a coordinated compensation mechanism with overall and systematic characteristics, which restricts the overall improvement of the ecological security in the WRB. To address these gaps, and based on the functional positioning of the WRB, this paper explores a compensation framework of FES subsystems. The results demonstrate that the proposed framework can contribute to achieving the goal of establishing a holistic EC system for the entire basin.

4.3.2. Suggestions for Improving Future Ecological Compensation

In response to the aforementioned issues, we propose the following three suggestions:
First, refine the compensation scale and establish a dual-tier “county-watershed” compensation unit. Using sub-watersheds with clear hydrological boundaries as the basic geographical units for ecological accounting and responsibility division and using county-level administrative regions as the units for fund allocation and policy implementation. Meanwhile, the EC is connected with the existing soil and water conservation projects in the WRB (such as the Comprehensive Improvement Project of the Wei River, Integrated Project for Soil and Water Conservation in Sloping Farmland, etc.). The areas where these projects are implemented are designated as priority compensation areas, achieving spatial correspondence of “project area—compensation area”. Second, establish a diversified ESs valuation system to broaden and differentiate compensation content. On the basis of the existing EC policies for water quality and quantity, incorporate additional indicators such as SR and CS. For instance, select typical counties like Wuqi County and Weiyuan County to carry out pilot projects, integrating the outcomes of water and soil erosion control into the EC framework. This will move beyond the current narrow focus on water source protection and water quality conservation by incorporating multiple ESs into a comprehensive accounting framework. Third, establish a basin-wide collaborative governance structure and promote diverse compensation pathways that cover both upstream–downstream and mainstream–tributary relationships. Ultimately, this will facilitate the coordinated enhancement of overall basin ecological benefits and socio-economic development.

4.4. Limitations and Prospects

This paper still has some limitations. First, the assumptions made in this paper are based on a scenario where the ESs flow within the basin. This may lead to a simplistic description of the actual regional trade dynamics. Adu et al. (2024) [67] believed that the attenuation of distance reflected the spatial redistribution characteristic of ESs flows. When considering the spillover effects of ESs flows, the direction of the flows may reverse or become multi-directional. At this point, the simple distance attenuation model cannot explain the multi-directional flow and cross-border dynamic characteristics of the spillover effects [68]. In the future, we plan to conduct further research on the spillover effects in the WRB and construct a transmission mechanism that goes beyond simple geographical distance and includes network resistance (such as land use barriers, policy barriers) and node attractiveness (such as urban demand centers). Second, the framework proposed in this paper aims to address the issue of differentiation in the static EC. However, the ESs flows (supply, demand and transmission) are not static. They change with seasons, climate, land use, economic development and policies [69,70,71]. More importantly, the ESs flows are not independent of each other. Instead, there are complex trade-offs and synergistic relationships among them. For instance, land use adjustments made to enhance WY may undermine SR function. Therefore, optimizing one or several service flows may trigger negative or positive feedback effects on other service flows, thereby altering the overall efficiency and fairness of EC. Future research will integrate land use change prediction models and climate model data. Based on the simulation of changes in ESs flows under different development paths (ecological protection red lines, urban expansion, climate change), it will further analyze the trade-offs and synergy mechanisms among service flows and use them as the core basis for dynamically adjusting compensation schemes. Third, the current FES framework and its theorem model, as well as its quantitative model, are still in the process of continuous development and improvement. The current practice still faces challenges in terms of data availability and the precise quantification of process mechanisms. Additionally, although a multi-scale analytical framework was adopted, the delineation of the watershed scale still depends on a five-level standardized river system. Due to the limitations of the data sources, there may be differences in local precision compared to the actual river distribution. Therefore, we plan to promote the integration of multiple data sources and develop indirect verification methods in the future to make the supply–demand simulation closer to the actual management scenarios.

5. Conclusions

This paper constructed an FES subsystems framework for EC and systematically assessed the supply–demand relationship, flow paths and EC standards of ESs in the WRB at multiple scales. The main conclusions drawn were as follows:
(1)
Significant spatial heterogeneity and scale effects were observed in the supply and demand of ESs. The Guanzhong Plains Urban Agglomeration, as the socio-economic core, served as the paying areas with high demand. In contrast, the southern Qinling Mountains and the northern Loess Plateau were important ESs supply areas and compensation recipients.
(2)
The flow paths were significantly influenced by transmission media. Models such as the water-related ESs model, the E2SFCA method and the gravity model can more accurately reflect their spatial transmission characteristics.
(3)
The differentiated EC standards proposed in this paper are economically feasible. The estimated required compensation funds at the county and watershed scales were 7.6 billion yuan and 2.6 billion yuan, respectively, representing a relatively low proportion of the regional GDP.
(4)
By integrating the framework of FES subsystems with ESs flows, this paper innovatively broadened the design concept of EC. It provides a systematic theoretical framework and methods for integrated basin management.

Supplementary Materials

The following supporting information can be downloaded at: https://www.mdpi.com/article/10.3390/land15010111/s1, Section S1: Calculation method of ESs; Section S2: Calculation method of ESs value; Section S3: Model validation; Section S4: Sensitivity test; Section S5: Distribution map of important cities; Figure S1: Distribution map of important cities and sub-watersheds at multiple scales; Table S1: Method for calculating the physical quantity of ESs; Table S2: Method for calculating the monetary value of ESs; Table S3: Comparison of simulation results of the SCS-CN model; Table S4: The CP model estimates the overall verification accuracy of the product at the county-level scale; Table S5: Biophysical parameters in the WP module; Table S6: Carbon density coefficients for different land use types in the CS module; Table S7: The sensitivity test of the attenuation effect for the water-related services; Table S8: Threshold sensitivity test for the CP service. Refs. [20,32,48,50,72,73,74,75,76,77,78,79,80,81,82,83,84,85] have been cited in the Supplementary Materials.

Author Contributions

Conceptualization, N.G. and H.Z.; methodology, G.T.; software, N.G.; data curation, N.G. and H.Z.; writing—original draft preparation, N.G.; writing—review and editing, G.T.; supervision, H.Z. All authors have read and agreed to the published version of the manuscript.

Funding

This work was funded by the National Key R&D Program of China (2021YFC3200400).

Data Availability Statement

The raw data supporting the conclusions of this article will be made available by the authors on request.

Conflicts of Interest

The authors declare no conflicts of interest.

Abbreviations

The following abbreviations are used in this manuscript:
WRBWei River Basin
FESFlood-sediment transport, eco-environmental and socio-economic
ESsEcosystem services
ECEcological compensation
FMFlood mitigation
SRSoil retention
WYWater yield
WPWater purification
CPCrop production
CSCarbon sequestration
ESDRESs supply–demand ratio
E2SFCAEnhanced two-step floating catchment area

References

  1. Li, Y.; Zhang, H.; Zhao, Z.; Xu, K.; Guo, F. Water ecological compensation standards for the Yellow River Basin from coordinated provider–beneficiary perspectives. Environ. Res. 2025, 290, 123452. [Google Scholar] [CrossRef] [Scilit]
  2. Chen, L.; Xu, L.; Yu, M.Z.; He, G.Z. Research progress of water ecosystem service flows. Acta Ecol. Sin. 2025, 45, 1000–1012. [Google Scholar] [CrossRef]
  3. Salzman, J.; Bennett, G.; Carroll, N.; Goldstein, A.; Jenkins, M. The global status and trends of Payments for Ecosystem Services. Nat. Sustain. 2018, 1, 136–144. [Google Scholar] [CrossRef] [Scilit]
  4. Kaiser, J.; Haase, D.; Krueger, T. Payments for ecosystem services: A review of definitions, the role of spatial scales, and critique. Ecol. Soc. 2021, 26, 12. [Google Scholar] [CrossRef] [Scilit]
  5. Brown, I. Do habitat compensation schemes to offset losses from sea level rise and coastal squeeze represent a robust climate change adaptation response? Ocean Coastal Manag. 2022, 219, 106072. [Google Scholar] [CrossRef] [Scilit]
  6. Qin, Y.; Wang, S.; Chen, S.; Cai, X. A systematic review of ecological restoration in China from 1991 to 2024: A bibliometric analysis. Ecol. Eng. 2026, 222, 107794. [Google Scholar] [CrossRef] [Scilit]
  7. Borges-Matos, C.; d’Albertas, F.; Mendes, M.E.; Loyola, R.; Metzger, J.P. Combining protection and restoration strategies enables cost-effective compensation with ecological equivalence in Brazil. Environ. Impact Assess. Rev. 2025, 114, 107922. [Google Scholar] [CrossRef] [Scilit]
  8. Zhou, J.; Wu, C.; Yeh, P.J.-F.; Ju, J.; Zhong, L.; Wang, S.; Zhang, J. Anthropogenic climate change exacerbates the risk of successive flood-heat extremes: Multi-model global projections based on the Inter-Sectoral Impact Model Intercomparison Project. Sci. Total Environ. 2023, 889, 164274. [Google Scholar] [CrossRef] [Scilit] [PubMed]
  9. Shan, Q.; Ling, H.; Liu, Y.; Zhang, G.; Zhao, L.; Chen, C.; Long, A. Extreme climate and human interventions driving flood dynamics in arid inland rivers: Regional and global perspectives. J. Environ. Manag. 2025, 395, 127788. [Google Scholar] [CrossRef] [Scilit]
  10. Implementation Plan for Further Promoting the Construction of Horizontal Ecological Protection Compensation Mechanism for Major River Basins. Available online: http://www.mof.gov.cn/jrttts/202506/t20250611_3965447.htm (accessed on 30 November 2025).
  11. Opinions on Further Improving the Horizontal EC Mechanism. Available online: https://www.gov.cn/zhengce/zhengceku/202506/content_7026446.htm (accessed on 30 November 2025).
  12. Wang, X.; Liu, P.; Wei, C.; Xu, N.; Zhao, P.; Wen, D. Research on ecological compensation based on ecosystem service flow: A case study in Guangdong province, China. J. Clean Prod. 2024, 480, 144090. [Google Scholar] [CrossRef] [Scilit]
  13. An, Z.Y.; Sun, C.Z.; Hao, S. Exploration of ecological compensation standard: Based on ecosystem service flow path. Appl. Geogr. 2025, 178, 103588. [Google Scholar] [CrossRef] [Scilit]
  14. Zhou, H.; Qiao, X.; Yang, Y.; Zhang, J.; Zheng, Q.; Gao, H.; Zhao, T. How to optimize ecological compensation to alleviate the ecosystem services supply and demand mismatch in the Luo River Basin? Ecol. Indic. 2025, 178, 114004. [Google Scholar] [CrossRef] [Scilit]
  15. Hu, L.; Zhang, Q.; Wang, G.; Singh, V.P.; Wu, W.; Fan, K.; Shen, Z. Flood disaster risk and socio-economy in the Yellow River Basin, China. J. Hydrol. Reg. Stud. 2022, 44, 101272. [Google Scholar] [CrossRef] [Scilit]
  16. Jiang, E.H.; Wang, Y.J.; Tian, S.M.; Li, J.; Xu, L.; Zhang, X. Exploration of watershed system science. J. Hydraul. Eng. 2020, 51, 1026–1037. [Google Scholar] [CrossRef]
  17. Wang, Y.; Tang, F.; Jiang, E.; Wang, X.; Zhao, J. Optimizing hydropower generation and sediment transport in Yellow River basin via cooperative game theory. J. Hydrol. 2022, 614, 128581. [Google Scholar] [CrossRef] [Scilit]
  18. Hu, H.; Tian, G.; Dai, Z. Multi-dimensional interest game between reservoir and city stakeholders in the Yellow River Basin: A case study of the lower reaches. Appl. Water Sci. 2023, 13, 125. [Google Scholar] [CrossRef] [Scilit]
  19. Zhao, G.; Tian, S.; Jiang, E.; Jing, Y.; Chen, R.; Wang, X.; Zhang, Y. Coordination analysis of flood-sediment transportation, eco-environment, and socio-economy coupling in the governance of the Yellow River Basin system. Sci. Rep. 2024, 14, 8090. [Google Scholar] [CrossRef] [Scilit]
  20. Geng, N.; Tian, G.; Zhang, H. The spatial-temporal evolution characteristics and influencing factors of coordinated development in the Yellow River Basin: Based on the perspective of flood-sediment transport, eco-environmental, and socio-economic subsystems. Ecol. Indic. 2025, 176, 113673. [Google Scholar] [CrossRef] [Scilit]
  21. Zhou, R.J.; Zhang, H.; Qian, M. Spatial-temporal evolution of ecosystem service flows in the Three Gorges Reservoir Area in the past 30 years and influencing factors. Ecol. Environ. Sci. 2025, 34, 876–887. [Google Scholar] [CrossRef]
  22. Wang, Z.; Liu, S. Spatiotemporal variability of climate: A key driver shaping spatial pattern and dominating temporal evolution of root zone soil moisture in China. J. Hydrol. 2025, 663, 134147. [Google Scholar] [CrossRef] [Scilit]
  23. Zhou, X.; Zhang, X.; Peng, H.; Ren, W.; Zou, Q. Bridging the ecosystem service supply-demand imbalance: Spatial flow patterns and driving forces in the Yangtze River midstream urban agglomeration, China. Ecol. Indic. 2025, 175, 113531. [Google Scholar] [CrossRef] [Scilit]
  24. Wu, J.; Fan, X.; Li, K.; Wu, Y. Assessment of ecosystem service flow and optimization of spatial pattern of supply and demand matching in Pearl River Delta, China. Ecol. Indic. 2023, 153, 110452. [Google Scholar] [CrossRef] [Scilit]
  25. Shi, J.F.; Zhai, X.N.; Wang, X.M.; Shao, G.; Zhao, H.N.; Xie, Q.Z. Discussion on quality defects after harvest and the maintaining quality transportation technology of grain in northeast China. Sci. Technol. Cereals Oils Foods 2021, 29, 200–210. [Google Scholar] [CrossRef]
  26. Zhao, Y.; Xie, Q.; Lu, Y.; Lee, Z. Scale Effect and Similarity Analysing of the Extracted River Networks Features Based on DEMs with Different Spatial Resolutions. E3S Web Conf. 2018, 53, 03035. [Google Scholar] [CrossRef] [Scilit]
  27. Wu, M.; Shi, P.; Chen, A.; Shen, C.; Wang, P. Impacts of DEM resolution and area threshold value uncertainty on the drainage network derived using SWAT. Water Sa 2017, 43, 450. [Google Scholar] [CrossRef] [Scilit]
  28. Water Resources Bulletin. Available online: https://slt.shaanxi.gov.cn/zfxxgk/fdzdgknr/zdgz/szygb/ (accessed on 30 December 2025).
  29. FAO. The State of Food and Agriculture 2020: Overcoming Water Challenges in Agriculture. 2020. Available online: https://openknowledge.fao.org/server/api/core/bitstreams/6e2d2772-5976-4671-9e2a-0b2ad87cb646/content (accessed on 30 December 2025).
  30. Nie, T.; Jiang, X.; Deng, C.; Cai, W.; Lei, Y.; Gao, S. Analysis of the evolution of water culture and water security in the Weihe River Basin over a 100 year-period. Sci. Total Environ. 2024, 920, 171066. [Google Scholar] [CrossRef] [Scilit] [PubMed]
  31. Song, J.; Tang, B.; Zhang, J.; Dou, X.; Liu, Q.; Shen, W. System dynamics simulation for optimal stream flow regulations under consideration of coordinated development of ecology and socio-economy in the Weihe River Basin, China. Ecol. Eng. 2018, 124, 51–68. [Google Scholar] [CrossRef] [Scilit]
  32. Hu, H.; Tian, G.; Adamowski, J.F.; Albano, R.; Liu, Y.; Jing, X.; Zhao, Q. Interregional imbalance in the Yellow River Basin: Insights from flood-sediment transport, socioeconomic, and environmental subsystems. J. Environ. Manag. 2024, 371, 123295. [Google Scholar] [CrossRef] [Scilit] [PubMed]
  33. Rojas, M.; Méndez, A.; Watkins-Fassler, K. The hierarchy of needs empirical examination of Maslow’s theory and lessons for development. World Dev. 2023, 165, 106185. [Google Scholar] [CrossRef] [Scilit]
  34. Yan, F.; Shangguan, W.; Zhang, J.; Hu, B. Depth-to-bedrock map of China at a spatial resolution of 100 meters. Sci. Data 2020, 7, 2. [Google Scholar] [CrossRef] [Scilit]
  35. Yang, J.; Dong, J.; Xiao, X.; Dai, J.; Wu, C.; Xia, J.; Zhao, G.; Zhao, M.; Li, Z.; Zhang, Y.; et al. Divergent shifts in peak photosynthesis timing of temperate and alpine grasslands in China. Remote Sens. Environ. 2019, 233, 111395. [Google Scholar] [CrossRef] [Scilit]
  36. Chi, C.; Shen, J.; Gao, X.; Hu, P.; Yi, P. Horizontal ecological compensation standards based on ecosystem services flow. Ecol. Indic. 2024, 163, 112081. [Google Scholar] [CrossRef] [Scilit]
  37. Wang, Z.; Zhang, L.; Li, X.; Li, Y.; Frans, V.F.; Yan, J. A network perspective for mapping freshwater service flows at the watershed scale. Ecosyst. Serv. 2020, 45, 101129. [Google Scholar] [CrossRef] [Scilit]
  38. Chen, Y.; Zhang, S.; Yang, L.; Zhang, X.; Yu, K.; Li, J. Ecological footprint in Beijing-Tianjin-Hebei urban agglomeration: Evolution characteristics, driving mechanism, and compensation standard. Environ. Impact Assess. Rev. 2024, 109, 107649. [Google Scholar] [CrossRef] [Scilit]
  39. Wang, H.; Ma, Y.; Yuan, W.; Ye, H.; Sun, C.; Zhang, X.; Lan, J.; Guo, W. Exploring spatiotemporal heterogeneity and driving factors of water supply and demand in the Jialing River Basin from the perspective of service flows. J. Clean Prod. 2025, 502, 145391. [Google Scholar] [CrossRef] [Scilit]
  40. Yu, Z.; Zhao, Q.; Ding, S.; Yu, J.; Liu, B.; Feng, W.; Li, Y.; Zhou, J. Unpaved road-altered confluence networks exacerbate soil organic carbon loss in mountainous forested catchments. J. Hydrol. 2026, 664, 134500. [Google Scholar] [CrossRef] [Scilit]
  41. Blumenberg, E.; Yao, Z.; Wander, M. Variation in child care access across neighborhood types: A two-step floating catchment area (2SFCA) approach. Appl. Geogr. 2023, 158, 103054. [Google Scholar] [CrossRef] [Scilit]
  42. Liu, D.; Wang, J.; Song, J.; Kwan, M.-P.; Fang, D.; Ariga, T.; Chen, Y.; Stinckwich, S. Exploring the inequality in fine-grained primary healthcare accessibility in Macau based on high-resolution geospatial data under the 15-minute city framework. Appl. Geogr. 2025, 174, 103473. [Google Scholar] [CrossRef] [Scilit]
  43. Miao, J.J.; Pan, P.P.; Liu, B.Y.; Yuan, X.; Pan, Z.; Li, L.; Wang, X.; Wang, Y.; Cao, Y.; Zhang, T. Research on grain supply and demand matching in the Beijing–Tianjin–Hebei Region based on ecosystem service flows. J. Integr. Agric. 2025, in press. [Google Scholar] [CrossRef] [Scilit]
  44. Liu, W.; Zhan, J.; Zhao, F.; Zhang, F.; Teng, Y.; Wang, C.; Chu, X.; Kumi, M.A. The tradeoffs between food supply and demand from the perspective of ecosystem service flows: A case study in the Pearl River Delta, China. J. Environ. Manag. 2022, 301, 113814. [Google Scholar] [CrossRef] [Scilit]
  45. Wu, C.; Lu, R.; Zhang, P.; Dai, E. Multilevel ecological compensation policy design based on ecosystem service flow: A case study of carbon sequestration services in the Qinghai-Tibet Plateau. Sci. Total Environ. 2024, 921, 171093. [Google Scholar] [CrossRef] [Scilit]
  46. Wang, C.; Li, W.; Sun, M.; Wang, Y.; Wang, S. Exploring the formulation of ecological management policies by quantifying interregional primary ecosystem service flows in Yangtze River Delta region, China. J. Environ. Manag. 2021, 284, 112042. [Google Scholar] [CrossRef] [Scilit]
  47. Zhang, H.; Zhang, H.; Liu, Y.; Dong, G. Accounting for ecosystem service flows in water security assessment: A case study of the Yiluo River Watershed, China. Appl. Geogr. 2024, 172, 103421. [Google Scholar] [CrossRef] [Scilit]
  48. Chen, H.Y.; Yao, S.J.; Peng, W.T.; Cai, W.B.; Cai, Y.L. Spatial coupling study of supply demand and flow of water purification ecosystem services for ecological compensation a case study of the Yangtze River Delta Ecological Green Integrated Development Demonstration Zone. Acta Ecol. Sin. 2025, 45, 3079–3091. [Google Scholar] [CrossRef]
  49. An, Z.Y.; Sun, C.Z.; Hao, S. Matching relationship between supply and demand of ecosystem services from the perspective of water-energy-food nexus in Northeast China. Acta Ecol. Sin. 2024, 44, 4170–4186. [Google Scholar] [CrossRef]
  50. Liu, J.; Wang, J.; Tan, Y. Spatiotemporal pattern and influencing mechanism of the flood-regulating ecosystem service capacity and demand in China’s Yellow River basin, 2000–2020. J. Hydrol.-Reg. Stud. 2023, 45, 101312. [Google Scholar] [CrossRef] [Scilit]
  51. Li, Z.; Yan, W. Service flow changes in multilayer networks: A framework for measuring urban disaster resilience based on availability to critical facilities. Landsc. Urban Plan. 2024, 244, 104996. [Google Scholar] [CrossRef] [Scilit]
  52. Men, D.; Pan, J.; Sun, X. Spatial and temporal patterns of supply and demand risk for ecosystem services in the Weihe River Main Stream, NW China. Environ. Sci. Pollut. Res. 2022, 30, 36952–36966. [Google Scholar] [CrossRef] [Scilit] [PubMed]
  53. Men, D.; Pan, J.H. Optimization of the ecological network in the Weihe River Basin using supply and demand of ecosystem service and topological structure analysis. Trans. Chin. Soc. Agric. Eng. 2024, 40, 212–221. [Google Scholar] [CrossRef]
  54. Huang, C.; Chen, J.; Huang, W.; Sun, C.; Guo, X. Analysis of water and sediment reducing effects of water conservation measures in the upstream of the Weihe River. J. Glaciol. Geocryol. 2020, 42, 965–973. [Google Scholar] [CrossRef]
  55. Jia, L.; Yao, S.; Deng, Y.; Li, Y.Y.; Hou, M.Y.; Gong, Z. Temporal and spatial characteristics of soil erosion risk in Weihe River Basin and its geographical exploration. J. Ecol. Rural Environ. 2021, 37, 305–314. [Google Scholar] [CrossRef]
  56. Wang, S.; Jiang, R.; Zhao, Y.; Xie, J.; Xie, J.; Cheng, S.; Wang, L.; Lu, X. Quantifying the drought-flood abrupt alternation events over Wei River Basin: Dynamic evolution characteristics, driving factors and inherent mechanism. Atmos. Res. 2025, 323, 108185. [Google Scholar] [CrossRef] [Scilit]
  57. Sun, S.; Lü, Y.; Feng, X.; Maestre, F.T.; Fu, B. Optimizing soil conservation through comprehensive benefit assessment in river basins. Environ. Sci. Ecotechnol. 2025, 23, 100496. [Google Scholar] [CrossRef] [Scilit]
  58. Peng, H.; Zhang, X.; Ren, W.; He, J. Spatial pattern and driving factors of cropland ecosystem services in a major grain-producing region: A production-living-ecology perspective. Ecol. Indic. 2023, 155, 111024. [Google Scholar] [CrossRef] [Scilit]
  59. Niu, J.; Mao, C. Research on coordination mechanism between agricultural green and land ecosystem in Yellow River Basin. Sci. Rep. 2025, 15, 1934. [Google Scholar] [CrossRef] [Scilit] [PubMed]
  60. Hu, Z.; Gao, P.; Li, S.; Mu, X. Changes of runoff and sediment load and its response to precipitation and human activities in the Weihe River Basin. Res. Soil Water Conserv. 2024, 31, 28–33. [Google Scholar] [CrossRef]
  61. Tang, J.; Lu, Y. Analysis of the Characteristics of Water and Sediment Changes in the Upstream of the Weihe River. Water Resour. Dev. Manag. 2023, 9, 51–59. [Google Scholar] [CrossRef]
  62. Moustier, P. Short Urban Food Chains in Developing Countries: Signs of the Past or of the Future? Nat. Sci. Soc. 2017, 25, 7–20. [Google Scholar] [CrossRef] [Scilit]
  63. Qi, X.; Vitousek, P.M.; Liu, L. Provincial food security in China: A quantitative risk assessment based on local food supply and demand trends. Food Secur. 2015, 7, 621–632. [Google Scholar] [CrossRef] [Scilit]
  64. Fang, G.; Sun, X.; Zheng, H.; Zhu, P.; Wu, W.; Yang, P.; Tang, H. Optimizing the ecosystem service flow of grain provision across metacoupling systems will improve transmission efficiency. Appl. Geogr. 2024, 172, 103420. [Google Scholar] [CrossRef] [Scilit]
  65. Zhou, Y.; Liu, Z. A social-ecological network approach to quantify the supply-demand-flow of grain ecosystem service. J. Clean Prod. 2024, 434, 139896. [Google Scholar] [CrossRef] [Scilit]
  66. Wang, H.; Chen, Y.; Xie, J.; Liu, C. Research on digital empowerment, innovation vitality and manufacturing supply chain resilience mechanism. PLoS ONE 2025, 20, e0316183. [Google Scholar] [CrossRef] [Scilit] [PubMed]
  67. Adu, D.; Jianguo, D.; Asomani, S.N.; Abbey, A. Energy generation and carbon dioxide emission-The role of renewable energy for green development. Energy Rep. 2024, 12, 1420–1430. [Google Scholar] [CrossRef] [Scilit]
  68. Wan, N.; Zou, B.; Sternberg, T. A three-step floating catchment area method for analyzing spatial access to health services. Int. J. Geogr. Inf. Sci. 2011, 26, 1073–1089. [Google Scholar] [CrossRef] [Scilit]
  69. Liu, Y.; Ji, X.; Xu, S.; Li, L.; Pan, Y.; Wu, J.; Zhang, Y. Unraveling the influence of climate and land use change on ecological networks based on ecosystem services priority conservation areas. Glob. Ecol. Conserv. 2025, 64, e03923. [Google Scholar] [CrossRef] [Scilit]
  70. Shi, P.; Zhou, D.; Jiang, J.; Huang, X.; Zhang, J.; Dong, Q.; Jia, Y. Spatiotemporal evolution pattern of water yield service of ecosystems in the Shule River Basin, Northwest China, integrating future climate and land use changes. Ecol. Indic. 2025, 181, 114452. [Google Scholar] [CrossRef] [Scilit]
  71. Wu, S.; Li, R.; Yan, Y.; Du, Z.; Wu, Z.; Ma, K. Scale-dependent drivers of ecosystem service supply-flow-demand couplings in the Shanxi Yellow River Basin, China. iScience 2025, 28, 114002. [Google Scholar] [CrossRef] [Scilit]
  72. Luo, Z.; Tian, J.; Zeng, J.; Pilla, F. Assessing the spatial pattern of supply-demand mismatches in ecosystem flood regulation service: A case study in Xiamen. Appl. Geogr. 2023, 160, 103113. [Google Scholar] [CrossRef] [Scilit]
  73. Jaafar, H.H.; Ahmad, F.A.; El Beyrouthy, N. GCN250, new global gridded curve numbers for hydrologic modeling and design. Sci. Data 2019, 6, 145. [Google Scholar] [CrossRef] [Scilit]
  74. Lu, Z.; Li, W.; Yue, R. Investigation of the long-term supply–demand relationships of ecosystem services at multiple scales under SSP–RCP scenarios to promote ecological sustainability in China’s largest city cluster. Sustain. Cities Soc. 2024, 104, 105295. [Google Scholar] [CrossRef] [Scilit]
  75. Ekanayaka, H.B.G.D.M.P.; Abeysingha, N.S.; Amarasekara, T.; Ray, R.L.; Samarathunga, D.K. The use of InVEST-SDR model to evaluate soil erosion and sedimentation in the closer catchment of a proposed tropical reservoir in Sri Lanka. Int. J. Sediment Res. 2025, 40, 253–268. [Google Scholar] [CrossRef] [Scilit]
  76. Tenreiro, T.R.; García-Vila, M.; Gómez, J.A.; Jiménez-Berni, J.A.; Fereres, E. Using NDVI for the assessment of canopy cover in agricultural crops within modelling research. Comput. Electron. Agric. 2021, 182, 106038. [Google Scholar] [CrossRef] [Scilit]
  77. Teng, Y.; Chen, G.; Su, M.; Zhang, Y.; Li, S.; Xu, C. Ecological management zoning based on static and dynamic matching characteristics of ecosystem services supply and demand in the Guangdong–Hong Kong–Macao Greater Bay Area. J. Clean. Prod. 2024, 448, 141599. [Google Scholar] [CrossRef] [Scilit]
  78. Shen, J.; Zhao, M.; Tang, X.; Wu, C. Ecological restoration zoning and strategy based on ecosystem service supply and demand relationships: A case study of the Yellow River Basin. J. Nat. Conserv. 2025, 84, 126837. [Google Scholar] [CrossRef] [Scilit]
  79. Yu, M.; Jin, H.Z.; Li, Q.; Yao, Y.; Zhang, Z.M. Gross Ecosystem Product (GEP) Accounting for Chenggong District. J. West China For. Sci. 2020, 49, 41–48+55. [Google Scholar] [CrossRef]
  80. Mou, X.J.; Wang, X.H.; Zhang, X.; Rao, S.; Zhu, Z.X. Accounting and Mapping of Gross Ecosystem Product in Yanqing District, Beijing. Res. Soil Water 2020, 27, 265–274+282. [Google Scholar] [CrossRef]
  81. Zhang, X. Small Watershed Soil and Water Conservation Carbon Sequestration Trading Project. Available online: https://sndrc.shaanxi.gov.cn/sy/xwxx/wndt/202410/t20241015_3237031_wap.html (accessed on 30 November 2025).
  82. Cai, C.; Ding, S.; Shi, Z.; Huang, L.; Zhang, G. Study of applying USLE and geographical information system IDRISI to predict soil erosion in small watershed. J. Soil Water Conserv. 2000, 14, 19–24. [Google Scholar] [CrossRef]
  83. Shao, Y.; Liu, Y.; Li, Y.; Yuan, X. Regional ecosystem services relationships and their potential driving factors in the Yellow River Basin, China. J. Geogr. Sci. 2023, 33, 863–884. [Google Scholar]
  84. Zhu, G.; Qiu, D.; Zhang, Z.; Sang, L.; Liu, Y.; Wang, L.; Zhao, K.; Ma, H.; Xu, Y.; Wan, Q. Land-use changes lead to a decrease in carbon storage in arid region, China. Ecol. Indic. 2021, 127, 107770. [Google Scholar] [CrossRef] [Scilit]
  85. Zhao, M.; He, Z.; Du, J.; Chen, L.; Lin, P.; Fang, S. Assessing the effects of ecological engineering on carbon storage by linking the CA-Markov and InVEST models. Ecol. Indic. 2019, 98, 29–38. [Google Scholar] [CrossRef] [Scilit]
Figure 1. The location of the study area.
Land 15 00111 g001
Figure 2. Methodological framework.
Land 15 00111 g002
Figure 3. The spatial distribution of the supply and demand of the flood-sediment subsystem at multiple scales.
Land 15 00111 g003
Figure 4. The spatial distribution of the supply and demand of the eco-environmental subsystem at multiple scales.
Land 15 00111 g004
Figure 5. The spatial distribution of the supply and demand of the socio-economic subsystem at multiple scales.
Land 15 00111 g005
Figure 6. The flow paths of FES subsystems at the county scale.
Land 15 00111 g006
Figure 7. The flow paths of FES subsystems at the watershed scale.
Land 15 00111 g007
Figure 8. The EC results at the county and watershed scales.
Land 15 00111 g008
Figure 9. The flow paths and proportion of EC funds at the county and watershed scales. (Figures (a,d) are, respectively, the flow paths of the EC funds at the county and watershed scale. Figures (b,e) are, respectively, the proportions of the paying funds at the county and watershed scale. Figures (c,f) are, respectively, the proportions of the compensated funds at the county and watershed scale).
Land 15 00111 g009
Table 1. Data sources.
DatasetData TypeSpatial ResolutionData Source
Land CoverRaster30 mhttps://zenodo.org/records/15853565 (accessed on 30 November 2025)
Digital Elevation ModelRaster30 mhttps://www.gscloud.cn/ (accessed on 30 November 2025)
PrecipitationRaster1 kmhttp://www.geodata.cn/ (accessed on 30 November 2025)
EvapotranspirationRaster1 kmhttp://www.geodata.cn/ (accessed on 30 November 2025)
Root Restricting Layer depthRaster1 km[34]
Soil PropertiesRaster1 kmhttps://www.fao.org/soils-portal/soil-survey/soil-maps-and-databases/harmonized-world-soil-database-v12/en/ (accessed on 30 November 2025)
Normalized Difference Vegetation IndexRaster30 m[35]
PopulationRaster1 kmhttps://landscan.ornl.gov/ (accessed on 30 November 2025)
Statistical dataTable/Text-Statistical yearbook and statistical bulletin
Carbon EmissionTable/Text-https://edgar.jrc.ec.europa.eu/report_2024 (accessed on 30 November 2025)
RiverShp-www.openstreetmap.org/ (accessed on 30 November 2025)
China Admin DivisionShp-https://www.cnopendata.com (accessed on 30 November 2025)
Table 2. Method for calculating the physical quantity of ESs.
ESsSupplyDemand
FM                                                   F M S i t = P i t − Q i t Q i t = ( P i t − 0.2 S m a x , i t ) 2 P i t + ( 1 − 0.2 ) S m a x , i t ,   P i t ≥ 0.2 S m a x , i t 0 , P i t < 0.2 S m a x , i t                                           S m a x , i t = 25,400 C N i t − 254             F M D i t = Q i t ,   i n   c o n s t u r c t i o n   l a n d 0 ,   o t h e r w i s e Q i t = ( P i t − 0.2 S m a x , i t ) 2 P i t + ( 1 − 0.2 ) S m a x , i t ,   P i t ≥ 0.2 S m a x , i t 0 , P i t < 0.2 S m a x , i t
SR S R S i t = R i t × K i t × L S i t × ( 1 − C i t × P i t ) S R D i t = R i t × K i t × L i t × S i t × C i t × P i t
WY W Y S i t = ( 1 − A E T i t P i t ) × P i t W Y D i t = A i t × A g r i t + G i t × I n d i t + P i t × D o m i t
WP W P S i t = l o a d i t × N D R i t W P D i t = W Y i t × C
CP C P S i t = G s u m t × N D V I i t N D V I s u m t C P D i t = D C r o p , i t × ρ p o p , i t
CS C S S i t = C a b o v e , i t + C b e l o w , i t + C s o i l , i t + C d e a d , i t C S D i t = D p e r , i t × ρ p o p , i t
Table 3. The key paths at the county scale.
ESsKey Paths
Flow Paths 1Flow 1Flow Paths 2Flow 2Flow Paths 3Flow 3
FM ( m 3 )Yaozhou to Yanliang7,787,270Maiji to Weiyang 7,573,378Taibai to Weiyang 6,936,197
SR ( t )Taibai to Weiyang 57,273Taibai to Yanta 55,511Zhouzhi to Weiyang 53,264
WY ( m 3 )Min to Yanta 22,448,063Taibai to Yanta 20,862,153Zhouzhi to Yanta 18,269,789
WP(N) ( t )Huining to Weiyang1138Jingning to Weiyang1051Tongwei to Weiyang1008
WP(P) ( t )Maiji to Weiyang 275Huining to Weiyang 230Jingning to Weiyang179
CP ( k g )Weibing to Jintai 90,490,435Huyi to Wugong 5,778,232Chencang to Jintai 3,342,609
CS ( t )Fu to Pucheng 705,840Fu to Chengcheng 459,867Fu to Xunyi 443,127
Table 4. The key paths at the watershed scale.
ESsKey Paths
Flow Paths 1Flow 1Flow Paths 2Flow 2Flow Paths 3Flow 3
FM ( m 3 )26 to 667,330,72926 to 735,740,92140 to 664,491,723
SR ( t )81 to 6619,33762 to 6617,02263 to 6612,828
WY ( m 3 )40 to 663,919,10563 to 663,309,22726 to 662,965,484
WP (N) ( t )26 to 6683847 to 6639163 to 66370
WP (P) ( t )26 to 6618563 to 6611762 to 6699
CP ( k g )60 to 6728,413,99881 to 786,859,48881 to 794,044,655
CS ( t )13 to 55740,60512 to 80609,87612 to 55545,280
Disclaimer/Publisher’s Note: The statements, opinions and data contained in all publications are solely those of the individual author(s) and contributor(s) and not of MDPI and/or the editor(s). MDPI and/or the editor(s) disclaim responsibility for any injury to people or property resulting from any ideas, methods, instructions or products referred to in the content.