Article

The Impact of Snow Grooming on Morphology and Erosion of Alpine Hillslopes: A Case Study from Kasprowy Wierch Ski Station in the Tatra Mountains

Institute of Geography and Spatial Management, Faculty of Geography and Geology, Jagiellonian University, 30-387 Krakow, Poland
*
Author to whom correspondence should be addressed.
Land 2025, 14(9), 1870; https://doi.org/10.3390/land14091870
Submission received: 18 August 2025 / Revised: 9 September 2025 / Accepted: 11 September 2025 / Published: 12 September 2025
(This article belongs to the Special Issue Conservation of Bio- and Geo-Diversity and Landscape Changes II)

Abstract

The rapid expansion of ski tourism and climate change-induced snow shortages have led to intensified ski run maintenance, including extensive earthworks, artificial snowmaking, and regular snow grooming. While these activities are known to cause significant land degradation, quantitative geomorphological studies, specifically on the effects of snow grooming, are limited. This study addresses this knowledge gap by quantitatively assessing the impact of snow grooming on erosion processes and hillslope morphology by comparing them with natural landforms. We achieved this by determining the spatial distribution, morphometry, and long-term persistence of studied landforms. The study area consisted of a unique ski resort at Kasprowy Wierch, which does not use artificial snowmaking or extensive earthworks. We combined detailed field mapping with the analysis of multi-temporal Digital Elevation Models (DEMs) and orthophotos from 2012, 2019, 2020, and 2023. Our methodology also included the calculation of volumetric changes using the DEM of Difference (DoD) analysis. We distinguished two groups of eroded areas, natural landforms (e.g., shallow landslides, debris flow tracks, nivation niches) and snow groomer-induced forms, which were concentrated on ski runs. Natural landforms were elongated and deeper, with higher edges, clustered along debris flow tracks, and occurred on steeper slopes (mean 26.8°). They were more persistent and extensive, with a total area ranging from 3891 m2 in 2012 to 3452 m2 in 2023. In contrast, groomer-eroded landforms, located on gentler slopes (mean 23.4°), were smaller, more angular, less persistent, and concentrated on narrower, intensively used ski run sections. Their total area decreased from 2122.71 m2 to 1762.25 m2 over the same period, despite an increase in their count. The volumetric analysis revealed distinct dynamics: over the long term (2012–2023), natural forms showed a total deposition of +8.196 m3, while groomer-eroded forms experienced total erosion of −2.070 m3. During an extreme rainfall event in 2020, natural landforms experienced vast erosion of −163.651 m3, nearly five times greater than the −33.765 m3 observed on snow groomer-eroded landforms, demonstrating their greater susceptibility to high-magnitude events. Importantly, a comparison with other studies reveals that the scale of erosion from snow grooming is relatively small compared to the severe impacts of artificial snowmaking. Our findings are relevant for managing protected areas, such as Tatra National Park, where the focus should be on mitigating anthropogenic impacts to preserve natural processes, which in turn implies that the development of new ski infrastructure should be prohibited.

1. Introduction

Ski tourism has grown rapidly in recent decades. This growth has led to a significant increase in ski resorts worldwide [1,2,3,4,5]. The snow shortages, driven by climate change, create functional problems for many ski resorts in Central and Western Europe [4,5,6]. Due to these disruptions, ski resorts invest heavily in advanced infrastructure and maintenance methods. This includes construction of high-capacity cable cars, extensive drainage systems, hillslope shaping, artificial snowmaking, and regular snow grooming [2,4,7]). These activities significantly impact the natural environment and often cause land degradation [8,9,10,11,12,13].
The first significant change is the reshaping of hillslopes to optimal gradients for skiers. Earthworks can significantly change the hillslope processes and morphology [14,15,16,17,18]. Skiing and the use of snow groomers causes soil compaction and degradation of vegetation cover [10,12,13,14,15,17,19,20,21].
The lack of vegetation cover and compacted soil accelerate natural geomorphological processes and lead to intensified soil erosion on hillslopes. Snow groomers also compact snow, delaying snowmelt by up to four weeks [11]. Artificial snowmaking extends the duration of snow cover by 30% to 200% versus natural rates [22] and greatly increases the water volume on the hillslope [23], promoting higher erosion intensity [7,18,24]. The construction of drainage systems mitigates the intensity of erosion on ski run surfaces, but it also increases erosion and deposition processes on the surrounding hillslopes and channel network [16,17,18,23,24,25].
Many studies were conducted in alpine environments using orthophotos to determine the extent of erosion landforms on alpine hillslopes [26,27,28]. These studies were conducted primarily in the Alps. They focused on identifying erosion landforms in alpine meadows, which are often grazed by livestock. This was conducted mainly through object-based image analysis of aerial orthophotos, with the identification of forms by field mapping. The following forms were identified: shallow landslides, livestock trails, sheet erosion landforms, snow abrasion scars, and anthropogenic landforms associated with cattle breeding. Some of these studies and related ones [26,29] also used LiDAR data and Digital Elevation Models (DEMs) to calculate the volume of the landforms. The use of DEMs and DEM of Difference (DoD) analysis is common in geomorphology to calculate changes in volume or ground level as a result of erosion and accumulation processes [30,31,32].
Studies on geomorphic changes caused by ski infrastructure frequently use LiDAR (Light Detection and Ranging) data, applying both airborne laser scanning (ALS) [16,18,23,24]. The quantitative analysis of these landform changes is particularly effective through the application of the DEM of Difference (DoD) method to repeated ALS surveys [30,31,32]. This technique is also widely used in the analysis of channel-bed morphology and sediment transport [30,31,33], mass movements [34,35,36] or coastal monitoring [37,38,39,40]. The wide range of possibilities of using LiDAR monitoring in geomorphology and other earth sciences was presented by Okyay et al. [32].
However, when analysing changes in the volume and extent of eroded landforms, it is also crucial to distinguish between the geomorphic processes that occur on the different hillslope landforms. Parts of hillslopes with silt and gravel sediments are primarily driven by shallow landslides and debris flow tracks, as well as processes related to snow and ice like nivation, solifluction, and snow abrasion. In areas with fine sediments and a lack of vegetation cover, water, aeolian, and snow erosion are particularly active. In contrast, on vegetated slopes, which are less susceptible to erosion, the dominant processes are shallow landslides and solifluction [28,41,42,43]. Although snow avalanches are also a significant geomorphic agent in alpine environments [44,45], previous research indicates that they do not shape the hillslope morphology in the area of Kasprowy Wierch [41]. This is the result of decreasing snowfall and snow avalanches in the Tatra Mountains [46,47]. In contrast to fine-sediment hillslopes, stone runs and scree areas are dominated by rockfalls and weathering processes [48,49,50].
Despite quoted research on the impacts of ski infrastructure, quantitative geomorphological studies focusing on the effects of snow grooming on the morphology of alpine slopes are limited. We decided to fill this gap and conduct research in a unique location in terms of ski run maintenance. The ski resort around Kasprowy Wierch is the only one in the entire Tatra Mountains and the entire Polish Carpathians where artificial snowmaking is not used and the hillslopes are not reshaped by earthworks. This presents a unique opportunity to analyse only the impact of snow groomers and natural processes. In addition, the hillslopes in the area are mostly covered by alpine meadows, but grazing has been prohibited here since 1954.
In our research we use field mapping, analysis of aerial RGB orthophotos, and DEM of Difference (DoD) analysis to demonstrate the changes on hillslopes connected to snow groomers.
The aim of this study is to quantitatively assess the impact of snow grooming on the erosion processes and morphology of alpine hillslopes by comparison with natural landforms. To achieve this, we define the following detailed aims: (i) to determine the spatial distribution, count, and morphometry of natural and snow groomer-eroded landforms across four analysed years (2012, 2019, 2020, 2023); (ii) to assess the persistence of identified landforms over time and to analyse their morphometric and spatial characteristics to understand the factors influencing their long-term presence; and (iii) to calculate the volumetric changes in natural and snow groomer-eroded landforms during specific analysis periods (2019–2020 and 2012–2023).

2. Materials and Methods

2.1. Study Area

The study area is located in Poland, in the Western Tatra Mountains, protected by Tatra National Park (Polish: Tatrzański Park Narodowy, TPN). The research was conducted in the area surrounding Kasprowy Wierch (1987 m a.s.l.) and consists of the upper parts of two valleys and glacial cirques, the Gąsienicowa Valley with the Gąsienicowy Cirque and the Goryczkowa Valley with the Goryczkowy Cirque, which are areas made available by Tatra National Park for skiing (Figure 1).
This area covers 68 ha and includes ski runs, a cable car from Zakopane, and two chairlifts (the Goryczkowa ski lift and the Gąsienicowa ski lift) of the PKL Kasprowy Wierch ski station (Polish: Polskie Koleje Linowe, Polish Cable Transport). The ski run link in the southern part of the area extends along the Polish–Slovakian border, which is the boundary between TPN and TANAP (Slovak: Tatranský národný park). In our analyses, we also took into account an area outside the ski run, where we identified damages caused by snow groomers (Figure 1).
Skiing in this area has existed since the 1930s, with a significant increase in popularity following the construction of chairlifts in the 1960s. It is the only ski resort in Poland where the ski runs have not been reshaped by earthworks and where artificial snow is not used [7]. The only method to maintain ski runs is snow grooming. During periods of low snowfall, snow is moved from the edges of the ski runs to the most used parts, where it is then regularly groomed. There is no break for snow grooming during the lift’s operating hours. Snow groomers can operate in the entire area made available as a ski run (purple and blue border in Figure 1), but we also noted their traces in the area outside the ski run marked in orange in Figure 1. The surroundings of Kasprowy Wierch are one of the most popular tourist spots in Tatra National Park. In addition to ski runs, there is an extensive network of hiking trails [51].
Figure 1. Location of the study area: (a) a regional overview and (b) an orthophoto (2021) of the surroundings of the PKL Kasprowy Wierch ski station. 1—Goryczkowa Valley; 2—Gąsienicowa Valley.
Land 14 01870 g001
The study area is formed of Carboniferous granites and granodiorites of the Goryczkowa crystalline core [52]. Glacial and periglacial processes transformed the study area during the Pleistocene glaciation. The area is located between 1987 and 1312 m a.s.l., and the denivelation reaches 675 m. Studied slopes have an average gradient of 22.6°. They are covered with scree and stone runs, but mostly with thick silt and gravel sediments with active solifluction, nivation, and wind erosion processes. Debris flow channels occur within glacial cirques [41,53,54]. On the slopes, Folic Leptosols, Leptic Podzols, and Haplic Podzols developed [55].
The meteorological station is located at the peak of Kasprowy Wierch, where the average annual air temperature is −2 °C. Average annual precipitation exceeds 2000 mm [56]. The most common type of precipitation during the year is snow [57]. The number of days with snow cover is 220 days, and the maximum snow cover thickness is 355 cm [56]. The average annual precipitation on Kasprowy Wierch in the study period of 2012–2023 was 1756.2 mm. The yearly minimum total was recorded in 2012 and amounted to 1362.7 mm. The maximum was recorded in 2020 and amounted to 2192.8 mm. Also in 2020, the maximum daily precipitation for the study period was recorded on 22 June, amounting to 126 mm. This rainfall occurred during a week-long precipitation period, with a total of 264.6 mm, based on our calculations using data from the Institute of Meteorology and Water Management of the National Research Institute. Full precipitation data with daily precipitation for the entire study period of 2012–2023 are presented in the Supplementary Materials (Figure S1). The study area is drained by small streams that are sourced in the central parts of cirques.
Most of the area is located above the alpine tree line and covered by alpine grasslands and subalpine Pinus mugo shrubs (Figure 1). Pinus mugo shrubs were degraded and decreased by centuries-old sheep grazing (abandoned since 1954, after the establishment of Tatra National Park) and nowadays by skiers [53].

2.2. Methods and Data Sources

In order to analyse the areas eroded by snow groomers on the hillslopes around Kasprowy Wierch, we conducted field mapping and analysed aerial RGB orthophotos and Digital Elevation Models (DEMs) obtained from point clouds acquired from TPN and the Head Office of Geodesy and Cartography in Poland (GUGiK, Polish: Główny Urząd Geodezji I Kartografii) (Table 1 and Table 2). All spatial analyses were performed using ArcGIS Pro 3.1 (ESRI). Point clouds from every year (2012, 2019, 2020, and 2023) were classified by the data provider according to the American Society for Photogrammetry and Remote Sensing (ASPRS) standard [58]. Point cloud parameters are presented in Table 1. We used these point clouds to generate DEMs. Each DEM was generated from class 2 (ground) points and with a 1 x 1 m horizontal resolution. DEMs were used for slope calculations and to generate DEMs of Difference (DoD).
During field mapping in the autumn of 2023, we identified eroded areas without vegetation on the hillslopes of Kasprowy Wierch. These were classified as snow groomer-eroded areas, with their locations, characterised by visible groomer tracks, recorded using a GPS receiver (Mobile Mapper 50, Spectra Geospatial, Westminster, CO, USA). During field mapping in the autumn of 2023, we identified areas of bare ground on the hillslopes of Kasprowy Wierch. We classified these as snow groomer-eroded areas based on visible groomer tracks and recorded their locations with a GPS receiver (Mobile Mapper 50, Spectra Geospatial). Using a detailed aerial RGB orthophoto from a few days after fieldwork, we manually vectorised the extent of these landforms and measured their area and shape in ArcGIS Pro 3.1 (ESRI, Redlands, CA, USA). Because of our field experience in this area, we were also able to identify and vectorise groomer-eroded areas from the other years (2012, 2019, and 2020) on the available RGB orthophotos. Orthophotos were generated from aerial photogrammetry campaigns. This manual vectorisation was crucial because it helped us prevent the misidentification of bare ground with similar-looking features like stone runs, which are shaped by different processes such as rockfalls [41]. We also used the same methods to vectorise and analyse natural landforms with bare ground in fine sediments, such as shallow landslides, snow abrasion scars, and debris flow tracks. The details of the orthophotos we used are in Table 2.
We also determined changes in the area eroded by snow groomers and natural landforms and their persistence throughout the years. For every vectorised eroded area, we calculated the area, mean slope, max slope, and circularity. In Statistica 13 (StatSoft, Tulsa, OK, USA), we conducted independent samples t-tests, using the first test to determine if there were statistically significant differences between snow groomer-eroded areas and natural landforms in the mean slope and circularity, and the second t-test to determine if there were statistically significant differences between calculated parameters of snow groomer-eroded areas, which were persistent and non-persistent throughout the analysed years. For this analysis, the polygons in our dataset were considered to be independent samples. The non-persistent group included all snow groomer-eroded forms identified across the four analysed years (2012, 2019, 2020, and 2023) that did not maintain continuous presence, while the persistent group included all forms that were present across all four analysed years.
In the next step, we analysed the changes in landforms, creating DoD. This is a map algebra analysis based on assessing the difference between two DEMs. It allows us to estimate the topographic change and erosion/deposition volume changes over a studied period [30,33]. We performed DoD analysis based on two periods: 2012–2023 and 2019–2020. The first period (2012–2023) indicates changes occurring over a longer period of time based on less accurate DEMs from GUGiK (Table 2) and may show overlapping periods of erosion and deposition. The second period (2019–2020) was analysed using higher-resolution DEMs from TPN (Table 2). It shows the changes that occurred during the year with the highest precipitation in the period of 2012–2023. We calculated DoDs using the raster calculator in ArcGIS Pro software, following the method proposed by Wheaton et al. [30]. To avoid elevation errors in DEMs, we calculated the minimum level of detection (minLoD). The minLoD establishes a threshold to differentiate real topographic changes from those resulting from elevation errors within individual DEMs [31,59]. To determine minLoD, we calculated root mean square error (RMSE), mean error (ME), and standard deviation of error (SDE), according to Höhle [60]. Error analyses were calculated for reference points obtained from four areas located in the upper and lower parts of the Gąsnienicowy and Goryczkowy cirques. They were straight, stable hillslopes with low morphological activity and covered with alpine grasslands. We chose reference areas based on available maps, DEMs, fieldwork, and earlier works in the research area [53,54]. We calculated one reference point per 1 × 1 m pixel for every DEM. In total, there were 5181 points. The mean slope of reference areas was 19.86°, with a standard deviation (SD) of 7.02, with the mean slope of the analysis area being 22.10°, with a SD of 7.70. More information about localisation and slopes of reference areas is in the Supplementary Materials (Figure S2, Table S1). Acknowledging the principle of error propagation, our methodology for determining the minLoD threshold directly follows the approach of Wheaton et al. [30]. The RMSE value used to calculate this threshold was derived from the elevation difference between the 2012 and 2023 DEMs, and between the 2019 and 2020 DEMs, respectively, in stable reference areas, making it an inherently cumulative error that accounts for the uncertainties of both models. After comparing values of these error calculations (Table 3), we selected RMSE as the most conservative minLoD value, adopting a 95% confidence interval to ensure the most precise results. This yielded minLoD values of 0.309 m for the 2012–2023 period and 0.092 m for the 2019–2020 period. The high minLoD for the 2012–2023 period is partly an effect of changes in the vertical coordinate system between 2012 and 2023 (Table 2). Due to the horizontal resolution of the DEMs, we assumed the RMSE at a 95% interval of vertical error as the volume error. Additionally, areas with the highest potential error, specifically stone runs and Pinus mugo shrubs, were excluded from the analysis. After excluding these areas, the analysed area covers 50.68 ha. In our volumetric change analyses for each landform, we calculated three distinct volumetric values: total volume change, total erosion, and total deposition. The total volume change represents the overall volumetric difference within a landform, summing both erosion (negative values) and deposition (positive values). Total erosion refers exclusively to the total volume of material that was lost within the landform boundaries. Similarly, total deposition refers exclusively to the total volume of material that was gained within the landform boundaries. Normalised volume means the average volume of material changed from 1 square metre. To accurately calculate the volume of each landform, we first applied the minLoD threshold by setting all raster cells with a calculated elevation difference below the minLoD value to “no data,” thereby excluding them from our subsequent volumetric calculations. We then employed a precise proportional allocation method to account for mixed pixels at the boundaries of our vectorized forms. We converted the DoD raster cells into square vector polygons. We then calculated the final volume for each landform by summing the DoD value of each pixel, weighted by the fractional area of that pixel that fell within the landform’s boundary. This method avoids the common issue of over- or underestimating volume by treating pixels on the boundary as a single, uniform value.

3. Results

3.1. Spatial Distribution and Morphometry of Landforms

We identified eroded areas without vegetation on the hillslopes of Kasprowy Wierch. These were classified into two groups: natural landforms and snow groomer-eroded areas. Many natural landforms discussed in this study are described in the Polish literature as ‘nisze erozyjne’ (erosional niches), which develop as a result of cryogenic and nivation processes in winter, as well as sheet wash and linear erosion in summer [54]. We classify these forms as ‘shallow landslides’ to maintain consistency with geomorphological terminology, particularly within the Alpine context [26,27,28,29]. This term is used because their formation shares similarities with the definition of shallow landslides, which are caused when a triggering event like heavy precipitation or snow cover movement displaces the topsoil layer [27]. These areas are also known to be exposed to further erosion and may take years to re-vegetate [28].
Natural landforms are mostly results of mass movements such as shallow landslides, debris flow tracks (Figure 2(C1)), and processes connected to snow and ice (e.g., snow abrasion, solifluction, nivation, needle ice). They also include burrows dug by marmots and paths made by bears and deer. Natural landforms generally have an elongated shape and occur on varied slopes (Figure 2(C1,C2)). They are also deeper and have higher edges. Natural landforms are mostly clustered around debris flow tracks (Figure 3, Figure 4, Figure 5, Figure 6 and Figure 7). Snow groomer-eroded areas are more angular in shape (Figure 2(A1,A2,B1,B2)), and a significant number of them occur near narrower and most frequented sections of the ski runs (Figure 3, Figure 4, Figure 5, Figure 6 and Figure 7).

3.1.1. Morphometric Characteristics of Landforms in 2012
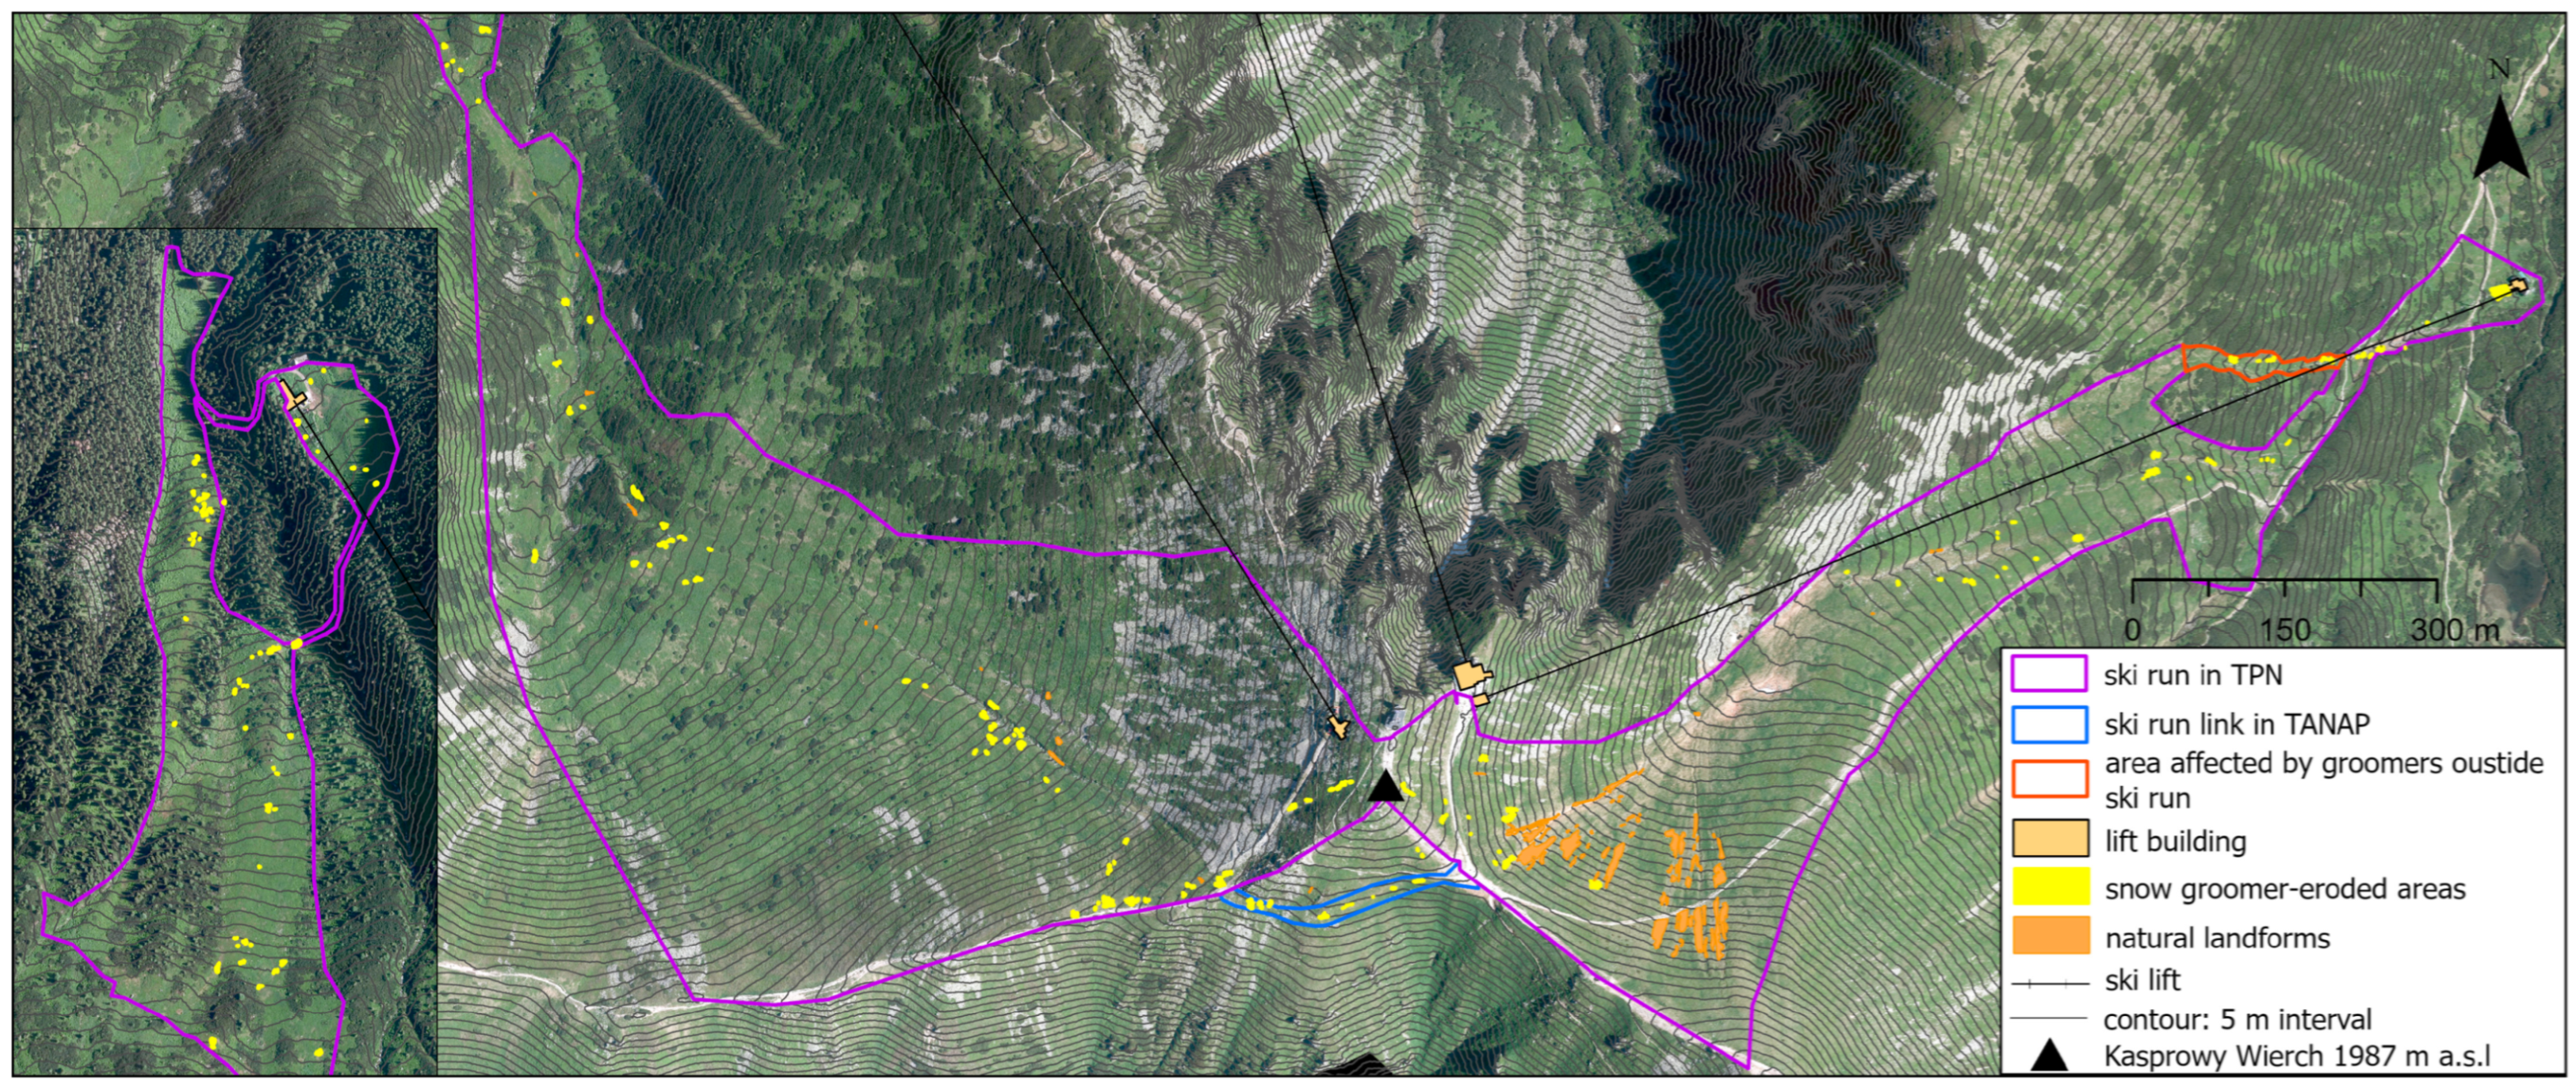
Analysis of orthophoto from 2012 enabled the identification of 270 landforms covering a total area of 6104.02 m2 in the study area (Figure 3). This constituted 1.21% of the analysed ski run area of 50.68 ha (506,800 m2). We recognised 80 natural landforms and 190 snow groomer-eroded areas (Table 4). Their areas are 3981.31 m2 and 2122.71 m2, respectively. The 80 natural landforms constituted 65.2% of the total degraded area, with the largest individual feature measuring 399.40 m2 and a mean area of 49.77 m2 (Table 4). These landforms, which include shallow landslides, snow abrasion scars, or debris flow tracks, showed a mean circularity of 0.49 (standard deviation, SD = 0.20). The average slope angle for natural landforms was 27.10°, with a maximum reaching 36.44° (Table 4).
Regarding the snow groomer-eroded areas, the 190 identified features comprised 34.8% of the total degraded area (Figure 3). The largest snow groomer-eroded area measured 147.51 m2, and the mean area was 11.17 m2 (Table 4). These areas showed a mean circularity of 0.62 (SD = 0.17). This indicates higher circularity compared to natural landforms, suggesting that features eroded by snow groomers develop a more rounded shape. The average slope for snow groomer-eroded areas is gentler, at 22.90°, though the maximum slope was the highest in the entire analysis and reached 42.88° (Table 4).
Figure 3. Spatial distribution of identified landforms in 2012.
Land 14 01870 g003

3.1.2. Morphometric Characteristics of Landforms in 2019
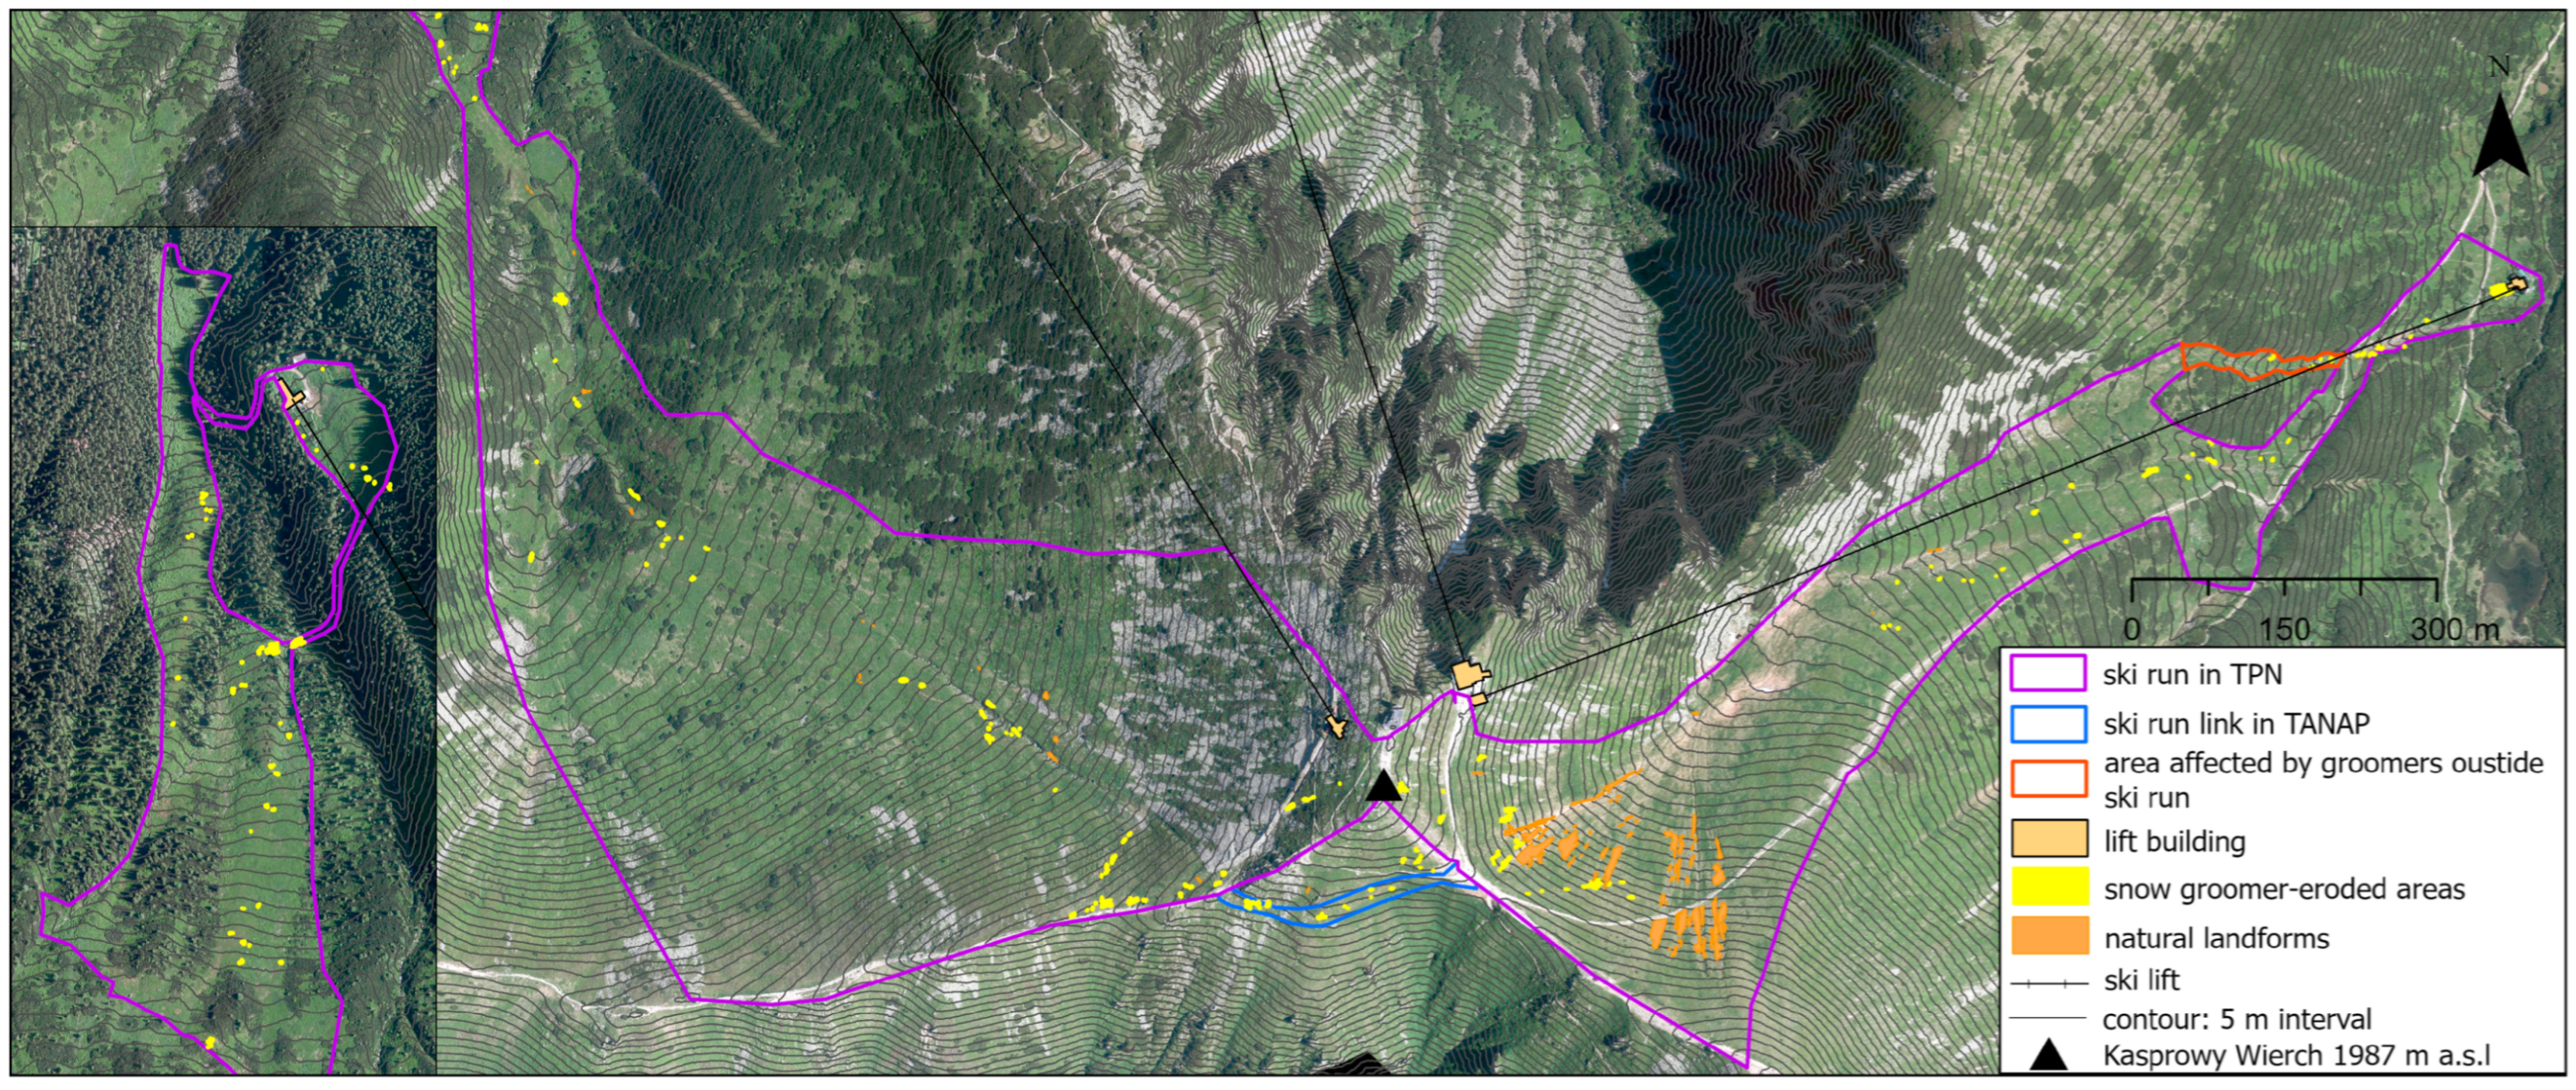
An analysis of the orthophotos taken in 2019 resulted in the identification of 276 landforms—81 natural and 195 snow groomer-eroded areas (Figure 4). The total area of these identified landforms was 5169.31 m2, constituting 1.02% of the analysed ski runs. Their areas are 3551.62 m2 and 1617.69 m2, respectively (Table 4). The 81 natural landforms comprised 68.7% of the total degraded area this year, with a mean area of 43.85 m2 and the largest individual feature measuring 371.40 m2. The mean circularity remained the same, at 0.49 (SD = 0.20). The average slope angle for these natural areas was 27.08°, with a maximum of 36.70° (Table 4), very similar to the previous year’s observations.
As for the snow groomer-eroded areas in 2019, the 195 identified features comprised 31.3% of the total degraded area (Figure 4). Their mean area reached 8.30 m2. The largest individual landform measured 131.21 m2 (Table 4). Their mean circularity was 0.63 (SD = 0.18), maintaining the pattern of higher circularity compared to natural areas. The snow groomer-eroded areas were found on slopes with an average gradient of 23.84°, reaching a maximum of 41.15° (Table 4).
Figure 4. Spatial distribution of identified landforms in 2019.
Land 14 01870 g004

3.1.3. Morphometric Characteristics of Landforms in 2020
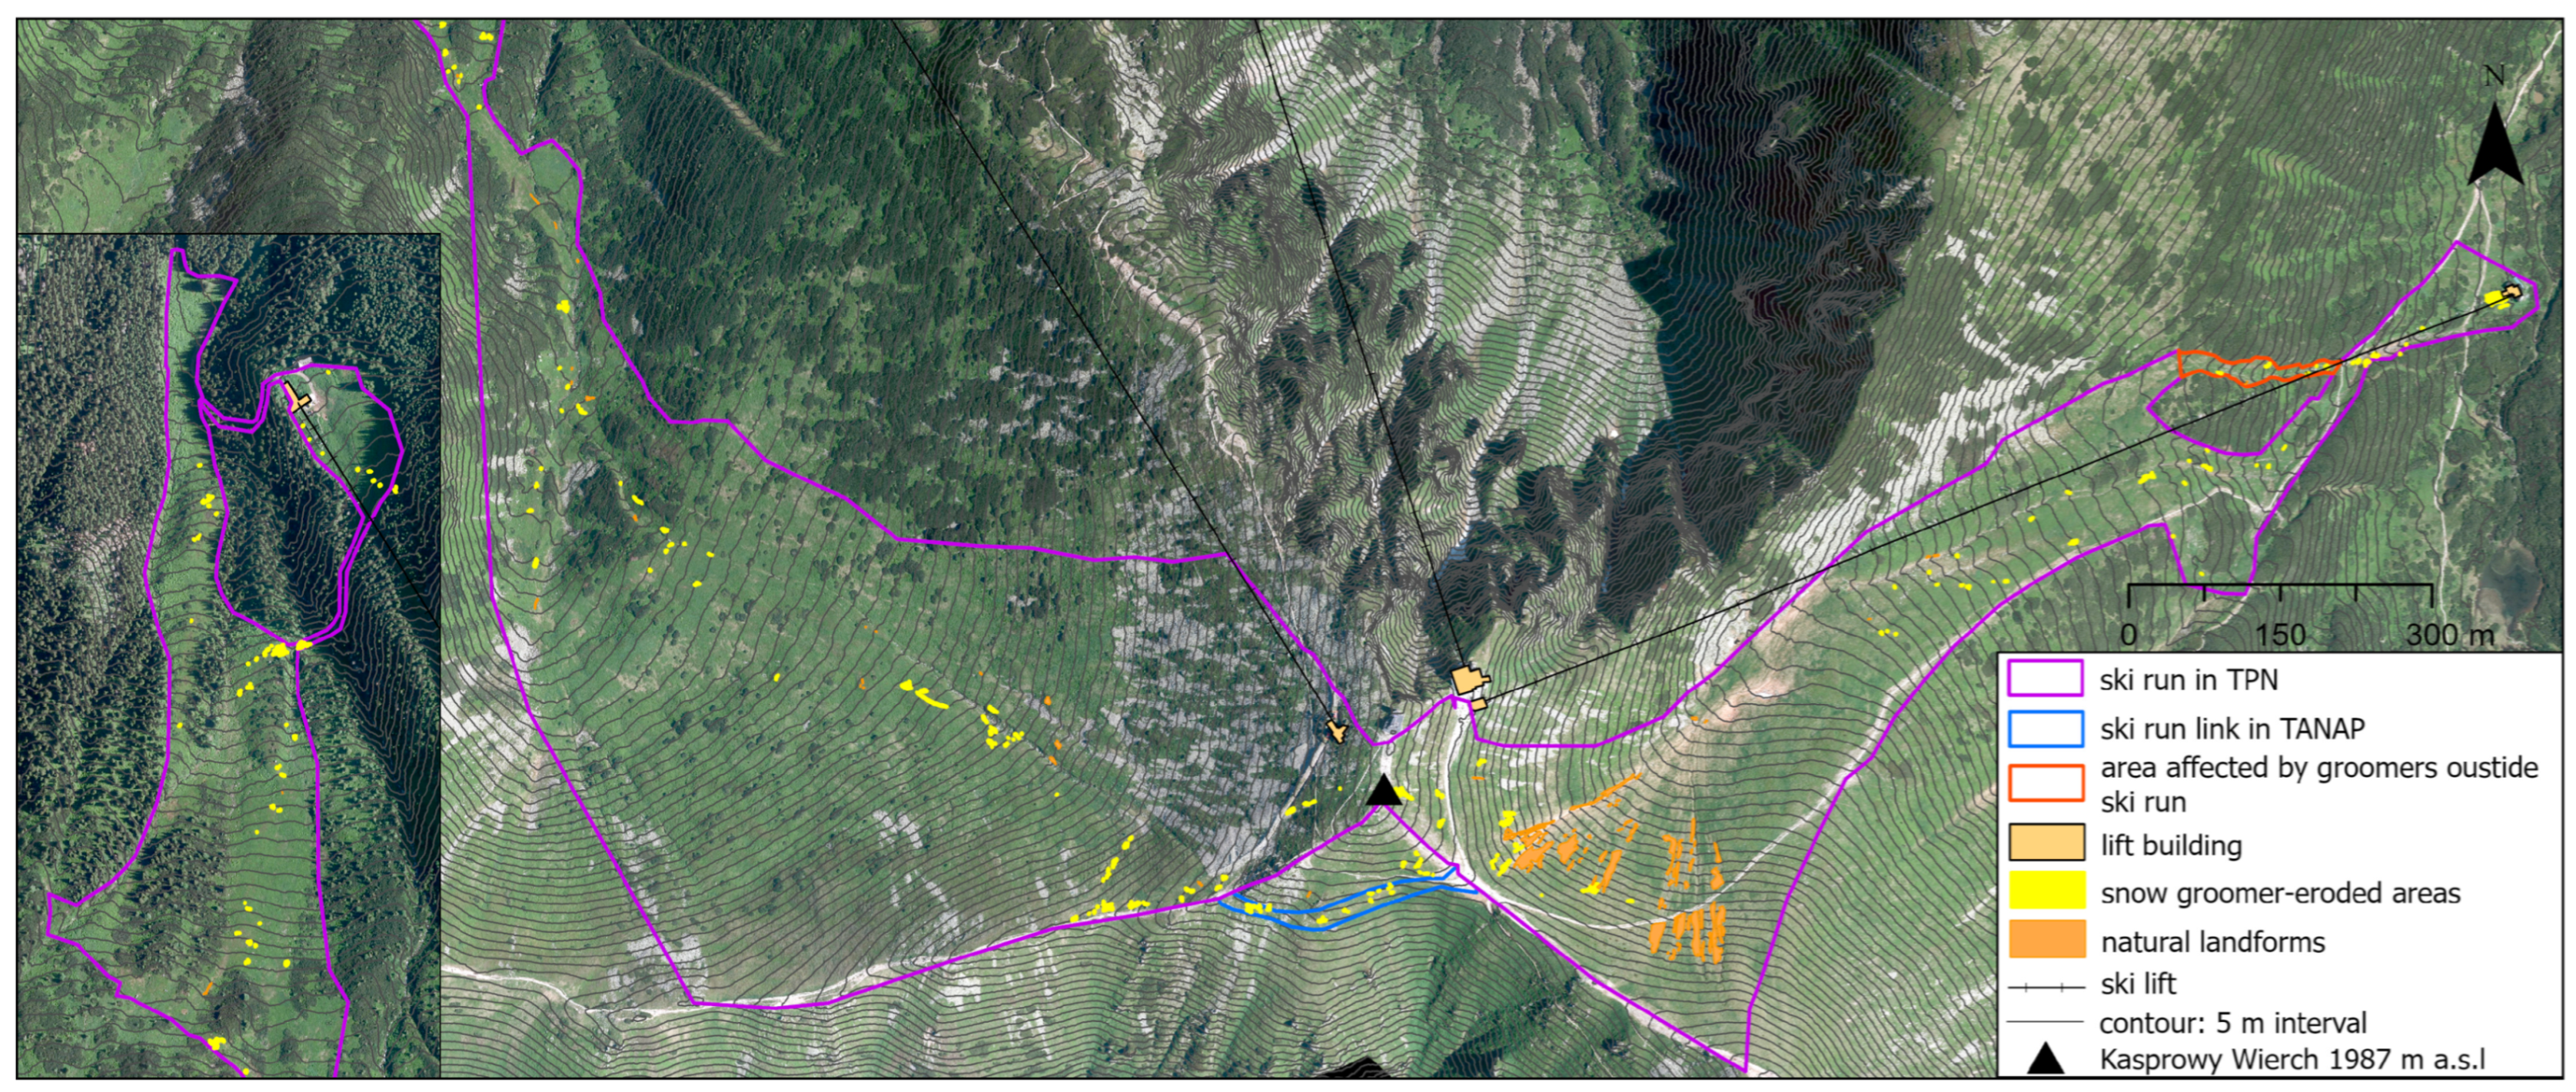
Within the study area, an analysis of 2020 orthophotos led to the identification of 305 landforms, totalling 5614.42 m2. This constituted 1.11% of the analysed ski run area of 50.68 ha. We recognised 89 natural areas and 216 snow groomer-eroded areas (Figure 5). Their areas were 3780.89 m2 and 1833.53 m2, respectively (Table 4).
Figure 5. Spatial distribution of identified landforms in 2020.
Land 14 01870 g005
The 89 natural landforms comprised 67.3% of the total degraded area, with a mean circularity of 0.46 (SD = 0.20) (Table 4). The largest landform had 390.65 m2 and a mean of 42.64 m2. The mean slope of natural landforms reached 26.03°, with a maximum of 36.59° (Table 4). This year was characterised by the highest number of natural landforms and the lowest mean slope of natural landforms in the entire period under analysis.
The snow groomer-eroded areas in 2020, numbering 216 features, had a total area of 1833.53 m2, with a mean area of 8.49 m2 and the largest area being 139.26 m2 (Figure 5). Their mean circularity was 0.61 (SD = 0.18). These areas were located on slopes averaging 23.68°, with a maximum of 41.15°(Table 4).

3.1.4. Morphometric Characteristics of Landforms in 2023
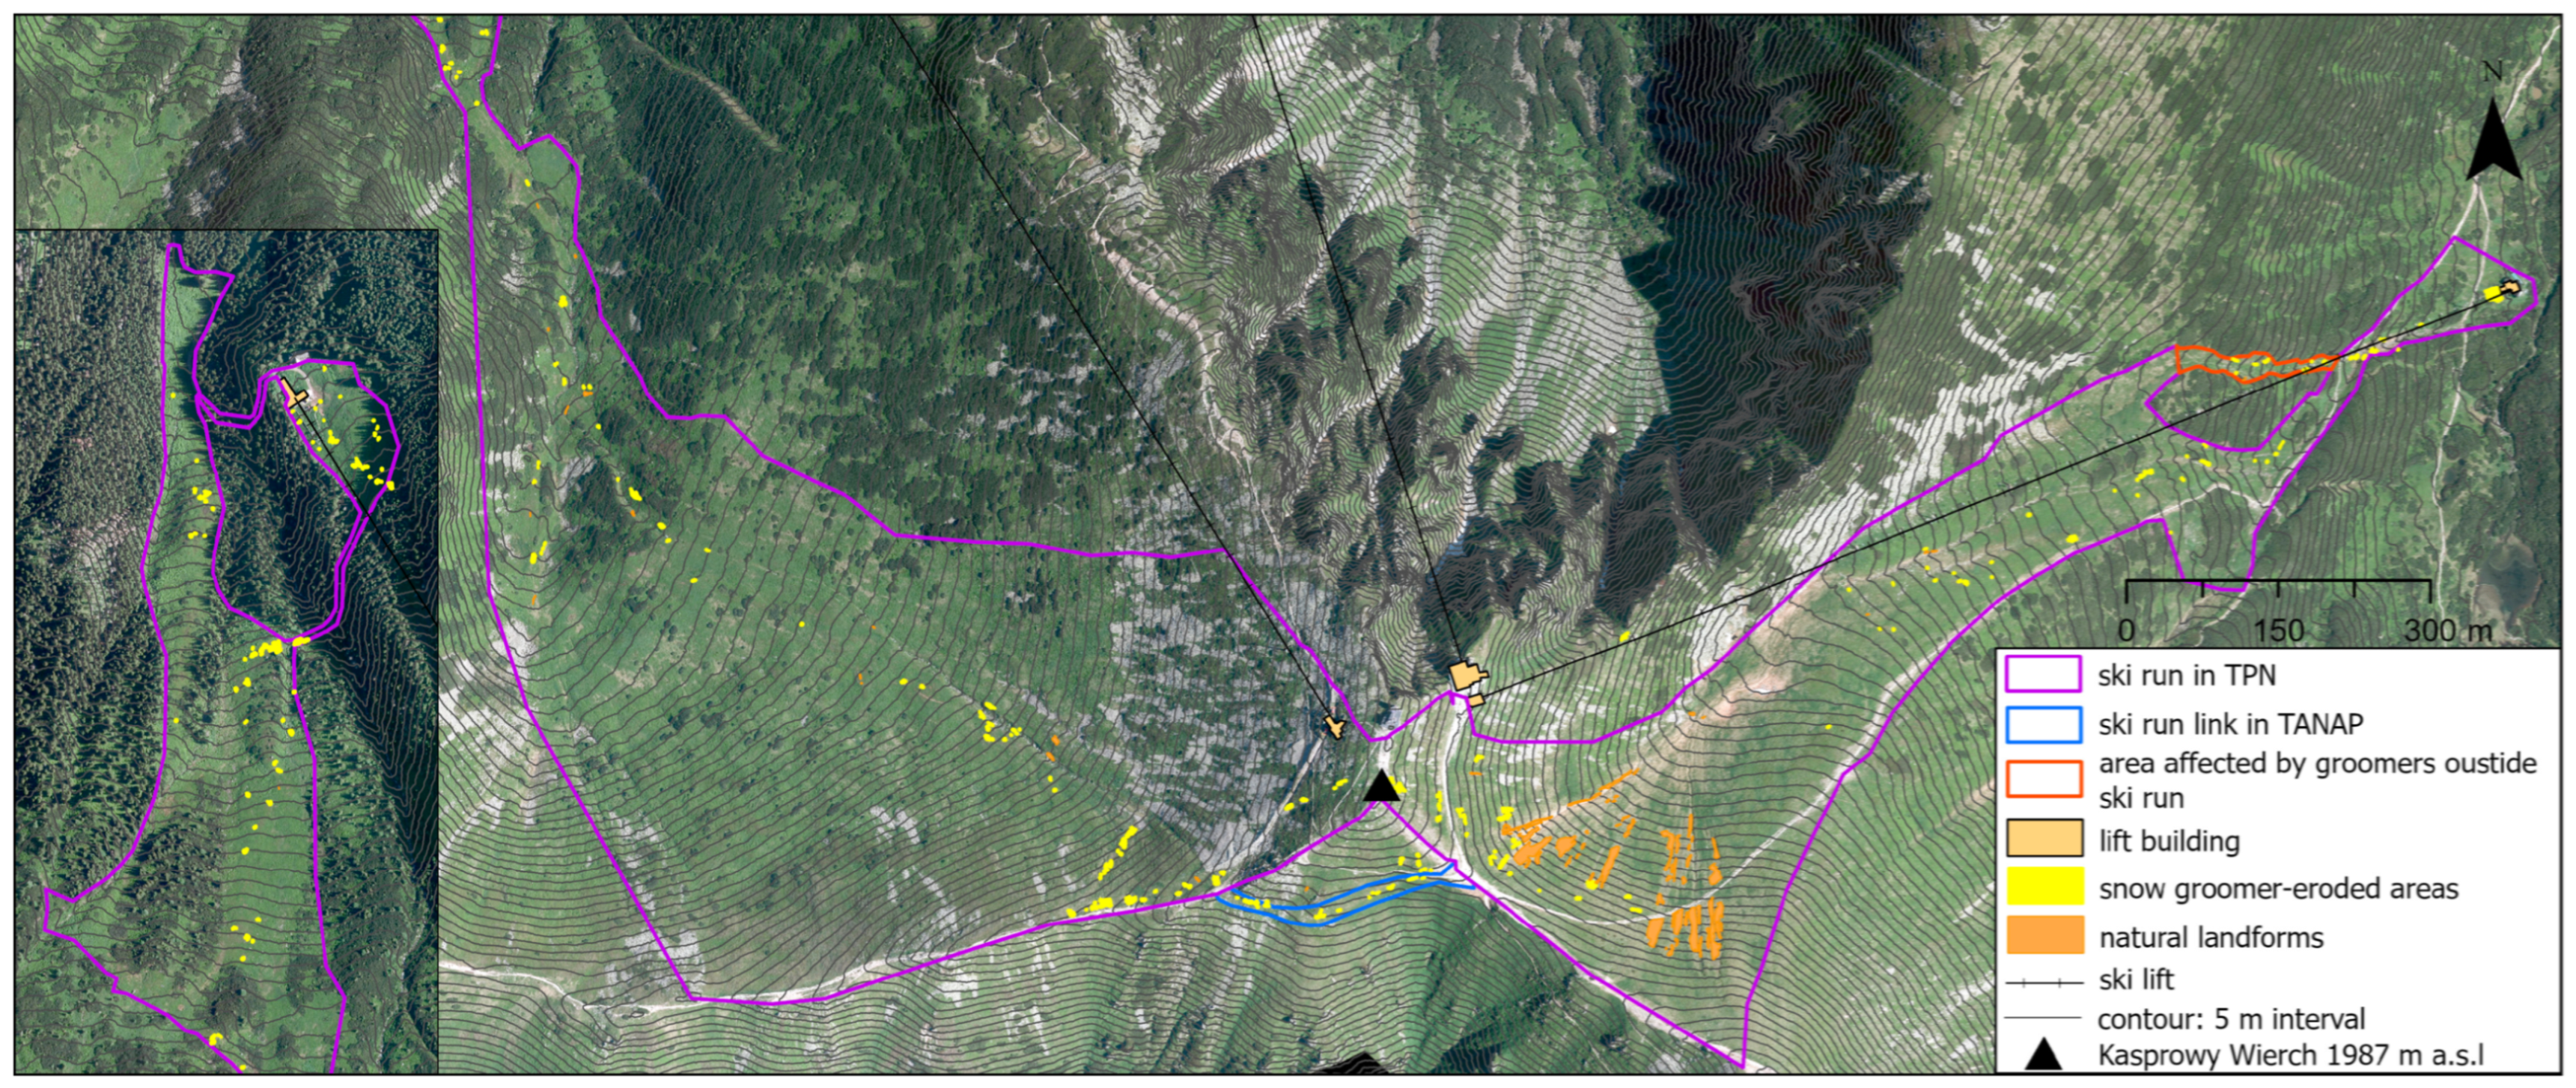
For the year 2023, a total of 326 landforms were identified, covering a combined area of 5214.35 m2 in the study area. This constituted 1.03% of the analysed ski run area. We recognised 78 natural features (3452.10 m2) and 248 snow groomer-eroded areas (1762.25 m2) (Figure 6). The mean area of natural landforms was 44.26 m2, and the largest landform measured 371.88 m2 (Table 4). The mean circularity in this group was 0.44 (SD = 0.19), which is slightly lower than in previous years, highlighting the elongated shapes resulting from snow abrasion and mass movements. The slope averaged 26.80°, with a maximum reaching 36.98°.
As for the snow groomer-eroded areas in 2023, the 248 identified features collectively covered an area of 1762.25 m2, with the largest feature being 109.40 m2. Their mean area was 7.11 m2 and mean circularity was 0.59 (SD = 0.19), continuing to reflect their distinct, more rounded morphology shaped by grooming activities, but with a slight decrease compared to previous years. These areas were located on slopes with an average gradient of 23.01°, reaching a maximum of 42.88°, the highest in the entire analysis (Table 4).
Figure 6. Spatial distribution of identified landforms in 2023.
Land 14 01870 g006

3.2. Persistent Landforms Throughout the Study Period

3.2.1. Morphometric Differences in Persistent Landforms

The analysis of landform persistence throughout the entire observation period (2012, 2019, 2020, and 2023) revealed a significant number of stable features. Specifically, 68 natural landforms and 118 snow groomer-eroded areas were consistently present across all analysed years (Figure 7). These persistent forms constituted varying proportions of the total annual counts: for natural landforms, they represented approximately 85.0% (2012), 84.0% (2019), 76.4% (2020), and 87.2% (2023); and for snow groomer-eroded areas, the percentages were about 62.1% (2012), 60.5% (2019), 54.6% (2020), and 47.6% (2023).
Natural landforms were larger (with a mean area of 46.90 m2 and maximum of 355.96 m2) and situated on steeper hillslopes (mean 27.89°) than persistent snow groomer-eroded areas (mean area 6.92 m2, maximum area of 70.60 m2, and mean slope 22.96°) (Table 5). Snow groomer-eroded areas were characterised by a circular shape (mean circularity 0.59) compared to the natural landforms (mean circularity 0.45) (Table 5).
Figure 7. Spatial distribution of persistent landforms throughout the study period.
Land 14 01870 g007

3.2.2. Statistical Differences in Persistent Landforms Characteristics

The independent samples t-test showed that there are statistically significant differences in circularity and mean slope between snow groomer-eroded areas and natural landforms that persisted throughout the entire study period (2012, 2019, 2020, and 2023).
In the circularity, there was a highly statistically significant difference (p < 0.000001). Snow groomer-eroded areas proved to be much more circular on average (mean 0.61) compared to natural landforms (mean 0.46) (Table 6). This highlights that features eroded by snow groomers have markedly more rounded shapes.
The difference in mean slope is also a highly statistically significant difference (p < 0.000001) (Table 6). Natural landforms were consistently persistent on steeper hillslopes, averaging 27.89°, while snow groomer-eroded areas can develop on gentler hillslopes, with an average of 22.96° (Table 6).

3.2.3. Statistical Differences in Morphometry of Persistent and Non-Persistent Snow Groomer-Eroded Landforms

The t-test results showed no statistically significant differences in either circularity or mean slope between persistent and non-persistent snow groomer-eroded landforms. The non-persistent group included all snow groomer-eroded forms identified across the four analysed years (2012, 2019, 2020, and 2023) that did not maintain continuous presence. Regarding circularity, the difference between the groups was not statistically significant (p = 0.158) (Table 7). Similarly, for mean slope, no statistically significant difference was found (p = 0.790) (Table 7).
It indicates that the persistence of snow groomer-eroded landforms is not significantly linked to their mean circularity or the average slope on which they are located.

3.3. Volumetric Changes and Erosion/Deposition Processes
The analysis of volumetric changes provided us with information on the material displacement within both natural and snow groomer-eroded landforms across two analysed periods. The first period (2012–2023) indicates changes occurring over a longer period. The second period (2019–2020) showed the changes that happened during the year with the highest precipitation event in the period of 2012–2023.
Considering the first, longer 2012–2023 period, natural landforms exhibited a total volume change of +8.196 ± 0.309 m3, signifying deposition. This included a total erosion of −0.828 ± 0.309 m3 and a total deposition of +9.024 ± 0.309 m3, detailed data are presented in Table 8. In nine years, one natural landform eroded, while twenty showed a deposition process. An additional 57 landforms registered no volumetric change (Table 8).
Snow groomer-eroded areas, however, showed a total volume change of −2.070 ± 0.309 m3, indicating erosion. This comprised a total erosion of −6.363 ± 0.309 m3 and a total deposition of +4.292 ± 0.309 m3 (Table 8). In this longer timeframe, 11 eroding snow groomer landforms were identified compared to 19 deposition ones. Furthermore, 218 landforms registered no volumetric change (Table 8).
For the 2019–2020 period, natural landforms showed a total volume change of −163.651 ± 0.092 m3 from 3654.6 m2 (Table 8). This indicated a very significant erosion in only one year. These landforms had a total erosion of −163.676 ± 0.092 m3 and a minor total deposition of only +0.025 ± 0.092 m3. During this period, 67 eroding natural landforms were identified, compared to only two deposition ones. Additionally, 20 landforms registered no volumetric change (Table 8).
Similarly, snow groomer-eroded areas demonstrated a total volume change of −33.765 ± 0.092 m3. Mostly, this comprised a total erosion of −33.884 ± 0.092 m3; however, total deposition amounted to +0.119 ± 0.092 m3, which was higher in magnitude than that observed in natural landforms for this period (Table 8). In total, one hundred twelve snow groomer-eroded landforms experienced erosion, while four showed deposition of material. One hundred of these landforms remained volumetrically stable (Table 8).
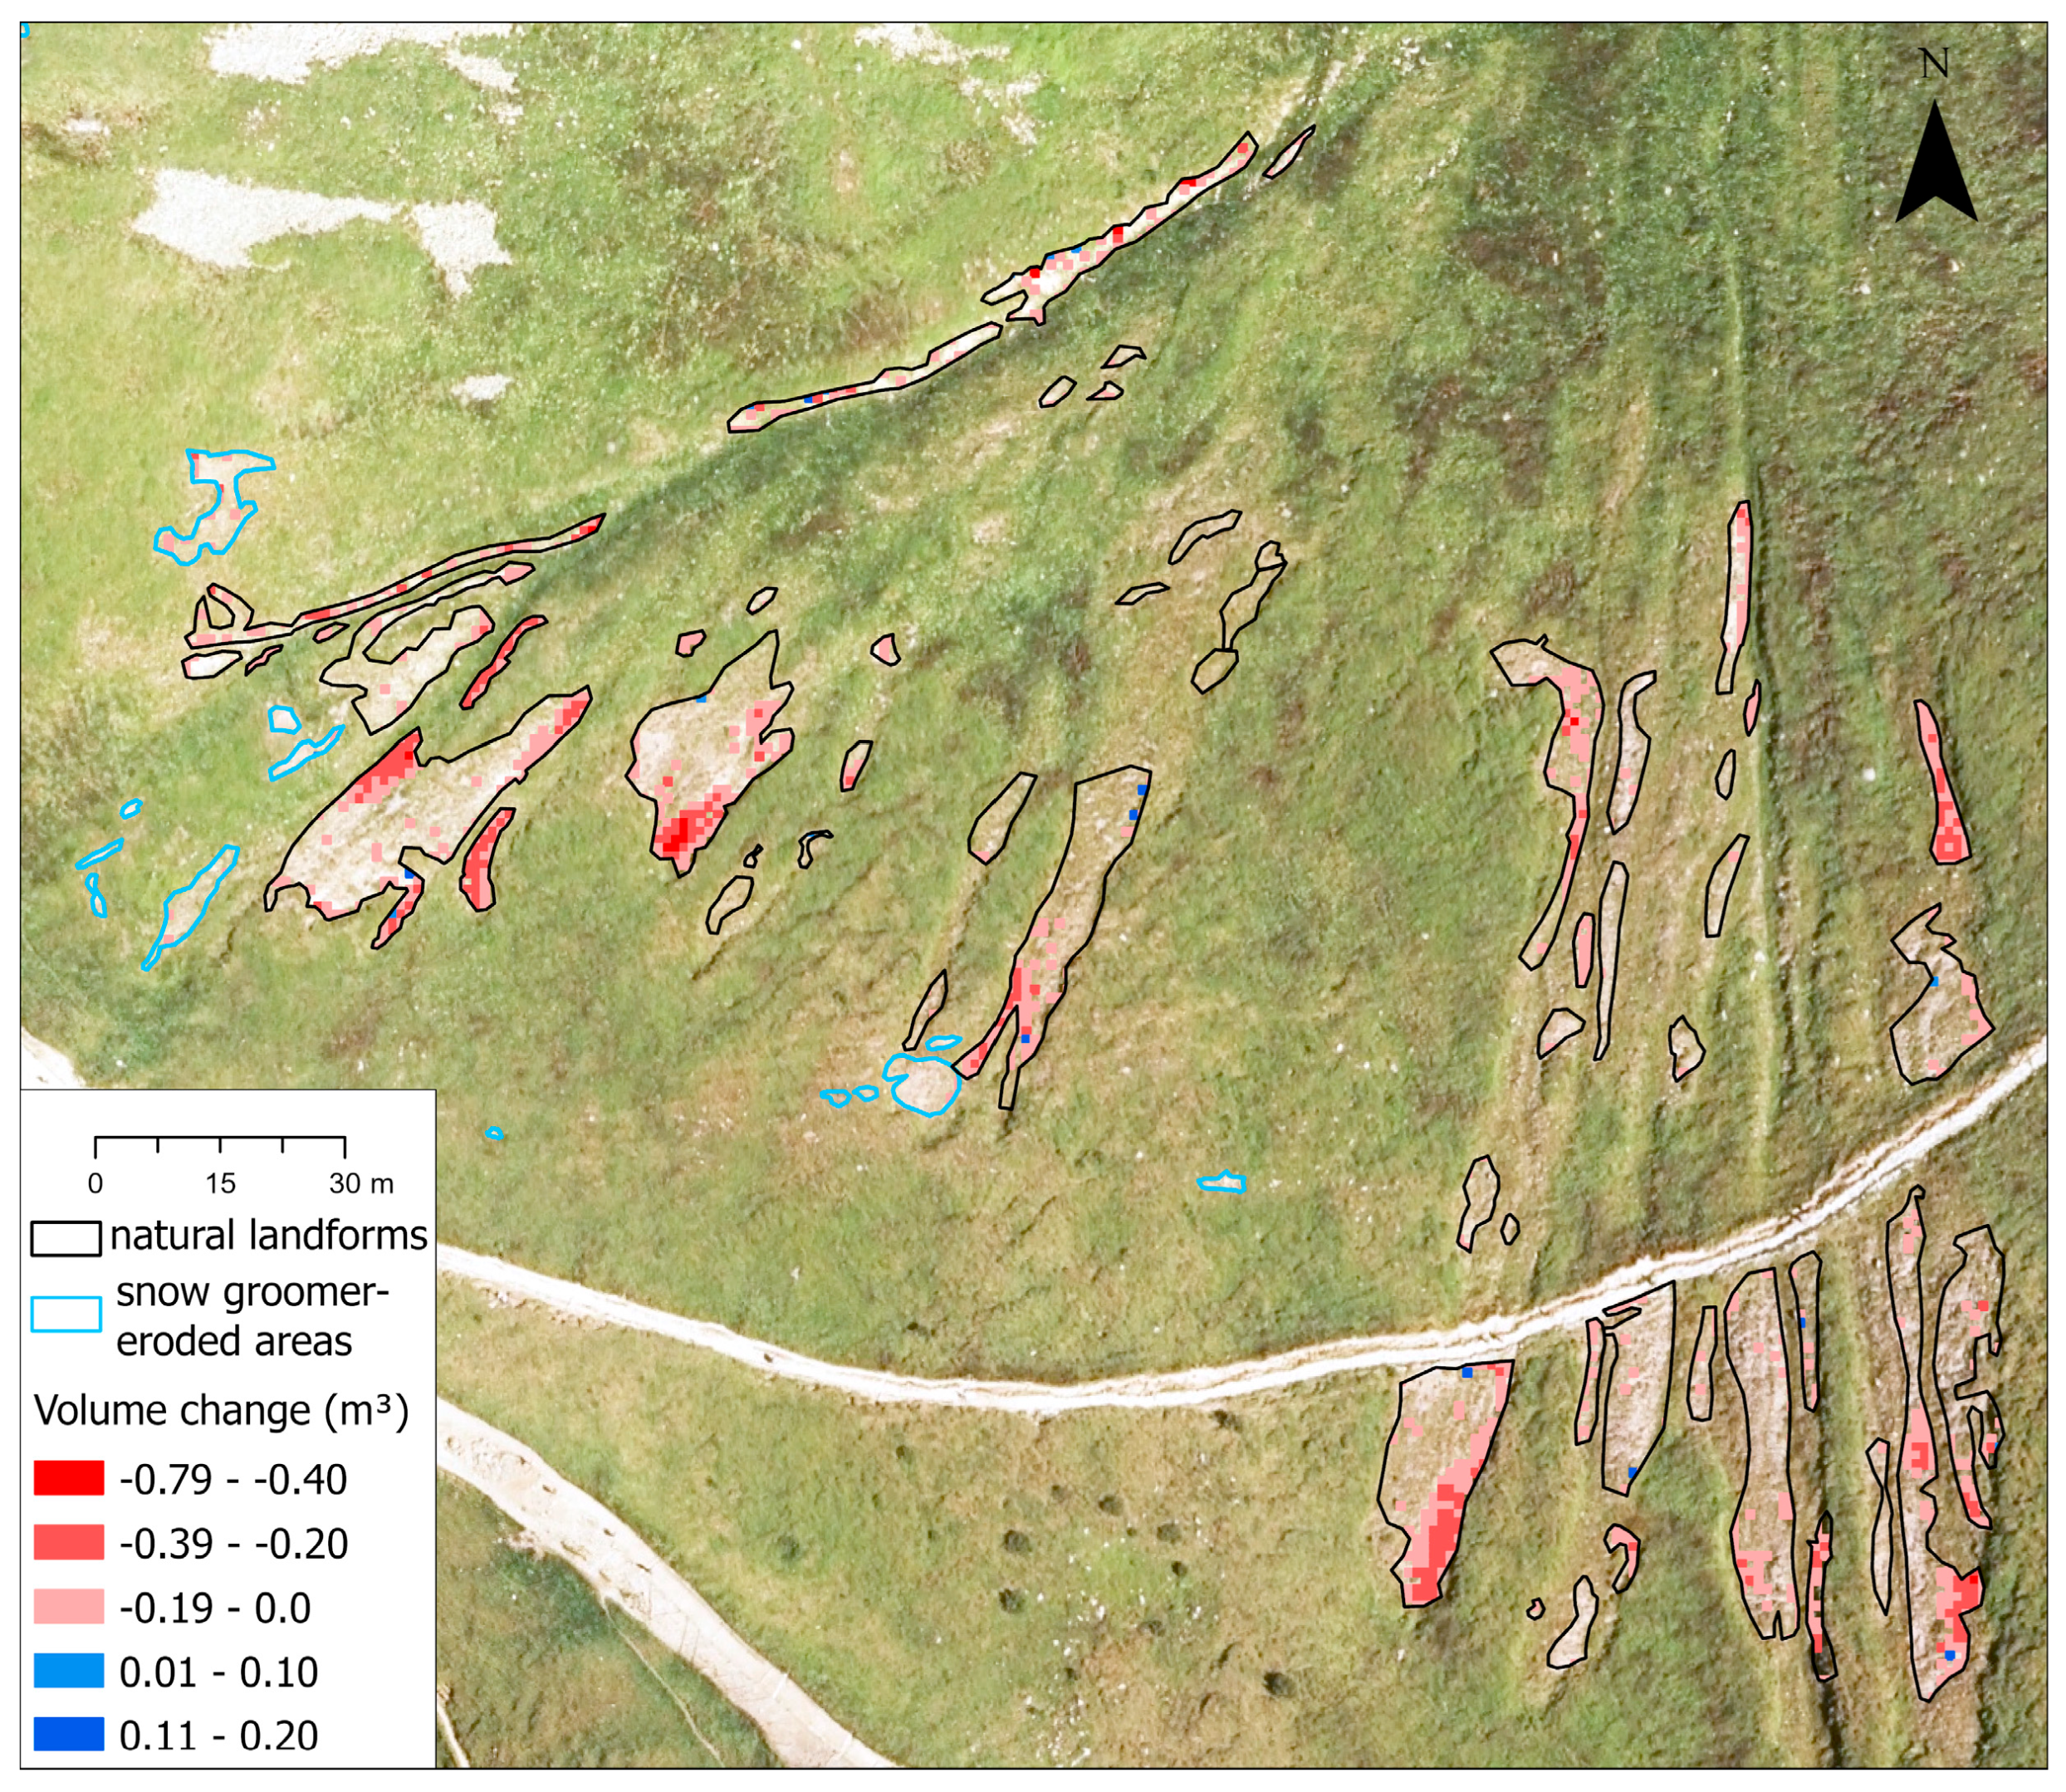
Most of the changes in natural landforms during both periods were related to shallow landslides and debris flow tracks in the upper part of the Gąsienicowa Valley. During the 2019–2020 period, intensive erosion reached up to −0.8 ± 0.092 m3 per square metre (almost 18 times more than the normalised volume of erosion—0.045 m, Table 8), with a single landform experiencing a volume 0.2 ± 0.092 m3 (Figure 8). In the longer period (2012–2023), minor deposition occurred on the edges of debris flow tracks, reaching up to +0.43 ± 0.309 m3.
Volumetric changes for snow groomer-eroded landforms indicated erosion in both periods. Moderate erosion was observed in the vicinity of debris flow tracks (Figure 8), while very intensive erosion was concentrated in the lower parts of the ski runs.
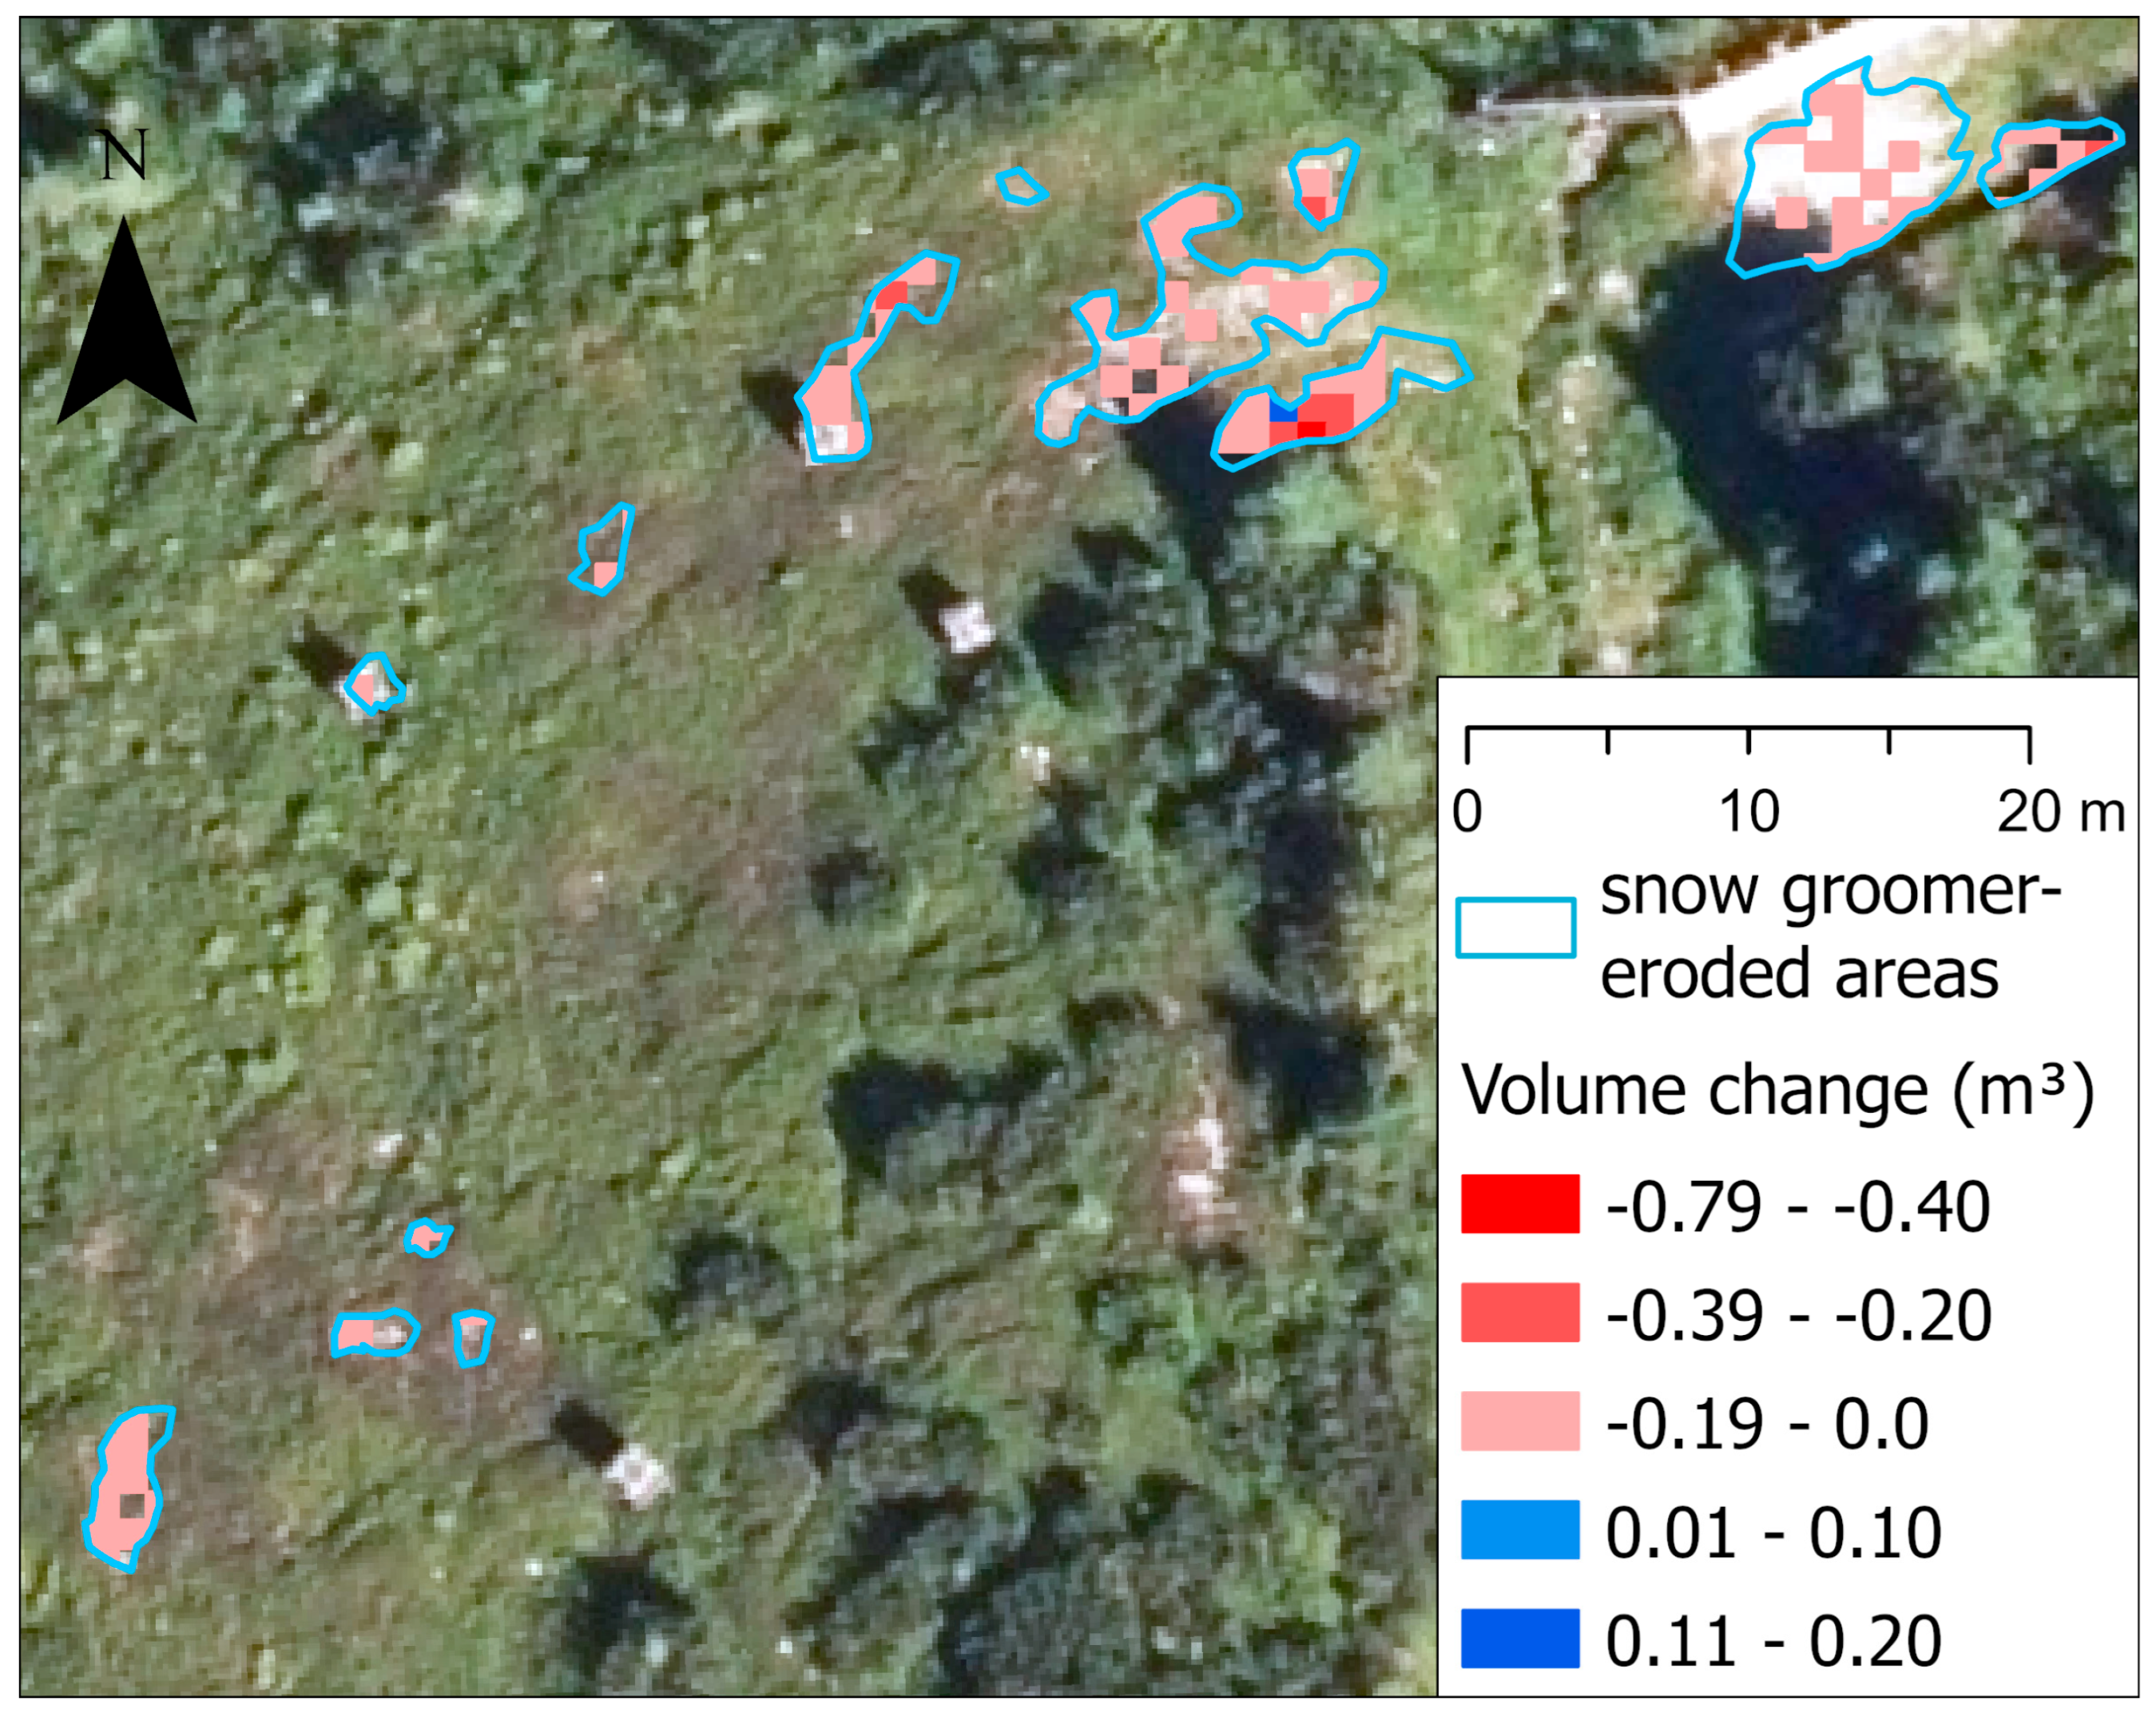
During the 2019–2020 period, the highest values occurred near the lower chairlift stations, reaching up to −0.72 ± 0.092 m3 per square metre. The maximum volume of erosion from a single landform was −2.71 ± 0.092 m3 in the Goryczkowa Valley (Figure 9).
In the longer period (2012–2023), the maximum volume of erosion was −2.03 ± 0.309 m3 from the same landform in the Goryczkowa Valley. This erosion reached up to –0.47 ± 0.309 m3 per square metre. This specific site was the most eroded area among all the snow groomer-eroded landforms (Figure 9).
Figure 8. The area of natural landforms with the highest erosion volume during the 2019–2020 period, the upper part of the Gąsienicowa Valley.
Land 14 01870 g008
Figure 9. An example of a highly eroded snow groomer landforms from the 2019–2020 period, the low part of the Goryczkowa Valley.
Land 14 01870 g009

4. Discussion

4.1. Morphometric Characteristics and Persistence of Natural and Groomer-Eroded Landforms

The results indicate that throughout the study period, natural landforms were found on a higher mean slope (26.8°) and had a more elongated shape (mean circularity 0.47). The number of landforms ranged from 89 in 2020 to 78 in 2023, while the total area ranged from 3891 m2 in 2012 to 3452 m2 in 2023. These changes, at 14.1% and 13.3%, respectively, showed little variation over time. This is because most of these landforms are shallow landslides and debris flow tracks, which remain continuously active [54]. Instead, depending on weather conditions (e.g., summer rainfall and snowmelt), they undergo minor overgrowth or extension. Most metrics showed a slight decrease from 2012; however, the highest number of landforms (89), the lowest mean slope, and the smallest mean size of forms were noted in 2020. This year was characterised by high geomorphological intensity, which was confirmed by the analysis of volume changes. This can be attributed to the fact that 2020 recorded the highest maximum daily and multi-day rainfall totals throughout the study period.
A comparison of our findings on the morphometry of Kasprowy Wierch with those from the Urseren Valley in the Swiss Central Alps (Canton Uri) [27] shows that shallow landslides in our study area occur on a much lower slope (26.8° vs. 39° in Urseren Valley). Similarly, much steeper slopes for shallow landslides were found in Tyrol [61]. However, a relevant exception was an area within the Zillertal Alps, where the occurrence of shallow landslides on slopes below 25° was linked to more intensive snow erosion [61]. This is an important finding, as the similar slopes at Kasprowy Wierch may be a result of the greater influence of snow and water erosion, which Rączkowska [54] identified as dominant processes, rather than the landslides themselves. Comparing surface changes in the Urseren Valley, the area of shallow landslides increased by 11.2% between 2000 and 2016 [27]. In the Kasprowy Wierch area, the area of shallow landslides decreased by 13.3% over a five-year period.
In contrast to natural landforms, the count of snow groomer-eroded landforms exhibited a significant increase, rising from 190 in 2012 to 248 in 2023 (a change of 30.5%). However, their total area decreased by 17% over the same period, from 2122.71 m2 to 1762.25 m2. This suggests that while more snow groomer-eroded landforms were created, they were, on average, much smaller. Indeed, the mean area of snow groomer-eroded landforms dropped significantly, from 11.17 m2 in 2012 to just 7.11 m2 in 2023. This trend is difficult to fully explain, but it may be due to a change in the snow groomer model, technological improvements, or a shift in driving patterns.
Snow groomer-eroded landforms occur on gentler slopes (mean slope 23.4°) than natural landforms throughout the entire study period. We presume that this is because snow groomers avoid working on the steepest slopes. Their spatial arrangement in linear patterns (Figure 3, Figure 4, Figure 5 and Figure 6) further suggests that these landforms are located along the most frequent routes of snow groomers. A similar situation was observed in the Urseren Valley, where forms affected by livestock management occurred on the gentlest slopes (12° to 22°) of all types of landforms studied on Alpine meadows [27]. Despite the similar trend, the mean slope of 23.4° for snow groomer-eroded landforms is higher because snow groomers, with their chain tracks, can operate on steeper slopes than the tractors and off-road vehicles used for spreading manure on meadows in the Urseren Valley [27]. Regarding the changes in area during the study periods (our study: 2012–2023; Urseren Valley: 2000–2016), the degradation caused by machine traffic is significantly less around Kasprowy Wierch. The described landforms decreased by 17%, while in the Urseren Valley [27], they increased more than four times.
The higher circularity of snow groomer-eroded landforms (mean circularity 0.67 vs. 0.47 for natural landforms) is likely due to the shape of the groomer’s plough itself. Since the plough is rectangular or rounded, it erodes angular landforms and creates shapes that are more circular than the elongated natural landforms.
The long-term persistence of these landforms also revealed key differences. A significant number of landforms were stable throughout the observation period, with 68 natural landforms and 118 snow groomer-eroded landforms consistently present across all analysed years. Natural landforms consistently showed high stability, representing between 76.4% and 87.2% of the total count. In contrast, snow groomer-eroded landforms were less persistent, with their proportion decreasing over time from 62.1% to 47.6%.
A statistical t-test confirmed that persistent natural and snow groomer-eroded landforms are distinct in their morphometric characteristics. Natural landforms were significantly larger and occurred on steeper hillslopes (mean area 46.91 m2 vs. 6.92 m2 and mean slope of 27.89° vs. 22.96°, respectively). However, a key finding emerged when comparing the t-test results for persistent and non-persistent snow groomer-eroded landforms. The results showed no statistically significant difference in either circularity or mean slope between these two groups.
This suggests that a snow groomer-eroded landform’s persistence is not primarily determined by its shape or the slope on which it is located. Instead, the study indicates that the long-term presence of these landforms is more closely tied to the grooming activity itself. This suggests that a snow groomer-eroded landform’s persistence is not primarily determined by its shape or the slope on which it is located. This is crucial, as the relatively shallow landforms formed by snow groomers often preserve the organic topsoil horizon. The areas with a remaning organic layer can regenerate faster than areas where erosion removed it and exposed the mineral soil [28,62].
Despite the potential for faster regeneration, the landforms’ long-term presence is undermined by the continuous, annual nature of grooming. This repeated disturbance prevents natural recovery from fully stabilising the landforms over time, especially along the most frequent groomer routes, which can be identified by the constant presence of these landforms. While snow groomers follow an established driving pattern during routine maintenance, it is also significantly influenced by dynamic weather conditions. More intensive grooming operations are required during periods of intensive snowfall, snowmelt, or when there is a lack of snow cover.

4.2. Volumetric Changes: Contrasting Long-Term Trends with a High-Intensity Event

The volumetric analysis provides valuable insights into the distinct dynamics of the two landform types by comparing a long-term period with a short, high-intensity event. Over the long-term period from 2012 to 2023, both natural and snow groomer-eroded landforms showed a slight volume change, suggesting relative stability. The small magnitude of net changes can be influenced by the higher measurement error (±0.309 m3), which could mask some minor changes.
In the period of 2012–2023, snow groomer-eroded areas showed a small net erosion of −2.070 ± 0.309 m3 and mean lowering of −0.088 m. This small, long-term erosion is probably caused by grooming, which occurs repeatedly and often in the same areas.
Natural landforms exhibited a net volume change of +8.196 ± 0.309 m3, with depositional processes outweighing erosion (normalised volume of +0.004 m). This long-term deposition included high-intensity rainfall years. However, it indicates that natural landforms are dynamic systems where erosional events are cyclically balanced by subsequent deposition. The material displaced by secular processes, such as aeolian erosion and transport, rockfall, or nivation, is often deposited and stabilised by vegetation on the landforms’ edges in this area [54,63,64,65], contributing to this positive long-term trend.
The analysis of the 2019–2020 period presents a significantly different picture. This single year, characterised by the highest rainfall event in the study, was dominated by intensive erosional processes for both landform types. The ALS surveys from 2019 and 2020 had identical parameters, and the DoD analysis yielded a much lower measurement error (±0.092 m3). Consequently, the volumetric results from this period offer a higher degree of confidence and provide a stronger basis for our conclusions.
During this time, natural landforms experienced a vast net volume change, showing erosion of −163.651 ± 0.092 m3 and mean lowering of −0.045 m. Intensive erosion was also observed on the snow groomer-eroded landforms, though to a lesser extent, demonstrating a net erosion of −33.765 ± 0.092 m3 (normalised volume of −0.025 m).
The significant difference in erosion—with natural landforms eroding almost five times more than snow groomer-eroded landforms—directly connects these volumetric changes to their morphometry. This difference in volume of erosion confirms that while both landform types are susceptible to natural processes, groomed forms are simply less vulnerable.
The differences in morphometry—their location on gentler slopes and their relatively smaller size and more circular shape—are linked to a reduced potential for severe water erosion. The longer, naturally shaped landforms on steeper gradients provide good conditions for water to gain erosive velocity, which explains why they erode more. In contrast, the more circular and smaller snow groomer-eroded areas are situated on gentler slopes, which limits their susceptibility to intense water erosion.
In the context of landform persistence and the volumetric analysis results, the frequency of the driving factors leading to landform development is considered. Our analysis showed intense short-term erosion on both landform types. However, long-term trends revealed deposition on natural landforms versus erosion on snow groomer-eroded landforms.
While natural processes like rainfall, freeze–thaw cycles, and snowmelt are highly variable and unpredictable from year to year, snow grooming is a constant annual activity. Grooming occurs regularly throughout the winter season, although its frequency and duration can vary depending on snow cover and other operational factors. This makes the erosion caused by grooming a predictable, recurring event, in contrast to the sporadic nature of high-intensity natural drivers. This predictability, along with the fact that it occurs along the same routes, causes some of the snow groomer-eroded landforms to persist throughout the study period, despite their lower susceptibility to erosion.
The 2019–2020 period, in addition to high rainfall, was also characterised by special circumstances related to snow grooming, which may have reduced the erosion of groomed landforms during this time. The ski season on Kasprowy Wierch, which typically lasts until the end of April, was prematurely ended on 13 March 2020, due to the COVID-19 pandemic restrictions. This shortened the snow grooming period by over a month, significantly reducing the total time of human impact for that year. However, despite this decrease in snow grooming activity, the natural rainfall event that occurred during this period still resulted in a massive erosional impact.

4.3. The Morphological Impact of Snow Grooming and Artificial Snowmaking

Previous research has noted that snow groomers contribute to the destruction of vegetation, soil compaction, and soil stripping [21,66]. Our study quantifies the erosional impact of snow grooming in a unique location—the Kasprowy Wierch ski resort. This resort is exceptional because it is the only one in the Polish Carpathians that does not use artificial snowmaking or earthworks to reshape hillslopes. This provided us with a unique opportunity to isolate and analyse the impacts of snow groomers and natural processes alone.
Quantitative studies of erosion on and around ski runs consistently show that the most significant changes are driven by artificial snowmaking. For instance, research conducted in Białka Tatrzańska on a ski run that was 1040 m long and 75 m wide (approximately 7.8 ha) revealed that erosion caused by meltwater from artificial snow led to a lowering of a ski run escarpment by 0.5 m over six years [18]. The same study also documented the formation of an alluvial fan composed of material from the ski run, reaching a height of 0.31 m and a surface area of 360 m2 [18]. In this study, erosion also occurred on the ski run, but the area of these changes was not specified. The effects of meltwater from artificial snow can be even more severe in the valley network surrounding the ski runs. In a neighbouring catchment in Białka Tatrzańska [24], erosion in stream channels reached a maximum lowering of 2.6 m over a 41-m length, with an average lowering of 0.5 m over a 240-m section over six years. The channels transformed by drainage from ski runs had a total length of 916 m [24].
In contrast, in our study, the erosion caused by snow groomers on the hillslopes reached a maximum of −0.47 m over 11 years. In terms of area, the total surface occupied by snow groomer-eroded landforms in our study, located on a skiable area of 68 ha, ranged from 1762.3 m2 to 2122.7 m2, with permanent landforms accounting for 815 m2. This comparison suggests that while the scale of erosion caused by snow groomers is significant in an alpine area without snowmaking, it is relatively small—especially in terms of the affected area—when compared to the far more extensive impacts of artificial snowmaking.

4.4. Limitations of the Method and Future Research Perspectives

While our methodology provides significant quantitative results, we acknowledge certain limitations that should be considered when interpreting the data. These limitations are particularly related to elevation error and the manual vectorization of RGB orthophotos.
The method’s error may arise from varying hillslope gradients. Our error estimation, based on a single RMSE value, is appropriate for landforms with a mean slope of 19.86°. As a single, universal threshold was used, it may lead to an underestimation of changes on lower slopes, where the error is likely smaller, and an overestimation on slopes steeper than 19.86°, where the error is likely higher. In this study, we aimed to obtain a universal, average, and representative elevation error value for the entire area from the selected reference surfaces. Perhaps in future studies, it would be worthwhile to adjust the elevation error to specific landforms by designating reference surfaces for specific slope intervals.
When manually identifying landforms based on the orthophoto, a limitation of the method is the recognition of landform boundaries. This error results from the available resolution and the subjectivity of visual interpretation. We could not use an automatic classification because the colours and shapes of vegetation and stone runs were too similar to the erosional landforms we were studying. The future availability of near-infrared (NIR) orthophotos could enable the use of automatic classification, which would significantly increase the precision of the results compared to those obtained from RGB orthophotos [67]. Alternative solutions could be very precise RGB orthophotos obtained from a UAV (unmanned aerial vehicle, drone) with RTK-GNSS, which would ensure the high accuracy of shapes and boundaries for both manual and automatic vectorization.
The methodology presented in this study could be applied to future research on the impact of artificial snowmaking on channels and hillslope morphology, a topic of significant importance in the context of ski infrastructure. Our approach, which calculates error from sloped surfaces and uses reference surfaces across various parts of a catchment, offers a way to enhance the precision of calculated results. Compared to our previous studies that relied on a limited number of individual reference points [18,24], this approach provides a more robust and reliable basis for analysis.
From a broader perspective, we believe our methodology could also be useful for analysing other important issues. For example, studying changes in the morphology of natural forms in alpine meadows from a broader spatial perspective in the Tatra Mountains or other alpine regions could demonstrate an increase in their activity due to climate change, primarily through increased rainfall or the melting of glaciers in glaciated mountains [28,46,68,69]. Given the high pressure on the hillslopes in Tatra National Park from hiking tourism, this methodology could also be useful for monitoring erosion on hiking trails [51,70]. The use of increasingly available data from UAVs, especially from LiDAR UAVs with RTK-GNSS, in monitoring geomorphological changes, would significantly increase the precision of results, allowing for the estimation of changes with an accuracy of a few centimetres or even below [71,72,73,74].

5. Conclusions

Our study provides the first quantitative assessment of the impact of snow grooming on erosional processes and alpine hillslope morphology in a unique environment: a ski resort without artificial snowmaking. Our main conclusions are as follows:
  • Morphometry and Persistence: Natural landforms are found on steeper slopes and have a more elongated shape (mean slope 26.8°, circularity 0.47), while snow groomer-eroded landforms are located on gentler slopes and are more circular (mean slope 23.4°, circularity 0.67). The study found that natural landforms are more persistent; in contrast, the long-term presence of groomer-eroded landforms is a direct consequence of ongoing annual grooming, rather than being determined by their shape or slope.
  • Volumetric Dynamics: In the long term (2012–2023), natural landforms exhibited slight net deposition, while groomer-eroded forms showed gradual and consistent erosion. The most significant differences were revealed during the extreme rainfall event of 2020: erosion on natural landforms was nearly five times greater than on groomer-eroded forms.
  • Linking Erosion to Morphometry: The lower susceptibility of groomer-eroded landforms to erosion during high-intensity rainfall is related to their morphometric characteristics. Their circular shape and location on gentler slopes are linked to a reduced potential for severe erosion.
  • Grooming vs. Artificial Snowmaking Impact: While snow grooming causes consistent, predictable erosion, its scale is relatively small when compared to the erosion caused by artificial snowmaking. The maximum erosion on slopes in our study was −0.47 m over 11 years, whereas in resorts with snowmaking, erosion reached −0.5 m in 6 years on ski slope escarpments and up to −2.6 m in stream channels. This highlights that the water volume from artificial snow is the dominant erosional factor, which is crucial for the planning of ski infrastructure, especially within protected areas.
  • Methodological Limitations and Future Research: We acknowledge the methodological limitations of our study, particularly concerning the use of a single, universal elevation error derived from a mean slope, which may lead to the underestimation or overestimation of changes on landforms with different gradients. We also highlight the inherent subjectivity of manual landform vectorization. Despite these limitations, our methodology provides a robust and reliable basis for this unique study and could serve as a foundation for future research. Future studies could employ more advanced methods, such as utilising spatially distributed error models or integrating high-resolution UAV-based LiDAR data, to achieve even greater precision in quantifying geomorphological changes.
This study’s findings are particularly relevant for managing protected areas like Tatra National Park. While our results show that natural processes can cause more intense, high-magnitude erosion, these phenomena and the resulting landforms are considered fundamental components of the natural landscape’s evolution and are thus protected. In sharp contrast, snow groomers introduce an alien, anthropogenic factor to this alpine hillslope environment. Despite causing relatively less severe erosion, this damage is constant and predictable, systematically disrupting natural ecological succession. Therefore, while both natural and human-induced erosion occur, the primary focus in national parks must be on monitoring, mitigating, and ultimately eliminating the impact of anthropogenic factors. The findings of this study thus have direct implications for land managers, policymakers, and decision-makers, who must prohibit the development of new ski infrastructure—especially that involving artificial snowmaking—to preserve the natural character and dynamics of the protected landscape.

Supplementary Materials

The following supporting information can be downloaded at: https://www.mdpi.com/article/10.3390/land14091870/s1, Figure S1: Full precipitation data with daily precipitation for the entire study period of 2012–2023; Figure S2: Localisation of reference areas (1-4) for error analysis; Table S1: Slope parameters of reference areas for error analysis.

Author Contributions

Conceptualization, D.P. and K.K.; methodology, D.P.; validation, D.P.; formal analysis, D.P.; investigation, D.P.; resources, D.P.; data curation, D.P.; writing—original draft preparation, D.P.; writing—review and editing, D.P.; visualisation, D.P.; supervision, D.P. and K.K.; project administration, D.P.; funding acquisition, D.P. All authors have read and agreed to the published version of the manuscript.

Funding

The study was supported by the National Science Centre, Poland, within project PRELUDIUM 19, grant number 2020/37/N/ST10/02550.

Data Availability Statement

The dataset will be available upon request from the corresponding author due to sharing and nature protection policies of the data provider, Tatra National Park.

Acknowledgments

The data used in this study (orthophotos and point clouds from airborne laser scanning during 2019 and 2020) were acquired as part of the project entitled “Inventory and assessment of the state of natural resources in the Tatra National Park using modern remote sensing technologies” (original title: „Inwentaryzacja i ocena stanu zasobów przyrodniczych w Tatrzańskim Parku Narodowym przy wykorzystaniu nowoczesnych technologii teledetekcyjnych”) (no. POIS.02.04.00-00-00-0010/18). The project was implemented under the Operational Programme Infrastructure and Environment 2014–2020, Priority Axis II: Environmental protection, including adaptation to climate change, Activity 2.4: Nature protection and ecological education. The authors would like to thank Waldemar Piątek, the father of Dawid Piątek, for his invaluable assistance during fieldwork and for his helpful insights during the discussions.

Conflicts of Interest

The authors declare no conflicts of interest.

References

  1. Elsasser, H.; Messerli, P. The vulnerability of the snow industry in the Swiss Alps. Mt. Res. Dev. 2001, 21, 335–339. [Google Scholar] [CrossRef]
  2. Krzesiwo, K. Rozwój i Funkcjonowanie Stacji Narciarskich w Polskich Karpatach. Ph.D. Thesis, Jagiellonian University, Cracow, Poland, 2014. [Google Scholar]
  3. Krzesiwo, K. Ocena sytuacji rozwojowej i funkcjonalnej stacji narciarskich—Przykład polskich Karpat. Pr. Kom. Geogr. Przem. Pol. Tow. Geogr. 2021, 35, 259–276. [Google Scholar] [CrossRef]
  4. Steiger, R.; Scott, D.; Abegg, B.; Pons, M.; Aall, C. A critical review of climate change risk for ski tourism. Curr. Issues Tour. 2017, 22, 1343–1379. [Google Scholar] [CrossRef]
  5. Vanat, L. 2022 International Report on Snow & Mountain Tourism. Overview of the Key Industry Figures for Ski Resorts. Available online: https://de.cdn-website.com/64e34689550d402aa147af5bbc27524d/files/uploaded/RM-world-report-2022.pdf (accessed on 1 August 2025).
  6. Willibald, F.; Kotlarski, S.; Ebner, P.P.; Bavay, M.; Marty, C.; Trentini, F.V.; Grêt-Regamey, A. Vulnerability of ski tourism towards internal climate variability and climate change in the Swiss Alps. Sci. Total Environ. 2021, 784, 147054. [Google Scholar] [CrossRef] [PubMed]
  7. Piątek, D.; Krzemień, K.; Gołąb, A. Warunki występowania erozji w obszarze stacji narciarskich w Karpatach Polskich. Landf. Anal. 2022, 41, 17–31. [Google Scholar] [CrossRef]
  8. Mosimann, T. Geo-ecological impacts of ski piste construction in the Swiss Alps. Appl. Geogr. 1985, 5, 29–37. [Google Scholar] [CrossRef]
  9. Tsuyuzaki, S. Environmental deterioration resulting from ski-resort construction in Japan. Environ. Conserv. 1994, 21, 121–125. [Google Scholar] [CrossRef]
  10. Ries, J.B. Landscape damage by skiing at the Schauinsland in the Black Forest, Germany. Mt. Res. Dev. 1996, 16, 27–40. [Google Scholar] [CrossRef]
  11. Keller, T.; Pielmeier, C.; Rixen, C.; Gadient, F.; Gustafsson, D.; Stähli, M. Impact of artificial snow and ski-slope grooming on snowpack properties and soil thermal regime in a sub-alpine ski area. Ann. Glaciol. 2004, 38, 314–318. [Google Scholar] [CrossRef]
  12. Wipf, S.; Rixen, C.; Fischer, M.; Schmid, B.; Stoeckli, V. Effects of ski piste preparation on alpine vegetation. J. Appl. Ecol. 2005, 42, 306–316. [Google Scholar] [CrossRef]
  13. Barni, E.; Freppaz, M.; Siniscalco, C. Interactions between vegetation, roots, and soil stability in restored high-altitude ski runs in the Alps. Arct. Antarct. Alp. Res. 2007, 39, 25–33. [Google Scholar] [CrossRef]
  14. Ruth-Balaganskaya, E.; Myllynen-Malinen, K. Soil nutrient status and revegetation practices of downhill skiing areas in Finnish Lapland—A case study of Mt. Ylläs. Landsc. Urban Plan. 2000, 50, 259–268. [Google Scholar] [CrossRef]
  15. Ristić, R.; Kašanin-Grubin, M.; Radić, B.; Nikić, Z.; Vasiljević, N. Land degradation at the Stara Planina ski resort. Environ. Manag. 2012, 49, 580–592. [Google Scholar] [CrossRef] [PubMed]
  16. Fidelus-Orzechowska, J.; Wrońska-Wałach, D.; Cebulski, J.; Żelazny, M. Effect of the construction of ski runs on changes in relief in a mountain catchment (Inner Carpathians, Southern Poland). Sci. Total Environ. 2018, 630, 1298–1308. [Google Scholar] [CrossRef] [PubMed]
  17. Furdada, G.; Victoriano, A.; Diez-Herrero, A.; Génova, M.; Guinau, M.; de Las Heras, A.; Palau, R.; Hürlimann, M.; Khazaradze, G.; Casas, J.; et al. Flood consequences of land-use changes at a ski resort: Overcoming a geomorphological threshold (Portainé, eastern Pyrenees, Iberian Peninsula). Water 2020, 12, 368. [Google Scholar] [CrossRef]
  18. Piątek, D.; Bernatek-Jakiel, A. How does ski infrastructure change soil erosion processes on hillslope? Land Degrad. Dev. 2024, 35, 3378–3391. [Google Scholar] [CrossRef]
  19. Łajczak, A.; Michalik, S.; Witkowski, Z. Wpływ narciarstwa i turystyki pieszej na przyrodę masywu Pilska. Studia Naturae 1996, 41, 253. Available online: https://www.iop.krakow.pl/artykuly_1_548.html?wydawnictwo_id=208 (accessed on 1 September 2025).
  20. Krzemień, K. Morfologiczne skutki gospodarki turystycznej w obszarze wysokogórskim na przykładzie masywu les Monts Dore (Francja). In Geografia, Człowiek, Gospodarka; Domański, B., Ed.; IG UJ: Cracow, Poland, 1997; pp. 277–286. [Google Scholar]
  21. Roux-Fouillet, P.; Wipf, S.; Rixen, C. Long-term impacts of ski piste management on alpine vegetation and soils. J. Appl. Ecol. 2011, 48, 906–915. [Google Scholar] [CrossRef]
  22. Bacchiocchi, S.C.; Zerbe, S.; Cavieres, L.A.; Wellstein, C. Impact of ski piste management on mountain grassland ecosystems in the Southern Alps. Sci. Total Environ. 2019, 665, 959–967. [Google Scholar] [CrossRef]
  23. Wrońska-Wałach, D.; Cebulski, J.; Fidelus-Orzechowska, J.; Żelazny, M. Impact of ski run construction on atypical channel head development. Sci. Total Environ. 2019, 692, 791–805. [Google Scholar] [CrossRef]
  24. Piątek, D.; Gołąb, A.; Wrońska-Wałach, D. Changes in erosion processes and morphology of step-pool channels in the ski resort with artificial snowmaking, an example from Gubałowskie foothills. Quaest. Geogr. 2025, 44, 151–156. [Google Scholar] [CrossRef]
  25. David, G.C.; Bledsoe, B.P.; Merritt, D.M.; Wohl, E. The impacts of ski slope development on stream channel morphology in the White River National Forest, Colorado, USA. Geomorphology 2009, 103, 375–388. [Google Scholar] [CrossRef]
  26. Zieher, T.; Perzl, F.; Rössel, M.; Rutzinger, M.; Meißl, G.; Markart, G.; Geitner, C. A multi-annual landslide inventory for the assessment of shallow landslide susceptibility–Two test cases in Vorarlberg, Austria. Geomorphology 2016, 259, 40–54. [Google Scholar] [CrossRef]
  27. Zweifel, L.; Meusburger, K.; Alewell, C. Spatio-temporal pattern of soil degradation in a Swiss Alpine grassland catchment. Remote Sens. Environ. 2019, 235, 111441. [Google Scholar] [CrossRef]
  28. Geitner, C.; Mayr, A.; Rutzinger, M.; Löbmann, M.T.; Tonin, R.; Zerbe, S.; Kohl, B. Shallow erosion on grassland slopes in the European Alps–Geomorphological classification, spatio-temporal analysis, and understanding snow and vegetation impacts. Geomorphology 2021, 373, 107446. [Google Scholar] [CrossRef]
  29. Mayr, A.; Bremer, M.; Rutzinger, M.; Geitner, C. Unmanned aerial vehicle laser scanning for erosion monitoring in alpine grassland. ISPRS Ann. Photogramm. Remote Sens. Spat. Inf. Sci. 2019, 4, 405–412. [Google Scholar] [CrossRef]
  30. Wheaton, J.M.; Brasington, J.; Darby, S.E.; Sear, D.A. Accounting for uncertainty in DEMs from repeat topographic surveys: Improved sediment budgets. Earth Surf. Process. Landf. 2010, 35, 136–156. [Google Scholar] [CrossRef]
  31. Blasone, G.; Cavalli, M.; Marchi, L.; Cazorzi, F. Monitoring sediment source areas in a debris-flow catchment using terrestrial laser scanning. Catena 2014, 123, 23–36. [Google Scholar] [CrossRef]
  32. Okyay, U.; Telling, J.; Glennie, C.L.; Dietrich, W.E. Airborne lidar change detection: An overview of earth sciences applications. Earth-Sci. Rev. 2019, 198, 102929. [Google Scholar] [CrossRef]
  33. Cavalli, M.; Goldin, B.; Comiti, F.; Brardinoni, F.; Marchi, L. Assessment of erosion and deposition in steep mountain basins by differencing sequential digital terrain models. Geomorphology 2017, 291, 4–16. [Google Scholar] [CrossRef]
  34. Bull, J.M.; Miller, H.; Gravley, D.M.; Costello, D.; Hikuroa, D.C.H.; Dix, J.K. Assessing debris flows using LIDAR differencing: 18 may 2005 Matata event, New Zealand. Geomorphology 2010, 124, 75–84. [Google Scholar] [CrossRef]
  35. Burns, W.J.; Coe, J.A.; Kaya, B.S.; Ma, L. Analysis of elevation changes detected from multi-temporal LiDAR surveys in forested landslide terrain in western Oregon. Environ. Eng. Geosci. 2010, 16, 315–341. [Google Scholar] [CrossRef]
  36. Pawłuszek, K.; Borkowski, A. Automatic landslides mapping in the principal component domain. In Advancing Culture of Living with Landslides; Mikoš, M., Vilímek, V., Yin, Y., Sassa, K., Eds.; Springer: Cham, Switzerland, 2017; Volume 2017, pp. 421–428. [Google Scholar] [CrossRef]
  37. Pye, K.; Blott, S.J. Assessment of beach and dune erosion and accretion using LiDAR: Impact of the stormy 2013–14 winter and longer term trends on the Sefton Coast, UK. Geomorphology 2016, 266, 146–167. [Google Scholar] [CrossRef]
  38. Richter, A.; Faust, D.; Maas, H.G. Dune cliff erosion and beach width change at the northern and southern spits of Sylt detected with multi-temporal Lidar. Catena 2013, 103, 103–111. [Google Scholar] [CrossRef]
  39. Winowski, M.; Tylkowski, J.; Hojan, M. Assessment of moraine cliff spatio-temporal erosion on Wolin Island using ALS data analysis. Remote Sens. 2022, 14, 3115. [Google Scholar] [CrossRef]
  40. Woolard, J.W.; Colby, J.D. Spatial characterization, resolution, and volumetric change of coastal dunes usingairborne LIDAR: Cape Hatteras, North Carolina. Geomorphology 2002, 48, 269–287. [Google Scholar] [CrossRef]
  41. Rączkowska, Z.; Kotarba, A. Dolina Suchej Wody w Tatrach: Środowisko i Jego Współczesne Przemiany; IGiPZ PAN: Cracow, Poland, 2014; Volume 239. [Google Scholar]
  42. Giaccone, E.; Luoto, M.; Vittoz, P.; Guisan, A.; Mariéthoz, G.; Lambiel, C. Influence of microclimate and geomorphological factors on alpine vegetation in the Western Swiss Alps. Earth Surf. Process. Landf. 2019, 44, 3093–3107. [Google Scholar] [CrossRef]
  43. Thorn, C.E.; Hall, K. Nivation and cryoplanation: The case for scrutiny and integration. Prog. Phys. Geogr. 2002, 26, 533–550. [Google Scholar] [CrossRef]
  44. Luckman, B.H. The geomorphic activity of snow avalanches. Geogr. Ann. Ser. A Phys. Geogr. 1977, 59, 31–48. [Google Scholar] [CrossRef]
  45. Durlević, U.; Valjarević, A.; Novković, I.; Ćurčić, N.B.; Smiljić, M.; Morar, C.; Stoica, A.; Barišić, D.; Lukić, T. GIS-based spatial modeling of snow avalanches using analytic Hierarchy process. a case study of the Šar Mountains, Serbia. Atmosphere 2022, 13, 1229. [Google Scholar] [CrossRef]
  46. Żmudzka, E. Współczesne zmiany klimatu wysokogórskiej części Tatr. Pr. Stud. Geogr. 2011, 47, 217–226. [Google Scholar]
  47. Rączkowska, Z.; Długosz, M.; Gądek, B.; Grabiec, M.; Kaczka, R.J.; Rojan, E. Uwarunkowania przyrodnicze, skutki i zmiany aktywności lawin śnieżnych w Tatrach. In Nauka Tatrom, Tom I—Nauki o Ziemi; TPN: Zakopane, Poland, 2015. [Google Scholar]
  48. Douglas, G.R. Magnitude frequency study of rockfall in Co. Antrim, N. Ireland. Earth Surf. Process. 1980, 5, 123–129. [Google Scholar] [CrossRef]
  49. Hall, K.; Thorn, C.E.; Matsuoka, N.; Prick, A. Weathering in cold regions: Some thoughts and perspectives. Prog. Phys. Geogr. 2002, 26, 577–603. [Google Scholar] [CrossRef]
  50. Zielonka, A.; Wrońska-Wałach, D. Can we distinguish meteorological conditions associated with rockfall activity using dendrochronological analysis?-An example from the Tatra Mountains (Southern Poland). Sci. Total Environ. 2019, 662, 422–433. [Google Scholar] [CrossRef] [PubMed]
  51. Fidelus-Orzechowska, J.; Sitarz, M.; Król, M. Change Patterns between 1993 and 2023 and Effects of COVID-19 on Tourist Traffic in Tatra National Park (Poland). Land 2024, 13, 516. [Google Scholar] [CrossRef]
  52. Szczegółowa Mapa Geologiczna Tatr 1:10000. Mapa. Państwowy Instytut Geologiczny: Warszawa, Poland. 2020. Available online: https://cbdgportal.pgi.gov.pl/smgt/ (accessed on 1 August 2025).
  53. Kozłowska, A.; Rączkowska, Z. Badania geoekologiczne w otoczeniu Kasprowego Wierchu. Wprowadzenie. In Badania Geoekologiczne w Otoczeniu Kasprowego Wierchu; Kotarba, A., Kozłowska, A., Eds.; Wydawnictwo Continuo: Katowice, Poland, 1999; pp. 9–16. [Google Scholar]
  54. Rączkowska, Z. Rzeźba stoków w otoczeniu Kasprowego Wierchu. In Badania Geoekologiczne w Otoczeniu Kasprowego Wierchu; Kotarba, A., Kozłowska, A., Eds.; Wydawnictwo Continuo: Katowice, Poland, 1999; pp. 17–24. [Google Scholar]
  55. Skiba, S.; Koreń, M.; Drewnik, M.; Kukla, J. Soils. In Atlas of the Tatra Mts; Dąbrowska, K., Guzik, M., Eds.; Wydawnictwo TPN: Zakopane, Poland, 2015; pp. 23–31. [Google Scholar]
  56. Ustrnul, Z.; Walawender, E.; Czekierda, D.; Štástný, P.; Lapin, M.; Mikulová, K. Precipitation and snow cover. In Atlas of the Tatra Mts; Dąbrowska, K., Guzik, M., Eds.; Wydawnictwo TPN: Zakopane, Poland, 2015; pp. 32–45. [Google Scholar]
  57. Hess, M. Klimat. In Przyroda Tatrzańskiego Parku Narodowego, Tatry i Podtatrze 3; Mirek, Z., Głowaciński, Z., Klimek, K., Piękoś-Mirkowa, H., Eds.; Wydawnictwo TPN: Zakopane, Poland, 1996; pp. 53–68. [Google Scholar]
  58. ASPRS. ASPRS LAS Specification; Report; ASPRS: Bethesda, MD, USA, 2008; Available online: https://www.asprs.org/a/society/committees/standards/asprs_las_format_v12.pdf (accessed on 1 August 2025).
  59. Buckley, S.J.; Mitchell, H.L. Integration, validation and point spacing optimisation of digital elevation models. Photogramm. Rec. 2004, 19, 277–295. [Google Scholar] [CrossRef]
  60. Höhle, J.; Höhle, M. Accuracy assessment of digital elevation models by means of robust statistical methods. ISPRS J. Photogramm. Remote Sens. 2009, 64, 398–406. [Google Scholar] [CrossRef]
  61. Wiegand, C.; Geitner, C. Investigations into the distribution and diversity of shallow eroded areas on steep grasslands in Tyrol (Austria). Erdkunde 2013, 67, 325–343. [Google Scholar] [CrossRef]
  62. Chambers, J.C.; MacMahon, J.A.; Brown, R.W. Alpine seedling establishment: The influence of disturbance type. Ecology 1990, 71, 1323–1341. [Google Scholar] [CrossRef]
  63. Kłapa, M. Procesy morfogenetyczne i ich związek z sezonowymi zmianami pogody w otoczeniu Hali Gąsienicowej w Tatrach (Morphogenetic processes and their connection with seasonal weather changes in the Tatra Mountains). Dok. Geogr. 1980, 4, 55. [Google Scholar]
  64. Izmaiłow, B. Rola wiatru w modelowaniu wysokogórskiej partii Tatr w rejonie Doliny Gąsienicowej. Zesz. Nauk. UJ Prace Geogr. 1986, 64, 121–164. [Google Scholar]
  65. Kotarba, A. Współczesne procesy rzeźbotwórcze. In Przyroda Tatrzańskiego Parku Narodowego; Mirek, Z., Ed.; TPN: Zakopane, Poland, 1996; pp. 125–138. [Google Scholar]
  66. Łajczak, A. Wpływ narciarstwa i turystyki pieszej na erozję gleby w obszarze podszczytowym Pilska. Stud. Nat. 1996, 41, 131–159. [Google Scholar]
  67. Ayhan, B.; Kwan, C.; Budavari, B.; Kwan, L.; Lu, Y.; Perez, D.; Vlachos, M. Vegetation detection using deep learning and conventional methods. Remote Sens. 2020, 12, 2502. [Google Scholar] [CrossRef]
  68. Jomelli, V.; Pavlova, I.; Utasse, M.; Chenet, M.; Grancher, D.; Brunstein, D.; Leone, F. Are Debris Floods and Debris Avalanches Responding Univocally to Recent Climatic Change–A Case Study in the French Alps. In Climatic Change: Geophysical Foundations and Ecological Effects; Blanco, J., Kheradmand, H., Eds.; InTech: London, UK, 2011; pp. 423–444. [Google Scholar]
  69. Clague, J.; Huggel, C.; Korup, O.; Mcguire, B. Climate Change and Hazardous Processes in High Mountains. Rev. Asoc. Geol. Argent. 2012, 69, 328–338. [Google Scholar]
  70. Fidelus-Orzechowska, J.; Gorczyca, E.; Bukowski, M.; Krzemień, K. Degradation of a protected mountain area by tourist traffic: Case study of the Tatra National Park, Poland. J. Mt. Sci. 2021, 18, 2503–2519. [Google Scholar] [CrossRef]
  71. Gkiatas, G.T.; Koutalakis, P.D.; Kasapidis, I.K.; Iakovoglou, V.; Zaimes, G.N. Monitoring and Quantifying the Fluvio-Geomorphological Changes in a Torrent Channel Using Images from Unmanned Aerial Vehicles. Hydrology 2022, 9, 184. [Google Scholar] [CrossRef]
  72. Śledź, S.; Ewertowski, M.W.; Piekarczyk, J. Applications of unmanned aerial vehicle (UAV) surveys and Structure from Motion photogrammetry in glacial and periglacial geomorphology. Geomorphology 2021, 378, 107620. [Google Scholar] [CrossRef]
  73. Li, W.; Li, P.; Yan, L.; Hu, J.; Wang, L.; Li, D.; Zhao, G. Impacts of spatial resolutions of UAV-LiDAR-derived DEMs on erosion modelling in the hilly and gully Loess Plateau. Catena 2025, 255, 109059. [Google Scholar] [CrossRef]
  74. Lei, Q.; Wang, X.; Liu, Y.; Guo, J.; Cai, T.; Xia, X. Monitoring Change and Recovery of an Embayed Beach in Response to Typhoon Storms Using UAV LiDAR. Drones 2024, 8, 172. [Google Scholar] [CrossRef]
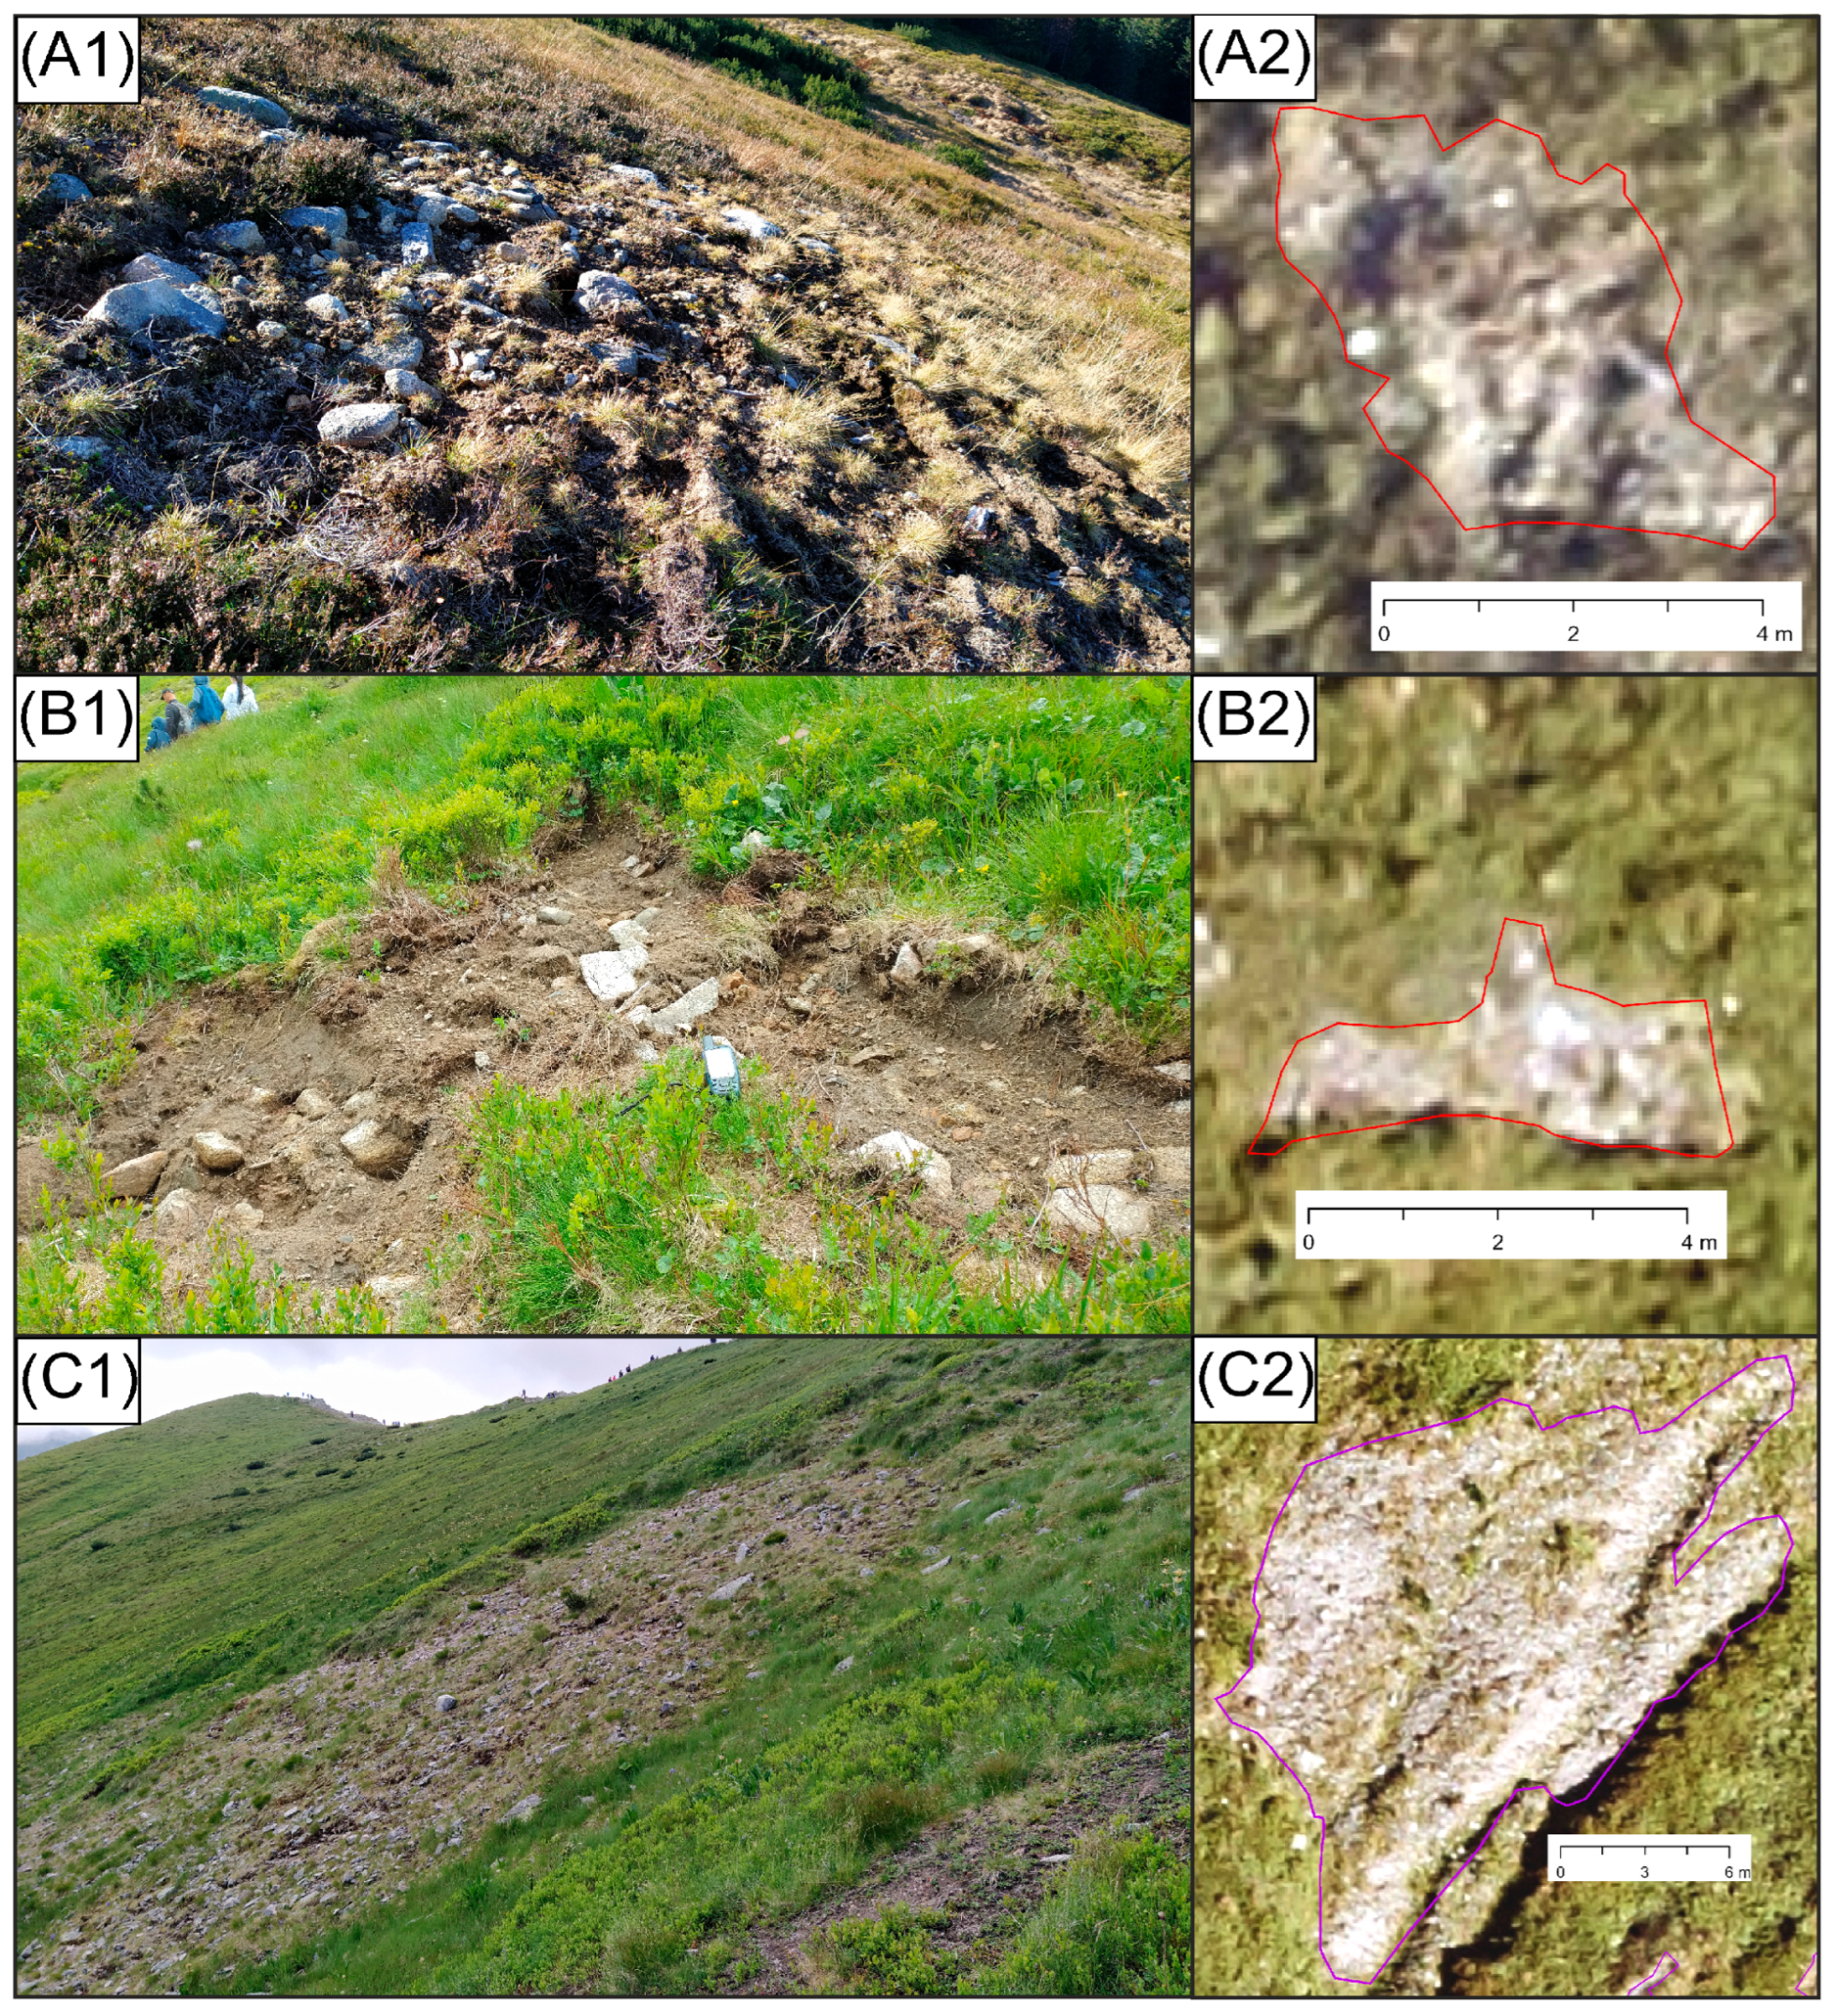
Figure 2. Examples of landforms identified in the research area and on the orthophoto (2023). (A1,B1)—snow groomer-eroded area in the field; (A2,B2)—orthophoto images of the same groomer-eroded landforms. (C1)—natural landform, shallow landslide along debris flow track; (C2)—the corresponding landform depicted on the orthophoto.
Land 14 01870 g002
Table 1. Sources and resolution parameters of used orthophotos.
OrthophotoSourceAcquisition DateVertical Error (m)Vertical Coordinate System
2012Tatra National Park2012-08-190.2PL-KRON86-NH
2019Tatra National Park2019-09-27,
2019-10-01
0.12PL-KRON86-NH
2020Tatra National Park2020-08-21,
2020-08-22
0.2PL-KRON86-NH
2023Head Office of Geodesy and Cartography in Poland2023-09-060.05PL-EVRF2007-NH
Table 2. Sources and parameters of used DEMs.
DEMSourceAcquisition DateScannerPoint Density (Points per m2)Horizontal Resolution (m)Vertical Resolution from Receiver Specification (m)Vertical Coordinate System
2012ALS point cloud from the Head Office of Geodesy and Cartography in Poland2012-08-19Riegl LMS-Q680910.07 to 0.15PL-KRON86-NH
2019ALS point cloud from Tatra National Park2019-10-14,
2019-10-15
Riegl VQ-780II2710.04PL-KRON86-NH
2020ALS point cloud from Tatra National Park2020-07-30,
2020-08-01
Riegl VQ-780II2710.04PL-KRON86-NH
2023ALS point cloud from the Head Office of Geodesy and Cartography in Poland2023-09-06Riegl VQ-1560 II S1210.1PL-EVRF2007-NH
Table 3. DEM of Difference (DoD) error analyses.
DoDME (m)SDE (m)RMSE (m)RMSE at 95% Confidence (m)
2012–2023−0.0580.1460.1570.309
2019–20200.009 0.046 0.0470.092
Table 4. Morphometric characteristics of identified landforms in analysed years.
YearLandform TypeCountTotal Area (m2)Mean Area (m2)Max. Area (m2)Mean CircularitySD CircularityMean Slope (°)Max. Slope (°)
2012Natural803981.3149.77399.400.490.2027.1036.44
Snow Groomer-Eroded1902122.7111.17147.510.620.1722.9042.88
2019Natural813551.6243.85371.400.490.2027.0836.70
Snow Groomer-Eroded1951617.698.30131.210.630.1823.8441.15
2020Natural893780.8942.64390.650.460.2026.0336.59
Snow Groomer-Eroded2161833.538.49139.260.610.1823.6841.15
2023Natural783452.1044.26371.880.440.1926.8036.98
Snow Groomer-Eroded2481762.257.11109.400.590.1923.0142.88
Table 5. Morphometric characteristics of persistent landforms throughout the study period.
Landform TypeCountTotal Area (m2)Mean Area (m2)Max. Area (m2)Mean CircularityMean Slope (°)
Natural683189.5346.91355.960.4527.89
Snow Groomer-Eroded118816.156.9270.600.5922.96
Table 6. Results of an independent t-test comparing the morphometric characteristics of persistent natural and snow groomer-eroded landforms.
VariableGroup of LandformsMeanStd. Dev.t-Statisticdfp-Value
Slope (°)Natural27.895.19−4.949183<0.000001
Snow Groomer-Eroded22.967.14
CircularityNatural0.460.205.641184<0.000001
Snow Groomer-Eroded0.610.18
Table 7. Results of an independent t-test comparing the morphometric characteristics of persistent and non-persistent snow groomer-eroded landforms.
VariableGroup of LandformsMeanStd. Dev.t-Statisticdfp-Value
Slope (°)Non-Persistent23.177.290.266500<0.790249
Persistent22.967.14
CircularityNon-Persistent0.620.191.413500<0.158351
Persistent0.590.15
Table 8. Volumetric changes in natural and snow groomer-eroded landforms based on DoD analysis across two observation periods (2012–2023 and 2019–2020).
PeriodLandform TypeCountTotal Area (m2)Volume (m3)Normalised Volume (m3/m2)
LandformsEroding LandformsDeposition LandformsUnchanged LandformsLandforms at the End of PeriodChanged LandformsEroding LandformsDeposition LandformsTotal Net ChangeTotal ErosionTotal DepositionTotalErosionDeposition
2012–2023Natural78120573452.102140.8452.24332088.60+8.196 ± 0.309−0.828 ± 0.309+9.024 ± 0.309+0.004−0.016+0.004
Snow Groomer-Eroded24811192181762.25415.8372.22341.59−2.070 ± 0.309−6.363 ± 0.309+4.292 ± 0.309−0.005−0.088+0.013
2019–2020Natural89672203780.893654.573647.576.99−163.651 ± 0.092−163.676 ± 0.092+0.025 ± 0.092−0.045−0.045+0.004
Snow Groomer-Eroded21611241001833.531347.851300.9846.87−33.765 ± 0.092−33.884 ± 0.092+0.119 ± 0.092−0.025−0.026+0.003
Disclaimer/Publisher’s Note: The statements, opinions and data contained in all publications are solely those of the individual author(s) and contributor(s) and not of MDPI and/or the editor(s). MDPI and/or the editor(s) disclaim responsibility for any injury to people or property resulting from any ideas, methods, instructions or products referred to in the content.