Article

A Methodological Approach to the Restoration of a Rural Street Using Affordable Digital Technologies

by
Donat Karzhauov
,
Viera Paganová
* and
Ľuboš Moravčík
Institute of Landscape Architecture, Faculty of Horticulture and Landscape Engineering, Slovak University of Agriculture, 949 76 Nitra, Slovakia
*
Author to whom correspondence should be addressed.
Land 2025, 14(9), 1790; https://doi.org/10.3390/land14091790
Submission received: 18 July 2025 / Revised: 28 August 2025 / Accepted: 29 August 2025 / Published: 2 September 2025
(This article belongs to the Special Issue Integrating Spatial Analysis into Sustainable Urban Planning)

Abstract

Accurate spatial data is essential for the effective planning and restoration of rural streets, which are linear elements within settlements. This study evaluates the applicability of digital street models to landscape architecture, focusing on the precision and efficiency of three data acquisition methods: terrestrial laser scanning (TLS), aerial photogrammetry using an unmanned aerial vehicle (UAV), and close-range photogrammetry (CRP) using a smartphone. TLS was used as the reference method due to its high local geometric accuracy, while UAV and CRP were assessed as low-cost alternatives. We conducted field data collection, digital model processing, and a comparative analysis of accuracy, cost, and time requirements. TLS achieved high precision, with 85% of measured points within ±0.5 cm; however, it produced data gaps due to scanning obstacles. UAV-derived models demonstrated 93% agreement with TLS and offered more complete coverage, making it a more efficient option for overall mapping. CRP models showed only 34% compliance with TLS but provided superior texture detail. However, their limited geometric accuracy and risk of deformation constrain their use in visualizing specific elements. Among the low-cost methods, the UAV is the most suitable for generating models usable in GIS and CAD environments. A combined approach—using a UAV for accurate geometry and CRP for detailed textures—offers a cost-effective strategy for enhancing model quality in landscape architectural applications.

Graphical Abstract

1. Introduction

Landscape mapping and planning focuses on collecting data on its various functions and land use forms. It involves a comprehensive study and representation of landscape characteristics using diverse tools, topographical data, vegetation, and land management practices. By utilizing satellite and aerial imagery, landscape mapping facilitates spatial information visualization and the monitoring of changes over time.
Current technologies and software for spatial data acquisition and processing offer a wide range of solutions. These technologies vary significantly in approach, output quality, cost, and the level of user expertise required. A broad spectrum of geospatial tools—such as smartphones, drones, laser scanners, and public satellite imagery—has become increasingly accessible and promising. Nonetheless, careful selection is essential in order to achieve optimal outcomes and efficiency [1].
Landscape architects employ various 3D data collection techniques to capture objects and sites. Unmanned aerial vehicles (UAVs) have recently emerged as a suitable technology for acquiring data with exceptionally high spatial and temporal resolution, while offering lower costs compared to other remote sensing methods. Landscape architects utilize UAVs as versatile airborne platforms for carrying different sensors and operating photogrammetric software. This approach enables the generation of 3D models at a significantly faster rate than traditional topographic survey methods [2].
Terrestrial laser scanning (TLS) provides precise data, including coordinates, elevation, and RGB values (red, green, blue color data), which can be used to generate 3D models and visualize design concepts. This technology is widely applied in architecture, archeology, and construction, assisting architects and designers in producing maps for reconstruction and building projects [3].
In addition to these methods, photogrammetric techniques based on photographs and video footage can be employed to automatically reconstruct 3D models of landscapes and archeological objects, an approach that reduces processing time and labor costs [4].
Accurate 3D models, particularly from UAV and TLS, can serve as a foundational layer for developing a ‘digital twin’ of the urban environment. Defined as a dynamic digital replica of the physical world, a digital twin enables complex analyses, simulations, and optimizations that are highly relevant to urban planning [5].
Digital twins allow planners to examine complex urban phenomena in a virtual environment, making it easier to spot spatial patterns and correlations that are often hidden. This insight supports more informed and precisely targeted interventions, improving the accuracy of planning decisions. Beyond their analytical role, digital twins serve as virtual test grounds where different scenarios can be explored [6]. They enable simulations of proposed changes in urban design, infrastructure development, and environmental conditions. Such predictive modeling can be tailored to specific demographic groups, helping to uncover barriers to accessibility and equity in service provision. Just as importantly, digital twins foster public engagement through participatory planning. Visualization tools, including virtual reality, allow residents to interact with proposed projects, promoting transparency and collaboration throughout the planning process [7].
These advanced technologies enable landscape architects to acquire precise spatial data, supporting more efficient and creative design processes and enhancing decision-making in landscape planning and maintenance. It is essential for landscape architects to choose solutions that are not only cost- and time-effective but also tailored to the specific needs of each project. Landscapes often include linear features such as rivers, streets, railways, and canals; these are perceived and evaluated as distinct objects due to their elongated form and integration with other natural and artificial elements, making them particularly challenging to assess. River landscapes, for instance, often require advanced tools [8]. These challenges arise from the uneven distribution of elements such as water, vegetation, and built structures, further complicating the analytical process.
When this concept is narrowed down to streets, similar challenges persist, as these also involve dynamic interactions with the urban environment—such as buildings and vegetation—which require specialized approaches to ensure comprehensive assessment and effective data acquisition strategies.
The aim of this study was to investigate selected low-cost methods of acquiring spatial data, comparing them in terms of accuracy, time demand, cost, and the level of expertise required, within the specific context of a linear site such as a rural street. The models generated using these methods were evaluated for their potential use in the rural street revitalization design process, including dimension acquisition and visualization. Professional tools have historically been associated with high costs. However, the rise of open-source software and the capabilities of modern portable devices—such as drones and smartphones—now enable the use of cost-effective methods of acquiring spatial data.
In this study, we focused on evaluating the following hypotheses: (H1) a representative digital model of a linear landscape feature (object) can be obtained using low-cost methods and (H2) models of linear features acquired via such methods can be effectively utilized for further processing in GIS and CAD environments. The aim was to assess both the technical feasibility and practical applicability of such approaches in the context of spatial data acquisition and analysis.
This study contributes to bridging the gap between advanced geospatial data acquisition research and professional landscape architecture practice by demonstrating that low-cost UAV photogrammetry can produce representative 3D models of linear landscape features with sufficient accuracy for integration into GIS and CAD workflows. By evaluating both technical feasibility and practical applicability, this research offers evidence-based guidance on cost-effective, design-ready survey methods that can expand access to high-quality spatial data in landscape architecture projects.

2. Materials and Methods

2.1. Study Area

The cadastral territory of the village of Dražovce is situated on the southwestern slopes of the Tribeč Mountains, with a smaller portion extending into the Danubian Lowland (Figure 1). The village is close to the city of Nitra, located approximately 6.8 km to the northwest. The center of the village is positioned at an elevation of 154 m above sea level, while the elevation across the entire cadastral area ranges from 140 to 187 m above sea level [9].
In this study, spatial data were acquired using laser scanning and photogrammetry, applied through both static and dynamic capture methods. The selection of these techniques is justified by their general availability and classification as low-cost solutions when compared to professional-grade equipment.
  • Terrestrial laser scanning;
  • Aerial photogrammetry;
  • Close-range photogrammetry (CRP).
TLS was selected as the reference method for assessing the accuracy of the other technologies under investigation. It is a high-precision technology that uses laser beams to generate point clouds and 3D models of surfaces or objects with millimeter-level accuracy. Due to its precision and broad range of applications, it serves as the benchmark against which other accessible methods are compared, such as close-range and aerial photogrammetry, which rely on commonly available devices like smartphones and drones.
All examined methods were evaluated in terms of the required skills, time and financial demands, as well as output accuracy, while analyzing the possibilities of integrating available technologies into landscape architecture projects. This approach aims to identify solutions that offer an optimal balance between quality and cost, with the goal of promoting the broader use of digital methods in designing and restoring public spaces.

2.2. Methodological Framework and Selection Criteria

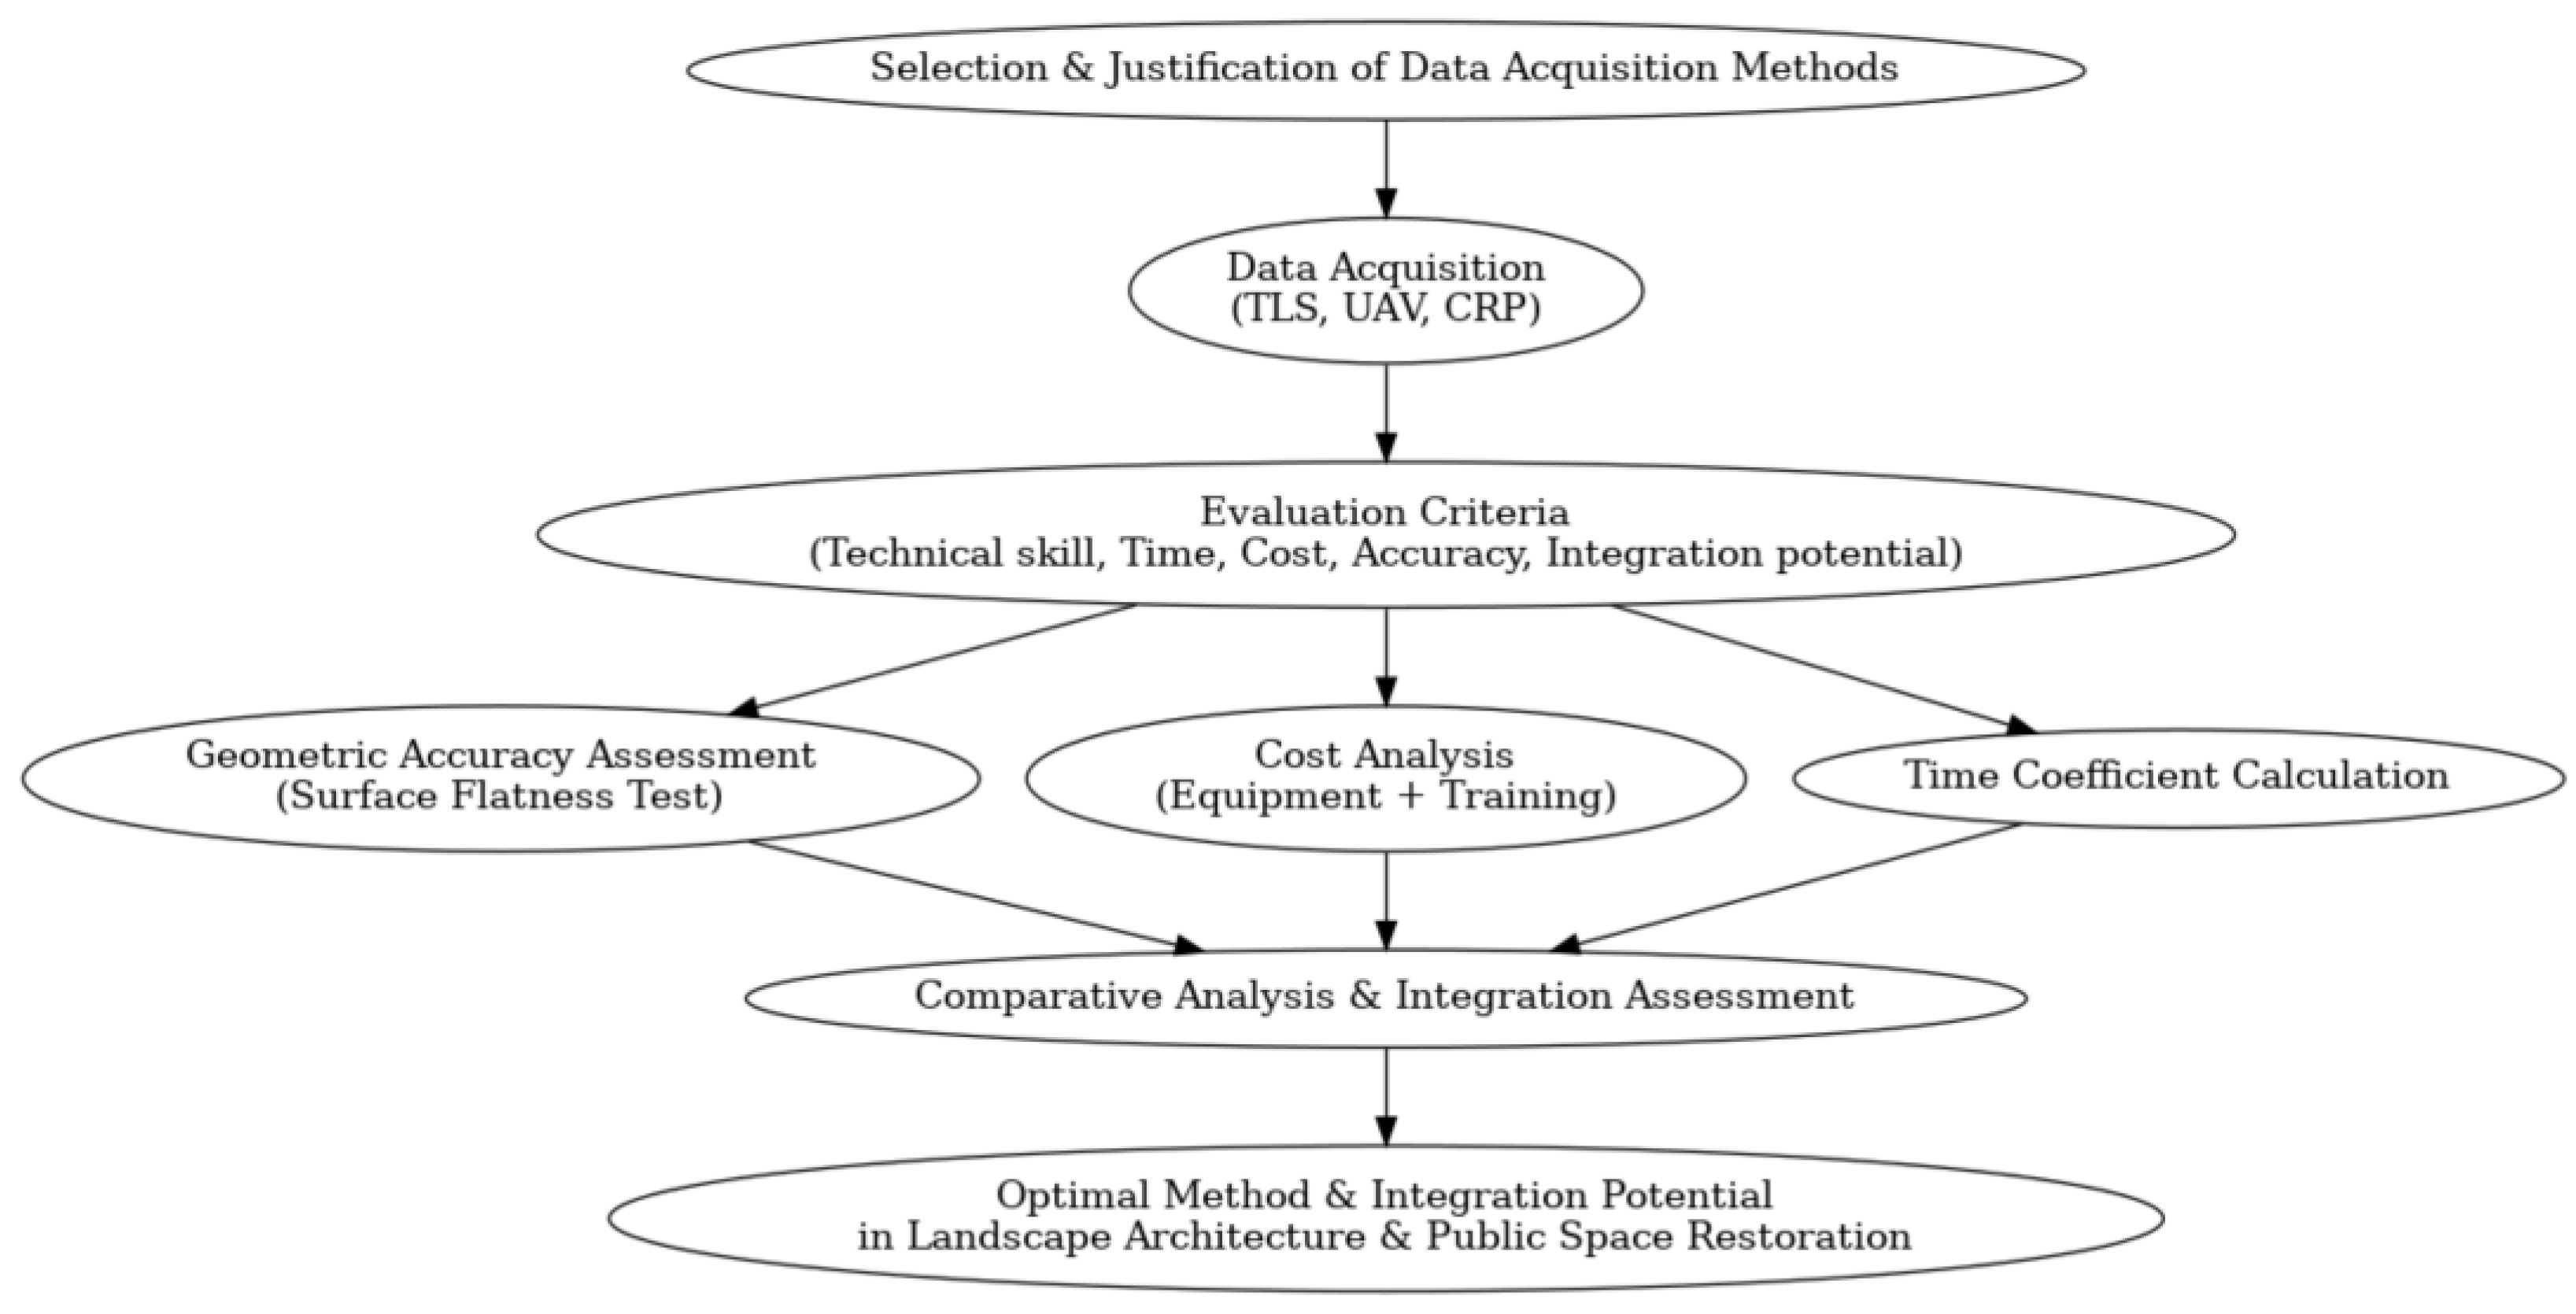
The methodological workflow (Figure 2) for comparing terrestrial laser scanning (TLS), aerial photogrammetry (UAV), and close-range photogrammetry (CRP) follows the following phase sequence: (1) selecting and justifying the data acquisition methods, (2) collecting spatial data for the test object using each method, (3) defining evaluation criteria, (4) performing a geometric accuracy assessment through a surface flatness test, (5) conducting a cost analysis, (6) calculating a time coefficient for standardized comparison, and (7) performing a comparative analysis to determine the optimal balance between cost, accuracy, and integration potential in landscape architecture and public space restoration workflows.
First, we defined the criteria used to select, apply, and compare the data acquisition methods (Table 1). The selection process considered both technical and practical aspects, ensuring that the chosen technologies represented a balanced range of precision, accessibility, and applicability to landscape architecture workflows. The evaluation framework (Figure 2) includes the following:
  • Technical Requirements—level of operator expertise, complexity of use, and necessary training time.
  • Time Efficiency—duration of data capture for a standardized section, allowing fair method comparison.
  • Cost Factors—acquisition and training costs, with market survey and average calculations.
  • Accuracy Assessment—comparison against a high-precision TLS reference through a surface flatness test.
  • Integration Potential—applicability of each method in restoration projects and urban landscape contexts.
Table 1. Technical specifications and performance parameters for the selected TLS and UAV equipment.
CategoryParameterTLS (Terrestrial Laser Scanner) SpecificationUAV (Aerial Photogrammetry) Specification
Performance and AccuracyPositional Accuracy≥3 mm at 50 m±0.1 m (Horizontal/Vertical with RTK)
Linear Error≤1 mmN/A
Angular Accuracy≥8″ (Horizontal and Vertical)N/A
RTK Module AccuracyN/AHorizontal: 1 cm + 1 ppm;
Vertical: 1.5 cm + 1 ppm
Scanning Range≥120 m≥15 km (flight distance)
Scanning Rate≥1,000,000 points/sN/A
Scan Time (full field of view)≤3.5 min (at 3.1 mm/10 m resolution)N/A
Camera and OpticsSensorDual-axis compensator4/3 CMOS, 20 MP
LensN/AFOV ≥ 84°, aperture f/2.8–f/11
Image Resolution≤3.1 mm at 10 m (point density)≥5280 × 3956 pixels
Video ResolutionN/A4K @ 30 fps (H.264)
Operational CharacteristicsWind ResistanceN/A≥12 m/s
Flight TimeN/A≥45 min (no wind)
GNSSN/AGPS + Galileo + BeiDou + GLONASS
StabilizationN/A3-axis gimbal (tilt, roll, pan)
Data and ConnectivitySoftware CompatibilityAutomatic scan registration (e.g., Cyclone), export to CAD/BIMStandard formats (MP4, JPG)
Storage and TransmissionSSD ≥ 256 GB, WLAN, USBU3/Class10/V30, video transmission ≥ 8 km
Safety and ClassificationLaser Safety ClassClass 1 (eye-safe)N/A
Device ClassificationN/AClass C2 (according to EU regulations)
N/A: Not available.
By combining these factors, the chapter provides a transparent and replicable approach for determining the most suitable method under varying project conditions.

2.3. Acquisition Using TLS

Scanner positions were planned before the 3D laser scanning process. This step involved surveying the area, determining the number and locations of scanning stations, and planning the movement routes and scanning parameters.
The goal was to ensure optimal coverage of the entire area and obtain comprehensive and accurate data with the fewest possible scanning stations. Terrain accessibility, vegetation, and potential obstacles that could affect the scanning process were also taken into account (Figure 3).
The 3D laser scanning process was carried out using the Leica ScanStation P20 (Leica Geosystems AG, Heerbrugg, Switzerland) terrestrial laser scanner. This pulse-based TLS scanner from Leica Geosystems enables the rapid acquisition of high-quality data, with a scanning speed of up to one million points per second and a maximum range of 120 m. All visible objects were scanned at a high resolution. The street was scanned at a resolution of 6.3 mm at a distance of 10 m, ensuring detailed capture with maximum accuracy [10].
Scanning path choice was influenced by the need to minimize obstacles such as existing buildings, parked cars, and vegetation, as well as to reduce interference from street traffic. Due to the specific conditions of the site, it was not possible to place reference targets. Therefore, selecting scanner positions in a way that ensured overlapping areas between individual point clouds, allowing for their accurate alignment during post-processing, was essential.

2.3.1. Scan Registration

After the scanning process was completed, the acquired files were exported into Leica Cyclone 3DR software v2025.1.0. Within this environment, we visually aligned (registration) nine point cloud files. A detailed deviation diagram enabled precise optical alignment with an accuracy of less than 20 mm.
The merging process was performed in stages: initially, adjacent point cloud pairs were combined into larger units. These combined clouds were then progressively aligned with each other in the same manner until a complete point cloud was assembled. The final dataset was exported in *.las format.

2.3.2. TLS Data Processing

The TLS-acquired data were processed using the open-source software CloudCompare v2.13.0, which allows efficient handling and analysis of large point clouds.
The processing begins with importing the registered scans into the CloudCompare environment. The software supports a wide range of commonly used point cloud formats, including *.las, which was used in this case.
To facilitate linear feature processing, the point cloud was divided into six smaller segments (Figure 4), an approach that also reduces computational load during viewport visualization.

2.4. Acquisition Using Aerial Photogrammetry

Aerial photogrammetry was conducted using the DJI Mavic 3 Enterprise RTK drone (DJI, Shenzhen, China), which captures georeferenced images using RTK (Real-Time Kinematic) technology. This assists the software in aligning photographs and refining their position within the WGS 84 coordinate system.
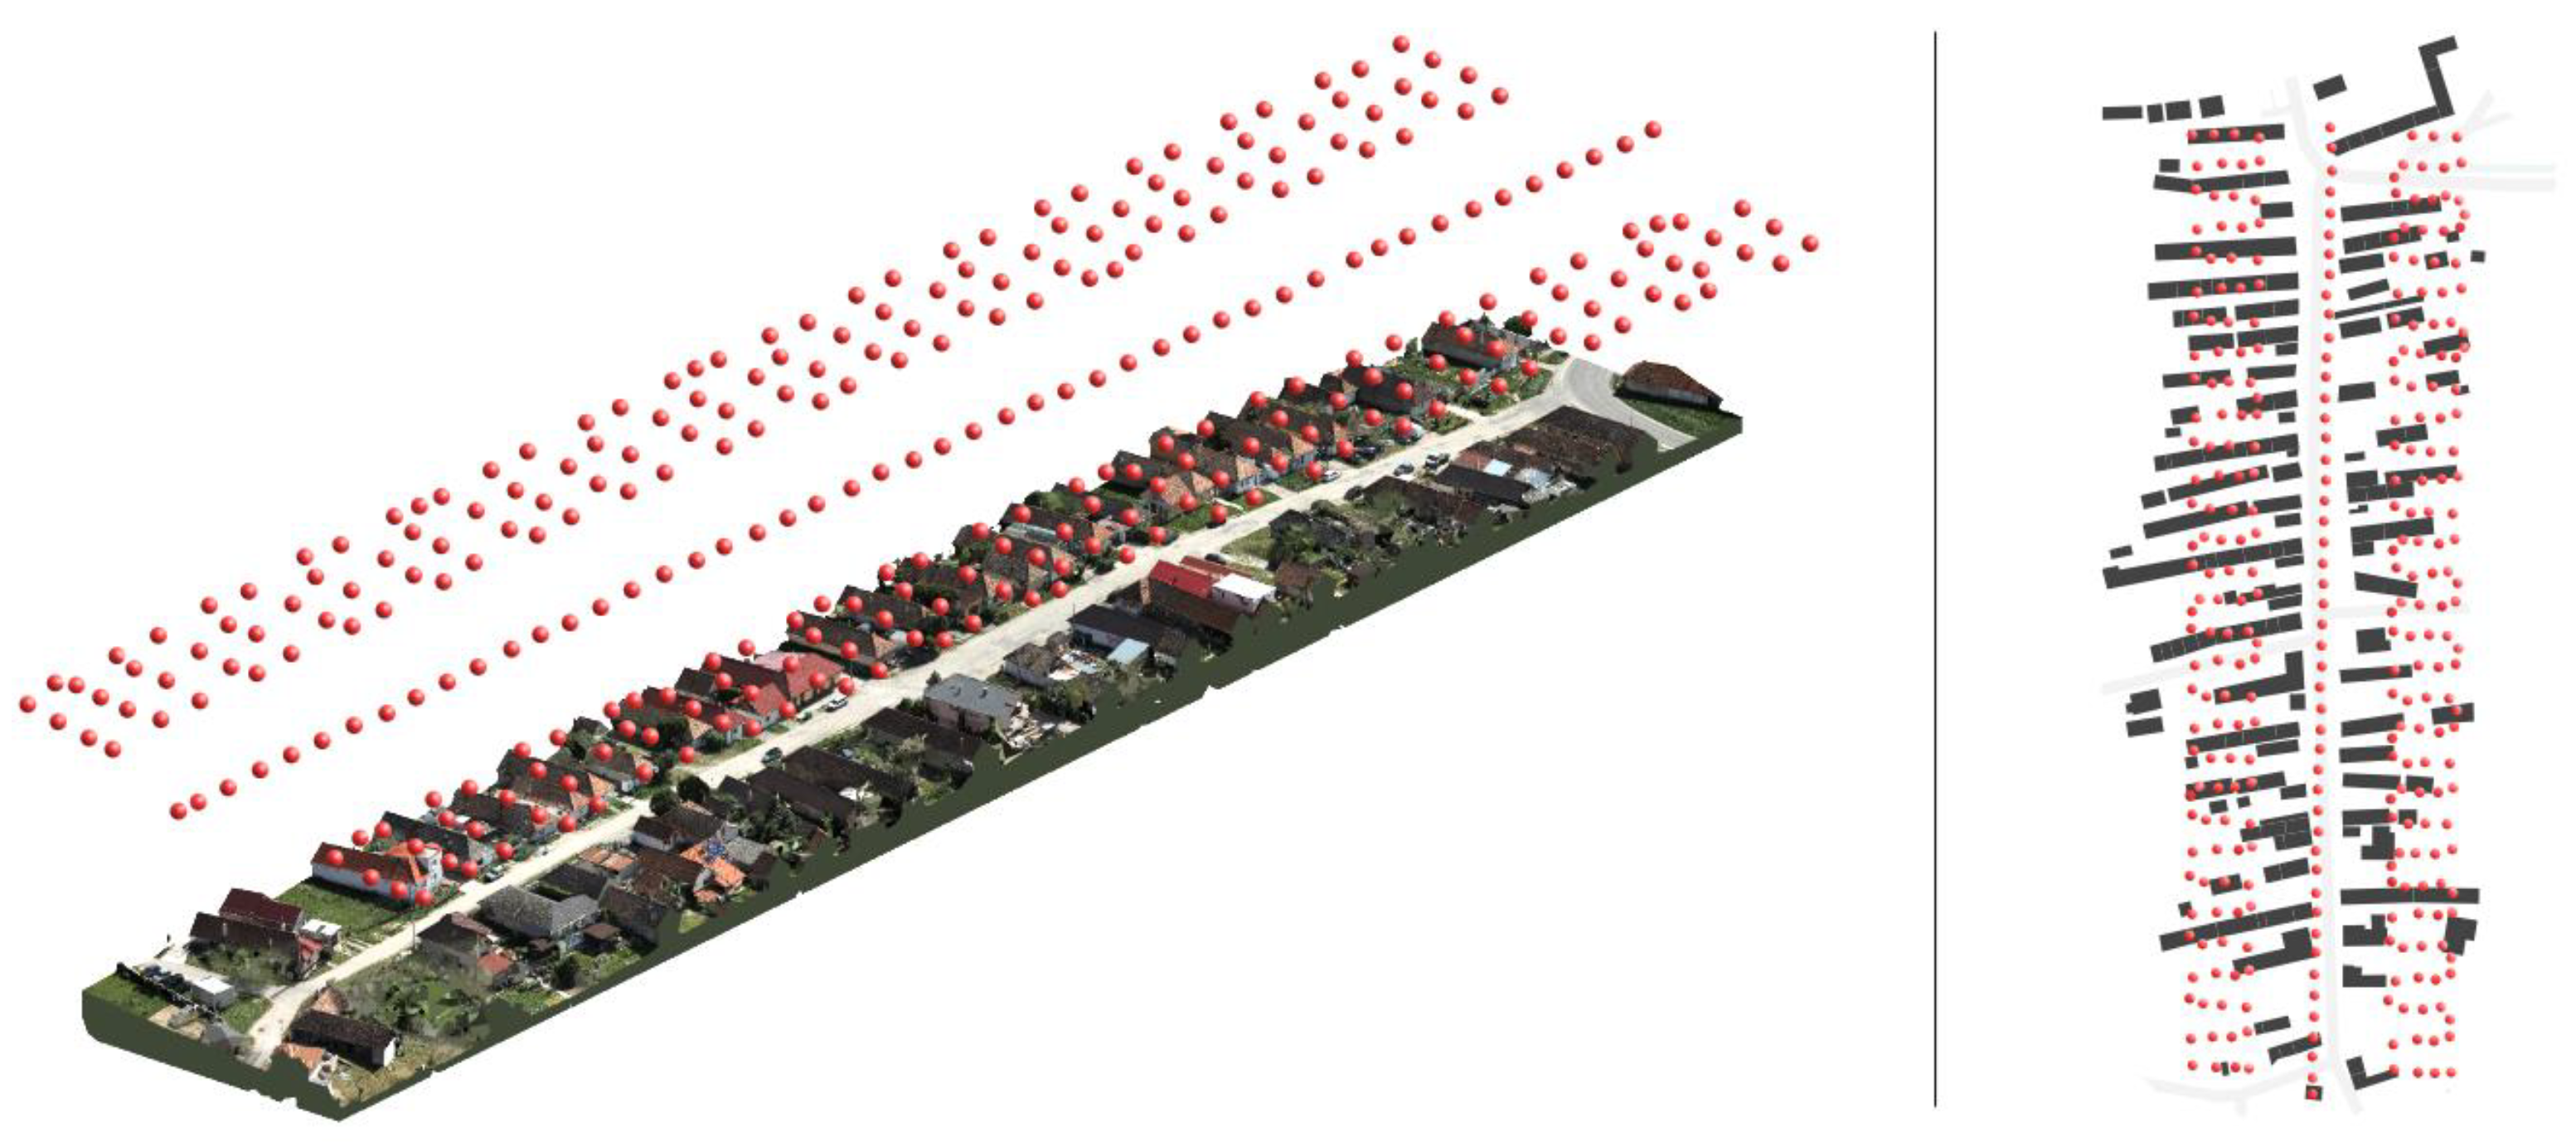
The flight plan was defined in the Pilot software v2.5.1.15 (DJI free), with the goal of covering not only the street itself but also its surroundings. The drone flew at an altitude of 40 m at a speed of 3 m/s, first along a path parallel to the street’s axis and then in a perpendicular direction. It then followed a wave-like trajectory on both sides of the street, with the camera oriented toward its longitudinal axis.
The aerial photogrammetry data were processed using RealityCapture software v1.4 (Figure 5).

2.5. Acquisition Using Close-Range Photogrammetry

In this case, photogrammetric capture was performed using an iPhone 13 mini, equipped with a dual 12 MP camera system: a main camera with an f/1.6 aperture and an ultra-wide camera with an f/2.4 aperture and a 120° field of view. Both cameras were used during capture, with the operator following different movement paths. Video was recorded at a 4K resolution at 24 fps. In line with the capabilities of standard-class mobile devices, resolution was prioritized over image quality.
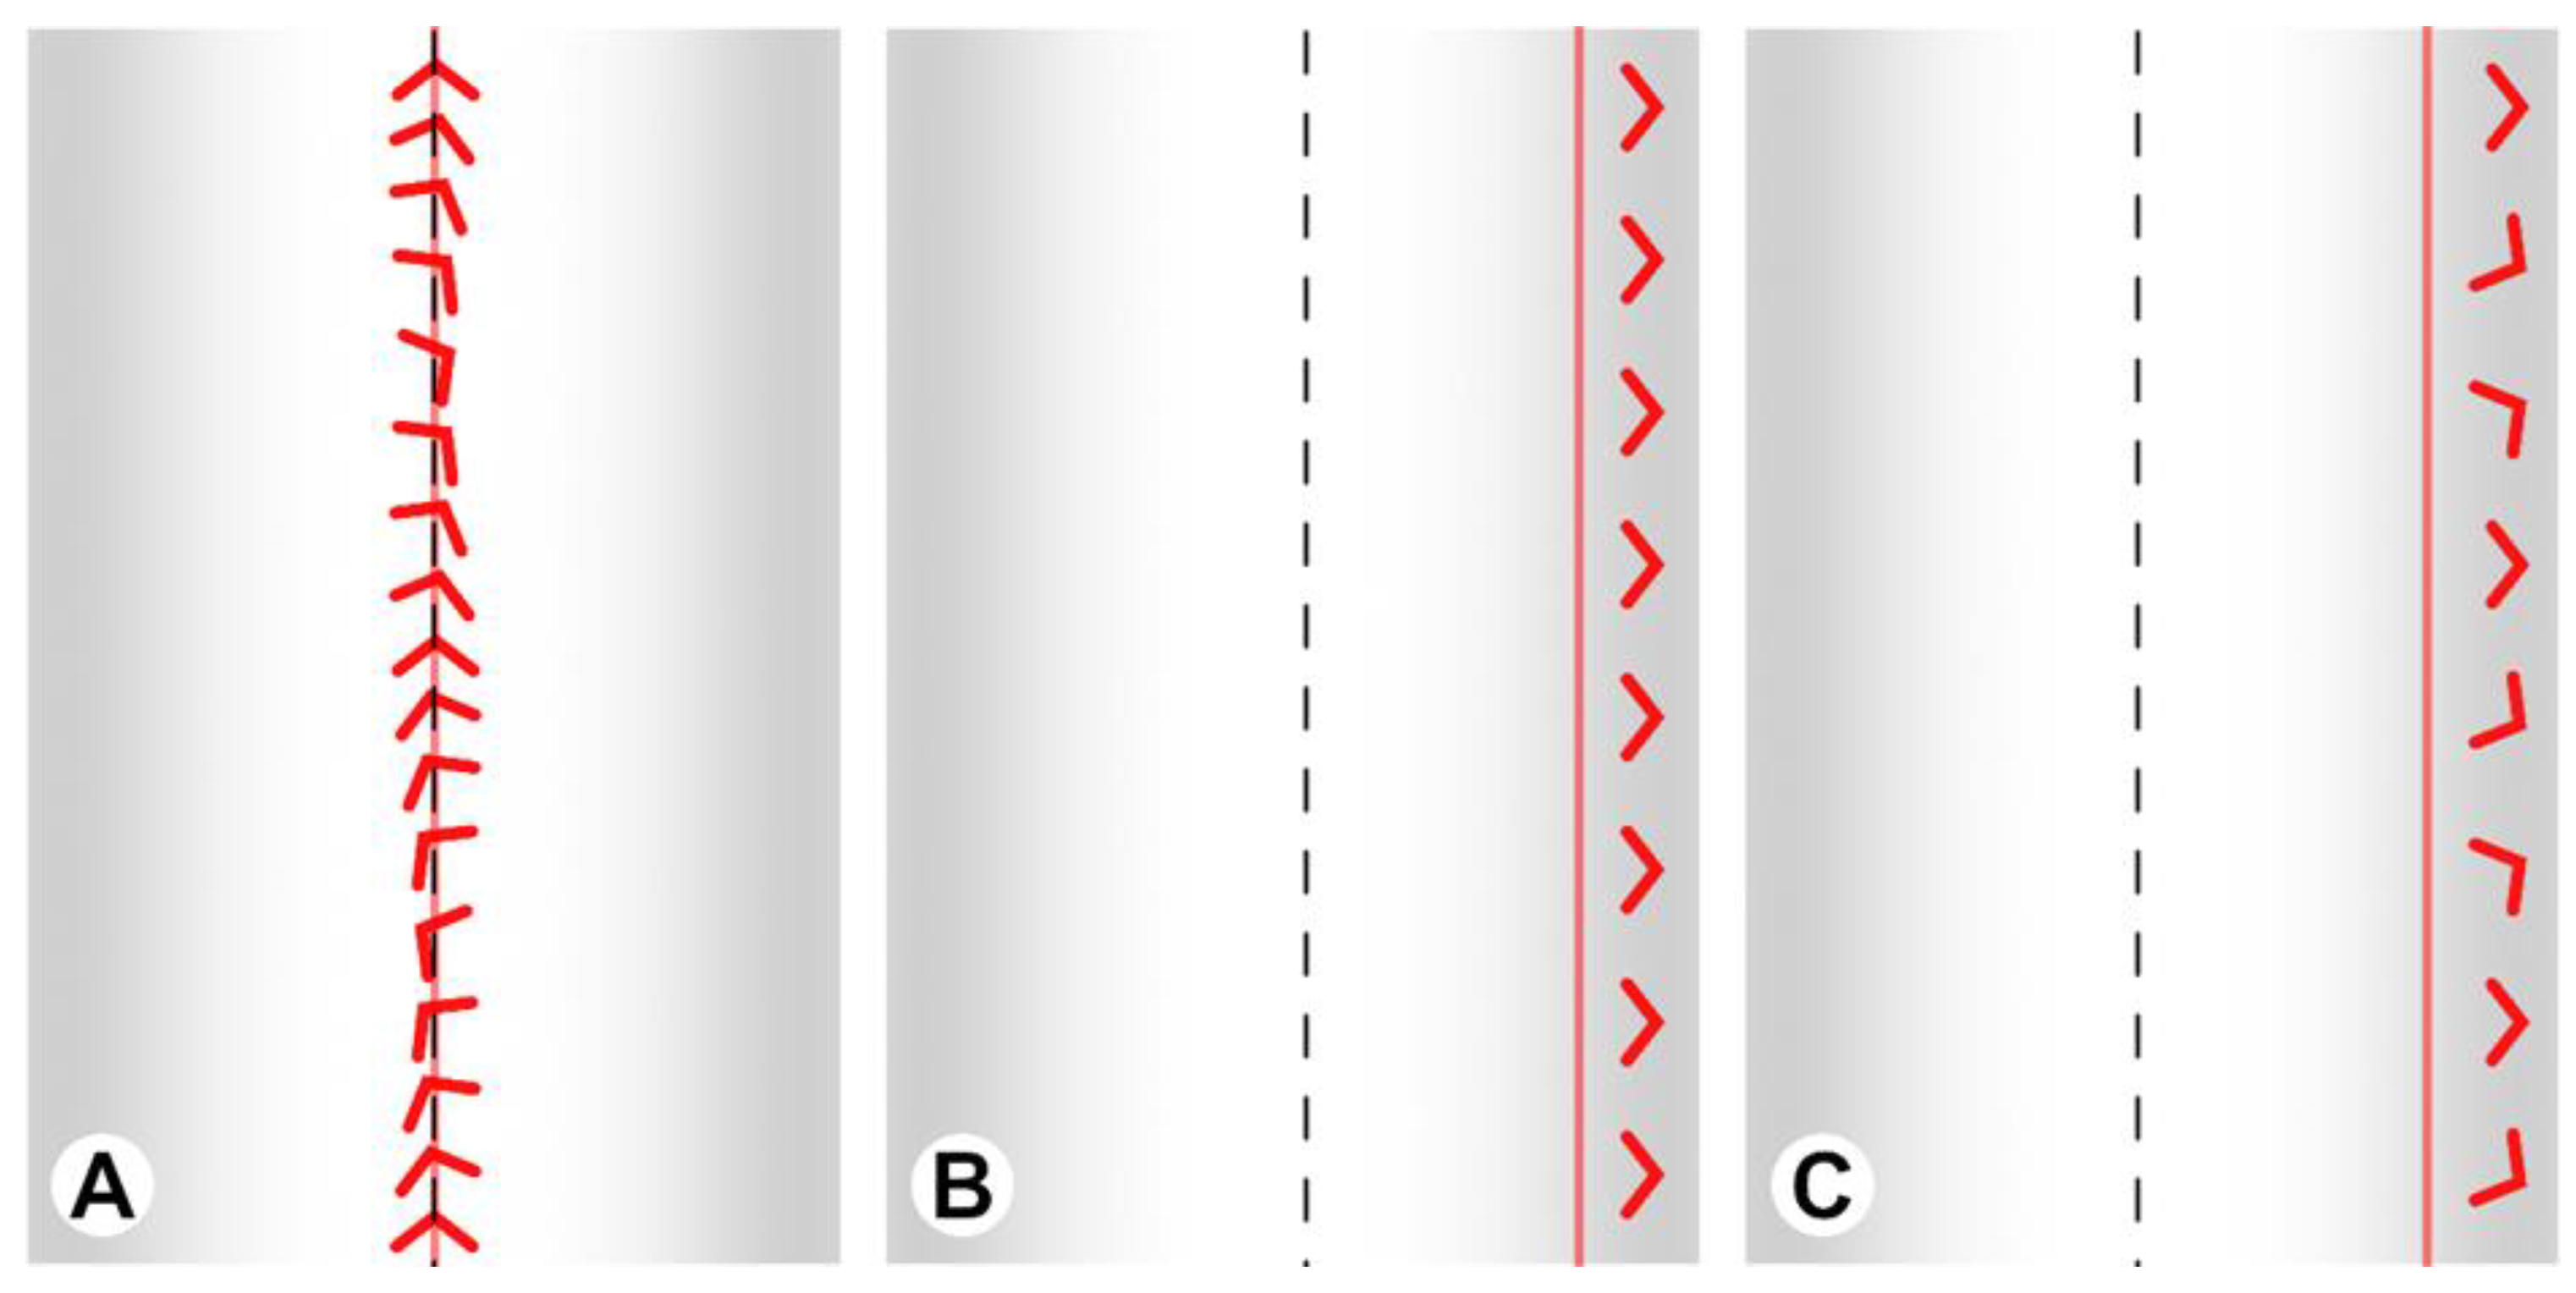
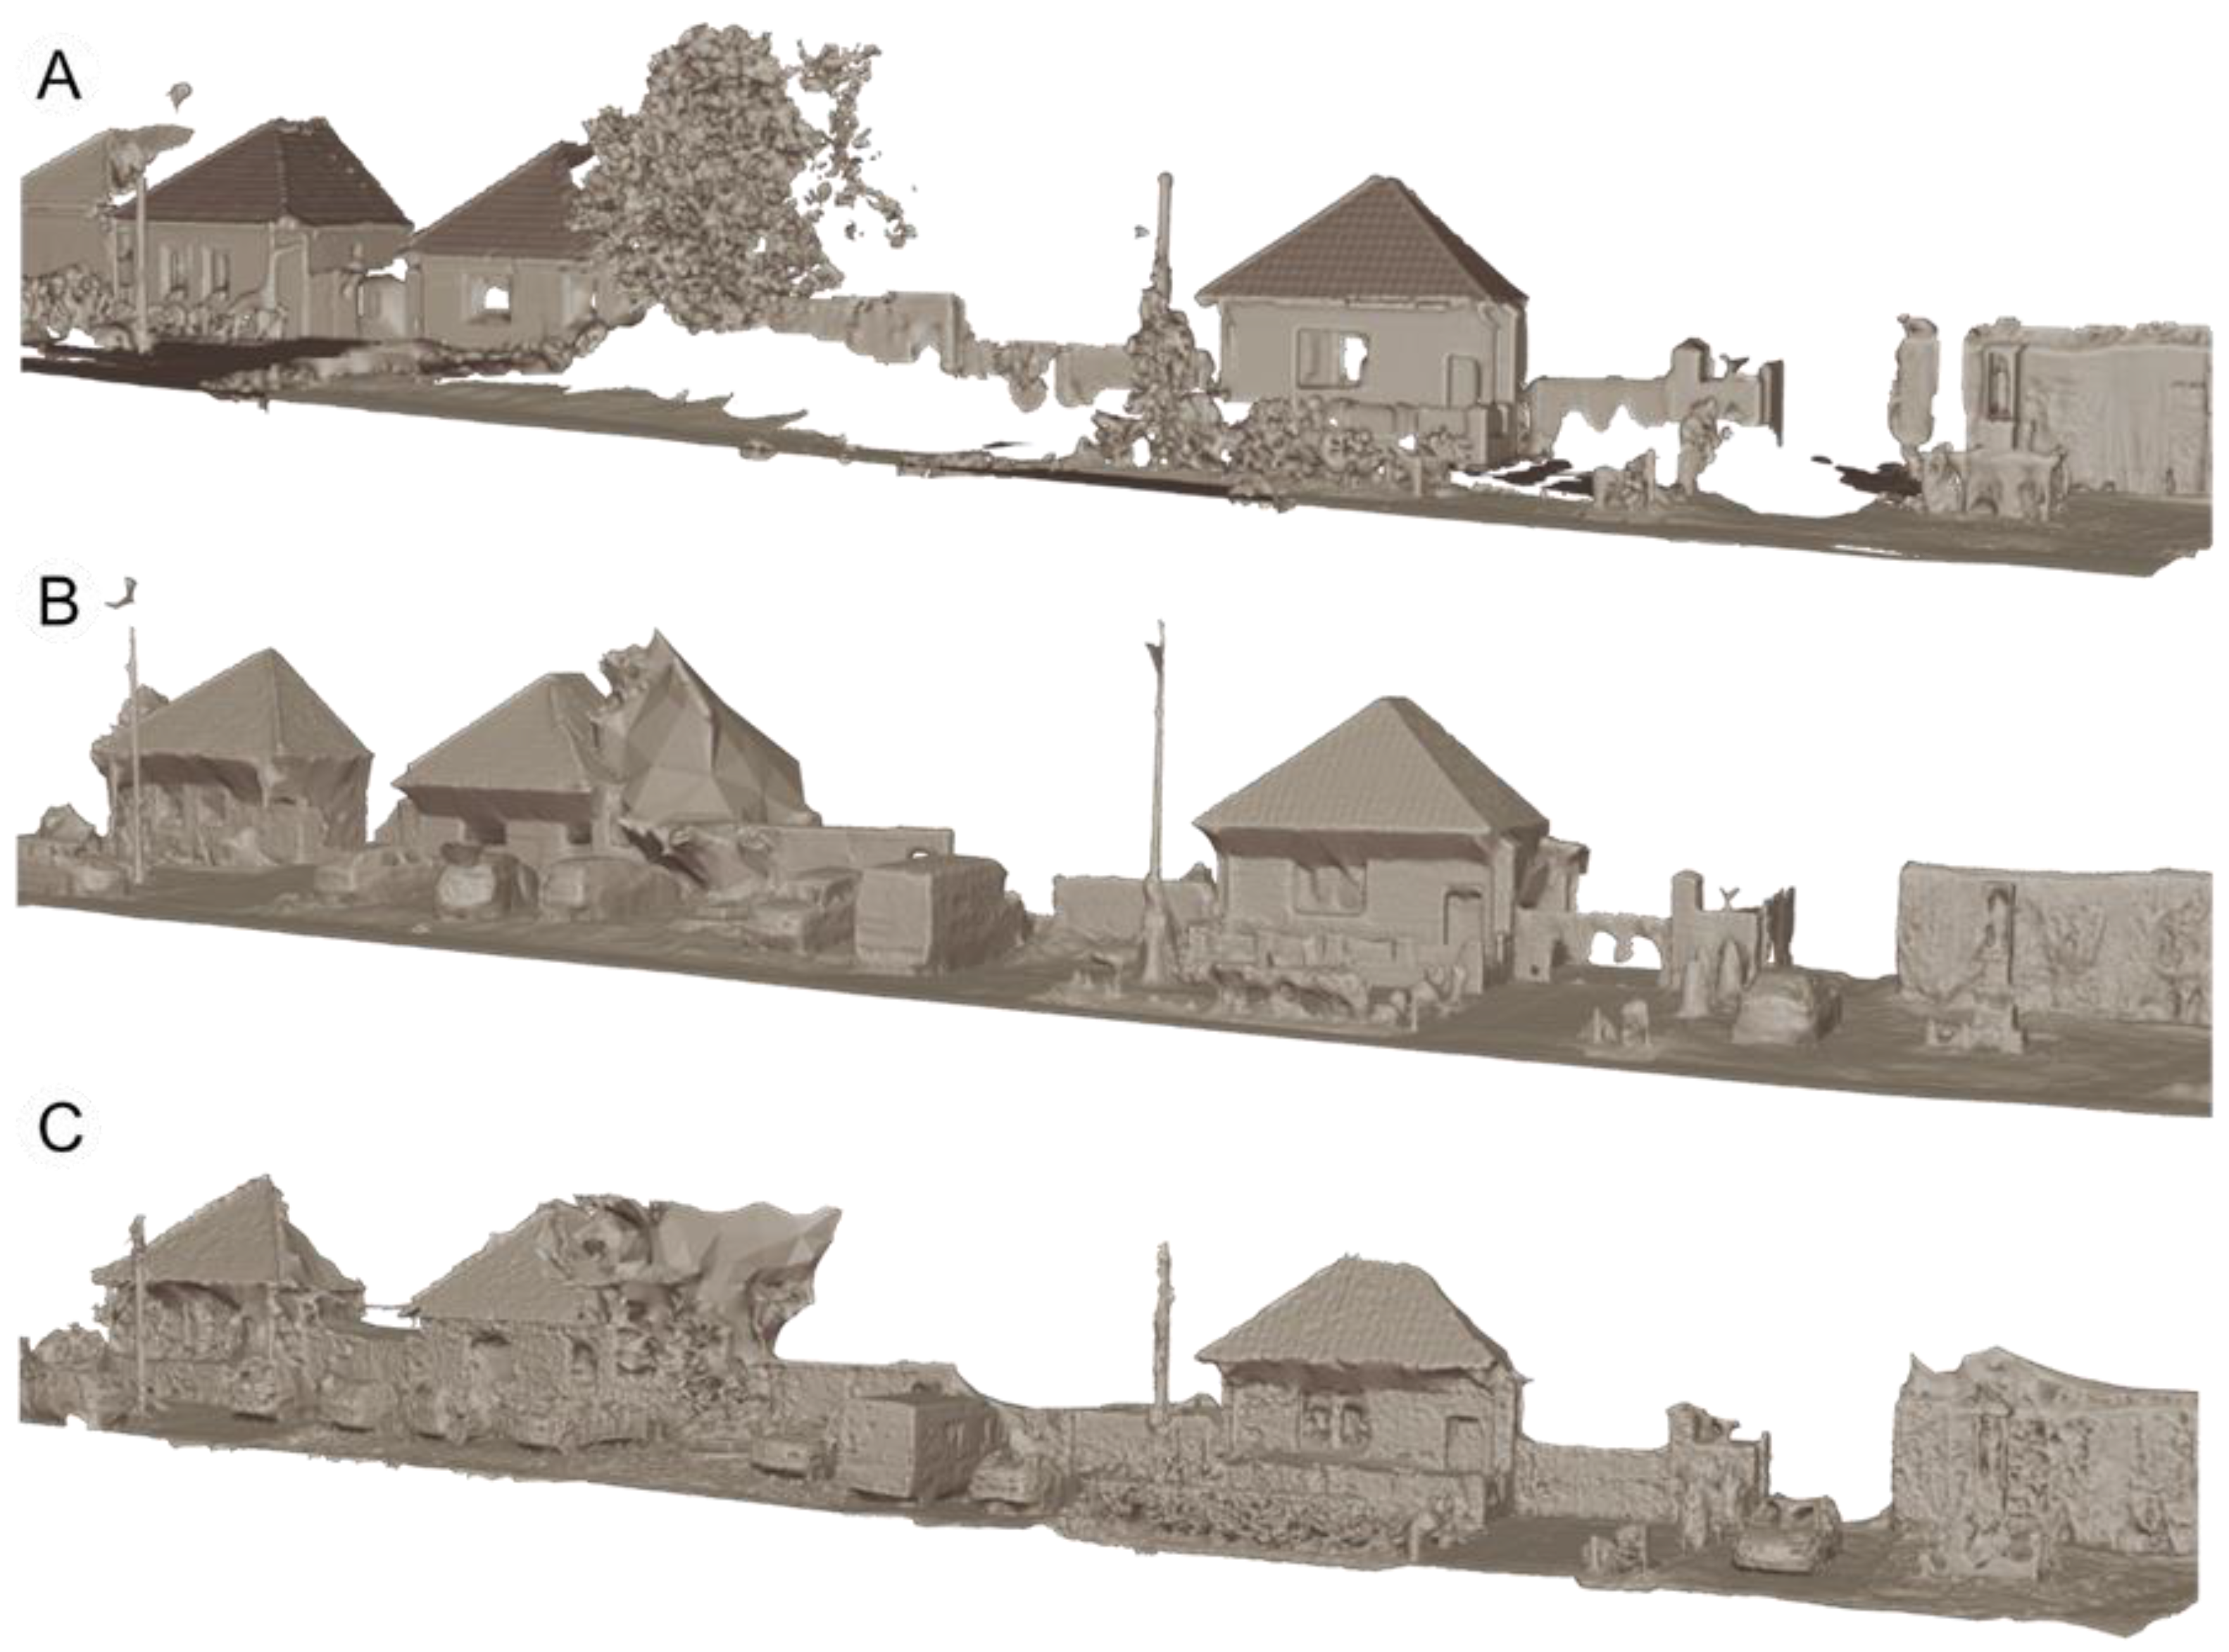
At the start of data acquisition, a bilateral street scanning method was used. Although this approach was expected to provide a continuous spatial model, in practice, the reconstruction was fragmented (Figure 6A). Various strategies were tested to optimize input data capture, including the use of different lenses, changing the phone orientation (portrait/landscape), switching between photos and video, and adjusting the operator’s movement during capture (Figure 7). The best results (Figure 6C) were achieved when the video was split into a dense sequence of frames, and the operator deliberately widened the field of view by horizontally rotating the device (Figure 7C).
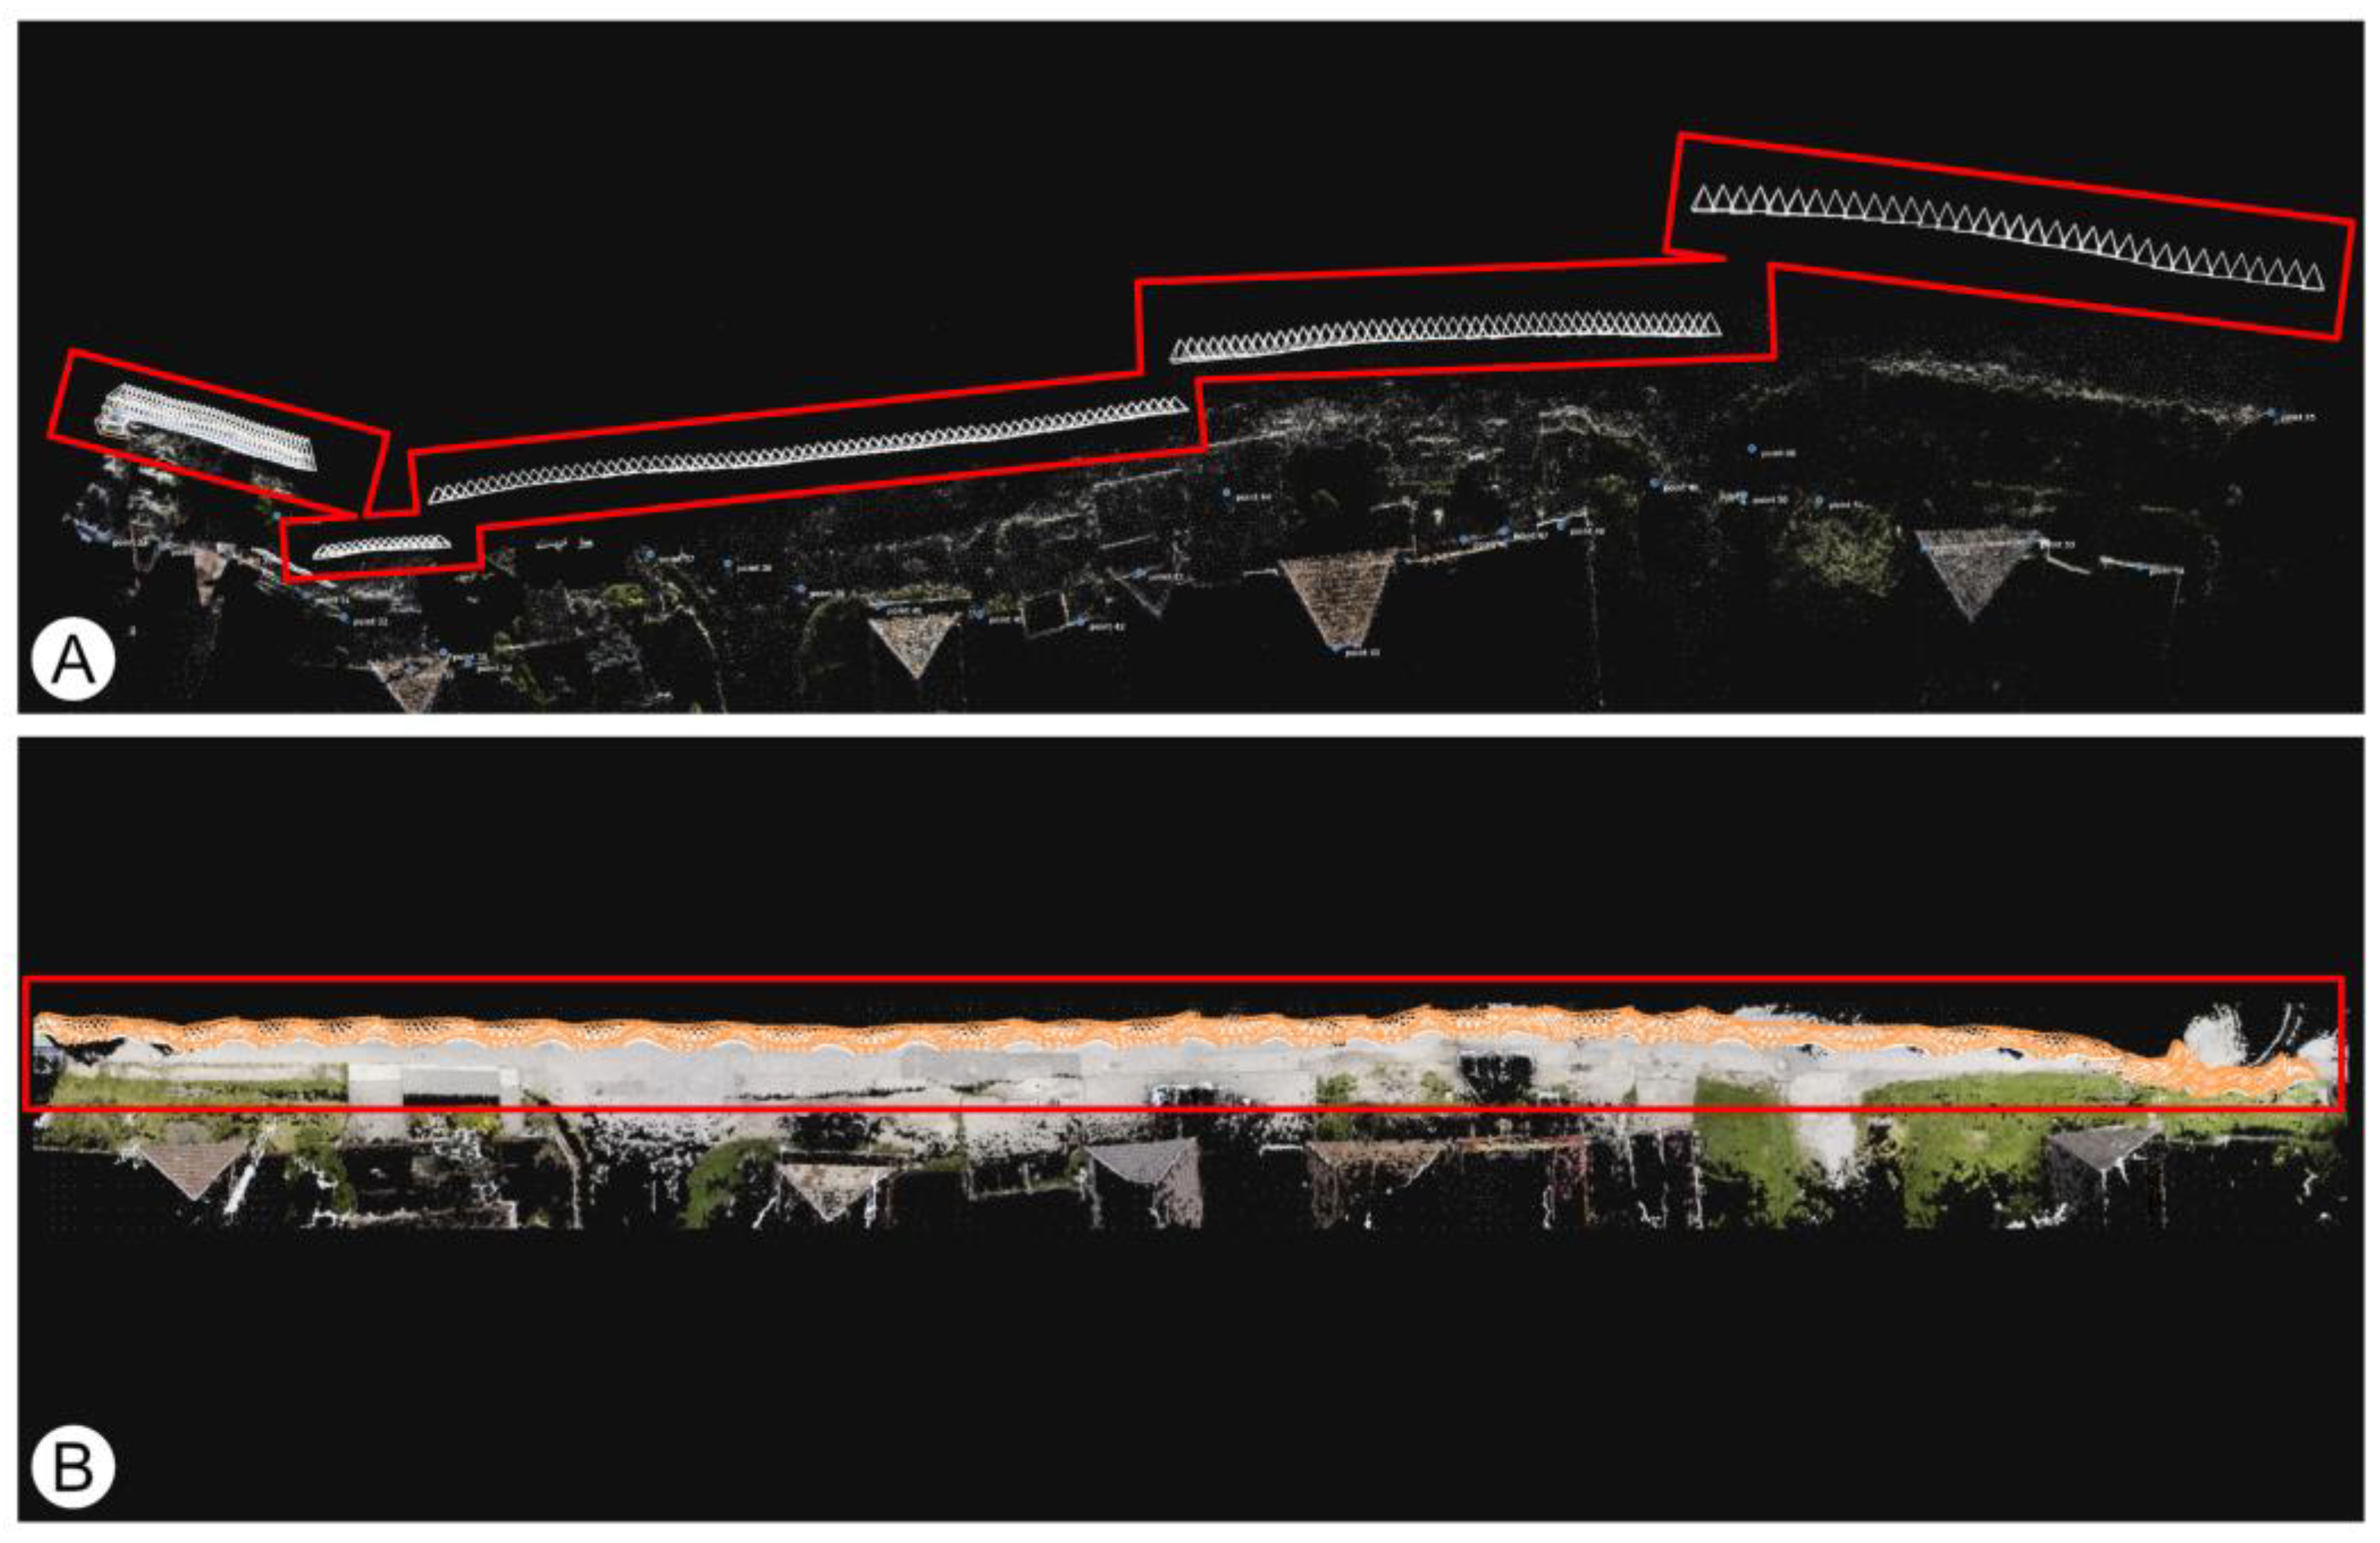
Due to insufficient overlap between adjacent frames, the resulting street model does not reflect reality (Figure 8A). Although the operator performed direct one-sided scanning, the photogrammetric software was unable to reconstruct the scene with correct position and structure. In contrast, direct one-sided scanning with horizontal lens rotation provided enough overlap to generate a realistic street model (Figure 8B).
The close-range photogrammetry data were processed using RealityCapture version 1.4. The first step involved splitting the video into a sequence of individual frames. Although RealityCapture officially supports video import for photogrammetry, the frame sequence was generated in the open-source software Blender 3D version 3.6 LTS for greater flexibility and control over frame rate and resolution.

2.6. Methodological Procedure for Comparing Surface Flatness

To assess the geometric accuracy of models obtained through different acquisition methods (TLS, UAV photogrammetry, and CRP), a surface flatness test was conducted on a selected object—a residential building facade. Windows and doors were removed from the point clouds of the tested section. The cleaned point clouds were then analyzed using the Analysis/Surface Flatness [11] function in Cyclone 3DR software version 2025.1.0, with test parameters set as follows: ruler dimension = 13.00 m and tolerance = 0.005 m.

2.7. Methodology for Quantifying the Cost of Different Data Acquisition Methods

Technical equipment costs were determined through an online market survey conducted on 7 May 2025. For each device, eight price offers were collected. The highest and lowest prices were excluded, and the average price was calculated from the remaining six sources. Prices for the 3D scanner Leica P20 and the drone Mavic 3Enterpise RTK are listed without VAT.
The costs of technician training for device operation and data processing were estimated based on available online training course offers. These courses vary significantly in price and duration. An average daily training cost was calculated from multiple offers, and the course length was determined as the average duration from the available options [12,13,14,15,16,17,18,19]. For UAV photogrammetry, an average duration of 4 days was used; for TLS this was 1 day; and for CRP this was 25 days. The final cost was calculated using the following formula:
T o t a l   c o s t   =   a v e r a g e   d i a r y   c o s t     a v e r a g e   n u m b e r   o f   d a y s

2.8. Methodology for Calculating the Time Coefficient

The time coefficient enables a standardized comparison of time expenditure across different data acquisition methods, independent of linear feature length. It represents the time required to capture a 10 m segment of a linear feature (Equation (1)):
T i m e   c o e f f i c i e n t = T o t a l   t i m e S t r e e t   l e n g t h 10
Total Time = Preparation + Data Acquisition + Data Processing

3. Results

This study evaluated time requirements, equipment costs, operator skill demands, and output quality across various spatial data acquisition methods applicable to the field of landscape architecture.

3.1. Output Quality Evaluation

The quality of outputs from the various data acquisition methods was assessed in terms of geometric accuracy, specifically the flatness of selected facade segments of a residential house. Known for its high precision, TLS served as the reference method for geometric comparison.
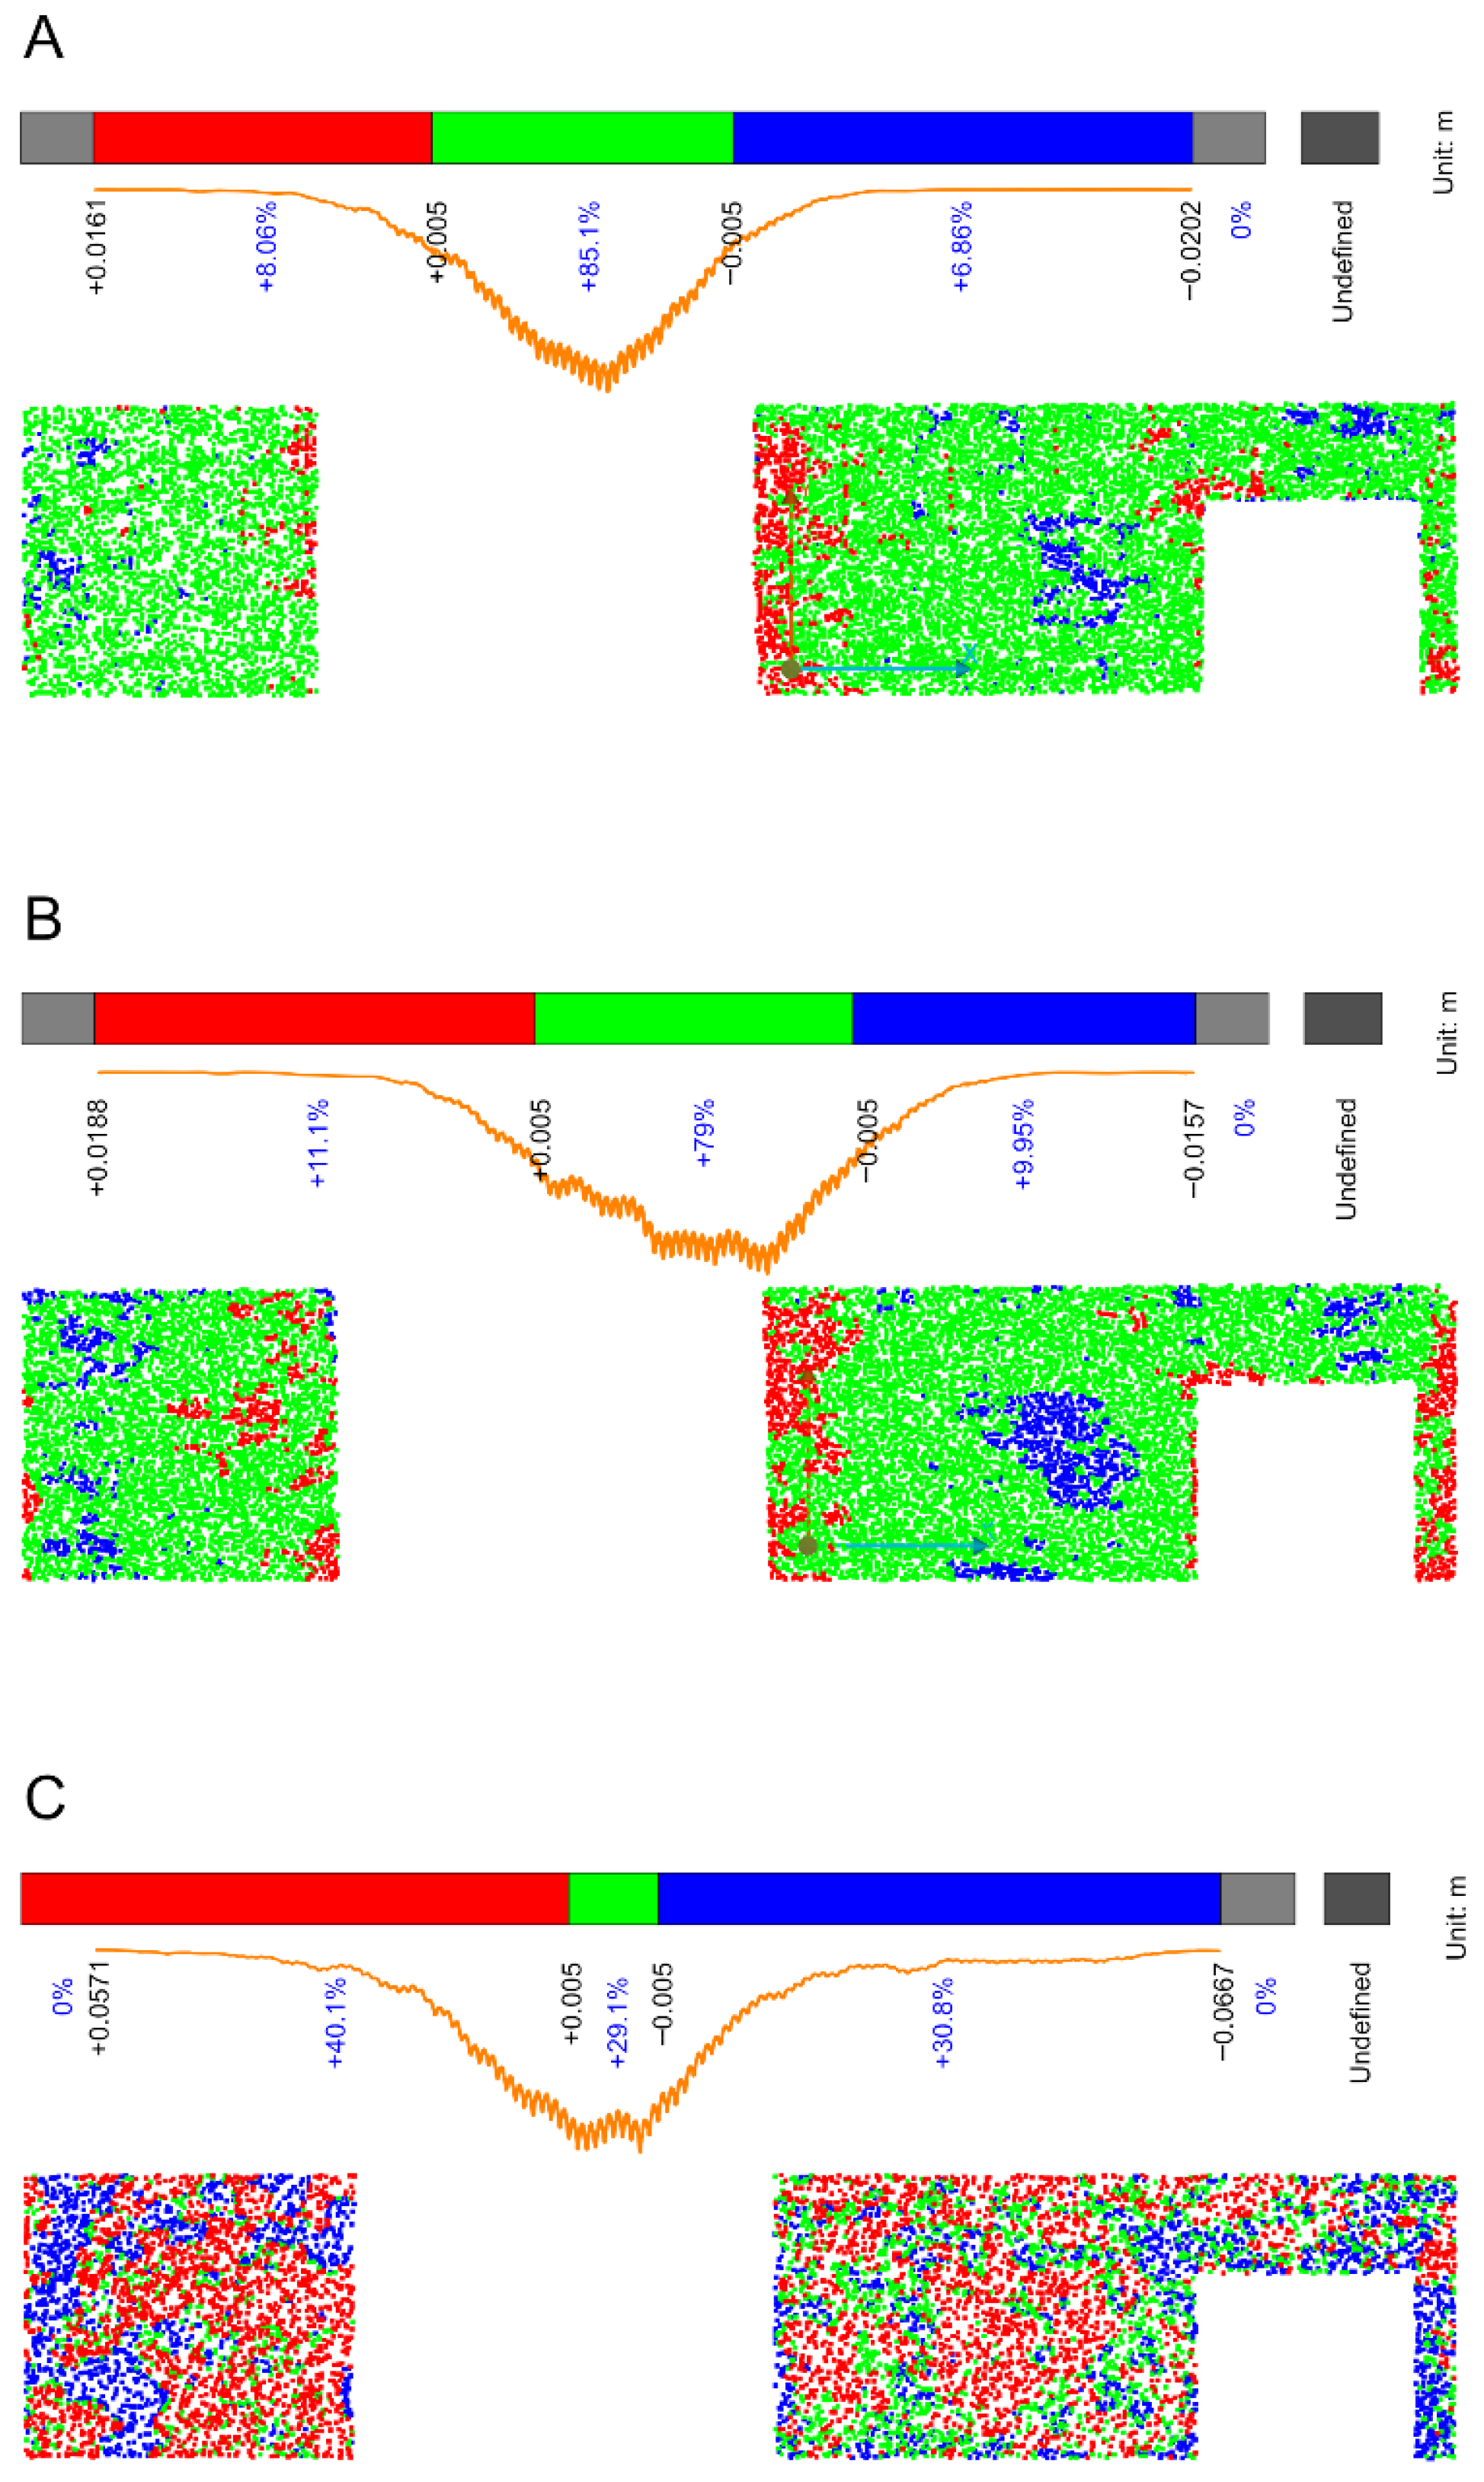
To quantitatively evaluate geometric quality, a surface flatness analysis was conducted on selected facade segments, with windows and doors excluded from the assessment (Figure 9). The analysis results are presented in Figure 10.
The TLS model (Figure 10A) represents facade surface flatness evaluation (Figure 11A). Most points (85%) fall within a ±0.5 cm tolerance from the ideal plane, reflecting the real, though not perfectly flat, facade surface. The analysis confirms this model’s reference value (Figure 10A).
Aerial photogrammetry (Figure 11B) produced results closely resembling those of the TLS model. Within the ±0.5 cm tolerance zone, 79% of points were located. The observed deviations stem from the photogrammetric processing principles and the higher acquisition altitude-induced lower point density.
In the flatness test, the close-range photogrammetry model (Figure 11C) showed the largest deviations. Although it offers the highest textural quality, geometrically speaking, the points deviate more from the ideal plane (only 29% within the green zone). This increased variability is caused by several factors: smartphone sensor quality, image capture consistency, and device height stability during manual movement. Point dispersion also results from less robust algorithms when processing data with lower overlap and lighting changes.
Overall, in terms of accuracy, UAV photogrammetry shows a 93% agreement with TLS, while CRP shows only 34%. Close-range photogrammetry is advantageous for detailed texture visualization. However, for geometrically accurate analyses, we must consider its lower precision compared to TLS and UAV photogrammetry. UAV photogrammetry offers a balanced compromise between texture quality and geometric accuracy, making it suitable for mapping larger areas.

3.2. Time Requirement Evaluation

The time demands of each data acquisition and processing method represent another key factor for their practical use in landscape architecture projects. A detailed comparison of the time required for each workflow phase (TLS, UAV, and CRP) is provided in Table 2.
In this study, close-range photogrammetry did not involve a measurable preparation phase (marked as ‘–’, time = 0 min), as data capture was carried out on the go. In aerial photogrammetry, defining the flight plan (“Enter Fly Task”) took 10 min. For TLS, spatial analysis for planning station positions required 15 min.
The on-site data collection phase exhibited substantial differences in time demands between the methods compared. CRP proved fastest: capturing both sides of the street (“First-Side Street Capture” and “Second-Side Street Capture”) required only 9 min in total (4.5 + 4.5 min). UAV photogrammetry—including drone setup on-site and flight—took approximately 35 min (5 min preparation + up to 30 min flight). The most time-consuming field method was TLS: sequential scanning from multiple stations, together with scanner setup at each location (tripod placement, self-test, etc.), required 82.5 min in total (6 min setup + 76.5 min scanning).
Processing times for TLS and CRP were approximately equal (Table 2). For UAV photogrammetry, point-cloud generation and registration were relatively quick (3.8 min); however, subsequent meshing and texture mapping represented the longest processing step across all methods, requiring 197.2 min.
The mapped street has a length of 360 m; however, for a longer linear feature, the time expenditure for TLS would increase due to the necessity to relocate and level the station. Such downtime is absent in the UAV and CRP continuous acquisition processes. A time coefficient-based comparison (Equation (1)) indicates that close-range photogrammetry is the most rapid method during the field data acquisition phase. The processing time for CRP results is approximately 130 min, which is comparable to the time expenditure for processing TLS data.
Consequently, selecting the optimal method in terms of time depends on the specific project requirements, the desired level of detail, the final output type (e.g., point cloud versus textured model), and the extent of the area of interest. This results in a time expenditure per 10 m of 6.3 min for TLS, 6.8 min for UAV, and 3.8 min for CRP.

3.3. Equipment and Operator Qualification Cost Evaluation

In addition to time requirements and output quality, overall cost is a key factor in spatial data acquisition method selection. Table 3 summarizes the estimated costs, divided into three main categories: technical equipment, software, and operator training expenses.
The highest initial cost (Table 3) is associated with the terrestrial laser scanner (Leica P20: EUR 7110), followed by UAV equipment (DJI Enterprise RTK: EUR 3606). In contrast, the CRP method using a standard smartphone (in this case, an iPhone 13 mini) incurs no additional hardware costs, assuming the user already owns such a device.
In the software domain, our study focused on leveraging open-source solutions (CloudCompare for TLS data processing) or free-license tiers of commercial packages (RealityCapture—Free License Tier for photogrammetric processing). This strategy substantially reduces—or entirely eliminates—software expenditures, aligning with the objective of identifying low-cost workflows.
The labor cost item represents the investment required to train an operator in both the hardware and software specific to each acquisition method. As detailed in the Methodology Section (Section 2.7), these costs were derived from the average price and duration of available specialized courses. The highest training expense is associated with aerial photogrammetry (EUR 1128), followed by TLS (EUR 1008). From this perspective, training for close-range photogrammetry is the least demanding and thus most cost-effective (EUR 558).
An overall cost comparison clearly indicates that close-range photogrammetry, using a smartphone and freely available software, is the most financially accessible method. In contrast, aerial photogrammetry and TLS involve significantly higher initial investments in terms of both hardware and training. Among the methods evaluated, TLS emerges as the most capital-intensive in terms of upfront costs.

3.4. Options for Combining UAV and CRP

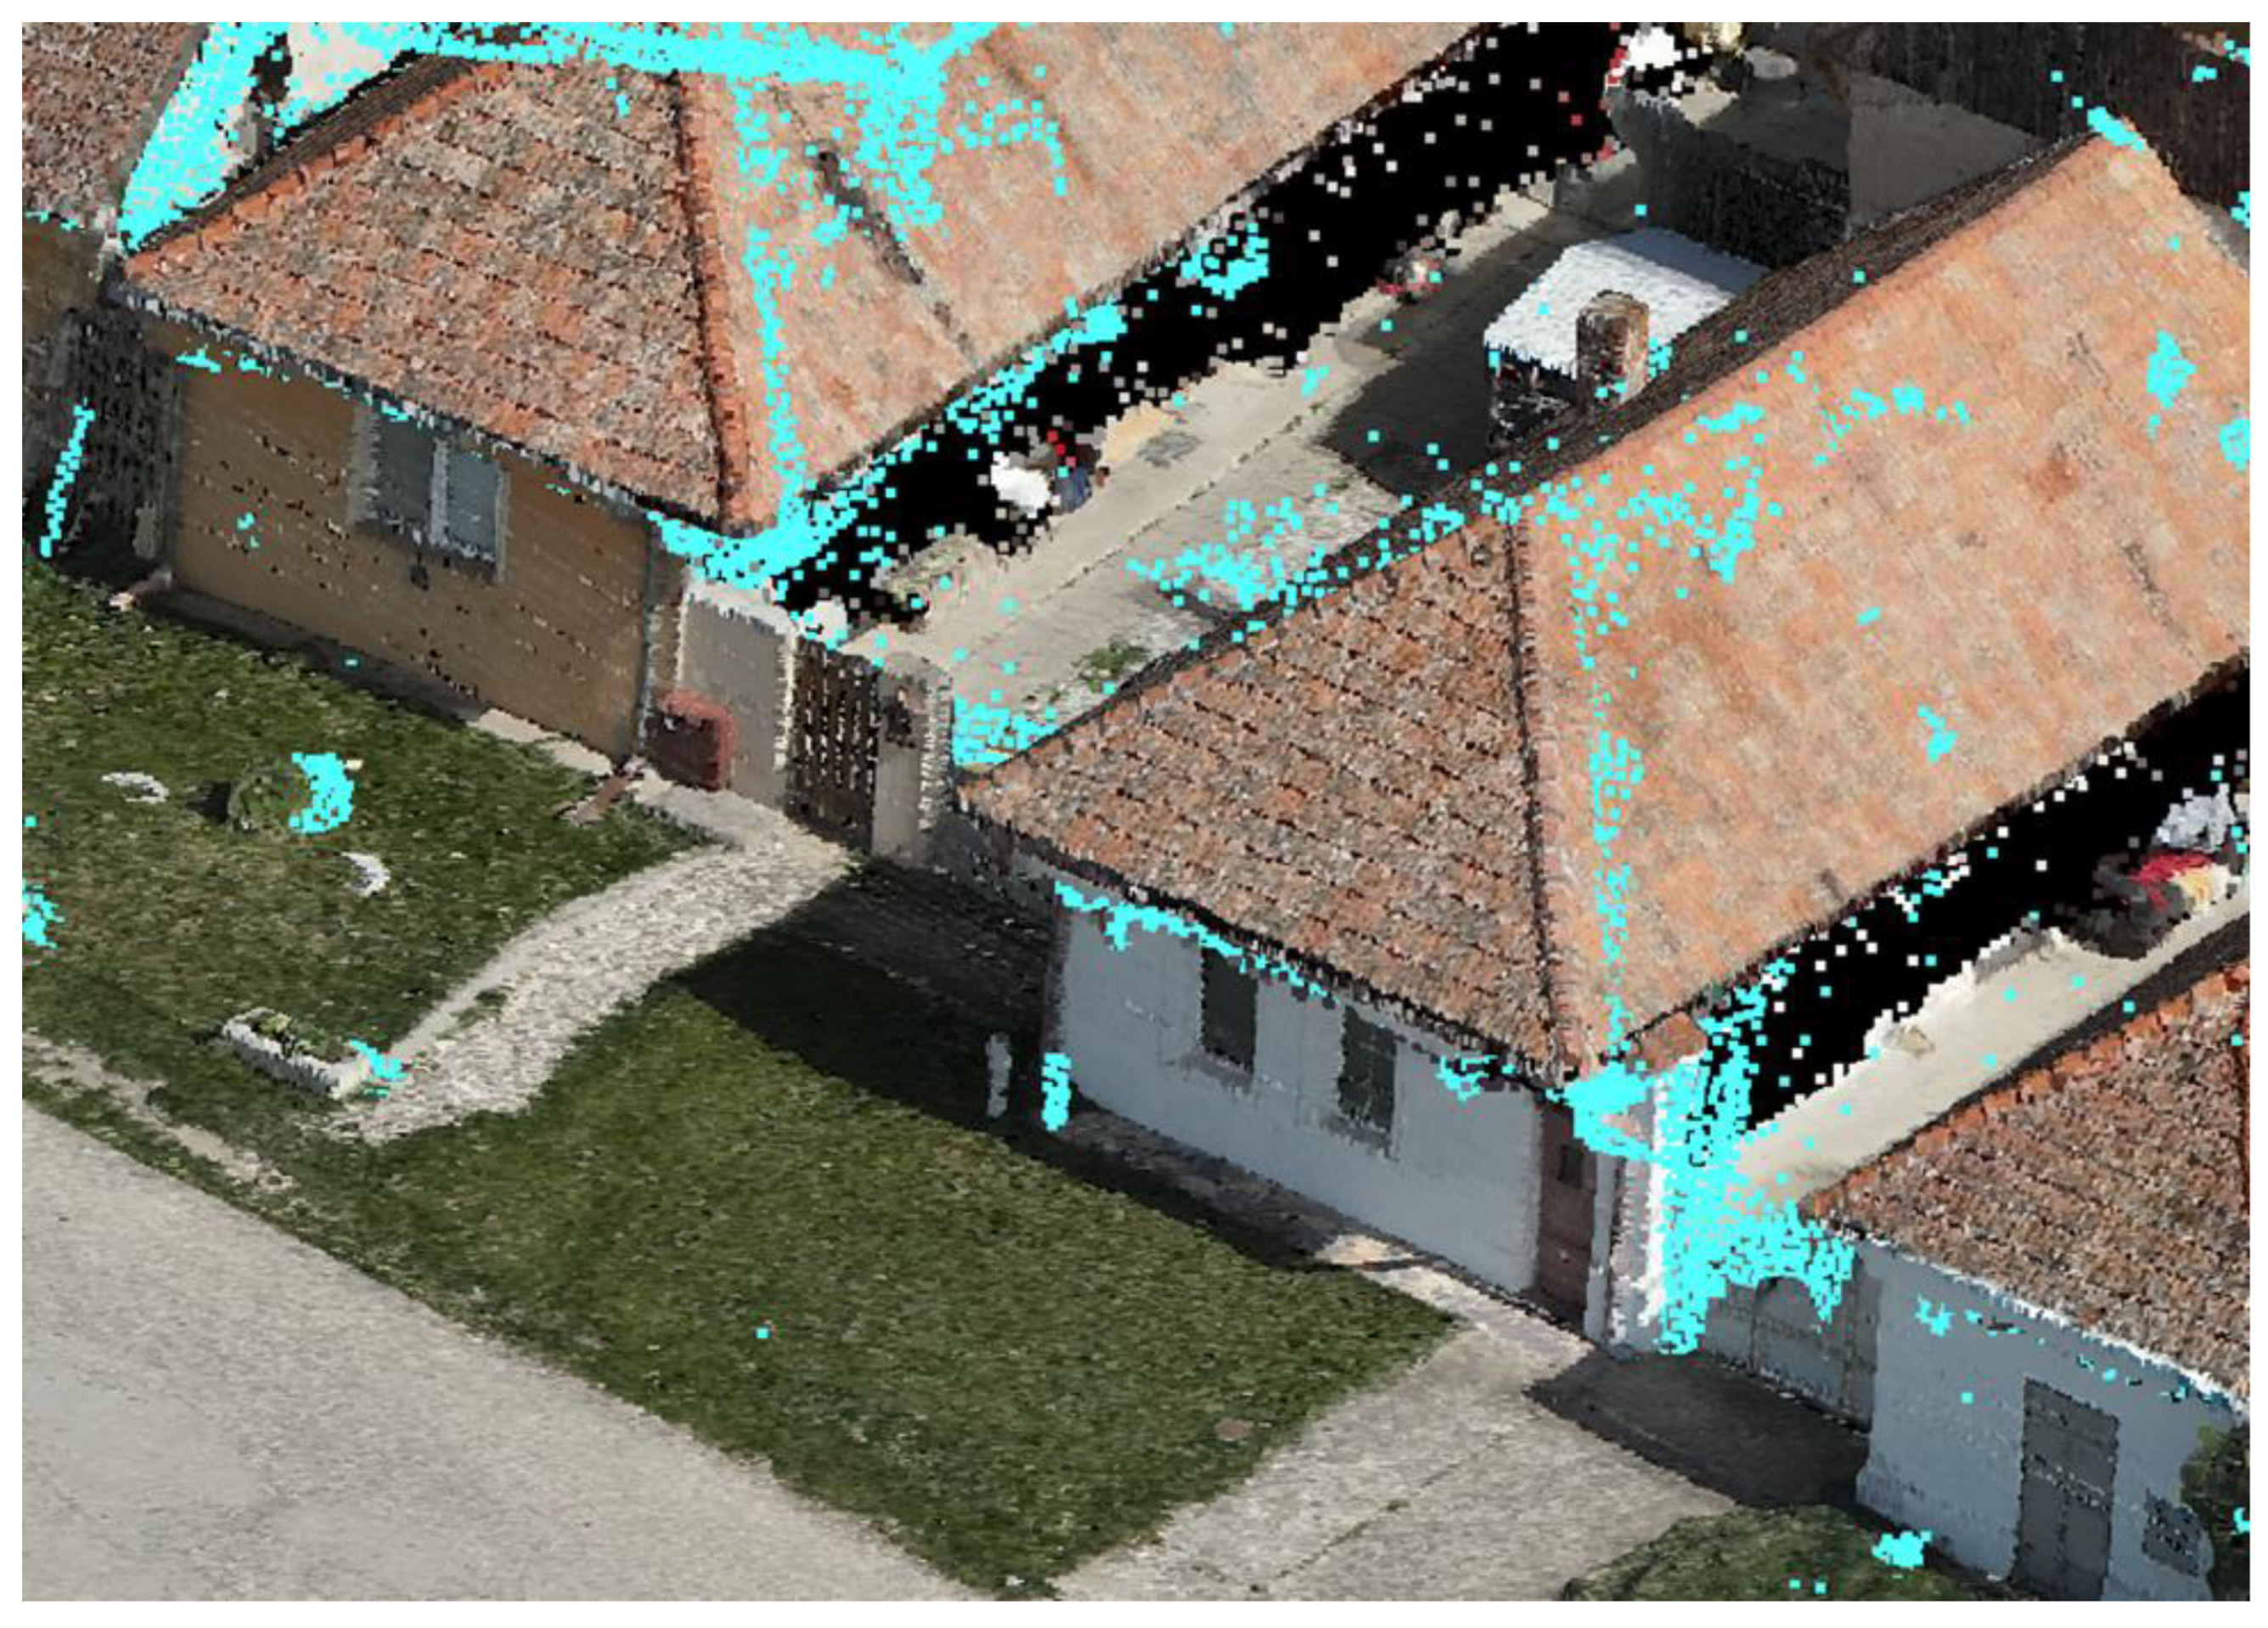
As a form of ground-based scanning, close-range photogrammetry (CRP) can complement aerial photogrammetry (UAV) data—particularly when documenting complex urban or rural scenes. UAVs efficiently map extensive areas and horizontal surfaces but often fail to capture sufficient detail in vertical facades and soffits. These missing or under-resolved portions of UAV-derived models can be effectively supplemented with CRP data, which excels at capturing fine textures and geometry. Since CRP accuracy diminishes with increasing distance from the subject, its optimal application, in tandem with UAV data, focuses primarily on ground-level elements—such as lower facade sections, small-scale architectural details, or terrain-level features—while higher structures remain well covered by UAV imagery. A targeted synergy combining these two methods thus enables the generation of a more comprehensive and detailed digital model, optimizing both cost and time efficiency, and thereby enhancing the quality of deliverables for analysis and design (Figure 12).

3.5. Application of the Model for Decision-Making

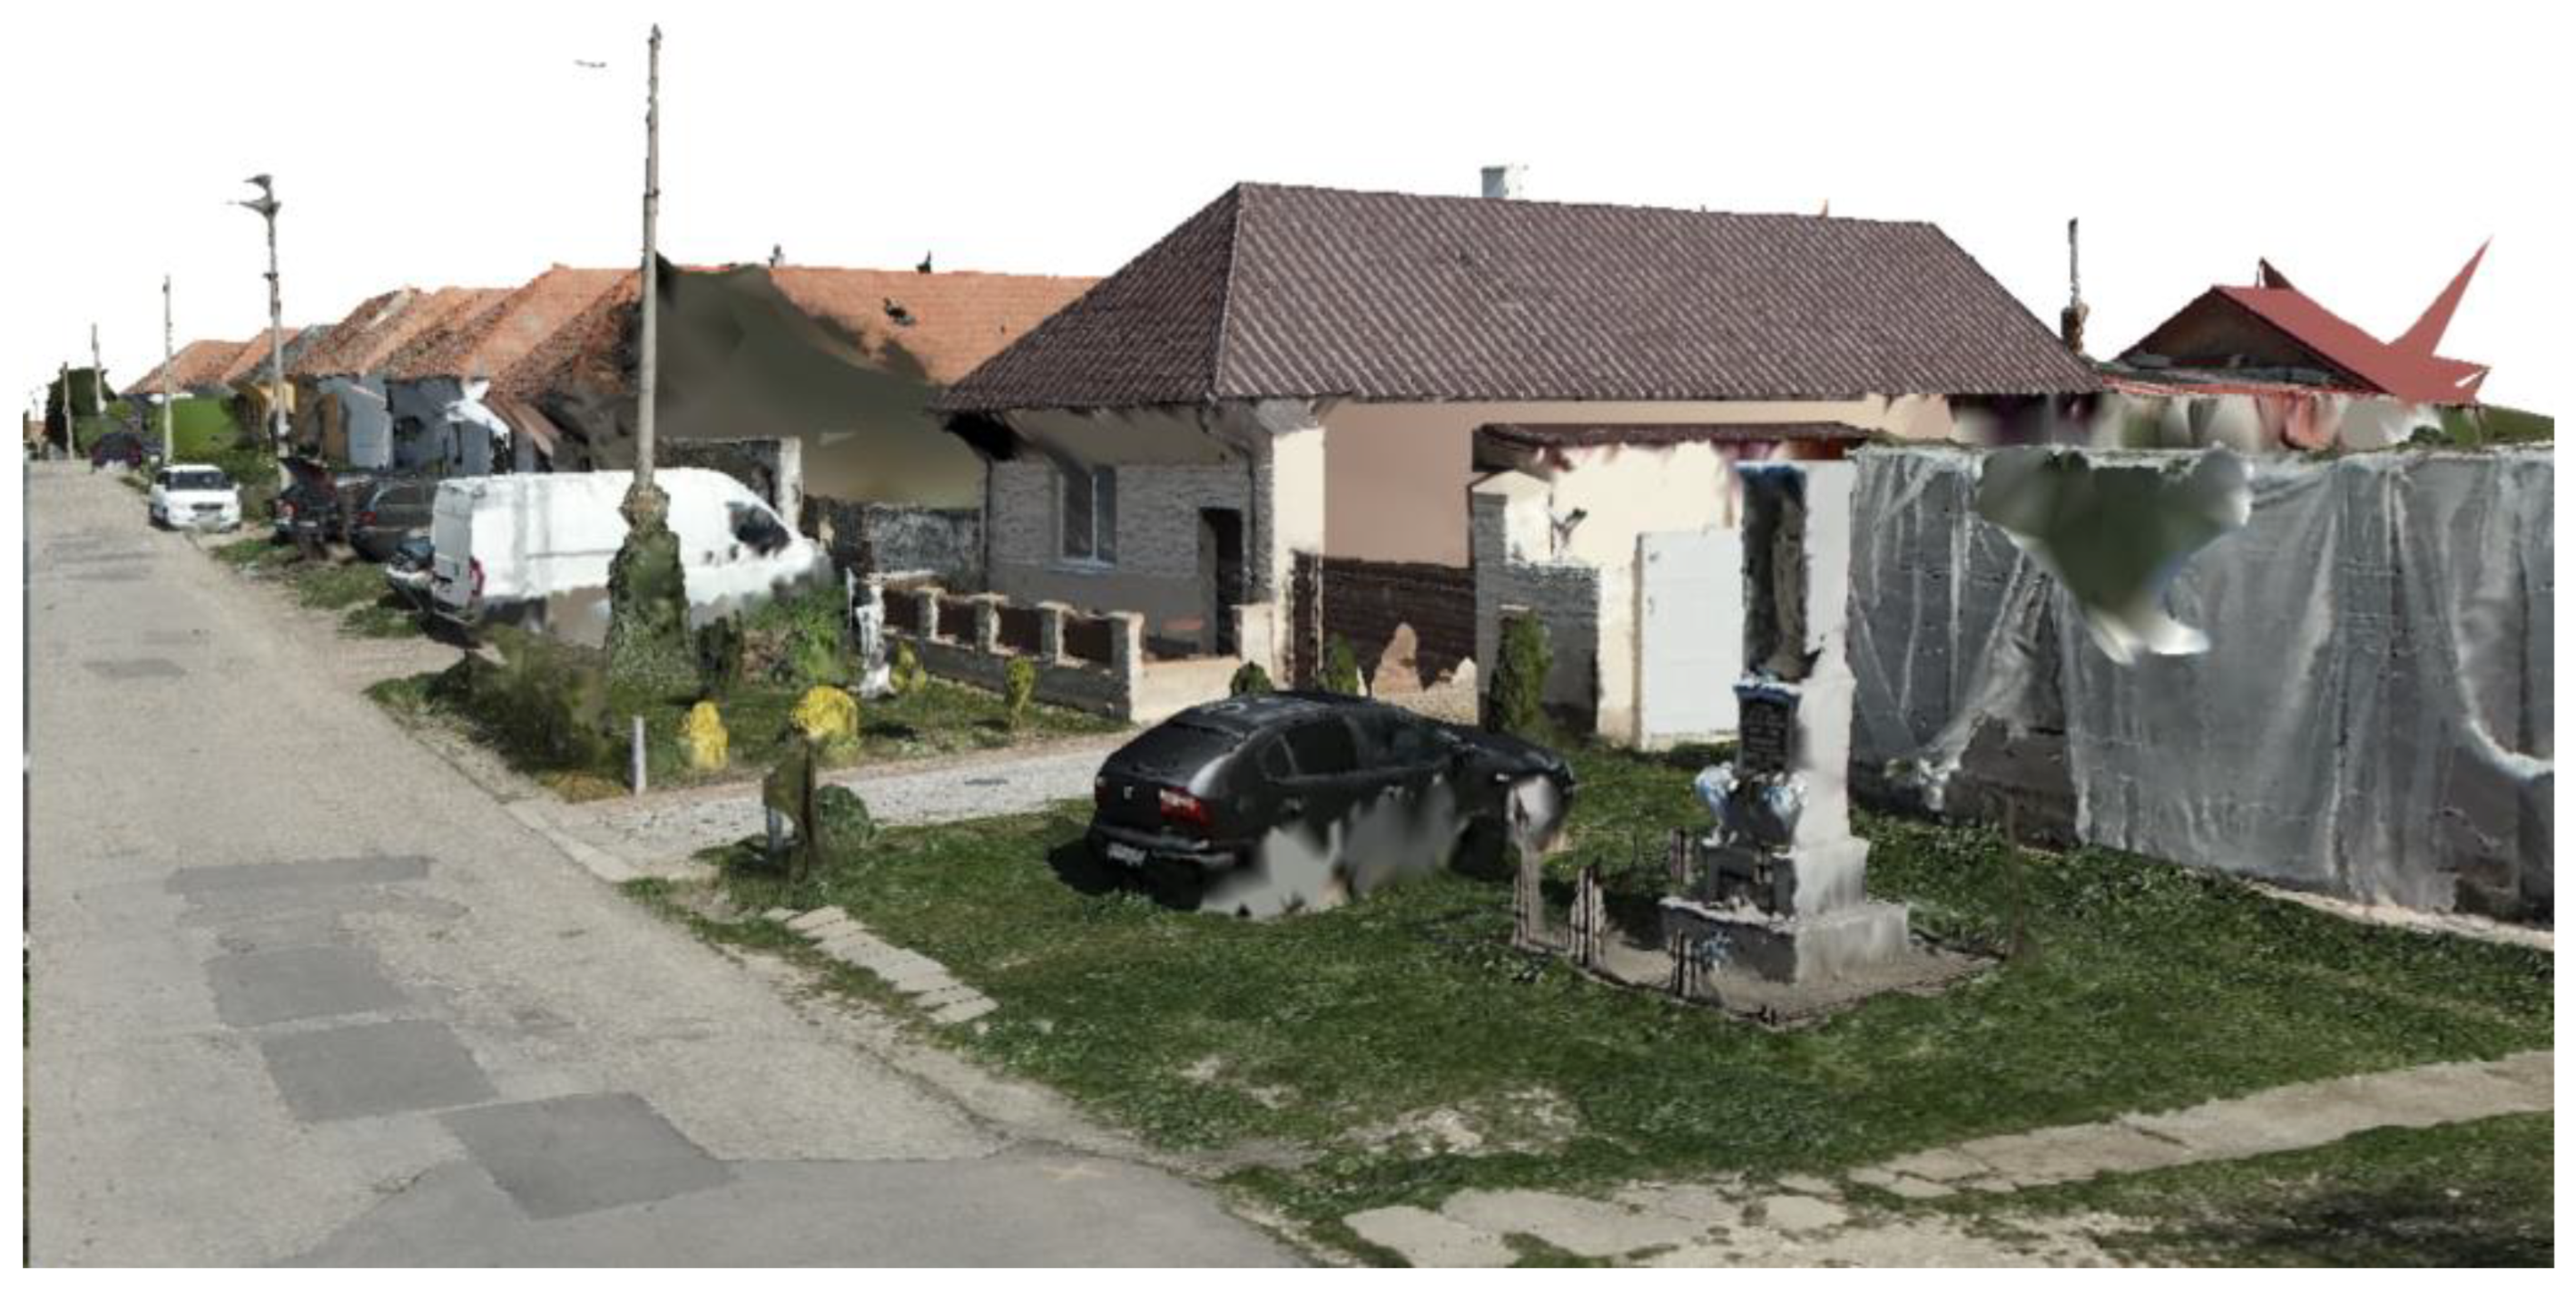
The spatial geometric model of the street, acquired via UAV-based photogrammetry (Figure 13), represents more than a mere three-dimensional visualization. It serves as a comprehensive, data-rich foundation that enables a series of analyses crucial for objective decision-making within the landscape architecture design process. Its application transforms the planning process from predominantly intuitive to data-driven.
At a fundamental level, the model provides a precise, georeferenced 3D inventory of the entire site. It allows for the exact measurement and analysis of the spatial arrangement of objects such as buildings, fences, retaining walls, and minor architectural features. Based on these data, it is possible to determine the widths and condition of existing communications and sidewalks with high accuracy, as well as to identify critical bottlenecks or barriers. A key metric provided by the model is the quantification of the ratio between impervious surfaces and green spaces. This information is essential for assessing the site’s ecological stability. It is possible to precisely calculate the total area of impervious (radiant) surfaces, such as asphalt and concrete, which contribute to the urban heat island effect, comparing it to lawns and vegetated beds.
The model provides a detailed overview of the existing green infrastructure during summer (leaf-on) conditions. It enables the precise localization and identification of trees and shrub groups, as well as their direct interaction with surrounding structures and technical infrastructure. Based on the 3D data, it is possible to analyze, for example, conflicts between tree canopies and building facades or power lines. Even more importantly, the model serves as a basis for shadow studies. Simulating solar radiation at different times of the day and year allows for an objective assessment of which parts of the street are exposed to extreme insolation and which are pleasantly shaded. These insights are key in designing new public seating areas, positioning street furniture, and planning tree planting to improve the microclimate (Figure 14).
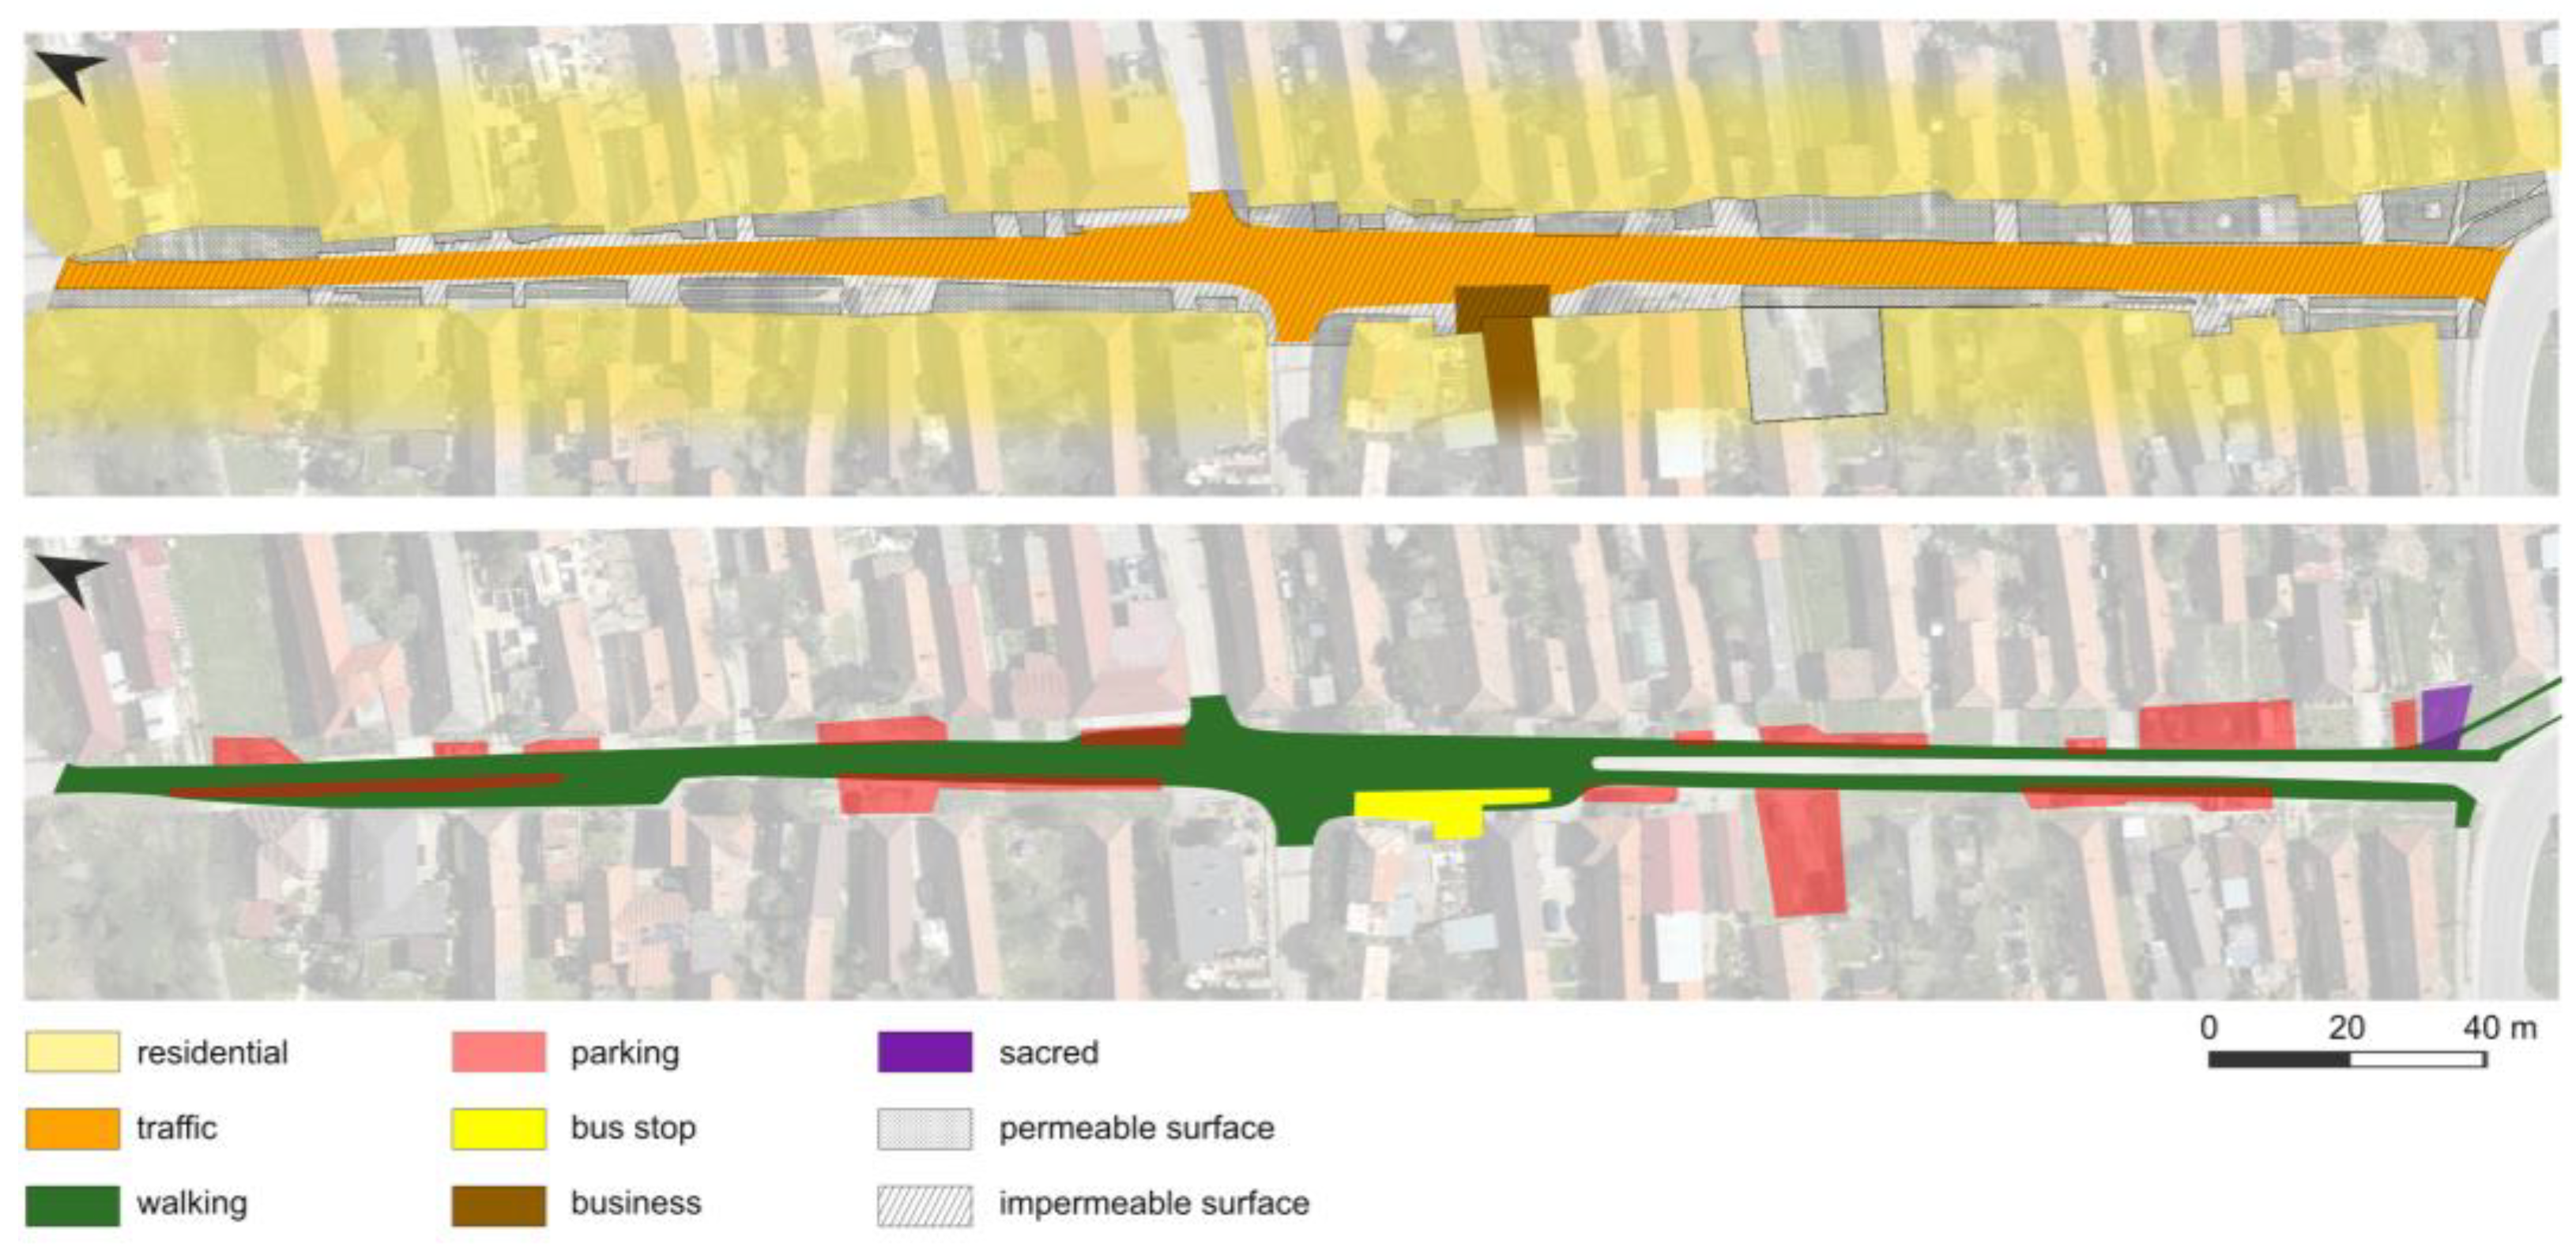
By combining the geometric model with the orthophotomosaic (Figure 15), it is possible to analyze functional relationships and potential risks within the site. The model precisely visualizes locations where conflicts occur between different modes of transport and pedestrian movement. It reveals sections without sidewalks, unsafe road crossings, inadequate sight lines at intersections, and places where parked vehicles obstruct smooth and safe circulation.
The Digital Surface Model (DSM), which is one of the photogrammetry outputs, combined with the orthophotomosaic, serves as an invaluable basis for stormwater runoff analysis. Based on terrain slope and the identification of permeable and impervious surfaces, it is possible to model where water drains from the area, where it potentially accumulates, and where there is a risk of localized flooding or erosion. These analyses are essential for designing sustainable stormwater management systems (e.g., rain gardens, permeable surfaces) and for the proper placement of technical infrastructure, such as drainage inlets.
Ultimately, this digital model becomes not only the foundation for the design itself but also a dynamic tool for simulating its impacts. It serves as a robust and accurate baseline for creating and updating land use plans and further project documentation.
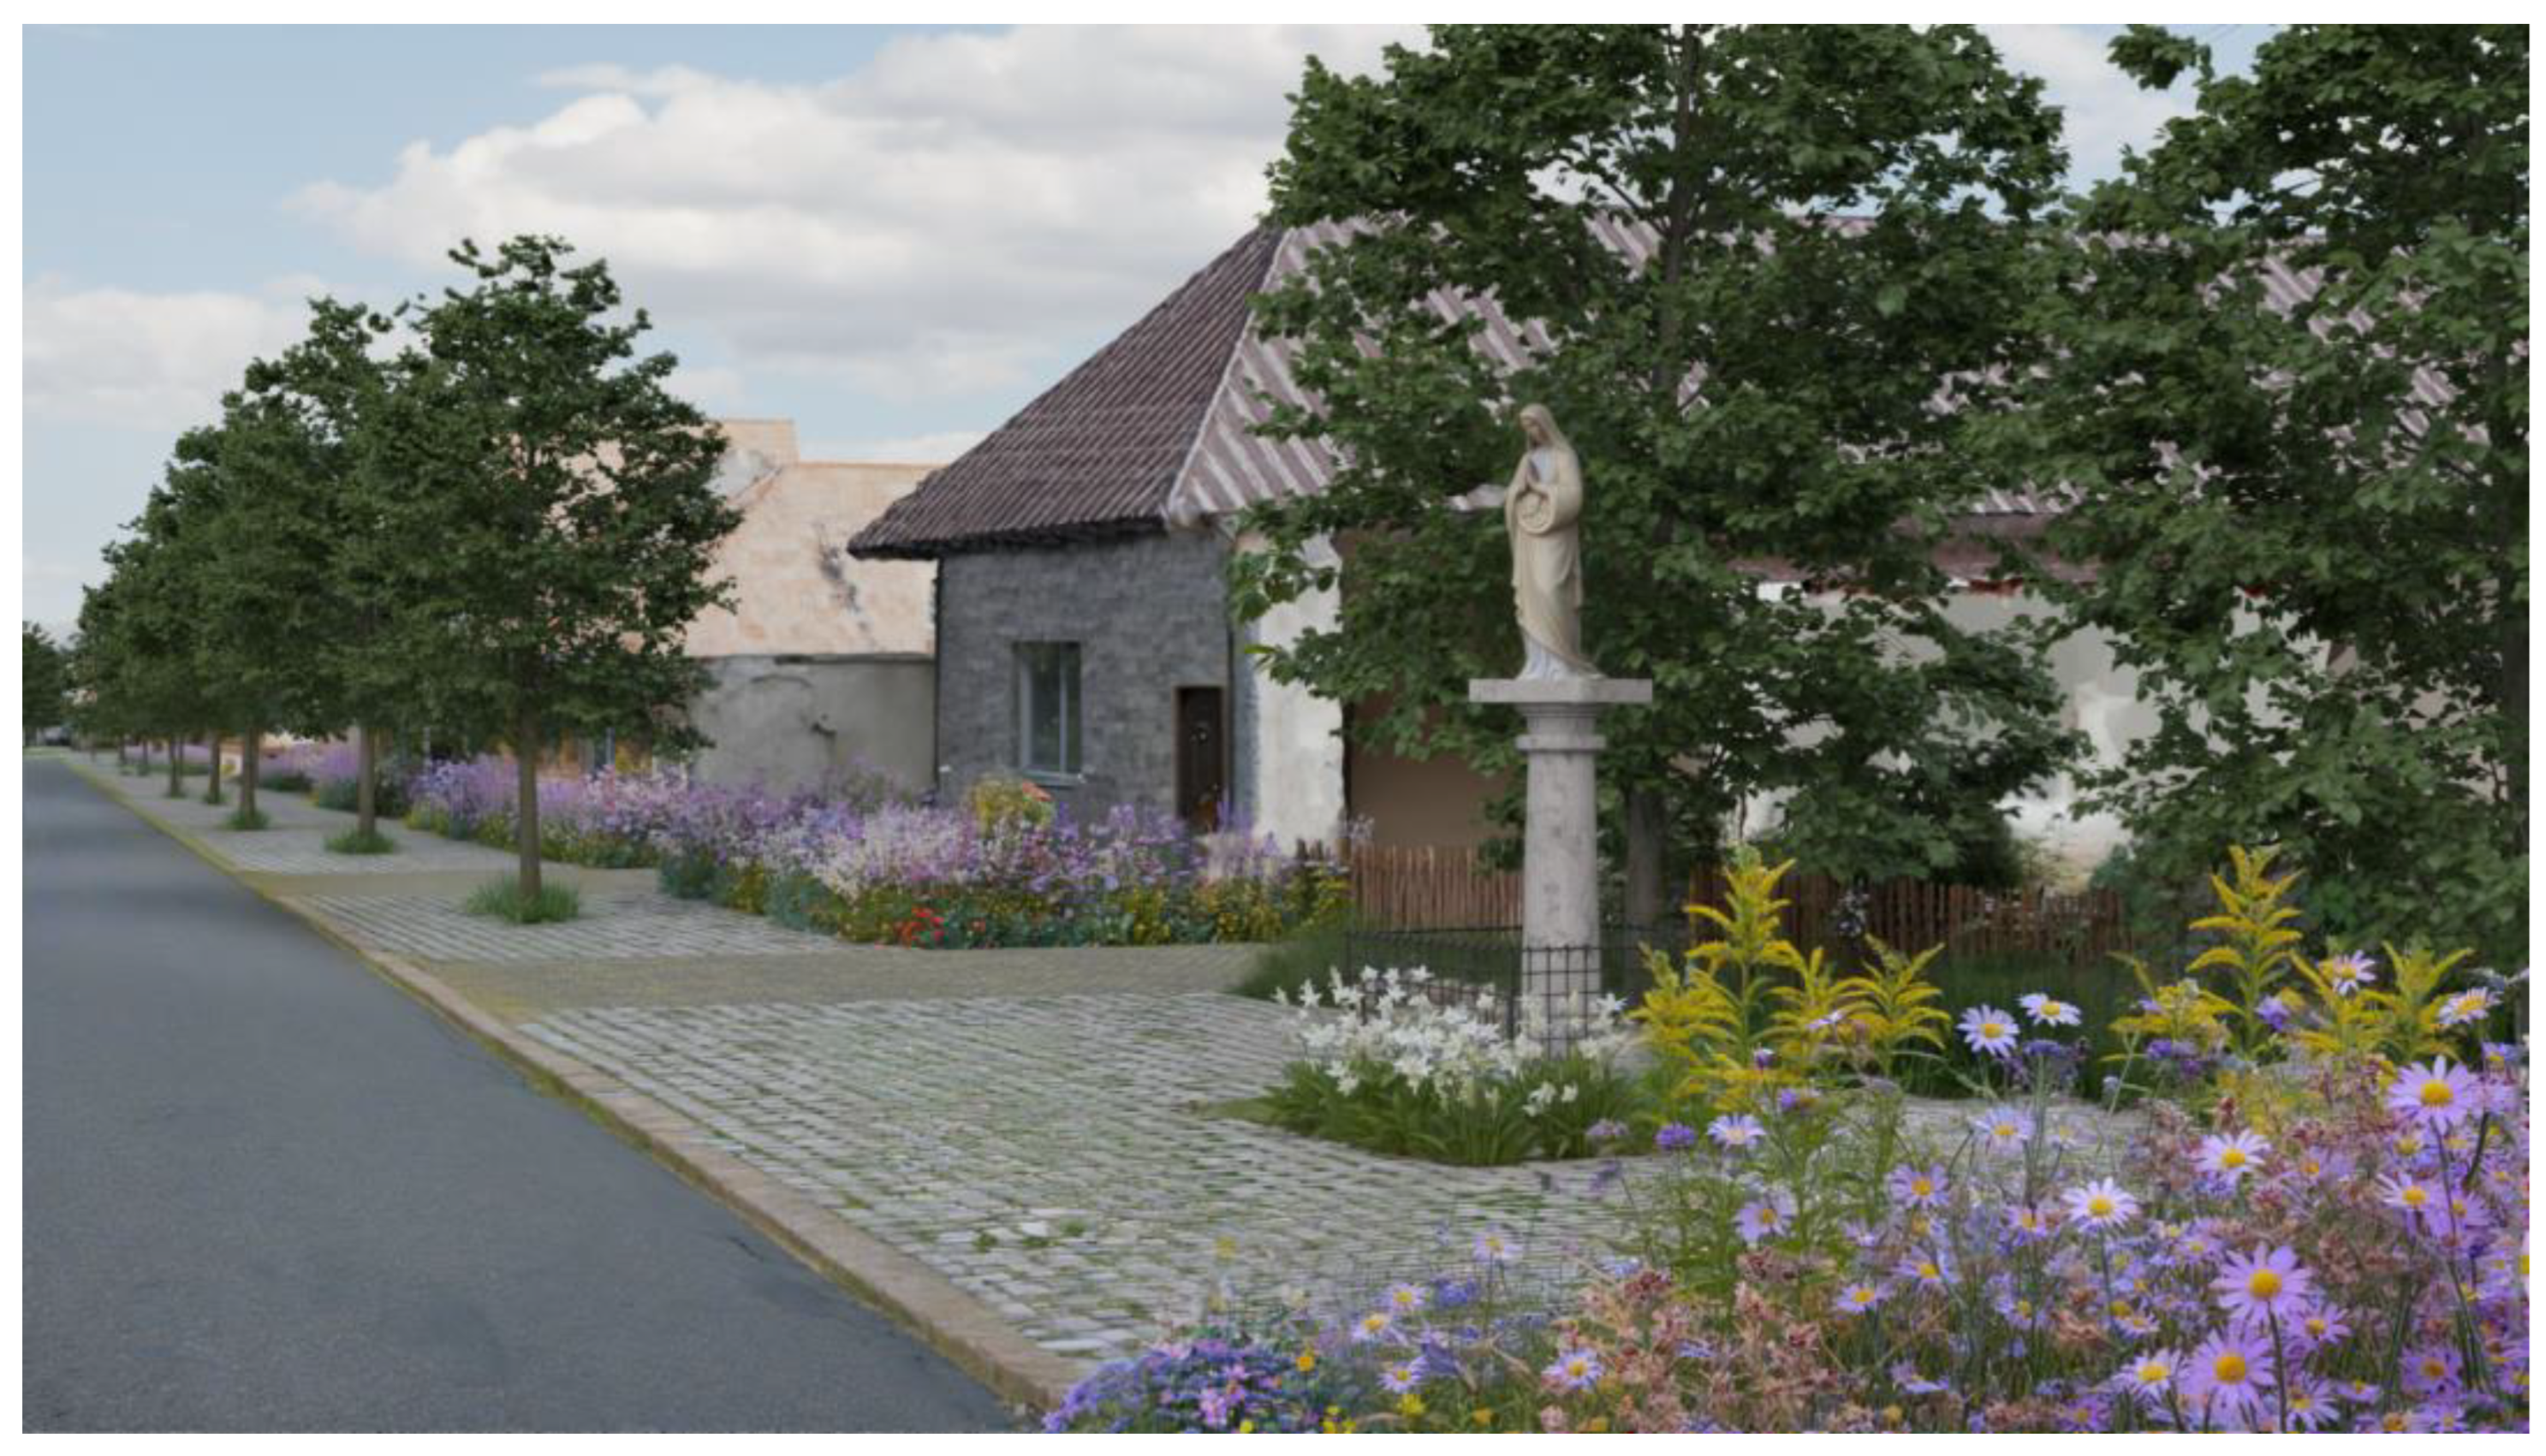
The accurate three-dimensional spatial model of the rural street served as a foundational analytical tool, enabling the transformation of identified deficiencies into specific, data-driven design solutions. Its high geometric and visual fidelity provided the necessary basis for validating and optimizing the design concept, which aims to return the street to its residents and create a functional, ecologically stable, and harmonious environment.
One of the most critical issues identified was the dominance of traffic and the absence of safe pedestrian spaces. The model allowed for precisely defining space for new, standards-compliant bidirectional sidewalks, which physically separate pedestrian movement from motor traffic, thereby directly addressing collision risk. Based on exact widths and spatial relationships, it was possible to design traffic-calming measures, such as narrowed driving lanes and designated parking bays, whose functionality and passability were directly verified within the 3D environment.
Topographical and material data were key to designing stormwater management measures. By identifying extensive impervious areas and analyzing slopes, it was possible to design their partial replacement with semi-permeable surfaces and strategically locate new vegetation areas that function as rain gardens, thus promoting rainwater retention in the area. The model also provided a basis for solar analysis, which informed the design and correct placement of a new avenue of trees. This not only contributes to improving microclimatic conditions by shading radiant surfaces but also restores the traditional rural character of the street.
Beyond these technical and environmental aspects, the model was instrumental in comprehensively designing spaces aimed at revitalizing social life, responding to the street’s historical function as a place for community gathering. It allowed for the precise allocation and design of new public areas, such as widened sidewalks, a small square, and seating zones with asymmetrically placed street furniture in a traditional rural style. Within the 3D environment, it was possible to verify that the placement of benches and bins respects lighting conditions, does not impede movement, and does not interfere with the planned vegetation. The model also helped in compositionally integrating new features like a children’s playground, a reconstructed historical well, and a dignified space in front of the Virgin Mary statue, all of which strengthen local identity and cultural awareness. This integrative approach, validated within the 3D model, ensures that the proposed solutions are not merely a collection of separate elements but form a functionally, ecologically, and socially interconnected and sustainable public space that actively encourages residents to interact and care for their surroundings.

4. Discussion

Digital models obtained through different data acquisition methods offer distinct possibilities for application in the landscape architectural design process of rural street restoration. The specific features and potential of models created using TLS, UAV photogrammetry, and CRP vary accordingly.

4.1. Results Obtained Using TLS Data

Models created through TLS exhibit the highest geometric accuracy compared to UAV RTK photogrammetry [20,21], enabling the detailed capture of surfaces and shapes, as demonstrated in the facade flatness analysis (Figure 11). These data are therefore exceptionally suitable as a reliable basis for the precise measurement of dimensions such as lengths, heights, areas, and volumes. Due to their accuracy, TLS models are ideal for producing detailed 2D or 3D CAD documentation, including floor plans, sections, elevations, and Digital Surface Models (DSMs).
Regarding visual quality, TLS primarily provides a point cloud, which may include RGB information. However, for photorealistic visualizations, TLS models often require additional processing, such as creating a polygonal mesh and applying textures. When a mesh is created, as in this study (Figure 9A), it can serve as an accurate geometric foundation for visualizations, onto which textures from other sources can be applied.
In the design process context, TLS data represent a key resource for detailed technical planning and engineering. They allow for analyses of the existing conditions with a high degree of certainty—for example, when assessing slopes, elevations, or identifying potential collisions—and serve as precise bases for integrating new elements into the planned scene.
TLS facilitates the high-precision capture of the complete 3D geometry of terrain and objects in a relatively short timeframe, rendering it an effective mapping tool, particularly for complex geometric structures. The resulting model demonstrated that the existing overlap was insufficient. Scanning from a limited number of positions results in data shadows, also known as occlusions, caused by obstructions. These can be mitigated by relocating the scanner and performing scans from multiple positions (stations). However, our study has shown that, for linear features, employing a greater number of scan stations makes the TLS method exceedingly time-consuming [22].
Point clouds can be registered either automatically or manually. TLS technology allows for the highly accurate acquisition of spatial data, typically achieving a precision of less than 1 cm. However, with a very dense distribution of measured points, an even higher level of accuracy can be attained, ranging from several millimeters to a few centimeters. Consequently, TLS data serve as a fundamental source in creating precise technical drawings, such as floor plans, 2D vertical sections, and elevations. These drawings are essential inputs for architectural, structural, and material analyses of objects [23].

4.2. Results from Data Acquired Using Aerial Photogrammetry

In other studies, aerial photogrammetry has been demonstrated to be a less precise method [24]; however, it is suitable for combining with other scanning types, such as TLS [25]. Factors that directly influence the results include flight altitude and sensor quality [26]. However, in comparison to TLS, the overall accuracy is satisfactory, typically falling within the centimeter range [27,28,29,30,31]. In the presented study, aerial photogrammetry utilizing UAVs demonstrated surprisingly good geometric accuracy, even in capturing fine details. Facade planarity analysis (Figure 11B) indicated that the UAV data-derived model largely corresponded with TLS results, successfully capturing subtle surface irregularities. This finding is particularly significant considering capture altitude and the fundamental principle of the photogrammetric method, which calculates models based on pixels rather than direct physical measurement [32].
Photogrammetry, which continues to undergo significant technological advancements through powerful algorithms and accessible computational technology, now allows for accuracies approaching those of laser scanning [33]. We consider UAV-based models to be suitable for mapping wider streetscapes and their immediate surroundings, providing a high-quality basis for creating orthophotomaps and Digital Surface Models (DSMs) (Figure 13 and Figure 15). The achieved accuracy is sufficient for both conceptual and detailed design phases. From a visual quality perspective, this method yields continuous textured 3D models of the entire area, with textures appropriate for overall aerial-perspective visualizations or contextual displays. UAVs do not present the same blind spots as TLS [24], which can be critical when mapping fine details and elements of minor architecture, particularly due to occluding objects such as vehicles. However, textures in fine details might be less sharp compared to close-range photogrammetry. Within the design process, UAV models are applicable for generating overview visualizations; integrating designs into a broader context; obtaining fundamental dimensions and shapes across the entire street; and analyzing vegetation structures, roofs, and the overall spatial layout. They are also well-suited for various GIS analyses, such as visibility, solar shading, and slope analyses over larger areas.

4.3. Results from Data Acquired Using Close-Range Photogrammetry

CRP utilizing smartphones generally exhibits satisfactory accuracy for static, single images [34]. Despite the mobile sensor possessing inferior technical specifications compared to compact digital cameras, the difference in resulting model accuracy is approximately 0.01 m [35]. When extracting image sequences from video, CRP demonstrates the lowest geometric accuracy among the methods applied in this study. This was evidenced by the facade planarity analysis (Figure 11C) and the street model deformation (Figure 8 and Figure 12). It was not possible to create image series for linear features, but only video recordings, which negatively impacted data quality. This resulted in a “distorted model” less suitable for precise measurements over longer distances or for generating accurate CAD documentation of the entire street. On smaller segments, such as a single facade, acceptable accuracy can be achieved regarding the placement of new elements and their visualization.
Despite the presence of geometric distortions, CRP models demonstrate superior visual quality and the highest texture sharpness (Figure 10C). Consequently, they are well-suited for creating detailed and attractive visualizations of specific elements, materials, and surface treatments. Geometric inaccuracies can be largely concealed by high-quality textures, particularly in static shots. In the design process, we consider the CRP method to be appropriate for generating visualizations of specific details and selected scenes, such as a view of a proposed section of a space or a detailed minor architectural element. It can also be used for the rapid documentation of the visual condition of elements or the conformance of existing and proposed materials, providing a source of detailed textures. In this context, geometric precision is not the primary concern; rather, visual appearance is paramount. For overall street views, it is less suitable due to potential distortions within the context of linear features.
In landscape architecture, identifying textures is essential for creating a cohesive and harmonious site design. This applies to urban furniture, small-scale architecture, and surface treatments for pathways and roads, all of which are designed to align with the character of the existing built environment. Textures strongly influence how users perceive a space, so when multiple textures appear in a spatial model, they are blended and refined into a more harmonious and improved design.
According to our study, processing data acquired photogrammetrically (UAV and CRP) requires a greater time investment; however, this computational work is performed by the computer, negating the need for manual technician oversight. In contrast, the processing of TLS data necessitates manual cleaning of interfering elements such as traffic, power lines, etc. With photogrammetry, electrical wiring is too insignificant to be registered in the model and moving traffic is automatically ignored.

5. Conclusions

This study confirmed that a representative digital model of a linear landscape feature can be obtained using low-cost data acquisition methods (Hypothesis H1). Aerial photogrammetry allows for the acquisition of a relatively high-quality linear feature model with low time requirements for field data capture. We anticipate that even for longer linear features, the time expenditure for UAV field data collection will not increase significantly.
Not all digital models presented in this study are usable for further processing within GIS and CAD environments (Hypothesis H2). From a precision standpoint, UAVs represent a reliable method that can be employed in GIS and CAD. Outputs from the CRP method exhibit lower accuracy and are therefore not independently usable in GIS and CAD environments. TLS data provide the highest precision but are associated with relatively higher costs and a more time-consuming data collection process.
UAV photogrammetry presents a favorable compromise for mapping extensive areas, offering satisfactory accuracy at moderate costs, albeit requiring more computationally intensive data processing. The CRP method is, indeed, extremely low-cost, acquiring data rapidly and producing superior textures; this is, however, at the expense of lower geometric accuracy and the risk of model deformations. It is thus primarily suitable for visualizing specific scenes.
For the landscape architect, understanding these characteristics and the limitations of each technology in relation to budget is crucial. In many instances, the most effective approach may involve a combination of methods. For example, one might utilize UAVs for the precise, area-wide acquisition of terrain geometry, major structures, and broader surrounding mapping, while employing CRP for detailed facade textures or to supplement occluded areas. This approach allows for an optimized cost–time–quality output ratio according to specific project requirements.
The models resulting from the methods mentioned serve as crucial data inputs for Landscape Information Modeling (LIM), an object-oriented approach for urban planning and design. This framework allows for the practical application of the data in sustainable urban development and participatory design, including infrastructure monitoring, environmental assessment, and the virtual prototyping of public spaces.

Author Contributions

Conceptualization, D.K., V.P., and Ľ.M.; methodology, Ľ.M. and D.K.; validation, V.P. and Ľ.M.; formal analysis, D.K. and Ľ.M.; investigation, D.K. and Ľ.M.; resources, D.K., V.P. and Ľ.M.; data curation, D.K.; writing—original draft preparation, D.K. and V.P.; writing—review and editing, D.K., V.P., and Ľ.M.; visualization, D.K. and Ľ.M.; supervision, V.P.; project administration, V.P.; funding acquisition, V.P. All authors have read and agreed to the published version of the manuscript.

Funding

This research was funded by Kultúrna a Edukačná Grantová Agentúra MŠVVaM SR (Cultural and Educational Grant Agency of the Ministry of Education, Research, Development and Youth of the Slovak Republic), under grant number 015SPU-4/2023.

Data Availability Statement

Data are contained within the article.

Conflicts of Interest

The authors declare no conflicts of interest.

Abbreviations

The following abbreviations are used in this manuscript:
DSMDigital Surface Model
RGBRed, Green, Blue
UAVUnmanned Aerial Vehicle
TLSTerrestrial Laser Scanning
CRPClose-Range Photogrammetry
LIMLandscape Information Modeling

References

  1. Ricker, B. Geospatial technologies and tools for data collection and communication: A Taxonomy. In Proceedings of the 22nd EGU General Assembly 2020, Online, 4–8 May 2020; Copernicus Publications (EGU): Vienna, Austria, 2020; p. 9008. [Google Scholar] [CrossRef]
  2. Cilek, A.; Berberoğlu, S.; Dönmez, C.; Ünal, M. Generation of high-resolution 3-D maps for landscape planning and design using UAV technologies. J. Digit. Landsc. Archit. 2020, 5, 275–284. [Google Scholar]
  3. Andrew, O.; Azmy, S.N.; Majid, Z. Evaluating terrestrial laser scanning (TLS) for hard and soft landscape mapping. Int. Arch. Photogramm. Remote Sens. Spatial Inf. Sci. 2023, XLVIII-M-1-2023, 439–444. [Google Scholar] [CrossRef]
  4. Iakushkin, O.; Selivanov, D.; Tazieva, L.; Fatkina, A.; Grishkin, V.; Uteshev, A. 3D Reconstruction of Landscape Models and Archaeological Objects Based on Photo and Video Materials. In Computational Science and Its Applications—ICCSA 2018; Gervasi, O., Murgante, B., Misra, S., Stankova, E., Torre, C.M., Rocha, A.M.A.C., Taniar, D., Apduhan, B.O., Tarantino, E., Ryu, Y., Eds.; Springer: Cham, Switzerland, 2018; Volume 10963, pp. 160–169. [Google Scholar]
  5. Kovanič, Ľ.; Peťovský, P.; Topitzer, B.; Blišťan, P.; Tokarčík, O. Analysis of the Qualitative Parameters of Mobile Laser Scanning for the Creation of Cartographic Works and 3D Models for Digital Twins of Urban Areas. Appl. Sci. 2025, 15, 2073. [Google Scholar] [CrossRef]
  6. Sohail, A.; Shen, B.; Cheema, M.A.; Ali, M.E.; Ulhaq, A.; Babar, M.A.; Qureshi, A. Beyond Data, Towards Sustainability: A Sydney Case Study On Urban Digital Twins. PFG 2025, 93, 365–377. [Google Scholar] [CrossRef]
  7. Hooli, M. Digital Twins and Urban Planning: Designing Smarter, More Inclusive Cities. Eur. J. Comput. Sci. Inf. Technol. 2025, 13, 104–112. [Google Scholar] [CrossRef]
  8. Luo, J.; Zhao, T.; Cao, L.; Biljecki, F. Semantic Riverscapes: Perception and evaluation of linear landscapes from oblique imagery using computer vision. Landsc. Urban Plan. 2022, 228, 104569. [Google Scholar] [CrossRef]
  9. Rajec, A.; Félix, R.; Šuráb, M. Dražovce Minulosť a Prítomnosť (1113–1996); Vydavateľstvo EKO: Nitra, Slovakia, 1996; pp. 7–29. [Google Scholar]
  10. Leica ScanStation P20—Product Specifications. Available online: https://downloads.leica-geosystems.com/files/archived-files/Leica_ScanStation_P20_DAT_us.pdf (accessed on 1 July 2025).
  11. Surface Flatness—Help 2021.2. Available online: https://cyclone3dr.leica-geosystems.com/help/2021.2/SurfaceFlatnessC.html (accessed on 3 July 2025).
  12. Pilot Dronu—Specialista na Fotogrammetrii a Laserové Skenování. Available online: https://dronpro.cz/pilot-dronu-specialista-na-fotogrammetrii-a-laserove-skenovani (accessed on 28 August 2025).
  13. Aerial Photography and Digital Photogrammetry. Available online: https://www.cranfield.ac.uk/courses/short/environment/aerial-photography-and-digital-photogrammetry (accessed on 3 July 2025).
  14. 5-Day General Drone Photogrammetry Training Course. Available online: https://store.ired.co.uk/products/5-day-general-drone-photogrammetry-training-course (accessed on 3 July 2025).
  15. ARC Aerial Imaging Training. Available online: https://www.arcaerialimaging.com/training (accessed on 3 July 2025).
  16. 2025 Photogrammetry and Splats with Phones Courses—Educators in VR. Available online: https://educatorsinvr.com/2025/01/03/2025-photogrammetry-and-splats-with-phones-courses/ (accessed on 3 July 2025).
  17. 3D Reconstructor Course with Photogrammetry—3D Geodata Academy. Available online: https://learngeodata.eu/3d-reconstructor-formation/ (accessed on 3 July 2025).
  18. Individual Online Training: Terrestrial Laser Scanning—Boutique en Ligne. Available online: https://shop.laserscanning-europe.com/Individual-Online-Training-Terrestrial-Laser-Scanning (accessed on 3 July 2025).
  19. Reality Capture Training Courses-- Leica Geosystems. Available online: https://leica-geosystems.com/en-gb/services-and-support/training/reality-capture-training-courses (accessed on 3 July 2025).
  20. Abd-Elmaaboud, A.; El-Tokhey, M.; Ragheb, A.; Mogahed, Y. Comparative assessment of terrestrial laser scanner against traditional surveying methods. Int. J. Eng. Appl. Sci. 2019, 6, 79–84. [Google Scholar]
  21. Arkali, M.; Atik, M. Accuracy Assessment of RTK, PPK, and PPP-AR Techniques for Direct Georeferencing in UAV-Based Photogrammetric Mapping. Int. Arch. Photogramm. Remote Sens. Spat. Inf. Sci. 2025, 48, 325–330. [Google Scholar]
  22. Hofierka, J.; Šašak, J.; Šupinský, J.; Gallay, M.; Kaňuk, J.; Sedlák, V. 3D mapovanie krajiny pomocou pozemného a leteckého laserového skenovania. Zivotn. Prostr. 2017, 51, 21–27. [Google Scholar]
  23. Karandušovská, I.; Žitňák, M. (Eds.) Vidiecke Stavby v Európskych Regiónoch: Architektúra, Konštrukcie, Architektúra—Konštrukcie—Technológie—Bezpečnosť II/Rural Buildings in European Regions: Architectural—Construction—Technology—Safety II; Slovenská Poľnohospodárska Univerzita v Nitre: Nitra, Slovakia, 2014. [Google Scholar]
  24. Marčiš, M.; Fraštia, M. Fotogrametria ako efektívny pomocník geodeta na príklade zamerania stavebného objektu. Geodézia Kartogr. 2018, 64, 233–236. [Google Scholar]
  25. Małyszek, H.; Stachula, S.; Kępowicz, B. The Case Study of Using Photogrammetric Systems and Laser Scanning for Three-Dimensional Modeling of Cultural Heritage Sites. Adv. Sci. Technol. Res. J. 2023, 17, 345–357. [Google Scholar] [CrossRef] [PubMed]
  26. Marčiš, M.; Fraštia, M.; Vošková, K. Potential of Low-Cost UAV Photogrammetry for Documenting Hard-to-Access Interior Spaces Through Building Openings. Heritage 2024, 7, 6173–6191. [Google Scholar] [CrossRef]
  27. Naumann, M.; Geist, M.; Bill, R.; Niemeyer, F.; Grenzdörffer, G. Accuracy comparison of digital surface models created by unmanned aerial systems imagery and terrestrial laser scanner. Int. Arch. Photogramm. Remote Sens. Spat. Inf. Sci. 2013, 40, 281–286. [Google Scholar]
  28. Bolognesi, M.; Furini, A.; Russo, V.; Pellegrinelli, A.; Russo, P. Accuracy of cultural heritage 3D models by RPAS and terrestrial photogrammetry. Int. Arch. Photogramm. Remote Sens. Spatial Inf. Sci. 2014, XL-5, 113–119. [Google Scholar] [CrossRef]
  29. Lee, J.; Sung, S. Assessment of Positioning Accuracy of UAV Photogrammetry based on RTK-GPS. J. Korea Acad.-Ind. Coop. Soc. 2018, 19, 63–68. [Google Scholar]
  30. Mora, O.; Chen, J.; Stoiber, P.; Koppanyi, Z.; Pluta, D.; Josenhans, R.; Okubo, M. Accuracy of stockpile estimates using low-cost sUAS photogrammetry. Int. J. Remote Sens. 2020, 41, 4512–4529. [Google Scholar] [CrossRef]
  31. Kovanič, L.; Blistan, P.; Štroner, M.; Urban, R.; Blistanová, M. Suitability of aerial photogrammetry for dump documentation and volume determination in large areas. Appl. Sci. 2021, 11, 6564. [Google Scholar] [CrossRef]
  32. Sayyaparaju, U.L.V. Reconstruction of archaeological sites using aerial photogrammetry. Int. J. Adv. Res. Innov. Ideas Educ. 2023, 9, 697–703. [Google Scholar]
  33. Skladan, M.; Vybošťok, J.; Chudá, J.; Lieskovský, M.; Gejdoš, M. Diameter at breast height estimation by innovative close-range technologies of fast-growing trees plantations. In Fast-Growing Trees and Plants Grown for Energy Purposes: Theory and Good Practices of Growing and Energy Use of Bio-Mass; Kišš, V., Civáňová, Ľ., Kováčik, M., Eds.; Slovak University of Agriculture in Nitra: Nitra, Slovakia, 2022; pp. 38–43. [Google Scholar]
  34. Fabris, M.; Fontana Granotto, P.; Monego, M. Expeditious Low-Cost SfM Photogrammetry and a TLS Survey for the Structural Analysis of Illasi Castle (Italy). Drones 2023, 7, 101. [Google Scholar] [CrossRef]
  35. Konstantakis, M.; Trichopoulos, G.; Aliprantis, J.; Gavogiannis, N.; Karagianni, A.; Parthenios, P.; Serraos, K.; Caridakis, G. An Improved Approach for Generating Digital Twins of Cultural Spaces through the Integration of Photogrammetry and Laser Scanning Technologies. Digital 2024, 4, 215–231. [Google Scholar] [CrossRef]
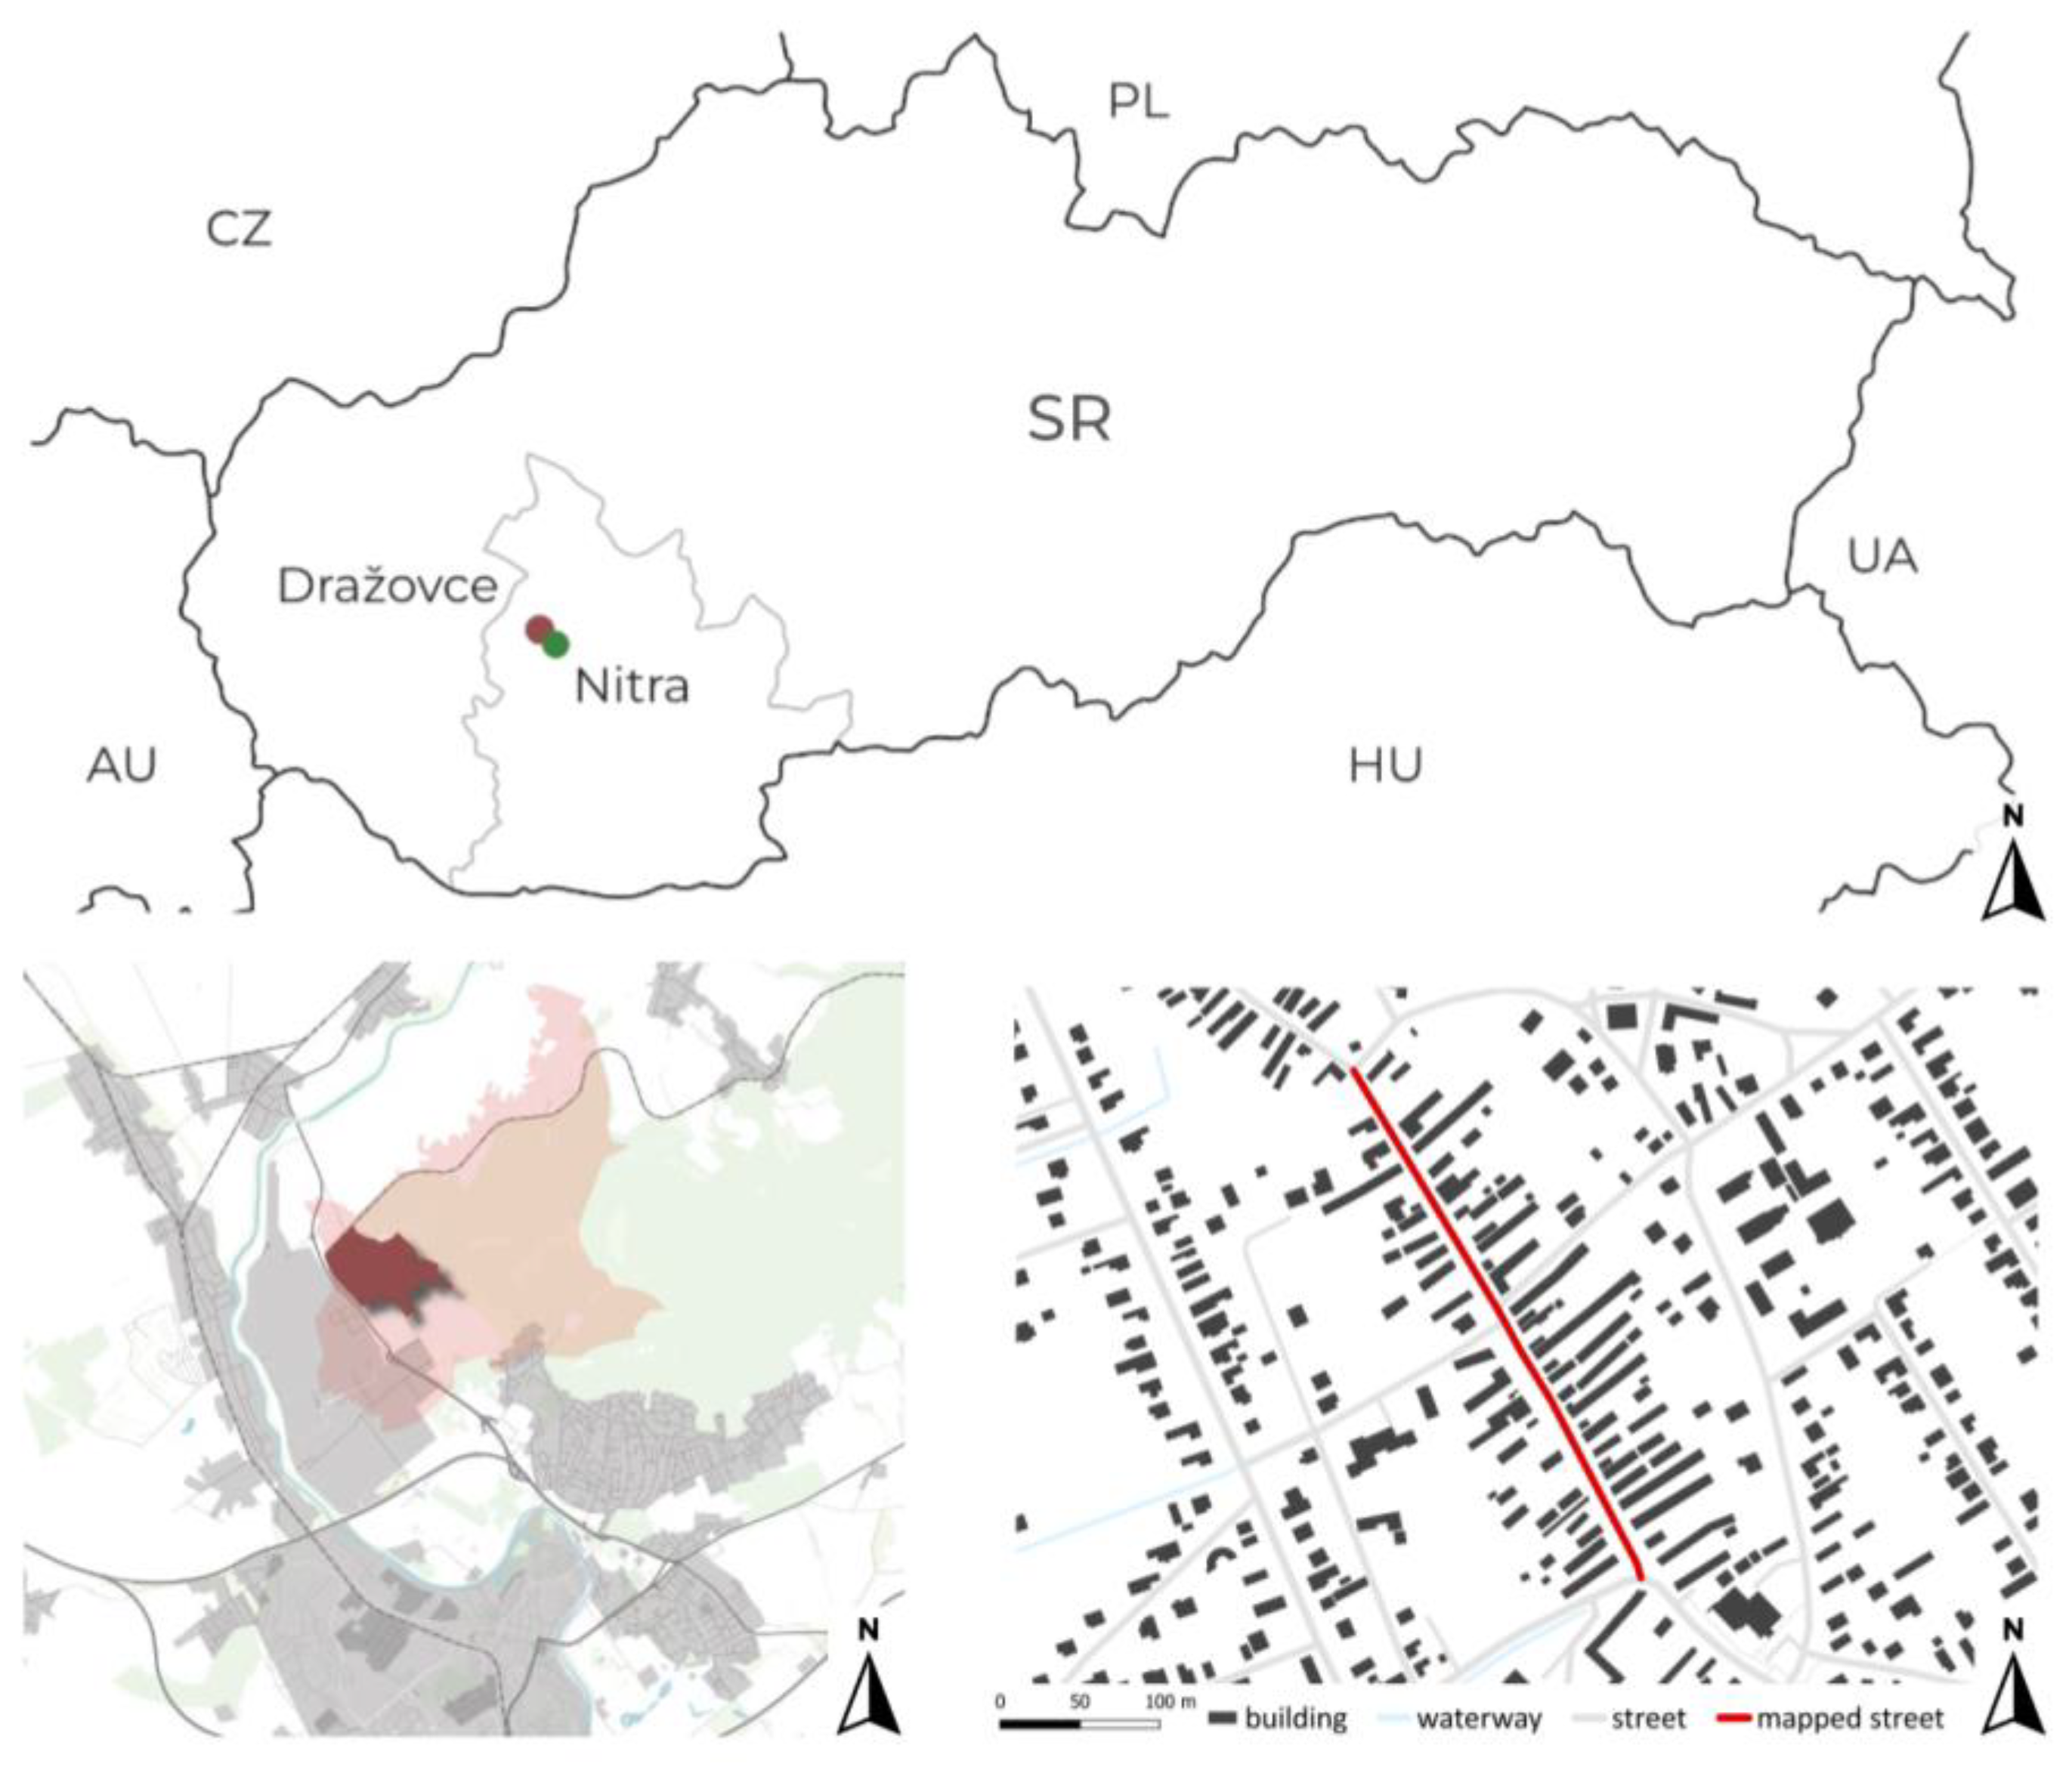
Figure 1. Location of the Dražovce district within the city of Nitra (left). The red line indicates the subject of this study—a rural street that once served as the central axis of formerly independent Dražovce (right).
Land 14 01790 g001
Figure 2. Overall methodological workflow.
Land 14 01790 g002
Figure 3. Positioning of TLS scanner stations (red dots) along the street in the Dražovce area (Nitra).
Land 14 01790 g003
Figure 4. Division of the linear street object into six segments (each in a different color), representing homogeneous areas for easier data processing.
Land 14 01790 g004
Figure 5. Placement of camera positions (red dots) above the 3D model completed by UAV photogrammetry.
Land 14 01790 g005
Figure 6. Raw results of different data capture methods: bilateral street scanning (A), direct one-sided street scanning (B), and direct one-sided scanning with horizontal lens orientation (C). The quality improves from (AC).
Land 14 01790 g006
Figure 7. Operator’s street capture methods: scanning both sides of the street along its longitudinal axis with smooth horizontal camera rotation ±60° (A); direct one-sided street scanning (B); and direct one-sided scanning with horizontal camera rotation ±30° (C). Street axis (dashed line), operator’s path (red line) and camera shooting direction (red marks).
Land 14 01790 g007
Figure 8. Impact on the final model and reconstructed camera positions (red box): one-sided street scanning with the camera stably oriented perpendicularly to facades resulted in uneven point density (red box) and misaligned camera positions (A), in comparison with direct one-sided scanning with horizontal camera rotation ±30° (B).
Land 14 01790 g008
Figure 9. Street segment mesh results from TLS (A), aerial photogrammetry (B), and close-range photogrammetry (C). TLS output shows insufficient overlap between the fields of view of different stations (A), while close-range photogrammetry (C) has lower input data quality (images).
Land 14 01790 g009
Figure 10. Visual representation of the building facade model acquired using three methods: (A) terrestrial laser scanning (TLS), (B) aerial photogrammetry (UAV), and (C) close-range photogrammetry (smartphone). Red rectangles indicate areas selected for detailed surface flatness analysis (see Figure 10), while red crosses mark elements (windows, doors) excluded from the flatness evaluation.
Land 14 01790 g010
Figure 11. Quantitative flatness analysis of selected facade segments for models obtained by (A) TLS, (B) UAV photogrammetry, and (C) close-range photogrammetry. The color scale at the top of each segment visualizes point deviations from the ideal plane: deviation within ±0.5 cm (green), positive deviation > 0.5 cm (red), negative deviation < −0.5 cm (blue). The orange curve and presented percentage values represent the point distribution within the respective deviation zones.
Land 14 01790 g011
Figure 12. Deformation in the CRP model (blue points) compared to the UAV model. The integrated CRP data (blue points) highlight misalignments between the generated models, especially along roof edges, while also effectively supplementing missing gate details.
Land 14 01790 g012
Figure 13. Raw street model acquired via UAV photogrammetry. Spring drone photogrammetry missed trees without leaves, which appear as green blotches between rooftops. Tree inventory was supplemented with TLS data.
Land 14 01790 g013
Figure 14. Visualization of the street revitalization design, created using the 3D model as an analytical baseline and precise geometric foundation. The proposed modifications include traffic calming through new sidewalks, microclimate improvement by planting an avenue of trees, and the implementation of water retention measures in the form of permeable surfaces and rain gardens.
Land 14 01790 g014
Figure 15. Orthophotomosaic (UAV photogrammetry), serving as a precise geometric and analytical foundation for the street’s revitalization design and facilitating analyses of functional zoning and the identification of existing spatial conflicts, such as vehicle–pedestrian conflicts and parking obstructing traffic flow.
Land 14 01790 g015
Table 2. Comparison of time requirements (min.) for individual phases of data acquisition and processing using terrestrial laser scanning (TLS), aerial photogrammetry (UAV), and close-range photogrammetry (CRP) for mapping a linear feature of a rural street (360 m in length).
ProcessTLSUAV PhotogrammetryCRP
TaskTime (min)TaskTime (min)TaskTime (min)
PreparationSpatial analysis for the location of TLS sites15Enter Fly Task10-0
Data collectionTripod placement, self-test of the 3D scanner6UAV preparation in the field5First-Side Street Capture4.5
Scanning with specified field of view, alignment of the tripod and scanner and resolution at the scan station (1 to 9) times76.5Flying process30Second-Side Street Capture4.5
Data processingPoint cloud registration and noise cleaning, reduction in the number of points120Point cloud generation and registration3.78Point cloud generation6.35
Point-cloud registration10
Meshing10Meshing and Texturing197.2Meshing and Texturing113
Table 3. Comparison of estimated costs for technical equipment, software, and required operator qualification (training) across different data acquisition methods. Costs are calculated as the average of six price quotes, excluding the highest and lowest values.
Cost Type TLSUAV PhotogrammetryClose-Range Photogrammetry
Cost ItemValue (€)Cost ItemValue (€)Cost ItemValue (€)
EquipmentTLS Leica P207110DJI Mavic 3 Enterprise RTK3606Mobile phone0
SoftwareCloudCompareFree Open-sourceRealityCaptureFree License TierReality CaptureFree License Tier
LaborCourse1008Course1128Course558
Disclaimer/Publisher’s Note: The statements, opinions and data contained in all publications are solely those of the individual author(s) and contributor(s) and not of MDPI and/or the editor(s). MDPI and/or the editor(s) disclaim responsibility for any injury to people or property resulting from any ideas, methods, instructions or products referred to in the content.