1. Introduction
With the increase in population density alongside increasing urban populations, substantial pressure is placed on already contested space within streets, particularly on ‘main streets’ which feature high vehicle traffic and movement of goods, which need to provide for pedestrian and cycling movement, as well being functional for retail and commercial activity. The expansion of our urban centres necessitates a strategic focus on the pedestrian experience. It is imperative that urban policy and streetscape design actively foster safe, comfortable, and accessible walking conditions. The core objective must be to ensure all residents have equitable access to key destinations on foot, including public transport, retail precincts, healthy food outlets, and parks and recreation facilities [
1].
Streets, especially main streets, are fundamental to the fabric of cities, serving as both conduits for movement and spaces for social interaction and placemaking [
2]. Despite their centrality to urban life, streetscape design is often prioritised for functionality over experiential quality, with limited consideration of how design elements shape human perception and behaviour [
3]. Among these elements, trees have emerged as a critical component of urban infrastructure, offering environmental, aesthetic, and psychological benefits [
4]. Yet, while the value of trees is widely acknowledged, empirical evidence quantifying their impact on streetscape perception remains limited [
5].
Trees contribute to urban environments in multifaceted ways. They mitigate urban heat islands, improve air quality, and enhance biodiversity [
6], while also playing a significant role in shaping human experiences including perceptions of safety, comfort, and attractiveness, fostering a sense of place and well-being [
7,
8,
9]. However, the mechanisms through which trees influence these perceptions are not fully understood, particularly in the context of streetscape design. This study aims to provide clarity by systematically examining the perceptual impacts of trees through controlled, immersive simulations.
Traditional methods of studying streetscape perception, such as field observations and surveys, have provided valuable insights but are often constrained by their inability to isolate specific variables or simulate alternative design scenarios [
10]. Immersive virtual environments (IVEs) offer a promising alternative, enabling researchers to create realistic, controllable simulations of urban spaces and systematically gather data on human perceptions [
11]. When combined with e-participation tools, IVEs also democratise the design process, engaging diverse stakeholders in the evaluation of streetscape designs [
12]. This study leverages these technologies to explore the role of trees in shaping public perceptions of streetscapes.
The research addresses a central question: Do trees significantly influence how people perceive and experience streets? By simulating streetscapes with varying tree densities, placements, and species, this study seeks to uncover the nuanced ways in which trees contribute to perceptions of traffic safety, comfort, and attractiveness. The findings aim to provide evidence-based insights for urban designers, planners, and policymakers, supporting the integration of trees into streetscapes as a means of enhancing urban liveability.
The implications of this research are both practical and theoretical. In an era of rapid urbanisation and climate change, the need to create sustainable, resilient, and liveable cities has never been more urgent [
13]. Trees, as this study demonstrates, are not merely decorative elements but essential components of urban infrastructure. By understanding how trees shape perceptions of streets, we can design spaces that are not only functional but also enriching and inclusive.
2. Background and Key Literature
2.1. The Importance of Streets in Urban Environments
Streets constitute approximately 80% of public space in cities, making them central to the daily experiences of urban dwellers [
14]. Therefore, the design of our roads and streets is a fundamental determinant of a city’s liveability, directly influencing community safety, physical activity, and public health. As the Future Transport Strategy 2056 establishes, effective street design must successfully balance facilitation of movement of people and goods while also serving as a vital place for community life [
15]. This integrated approach is advanced by the Road Safety Plan 2021, a supporting strategy that explicitly identifies the creation of safe and liveable urban environments as a critical priority for achieving the state’s road safety objectives [
16].
Streets are not merely conduits for movement but also vital spaces for social interaction, economic activity, and cultural expression [
2]. However, in cities that developed alongside the automobile, street design has historically prioritised car movement over pedestrian comfort and placemaking [
3]. This legacy has resulted in streetscapes that often feel unsafe, unwelcoming, and disconnected from the needs of people [
17].
As cities grapple with the challenges of climate change, urbanisation, and public health, there is a growing recognition of the need to redesign streets to support sustainable transport options such as walking, cycling, and public transit [
13]. While the need for change is well established, there is a lack of empirical evidence on which specific design interventions have the most positive impact on pedestrian experience, perceptions of traffic safety, and the uptake of sustainable transport options [
18]. This knowledge gap hinders the ability of urban planners and policymakers to make informed decisions about street design.
2.2. Potential Interventions for Improving Streetscapes
A range of interventions have been proposed to enhance the safety and pleasantness of streets, particularly in car-dominated cities. These include the following.
Reducing traffic speed: Slower vehicle speeds are associated with improved pedestrian safety and comfort [
19].
Increasing separation from traffic: Physical distance between pedestrians and vehicles can reduce perceived risk and enhance comfort [
20].
Adding barrier separations: Elements such as trees, vegetation, and fencing can provide both physical and psychological separation from traffic [
4].
Improving crossing infrastructure: Adjustments to pedestrian crossings, such as raised platforms and shorter crossing distances, can enhance the pedestrian experience [
21].
Among these interventions, increasing tree canopy cover is often considered the most desirable option due to its multiple co-benefits. Trees not only improve the aesthetic quality of streets but also contribute to climate resilience, human health, and a sense of place [
5]. However, the role of trees in shaping perceptions of safety and comfort is complex and context-dependent, requiring further investigation.
2.3. The Role of Trees in Urban Streetscapes
The impact of trees on perceptions of safety is not straightforward. Responses to trees can vary depending on the perceived threat. For example, trees may create a sense of enclosure and imageability that enhances the overall character of a neighbourhood, but this same sense of enclosure can elicit different responses depending on whether the perceived threat is crime or traffic [
18]. There are conflicting results from various studies on perceptions of safety and trees. While trees are positively correlated with neighbourhood-level perceptions of safety [
17,
21,
22], their impact on street-level perceptions of safety from traffic is surprisingly low [
18]. This conflict of results highlights the need for nuanced research into how trees influence perceptions of safety in different contexts.
Furthermore, a significant bias exists within transportation safety guidance. Roadside trees are often categorised as a safety hazard for drivers, with guidelines predominantly informed by studies of high-speed rural roads, where fixed-object collisions are a serious concern. The application of these findings to low-speed urban local streets, however, is less rigorously substantiated [
23]. Conversely, there is a notable lack of data quantifying the potential protective benefits of street trees. This includes their role in preventing pedestrian fatalities by acting as a physical barrier against errant vehicles [
24] or in passively enforcing lower vehicle speeds through the psychological effect of a visually enclosed streetscape [
25].
Despite these safety debates, the positive contribution of tree canopy cover to the perceived quality and character of a street is well established. A continuous canopy significantly enhances the sense of place through increased imageability and enclosure, principles first articulated by Henry Arnold [
26]. This creation of a defined, coherent streetscape is itself a critical factor influencing overarching perceptions of a safe and pleasant environment.
2.4. Potential Approaches to Eliciting Perceptions of Streetscapes
Understanding how people perceive streetscapes requires robust methods for eliciting and analysing responses to streetscape stimuli. Traditional approaches, such as memory-based or image-based surveys and revealed-preference studies, have provided valuable insights, but are often limited by their inability to control for confounding factors [
10]. Such methods rely on the memory of participants or the interpretation of spaces based on two-dimensional drawings or three-dimensional still images such as photographs, manipulated photographs, or generated 3D perspective images (by digital modelling or generative AI [
10]. Immersive virtual environments (IVEs) offer a promising alternative, enabling researchers to create realistic, controllable simulations of urban spaces and gather data on human perceptions in a systematic manner [
11]. By minimising confounding variables within a virtual environment, variable changes can be controlled using a ‘discrete choice’ process developed for marketing and psychology experimentation [
27]. IVEs allow for the precise manipulation of singular design variables, such as tree density, placement, and species, while controlling for external factors like weather and lighting. When combined with e-participation tools, IVEs also ‘democratise’ the design process, engaging diverse stakeholders in the evaluation of streetscape designs [
12]. Other methods, such as emotion sliders and perceived preference surveys, can complement IVEs by capturing the emotional and cognitive dimensions of streetscape perception [
18,
20].
There is potential to overcome traditional limitations of place-based studies to gather quantifiable data from diverse demographic groups by combing UX metrics, IVE technology (including spatial audio), and e-participation methods to rigorously assess how individual streetscape variables, particularly tree presence and configuration, influence public perception at scale, to understand the impact of individual variables on larger sectors of society than directly impacted stakeholder groups. A hybrid IVE e-participation approach has the potential to generate quantifiable results across remote participant pools, even when surveys are accessed through diverse devices. By leveraging the IVE’s controlled parameters, vegetation impacts could be isolated from other streetscape variables, a critical capability for evaluating urban greening interventions.
2.5. Research Aim
This work was part of a larger study developed in collaboration with the major Transport Authority for the state of New South Wales, Australia (TfNSW), with the key objective of gathering affective, revealed, and stated preferences for a series of streetscape design interventions with the potential to improve perceptions of traffic safety and place. While the broader study tested a range of variables from speed reduction and crossing types to barrier fences and cycle lanes, this paper particularly focuses on the effect of trees on perceptions of safety and place.
In this paper, we aim to address the knowledge gap regarding how trees influence perceptions of streetscapes, particularly in terms of traffic safety and comfort, to provide evidence-based insights for urban designers, planners, and policymakers, supporting the integration of trees into streetscapes as a means of enhancing urban liveability.
To address this aim, we have used an IVE-based e-participation framework to explore the following questions:
What impact do trees have on the perceptions of street safety, comfort, and place for pedestrians on busy commercial streets?
How do trees shape perceptions of safety, comfort, and attractiveness in urban streetscapes?
Do people’s stated preferences match their revealed perceptual preferences for trees in streets?
And ultimately, do trees really make a difference to our perceptions of streets?
3. Method: Developing an Immersive Virtual Environment E-Participation Streetscape Study
To answer these questions, we developed an interactive, immersive virtual environment e-participation streetscape study survey aimed at understanding citizen preferences, both stated and revealed, for a selection of different streetscape safety interventions. The approach included discrete choice experimentation, as described by Louviere et al. [
27]. This process allowed for variable changes to explore variations in specific streetscape elements.
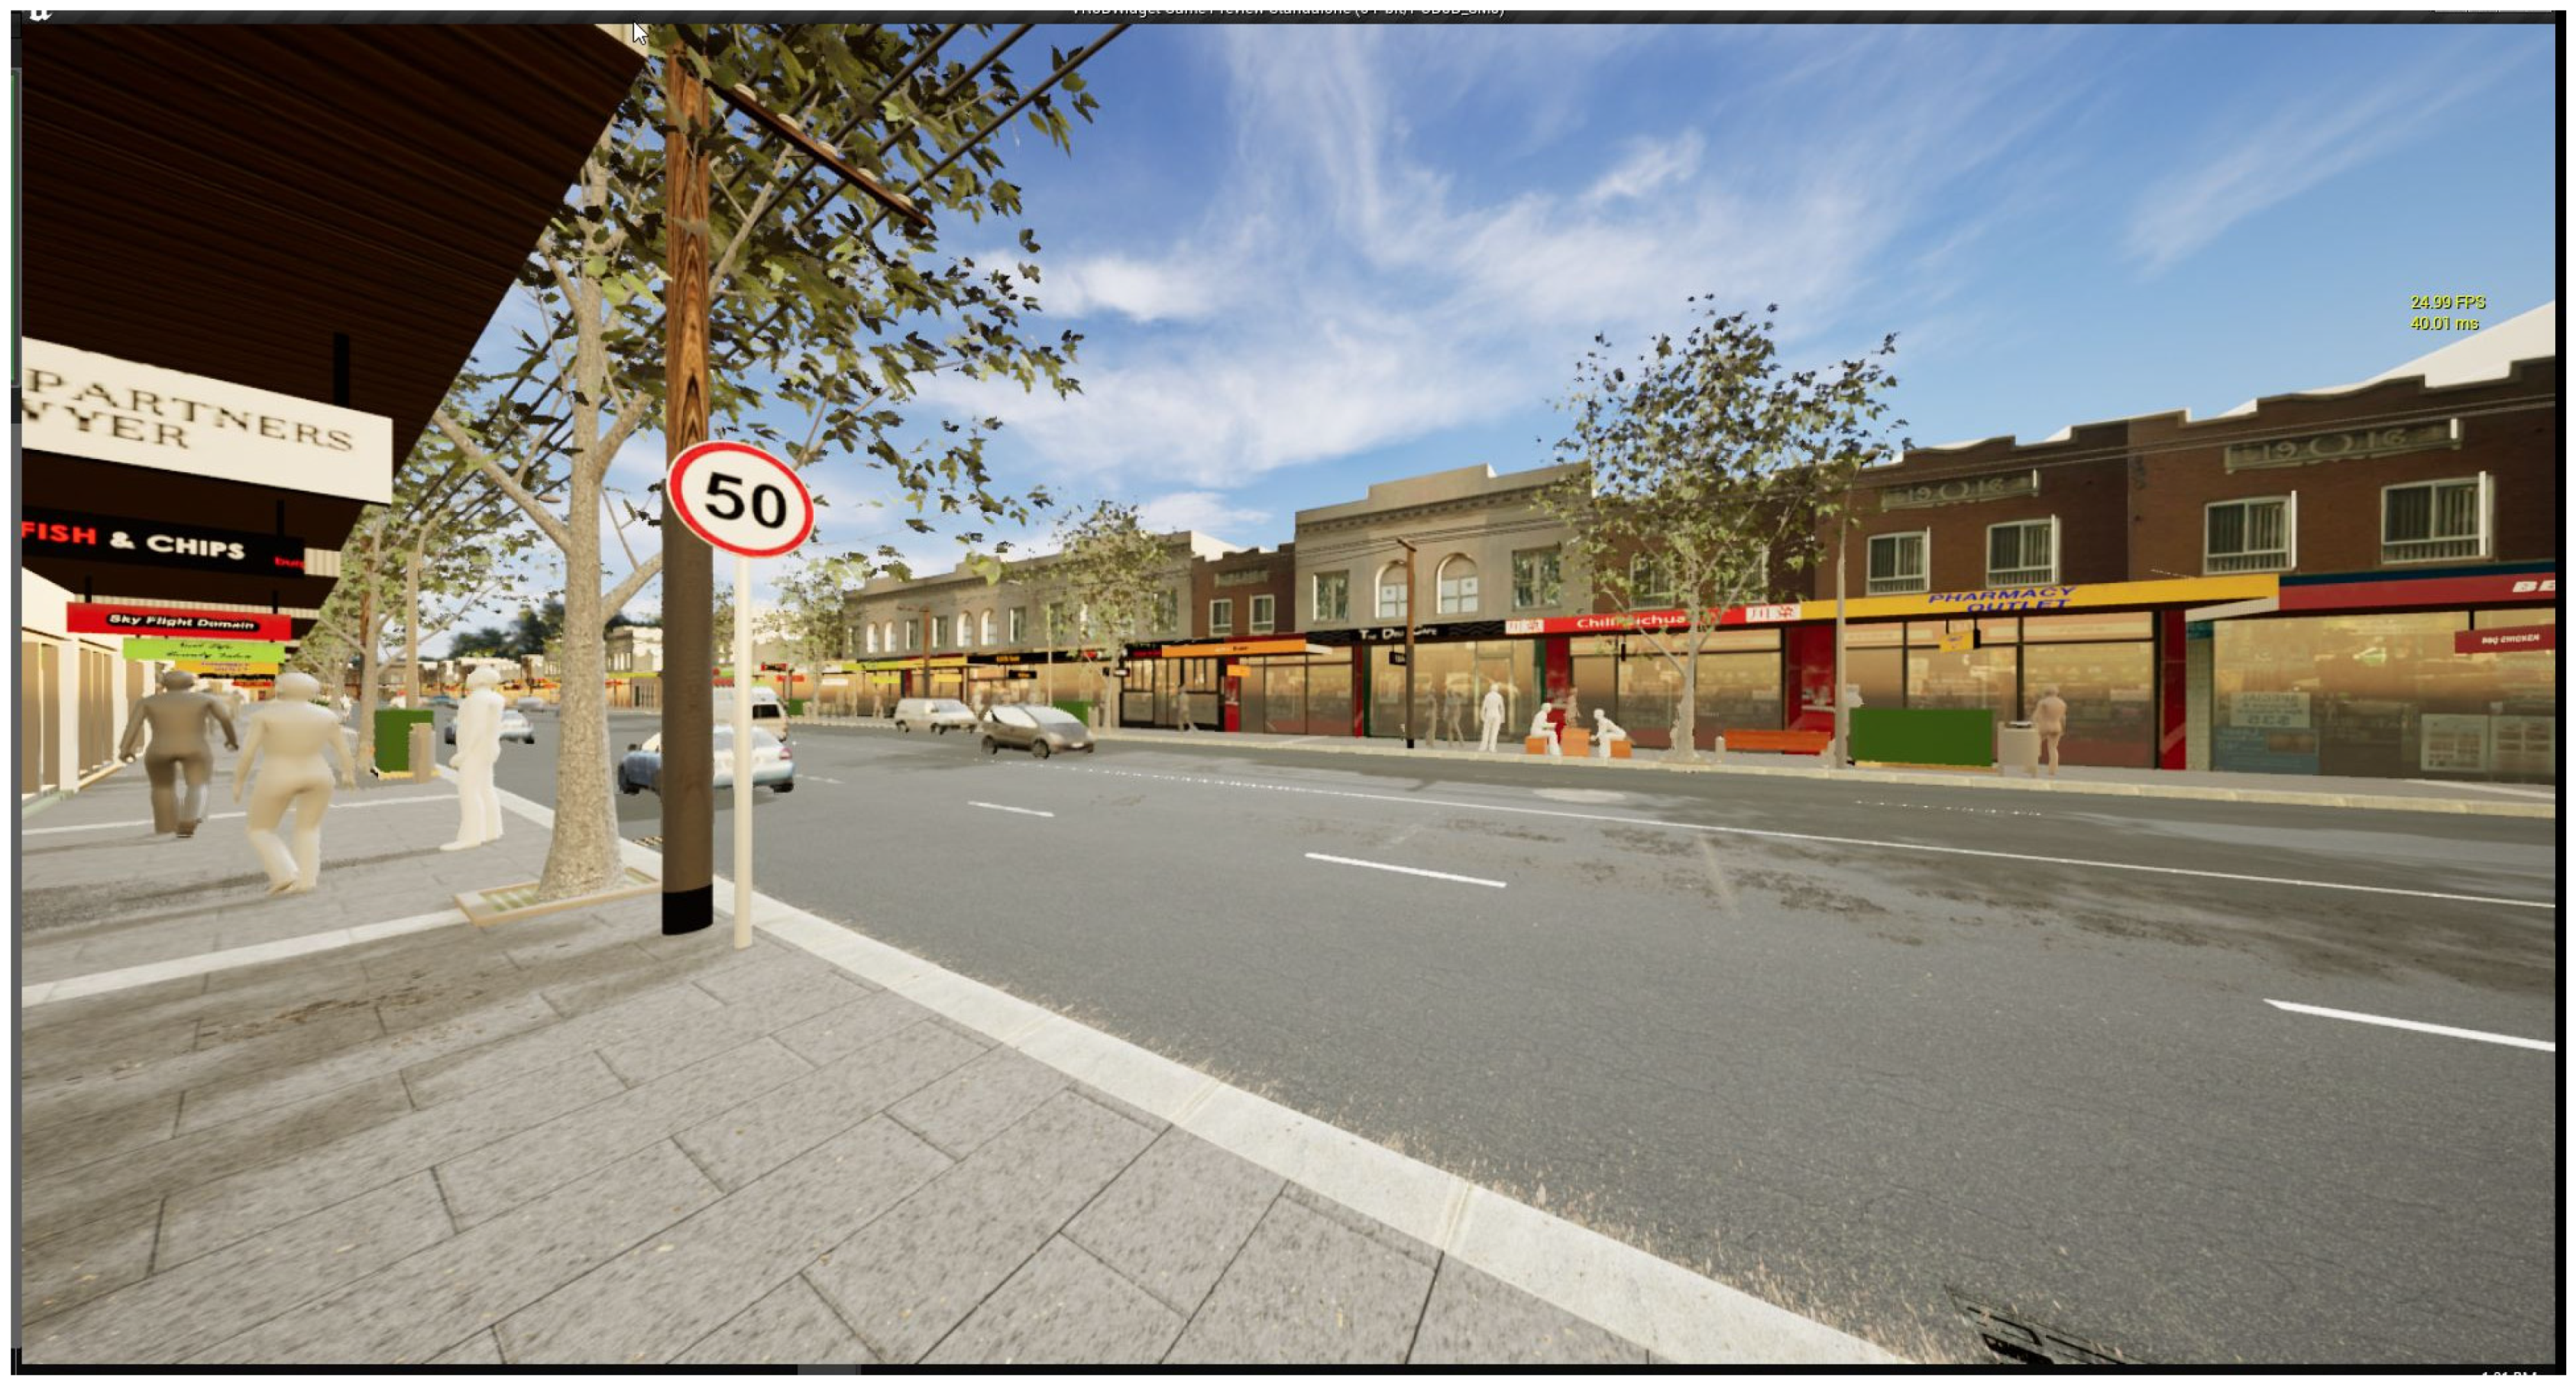
Our methodological approach commenced with the establishment of a ‘baseline’ scenario. This model represented a typical, busy commercial main street, configured with two traffic lanes in each direction and a posted speed limit of 50 km/h. This baseline served as the control condition against which all subsequent interventions were measured. We then systematically modified this streetscape to incorporate specific treatments, such as an increase in street canopy cover. A critical aspect of the methodology was to hold all other variables constant, or as similar as practicable, to isolate and identify the specific effects of the canopy intervention.
IVEs were produced for each scenario, which were to be viewed as 360-degree videos combining a combination of visual environmental feedback that helps the user to interpret the sensory cues as described by Bernhard et al. [
28], and auditory feedback as described by Nordahl & Nilsson [
29] and Lokki & Grohn [
30]. Survey questions following the IVE prompted participants to answer questions with a ranking preference, adapted from the ‘emotion/affect slider’ as described by Betella & Verschure [
31], with the ‘visual analogue scale’ as described by Klimek et al. [
32].
Subsequent sections of this paper delineate the five principal stages of our methodological approach. The procedure commenced with the identification of specific variables designated for testing within the streetscape models. Following this, an animated, digital three-dimensional model of the street environment was constructed. The third phase involved the development of an online survey. This instrument incorporated the embedded digital environments and was composed of demographic questions, a rating system for perceptual and emotional affect using sliders and a grid (a measure we term ‘revealed preference’), and stated-preference questions requiring the ranking of options. The fourth step was the recruitment of participants for the survey. The process concluded with a comprehensive statistical analysis of the collected results.
We give a broad overview of the five-step method undertaken for this study, but do not go into the technical aspects of the modelling and e-survey setup, which are both detailed elsewhere [
11].
3.1. Variable Identification
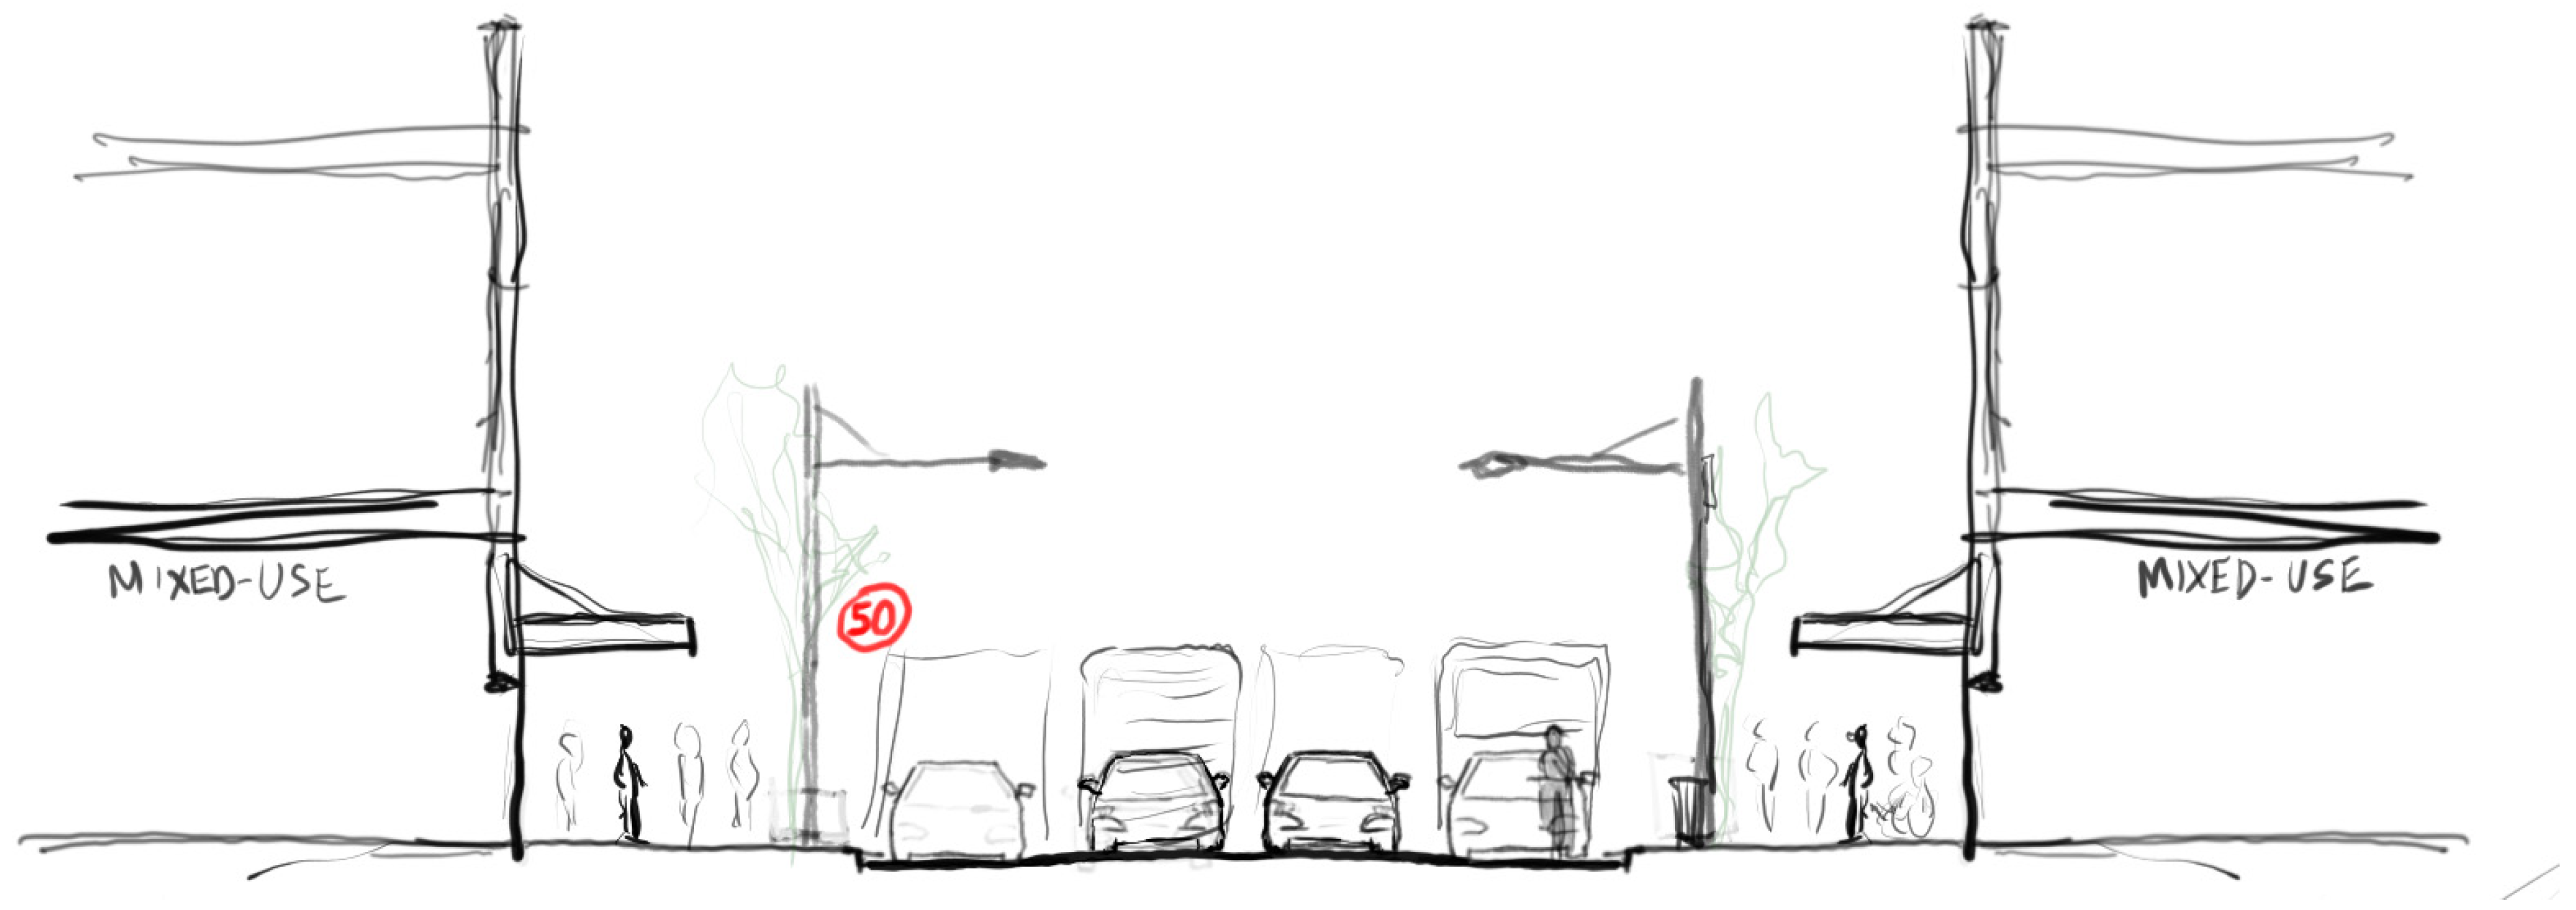
For this study, a comparative set of scenarios was produced through two workshops conducted with the TfNSW stakeholder group. These scenarios were prioritised based on importance to stakeholders, ensuring comparability, and modelling feasibility. One ‘baseline’ of a challenging, high-volume of traffic movement, ‘main street’ (
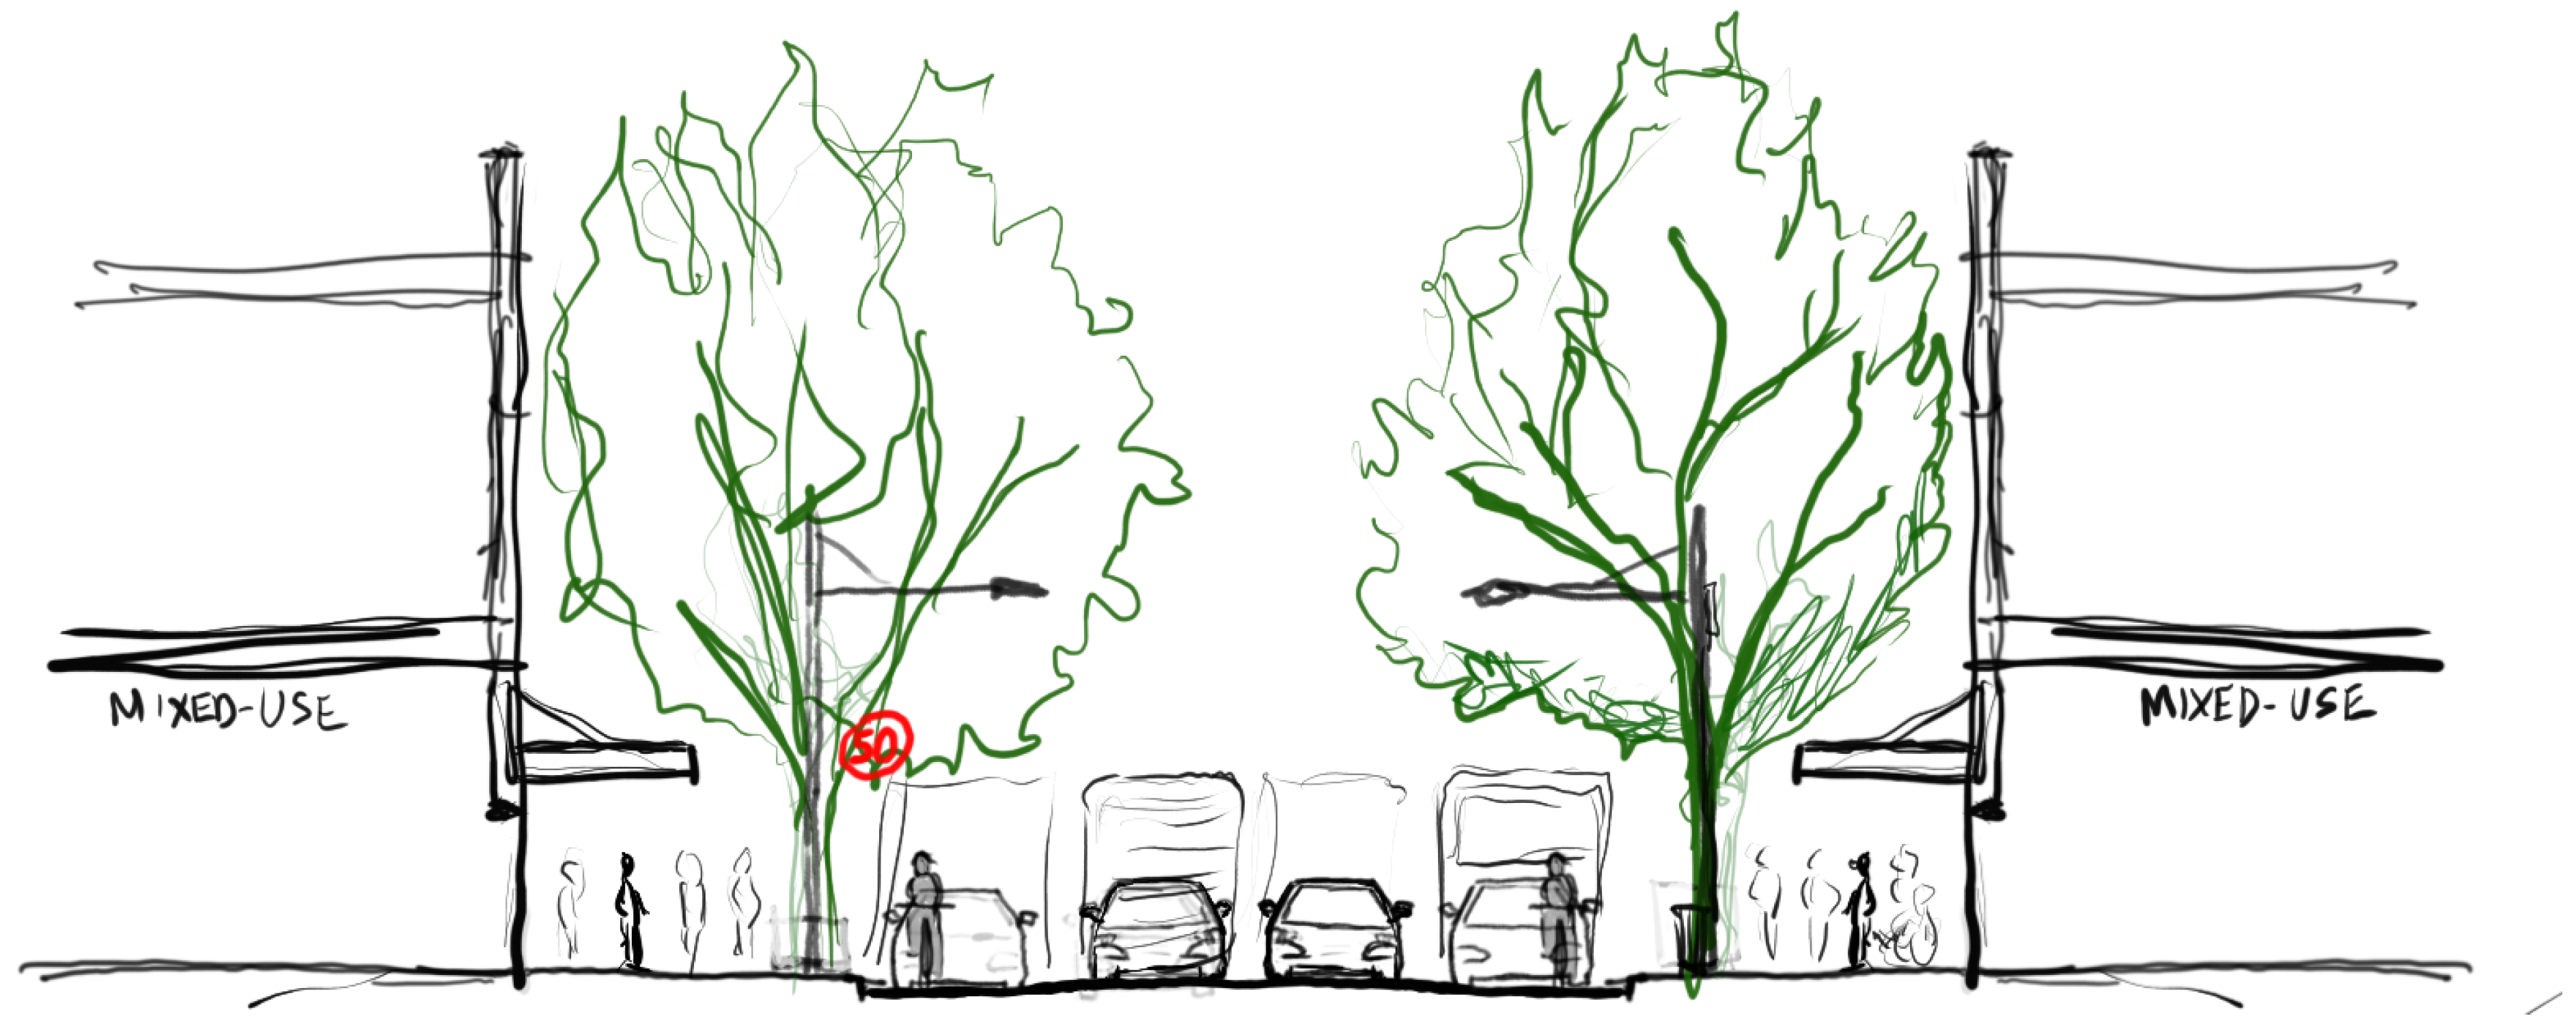
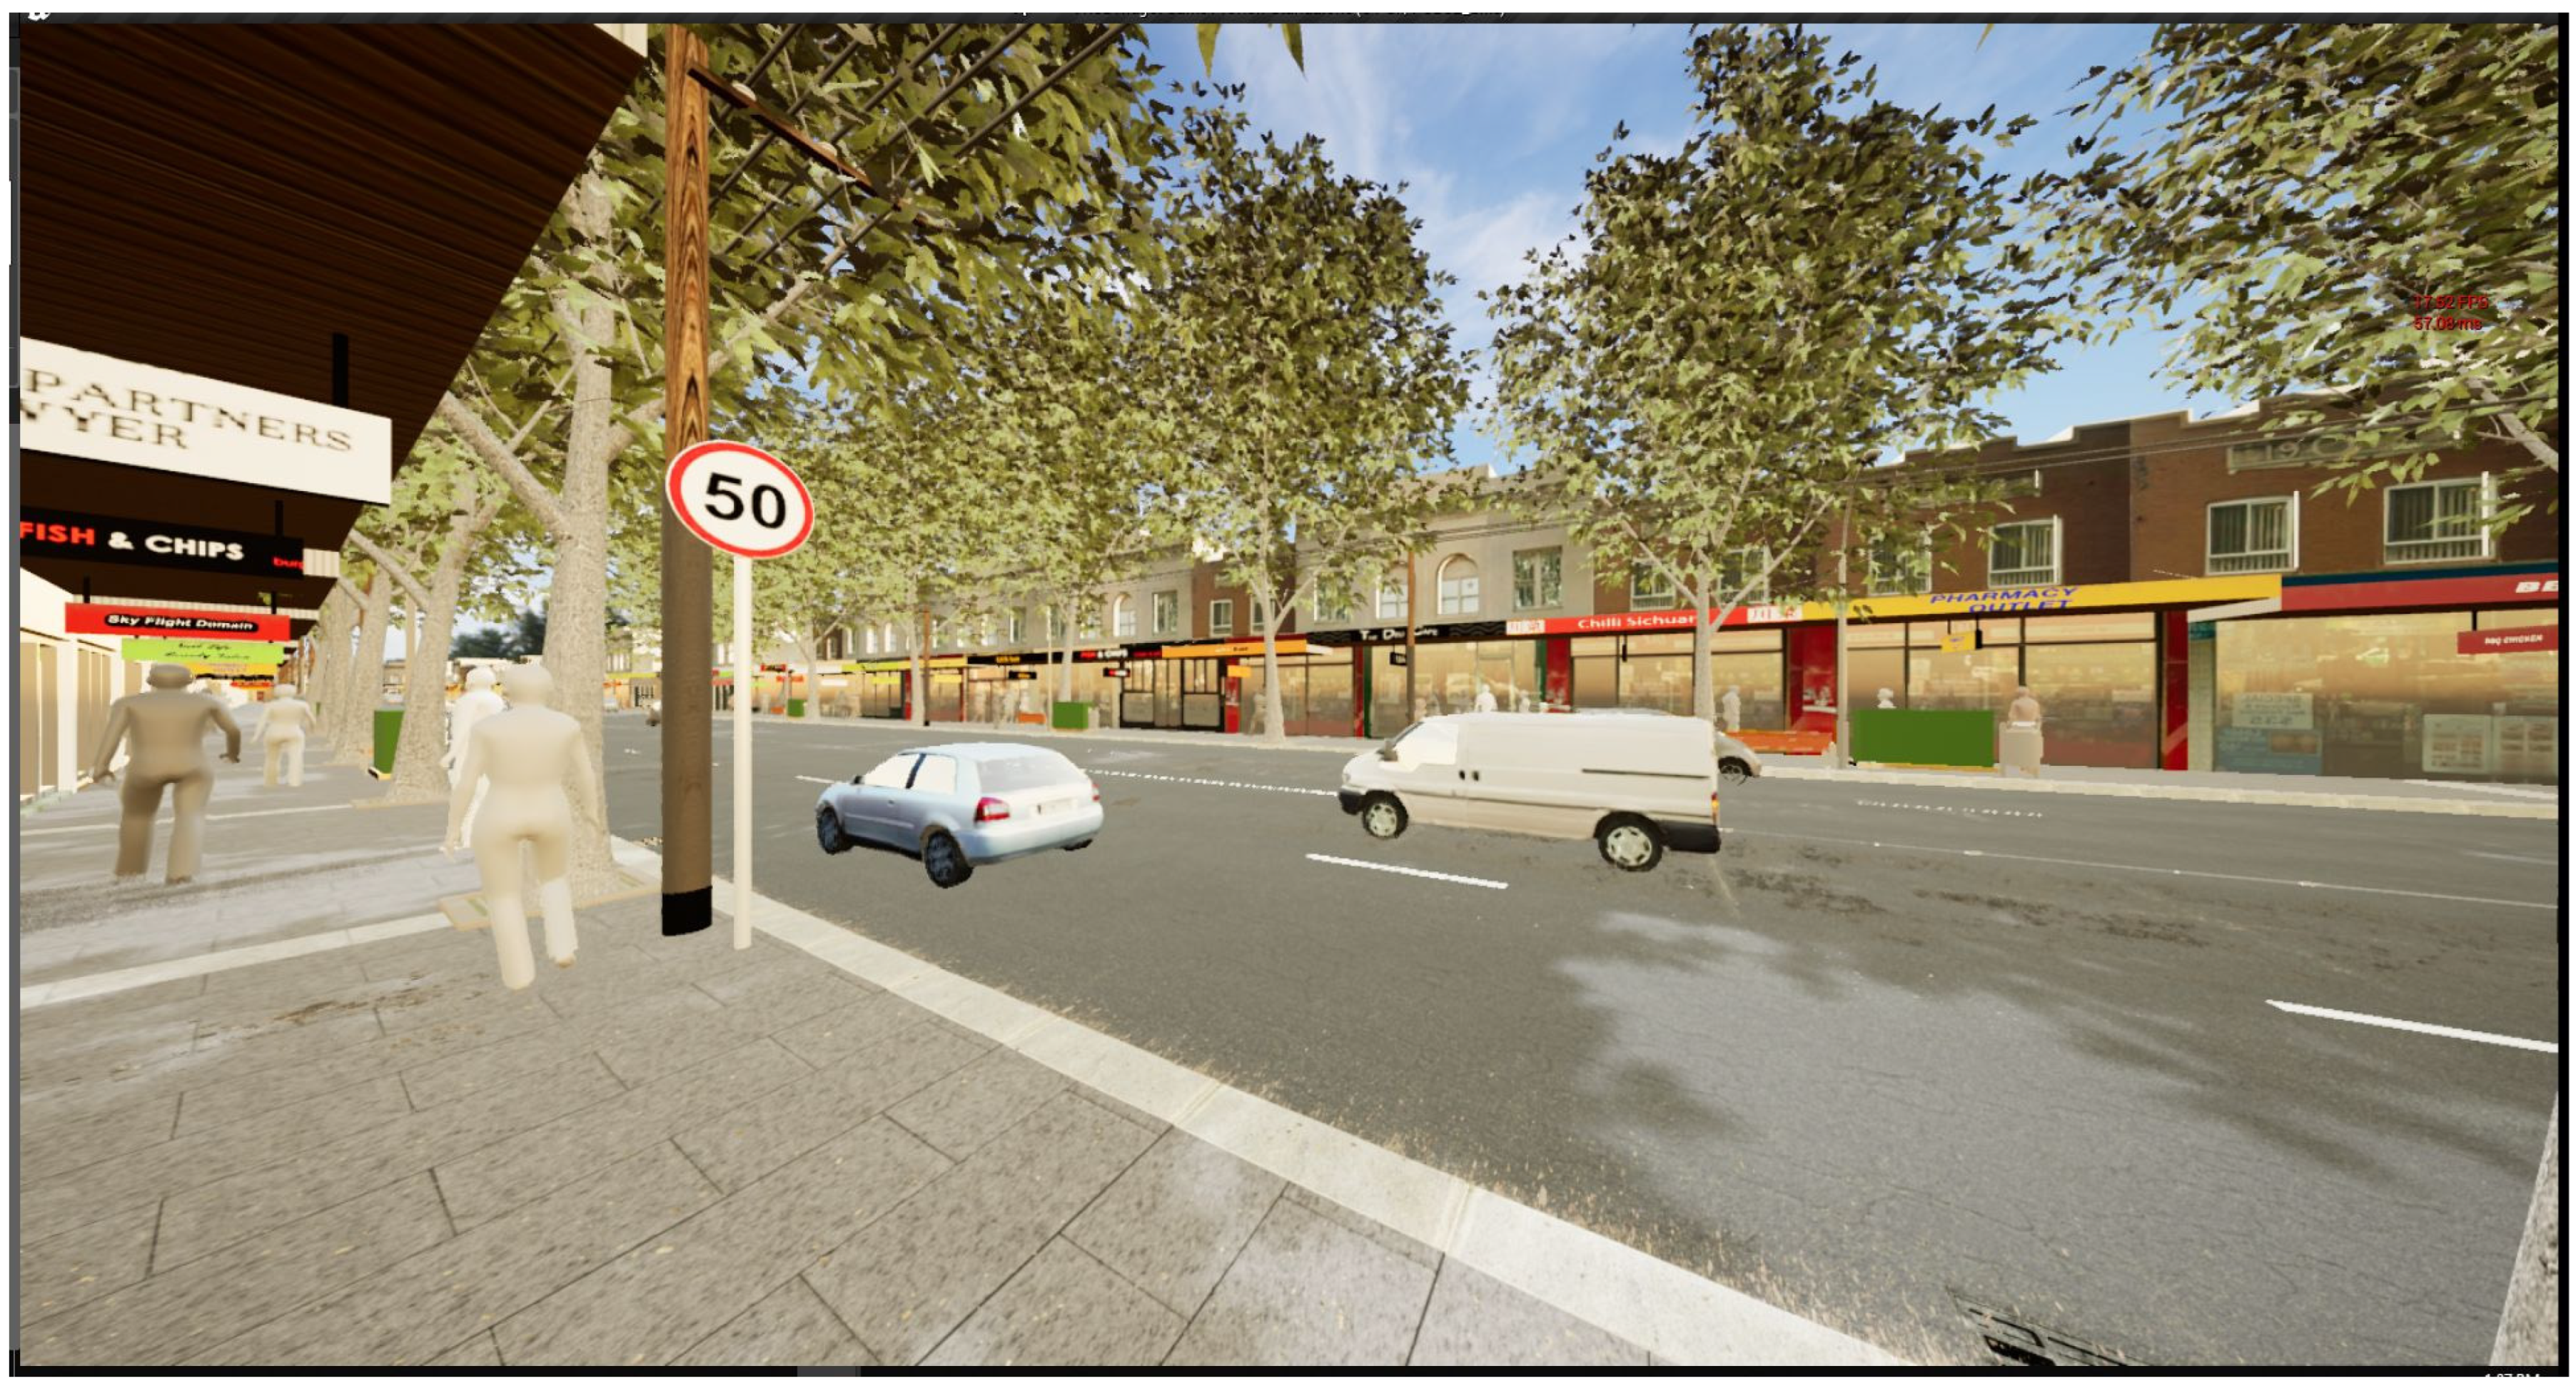
Figure 1), and twelve priority variations were used. These variations included one speed configuration, three distance separation configurations, four crossing configurations, and four different barrier separation configurations, including a low-level ‘ground vegetation’ scenario and an ‘increased tree canopy’ scenario (
Figure 2). Streets were kept as close to the baseline as possible, only changing the single variable where this did not interact with other street elements, and where this was not possible, only other essential elements were altered (for example, to add a bike lane, one car lane was removed). The streetscape scenarios chosen are described in
Table 1.
3.2. Animated 3D Digital Street Model Construction
We developed an animated 3D street model rendered as immersive interactive virtual environments (IVEs) with 360-degree spatial audio. Using a game engine, the scenarios were exported as 8K UHD equirectangular image sequences (7680 × 3840 pixels, 25 frames per second) for use in surveys to elicit participant responses.
The base geometry replicated a standard 20-metre-wide ‘main street’ featuring footpaths, parking, signage, and line markings, with detailing informed by the relevant Technical Direction: For Traffic and Transport Practitioners documents [
33], along with vegetation. Textures applied to streetscape geometry combined photos, patterns, and single-colour elements to create materiality and spatial depth, while minimising extraneous details. Generic signage ensured familiarity without evoking specific locations. Custom vegetation was modelled for the scenarios using water-sensitive plants such as
Dianella sp.,
Lomandra sp., Dwarf Bottlebrush,
Clivia sp.,
Juniper sp.,
Trachelospemum sp., and typical street trees.
To enhance the realism of the digital environment, a scripting protocol was applied to the tree leaf and ground-level vegetation meshes. This script introduced a randomised, minimal offset to these vertices, simulating the natural movement of foliage under a gentle breeze.
The same model also allowed controlled parameter adjustments, such as toggling bike lanes, vegetation, and barriers, and incorporated animated vehicles with speed and sound controls (used for other comparative scenarios). Starting with a ‘baseline’ scenario, variations were created by adjusting noise intensity, traffic speed, separation, and crossing details. Animated elements, including pedestrians and cyclists, were based on traffic data, with pedestrians programmed for realistic behaviours and textured in greyscale so the scenario variations could be clearly understood [
34,
35,
36], to reduce the ‘uncanny valley’ effect [
37], and to reduce distraction.
Each scenario was integrated into a game engine for real-time control, optimised lighting, dynamic vegetation, programmed traffic signals, and immersive 360-degree binaural audio for realistic simulations.
Subsequently, the view captured by the camera lenses was projected onto a 2:1 aspect ratio canvas utilising an equirectangular format. The rendered scenes were exported as a sequence of equirectangular projections, a method that flattens a spherical view into a two-dimensional image. Each frame was rendered at an 8K Ultra High-Definition resolution of 7680 by 3840 pixels, with a frame rate of 25 frames per second.
The final 360-degree videos, which incorporated spatial audio, were compiled for thirteen distinct scenarios. These video files were then uploaded to the YouTube video-sharing platform to facilitate their use in the subsequent research phases (
Figure 3 and
Figure 4).
3.3. Online Survey with the Embedded Environments
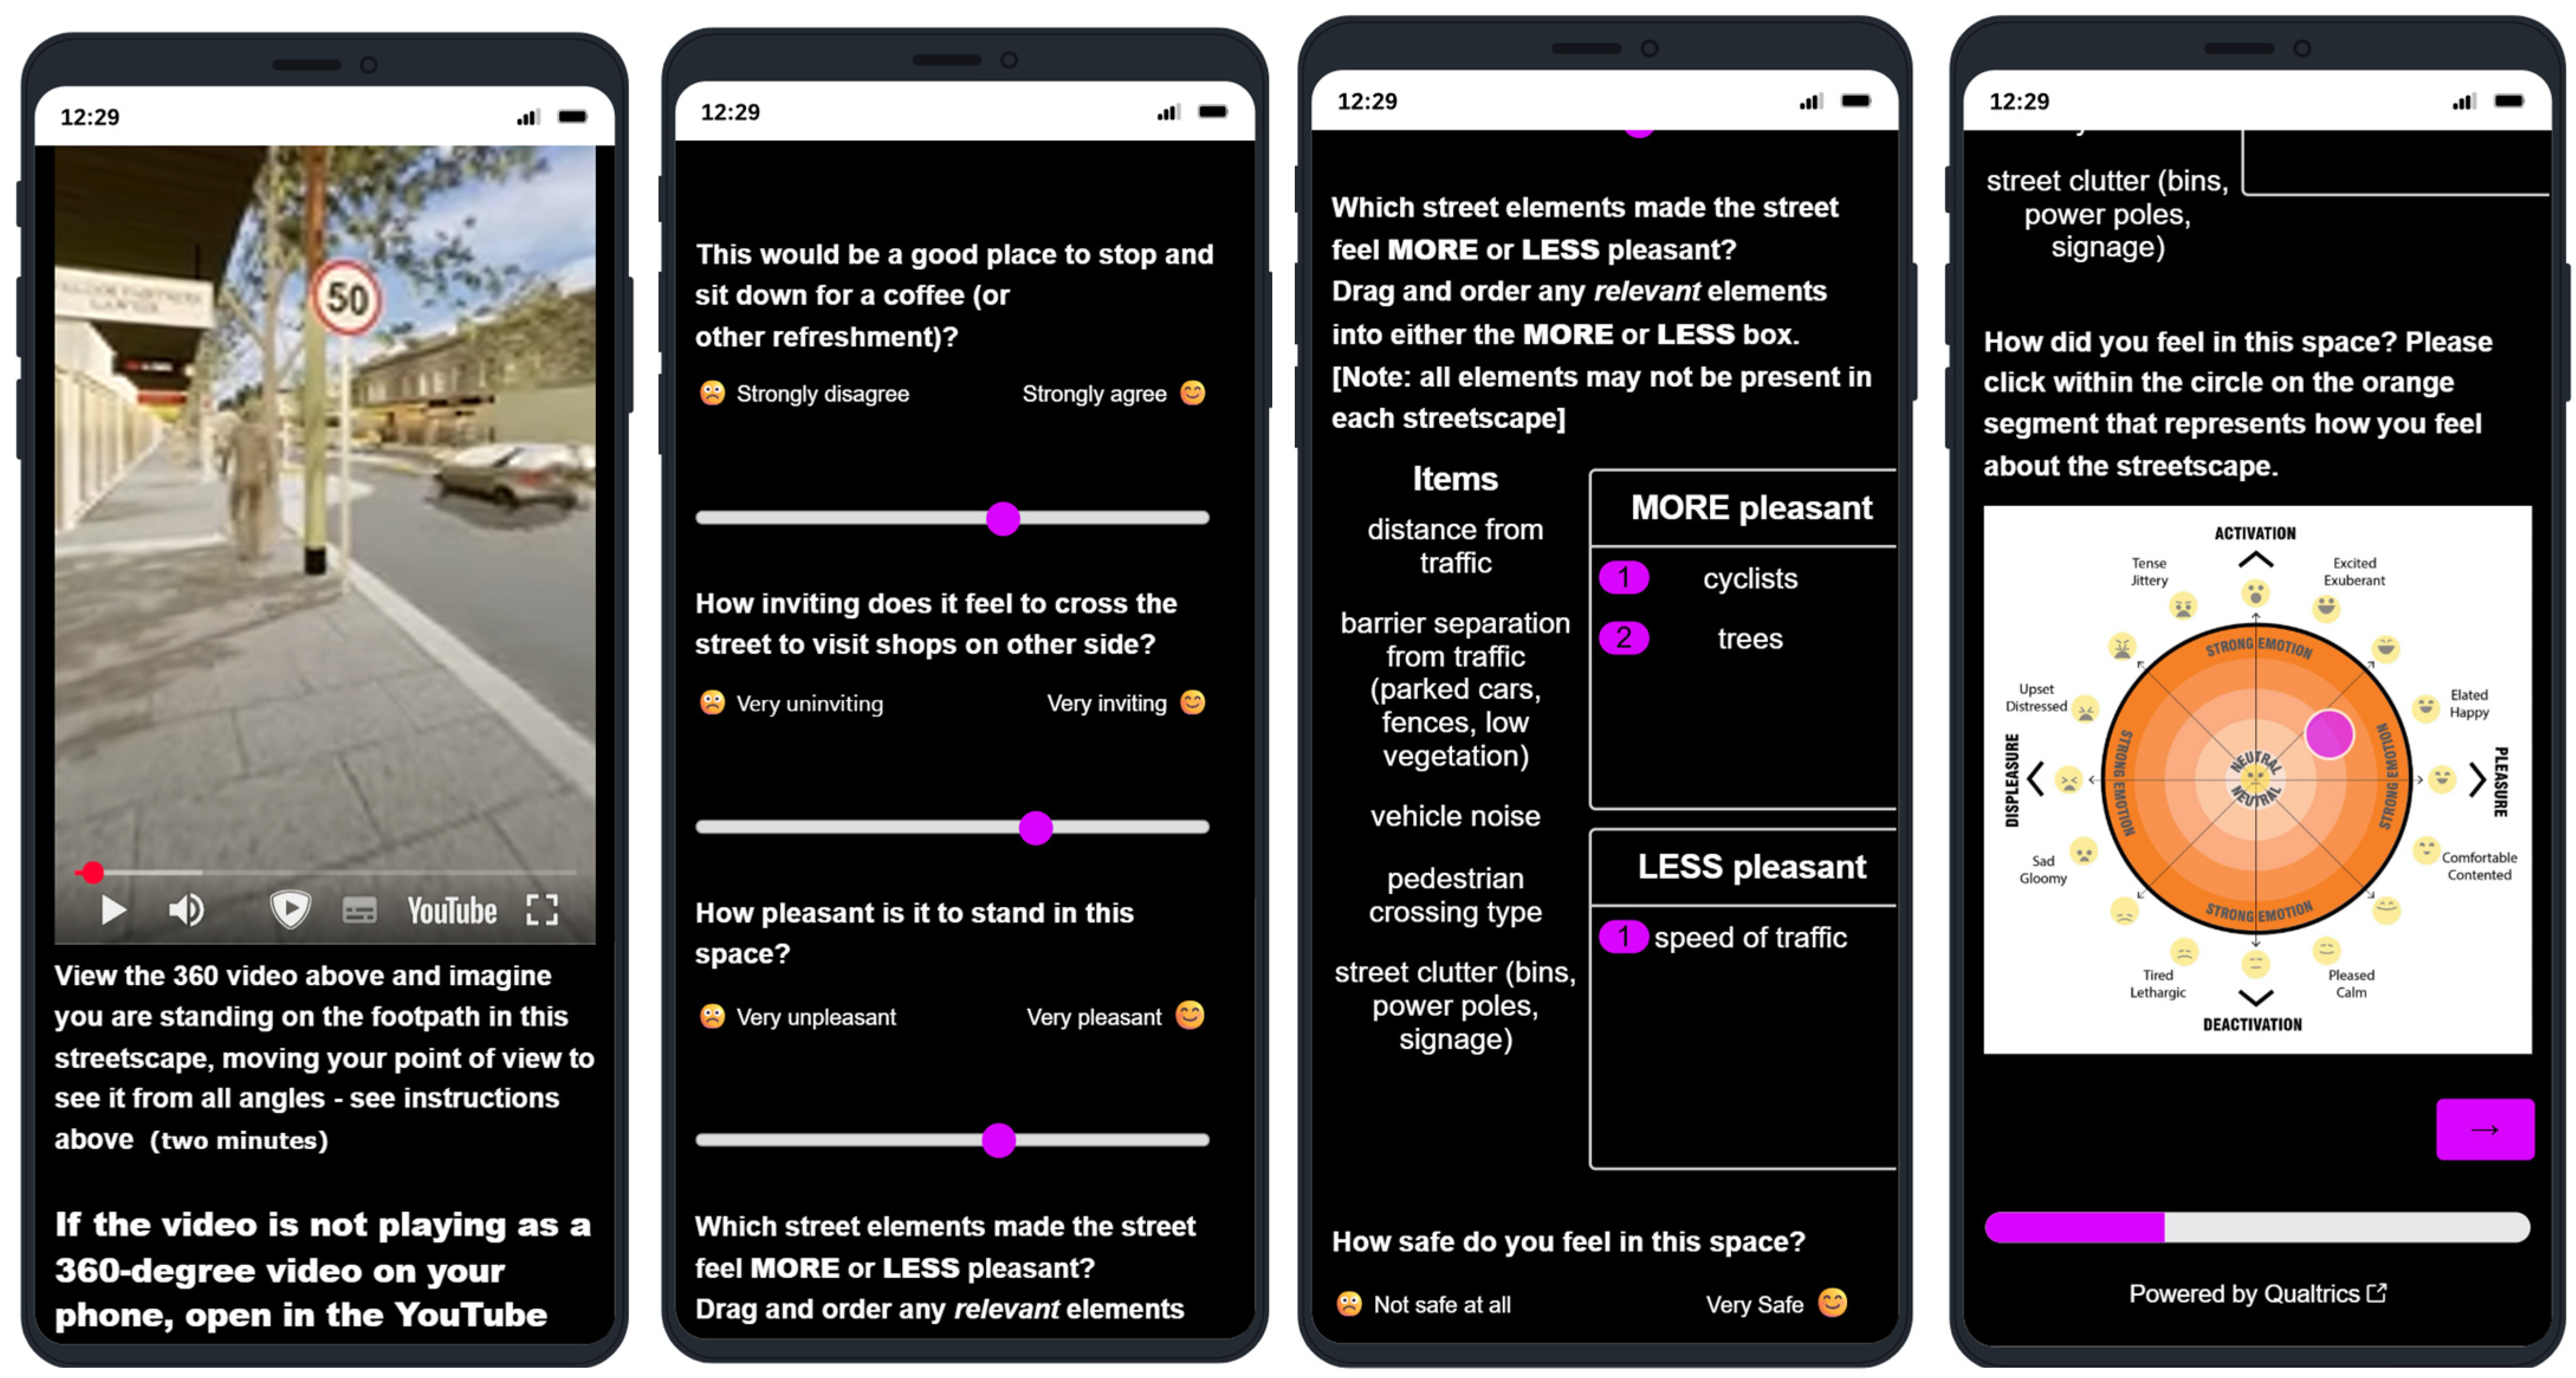
We then embedded the 360-degree IVE scenario models into an interactive Qualtrics™ survey. The survey was designed for participants using desktops, laptops, or smart devices. It featured a series of streetscape scenarios with varying road configurations, crossings, footpaths, and landscape elements. The survey included five sections: an introduction with informed consent, demographic questions, scenario instructions, randomised scenario presentations with questions, and post-scenario reflections.
Participants were introduced to the project, provided an explanatory statement, and asked to agree to informed consent before proceeding. Initial questions covered age group, gender, occupation, location, global living experience, and typical modes of transportation. Participants were instructed to imagine themselves standing on the footpath while viewing and listening to 360-degree videos through headphones. They then answered a mix of preference-revealing questions and stated-preference questions on their feelings about crossing the street and the pleasantness or safety of each space. Participants used emotion sliders and visual analogue scales to express their feelings. Participants rated spaces for stopping, crossing, and overall pleasantness using sliders and emoji scales (
Figure 5). The revealed emotional slider preference questions were as follows:
‘Would this be a good place to stop for coffee?’
‘How inviting does it feel to cross the street to visit shops on the other side?’
‘How pleasant is it to stand in this space?’
‘How safe do you feel in this space?’
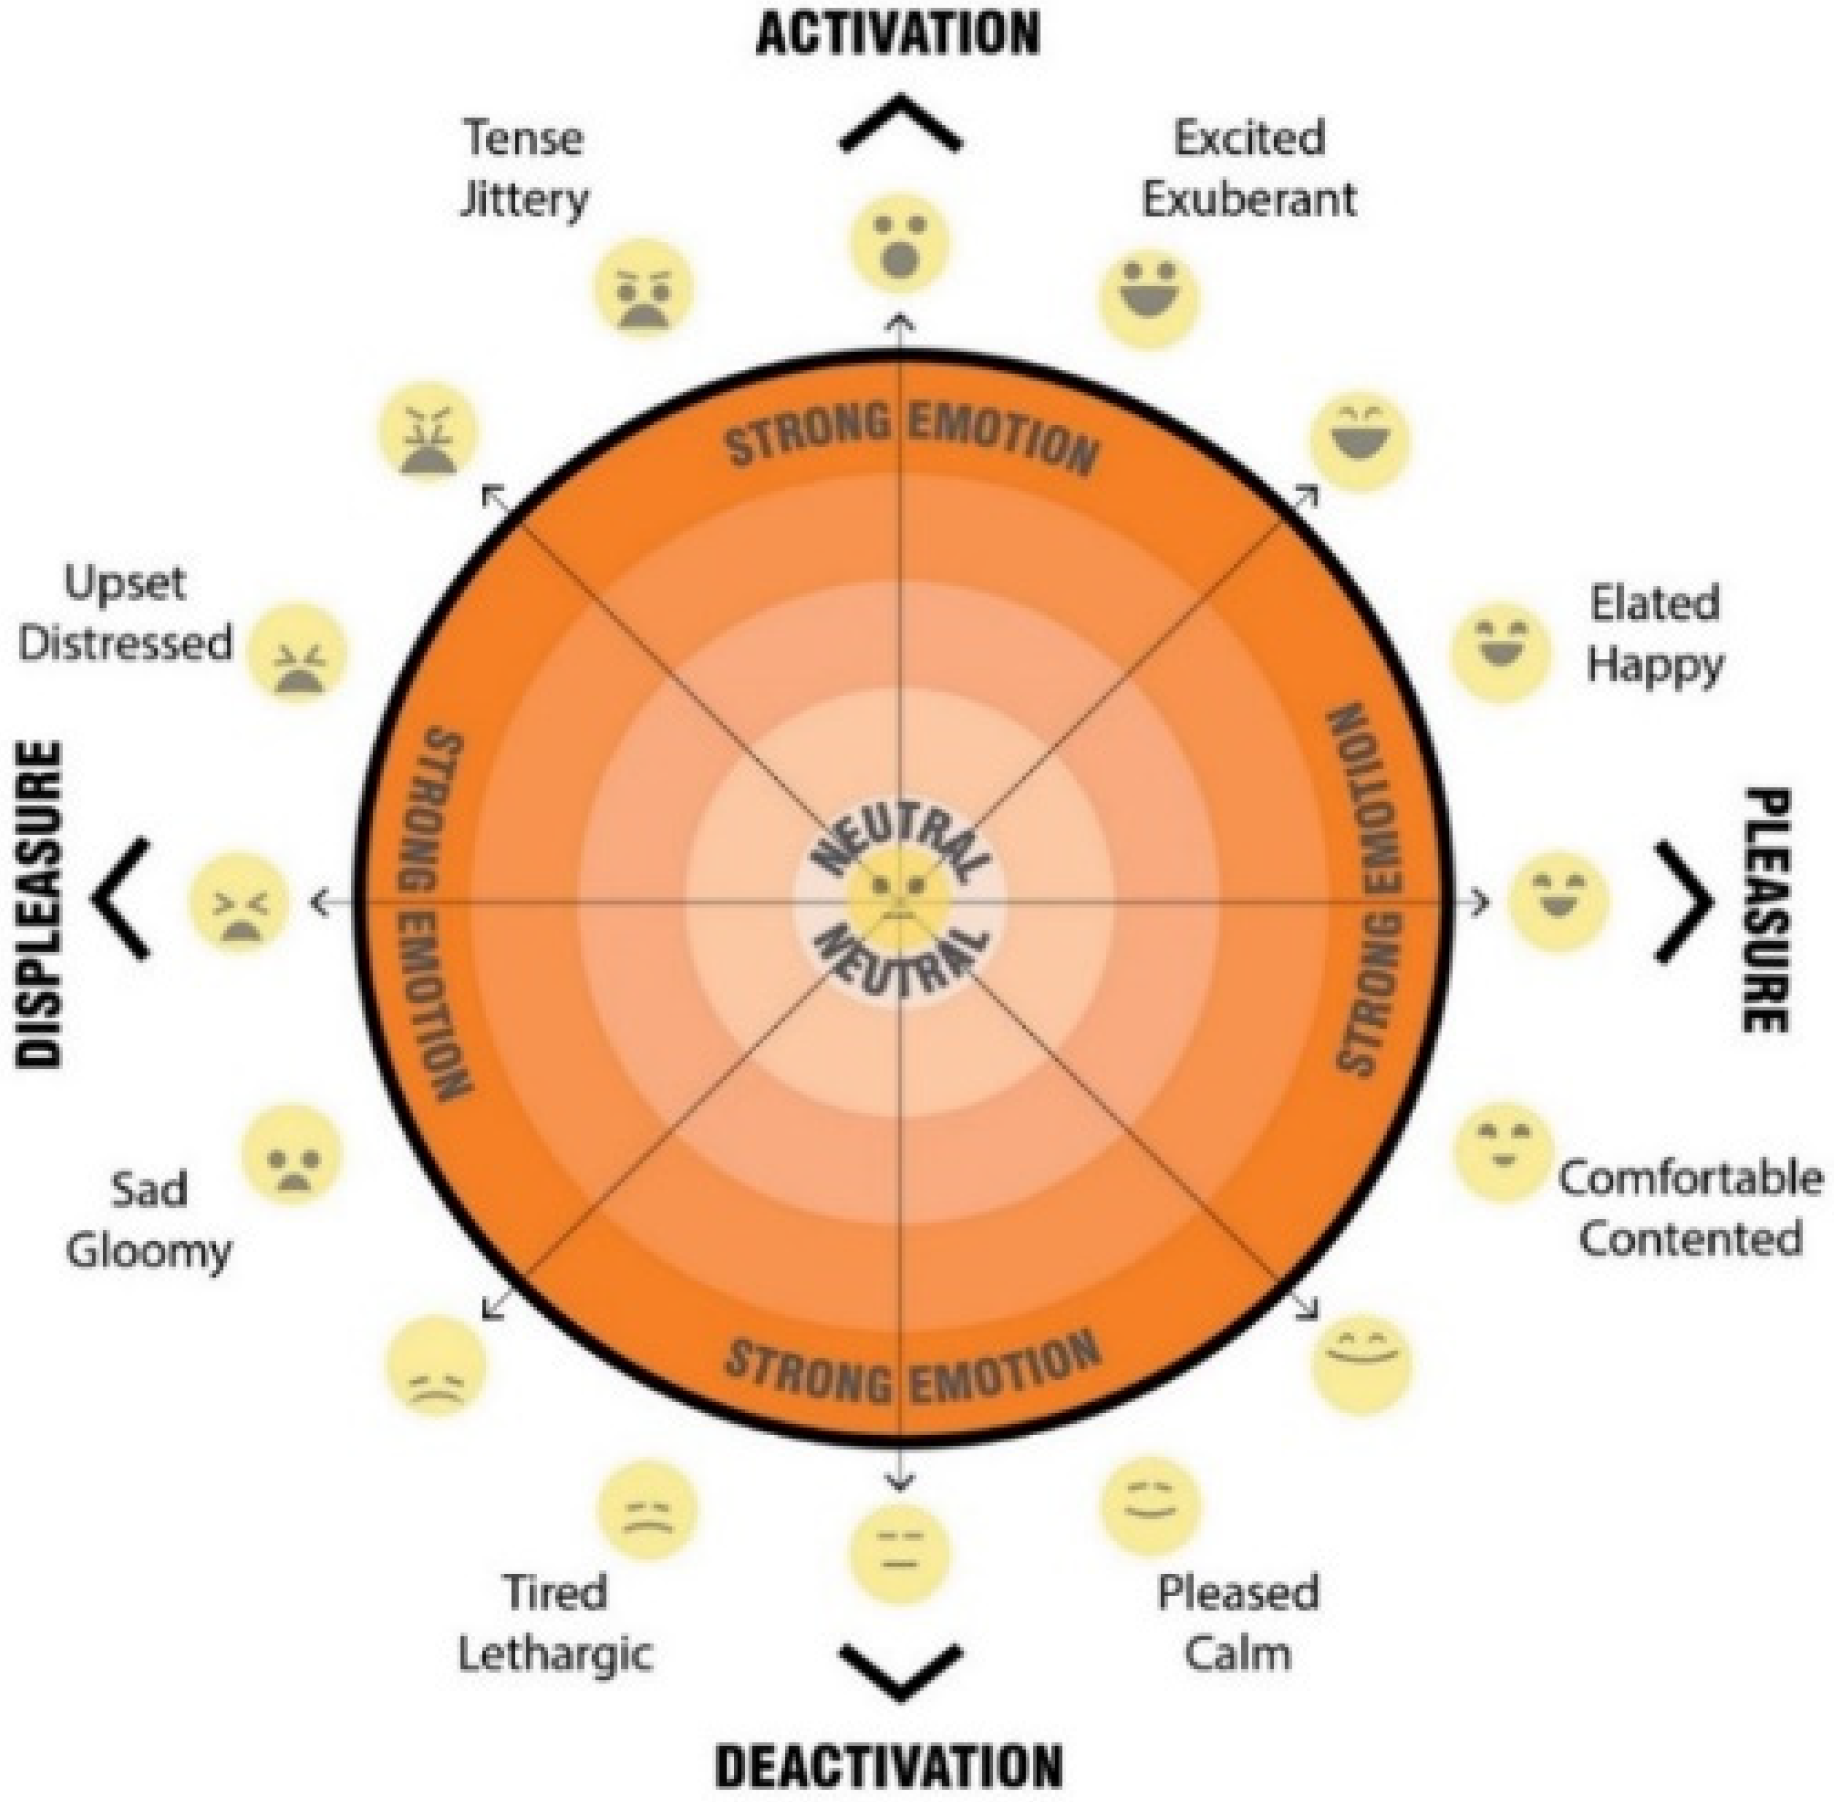
The final preference-revealing questions for each scenario asked participants to mark their psychological response to the space on a 2D ‘affect grid’ adapted from Russell et al. [
38] and combined with the EmojiGrid [
39] (
Figure 6). Participants were asked to respond to the prompt: ‘How do you feel in this space?’ They then used a mouse or finger to place a mark within a circle representing their mood. The grid had four quadrants: activation (arousal) in the top half, deactivation (sleepiness) in the bottom half, displeasure (unpleasant) on the left, and pleasure (pleasant) on the right. Each quadrant further represented nuanced emotions, with intensity increasing as points moved outward from the neutral centre. The darker orange colour indicated stronger emotional intensity, allowing participants to express both their mood and its level of activation or deactivation in a visual and intuitive way.
Participants were also asked to use a text box drag and drop to express their (stated) preferences, prioritising streetscape elements in the order they believed made the space feel MORE or LESS pleasant or safe. The list of 8 elements from which to select were as follows: trees, speed of traffic, distance from traffic, barrier separation from traffic (parked cars, fences, low vegetation), vehicle noise, pedestrian crossing type, cyclists, street clutter (bins, power poles, signage).
Respondents were instructed to rank only those elements they perceived to have the most significant influence on their assessment, rather than all elements in the provided list. The list of eight potential elements remained consistent across all scenarios. It is important to note that this list was presented irrespective of whether those specific elements were visually present in the stimulus material. For instance, pedestrian crossings were not a feature of every scenario. Similarly, physical barrier separations, such as fencing, substantial distance, or wider footpaths designed to create a buffer from adjacent traffic, were absent in some of the presented streetscapes.
All scenarios included consistent tree coverage, except for one, ‘increased tree canopy’, in which the tree size was increased and the spacing between trees decreased. Another scenario included the same trees with an additional vegetation strip along the edge of the footpath. With each scenario, participants responded with the drag and drop priorities to the following statements:
Rank elements that made the street feel MORE pleasant.
Rank elements that made the street feel MORE safe.
Rank elements that made the street feel LESS pleasant.
Rank elements that made the street feel LESS safe.
Participants were also provided with an open-ended text-based response question, allowing them to elaborate on their preferences and explain their choices.
3.4. Recruitment of Participants
The broader study sought generalisable, actionable insights into street-user preferences, detached from specific place-based experiences, and included diverse participants of varying ages, backgrounds, occupations, and locations. Minors under 16 were excluded as they could not consent. Recruitment used a snowball approach, shared via media posts, websites, blogs, emails, social media (Twitter, Facebook, Instagram, and LinkedIn), and a Facebook ad. To ensure a 95% confidence level and a margin of error of less than 10%, a minimum of 100 participants were targeted; however, the actual response rate significantly exceeded this, as discussed in the next section.
3.5. General Estimating Equation (GEE) Ordinal Logistic Regression
Four analysis models were performed to assess whether the 12 streetscape scenarios elicited statistically significant differences compared to the baseline scenario for each question. A generalised estimating equation (GEE) method combined with ordinal logistic regression was selected. This approach was chosen because GEE effectively manages repeated measures data, while ordinal logistic regression is well-suited for analysing Likert scale responses.
4. Results
4.1. Responses
The survey achieved a higher response rate than anticipated, considering its length and the detailed nature of the required responses. Participation exceeded 800 individuals, from which over 276 valid responses (constituting more than 50% completion) were obtained; 238 of these participants completed the entire survey. The gender distribution of the survey responses was 59% of participants identifying as male, 38% identifying as female, with the remainder identifying as other or preferring not to disclose. Responses were analysed for any potential influence of gender on the results. When controlling for background, device used, primary mode of transport, and age group, no statistically significant differences were found in the responses to key questions between male and female participants. Occupational data was collected to identify any potential bias related to profession. The study cohort represented a widely diverse range of occupations, including transport, education, the health sector, engineering, finance, and hospitality. No significant differences were found in the answers to the four key affect slider questions across all scenarios when analysed by occupational field, with one exception. For the question, ‘Would this be a good place to stop for coffee?’, respondents from design professions responded 54% more positively than all other occupations [Exp(B) 1.544].
Participants were spread across age groups, except for 75–84 (1%) and over 85 (<1%), likely due to the online-only format. The 16–18 group (3%) had fewer responses but this was proportionate given its narrower range. Analysis showed younger participants, particularly under 34, were more likely to respond positively across all scenarios. Responses relating to increased tree canopy and vegetation were not impacted by gender, background, or occupation to a significant degree.
4.2. Revealed Preference: Visual Analogue Emotional Slider Responses
Thirteen streetscape scenarios, based on a challenging high volume of traffic movement representing a ‘main street’ with conflicting aspects of movement, were presented randomly to participants with no indication of scenario name or the variable being changed. They were also met with four slider questions prompting them to provide their perceptions of safety and place. The scenarios included a simple ‘baseline’ street along with variations, including one with increased tree canopy cover and one with a vegetation buffer.
4.2.1. Revealed Preference for the Question: Would This Be a Good Place to Stop for Coffee?
We conducted an ordinal logistic regression using GEE for the results of the survey question, ‘Would this be a good place to stop for coffee (or other refreshments)?’. Compared to the ‘baseline’ scenario, statistically significant responses to eight of the scenarios were more positive. The ‘cycle lane’ (
p < 0.001) responses were on average 3.97 times more likely (3.01, 5.14) to be positive, the ‘wombat crossing’ (
p < 0.001) responses were on average 3.48 times more likely (2.44, 4.99) to be positive, and the ‘reduced speed 30 km/ph’ responses were on average 3.43 times more likely (2.69, 4.37) to be positive. The ‘increased tree canopy’ (
p < 0.001) responses were on average 72.9% more likely (1.397, 2.140) to be positive. This result was substantially more positive than the ‘barrier fence’ (
p < 0.001) responses, where on average, respondents were 59.3% more likely (1.245, 2.039) to be positive. The statistically significant findings are shown in
Table 2.
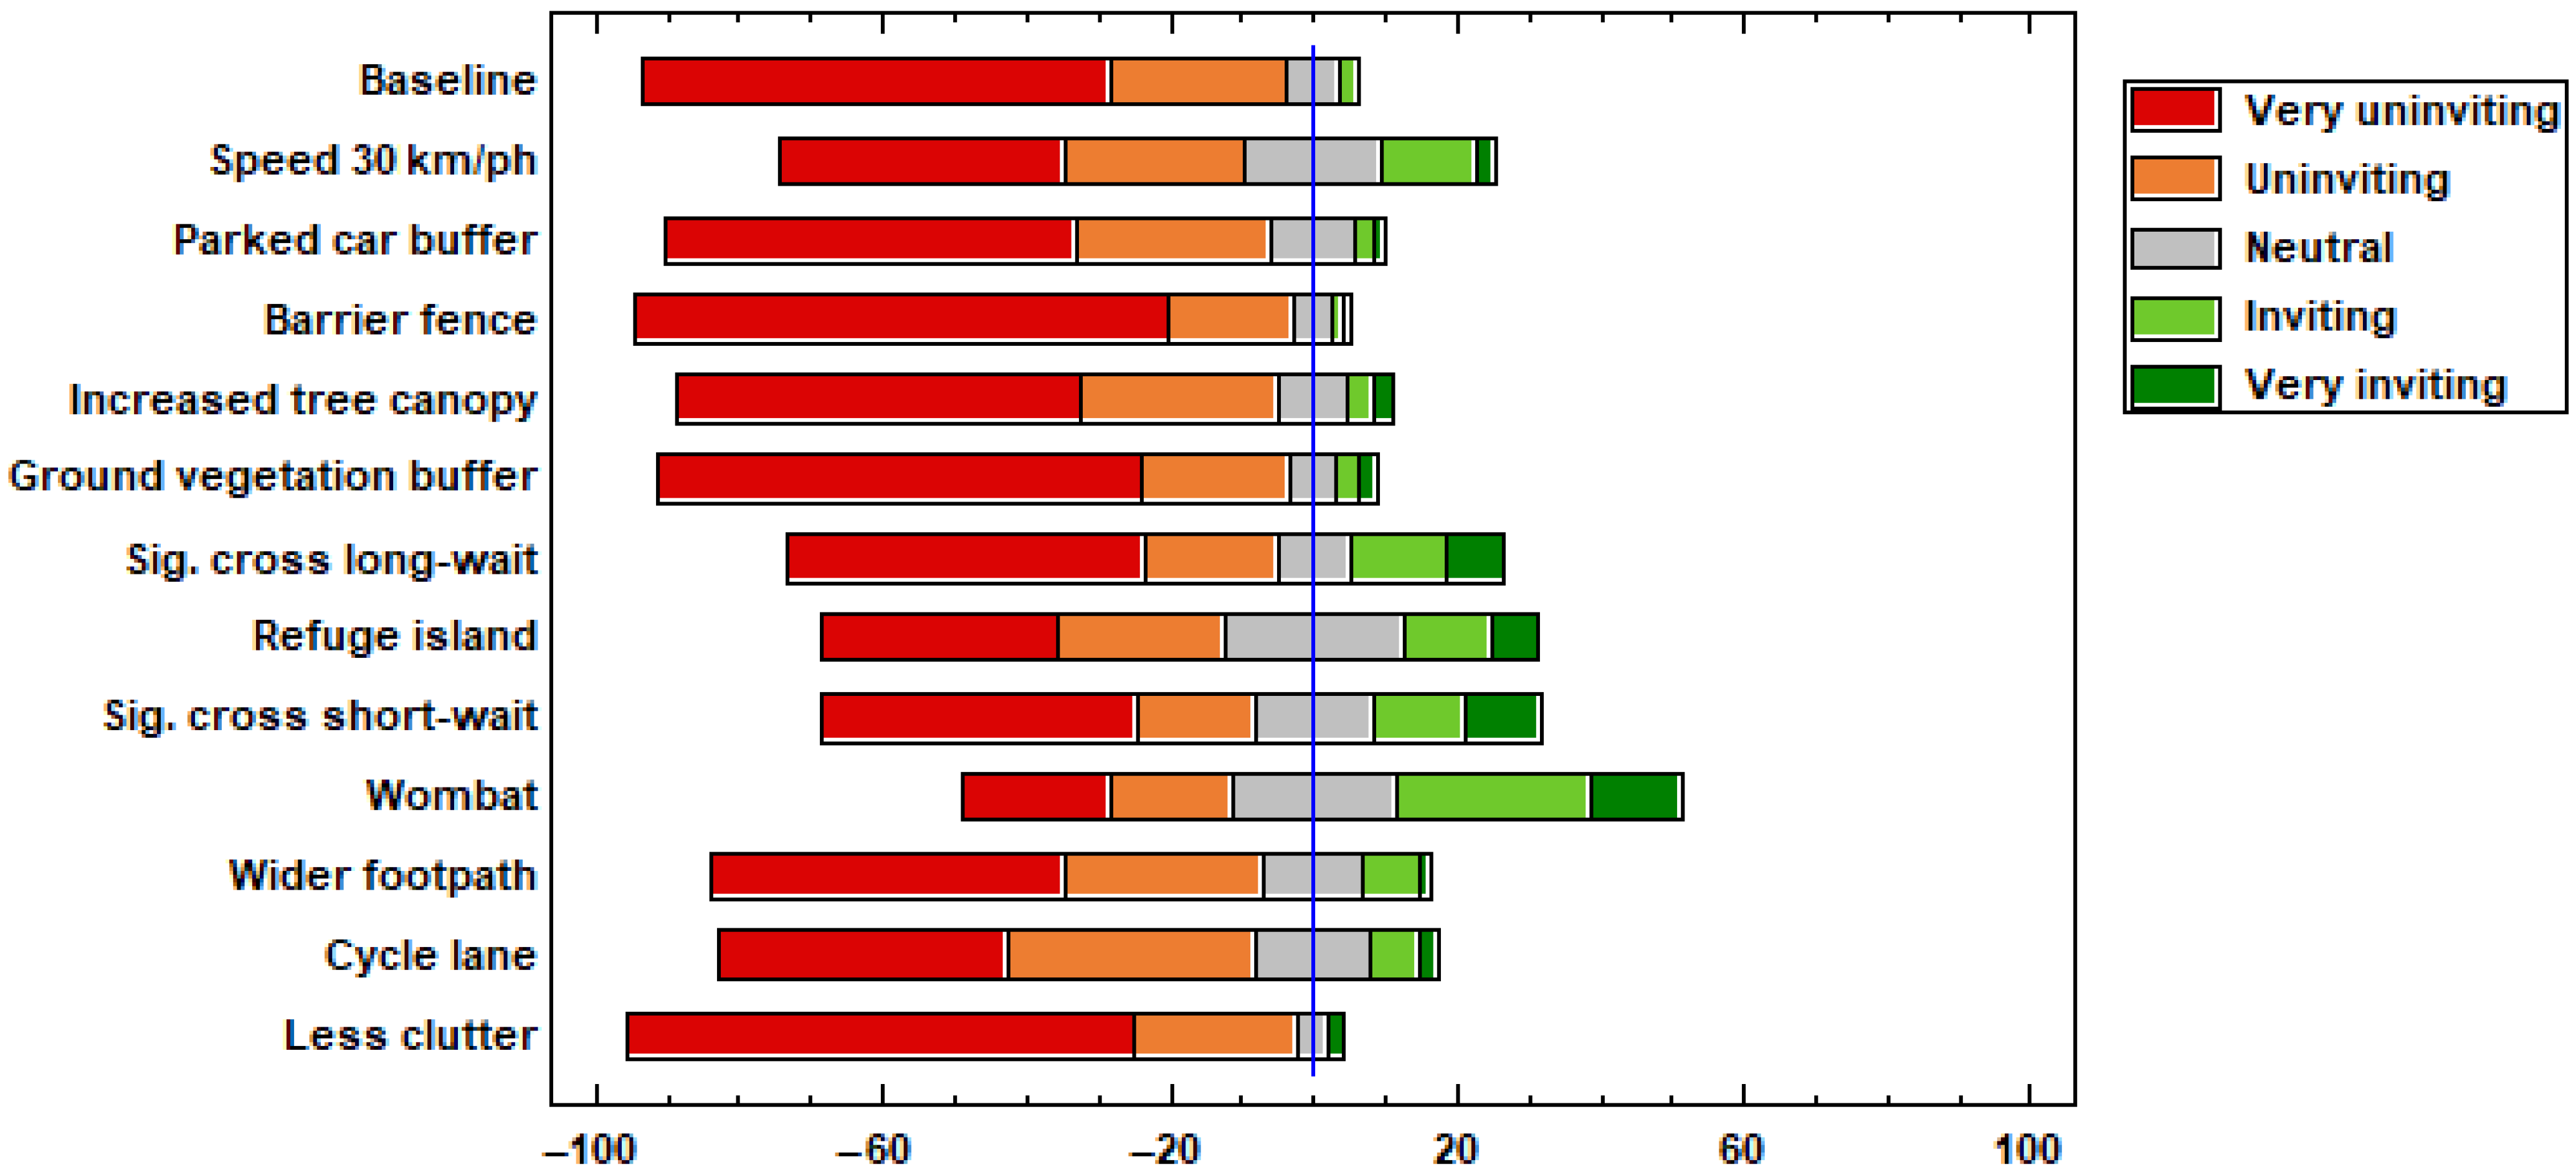
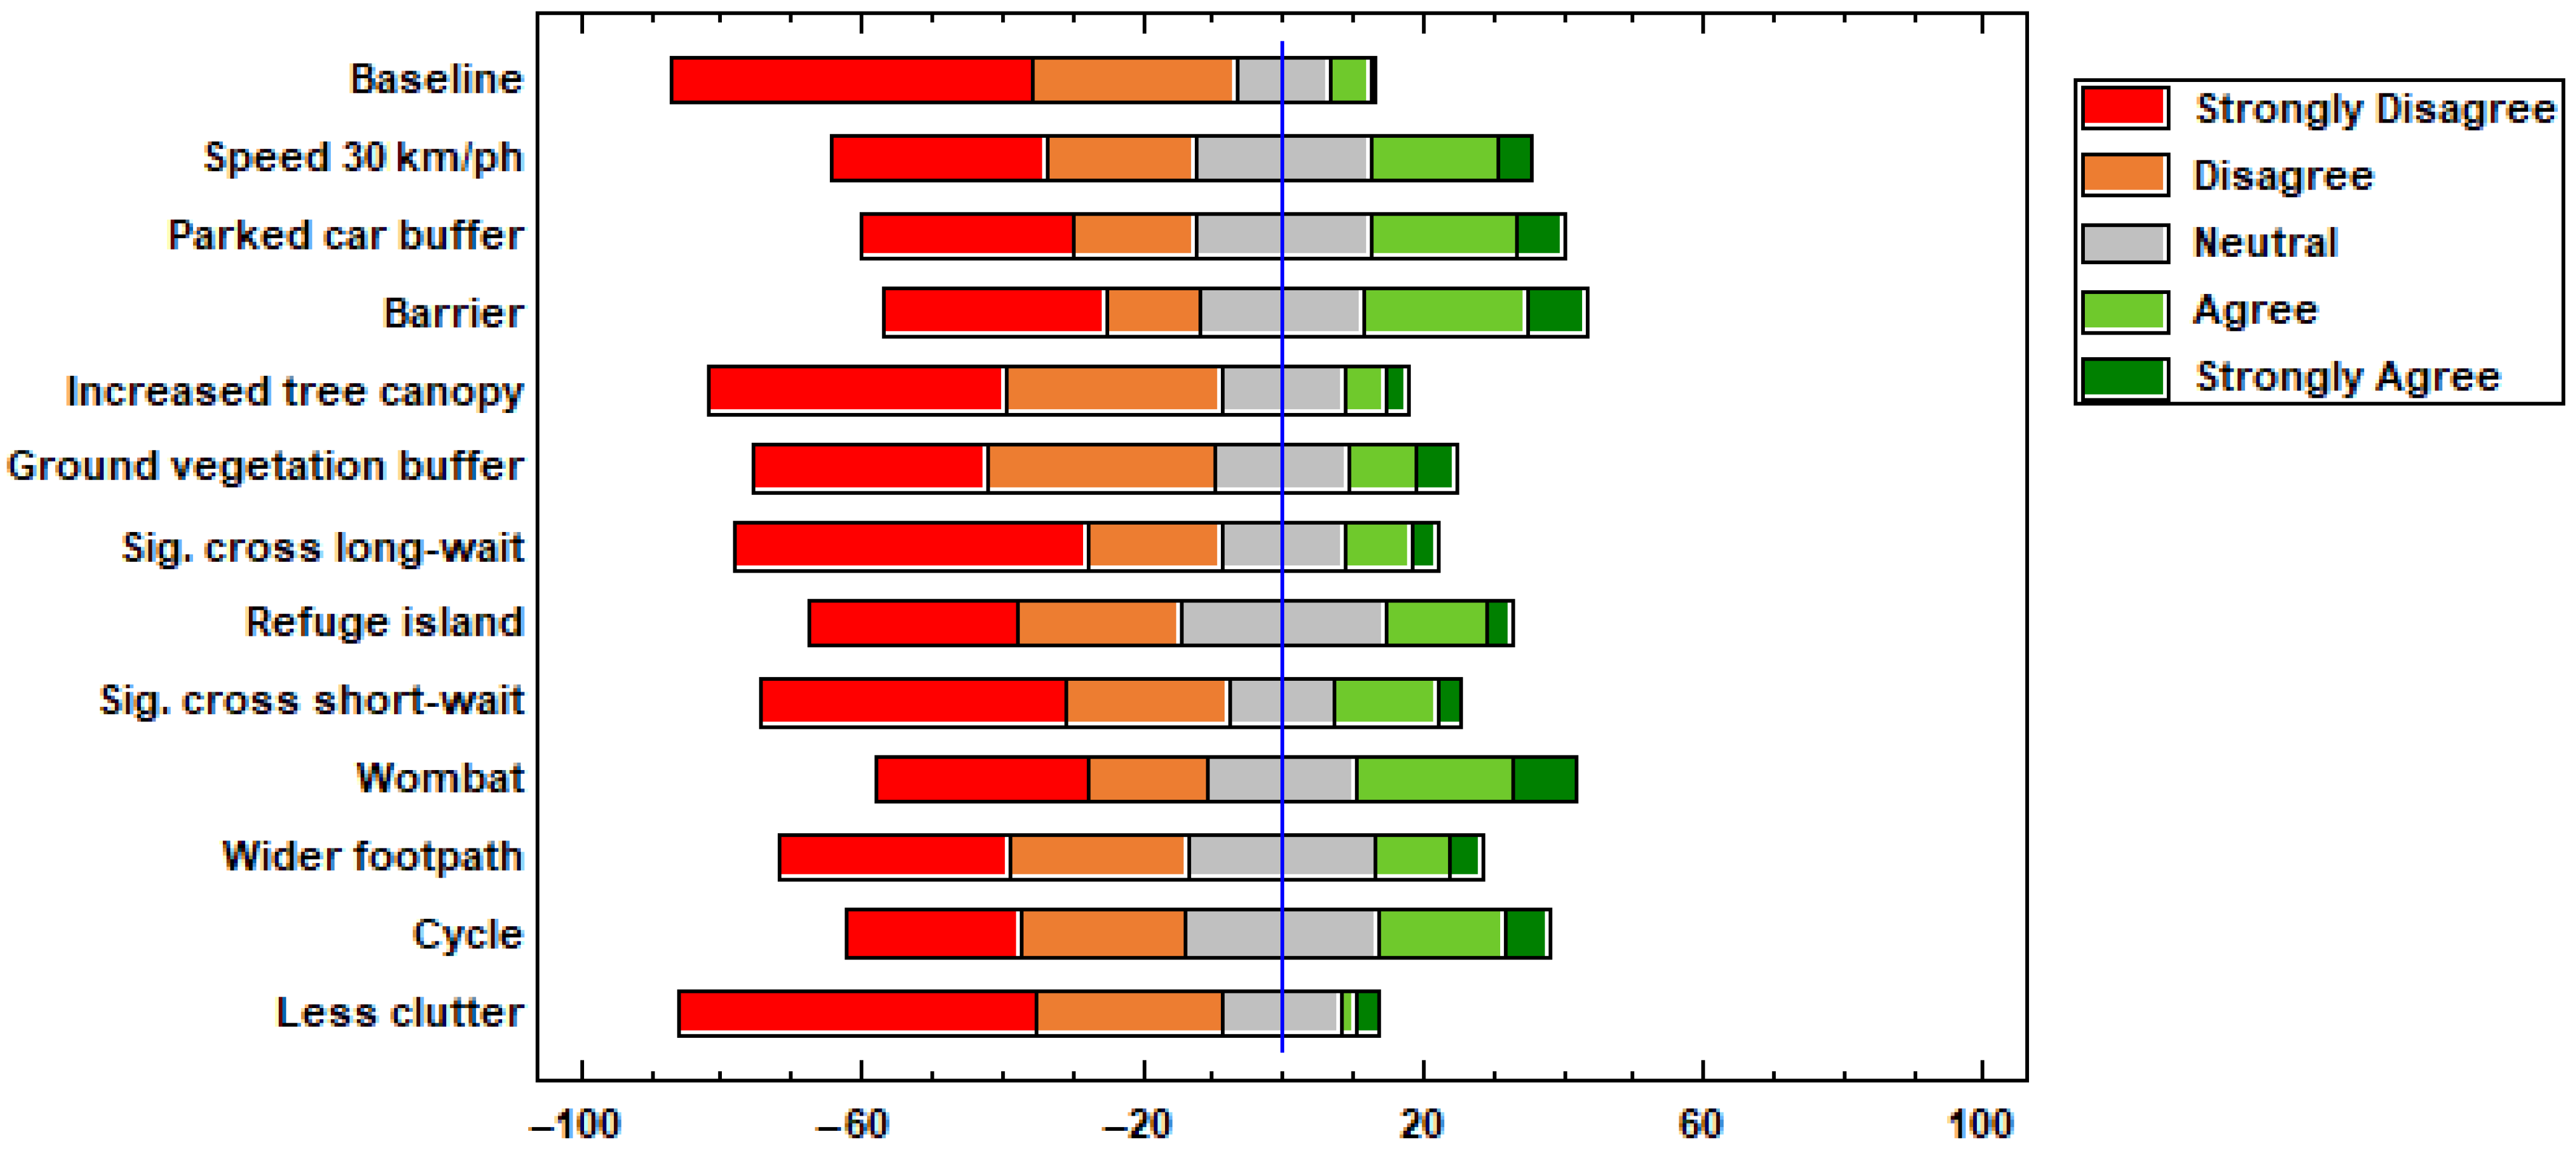
When the data was visualised using a diverging stacked bar chart, also known as a Likert plot (
Figure 7), the elements ‘ground vegetation buffer’, ‘increased tree canopy’, ‘cycle lane’, and ‘wombat crossing’ were found to elicit very strong positive responses, predominantly within the ‘agree’ and ‘strongly agree’ categories. Conversely, a high number of participants registered their responses within the ‘disagree’ and ‘strongly disagree’ ranges on the emotion/affect slider for the ‘baseline’ scenario, the ‘less clutter’ scenario, and both of the signalised crossing scenarios. The overall distribution of the emotional slider responses indicated a general skew towards the negative side of the neutral centre point across all scenarios. Although the specific reasoning for the strong negative response to the signalised crossings was not quantitatively established, qualitative written comments from some respondents suggest a potential cause may be the ‘irritating noise’ generated by the chirping or percussive sounds of the accessible pedestrian signals (APS).
4.2.2. Revealed Preference for the Question: ‘How Inviting Is It to Cross the Street to Visit Shops on the Other Side?’
We conducted the regression model for the collected data for the question, ‘How inviting does it feel to cross the street to visit shops on the other side?’ for the scenarios.
In comparison to the ‘baseline’ scenario, participant responses were substantially more positive for 6 of the 12 scenarios. Analysis identified that speed reduction measures and the inclusion of pedestrian crossings were the most statistically significant predictors of a positive result for this specific question. The ‘cycle lane’ scenario elicited responses that were, on average, 3.64 times more likely to be positive. Responses for the ‘increased tree canopy’ scenario were, on average, 98.6% more likely to be positive, with a confidence interval of (1.57, 2.51). Compared to the ‘baseline’, responses to 3 of the 12 scenarios were moderately more positive. Responses for the ‘parked car buffer’ were on average 73.8% more likely to be positive (1.14, 2.66). The ‘ground vegetation buffer’ responses were on average 72.3% more likely to be positive (1.13, 2.62), and the ‘barrier fence’ responses were on average 30% more likely to be positive (1.01, 1.67).
A summary of these statistically significant findings is provided in
Table 3.
The visualisation of results in a diverging stacked bar chart (Likert plot) (
Figure 8) revealed distinct response patterns. Scenarios including ‘wombat crossing’, ‘refuge island’, and both signalised crossings attracted strongly positive ratings, predominantly in the ‘inviting’ or ‘very inviting’ categories. Similarly, ‘reduced speed 30 km/h’, ‘cycle lane’, and ‘increased tree canopy’ treatments also received comparatively high positive responses. Conversely, a substantial number of participants registered negative perceptions for the ‘barrier fence’, ‘ground vegetation barrier’, ‘baseline’, and ‘less clutter’ scenarios, with responses clustering in the ‘uninviting’ to ‘very uninviting’ range. Among all treatments, the ‘barrier fence’ scenario elicited the most pronounced negative response, recording the highest frequency of ‘very uninviting’ ratings.
4.2.3. Revealed Preference for Question: ‘How Pleasant Is It to Stand in This Space?’
Likewise, while increased tree canopy cover had a statistically significant impact on the perceptions of the space as pleasant, the more impactful elements were associated with crossings and speed reduction. Of the barrier or buffer edge treatment types, the cycle lane and wider footpath had a more positive impact than increased tree canopy cover.
Analysis revealed that six of the twelve scenarios elicited substantially more positive responses compared to the ‘baseline’. The likelihood of a positive response was greatest for the ‘cycle lane’ scenario, which was on average 3.64 times more likely (2.80, 4.72). This was followed by the ‘wombat crossing’ at 3.52 times more likely (2.49, 4.99), the ‘speed 30 km/h’ at 3.23 times more likely (2.51, 5.16), the ‘refuge island’ at 2.94 times more likely (2.09, 4.11), and the ‘widened footpath’ at 2.32 times more likely (1.81, 2.98). The ‘increased tree canopy’ scenario was, on average, 98.6% more likely to receive a positive response (1.57, 2.51).
A further three scenarios were moderately more positive than the ‘baseline’. Responses for the ‘parked car buffer’ were 73.8% more likely to be positive (1.14, 2.66), the ‘ground vegetation buffer’ was 72.3% more likely (1.13, 2.62), and the ‘barrier fence’ was 30% more likely (1.01, 1.67). A summary of these statistically significant findings is presented in
Table 4.
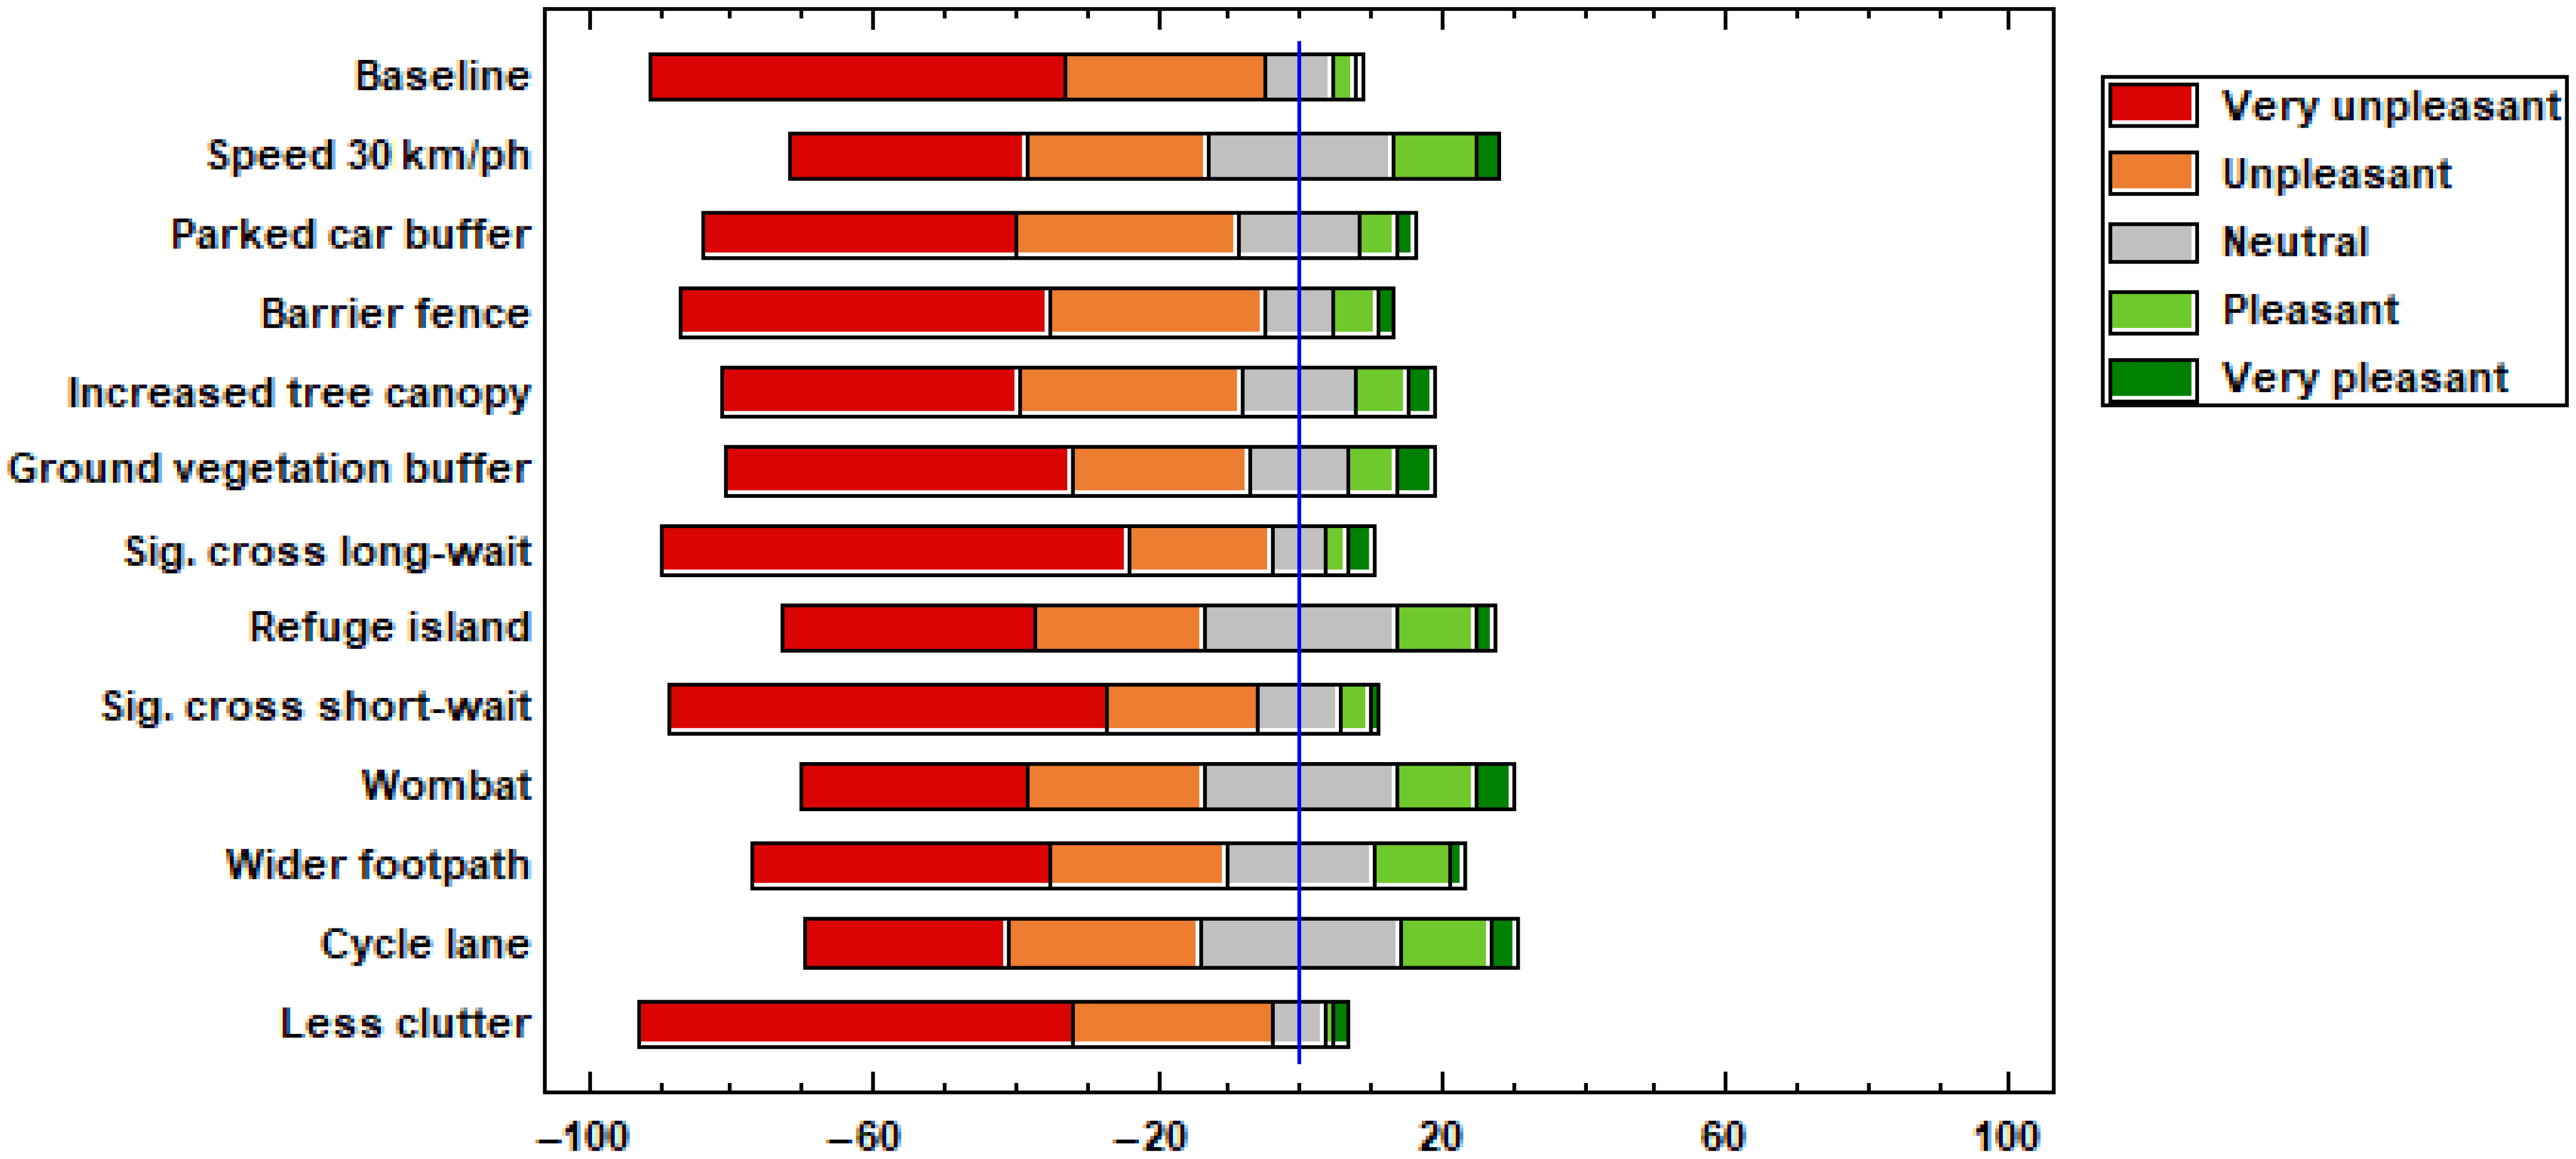
Among the scenarios that did not include pedestrian crossings, the ‘cycle lane’ and ‘reduced speed’ treatments were the least frequently rated as ‘unpleasant’ or ‘very unpleasant’ (
Figure 9). Statistical comparisons to the ‘baseline’ scenario showed that the responses for ‘reduced speed 30 km/h’, ‘increased tree canopy’, ‘refuge island’, ‘wombat crossing’, ‘wider footpath’, and ‘cycle lane’ were highly significantly different (
p < 0.001). The responses for ‘parked car buffer’ (
p = 0.011), ‘barrier fence’ (
p = 0.040), and ‘ground vegetation buffer’ (
p = 0.011) were moderately significantly different.
4.2.4. Revealed Preference for Increased Tree Canopy for Question: ‘How Safe Do You Feel in This Space?’
An identical statistical model was applied to responses for the question, ‘How safe do you feel in this space?’. The scenarios ‘speed 30 km/h’, ‘parked car buffer’, ‘barrier fence’, ‘refuge island’, ‘wombat crossing’, ‘wider footpath’, and ‘cycle lane’ all elicited highly statistically significant different responses from the ‘baseline’ (
p < 0.001 for all). The scenarios ‘increased tree canopy’ (
p = 0.003) and ‘Sig. cross short-wait’ (
p = 0.003) showed moderately significant differences. Compared to the ‘baseline’, three of the twelve scenarios yielded moderately more positive responses. The ‘increased tree canopy’ scenario was, on average, 39.7% more likely to receive a positive response (1.12, 1.74). The ‘ground vegetation buffer’ scenario was 103% more likely (1.42, 2.89), and the ‘Sig. cross short-wait’ scenario was 62.1% more likely (1.17, 2.24). A summary of these findings is provided in
Table 5.
The diverging stacked bar chart reveals that speed reductions (
Figure 10), traffic barriers, and separation buffers significantly improve perceived safety. The ‘reduced speed’ and ‘parked car buffer’ scenarios elicited comparable positive/negative responses, suggesting equal importance in safety perceptions. The top-rated scenarios, ‘barrier fence’ and ‘wombat crossing’, share no obvious variable alignment (speed, volume, sound, or separation). ‘Increased canopy’ and ‘ground vegetation buffer’ both received higher levels of ‘strongly agree’ than the ‘baseline scenario’, with ‘ground vegetation buffer’ performing slightly better than ‘increased canopy’.
4.3. Revealed Preference ‘Affect Grid’ Responses to the Question, ‘How Do You Feel in This Space?’
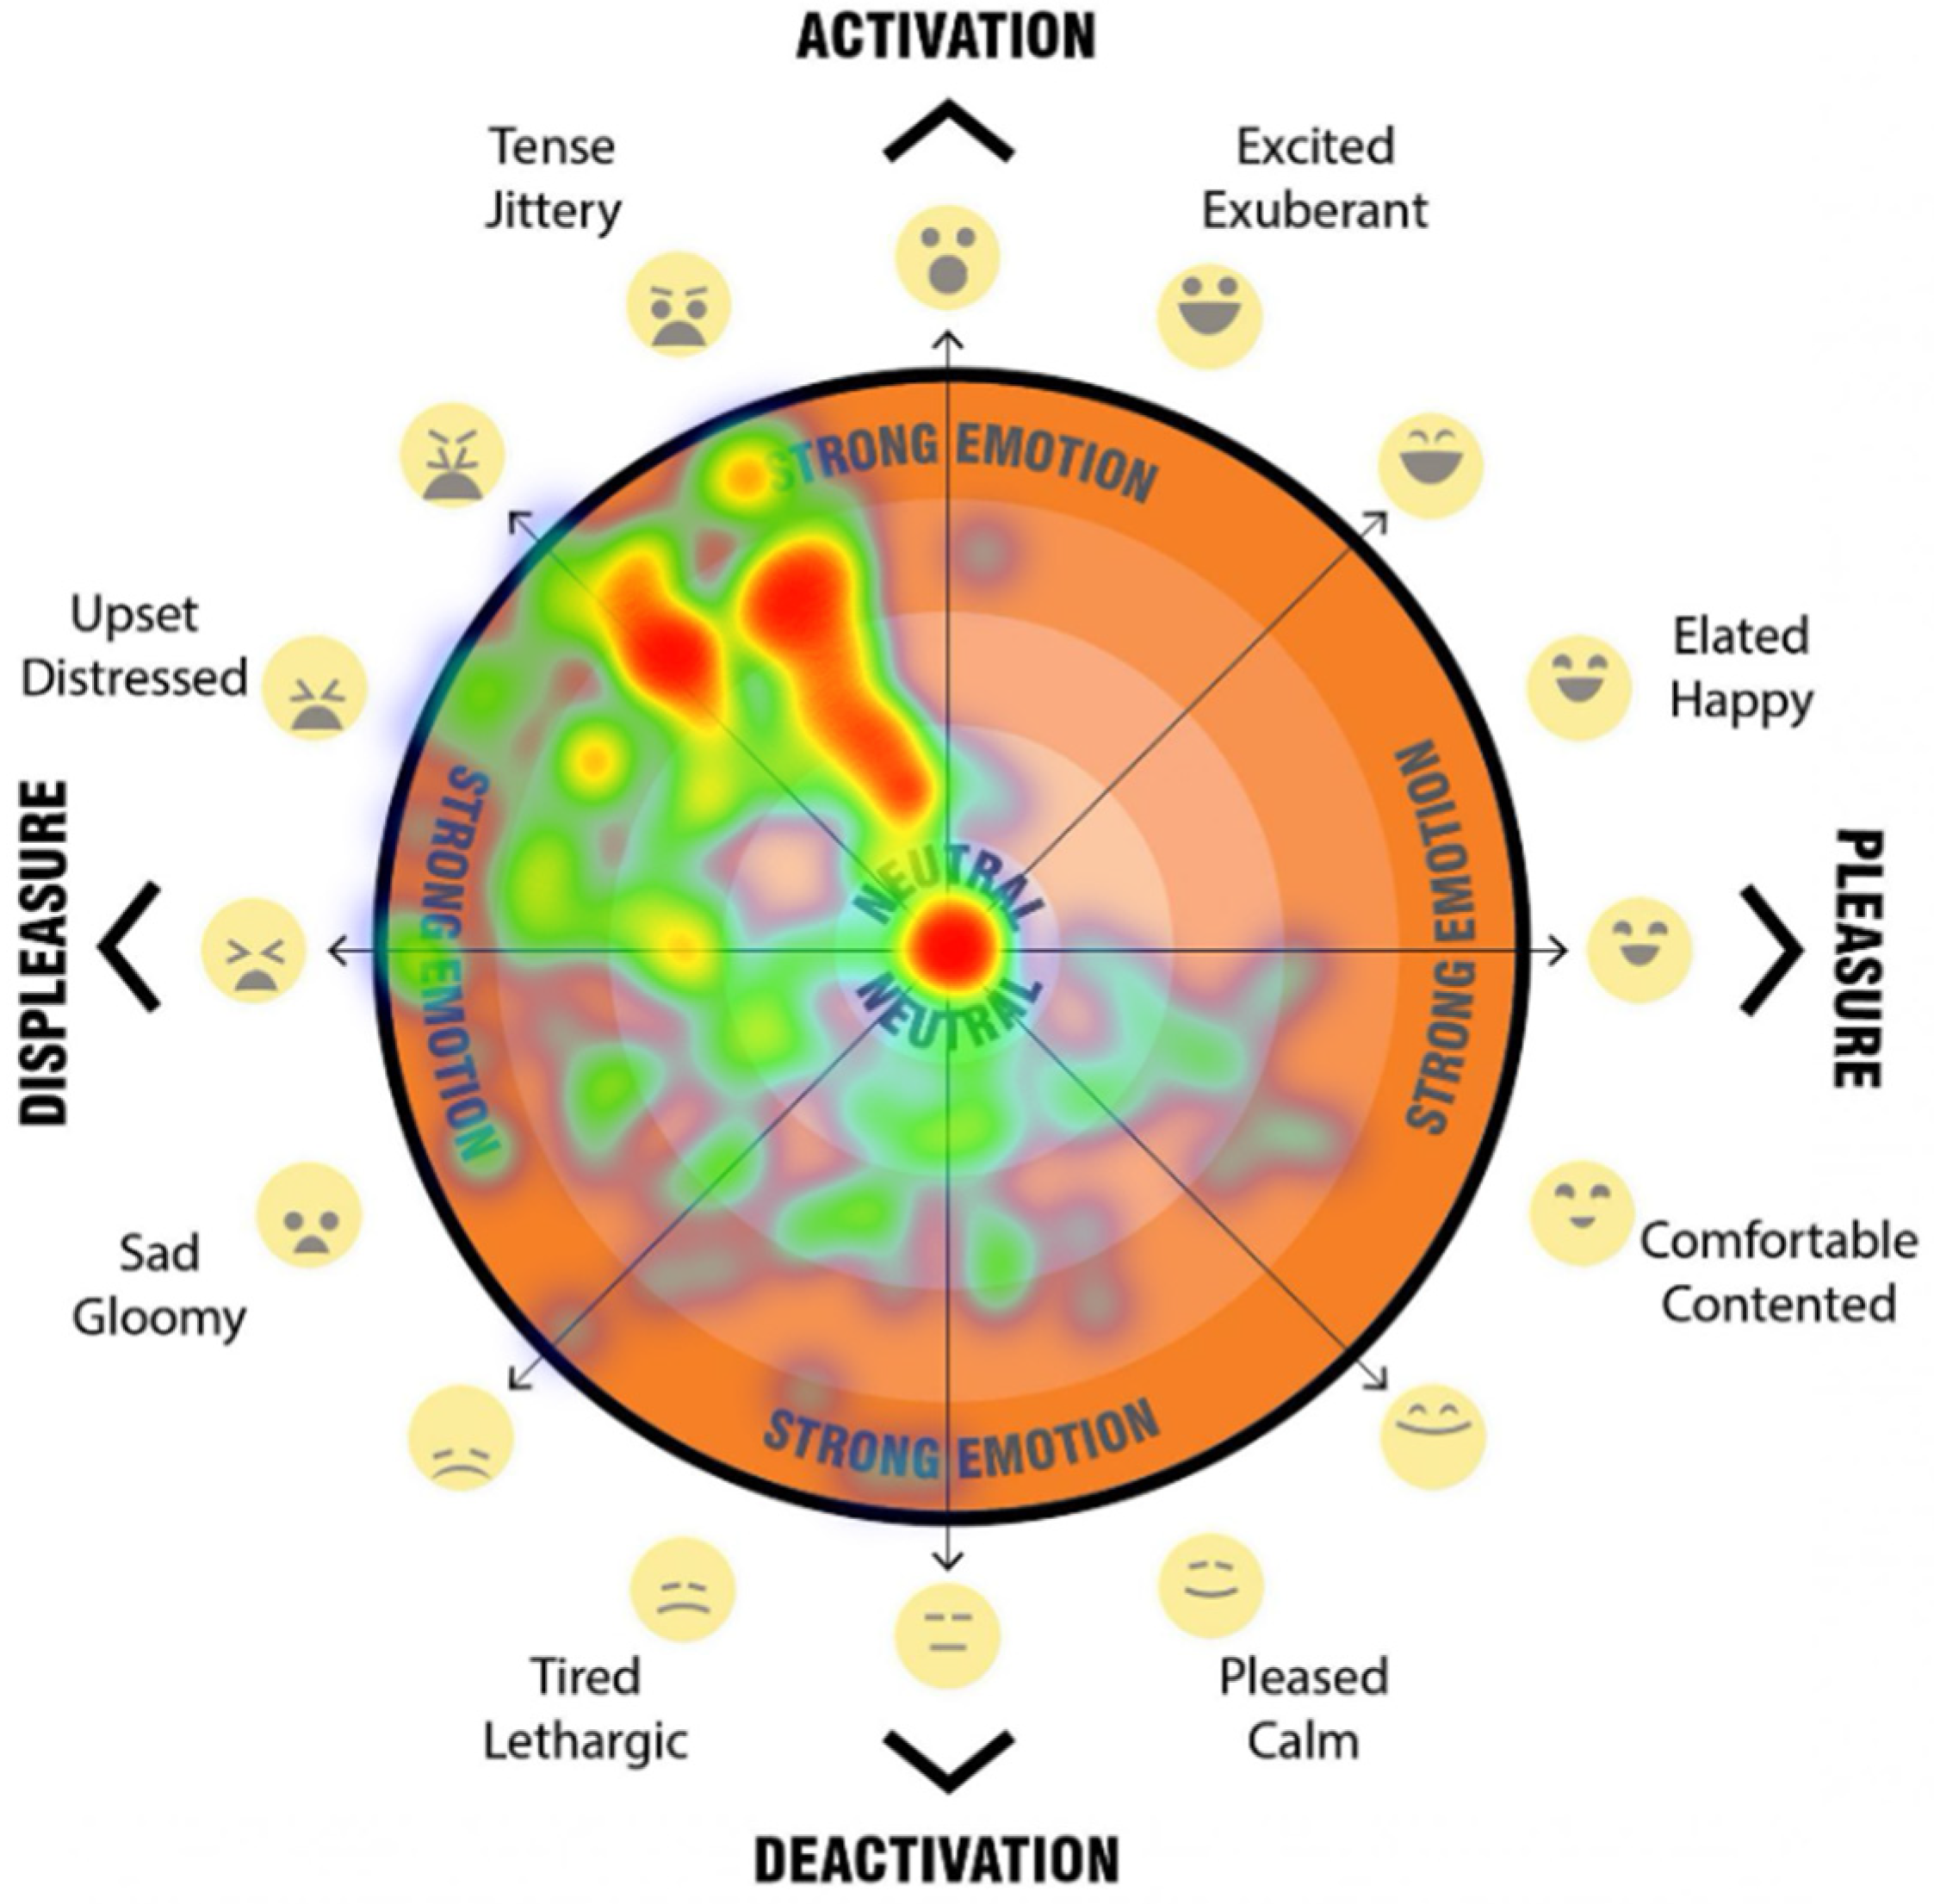
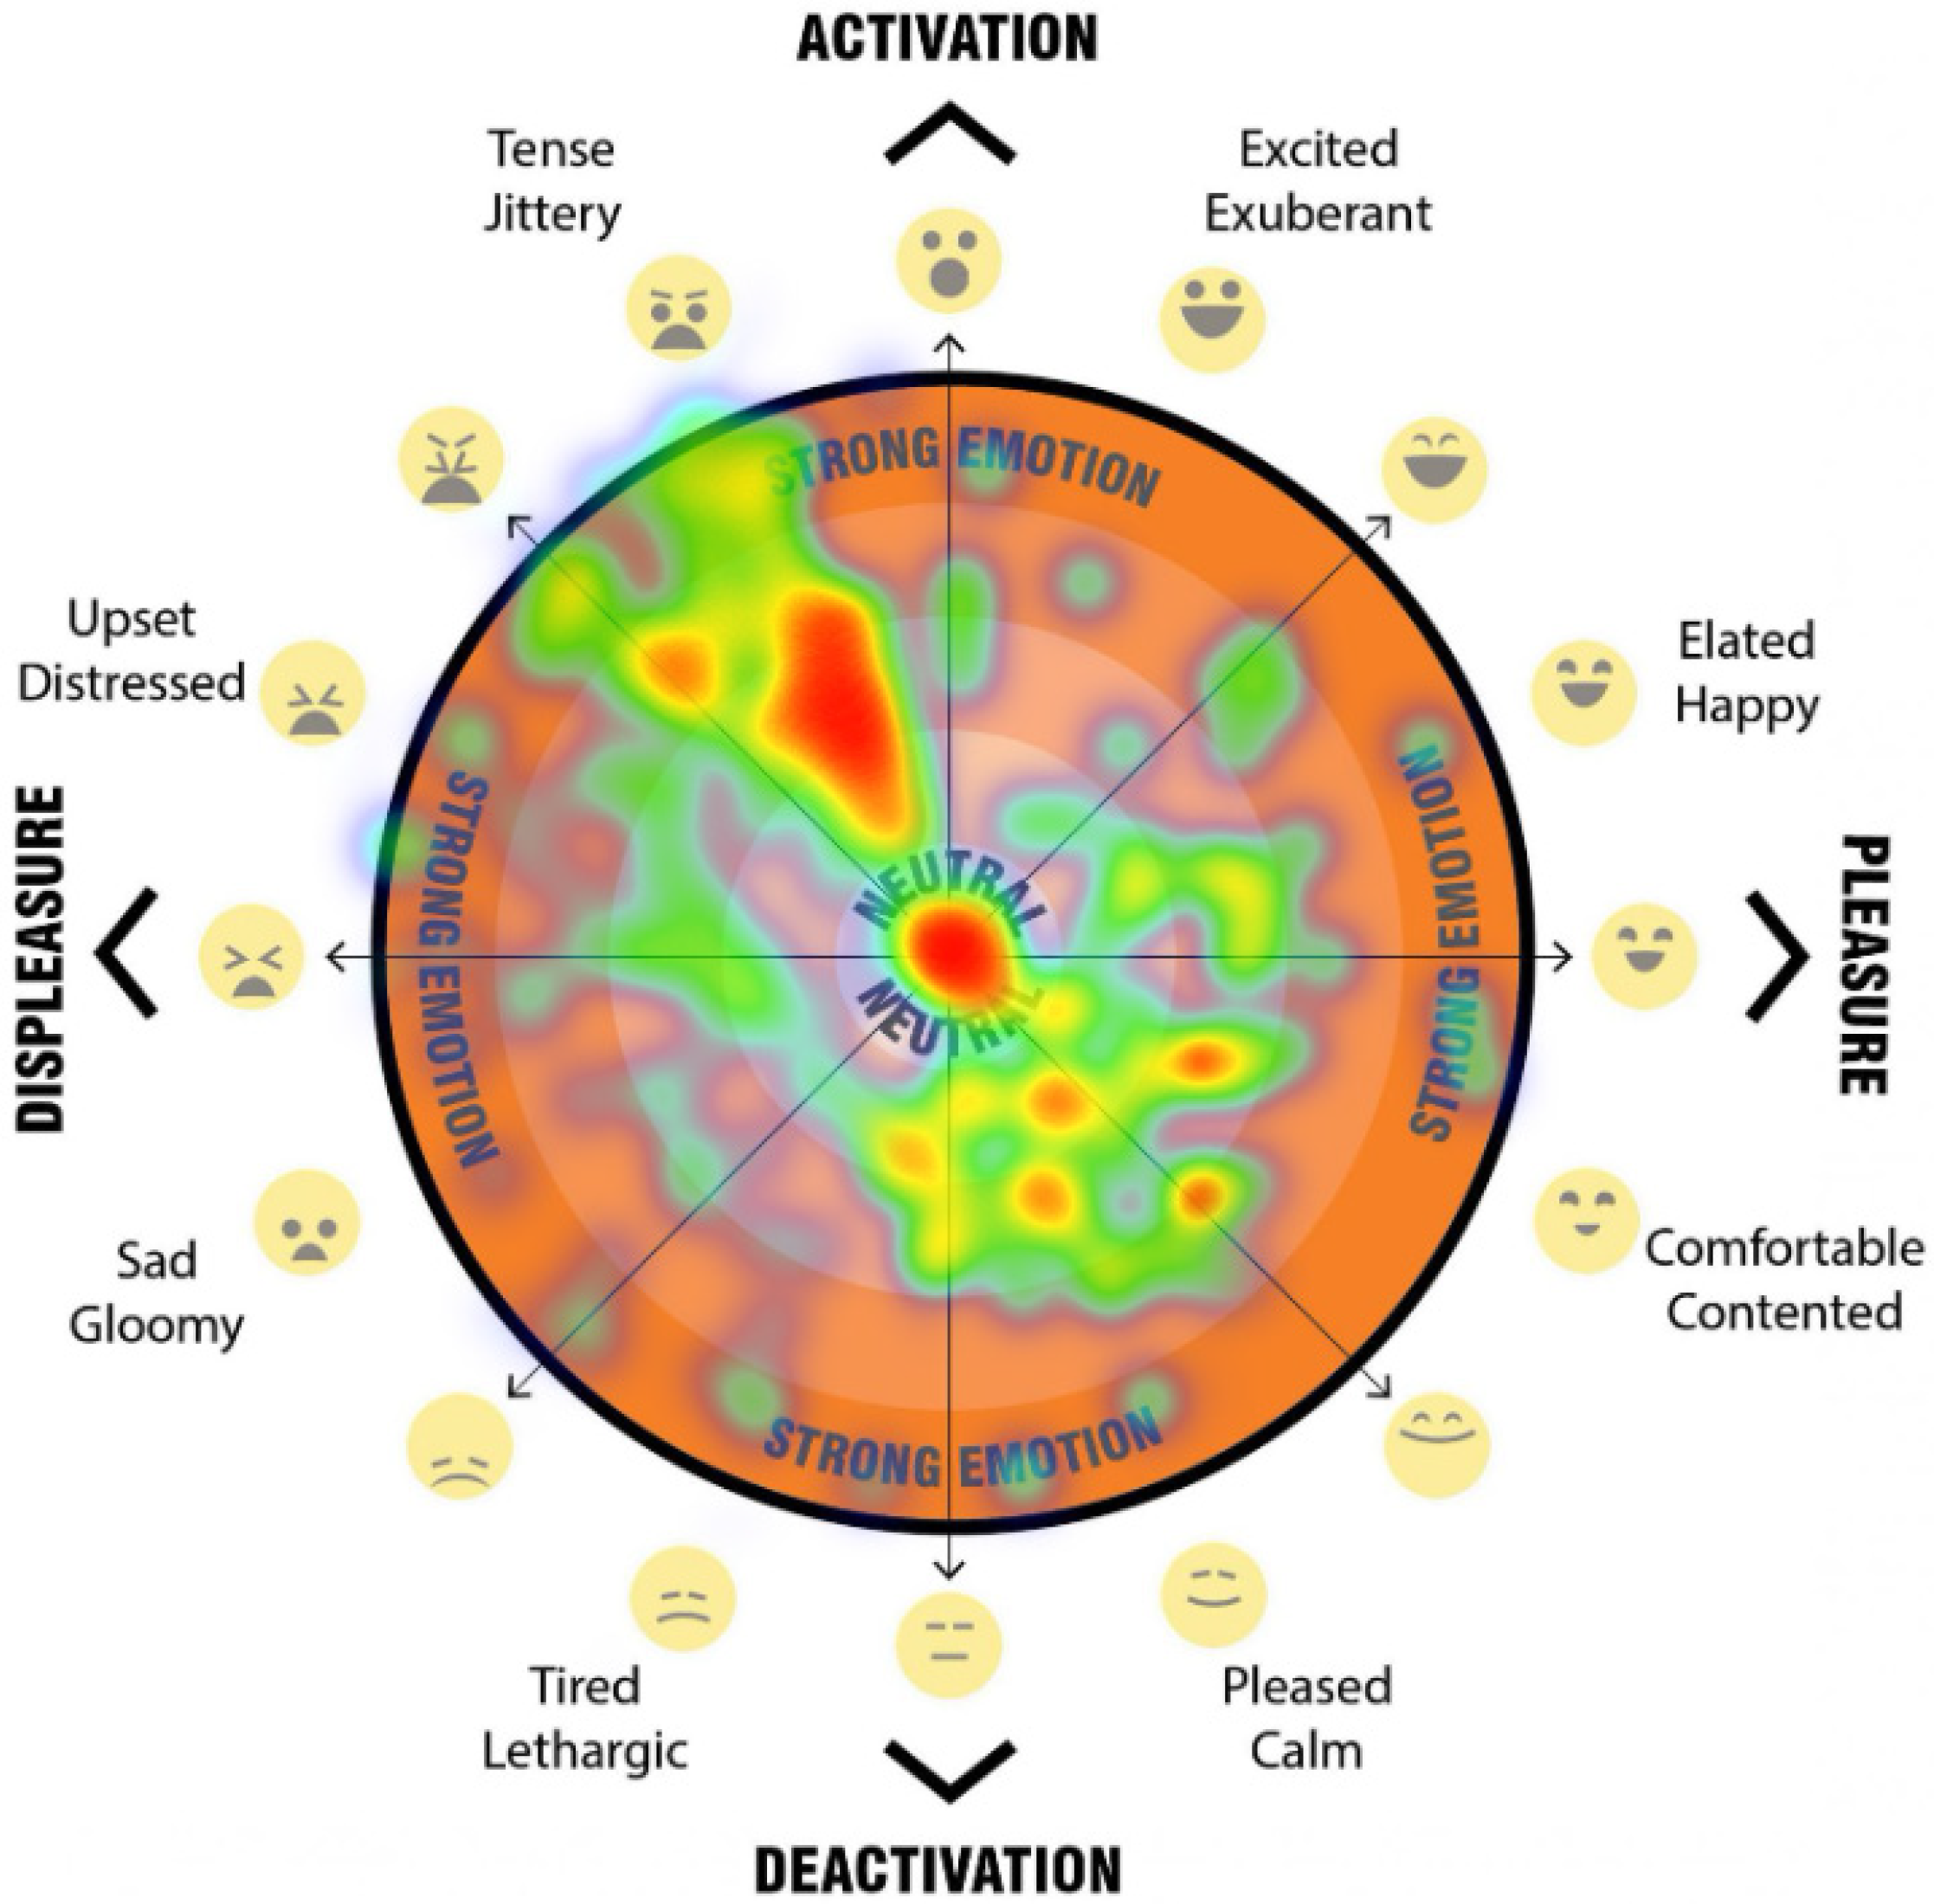
Analysis of the participants’ emotional responses, captured through the affect grid when participants were asked to indicate how they felt in each streetscape scenario, revealed distinct patterns. Participants marked their responses by selecting a point on the grid, with the vertical axis distinguishing between activation in the top half and deactivation in the bottom half, while the horizontal axis separated displeasure on the left from pleasure on the right. These responses were further categorised into four quadrants combining these states, with the distance from the neutral centre indicating emotional intensity, where darker orange markings represented stronger feelings (see
Figure 11 and
Figure 12).
Analysis of the emotional response data revealed a strong overall negative valence across all scenarios. Seventy percent of total responses were classified within the displeasure zone. Within this category, half of all responses (50% of the total) fell into the activation–displeasure quadrant, while 20% were categorised as deactivation–displeasure. Conversely, only 30% of responses were recorded within the pleasure zone. The majority of these (21% of total responses) were characterised as deactivation–pleasure, with a smaller proportion (9%) residing in the activation–pleasure quadrant.
In total, 70% of emotional responses fell within the displeasure zone, with half of these showing activation–displeasure characteristics and 20% exhibiting deactivation–displeasure. Within the pleasure zone, which accounted for the remaining 30% of responses, 21% were classified as deactivation–pleasure while 9% fell into the activation–pleasure category. Negative emotional states predominated across the streetscape scenarios, with activated displeasure emerging as particularly common among participants’ reactions.
Street trees and vegetation buffers significantly reduced pedestrian tension 69% reduction [Exp(B) = 0.302] and upset feelings 82% reduction [Exp(B) 0.179], compared with barrier fences, demonstrating their calming effect in urban environments. While reduced traffic speed and cycle lanes also improved emotional responses, vegetation-based interventions proved particularly effective at mitigating negative emotions like tension and sadness, highlighting their value for pedestrian well-being in streetscape design. A visualisation of emotional registration point responses is shown in heatmaps (
Figure 11 and
Figure 12).
4.4. Stated Preference: Ranked Streetscape Elements for Safety and Place
After viewing each scenario, participants were asked to complete the four stated-preference ‘drag and drop’ questions, ranking a list of eight predefined elements according to their negative or positive impact on pleasantness (sense of place) or safety. These predefined elements were trees, speed of traffic, distance from traffic, barrier separation from traffic (such as parked cars, fences, and low vegetation), vehicle noise, pedestrian crossing, cyclists, and street clutter (bins, power poles, and signage).
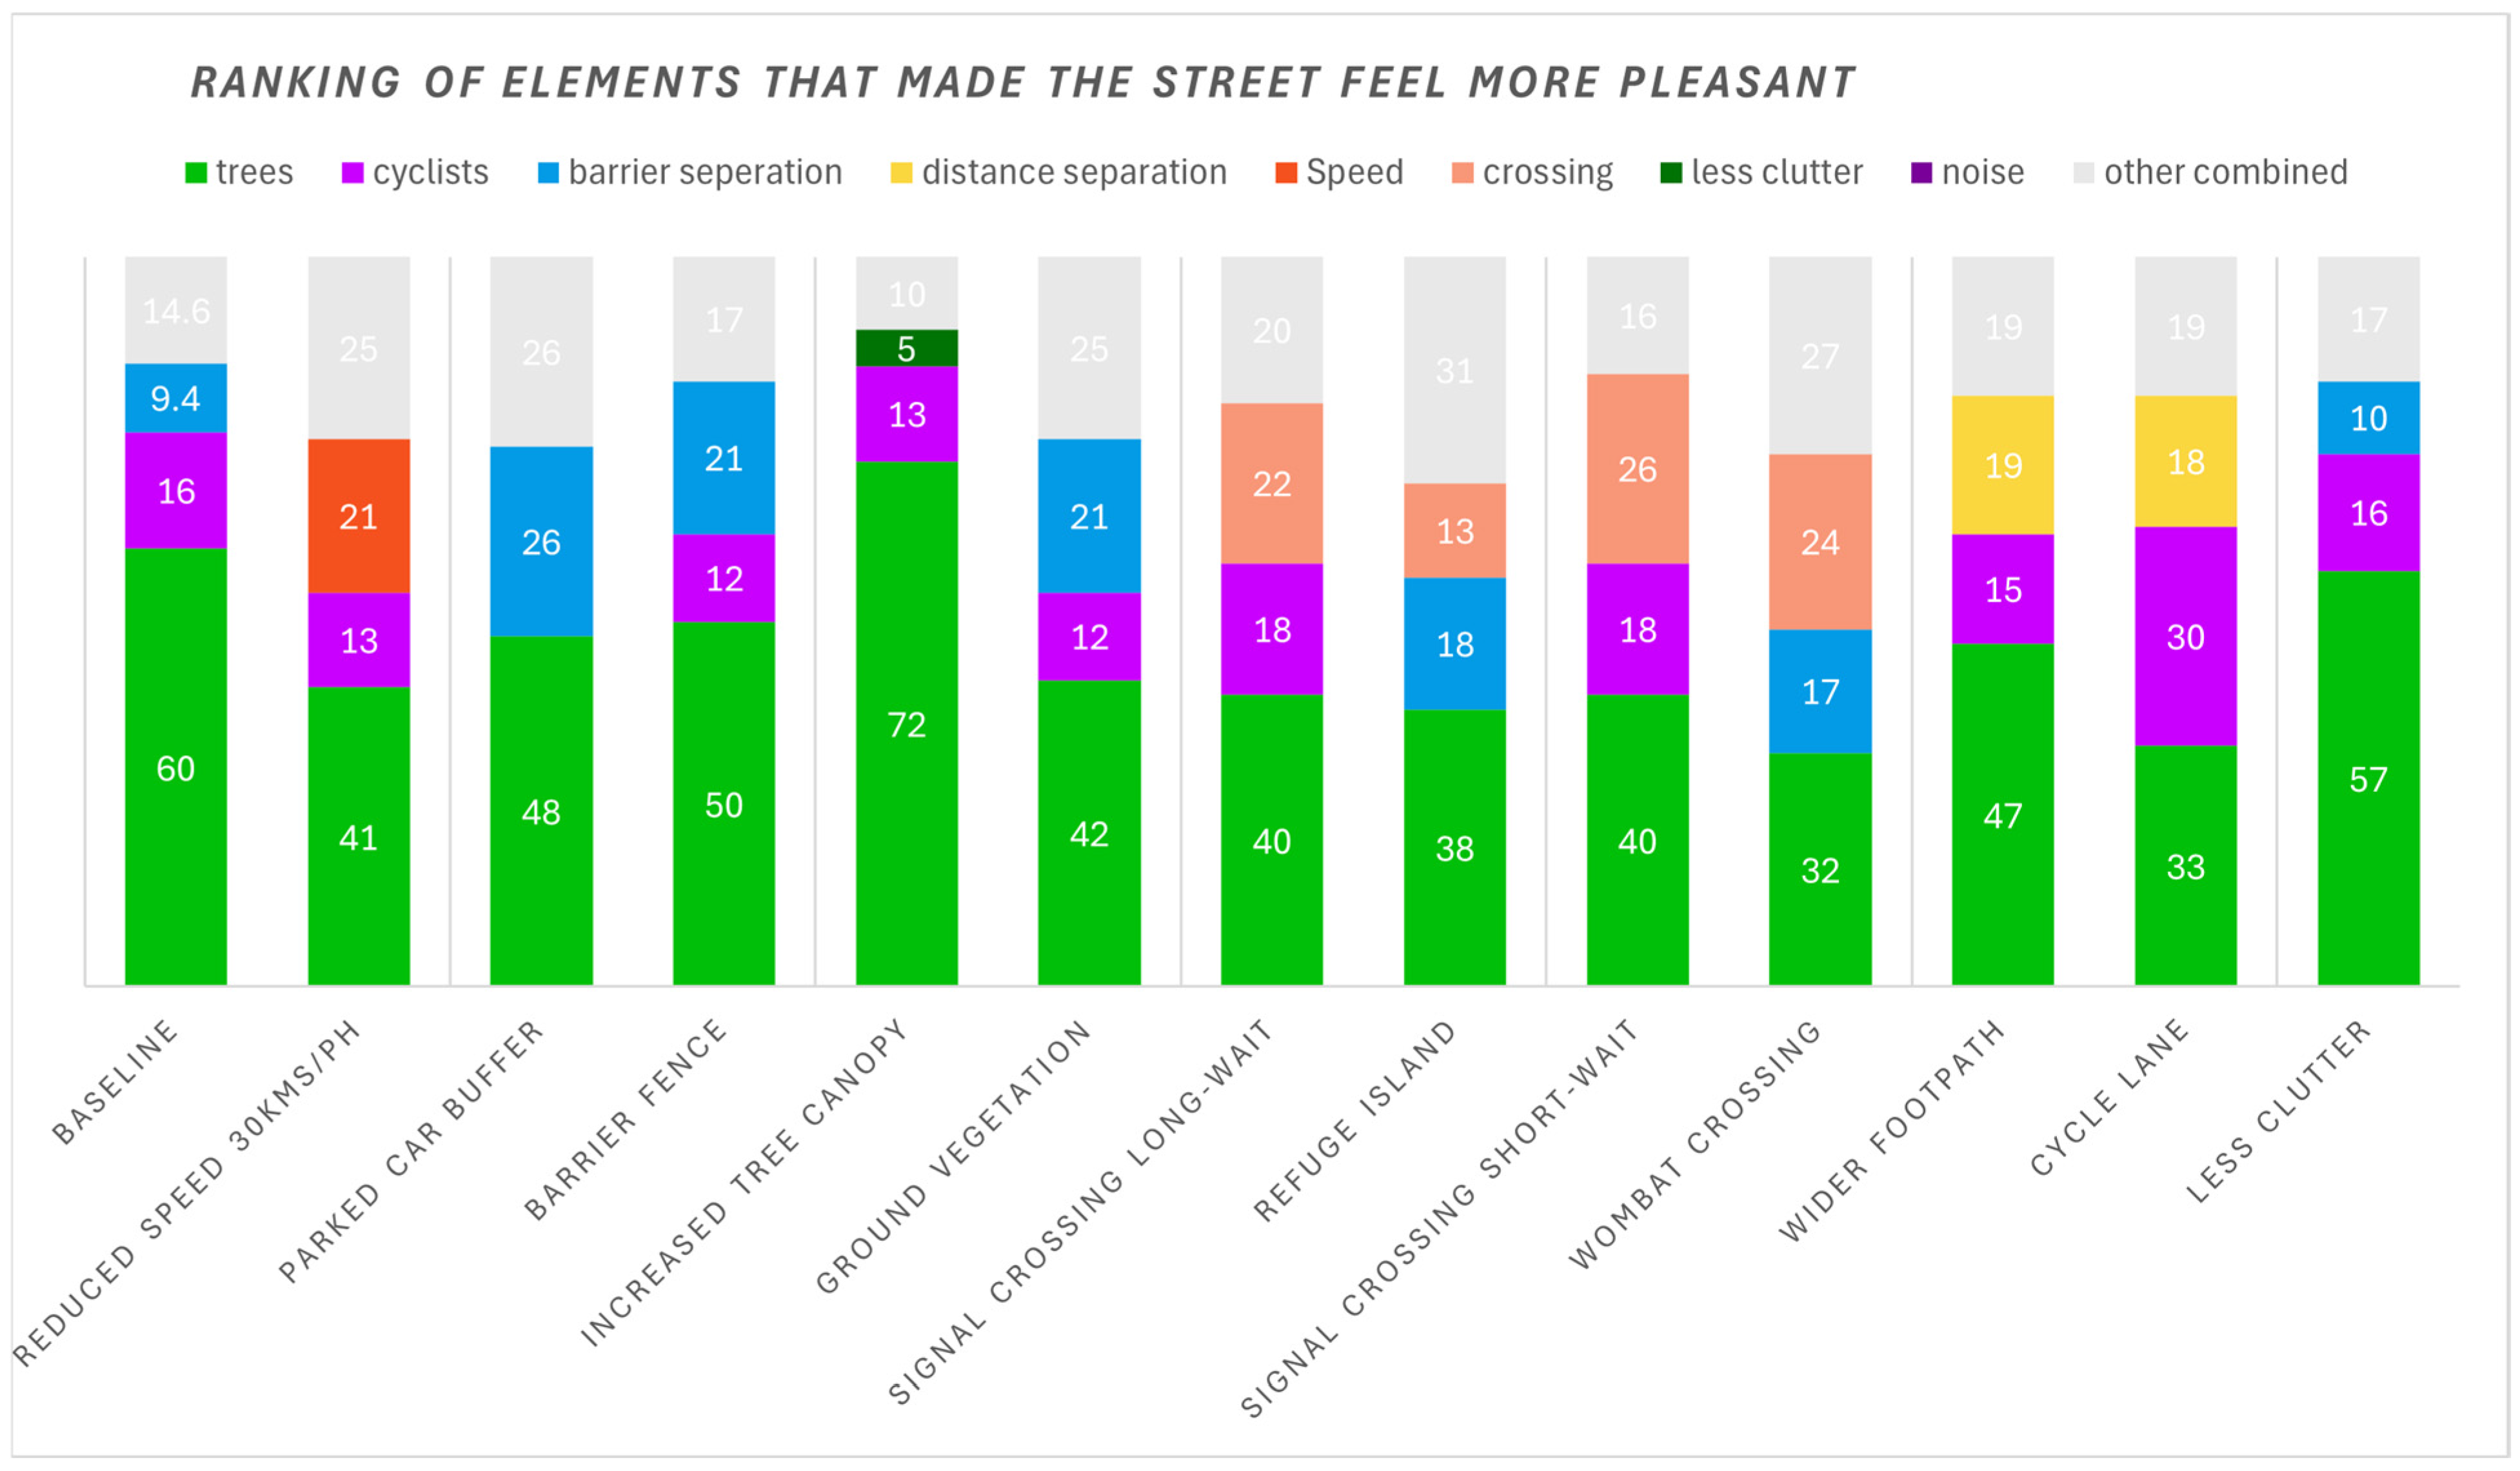
4.4.1. Ranking of Elements That Made the Street Feel MORE Pleasant
Across all scenarios, the three highest-ranked elements making a street more pleasant were first trees, then separation from traffic, and third the presence of cyclists. Trees were consistently ranked number one across all scenarios for this question. While the ‘drag and drop’ element ‘separation from traffic’ was not specific about how that separation was achieved, key physical differences between the scenarios allowed for this distinction into two spatial types; either barrier-separated (such as the ‘ground vegetation’ and ‘barrier fence’ scenarios, in which traffic speed and volume remain consistent with the baseline) or distance-separated, such as the ‘parked car’ and ‘widened footpath’ scenarios where traffic noise and volume were reduced in order to accommodate the alternative elements within the street.
Crossing scenarios saw a reduction in the percentage of respondents ranking trees first, with ‘crossings’ displacing either ‘cyclists’ or ‘barrier separation’ as the second- or third-ranking element for making the street feel more pleasant. Trees were ranked first by 72% of participants as the element making the street feel more pleasant for the ‘increased canopy’ scenario. This was also the only scenario to have (freedom from) ‘clutter’ ranking in the top three elements (trees were either not perceived as a ‘separation from traffic’ or ‘separation from traffic’ as an element did not feel rank-able in relation to trees because trees had already been ranked) (see
Figure 13).
4.4.2. Ranking of Elements That Made the Street Feel MORE Safe
Across all scenarios, three elements were consistently ranked in the highest three as making a street feel more safe. These were trees, crossings, and separation from traffic. While trees still featured as one of the most highly ranked elements for improving perceptions of safety (ranked first in four scenarios), crossings and traffic separation were more consistently ranked first in response to this question (see
Figure 14).
4.4.3. Ranking of Elements That Made the Street Feel LESS Pleasant
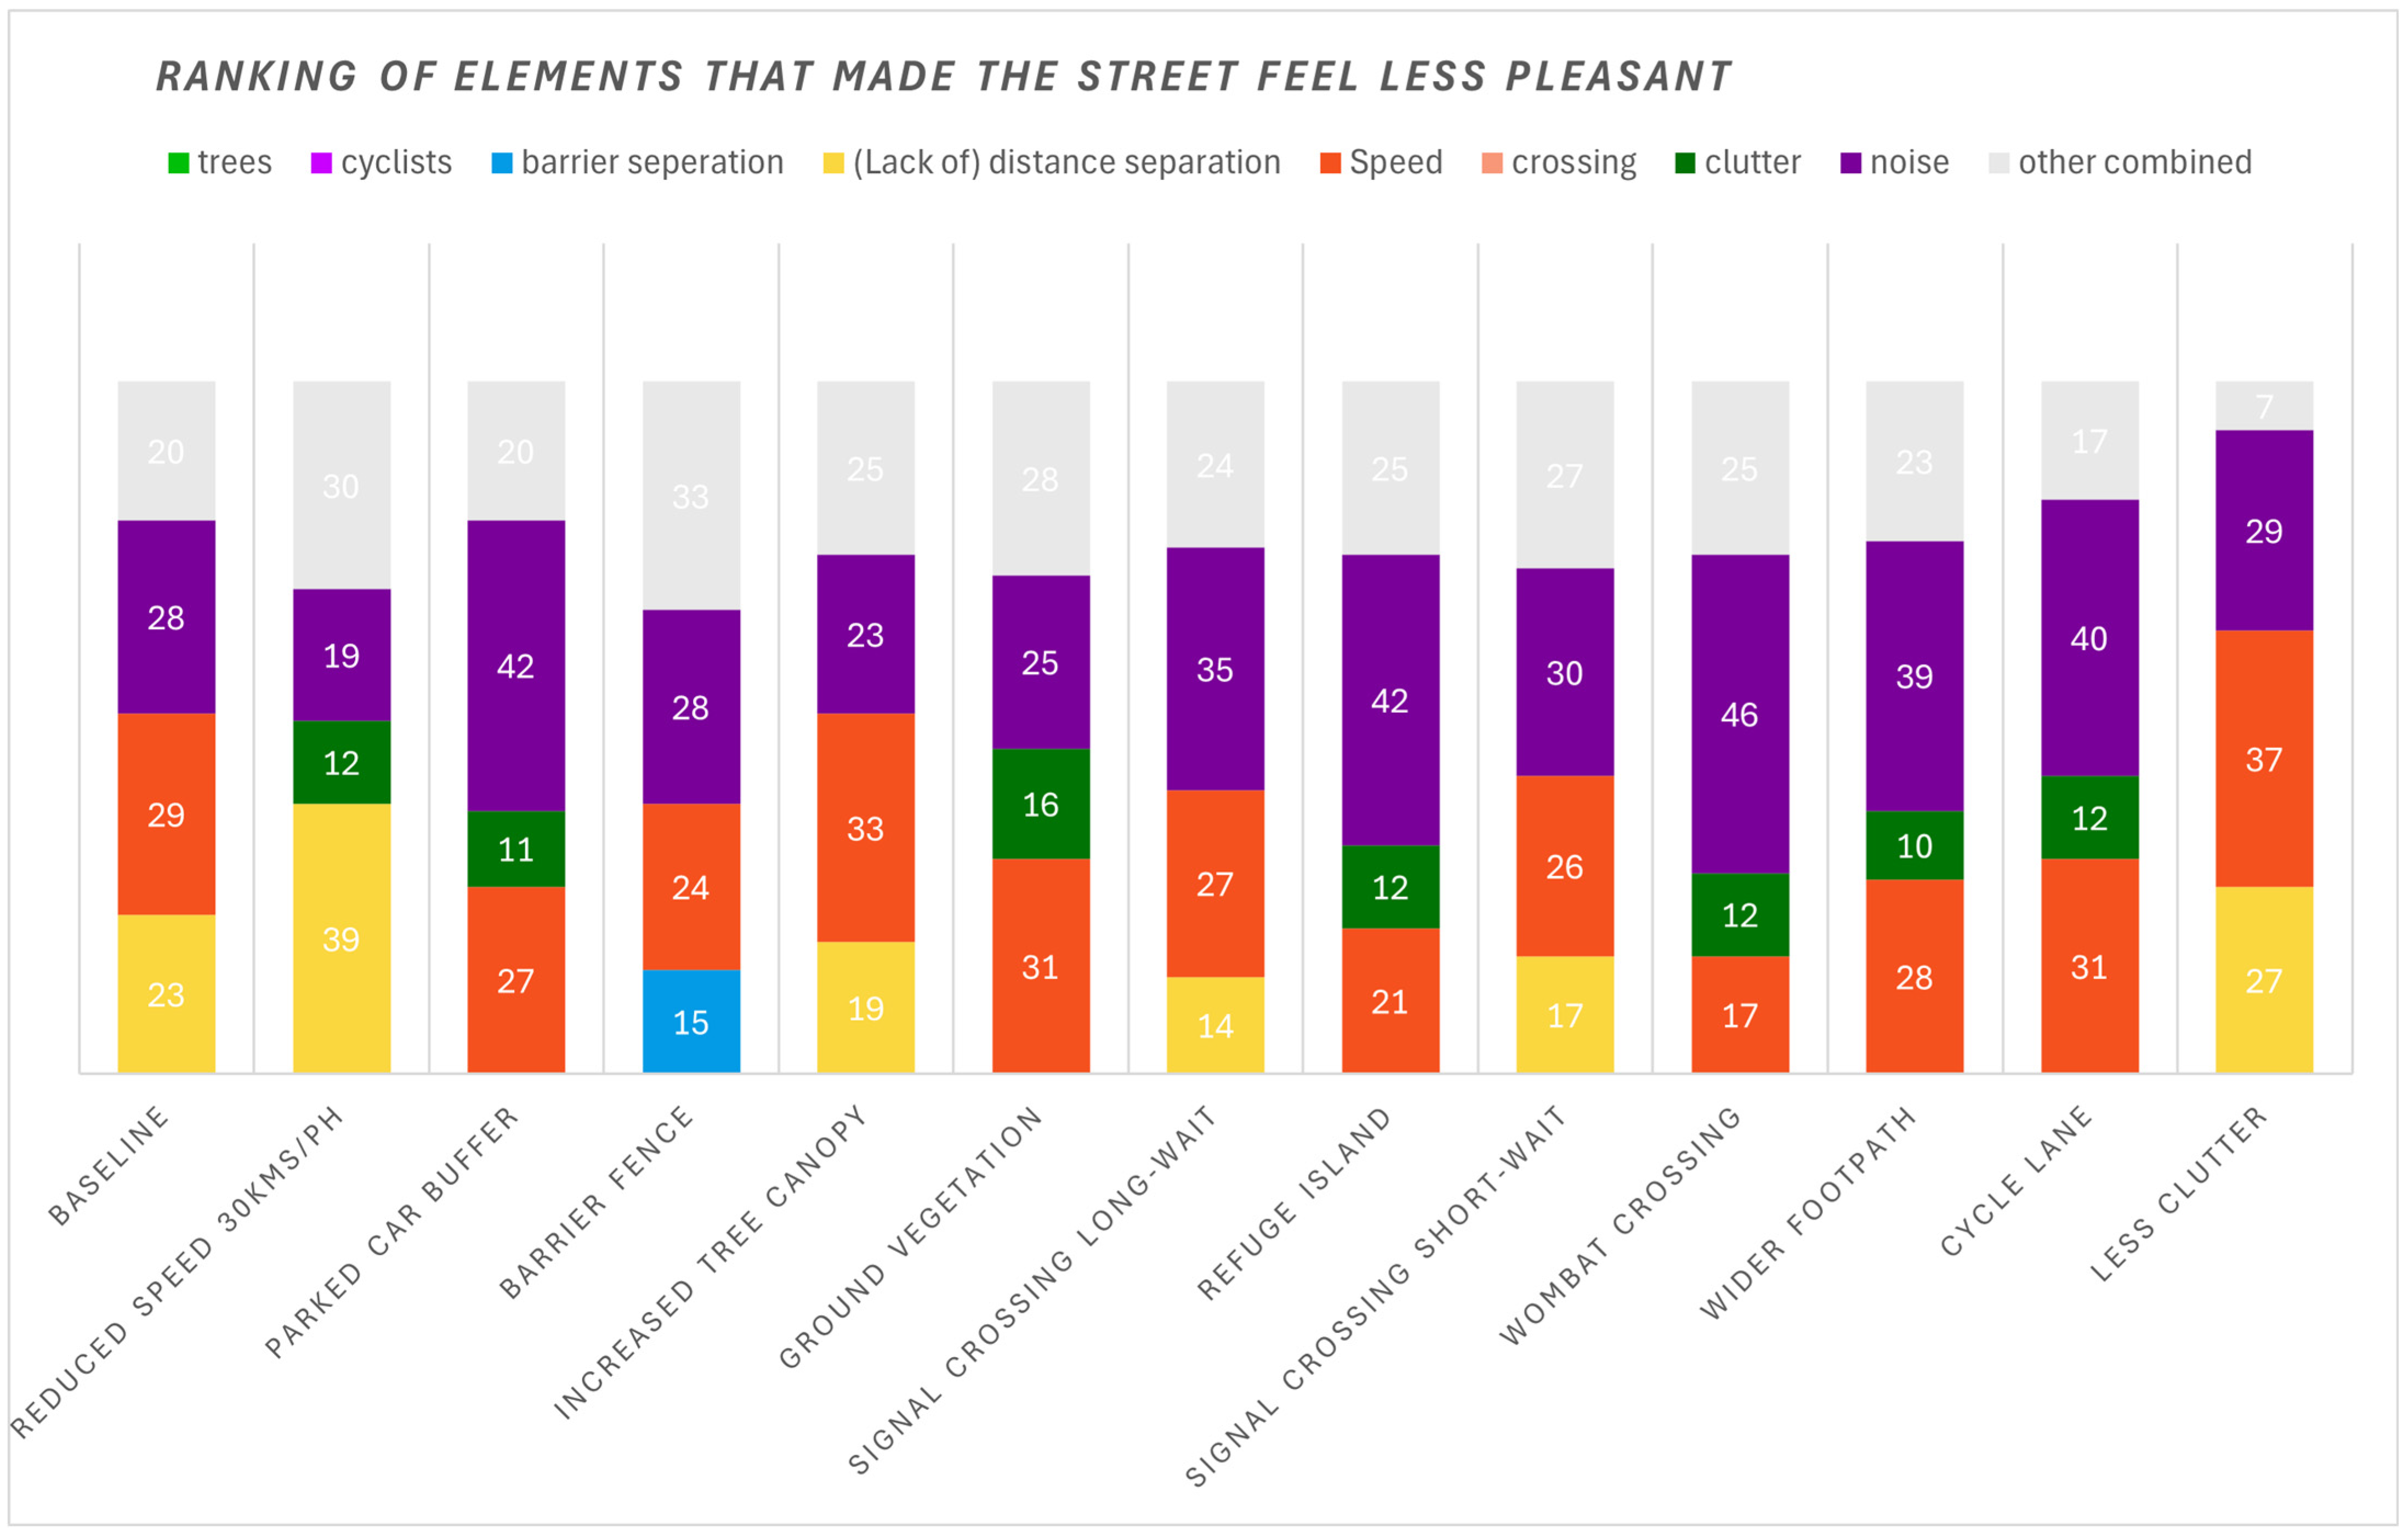
Analysis of respondent rankings across all scenarios identified the three elements most frequently selected as primary contributors to making a street less pleasant. The highest ranked factor was noise, followed by vehicle speed, and in third place a lack of distance separation from traffic. The presence of street clutter was also a commonly top-ranked element for reducing pleasantness. However, it is important to note that the inherent ambiguity of the term ‘clutter’ may have introduced a potential confounding effect. The word itself carries negative connotations, which may have influenced responses independently of the actual visual stimuli presented in the scenarios. Consequently, this particular result should be interpreted with caution.
Noise was the most popular choice of element to rank first that makes a street feel LESS pleasant (10 scenarios); this result is unsurprising given the inclusion of sound in the survey stimuli and the number of open text qualification responses, where the ‘annoyingness of the noise’ was frequently commented on. Speed was the second most popular choice of element to rank first for this question (four scenarios including ‘less clutter’). The three remaining scenarios where speed was ranked higher than noise were ‘baseline’, ‘increased tree canopy’, and ‘ground vegetation’ (see
Figure 15).
Lack of distance separation was the third most popular choice of element to rank first that makes a street feel LESS pleasant and was most often ranked third apart from the reduced speed scenario where it was ranked first.
4.4.4. Ranking of Elements That Made the Street Feel LESS Safe
Across all tested scenarios, the three elements most frequently ranked as the primary factor (No. 01) for making a street feel less safe were consistent: Vehicle speed, traffic noise, and a lack of distance separation from traffic. Notably, for perceptions of safety, the ranking order shifted; speed surpassed noise as the most selected element, whereas noise was the top concern for reducing pleasantness. In scenarios that did not include pedestrian crossings, the absence of a crossing itself emerged as a commonly top-ranked factor contributing to feelings of unsafety. Furthermore, a lack of separation remained a highly ranked concern for perceived safety, even in scenarios that incorporated mitigating features such as physical barrier fences or wider footpaths designed to provide a spatial buffer (see
Figure 16). This suggests a persistent psychological sensitivity to proximity to traffic, regardless of some physical interventions (see
Figure 16).
5. Discussion and Conclusion
5.1. Impact Trees Have on the Perceptions of Street Safety, Comfort, and Place for Pedestrians on Commercial Streets
The study’s results demonstrate that trees significantly enhance perceptions of street safety, comfort, and place for pedestrians on busy commercial streets, though their impact varies across different contexts. When assessing whether a street would be ‘a good place to stop for coffee’, the increased tree canopy scenario elicited responses that were 72.9% more likely to be positive compared to the baseline (
p < 0.001), outperforming artificial barriers like fences (59.3% more positive). This aligns with prior research indicating that trees contribute to a sense of enclosure and aesthetic appeal, fostering perceptions of comfort and sociability [
4,
40]. However, while trees improved perceived pleasantness and safety, their effect was less pronounced than traffic-calming measures (e.g., reduced speed zones, cycle lanes) or pedestrian-friendly crossings (e.g., wombat crossings).
Notably, trees were consistently ranked as the top element making streets feel more pleasant across all scenarios, underscoring their role in placemaking. For safety, trees were still highly valued but competed with crossings and traffic separation as primary concerns. This suggests that while trees enhance the experiential quality of streets, their perceived safety benefits may be secondary to direct traffic mitigation strategies.
Emotionally, trees reduced tense and upset feelings compared to the baseline, though less dramatically than speed reductions or vegetation buffers. The increased tree canopy scenario shifted affective responses toward deactivated pleasure (calmness), supporting theories that greenery promotes restorative experiences [
8]. Yet, the predominance of negative emotions across all scenarios (70% displeasure) highlights that trees alone cannot counteract stressors like traffic noise or speed, which were ranked as the top detractors of safety and pleasantness.
Trees are a critical component of streetscape design, enhancing place identity and comfort, but their benefits are maximised when integrated with traffic-calming and pedestrian-priority interventions. Policymakers should prioritise tree canopy expansion alongside measures like speed reduction and safe crossings to holistically improve pedestrian experiences.
5.2. Trees’ Role in Shaping Urban Streetscape Perceptions of Safety, Comfort, and Attractiveness in Urban Streetscapes
Our findings demonstrate that street trees significantly enhance perceptions of road safety, comfort, and attractiveness in urban streetscapes, though their impact is context-dependent. While trees emerged as the most highly valued element in stated-preference rankings for improving pleasantness, their performance in immersive simulations was more nuanced, positively influencing place perception but less dominant than traffic-calming measures like reduced speed or increased separation. This suggests that while people cognitively associate trees with improved environments [
41,
42], their experiential benefits in high-traffic environments may be partially overshadowed by immediate traffic stressors [
19]. Notably, trees improved perceived safety from traffic (albeit less strongly than dedicated crossings or barriers) while also fostering a sense of enclosure and visual coherence that enhanced place attachment [
8]. The discrepancy between stated and revealed preferences underscores that trees’ full benefits, particularly thermal comfort and auditory masking of traffic noise, may be underrepresented in virtual environments. For optimal impact, urban design should integrate trees with complementary treatments (e.g., traffic calming), as their placemaking potential is maximised when pedestrian stressors are first mitigated [
20].
5.2.1. Comparing Stated and Revealed Preferences for Trees as an Element That Made the Street MORE Pleasant
Analysis of the data reveals a complex relationship between stated and revealed preferences concerning street greening. A notable misalignment was observed between the two measures. In stated-preference evaluations, ‘trees’ were consistently ranked as the most popular element (number one) for enhancing a street’s pleasantness across all scenarios. However, this strong stated favour was not fully reflected in the revealed-preference data. The ‘increased tree canopy’ scenario yielded only moderately more positive results in participant responses compared to the ‘baseline’ condition. This discrepancy indicates that while people explicitly value trees highly for improving pleasantness, their implicit, affective responses to the visual stimulus of added canopy were positive but less pronounced than their stated opinions would suggest.
However, revealed-preference results for the question ‘Would this be a good place to stop for coffee?’ show that increasing canopy coverage alone was only slightly more effective than adding a barrier fence (‘increased tree canopy’ (0.73)). Likewise results for ‘How pleasant is it to stand in this space?’ revealed that a canopy cover increase alone was also substantially less effective than adding a cycle lane, increasing the footpath width, decreasing the speed, or adding a lane of parked cars, all interventions that have indirect reductions on traffic noise and speed.
Traffic speed and traffic volume (noise) were consistent between the ‘baseline’ and the ‘increased canopy cover’ scenarios, both elements that were consistently revealed and stated to have the most negative impact on the streetscape experience. Thus, the main difference between the baseline and the ‘increased canopy cover’ scenario was a single visual variable (sound, distance from traffic remained consistent).
5.2.2. Comparing Stated and Revealed Preferences for Trees and Street Safety
The study highlights an important distinction between how participants conceptually valued trees for safety and how trees actually influenced their perceptions when experiencing simulated streetscapes. While trees were frequently ranked highly as elements that made streets feel safer in stated-preference questions, their measurable impact in revealed-preference testing was more modest. The increased tree canopy scenario showed a statistically significant but relatively small improvement in safety perceptions compared to baseline conditions. This suggests participants may associate trees with safety in theory, but other factors become more influential when actually experiencing a busy streetscape.
The context of safety in this study primarily related to streetscapes and implied concern with traffic conditions rather than crime prevention. Within this traffic safety framework, trees performed less effectively than more direct interventions like physical barriers, speed reductions, or dedicated cycling infrastructure. This aligns with existing research showing that trees’ safety benefits depend heavily on context and the type of threat being considered. The spacing and arrangement of trees in the study may have limited their effectiveness as perceived safety barriers, not performing like bollards, as they did not create the same clear physical separation as elements like parked car buffers or fencing.
For pedestrian crossing decisions, trees did not emerge as a significant factor in making streets feel more inviting to cross. This reinforces that when assessing immediate safety concerns like crossing busy roads, participants prioritised clear traffic mitigation measures over aesthetic or environmental enhancements. The results suggest that while trees contribute positively to overall streetscape quality and pleasantness, their role in addressing specific traffic safety concerns may be secondary to more engineered solutions.
The findings have important implications for streetscape design. While trees offer multiple benefits for urban environments, their safety value appears most effective when combined with other traffic-calming measures. Designers should consider tree placement and density carefully to maximise their potential safety benefits, particularly in high-traffic areas. Future research could usefully explore how these relationships might differ in nighttime conditions or when considering crime prevention rather than just traffic safety. The study underscores that effective streetscape design requires a balanced approach combining greenery with other safety interventions to meet diverse pedestrian needs and perceptions.
5.3. Do Street Trees and Other Forms of Street Landscape Improve Pedestrians’ Perception of Safety and Place?
Answering this final question, there was a clear positive response: yes. The findings present compelling evidence that street trees significantly enhance pedestrians’ perceptions of both safety and place. Mirroring the positive effects observed with speed reduction interventions, street trees elicited consistently favourable responses across all evaluation metrics. In stated-preference rankings, trees emerged as the predominant first-choice element for enhancing streetscape pleasantness, demonstrating remarkable consistency across all tested scenarios. Analysis revealed that tree presence positively influenced multiple dimensions of pedestrian experience, including
Increased desirability for lingering activities (e.g., stopping for coffee);
Enhanced perceptions of environmental pleasantness;
Improved feelings of safety;
Greater invitation to cross streets for commercial purposes.
While street trees demonstrated a particularly strong performance, the ground-level vegetation buffer intervention also yielded positive responses, though with less pronounced effects. This may be attributable to several factors: the vegetation buffer’s implementation required footpath width concessions (without altering overall kerb alignment), and the scenario generated fewer responses compared to other interventions (notably ‘increased canopy’, ‘baseline’, ‘barrier fence’, and ‘reduced speed’ scenarios). These methodological considerations likely contributed to the lack of statistically significant findings for this specific intervention.
This suggests potential value in future research examining ground vegetation buffers in combination with complementary interventions, such as footpath widening, to more comprehensively assess their urban design potential. The current findings strongly support the prioritisation of street trees as a highly effective streetscape intervention for improving pedestrian experiences.
5.4. Key Insights for Traders and Local Government
The study’s findings carry significant implications for local businesses and governing authorities, particularly given established relationships between retail viability, dwell time, and environmental perceptions of safety and place quality [
43]. Three critical insights emerge from the analysis that challenge conventional streetscape planning approaches in commercial areas.
The most commercially beneficial interventions proved to be dedicated cycle lanes, wombat crossings (pedestrian-prioritised ‘zebra’ crossing with speed hump), and 30 km/h speed limits, which collectively enhanced both safety perceptions and place quality while improving pedestrian connectivity across retail corridors. These treatments created more inviting commercial environments that could potentially increase customer dwell times and cross-street visitation.
Notably, the study revealed that conventional prioritisation of on-street parking may require reconsideration. When evaluated against alternative treatments, parked car buffers demonstrated minimal benefits for retail environments. Cycle lanes, wombat crossings, and footpath widening all proved more effective at creating desirable stopping places, while mid-block crossings and tree canopy enhancements showed greater success in encouraging cross-street movement. The analysis identified limitations with barrier fencing solutions. While effective for safety improvement, these interventions created significant negative impacts on cross-street invitation and ranked poorly in creating pleasant stopping places. Practical challenges for commercial loading operations further diminish their suitability for retail precincts.
While not the top performing intervention, for ‘increased canopy’ a positive response was 73% more likely for the question ‘Would this be a good place to stop for coffee?’ and 53% more likely for the question ‘How inviting does it feel to cross the street to visit shops on the other side?’ than the ‘baseline’ scenario. These findings suggest municipal authorities should reevaluate traditional planning paradigms for commercial areas, prioritising pedestrian-oriented treatments and active transport infrastructure over conventional vehicular accommodations. The demonstrated preference for traffic calming and people-focused design over parking provision points toward more holistic approaches to retail streetscape planning that better balance movement and place functions.
5.5. Practitioner Recommendations
This study has yielded a wide range of insights beneficial for planning practitioners and contributed significantly to the existing knowledge base. Based on our findings, the following section summarises key recommendations for practitioners as follows.
5.5.1. IVE Within E-Participation Online-Survey for Streetscapes Community Engagement
E-participation using immersive virtual environments (IVEs) embedded in online surveys is an effective approach for community engagement in streetscape design, particularly for understanding perceptions of street trees. Perceptions, shaped by memories, experiences, and values, are challenging to analyse through traditional consultation methods due to subjectivity [
40]. IVEs, combined with revealed preference (rating scales), stated preference (element ranking), and emotion affect (affect grids), provide a robust approach to understanding how street trees influence perceptions of safety and place, aligning with findings that trees enhance comfort and attractiveness [
4]. IVEs offer two key innovations: they standardise responses from a pedestrian perspective, regardless of personal transport choices, and reduce emotional biases tied to specific streets. Online surveys enable broader geographic participation compared to localised traditional methods. We recommend adopting this approach to gather focused, empirically analysable input on street trees and other streetscape elements, addressing the limitations of conventional community engagement.
5.5.2. Tree Canopy Improvements Should Be in Considered with Other Treatments
Our analysis revealed some discrepancies between stated and revealed preferences regarding street trees’ role in place perception. While trees consistently ranked highest in stated-preference evaluations for enhancing streetscape pleasantness, their impact in immersive virtual environment (IVE) simulations proved less pronounced than traffic speed reduction, noise mitigation, and increased separation treatments. This divergence suggests several key insights as follows.
Cognitive vs. Experiential Valuation: While respondents cognitively value trees as important placemaking elements, their immediate perceptual experience in busy streetscapes remains dominated by traffic dynamics—particularly speed and noise variables.
Treatment Limitations: The tree canopy scenario’s moderate performance (where traffic speed remained unchanged) indicates that arboriculture interventions alone may be insufficient for meaningful place improvement without complementary traffic calming measures.
Virtual Environment Constraints: The IVE format may underrepresent trees’ full experiential benefits by excluding climatic factors like shade provision and thermal comfort—known contributors to real-world tree valuation [
4].
These findings lead to two principal recommendations. Firstly, tree canopy expansion should be implemented alongside complementary treatments like speed reduction and noise mitigation to maximise placemaking potential. Secondly, future virtual environment studies should incorporate thermal variables to better capture trees’ multisensory benefits.
The wombat crossing scenario demonstrated the powerful synergies possible when combining treatments. This intervention, integrating crossing infrastructure, traffic separation, and implicit speed reduction, generated response magnitudes an order of magnitude greater than baseline conditions. This suggests multi-modal interventions combining traffic calming, physical separation, pedestrian prioritisation, and greening may produce compound benefits. It also suggests alternative separation treatments (such as cycle paths or widened footpaths) warrant investigation as potential substitutes for vehicle buffers.
These findings underscore the need for integrated streetscape design approaches that address both movement and place considerations holistically. Future research should systematically examine treatment combinations to identify optimal configurations for different street typologies and contexts.
5.6. Limitations and Suggested Further Research
This research has successfully demonstrated the efficacy of a novel e-participation methodology. This approach integrated an online survey with animated, immersive virtual environments, an affect grid, and emotional response sliders to quantitatively assess citizen perceptions of safety and place quality in relation to street trees and other streetscape interventions. The results and insights generated by the project indicate substantial potential for expanding upon this work. It is therefore recommended that further research be undertaken to build upon the outcomes of this study.
The study’s online-only format introduced limitations in environmental control and audio consistency. While participant numbers increased with the online study, and instructions were given about the use of headphones and setting volume, uncontrolled variables like ambient noise and audio (speaker or headphone) quality may have influenced responses. If the volume settings on the participant device were turned up too loud, it may have exaggerated the impact of traffic noise, which may have impacted the comparison with vegetation perception.
Furthermore, subsequent refinement of the online survey interface is recommended to enhance its accessibility for individuals with visual impairment.
While the level of emersion was considered high for a phone-based survey with immersion and presence supporting a realistic, quality user experience [
44], the 360-video format with 3 degrees of freedom (3 DoF) also reduced immersion compared to full VR (6 DoF), potentially affecting how participants experienced tree canopy and ground vegetation scenarios.
Future research could productively investigate the impact of immersion level by comparing the methodological approach of this study, which utilised 360-degree videos, against full virtual reality experiences delivered via head-mounted displays. A limitation of the current study was a slight skew in community representation, with notably lower participation rates from youth (under 16 years) and older adults (75 years and over), demographic cohorts that may hold distinct perceptions of urban greenery. To address this gap and improve inclusivity, subsequent research could incorporate in-person, assisted e-participation methods specifically designed to engage these underrepresented groups, particularly older adults.
Importantly, variable isolation in streetscapes was challenging due to the interconnected nature of streetscape elements. While simple interventions like barrier fences were easily tested, some scenarios inherently involved multiple co-variables (e.g., traffic noise changes with footpath widening near for some crossing scenarios). This complexity may have affected the interpretation of tree canopy and ground vegetation impacts, as their benefits could not be compared directly against some streetscape modifications which necessitated reduced road width or lane number reduction such as ‘wombat crossing’ or ‘refuge island’. To combat potential order effect bias (where a participant may react differently to questions based on the order in which scenarios, for example, with reduced lanes, appear), we ran the scenarios with a randomised order via a computer-generated sequence.
While the virtual scenarios did include the sound of vehicles and the ‘irritating noise’ of accessible pedestrian signals (APS)’s percussive chirping, general streetscape sounds did not include bird noises. In the scenario with increased tree canopy, it is possible birds might be attracted to the street and contribute additional bird sounds. This may have an additional calming effect as suggested by Ratcliffe et al. [
45]. In future research, this aspect could be explored in more detail, with particular interest in the potential impact of increased coverage of native trees, which are known to attract native birds [
46]. Additionally, trees are also understood to have noise dispersion, absorption, and reflection properties [
4].
This study was conducted in mid–late August, with a focus on the state of NSW in Australia. While participants were not directed to assess spaces based on thermal comfort, the responses may have been influenced by late-winter weather and responses. Responses to trees may be even more positive if the study was conducted in the middle of summer where the consciousness of tree shade may be more front of mind.
The limited scenario number further restricted comprehensive testing of vegetation variables. In future work, investigations should examine how different tree species, spacing arrangements, and growth stages influence perceptions of place. This would include comparing uniform species plantings (same species on both sides of the street) with varied approaches (different species per side, mixed patterns, or random selections from municipal species lists). Particular attention should be given to species selection and placement that maximises ecosystem benefits, following the framework established by White and Langenheim [
10]. Additionally, research should explore how tree maturity affects perceptions, comparing the impacts of established canopy trees versus newly planted saplings on streetscape experience and perceived safety. Such investigations would provide more nuanced guidance for urban forest management while maintaining the placemaking benefits identified in this study. A summer study could be useful in testing this hypothesis. It might also be useful to test the impact of drawing attention to the shade and ecosystem benefits trees provide to see if perceptions change further.
5.7. Conclusion: Do Trees Really Make a Difference to Our Perceptions of Streets?
The findings of this study provide a clear and compelling answer: yes, trees fundamentally shape how we experience and perceive urban streets. While traffic conditions, particularly speed, noise, and proximity, emerged as dominant factors influencing safety concerns, with one participant noting ‘The proximity to the traffic, the speed of the traffic and the noise of the traffic made me feel most unsafe’, trees consistently enhanced perceptions of pleasantness, comfort, and place. As another participant reflected, ‘I was quite surprised at how much the increased tree canopy contributed to feelings of pleasantness’.
Trees were ranked as the top element making streets feel more pleasant across all scenarios, and their benefits extended to multiple dimensions of street experience. They increased the desirability of stopping for coffee, improved the perceived safety of standing in the space, and even made crossing to retail more inviting. One participant’s comment captured this holistic value: ‘Tree-lined streets are very inviting; more trees should be planted. Deciduous trees will provide cooling in summer while letting the sun in during winter’. However, the study also revealed nuanced limitations. While trees significantly improved placemaking, their impact on traffic safety perceptions was more modest compared to direct interventions like speed reduction or physical barriers. This aligns with participant observations that ‘All the traffic elements combined (distance from/footpath width, noise and speed) were the main things that made the space unpleasant for me’, underscoring that trees alone cannot counteract the stressors of high-traffic environments.
The integration of immersive virtual environments with large-scale e-participation has proven effective in quantifying these perceptual trade-offs, offering a replicable method to prioritise pedestrian-oriented design elements. As demonstrated, it is possible to rank streetscape interventions based on their perceived safety and placemaking value, though such rankings must balance perceptual data with practical considerations like cost, traffic flow, and measurable safety outcomes.
This research directly contributes to key Sustainable Development Goals by providing evidence-based strategies for sustainable urban development. For SDG 11 (Sustainable Cities and Communities), the findings offer practical, quantifiable guidance for creating safer, more inclusive, and resilient urban streetscapes through the integration of vegetation buffers and pedestrian-focused design. By demonstrating how tree canopy and vegetation significantly improve pedestrian perceptions of safety and reduce negative emotional responses, the study supports SDG 3 (Good Health and Well-being) through the design of urban environments that promote mental well-being and encourage active transport like walking. Furthermore, by advocating for increased urban greening, the research aligns with SDG 13 (Climate Action), as expanded tree canopy contributes to carbon sequestration, urban heat mitigation, and enhanced climate resilience in cities.
Ultimately, this study affirms that trees are valuable and effective for creating streets that are not just functional but liveable. Their ability to soften urban environments, foster a sense of place, and mitigate climate impacts, while complementing traffic-calming measures, makes them essential for people-centred street design. The challenge for urban designers, landscape architects, transport engineers, and planners lies in strategically integrating trees with other safety interventions to address both the emotional and physical dimensions of the pedestrian experience. As cities grow denser and climate pressures intensify, this balanced approach will be critical to designing streets that are safe, sustainable, and desirable places to be.
