Article

Beyond Homogeneous Perception: Classifying Urban Visitors’ Forest-Based Recreation Behavior for Policy Adaptation

1
Department of Ecological Landscape Architecture Design, Kangwon National University, Chuncheon 24341, Republic of Korea
2
Department of Landscape Architecture, Graduate School, Kangwon National University, Chuncheon 24341, Republic of Korea
*
Author to whom correspondence should be addressed.
Land 2025, 14(8), 1584; https://doi.org/10.3390/land14081584
Submission received: 11 July 2025 / Revised: 30 July 2025 / Accepted: 1 August 2025 / Published: 3 August 2025

Abstract

Urban forests, as a form of green infrastructure, play a vital role in enhancing urban resilience, environmental health, and quality of life. However, users perceive and utilize these spaces in diverse ways. This study aims to identify latent perception types among urban forest visitors and analyze their behavioral, demographic, and policy-related characteristics in Incheon Metropolitan City (Republic of Korea). Using latent class analysis, four distinct visitor types were identified: multipurpose recreationists, balanced relaxation seekers, casual forest users, and passive forest visitors. Multipurpose recreationists preferred active physical use and sports facilities, while balanced relaxation seekers emphasized emotional well-being and cultural experiences. Casual users engaged lightly with forest settings, and passive forest visitors exhibited minimal recreational interest. Satisfaction with forest elements such as vegetation, facilities, and management conditions varied across visitor types and age groups, especially among older adults. These findings highlight the need for perception-based green infrastructure planning. Policy recommendations include expanding accessible neighborhood green spaces for aging populations, promoting community-oriented events, and offering participatory forest programs for youth engagement. By integrating user segmentation into urban forest planning and governance, this study contributes to more inclusive, adaptive, and sustainable management of urban green infrastructure.

Graphical Abstract

1. Introduction

Forests are widely recognized as critical environmental assets that provide diverse ecological, economic, and social benefits [1]. Historically, forests were primarily valued for timber production and economic resources; their role as spaces for recreation and well-being has garnered increasing attention in recent years [2]. The COVID-19 pandemic amplified the significance of forest-based recreation as urban residents increasingly sought outdoor activities [3]. Urban forests, as a key form of green infrastructure, contribute not only to air quality and biodiversity but also to enhanced quality of life through opportunities for relaxation, physical activity, and social connection [4,5].
As the societal demand for forest-based recreation grows, urban forests are increasingly expected to fulfill multifunctional roles aligned with sustainable urban development and nature-based solutions [6,7]. This shift calls for more nuanced understanding and management strategies that reflect the heterogeneous needs and values of urban forest visitors. However, the demand for forest recreation varies significantly among visitors, with differing motivations, preferences, and activity patterns shaped by sociodemographic, psychological, and cultural factors [8,9]. Despite this diversity, current forest policies in many urban contexts often emphasize uniform facility expansion or generalized accessibility improvements, with limited attention to differentiated strategies aligned with specific visitor needs [10].
Previous studies on forest recreation have primarily focused on the psychological and social benefits of forest visits [7], the economic valuation of ecosystem services [11], and the relationship between green spaces and life satisfaction [12]. In terms of visitor segmentation, research has largely classified forest users based on activity types [13], sociodemographic profiles [14], or environmental attitudes [15]. Although these studies have advanced the understanding of forest users’ characteristics, they also exhibit several limitations. First, they often neglect visitors’ subjective perceptions of forest recreation values, which are key to designing user-centered forest policies. Second, methodological approaches have typically relied on descriptive statistics or simple clustering techniques, which may not adequately capture the latent and multidimensional nature of user perceptions and behavior. Unlike these conventional methods, latent class analysis (LCA) enables the identification of unobserved heterogeneity within the population by grouping individuals based on underlying response patterns, rather than observable characteristics alone [16]. Third, few studies have directly linked visitor typologies to tailored policy recommendations, with most focusing on general principles of conservation or facility planning [10]. Notably, in the Korean context, studies have often concentrated on specific sites or forest types (e.g., urban parks, national forests), limiting the generalizability of the findings for broader urban forest policy frameworks [2].
Given the increasing policy focus on inclusive, health-supportive, and perception-based green infrastructure, there is a pressing need to move beyond conventional segmentation approaches and explore visitor typologies grounded in value perception. Such an approach can provide deeper insights into how individuals prioritize different recreational, health, and ecological functions of urban forests and how these priorities translate into behavioral patterns and policy demands. The application of LCA in this context offers a methodologically rigorous and theoretically coherent approach to segmenting urban forest visitors in a way that better reflects the complexity of human–nature interactions. Furthermore, by linking visitor types to their specific policy preferences and satisfaction levels, this study contributes to bridging the gap between empirical segmentation research and actionable policy design.
To address these gaps, this study applies LCA to classify urban forest visitors based on their perceived forest recreation values and examines differences in behavior, satisfaction, and policy preferences among segments. By situating these findings within the broader discourse on green infrastructure governance and inclusive planning, we aim to provide a comprehensive empirical foundation for shifting from uniform, facility-oriented strategies to differentiated policy approaches tailored to diverse visitor types. Accordingly, this study seeks to answer the following research questions:
(1)
What are the latent classes of urban forest visitors based on their perceived forest recreation values?
(2)
How do these classes differ in their recreation behaviors, satisfaction levels, and policy demands?
(3)
What policy directions can effectively address the diverse needs of each visitor type?

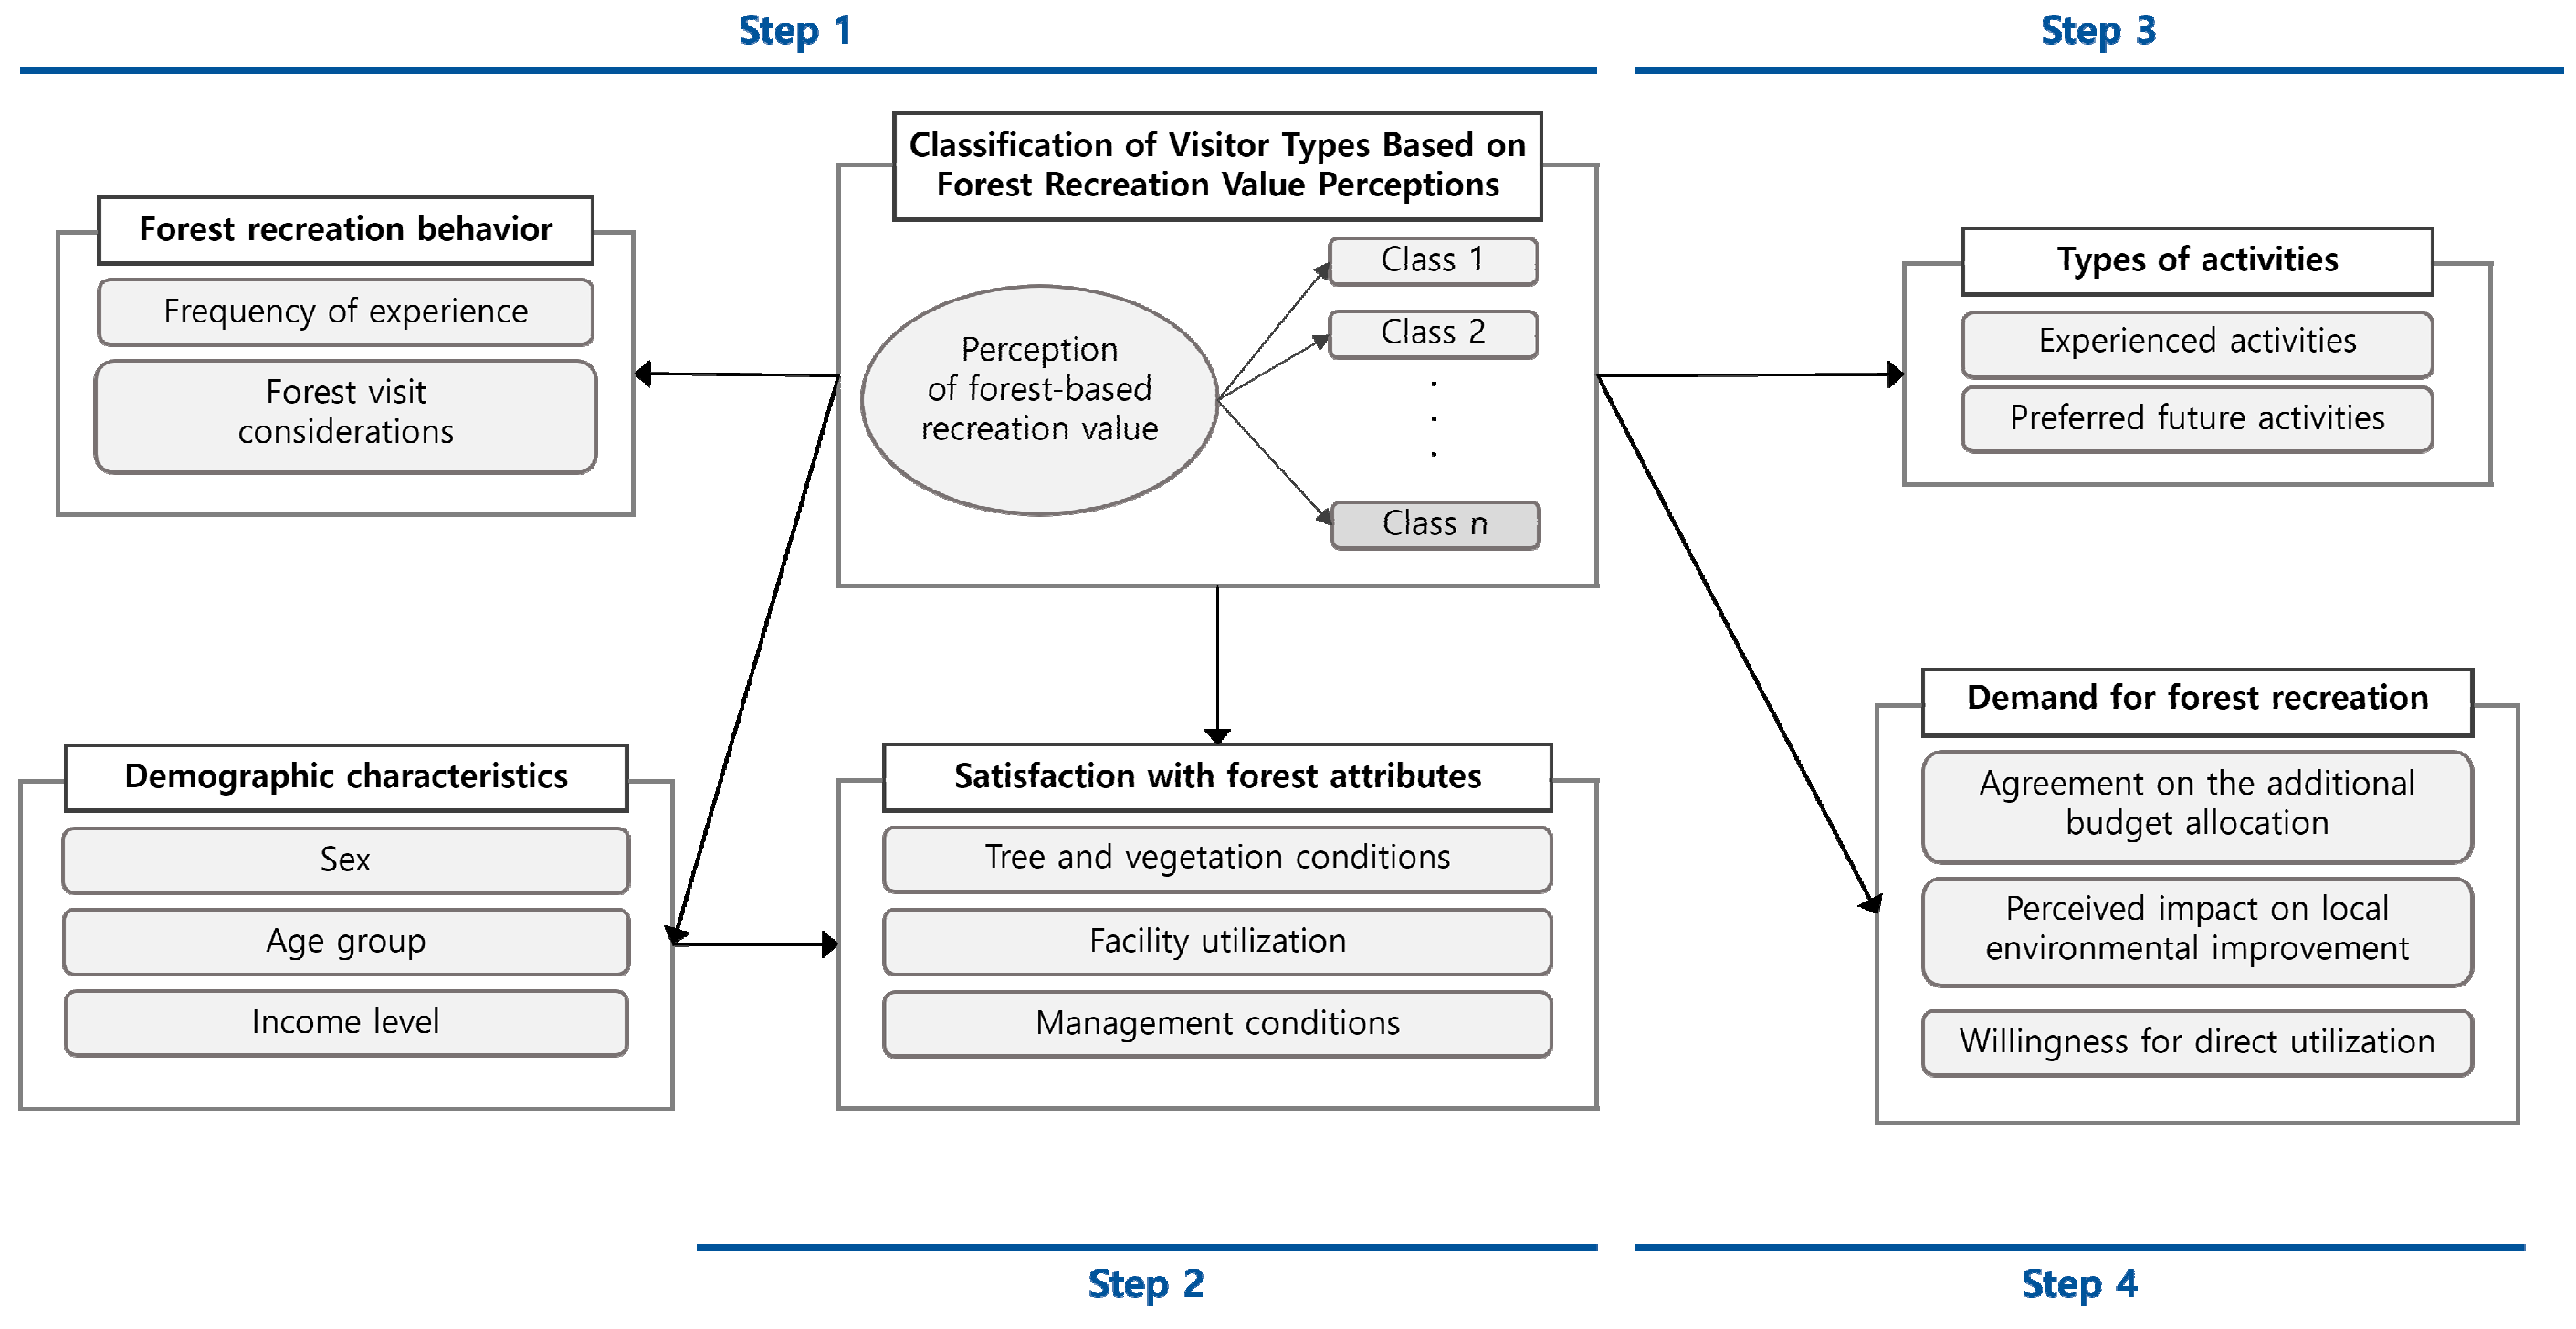
2. Materials and Methods
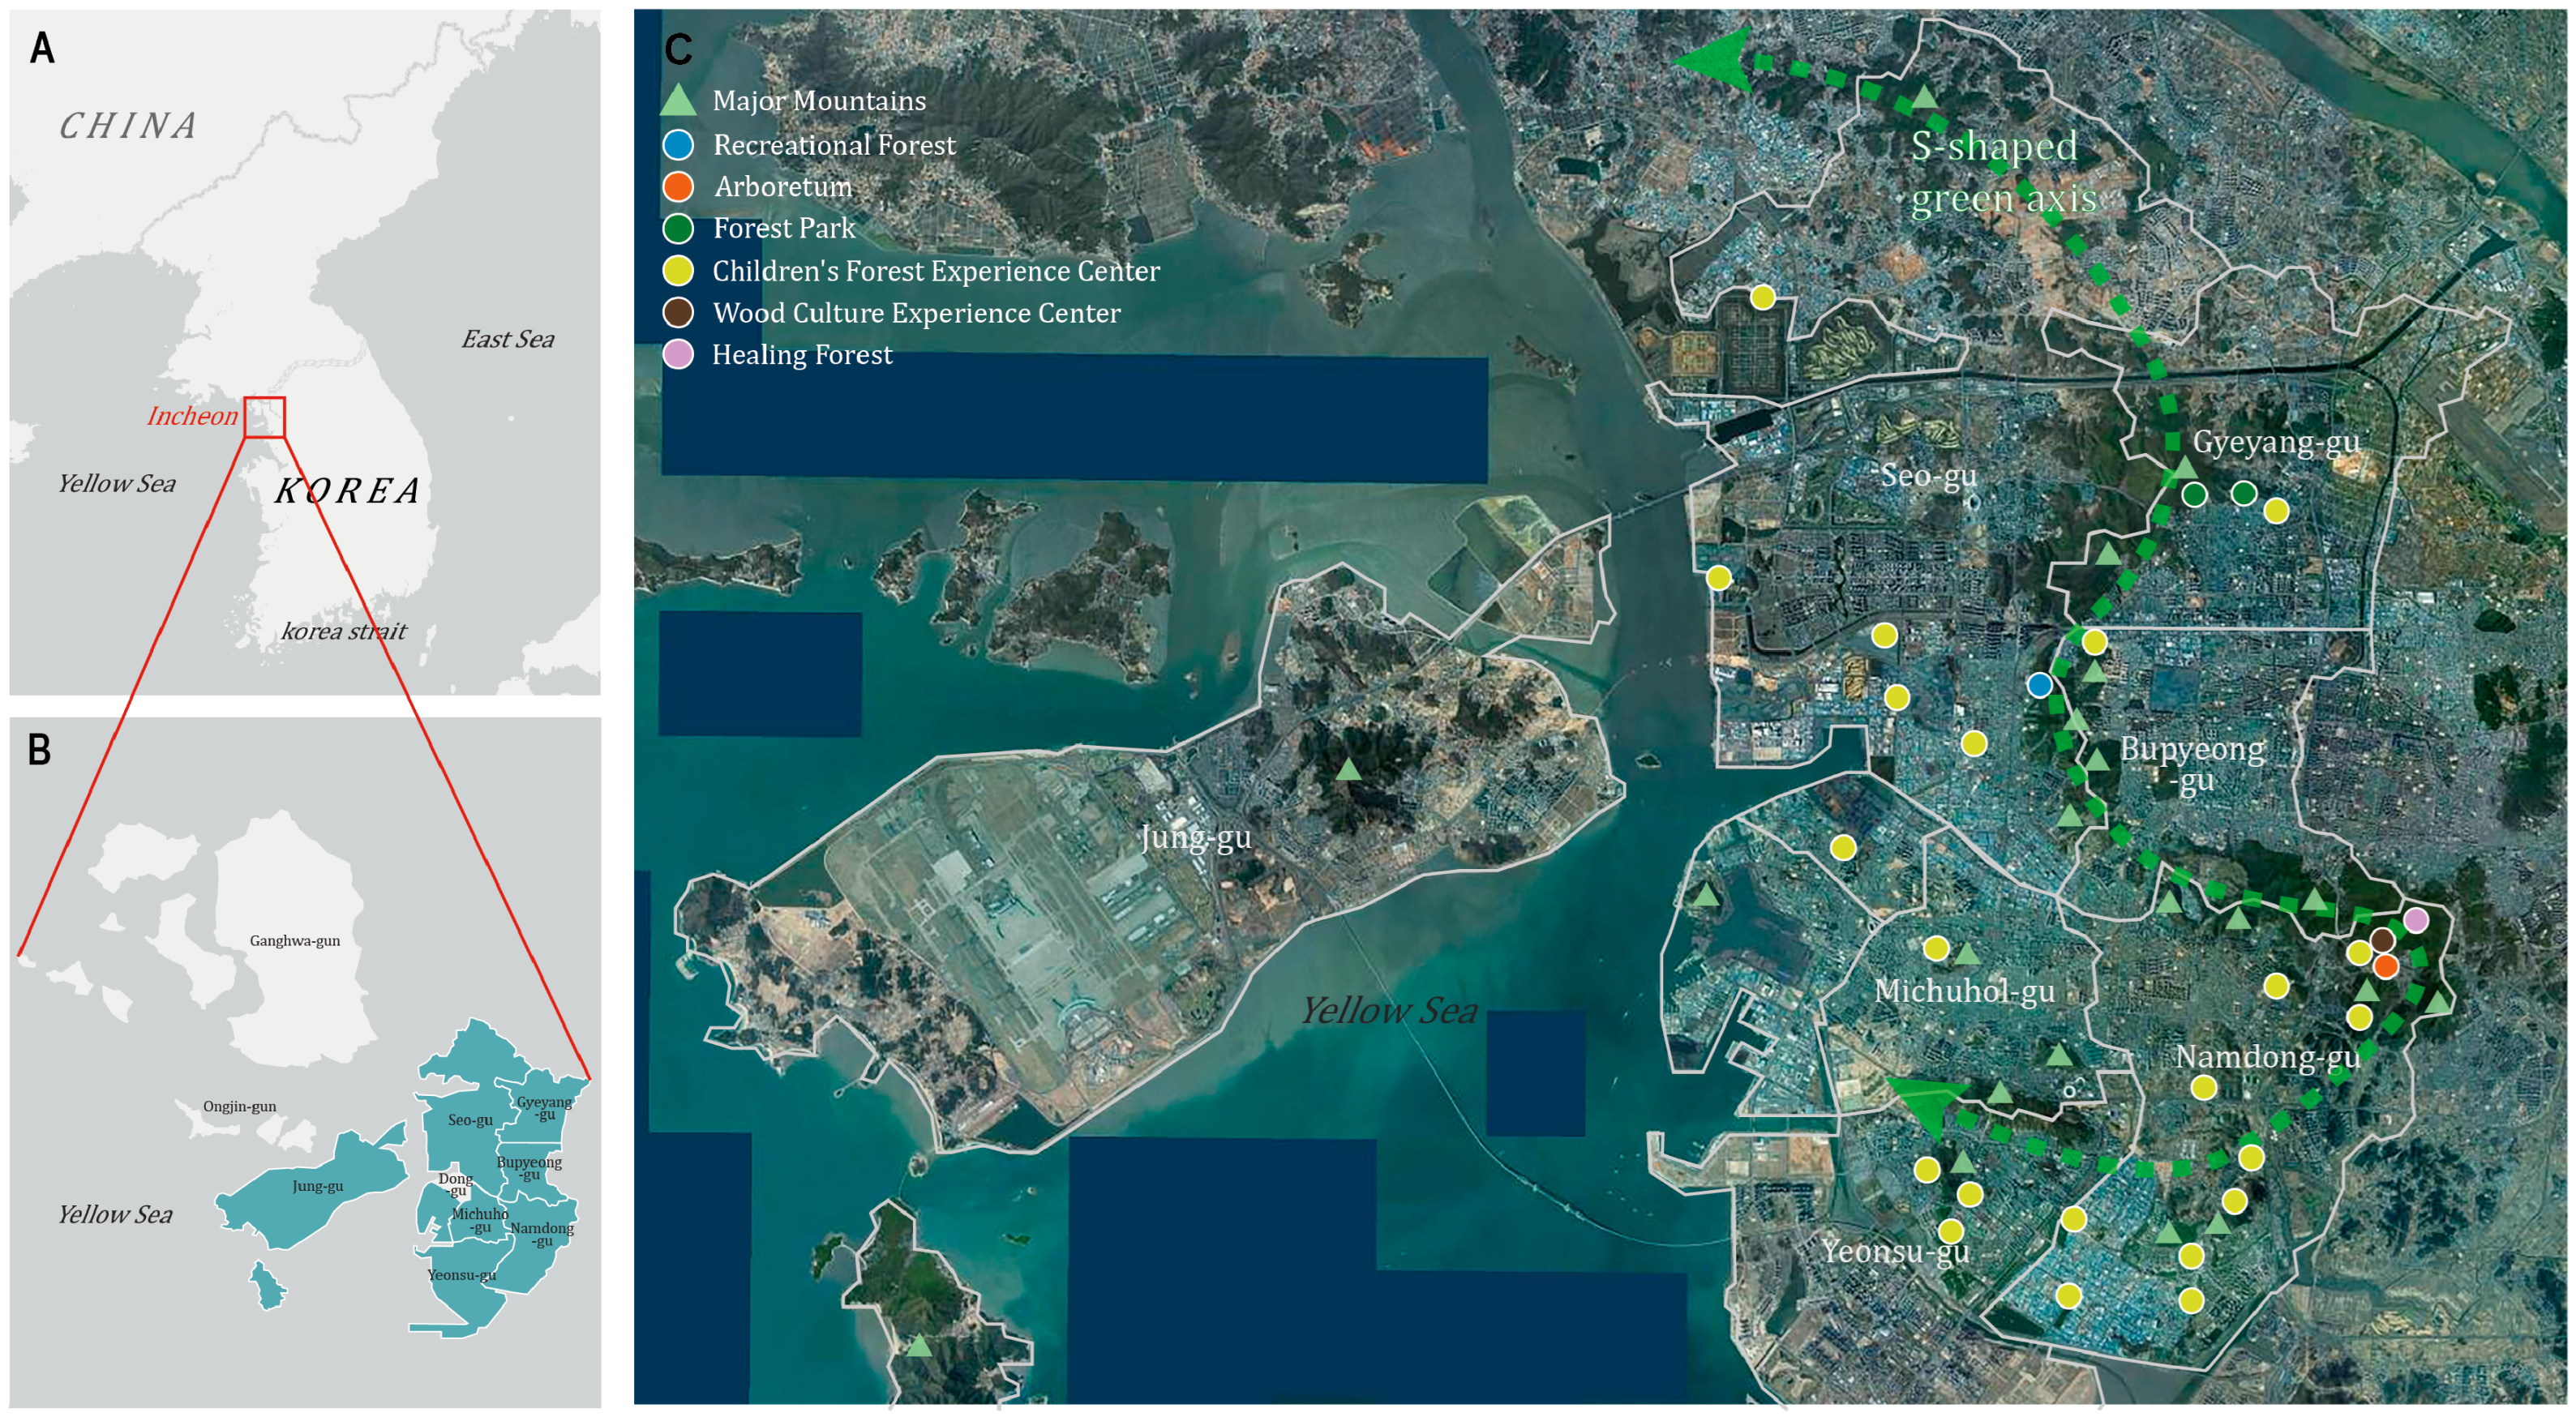
2.1. Study Site

Incheon Metropolitan City, a major port city in South Korea, has a population exceeding three million and serves as a global transportation hub. The distribution of the city’s urban forests follows an S-shaped green corridor, which serves as a major axis for recreation and ecological connectivity [17] (Figure 1). As of 2020, urban forests cover 36.9% (393,730,000 m2) of the city’s total area, with 84% under private ownership. Since 2015, forest coverage has declined by 10,540,000 m2 due to unregulated development [18]. To address growing recreational demands, the city adopted the Second Urban Forest Development and Management Plan (2019–2028), focusing on forest recreation area creation, greenway expansion, and modernization. The city operates 48 forest recreation facilities, including Gyeyangsan and Wonjeoksan, which host children’s forest experience centers, recreational forests, and healing centers. The 2040 Green Space Master Plan outlines further expansion and sustainable development strategies [19].

2.2. Survey Design and Sampling

2.2.1. Survey Items

This study included key demographic variables—sex, age group, and income level—to examine their associations with forest recreation value perception (FRVP) and visitor segmentation. These variables were selected based on prior research identifying them as influential factors influencing forest recreation behavior and value perception [20,21]. In particular, income level has been shown to significantly influence both the frequency and type of recreation activities.
The survey items on FRVP were designed to address limitations in previous studies, which primarily focused on physical or spatial attributes without considering multidimensional visitor values [14,16]. This study applied six key value dimensions proposed by the Korea Forest Welfare Institute [22]—health management, family time, sports and leisure, daily happiness and relaxation, social relationships, and forest ecosystem conservation—to provide a more comprehensive assessment of visitors’ perceptions.
Forest recreation behavior and activity types were included to capture visitor patterns that inform service development [23]. The survey covered visit frequency, companion type, and visit timing. Activity types were categorized into nine groups based on prior studies and national data [21], enabling analysis of visitor preferences and usage patterns.
This study examined visitor demand through items assessing agreement on additional budget allocation, perceived impact on local environmental improvement, and willingness to use new or enhanced forest recreation facilities. These items were intended to evaluate social acceptance, perceived benefits, and usage intentions, supporting the development of tailored policies and programs [24,25,26].
Satisfaction with forest attributes was measured across biological factors (e.g., species diversity, tree density) and anthropogenic factors (e.g., facility quality, accessibility, management conditions), which are known to influence visitor experiences [16,27,28]. The survey categorized these attributes into three dimensions: tree and vegetation conditions, facility utilization, and management conditions. The detailed composition of the survey items and their measurement scales is summarized in Table 1.

2.2.2. Sampling

The survey was conducted from 13 to 22 November 2023, targeting adult residents (aged 19 and older) from seven major districts (Jung-gu, Seo-gu, Michuhol-gu, Yeonsu-gu, Namdong-gu, Bupyeong-gu, and Gyeyang-gu) in Incheon Metropolitan City. Participants were recruited through a professional survey agency and participated voluntarily based on informed consent. Stratified non-proportional quota sampling was applied to balance sex, age (under 30, 40s–50s, over 60), and district representation. A total of 100 respondents were surveyed in each district to secure sufficient cases for robust city-level analysis rather than district-level representation. The overall sample design aimed to achieve a 95% confidence level with a 3–4% margin of error at the city level, providing a reliable basis for urban forest policy recommendations.
Dong-gu, Ganghwa-gun, and Ongjin-gun were excluded due to their small population size (less than 5% of the city’s total) and high proportion of older residents, which posed challenges for quota balancing. The sample’s demographic composition was compared with official population statistics (as of September 2023), confirming similar distributions in terms of sex and age (Table 2). While web-based surveys may introduce biases related to education or digital access, stratified quota sampling by sex, age, and district helped mitigate such concerns while enabling efficient data collection [29].

2.3. Statistical Analysis

The survey data were analyzed using R 3.6.1 with the polytomous variable LCA (poLCA) package and BM® SPSS® Statistics Version 29.0 (IBM Corp., Armonk, NY, USA). Figure 2 outlines the analytical process and statistical methods employed to explore the visitor types and their characteristics.

2.3.1. Classification of Visitor Types Based on FRVPs Using LCA

To identify distinct visitor types based on their FRVP, LCA was employed. LCA is a person-centered method that classifies individuals—rather than variables—into mutually exclusive latent groups based on similar response patterns across observed indicators. In this study, six FRVP-related items were used to uncover unobserved subgroups within the urban forest visitor population. This method assumes conditional independence among the observed variables and determines the optimal number of latent classes through model fit statistics, entropy, and the interpretability of resulting classes.
To evaluate the model fit, information criteria (ICs), including the Akaike Information Criterion (AIC), Bayesian Information Criterion (BIC), and sample-size-adjusted BIC (SABIC), were employed. Lower values on these indices indicate a better-fitting model [30]. Among them, the BIC is generally regarded as the most stable indicator [30], but the optimal number of classes should be determined through a comprehensive consideration of the AIC, SABIC, entropy, and model interpretability.
The entropy index represents the model’s classification accuracy, with values closer to 1 indicating higher classification clarity and precision [31]. However, in empirical studies, entropy values exceeding 0.80 are rare, and prior research has often relied on relative improvements in entropy to determine the best-fitting model [30].
To statistically assess whether adding one more class improves the model fit, comparisons were made between models with k latent classes and those with k–1, where k denotes the number of latent classes being estimated. For this purpose, the Lo–Mendell–Rubin likelihood ratio test (LMR-LRT) and bootstrap likelihood ratio test (BLRT) were employed. When the p-value of LMR-LRT or BLRT is below 0.05, the model with the additional class (k) is considered to have a significantly better fit [32]. However, a BLRT p-value above 0.05 does not automatically disqualify a model, as interpretability, parsimony, and the balance of class sizes must also be considered when selecting the optimal number of latent classes [30].
Beyond statistical criteria, selecting the optimal model should also account for model simplicity, interpretability, and the proportional distribution of latent classes [33]. If a subgroup constitutes less than 5% of the total sample, its interpretability may be significantly limited [34]. In this study, models with class proportions below 5% were not considered for final selection, so as to ensure meaningful interpretation.
The interpretation of latent classes was primarily guided by differences in the response patterns across the six FRVP items. For each latent class, mean scores were calculated to identify distinct value orientation profiles. Although the analysis was based on categorical data, mean comparisons across Likert-scale items were used for interpretive clarity, as is common in LCA applications involving ordinal indicators. In addition, sociodemographic characteristics and forest usage behaviors were examined post hoc to further refine the interpretation and assign meaningful labels to each class.

2.3.2. Forest Satisfaction by Visitor Types and Age

To examine how satisfaction with forest attributes varies depending on both visitor types and age group, a two-way analysis of variance (ANOVA) was conducted. This method allows for the simultaneous assessment of the main effects and interaction effects of two independent variables (visitor type and age group) on satisfaction levels [35]. The dependent variables were satisfaction with tree and vegetation conditions, facility utilization, and management conditions.

2.3.3. Activity-Preferences Mapping by Visitor Types

To explore the associations between visitor types, prior activity participation, and future activity preferences, a correspondence analysis (CA) was employed. This multivariate technique enables the visualization of categorical variable relationships in a two-dimensional space [36]. This study used CA to explore associations between visitor types, past activity participation, and future activity preferences. Dimensionality reduction was performed to extract key explanatory axes; the first and second dimensions explained over 70% of the variance, ensuring reliable variable relationships [36]. The positions of the variables were interpreted using X-axis (Dimension 1) and Y-axis (Dimension 2) coordinates.

2.3.4. Facility Demand and Environmental Improvement Impact by Visitor Types

A one-way ANOVA was conducted to analyze differences in forest recreation facility demand and perceived environmental improvement impact across visitor types. The independent variable was visitor type, while the dependent variables were agreement with additional budget allocation, perceived impact on local environmental improvement, and willingness for direct utilization. One-way ANOVA compares mean differences across groups under the assumptions of normality and homogeneity of variance [37,38]. Levene’s test confirmed homogeneity for “budget allocation” (p = 0.079), allowing for standard ANOVA with Scheffe’s post hoc test. However, for “perceived impact on local environmental improvement” and “willingness for direct utilization,” the homogeneity assumption was not met (p < 0.05). Consequently, Welch’s ANOVA (a heteroscedasticity-robust test) was applied, followed by Games–Howell post hoc comparisons [39].

3. Results

The survey respondents’ demographics were well distributed across sex, age, district, and income. The sex composition was nearly equal (51.6% male, 48.4% female). The age distribution was balanced, with 33.0% aged 30 or younger, 34.4% in their 40s–50s, and 32.6% aged 60 or older. The sample included respondents from seven districts in Incheon, each contributing about 14.3% (n = 100). This stratified approach enabled comparisons of FRVPs. Income varied widely: 8.6% earned below USD 1553, 32.1% between USD 1553 and USD 3106, 28.4% between USD 3106 and USD 4658, and 30.9% above USD 4658, supporting analysis of forest recreation demand across socioeconomic groups.

3.1. Classification of Visitor Types Based on FRVPs

3.1.1. Results of the FRVP Survey

The survey results on FRVP (Table 3) indicate that over 70% of respondents agreed across all items. Thus, forest recreation is perceived as a vital resource that contributes to physical and mental well-being and promotes social interactions and ecological awareness.

3.1.2. Determination of the Optimal Number of Latent Classes

To classify visitor types based on FRVPs, LCA was conducted, and model fit indices were compared to determine the optimal number of classes. As shown in Table 4, the four-class model demonstrated the best balance in terms of statistical fit, classification clarity, and interpretability.
The two- and three-class models showed partial statistical adequacy but had limitations such as low classification accuracy (entropy) or imbalanced class proportions. In contrast, the four-class solution presented stable decreases in AIC and BIC, a significant LMR-LRT result, and relatively even distribution across classes.
Although the AIC continued to decrease in the five- and six-class models, the BIC and SABIC began to increase, and some classes had proportions smaller than 5%, posing challenges for meaningful interpretation [34]. Considering statistical indices, classification precision, significance tests, and interpretability of class sizes, the four-class model was selected as the optimal structure for subsequent analyses.

3.1.3. Characteristics of Latent Classes

The specific differences in perceived forest recreation values across the four types are evident in the mean scores for six FRVPs as presented in Table 5, which clearly illustrates the variation in recreational motivations among user groups. Class 1 (multipurpose recreationists, 21.8%) demonstrated the highest mean scores (4.9–5.0) across all perception items, particularly valuing physical activities and sports, indicating a highly active recreation orientation. Class 2 (balanced relaxation seekers, 21.3%) also showed high perception scores, with particularly strong emphasis on “happiness and relaxation in daily life,” “exercise and vitality,” and “understanding of ecosystems.” Class 3 (casual forest users, 37.4%) exhibited moderate perceptions (means between 3.7 and 4.1), reflecting a light and routine approach to forest recreation. Class 4 (passive forest visitors, 19.5%) had the lowest perception scores (all means below 3.2), suggesting low engagement and awareness of the benefits of forest recreation. These differentiated patterns highlight that forest recreation is not perceived uniformly, underscoring the importance of designing policy and management strategies that reflect the diversity of visitor values and motivations.
The four latent classes exhibited distinct sociodemographic characteristics and forest utilization patterns, as shown in Table 6. Multipurpose recreationists were predominantly female and older adults with higher incomes, and they reported more frequent forest visits. Balanced relaxation seekers also included a high proportion of older individuals but demonstrated more balanced distributions in terms of sex and income. Casual forest users were mostly younger males who visited forests occasionally. Passive forest visitors were often younger, lower-income males who visited infrequently and cited cost as a primary consideration.
To statistically examine these differences, a chi-squared test was conducted. The results revealed significant associations between visitor type and sex, age group, and forest visit considerations such as natural landscape aesthetics. However, differences in income level and visit frequency did not reach statistical significance. These findings indicate that while sociodemographic and perceptual distinctions are evident among the four types, not all behavioral patterns vary significantly. Nevertheless, the typology provides a useful framework for developing targeted strategies that reflect user-specific characteristics and priorities.

3.2. Differences in Satisfaction with Forest Attributes by Visitor Type and Age Group

A two-way ANOVA was conducted to assess satisfaction levels across three forest attributes by visitor type and age group. As shown in Table 7, all three attributes showed significant main effects by visitor type (p < 0.001), but no significant main effects were observed for age group. However, the interaction effects between visitor type and age group were significant for all attributes (tree and vegetation conditions: F = 4.93, facility utilization: F = 4.11, management conditions: F = 2.44).
Satisfaction was generally highest among multipurpose recreationists, particularly those aged 60 and above. Conversely, passive forest visitors reported the lowest satisfaction across all attributes. Notably, for facility utilization, older adults in the passive group rated satisfaction slightly higher than those in the casual group, highlighting the importance of facility accessibility for older adults.
These findings underscore that forest satisfaction is more strongly influenced by visitor type than by age group, although specific age–type combinations reveal meaningful nuances. A targeted approach to forest management should account for both perceptual and demographic diversity.

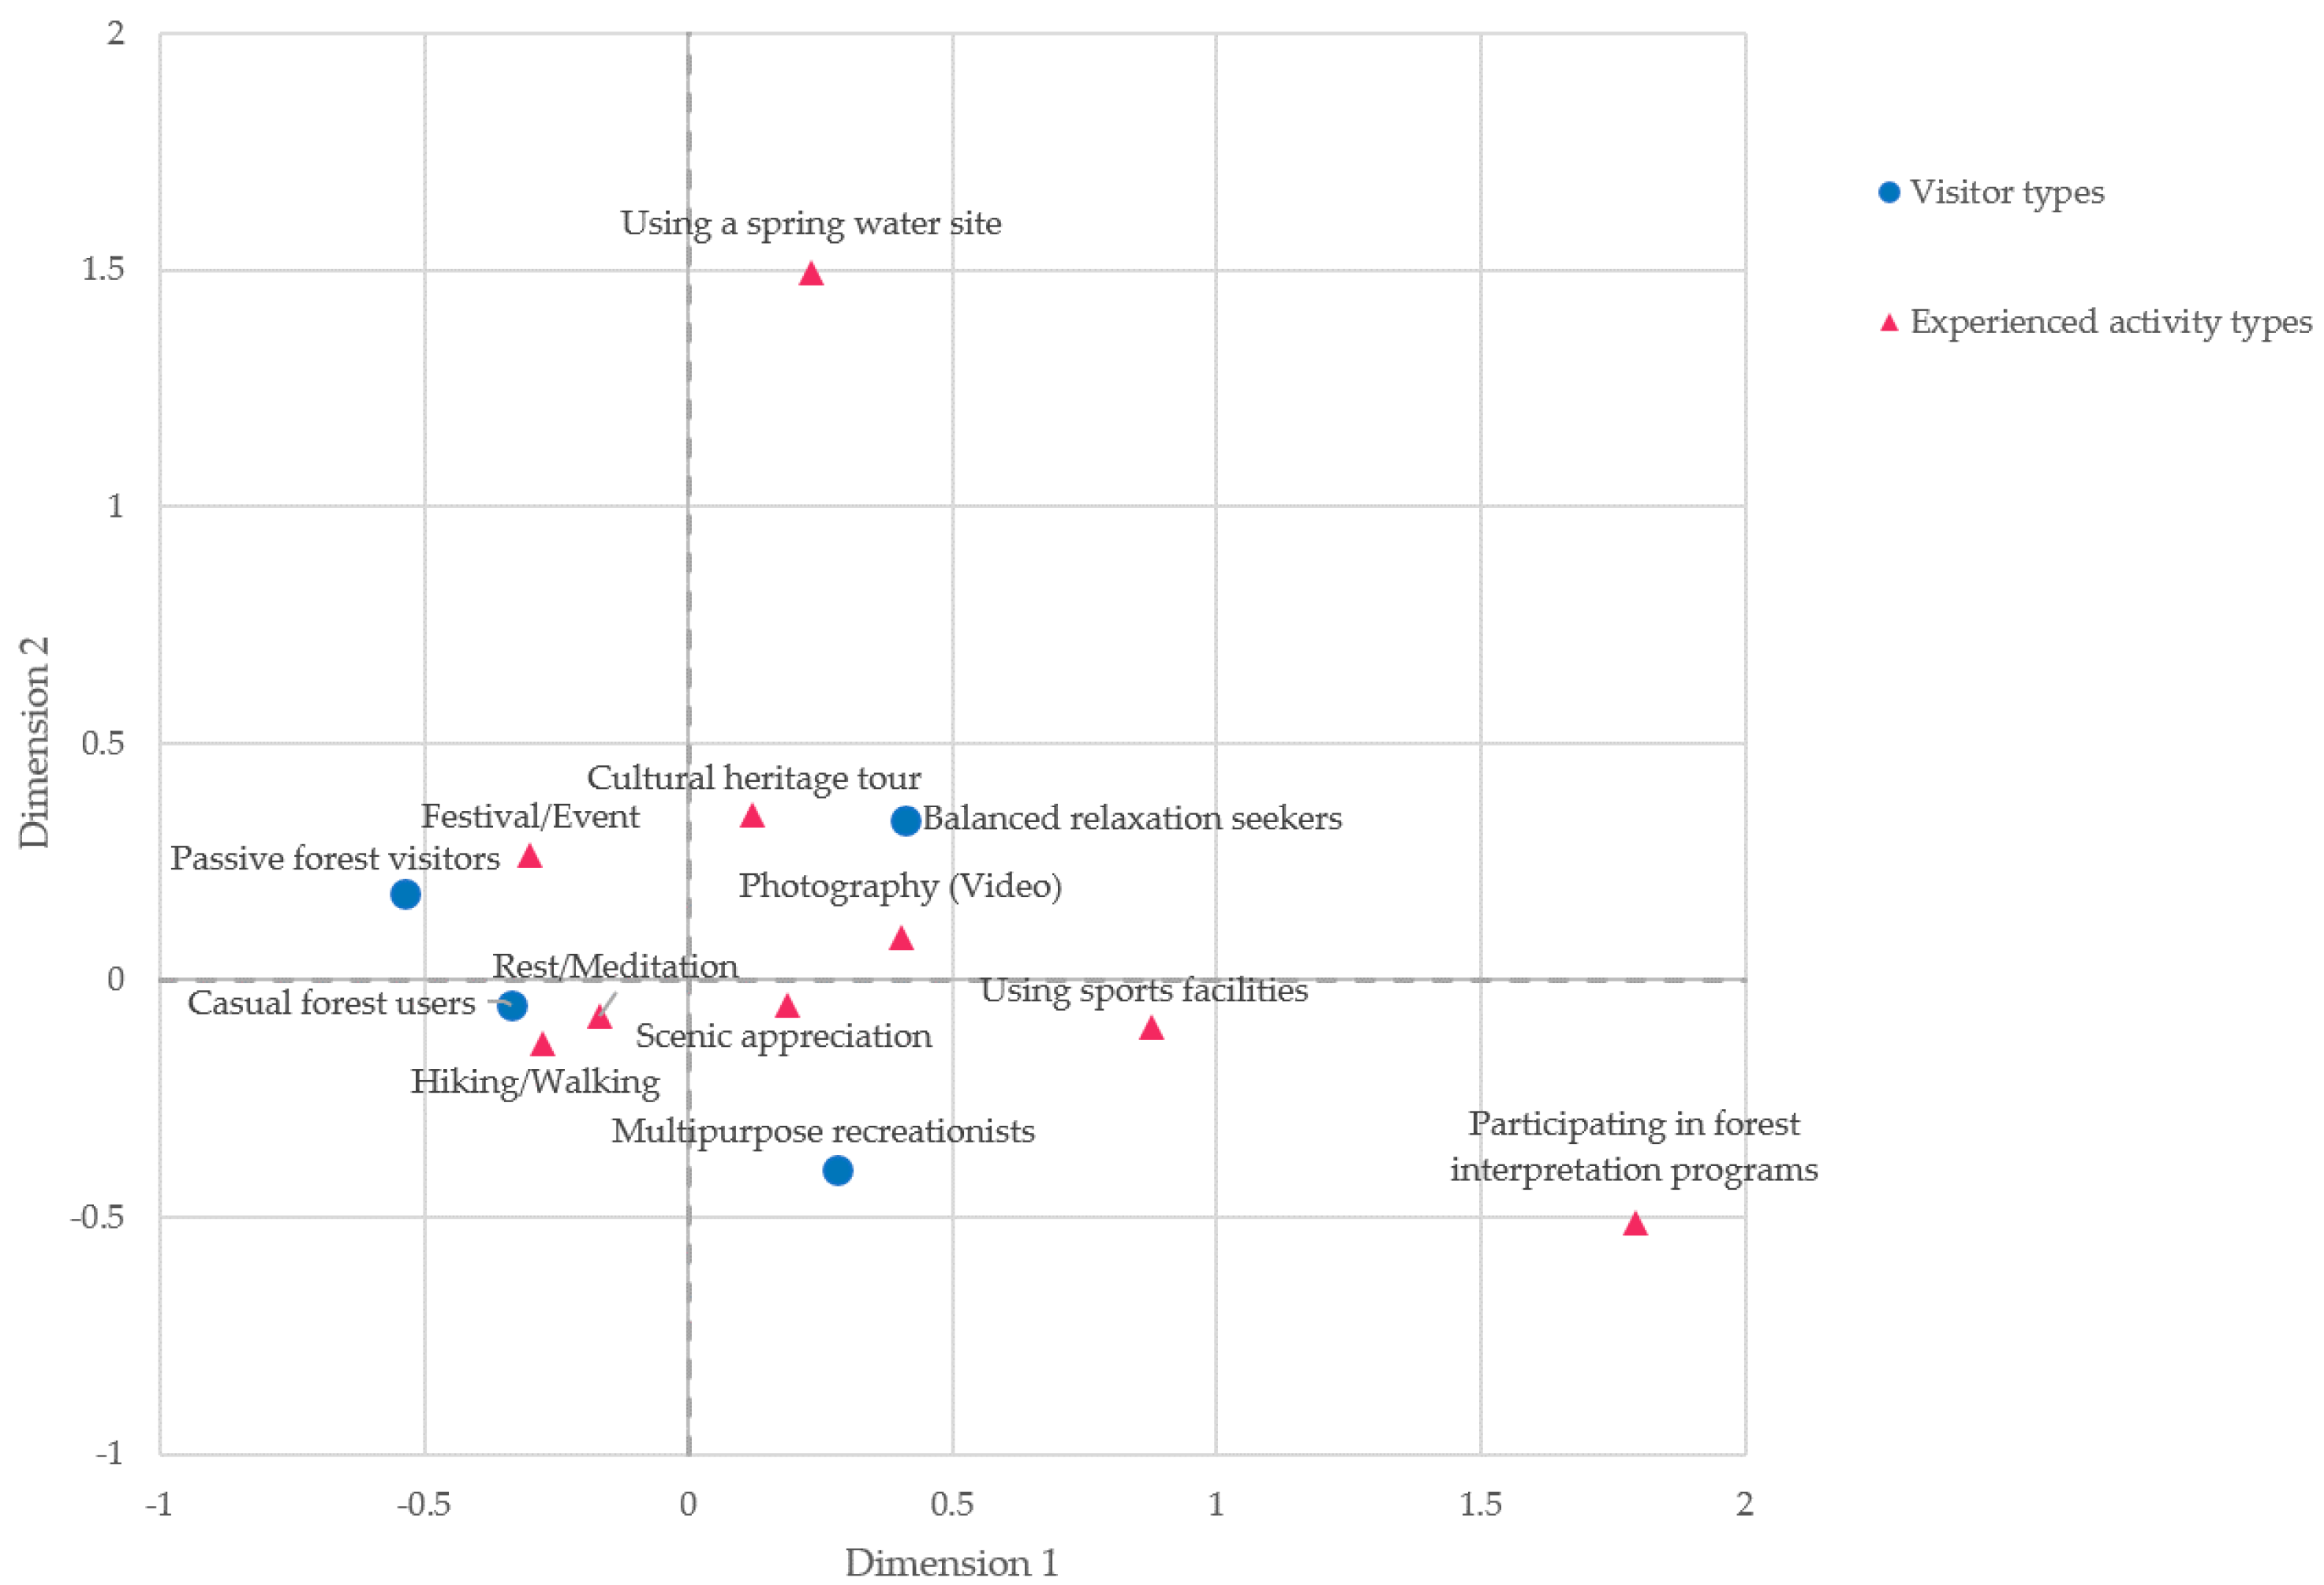
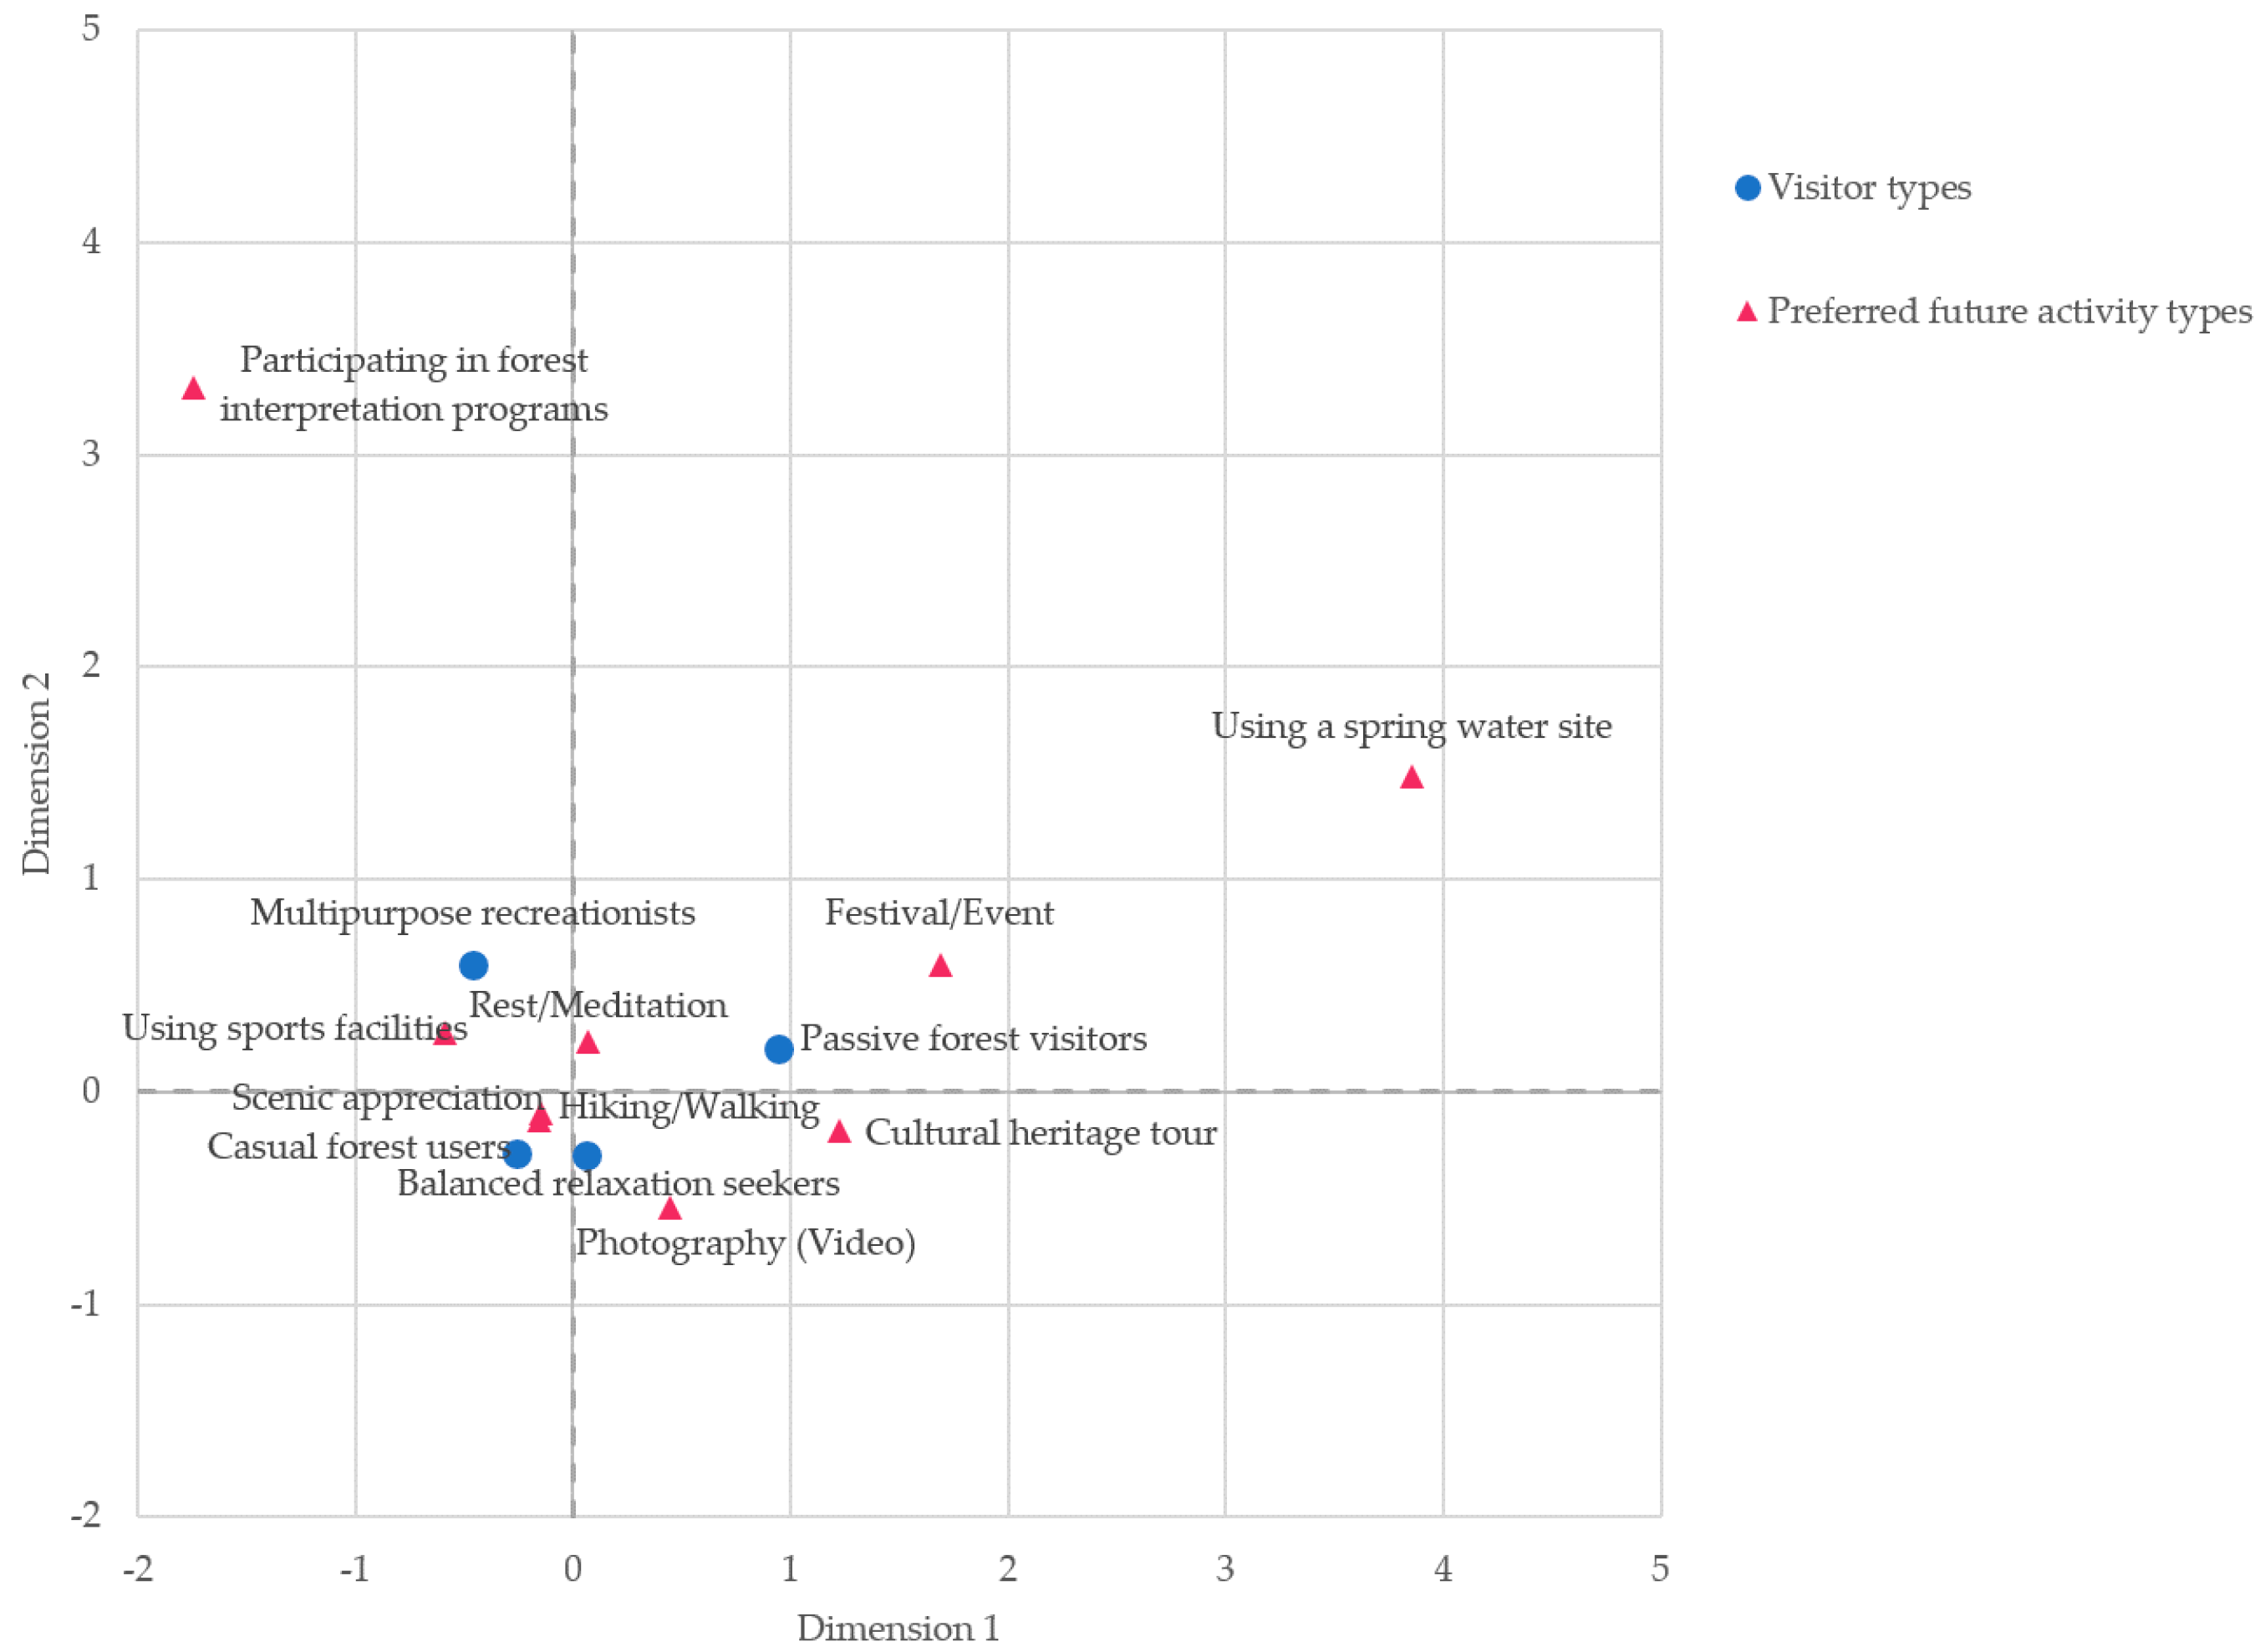
3.3. Analysis of the Relationships Among Visitor Types, Activity Participation, and Future Activity Preferences

To explore the relationship between visitor types and forest-based activities, CA was conducted using data on both past-year activity experiences and future activity preferences. The perceptual maps illustrate the associations among visitor types and activity patterns, offering insights into user behavior and strategic implications for forest recreation service design.
Figure 3 demonstrates the relationship between visitor types and forest-based activities experienced over the past year. Dimension 1 accounted for 66.8% of the variance, and Dimension 2 accounted for 19.7%, with a cumulative explanatory power of 86.5%. Multipurpose recreationists were strongly associated with scenic appreciation and sports facility use, indicating a preference for vitality-oriented and physical activities. Balanced relaxation seekers were linked to cultural heritage visits and photography, suggesting a balanced preference for cultural and emotional engagement. Casual forest users primarily engaged in hiking/walking and relaxation, reflecting a routine and accessible interaction with forest spaces. Passive forest visitors showed the strongest association with festival and event participation, indicating an episodic and event-driven pattern of forest visits, rather than frequent or habitual use.
The analysis of future preferred activities, as shown in Figure 4, revealed a similar trend. Dimension 1 explained 72.2% and Dimension 2 explained 22.6% of the variance, yielding a cumulative explanatory power of 94.8%. Most visitor types expressed a continued preference for the activities that they had previously experienced. Multipurpose recreationists were again associated with physically engaging activities such as sports facilities, while balanced relaxation seekers maintained their preference for photography. Casual forest users favored hiking, meditation, and scenic appreciation, reinforcing their identity as leisure-oriented users. Passive forest visitors preferred cultural heritage tours and festivals/events, highlighting their inclination toward non-routine, socially motivated activities.
The combined findings from past behavior and future activity preferences suggest strong consistency in forest-based activity patterns across all visitor types. Most users tend to continue engaging in activities that they have previously experienced and found satisfying. This consistency highlights the importance of designing recreation services that reinforce positive past experiences. Rather than adopting a one-size-fits-all approach, forest management strategies should be tailored to each visitor type’s behavioral profile. Such user-centered planning—grounded in both retrospective usage and anticipated demand—can foster sustainable engagement and improve satisfaction with forest-based recreation services.

3.4. Facility Demand and Environmental Improvement Impact by Visitor Type

Visitor types exhibited significant differences in facility-related demands and perceptions of environmental impact (Table 8). Multipurpose recreationists consistently demonstrated the highest levels of agreement regarding additional budget allocation, perceived environmental improvements, and willingness to use enhanced facilities. Balanced relaxation seekers followed closely across all three measures. Casual forest users showed moderate support, while passive forest visitors displayed the lowest agreement levels. Post hoc comparisons revealed clear hierarchical patterns, with passive forest visitors significantly differing from the more engaged user types. Notably, the gap between the most and least engaged groups was over 1.3 points across all dependent variables.
These findings suggest that FRVP is strongly associated with proactive support for facility improvement, belief in local environmental benefits, and direct utilization intention. Policies aiming to strengthen forest engagement may benefit from aligning facility planning with the needs and perceptions of more passive user groups.

4. Discussion

4.1. Forest Recreation Visitor Typologies and Their Interpretative Characteristics

This study identified and interpreted heterogeneous visitor typologies based on FRVP. The four latent classes—multipurpose recreationists, balanced relaxation seekers, casual forest users, and passive forest visitors—highlight the heterogeneity among forest users, who differ in their motivations, expectations, and behavioral tendencies. These findings are consistent with those of earlier studies that emphasize diversity in forest user behavior and perceptions [5,15].
Multipurpose recreationists exhibit a high level of FRVP. This group primarily comprises older adults and females with relatively high income levels. They prioritize physical activity, scenic beauty, and accessibility, and they visit forests regularly. Their strong association with the use of sports facilities and landscape appreciation aligns with prior research, which indicates that older adults often use nearby parks to maintain their physical health and vitality [40].
Balanced relaxation seekers represent individuals who emphasize psychological well-being, rest, and cultural enrichment. This group includes a high proportion of lower-income older adults who value tranquil spaces and cultural experiences. Their preferences for cultural heritage visits and photography/video activities reflect previous studies suggesting that older individuals often prefer passive or contemplative forest activities [41]. Although they share a similar age profile with multipurpose recreationists, their value orientation is more introspective and socially inclined.
Casual forest users exhibit moderate levels of forest recreation engagement, primarily treating visits as light, everyday leisure. This group includes a higher proportion of males and is relatively evenly distributed across age groups. Their preferences center on hiking, walking, and resting, but they show lower visitation frequency and modest satisfaction with forest facilities. These characteristics suggest that while they recognize the value of nature, they may lack a strong emotional or symbolic attachment to forest spaces.
Passive forest visitors display the lowest levels of FRVP. Typically composed of younger, low-income males, this group demonstrates limited engagement with forest environments. Their preferences lean toward event-based experiences such as festivals, indicating that their forest use is often largely driven by extrinsic rather than intrinsic motivations. This finding is consistent with studies highlighting younger generations’ lower environmental affinity and greater sensitivity to cost and accessibility barriers [14,42,43].
Across these four typologies, variations in sociodemographic attributes—particularly age, sex, and income—meaningfully intersect with recreational perceptions and behaviors. For example, older adults within the multipurpose recreationists group show the highest levels of satisfaction with tree and vegetation conditions, whereas younger passive forest visitors express the lowest satisfaction and the weakest intentions to use the facilities. These patterns suggest that forest recreation preferences are not only shaped by individual motivations but also embedded within broader social and economic contexts [44].
While casual forest users and passive forest visitors exhibit similarly low frequencies of forest visits and moderate satisfaction levels, their underlying motivations and spatial usage patterns differ. Casual forest users tend to engage in low-intensity, routine-based visits, often integrating nearby green spaces into their daily lives. This group demonstrates a moderate level of intentionality, using forests as spaces for stress relief and mild physical activity [45]. In contrast, passive forest visitors exhibit limited engagement and primarily access forest spaces incidentally—often during family outings or public events—with minimal intrinsic motivation or planned recreational intent [43]. These differences suggest that while both groups may appear similar in quantitative metrics, their qualitative profiles indicate distinct pathways to urban forest engagement and should be addressed with differentiated outreach strategies.
In summary, this typological framework underscores the need for a value-based, differentiated approach to forest recreation planning and policy. By recognizing the interpretative characteristics of each visitor type, urban forest governance can more effectively support diverse user expectations, promote equity in access and participation, and ensure sustainable forest welfare services.

4.2. Perceptual and Behavioral Differences Among Visitor Types

This section presents an integrated analysis of behavioral differences across visitor types, focusing on three dimensions: satisfaction with forest attributes, the linkage between past experiences and future activity preferences, and demand for urban forest improvement. While previous studies have typically addressed these factors independently, the novelty of this study lies in the comparative analysis, connecting perceptual types with behavioral outcomes—such as age–group interaction, activity continuity, and policy demand—thus offering insights for targeted and responsive forest management.
First, regarding satisfaction with forest attributes, individuals with higher FRVP generally reported higher satisfaction with vegetation, facilities, and management quality across age groups. Notably, the multipurpose recreationists exhibited the highest levels of satisfaction across all indicators, and older adults (aged 60 and above) consistently showed higher satisfaction regardless of type. These findings align with those of prior studies by Deng et al. [14] and Jang et al. [46], which demonstrated a positive relationship between forest perceptions and satisfaction. However, among those aged 60 and over, individuals classified as casual forest users reported lower satisfaction with facilities compared to passive forest visitors, possibly due to limited awareness of available amenities. This result supports those of Park [47], who found that older adults tend to have lower awareness of forest recreation programs and amenities, which, in turn, may lower perceived quality. These insights suggest the need to enhance informational outreach and program design tailored to older adults.
Second, the continuity between past and future forest-based activities showed consistent patterns across types. Multipurpose recreationists were strongly associated with scenic appreciation and sports facility use; balanced relaxation seekers with cultural heritage visits and photography; casual forest users with relaxation and walking; and passive forest visitors with event and festival participation. These results indicate that individuals tend to prefer activities that they have previously experienced, reaffirming the behavioral continuity reported in earlier studies [48,49,50]. Additionally, activity-based segmentation reveals nuanced user motivations: for example, multipurpose recreationists often link forest visits with physical vitality, while passive visitors are more event-driven.
Third, the demand for facility enhancement and expectations for environmental improvement differed clearly across groups. Multipurpose recreationists and balanced relaxation seekers strongly supported additional budget allocations and expressed high willingness to use upgraded amenities. In contrast, passive forest visitors recorded the lowest agreement levels across all dimensions. This reflects the pattern observed by Japelj et al. [10], where more active forest users perceived a greater need for facility investment and environmental improvement. However, passive forest visitors showed lower recognition of public value and long-term impact, suggesting that their motivations may center on short-term, event-based engagements.
In summary, visitor types based on FRVP are not only attitudinally distinct but also demonstrate differentiated behaviors in terms of satisfaction, activity continuity, and policy preferences. These findings underscore the importance of user-segmented urban forest strategies that address the complex interplay among sociodemographic characteristics, perceptual orientation, and behavioral patterns. Policy designs that reflect these multifaceted differences—particularly across age, experience, and social background—are essential for advancing inclusive and adaptive urban forest governance.

4.3. Implications for Urban Forest Management and Well-Being Promotion

This study empirically demonstrated that urban forest visitors show clearly differentiated satisfaction, behavioral patterns, and policy demands depending on their visitor type. These findings underscore the need for perception-based planning in urban green infrastructure governance, moving beyond uniform service provision toward tailored, user-centered strategies. In particular, there is a growing need to redefine urban forests as part of the urban welfare infrastructure in response to pressing social issues such as population aging, social isolation, and mental health decline.
In the short term, differentiated strategies for each visitor type are needed. First, the multipurpose recreationists group requires the expansion of active recreational spaces and experience-based programs centered on sports and physical activities. Second, the balanced relaxation seekers would benefit from programs focused on meditation, healing, and emotional well-being, such as nature–culture interpretation trails and cultural experience activities. Third, for the casual forest users, it is essential to improve walkable and neighborhood-based accessibility and provide low-intensity green infrastructure that integrates seamlessly with daily routines. Lastly, for the passive forest visitors, strategies should focus on raising awareness and fostering entry-level engagement through SNS-based promotion, festival- and event-driven programming, and targeted services for first-time visitors.
In the long run, urban forests should be positioned as multifunctional infrastructure where environmental, health, and cultural agendas converge. First, a “forest welfare governance” system should be established in response to population aging, integrating with national health insurance, care services, and mental health programs [51]. Second, in urban environments, where social disconnection and mental health issues are prevalent, urban forests can serve as resilient public spaces that promote social connectedness and psychological recovery [52]. Third, by linking forests with regional cultural assets, urban forests can function as arenas for reinforcing local identity and community bonding. This necessitates the development of community-led programs, place-based planning, and partnership-based governance structures.
Although this study was conducted in Incheon, a large Korean metropolitan city, the findings may be generalizable to other East Asian and Western urban contexts where urbanization and aging are salient concerns. Several countries have institutionalized models that align green infrastructure with health and social policies. For instance, Japan’s Shinrin-yoku (forest bathing) is nationally recognized as a preventive health strategy, promoting forest immersion programs under medical supervision [53]. In the UK, community woodlands are actively managed through partnerships between local governments and citizen groups, reinforcing social cohesion and inclusivity through place-based forest programs [54]. In Finland, the forest wellness model integrates urban forest visits into preventive healthcare, with field experiments demonstrating measurable reductions in stress indicators following exposure to green environments [55]. These examples illustrate diverse policy models that integrate ecological, psychological, and welfare goals through urban forest planning. Such cross-cultural comparisons underscore the need to contextualize urban forest governance within each country’s demographic and institutional landscape.

4.4. Study Limitations and Future Research Directions

This study provides empirical insights into the typologies of urban forest visitors based on their perceived forest recreation values and revealed perceptual and behavioral differences across types. While it offers meaningful implications, some limitations should be acknowledged to guide future research. First, this study focused on visitors in Incheon, a major metropolitan city in South Korea. Given Incheon’s distinct urban infrastructure, cultural environment, and forest accessibility, the generalizability of the findings to other regional or international contexts may be limited. Comparative studies involving small or medium-sized cities or rural communities are necessary to improve external validity.
Second, the latent class model used in this study was primarily based on perceived forest recreation values. Although effective, this approach does not fully reflect deeper socio-cultural dimensions that may significantly influence recreational behaviors and preferences. Factors such as cultural norms, collective memory, and neighborhood-level identity were not incorporated into the model, which may limit the cultural interpretability of the results. Future research should explicitly integrate such socio-cultural and psychological variables into typology models to improve the explanatory power and context-sensitivity. In designing this study, we deliberately focused on perceived recreational value as the primary segmentation criterion. This decision was made to directly inform user-centered urban forest planning, which increasingly relies on subjective experiences and preferences rather than static demographic profiles. Broader socio-cultural or temporal variables were excluded to ensure conceptual clarity and analytical tractability within the latent class modeling framework. Nonetheless, we recognize that incorporating these dimensions in future research will further enrich typology development and strengthen external validity.
Third, the cross-sectional nature of the data limits the ability to assess behavioral transitions or temporal changes in preferences. As user perceptions of forest recreation value may shift over time due to societal change, life events, or evolving urban environments, it is important to incorporate a temporal dimension to better understand these dynamic patterns. Longitudinal or panel-based research designs are needed to capture such transitions and investigate whether individuals move between visitor types as their values and life contexts evolve.
Future studies should also explore behavioral transition mechanisms across life stages and assess how urban forest needs change in response to aging, urban development, and environmental awareness. Multinational comparative research using Q-methodology or structural equation modeling may also help to validate the typologies in diverse cultural contexts and enhance their global applicability.

5. Conclusions

This study contributes to advancing both academic research and policy development by identifying distinct forest recreation visitor types based on perceived recreation values and analyzing their sociodemographic characteristics, behavioral patterns, satisfaction levels, future preferences, and policy demands. It provides empirical insight to inform the foundational question of “for whom urban forest services should be designed,” emphasizing the importance of perception-based and user-centered planning in green infrastructure management.
The findings offer practical guidelines for developing inclusive forest recreation policies at the municipal level. Specifically, they support differentiated approaches such as designing health-supportive green spaces for older adults, developing interactive and experiential programs to engage younger generations, and expanding neighborhood-level forest services to enhance everyday accessibility and use. Furthermore, the visitor typology proposed in this study holds potential for application in other regions and countries, serving as a replicable framework for culturally and demographically responsive urban forest governance.
Looking ahead, this perception-based typology and its policy implications can inform the development of national forest welfare strategies, urban green infrastructure governance models, and inclusive public service design. Moreover, this study highlights the potential of urban forests to address pressing urban challenges—such as social isolation, aging societies, and mental health issues—positioning these spaces not merely as leisure areas but as multifunctional urban environments that promote resilience, improve quality of life, and support community well-being.

Author Contributions

Conceptualization, Y.E.C. and G.E.C.; Methodology, Y.E.C., J.-Y.L., and G.E.C.; Software, G.E.C.; Validation Y.E.C.; Formal Analysis, Y.E.C., J.-Y.L., and G.E.C.; Investigation, Y.-J.Y., Y.E.C., and G.E.C.; Resources, Y.-J.Y. and Y.E.C.; Data Curation, J.-Y.L. and G.E.C.; Writing—Original Draft Preparation, Y.-J.Y., Y.E.C., J.-Y.L., and G.E.C.; Writing—Review and Editing, Y.-J.Y. and Y.E.C.; Visualization, G.E.C.; Supervision, Y.E.C.; Project Administration, Y.-J.Y.; Funding Acquisition, Y.-J.Y. All authors have read and agreed to the published version of the manuscript.

Funding

This research received no external funding.

Institutional Review Board Statement

This study was conducted in accordance with the Declaration of Helsinki. Although this study did not receive formal IRB approval, ethical review was deemed unnecessary under institutional guidelines, as the research involved a non-interventional online survey of adults and did not collect personally identifiable information. The participants were fully informed about the purpose, voluntary nature, data usage, and anonymity of the study at the beginning of the questionnaire. Data collection and analysis complied with Article 33 of the Statistics Act of the Republic of Korea.

Data Availability Statement

The data presented in this study are available upon request from the corresponding author. The data are not publicly available due to privacy and ethical considerations, as the participants’ responses were collected under assurances of anonymity and restricted use.

Conflicts of Interest

The authors declare no conflicts of interest.

Abbreviations

The following abbreviations are used in this manuscript:
LCALatent class analysis
FRVPForest recreation value perception
poLCAPolytomous variable LCA
ICInformation criteria
AICAkaike Information Criterion
BICBayesian Information Criterion
SABICSample-size-adjusted BIC
LMR-LRTLo–Mendell–Rubin likelihood ratio test
BLRTBootstrap likelihood ratio test
ANOVAAnalysis of variance
CACorrespondence analysis

References

  1. Tyrväinen, L. Economic valuation of urban forest benefits in Finland. J. Environ. Manag. 2001, 62, 75–92. [Google Scholar] [CrossRef]
  2. Choi, Y.E.; Choi, G.E.; Yun, Y.J. An analysis of visitor behaviors and satisfaction in urban forests: Focused on major forests in Incheon. J. People Plants Environ. 2024, 27, 409–425. [Google Scholar] [CrossRef]
  3. Derks, J.; Giessen, L.; Winkel, G. COVID-19-induced visitor boom reveals the importance of forests as critical infrastructure. Forest Policy Econ. 2020, 118, 102253. [Google Scholar] [CrossRef] [PubMed]
  4. Nordh, H.; Alalouch, C.; Hartig, T. Assessing restorative components of small urban parks using conjoint methodology. Urban For. Urban Green. 2011, 10, 95–103. [Google Scholar] [CrossRef]
  5. Zhang, H.; Chen, B.; Sun, Z.; Bao, Z. Landscape perception and recreation needs in urban green space in Fuyang, Hangzhou, China. Urban For. Urban Green. 2013, 12, 44–52. [Google Scholar] [CrossRef]
  6. Seok, Y.; Song, K.; Chon, J.; Choi, Y.E. From Landscape Architecture to Nature-Based Solutions: A Strategic Approach to Fine Dust Mitigation in Urban School Forests. Land 2025, 14, 281. [Google Scholar] [CrossRef]
  7. Shanahan, D.F.; Lin, B.B.; Gaston, K.J.; Bush, R.; Fuller, R.A. What is the role of trees and remnant vegetation in attracting people to urban parks? Landsc. Ecol. 2015, 30, 153–165. [Google Scholar] [CrossRef]
  8. Arnberger, A.; Eder, R. The influence of age on recreational trail preferences of urban green-space visitors: A discrete choice experiment with digitally calibrated images. J. Environ. Plan. Manag. 2011, 54, 891–908. [Google Scholar] [CrossRef]
  9. Lin, B.B.; Fuller, R.A.; Bush, R.; Gaston, K.J.; Shanahan, D.F. Opportunity or orientation? Who uses urban parks and why. PLoS ONE 2014, 9, e87422. [Google Scholar] [CrossRef]
  10. Japelj, A.; Mavsar, R.; Hodges, D.; Kovač, M.; Juvančič, L. Latent preferences of residents regarding an urban forest recreation setting in Ljubljana, Slovenia. Forest Policy Econ. 2016, 71, 71–79. [Google Scholar] [CrossRef]
  11. Sutherland, I.J.; Gergel, S.E.; Bennett, E.M. Seeing the forest for its multiple ecosystem services: Indicators for cultural services in heterogeneous forests. Ecol. Indic. 2016, 71, 123–133. [Google Scholar] [CrossRef]
  12. Kabisch, N.; Strohbach, M.; Haase, D.; Kronenberg, J. Urban green space availability in European cities. Ecol. Indic. 2016, 70, 586–596. [Google Scholar] [CrossRef]
  13. Byun, S.Y.; Heo, S.Y.; Koo, J. Market segmentation to identify forest recreation welfare consumers. J. Korean Soc. Forest Sci. 2023, 112, 248–257. [Google Scholar] [CrossRef]
  14. Deng, J.; Andrada, R.; Pierskalla, C. Visitors’ and residents’ perceptions of urban forests for leisure in Washington DC. Urban For. Urban Green. 2017, 28, 1–11. [Google Scholar] [CrossRef]
  15. Jim, C.Y.; Chen, W.Y. Recreation–amenity use and contingent valuation of urban greenspaces in Guangzhou, China. Landsc. Urban Plan. 2006, 75, 81–96. [Google Scholar] [CrossRef]
  16. Koo, J.C.; Park, M.S.; Youn, Y.C. Preferences of urban dwellers on urban forest recreational services in South Korea. Urban For. Urban Green. 2013, 12, 200–210. [Google Scholar] [CrossRef]
  17. Incheon Metropolitan City. 2025 Incheon Urban Master Plan Amendment Main Report; Incheon Metropolitan City: Incheon, Republic of Korea, 2012; p. 219. [Google Scholar]
  18. Incheon Metropolitan City. Incheon Metropolitan City’s 2nd Urban Forestry Management Plan (2019–2028); Incheon Metropolitan City: Incheon, Republic of Korea, 2023; pp. 204–214. [Google Scholar]
  19. Incheon Metropolitan City. 2040 Incheon Metropolitan City Park and Green Space Master Plan; Incheon Metropolitan City: Incheon, Republic of Korea, 2021. [Google Scholar]
  20. Koo, J.C.; Seok, H.; Byeon, S. Policy Tasks for Improving Demand—Supply Conditions of Forest Recreation Infrastructure; Report of Korea Rural Economic Institute; Korea Rural Economic Institute: Naju, Republic of Korea, 2019. [Google Scholar]
  21. Korea Forest Service. 2022 National Awareness Survey on Hiking and Forest Trail Experiences; Korea Forest Service Report; Korea Forest Service: Daejeon, Republic of Korea, 2022. [Google Scholar]
  22. Korea Forest Welfare Institute. 2022 Forest Recreation and Welfare Activity Survey; Korea Forest Welfare Institute Report; Korea Forest Welfare Institute: Daejeon, Republic of Korea, 2022. [Google Scholar]
  23. Zhao, J.; Abdul Aziz, F.; Song, M.; Zhang, H.; Ujang, N.; Xiao, Y.; Cheng, Z. Evaluating visitor usage and safety perception experiences in national forest parks. Land 2024, 13, 1341. [Google Scholar] [CrossRef]
  24. Bernath, K.; Roschewitz, A. Recreational benefits of urban forests: Explaining visitors’ willingness to pay in the context of the theory of planned behavior. J. Environ. Manag. 2008, 89, 155–166. [Google Scholar] [CrossRef]
  25. Lee, S.H.; Kim, S.; Lee, J. Enhancing forest utilization and quality of life: An integrated approach to promoting forest activities. Forests 2024, 15, 2237. [Google Scholar] [CrossRef]
  26. Tilman, A.R.; Haight, R.G. Public policy for management of forest pests within an ownership mosaic. Ecol. Econ. 2025, 234, 108602. [Google Scholar] [CrossRef]
  27. Sugiyama, T.; Ward Thompson, C.W. Associations between characteristics of neighbourhood open space and older people’s walking. Urban For. Urban Green. 2008, 7, 41–51. [Google Scholar] [CrossRef]
  28. Zhang, W.; Yang, J.; Ma, L.; Huang, C. Factors affecting the use of urban green spaces for physical activities: Views of young urban residents in Beijing. Urban For. Urban Green. 2015, 14, 851–857. [Google Scholar] [CrossRef]
  29. Dillman, D.A.; Smyth, J.D.; Christian, L.M. Internet, phone, Mail, and Mixed-Mode Surveys: The Tailored Design Method; John Wiley & Sons: Hoboken, NJ, USA, 2014; Volume 17, pp. 161–190. [Google Scholar]
  30. Nylund, K.L.; Asparouhov, T.; Muthén, B.O. Deciding on the number of classes in latent class analysis and growth mixture modeling: A Monte Carlo simulation study. Struct. Equ Model. Multidiscip. J. 2007, 14, 535–569. [Google Scholar] [CrossRef]
  31. Crosby, R.D.; Wonderlich, S.A.; Engel, S.G.; Simonich, H.; Smyth, J.; Mitchell, J.E. Daily mood patterns and bulimic behaviors in the natural environment. Behav. Res. Ther. 2009, 47, 181–188. [Google Scholar] [CrossRef] [PubMed]
  32. Muthén, B.; Muthén, L.K. Integrating person-centered and variable-centered analyses: Growth mixture modeling with latent trajectory classes. Alcohol. Clin. Exp. Res. 2000, 24, 882–891. [Google Scholar] [CrossRef]
  33. Jo, G.Y.; Park, T.Y. A longitudinal study on the changes in the typology of social relationships among retirees by using latent class analysis. Korean J. Fam. Welf. 2013, 18, 599–623. [Google Scholar] [CrossRef]
  34. Jung, T.; Wickrama, K.A. An introduction to latent class growth analysis and growth mixture modeling. Soc. Pers. Psychol. Compass. 2008, 2, 302–317. [Google Scholar] [CrossRef]
  35. Assaad, H.I.; Hou, Y.; Zhou, L.; Carroll, R.J.; Wu, G. Rapid publication-ready MS-Word tables for two-way ANOVA. Springer Plus 2015, 4, 33. [Google Scholar] [CrossRef]
  36. Kim, D.H.; Kang, B.H.; Lee, E.J.; Kang, H.J.; Lee, J.H. Analysis of the Relationship Between User Characteristics and Forest Welfare Facilities: Focusing on Correspondence Analysis. J. Korean Soc. For. Sci. 2024, 113, 1–13. [Google Scholar] [CrossRef]
  37. Armstrong, R.A.; Eperjesi, F.; Gilmartin, B. The application of analysis of variance (ANOVA) to different experimental designs in optometry. Ophthalmic Physiol. Opt. 2002, 22, 248–256. [Google Scholar] [CrossRef] [PubMed]
  38. Kim, H.Y. Analysis of variance (ANOVA) comparing means of more than two groups. Restor. Dent. Endod. 2014, 39, 74–77. [Google Scholar] [CrossRef]
  39. Park, H.-J.; Shon, J.-H. Quality of life depending on the presence of diabetes and engagement in moderate physical activity: Data from Korea National Health and Nutrition Examination Survey (2019–2021). Korea J. Sports Sci. 2024, 33, 523–532. [Google Scholar] [CrossRef]
  40. Lee, W.-S. Differences in environmental perception and satisfaction factor of park between young adults and old adults. J. Environ. Sci. Int. 2020, 29, 145–154. [Google Scholar] [CrossRef]
  41. Lee, J.H.; Yoo, R.H.; Lee, J.W. Analysis on visitors of healing forest for improvement of forest healing program. J. Korean Forest Recreat. 2016, 20, 73–80. [Google Scholar] [CrossRef]
  42. Eriksson, L.; Nordlund, A.; Olsson, O.; Westin, K. Beliefs about urban fringe forests among urban residents in Sweden. Urban For. Urban Green. 2012, 11, 321–328. [Google Scholar] [CrossRef]
  43. Filkobski, I.; Rofè, Y.; Tal, A. Community gardens in Israel: Characteristics and perceived functions. Urban For. Urban Green. 2016, 17, 148–157. [Google Scholar] [CrossRef]
  44. Yoon, T.K.; Myeong, J.Y.; Lee, Y.; Choi, Y.E.; Lee, S.; Lee, S.; Byun, C. Are you okay with overtourism in forests? Path between crowding perception, satisfaction, and management action of trail visitors in South Korea. Forest Policy Econ. 2024, 161, 103184. [Google Scholar] [CrossRef]
  45. Peschardt, K.K.; Schipperijn, J.; Stigsdotter, U.K. Use of Small Public Urban Green Spaces (SPUGS). Urban For. Urban Green. 2012, 11, 235–244. [Google Scholar] [CrossRef]
  46. Jang, Y.S.; Yoo, R.H.; Lee, J.H. The characteristics of forest leisure activities and demographic factors influencing visitor preference. J. Korean Soc. Forest Sci. 2020, 109, 231–242. [Google Scholar] [CrossRef]
  47. Park, J.W. Analysis of forest welfare service users’ activity experience, awareness, and satisfaction: Differences by year and user characteristics. J. Korean Forest Recreat. 2024, 28, 45–65. [Google Scholar] [CrossRef]
  48. Kim, D.S.; Lee, B.C.; Park, K.H. Determination of motivating factors of urban forest visitors through latent dirichlet allocation topic modeling. Int. J. Environ. Res. Public Health 2021, 18, 9649. [Google Scholar] [CrossRef]
  49. Stigsdotter, U.K.; Grahn, P. Stressed individuals’ preferences for activities and environmental characteristics in green spaces. Urban For. Urban Green. 2011, 10, 295–304. [Google Scholar] [CrossRef]
  50. Zhai, Y.; Baran, P.K.; Wu, C. Spatial distributions and use patterns of user groups in urban forest parks: An examination utilizing GPS tracker. Urban For. Urban Green. 2018, 35, 32–44. [Google Scholar] [CrossRef]
  51. Dodev, Y.; Zhiyanski, M.; Glushkova, M.; Shin, W.S. Forest welfare services-the missing link between forest policy and management in the EU. Forest Policy Econ. 2020, 118, 102249. [Google Scholar] [CrossRef]
  52. Hartig, T.; Mitchell, R.; de Vries, S.; Frumkin, H. Nature and health. Annu. Rev. Public Health 2014, 35, 207–228. [Google Scholar] [CrossRef] [PubMed]
  53. Park, B.J.; Tsunetsugu, Y.; Kasetani, T.; Kagawa, T.; Miyazaki, Y. The physiological effects of Shinrin-yoku (taking in the forest atmosphere or forest bathing): Evidence from field experiments in 24 forests across Japan. Environ. Health Prev. Med. 2010, 15, 18–26. [Google Scholar] [CrossRef]
  54. O’Brien, L.; Burls, A.; Townsend, M.; Ebden, M. Volunteering in nature as a way of enabling people to reintegrate into society. Perspect. Public Health 2011, 131, 71–81. [Google Scholar] [CrossRef] [PubMed]
  55. Tyrväinen, L.; Ojala, A.; Korpela, K.; Lanki, T.; Tsunetsugu, Y.; Kagawa, T. The influence of urban green environments on stress relief measures: A field experiment. J. Environ. Psychol. 2014, 38, 1–9. [Google Scholar] [CrossRef]
Figure 1. Study site: (A) Regional map indicating the location of Incheon Metropolitan City (red square). (B) Administrative map showing the districts within Incheon Metropolitan City. (C) Satellite map of Incheon Metropolitan City, highlighting the locations of forest recreation facilities and major mountains. The green arrow indicates the urban forest axis.
Land 14 01584 g001
Figure 2. Research model.
Land 14 01584 g002
Figure 3. Perceptual map of the relationships between visitor types and experienced activity types.
Land 14 01584 g003
Figure 4. Perceptual map of the relationships between visitor types and preferred future activity types.
Land 14 01584 g004
Table 1. Composition of survey items and measurement scales.
CategorySub-ItemsScale
Demographic characteristicsSex, age group, income levelNominal scale
FRVPNecessary for national health management5-Point Likert scale
Preferable for quality family time
Provides vitality through exercise and recreational activities
Brings happiness and relaxation in daily life
Enhances social connections
Helps in understanding the importance of forest ecosystems
Forest recreation behaviorFrequency of experience① Almost daily ② 3–4 times per week
③ 1–2 times per week ④ 1–2 times per month
⑤ 3–4 times per year ⑥ 1–2 times per year
Nominal scale
Forest visit considerations①Accessibility ② Cost ③ Forest leisure activities
④ Availability of informational signage ⑤ Natural landscape aesthetics
⑥ Provision of rest areas ⑦ Experience programs
Types of activitiesExperienced activities① Hiking/walking ② Scenic appreciation ③ Cultural heritage tour ④ Rest/meditation ⑤ Festival/event ⑥ Photography (Video) ⑦ Using a spring water site ⑧ Using sports facilities ⑨ Participating in forest interpretation programsNominal scale
Preferred future activities① Hiking/walking ② Scenic appreciation ③ Cultural heritage tour ④ Rest/meditation ⑤ Festival/event ⑥ Photography (Video) ⑦ Using a spring water site ⑧ Using sports facilities ⑨ Participating in forest interpretation programs
Demand for forest recreationAgreement on additional budget allocation5-Point Likert scale
Perceived impact on local environmental improvement
Willingness for direct utilization
Satisfaction with forest attributesTree and vegetation conditions5-Point Likert Scale
Facility utilization
Management conditions
Table 2. Population distribution by district in Incheon Metropolitan City (as of September 2023).
CategoryTotalSurvey Target AreasNon-Survey Target Areas
Jung-GuSeo-GuMichuhol-GuYeonsu-GuNamdong-GuBupyeong-GuGyeyang-GuDong-GuGanghwa-GunOngjin-Gun
Population2987,918 157,595618,052405,471389,722496,318488,383282,82659,94069,16220,449
Proportion (%)100.05.320.713.613.016.616.39.52.02.30.7
Source: Ministry of the Interior and Safety (n.d.). Retrieved from https://jumin.mois.go.kr/ (accessed on 1 July 2025).
Table 3. Descriptive statistics on FRVP (n = 700, unit: frequency (%)).
CategoryDisagree *NeutralAgree **Mean (SD) ***
Need for health management17 (2.5)106 (15.1)577 (82.4)4.23 (0.812)
Quality time with family26 (3.7)140 (20.0)534 (76.3)4.04 (0.832)
Vitality through exercise and leisure13 (1.8)147 (21.0)542 (77.2)4.03 (0.765)
Happiness and relaxation in daily life11 (1.6)127 (18.1)572 (80.3)4.12 (0.775)
Active social interactions22 (3.2)183 (26.1)495 (70.7)3.95 (0.830)
Understanding of forest ecosystem17 (2.4)149 (21.3)534 (76.3)4.05 (0.801)
* Disagree includes responses of “Strongly Disagree (1)” and “Disagree (2)” on a five-point Likert scale. ** Agree includes responses of “Agree (4)” and “Strongly Agree (5)” on a five-point Likert scale. *** Mean (SD) represents the average value across all responses.
Table 4. Comparison of model fit indices and class proportions for 2–6-class LCA solutions.
CategoryNumber of Latent Classes
234 *56
Information criteria (ICs)AIC7929.4247220.5557164.9717124.2877123.511
BIC8152.4277557.5357615.5287688.6217801.622
SABIC8030.6017389.8887402.4597429.9317497.3
Likelihood-based fit indexLMR-LRT0.000 **0.000 **0.000 **0.000 **0.041 **
BLRT0.6000.5000.9330.7331.000
Classification accuracy of the modelEntropy0.0700.0970.2290.2520.304
Class proportion (%)Class 162.00021.00022.00021.00022.000
Class 238.00031.00021.00022.0001.000
Class 3 48.00037.0004.00031.000
Class 4 19.00039.00016.000
Class 5 14.00021.000
Class 6 9.000
Note: * The four-class model showed optimal balance across fit statistics, classification accuracy (entropy), and group size interpretability; ** p < 0.05. Akaike Information Criterion (AIC); Bayesian Information Criterion (BIC); sample-size adjusted BIC (SABIC); Lo–Mendell–Rubin likelihood ratio test (LMR-LRT); bootstrap likelihood ratio test (BLRT).
Table 5. Mean and composition ratio by latent classes (n = 700, unit: mean (SD)).
FRVPClass 1
(n = 153, 21.8%)
Class 2
(n = 149, 21.3%)
Class 3
(n = 262, 37.4%)
Class 4
(n = 136, 19.5%)
Need for health management4.93 (0.306)4.11 (0.776)3.74 (0.448)3.05 (0.636)
Quality time with family4.91 (0.289)4.27 (0.553)3.86 (0.437)3.10 (0.612)
Vitality through exercise and leisure5.00 (0.000)4.48 (0.565)3.95 (0.358)3.08 (0.597)
Happiness and relaxation in daily life4.96 (0.278)4.72 (0.480)4.09 (0.479)3.13 (0.704)
Active social interactions4.92 (0.315)4.41 (0.558)3.86 (0.484)3.06 (0.593)
Understanding of forest ecosystem4.92 (0.372)4.42 (0.639)3.89 (0.404)2.95 (0.612)
Table 6. Sociodemographic characteristics and utilization patterns by visitor type (unit: frequency (%)).
CategoryMultipurpose RecreationistsBalanced Relaxation SeekersCasual Forest UsersPassive Forest Visitors x 2 (p)
Sex
(n = 700)
Male60 (39.2)76 (51.0)114 (55.0)81 (59.6)14.051
(0.003) **
Female93 (60.8)73 (49.0)118 (45.0)55 (40.4)
Age group
(n = 700)
30 or younger44 (28.8)36 (24.2)93 (35.5)58 (42.6)21.478
(0.002) **
40–5052 (34.0)50 (33.6)88 (33.6)51 (37.5)
60 or older57 (37.2)63 (42.2)81 (30.9)27 (19.9)
Income level *
(n = 700)
Below 3106 USD61 (39.9)61 (40.9)102 (38.9)61 (44.9)5.239
(0.513)
3106–4658 USD38 (24.8)49 (32.9)75 (28.6)37 (27.2)
Above 4658 USD54 (35.3)39 (26.2)85 (32.5)38 (27.9)
Frequency of experience
(n = 646)
Almost daily3 (2.1)1 (0.7)0 (0.0)0 (0.0)24.190
(0.062)
3–4 times per week4 (2.7)4 (2.8)7 (3.0)5 (4.2)
1–2 times per week24 (16.4)16 (11.0)28 (11.9)16 (13.3)
1–2 times per month49 (33.6)49 (33.8)73 (31.0)36 (30.0)
3–4 times per year36 (24.7)49 (33.8)81 (34.5)25 (20.8)
1–2 times per year30 (20.5)26 (17.9)46 (19.6)38 (31.7)
Forest visit considerations
(n = 646)
Accessibility99 (67.8)95 (65.5)166 (70.6)81 (67.5)37.730
(0.004) **
Cost1 (0.7)5 (3.4)11 (4.7)11 (9.2)
Availability of informational signage1 (0.7)3 (2.1)3 (1.3)6 (5.0)
Natural landscape aesthetics35 (24.0)23 (15.9)41 (17.5)14 (11.7)
Provision of rest areas10 (6.8)17 (11.7)13 (5.5)6 (5.0)
Experience programs0 (0.0)2 (1.4)1 (0.4)1 (0.8)
Etc.0 (0.0)0 (0.0)0 (0.0)1 (0.8)
* Income level is based on the 2023 average exchange rate of 1288.0 KRW/USD (USD/KRW = 1179.199); ** p < 0.05.
Table 7. Two-way ANOVA results for satisfaction with forest attributes (n = 700).
VariableSum of SquaresDegrees of FreedomMean SquareF
Tree and vegetation conditionsVisitor type (A)23.7737.9213.70 **
Age group (B)0.1520.070.13
A × B17.1262.854.93 **
Error315.085454.94
Facility utilizationVisitor type (A)37.10312.3720.36 **
Age group (B)0.6920.340.57
A × B14.9662.494.11 **
Error330.985450.61
Management conditionsVisitor type (A)43.20314.4024.28 **
Age group (B)0.3320.170.28
A × B8.6761.442.44 *
Error323.255450.59
Note: * p < 0.05, ** p < 0.001.
Table 8. Differences in facility demand and environmental improvement impact by visitor type (n = 700).
Dependent VariablesVisitor TypenMeanSDFpPost-Hoc Test
Agreement on additional budget allocationa1534.590.6483.519<0.001d < c < b < a
b1494.210.75
c2623.890.73
d1363.270.82
Perceived impact on local environmental improvementa1534.670.55120.181<0.001d < c < a, b
b1494.380.65
c2624.050.60
d1363.290.70
Willingness for direct utilizationa1534.720.53119.765<0.001d < c < b < a
b1494.560.63
c2624.110.63
d1363.380.73
a: Multipurpose recreationists; b: balanced relaxation seekers; c: casual forest users; d: passive forest visitors.
Disclaimer/Publisher’s Note: The statements, opinions and data contained in all publications are solely those of the individual author(s) and contributor(s) and not of MDPI and/or the editor(s). MDPI and/or the editor(s) disclaim responsibility for any injury to people or property resulting from any ideas, methods, instructions or products referred to in the content.

