Article

Designing Age-Friendly Paved Open Spaces: Key Green Infrastructure Features for Promoting Seniors’ Physical Activity

1
School of Design, Xi’an Technological University, Xi’an 710021, China
2
School of Arts and Design, Xi’an University, Xi’an 710065, China
3
College of Landscape Architecture and Art, Henan Agricultural University, Zhengzhou 450002, China
4
College of Landscape Architecture and Art, Northwest A&F University, Yangling 712100, China
*
Author to whom correspondence should be addressed.
Land 2025, 14(6), 1271; https://doi.org/10.3390/land14061271
Submission received: 29 April 2025 / Revised: 6 June 2025 / Accepted: 11 June 2025 / Published: 13 June 2025

Abstract

Urban parks, key components of green infrastructure (GI), offer paved open spaces that significantly impact physical activity (PA) among older adults. However, the environmental features of these spaces and their effects on PA remain underexplored. Existing studies often overlook factors like spatial configuration, planar morphology, and bag storage facilities, and lack a systematic analytical framework. Many also rely on simplistic PA measurements and struggle with multicollinearity in data analysis. This study addresses these gaps by proposing a comprehensive framework examining four environmental dimensions: spatial configuration, planar morphology, facility provision, and visual greenery. Using GPS-tracked mobility data, behavioral audits, and multicollinearity-robust Partial Least Squares (PLS) regression, we analyze the impact of these features on PA. Results show that functional elements—higher spatial integration (VIP = 1.04), larger activity areas (VIP = 1.82), sufficient bag storage (VIP = 1.64), outdoor fitness equipment (VIP = 1.30), and diverse greenery (VIP = 1.23)—significantly enhance PA. In contrast, factors like floral diversity (VIP = 0.67), water visibility (VIP = 0.48), and shape complexity (VIP = 0.16) have minimal effects. This study provides theoretical insights and practical strategies for retrofitting paved park spaces, contributing to age-friendly urban GI.

1. Introduction

Green Infrastructure (GI) serves as a crucial pathway for enhancing the quality of life for older adults (aged 60 years and above) in urban environments, particularly by promoting physical activity (PA). Regular PA is essential for maintaining physical health and preventing chronic diseases [1,2], especially for older adults who are generally more physically frail [3,4]. Compared to other age groups, older adults experience functional decline and poorer health conditions, often accompanied by various chronic diseases and daily functional impairments [5]. Despite the significant health benefits of PA for older adults, most do not achieve adequate levels of PA [6], which increases healthcare costs and diminishes their overall well-being. The social-ecological model indicates that the built environment, particularly GI, plays a key role in promoting or hindering PA participation [7]. This view is supported by the WHO’s 2018 Global Action Plan on PA, which advocates for positive interventions and modifications to the built environment as essential measures to promote PA [8]. Parks, as critical nodes within GI, are vital venues for older adults to engage in PA [9,10]. The environmental characteristics of parks significantly influence the level of PA among older adults [11,12]. In recent years, Green Infrastructure has also been increasingly viewed through the lens of Nature-Based Solutions (NBS)—a concept that emphasizes the role of natural elements in addressing urban sustainability and public health challenges [13,14]. Integrating NBS into GI planning can provide multifunctional benefits, including fostering physical activity opportunities, improving mental health, and enhancing urban resilience. Identifying key environmental features that foster PA in parks and implementing proactive environmental interventions to enhance older adults’ PA levels are central topics of concern for urban decision-makers, public health scholars, and designers [15].
Previous research analyzing the connection between park environmental features and PA can be classified into three scale-based levels: neighborhood, overall park, and park activity areas [11,16]. Environmental features considered encouraging for resident PA at the neighborhood level include park proximity [11], accessibility [17], and quantity [18]. At the overall park level, factors demonstrated to encourage PA consist of total park area [17,19], the total paved ground area in the park [20], specific park features [12], and the condition of park maintenance [9]. Research at the park activity area (facility) level indicates that pathways and paved open spaces inside parks significantly affect the PA of both adults and older adults. Studies commonly categorize park spaces into types such as pathways, paved open spaces, sports fields, building areas, children’s play areas, lawns, water bodies, and other natural zones [21]. Park pathways consistently emerge as encouraging PA, a conclusion supported across studies [12,22]. For instance, Zhai et al.’s study involving 286 older adults determined that these individuals spent 47.1% of their park visit time on pathways; the study further determined wider pathways (over 3.5 m) attracted more older adults and correlated more strongly with spontaneous activities [21]. Multiple studies also support a negative correlation between PA levels and the presence of lawns or water bodies [12,21,23]. Paved open spaces represent another key park component and are preferred areas for both adults and older adults [24,25]. An empirical study in Shanghai utilizing GPS tracking of older adults’ park visits demonstrated the highest usage rate for paved spaces compared to other space types [25]. These areas are vital for supporting PA [26], represent popular PA venues for the older population [10], and commonly host activities such as Tai Chi and square dancing.
Previous scholars indicated that specific environmental features of paved open spaces might either encourage or limit PA [25,27,28], thus calling for more systematic analysis of these features [29]. They also observed the particular utility of understanding these micro-level environmental characteristics, considering that micro-level interventions are more cost-effective and practical compared to modifying neighborhood-level features such as increasing park density [28]. However, research focusing on how different environmental features of park-based paved open spaces impact older adults’ PA remains relatively limited. Existing studies often concentrate on a restricted set of facilities or visual environmental variables. They typically lack a systematic analytical framework and sometimes present inconsistent conclusions.
Crucial yet often overlooked environmental variables impacting PA include the configurational characteristics, planform characteristics, and key facilities of paved open spaces in parks. Configurational characteristics refer to the spatial positioning of paved areas within the overall park structure. The study by Hillier and Iida [30] highlighted urban spatial geometry and topology as powerful determinants of pedestrian flow, significantly influencing land use. Prior studies have shown that these characteristics affect the accessibility of paved areas and other park facilities, thereby shaping visitor distribution [16,31,32]. Reliable spatial syntax tools are now available to assess configurational features and their impact on human activity [33,34], and have been widely applied across scales—from cities to buildings [35,36]. More recently, they have been used to explore the influence of park configurational features on walking [16] and social behavior [37]. Therefore, assessing how paved open space features affect PA should include configurational variables to capture their influence on older adults’ PA. Planform characteristics—such as area and shape—are key in design and are believed to enhance spatial perception, increase visitation, and extend stay duration, thereby promoting PA. Additionally, the role of bag storage facilities is often ignored. These are especially relevant for older adults in China who carry bags when combining park visits with shopping. A comprehensive analytical framework should thus integrate these variables, which hold important implications for both design theory and practice.
Discrepancies in research findings may stem from limitations in PA measurement methods. Many studies rely on self-reports or the SOPARC (System for Observing Play and Recreation in Communities) observational method. Self-reports require participants to recall activity locations, durations, and types during park visits [12,38], but memory lapses can lead to inaccuracies, and subjective perceptions may introduce bias [26,39]. SOPARC collects real-time data on crowd types and activity behaviors within specific areas and timeframes [40], but it is labor-intensive and cannot capture activity duration or sociodemographic details [17,39]. Growing interest is seen in mixed methods combining GPS tracking with questionnaires. GPS offers objective data on visit locations and durations, while questionnaires provide sociodemographic and activity information. Recent studies confirm this method’s improved accuracy and objectivity [41].
Moreover, different analytical methods might also be the source of discrepancies observed in conclusions. Research in this field frequently involves a large number of independent variables and high-dimensional data. Therefore, potential multicollinearity issues can be observed. These issues may compromise the stability and reliability associated with traditional linear regression models. Such instability potentially explains significant differences in research findings, including prominent debates about how environmental factors (e.g., floral diversity, water presence) exert their impact. For handling high-dimensional data and multicollinearity, the Partial Least Squares (PLS) regression model presents unique advantages. Its application significantly enhances the stability and reliability of analytical results. This study, therefore, employs the PLS model specifically to address these challenges, seeking to enhance analytical accuracy and reliability.
Existing research gaps prompted this study to incorporate key variables often previously overlooked. These variables include Paved Open Space Configurational Characteristics, planform characteristics, and facility provision. We integrated these elements into a systematic analytical framework including four dimensions: spatial structure, planform characteristics, facility provision, and visual environment characteristics. A systematic evaluation of older adults’ PA was conducted in this study utilizing a combination of GPS tracking and surveys. The PLS regression model is utilized; its purpose is to measure more accurately the effect of paved open space environmental features on older adults’ PA. Therefore, the research seeks answers to several key questions: What Paved Open Space Configurational Characteristics, planform characteristics, facility provision, and visual environment attributes affect older adults’ PA? What specific environmental features are most critical in influencing their PA levels?
To the best of our knowledge, we believe this analysis represents the first exploratory research performing a systematic analysis of how paved open space environmental features influence older adults PA. The analysis considers four dimensions: configurational characteristics, planform characteristics, facility provision, and visual environment. A thorough analysis of these issues contributes to bridging the cognitive divide in this research field. The study offers scientific evidence valuable to landscape designers and policymakers. The findings offer guidance for optimizing park paved open spaces and implementing environmental interventions. Such actions can effectively enhance PA levels among the older adults population, thus promoting their health and well-being.

2. Method

2.1. Study Area

This study selected three medium-sized urban parks in Xi’an—Lianhu, Revolution, and Fengqing—based on four criteria: (1) location in the central districts of Lianhu and Xincheng, which have high proportions of older adults (19.95% and 17.89%, respectively) [42,43]; (2) proximity to residential neighborhoods, senior universities, and cultural or commercial amenities, supporting frequent use by older adults and ensuring sufficient participant samples; (3) a wide variety of paved open spaces with distinct environmental characteristics, enabling comparative analysis; and (4) public management and good maintenance, ensuring a clean, safe, and consistent research setting. These criteria were established to ensure the study includes a sufficiently diverse sample of older adults and varied paved open space environments, while minimizing interference from hygiene and safety issues.
Paved open spaces are defined here as all publicly accessible paved areas within parks, some of which may include trees, structures, pavilions, or shading facilities. These spaces serve as the units of analysis. All paved spaces in the three parks were considered, excluding those under 30 m2 or with uneven surfaces—criteria chosen because small areas typically function as path transitions and uneven surfaces are unsuitable for PA. Ultimately, 110 paved open spaces met the criteria and were included in the analysis (Figure 1).

2.2. Variable Measurement

2.2.1. PA of Older Adults

Review and approval for this study were granted by the Academic Committee of the School of Design at Xi’an Technological University (Number: XATUDS20210162) on 7 January 2021. In addition, the research adheres to the relevant principles outlined in the Declaration of Helsinki regarding human biological research. The questionnaires and trajectory data collected were anonymous. They contain no personally identifiable information. Approval for utilizing oral informed consent from participants was also granted by the Academic Committee, which also assigned independent reviewers the task of overseeing and witnessing the data collection process.
Participant Recruitment and Data Collection Schedule. To study PA in various paved open spaces, we recruited older adults as they entered the parks to participate in our survey. Data collection occurred annually between October 2021 and 2023, during a period when the weather in Xi’an is generally favorable for outdoor activities. Collection was conducted in two daily time slots: 8:00 AM–11:00 AM and 3:00 PM–6:00 PM. These periods align with findings from preliminary research and other studies indicating peak park visitation times [44].
Eligibility and Consent Procedures. Participants were eligible if they were aged 60 years or older, engaged in leisure-oriented physical activities, and could move independently without assistive devices (e.g., wheelchairs, canes). Older adults were initially identified by trained research staff based on visible physical characteristics such as gray hair, facial wrinkles, and body posture. Age was then confirmed through direct verbal inquiry; individuals under 60 were excluded from participation. Throughout each day, members of our research team were stationed at every entrance and exit of the three parks. Upon a visitor’s arrival, researchers explained the study’s objectives and procedures before inviting them to participate. Formal oral informed consent was obtained under the supervision of independent reviewers assigned by the academic ethics committee.
App Installation and Survey Process. After obtaining consent, participants were assisted in installing Two-Step Road, one of the most widely used GPS outdoor tracking apps in China. The reliability of this app has been verified in multiple empirical studies [45,46]. Participants were instructed to whitelist the app to ensure continuous background operation during their activities. Upon completing their physical activity, they located researchers at any park exit. The research team then exported the GPS trajectory data in GPX format and assisted participants in completing a structured questionnaire. This combination of objective tracking and subjective reporting has been widely adopted and validated in behavioral studies involving GPS and survey integration [47,48].
The questionnaire collected basic sociodemographic information (e.g., gender, occupation, number of companions) to profile the older participants. It also included two items directly related to the study objectives: (1) the type of physical activity performed (e.g., singing, exercising with equipment, dancing), which was used to assign the corresponding MET values for estimating energy expenditure; and (2) the ID number of the paved open space where the activity occurred, which was used to cross-validate the GPS trajectory data and confirm the spatial accuracy of each recorded activity.
Data Cleaning and Final Sample. Participants received a small gift upon completing the study. All trajectory data were processed using ArcGIS 10.7 software, a standard tool for handling GPS-based movement data in urban behavior research [49]. Data cleaning, an essential step to ensure the accuracy and validity of behavioral trajectory analyses [46], involved excluding records with early exits, missing information, GPS signal anomalies, activity durations less than 5 min, travel distances less than 200 m, or inconsistencies between GPS-indicated locations and self-reported activity sites. After applying these exclusion criteria, a final sample of 385 valid records was retained for subsequent analysis.

2.2.2. PA Data Processing and Variable Measurement for Older Adults

The dependent variable measured in this study was the total metabolic equivalent (MET) associated with older adults visitors for each paved open space. PA duration [50,51], type of PA [26], and MET [21,24] are common indicators utilized for PA measurement. MET stands out among these indicators as its calculation (multiplying PA duration by the MET value of the specific activity type) comprehensively reflects both duration and type. Calculation of the energy metabolism for each older adults participant in their respective study locations followed the PA energy metabolism method recommended in the 2011 U.S. Physical Activity Guidelines: Energy expenditure (kilocalories) = MET × activity duration (minutes) [52]. Activity duration data came from the GPS tracking records of the older visitors. Meanwhile, activity type data were collected through questionnaire surveys. The MET values corresponding to different activity types were also sourced from the aforementioned guidelines. In this study, the MET values used ranged from 1.3 for sedentary activities to 5.0 for moderate-to-vigorous activities such as dancing and exercising with equipment. Based on the collected self-reported activity types, no activities exceeding a MET of 5.0 were observed among the older adult participants. An additional step involved normalizing the dependent variable (calories per minute) to eliminate the effects of different environmental features and usage conditions across the three parks on energy expenditure data; this ensured data comparability between spaces. We specifically employed the min-max normalization method, a widely used technique for rescaling data into a fixed range, typically [0, 1] [53]. This allowed us to convert the energy consumption values for each paved open space into comparable percentage values within a 0–1 distribution range. The relative differences in energy consumption levels across the various spaces are reflected by this normalization.

2.2.3. Measurement of the Environmental Characteristics of Paved Open Spaces

Measurement of the configurational characteristics of the Paved Open Spaces (Figure 2). The road network and open space boundary data for the three parks were obtained from unmanned aerial vehicle (UAV) photogrammetry using DJI Phantom 4 RTK (SZ DJI Technology Co., Ltd., Shenzhen, China). UAV-based photogrammetry has been widely validated as a reliable and accurate method for acquiring geospatial data, particularly in capturing detailed spatial dimensions in outdoor environments [54]. Quantitative measurement of the park spaces’ configurational characteristics utilized the convex space model from space syntax. Four commonly employed indicators were applied: Connectivity, Total Depth, Choice, and Integration [55]. Table 1 offers detailed definitions and calculation formulas for these indicators. Measurement of these indicators was performed using DepthMap 10 software. This software represents the most frequently utilized tool for assessing park space configurational characteristics. Its reliability has received extensive validation in prior related research [16,31,37].
This study carried out a systematic measurement of the environmental characteristics associated with paved open spaces. Measurement indicators were primarily sourced from field observations and data acquired through drone mapping. We selected these specific indicators either from established park environmental measurement tools or based on environmental factors demonstrated in previous research to significantly affect older adults’ PA. Appendix A contains the detailed operational definitions of variables and lists their origins. For organizational purposes, the indicators belong to three dimensions: planform characteristics, provision of facilities, and characteristics of the visual environment. The area and shape index of paved open spaces constitute the planform characteristics. Facility provision comprises five variables, namely the count of bag storage facilities, the quantity of benches, the availability of outdoor fitness equipment, the existence of shading facilities, and the proximity to restrooms. Characteristics related to the visual environment cover the number of green vegetation species, the diversity of flower species, horizontal visibility levels, and the presence of water features. Measurement for variables requiring field observation strictly adhered to the operational definitions specified in the relevant measurement tools. To ensure data reliability, two trained observers independently visited each study site, recorded the environmental characteristics, and then performed consistency checks; any identified discrepancies prompted re-measurement until agreement was reached.

2.3. Data Analysis

This study employed descriptive statistics, correlation analysis, univariate linear regression, and PLS regression as core analytical methods, all conducted using SPSSAU tools. Descriptive statistics summarized the distributions of independent and dependent variables. Correlation analysis assessed inter-variable relationships and identified multicollinearity; variables with high correlation (r > 0.7) were excluded to enhance model simplicity and stability. PLS regression was subsequently used to investigate both the overall and specific effects of environmental predictors on calorie metabolism. Originally proposed by Wold [60], PLS regression integrates principal component and multiple regression techniques. It is particularly suitable for small sample sizes, high-dimensional data, and datasets with multicollinearity [61]. It offers advantages such as robustness to noise, reduced sensitivity to measurement error, and the ability to extract latent variables that account for the shared variance between predictors and outcomes. The PLS analysis proceeded in three stages: (1) determining the optimal number of components using cross-validation metrics such as R2 and RMSEP [62]; (2) interpreting model results via regression coefficients and Variable Importance in Projection (VIP) scores; and (3) evaluating the individual contribution of each predictor to the outcome variable. Model validity was assessed according to established PLS guidelines [63]. Linear regression was also employed to resolve inconsistencies between VIP scores and regression coefficients, allowing for cross-verification and enhanced interpretability of the findings.

3. Result

3.1. Statistics of Participants and Environmental Variables

Table 2 displays the descriptive statistics concerning the participants’ social background information. A total of 385 valid samples were included in this study following the screening process. Participants included slightly more males than females. Female participants numbered 168, constituting 43.64% of the total sample, while 217 male participants accounted for the remaining 56.36%. Regarding occupational backgrounds, civil servants comprised 103 participants (23.75%). The sample included 32 farmers (8.31%), and individuals employed in commercial and service industries numbered 24 (6.23%). Analysis of the collected samples indicated that 233 participants were visiting alone (60.52%); conversely, 150 samples represented groups of two or more visitors (38.96%).
The descriptive statistics for the environmental indicators of the paved open spaces are presented in Table 3. Four indicators are incorporated concerning the structural characteristics of paved open spaces in the parks: Connectivity, Total Depth, Choice, and Integration. An average value of 2.66 was observed for Connectivity (minimum = 1, maximum = 7, standard deviation = 1.48, median = 2). Total Depth averaged 3442.09 (minimum = 1012, maximum = 6366, standard deviation = 1390.6, median = 3590). For Choice, the average value reached was 1705.42 (minimum = 0, maximum = 14,028, standard deviation = 2917.23, median = 542). Integration demonstrated an average value of 0.62 (minimum = 0.39, maximum = 1.07, standard deviation = 0.13, median = 0.58).
Two indicators (Area and Shape index) were considered regarding the planform characteristics of the park’s paved open spaces. The 110 paved open spaces had a mean area of 464.81 m2 (minimum = 34, maximum = 3066, standard deviation = 268.5). An average value of 1.164 was calculated for the shape index (minimum = 0.89, maximum = 2.01, standard deviation = 0.211).
Five indicators were evaluated relating to facility provision: the number of bag storage facilities, the number of benches, the presence of outdoor fitness equipment, the presence of shading facilities, and the distance to restrooms. There was an average of 0.39 bag storage facilities (median = 0), while benches averaged 4.25 per space (median = 1). In the study sample, outdoor fitness equipment was present in five locations (4.45%). Shading facilities were available at 25 locations (22.73%). Moreover, the mean distance from paved open spaces to the nearest restroom measured 141.58 m (minimum = 2, maximum = 442, standard deviation = 98.67, median = 115.5).
Four indicators were analyzed concerning the visual environment characteristics of the paved open spaces in the parks: the number of green vegetation species, flower species diversity, horizontal visibility, and the presence of water. An average of 2.7 green vegetation species was found across the 110 paved open spaces (minimum = 0, maximum = 9, standard deviation = 2.53). Flower species diversity averaged 1.05 (minimum = 0, maximum = 5, standard deviation = 0.84). Among the samples, 47 had low horizontal visibility, representing 42.73% of the total. In addition, visible water was a feature in 33 paved open spaces, making up 30% of the sample.
Table 3 additionally reports the predicted variable for this study: the metabolic equivalent (met/min) of PA for older adults in each paved open space. Its average value was 372.64 (minimum = 0, maximum = 6538.64, standard deviation = 777.3, median = 116).

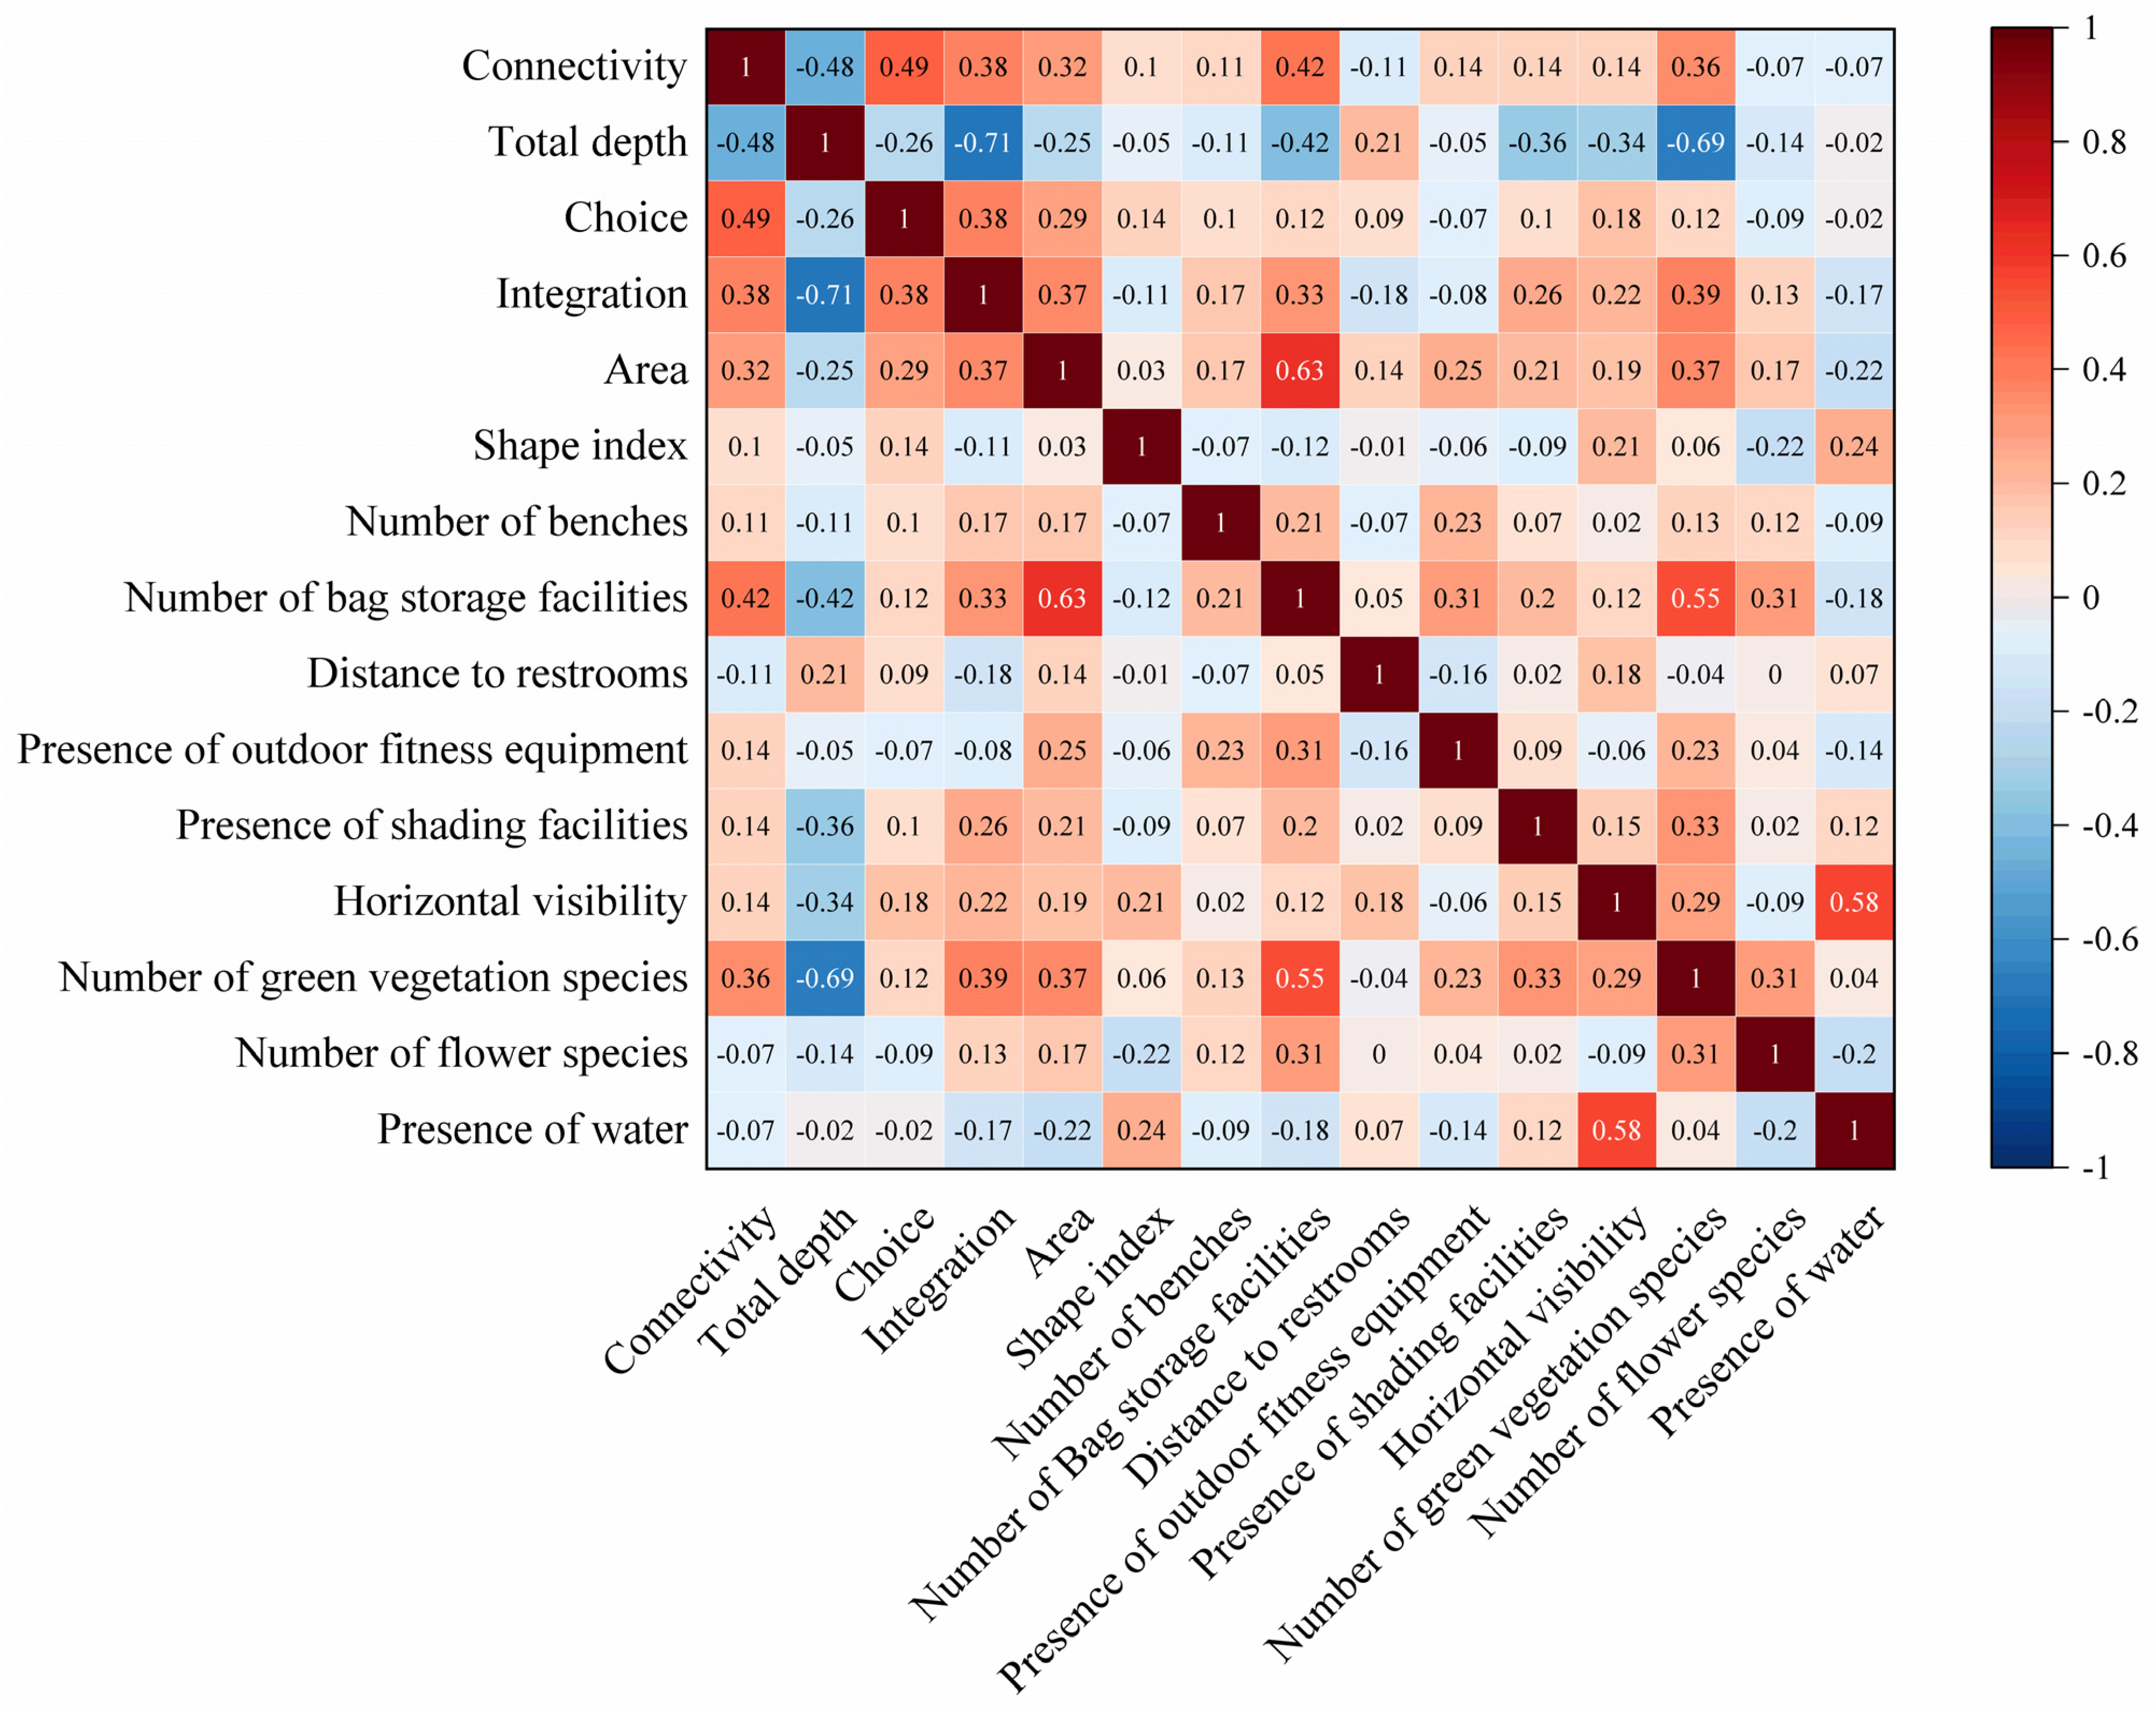
3.2. Key Environmental Correlations and Collinearity Concerns

Analysis of correlations between variables in the paved open space study was conducted. Results depicted in Figure 3 indicate high correlations among several variables. For instance, a significant negative correlation exists between total depth and integration (r = −0.71, p < 0.01); total depth additionally displays a strong negative relationship with the number of green vegetation species (r = −0.69, p < 0.01). Exclusion of the total depth variable is necessary to reduce multicollinearity issues, as these correlation coefficients surpass the empirical 0.7 threshold. Strong positive correlations were also observed: area correlated strongly with the number of bag storage facilities (r = 0.63, p < 0.01), the number of green vegetation species demonstrated a positive correlation with the number of bag storage facilities (r = 0.55, p < 0.01), and water presence correlated positively with horizontal visibility (r = 0.58, p < 0.01). Potential multicollinearity among variables is suggested by these strong correlations, which could introduce instability in regression coefficients and enhance model variance in ordinary linear regression models. The significant correlations, especially the strong relationships between multiple variable pairs, emphasize the potential risks associated with multicollinearity. In addressing such issues, PLS regression (Partial Least Squares regression) offers an effective method through dimensionality reduction and principal component extraction; this minimizes redundant information among independent variables while maximizing the explained variance in the dependent variable. The characteristics of the data in this study make this method particularly suitable.

3.3. Environmental Predictors of Physical Activity (PLS Regression)

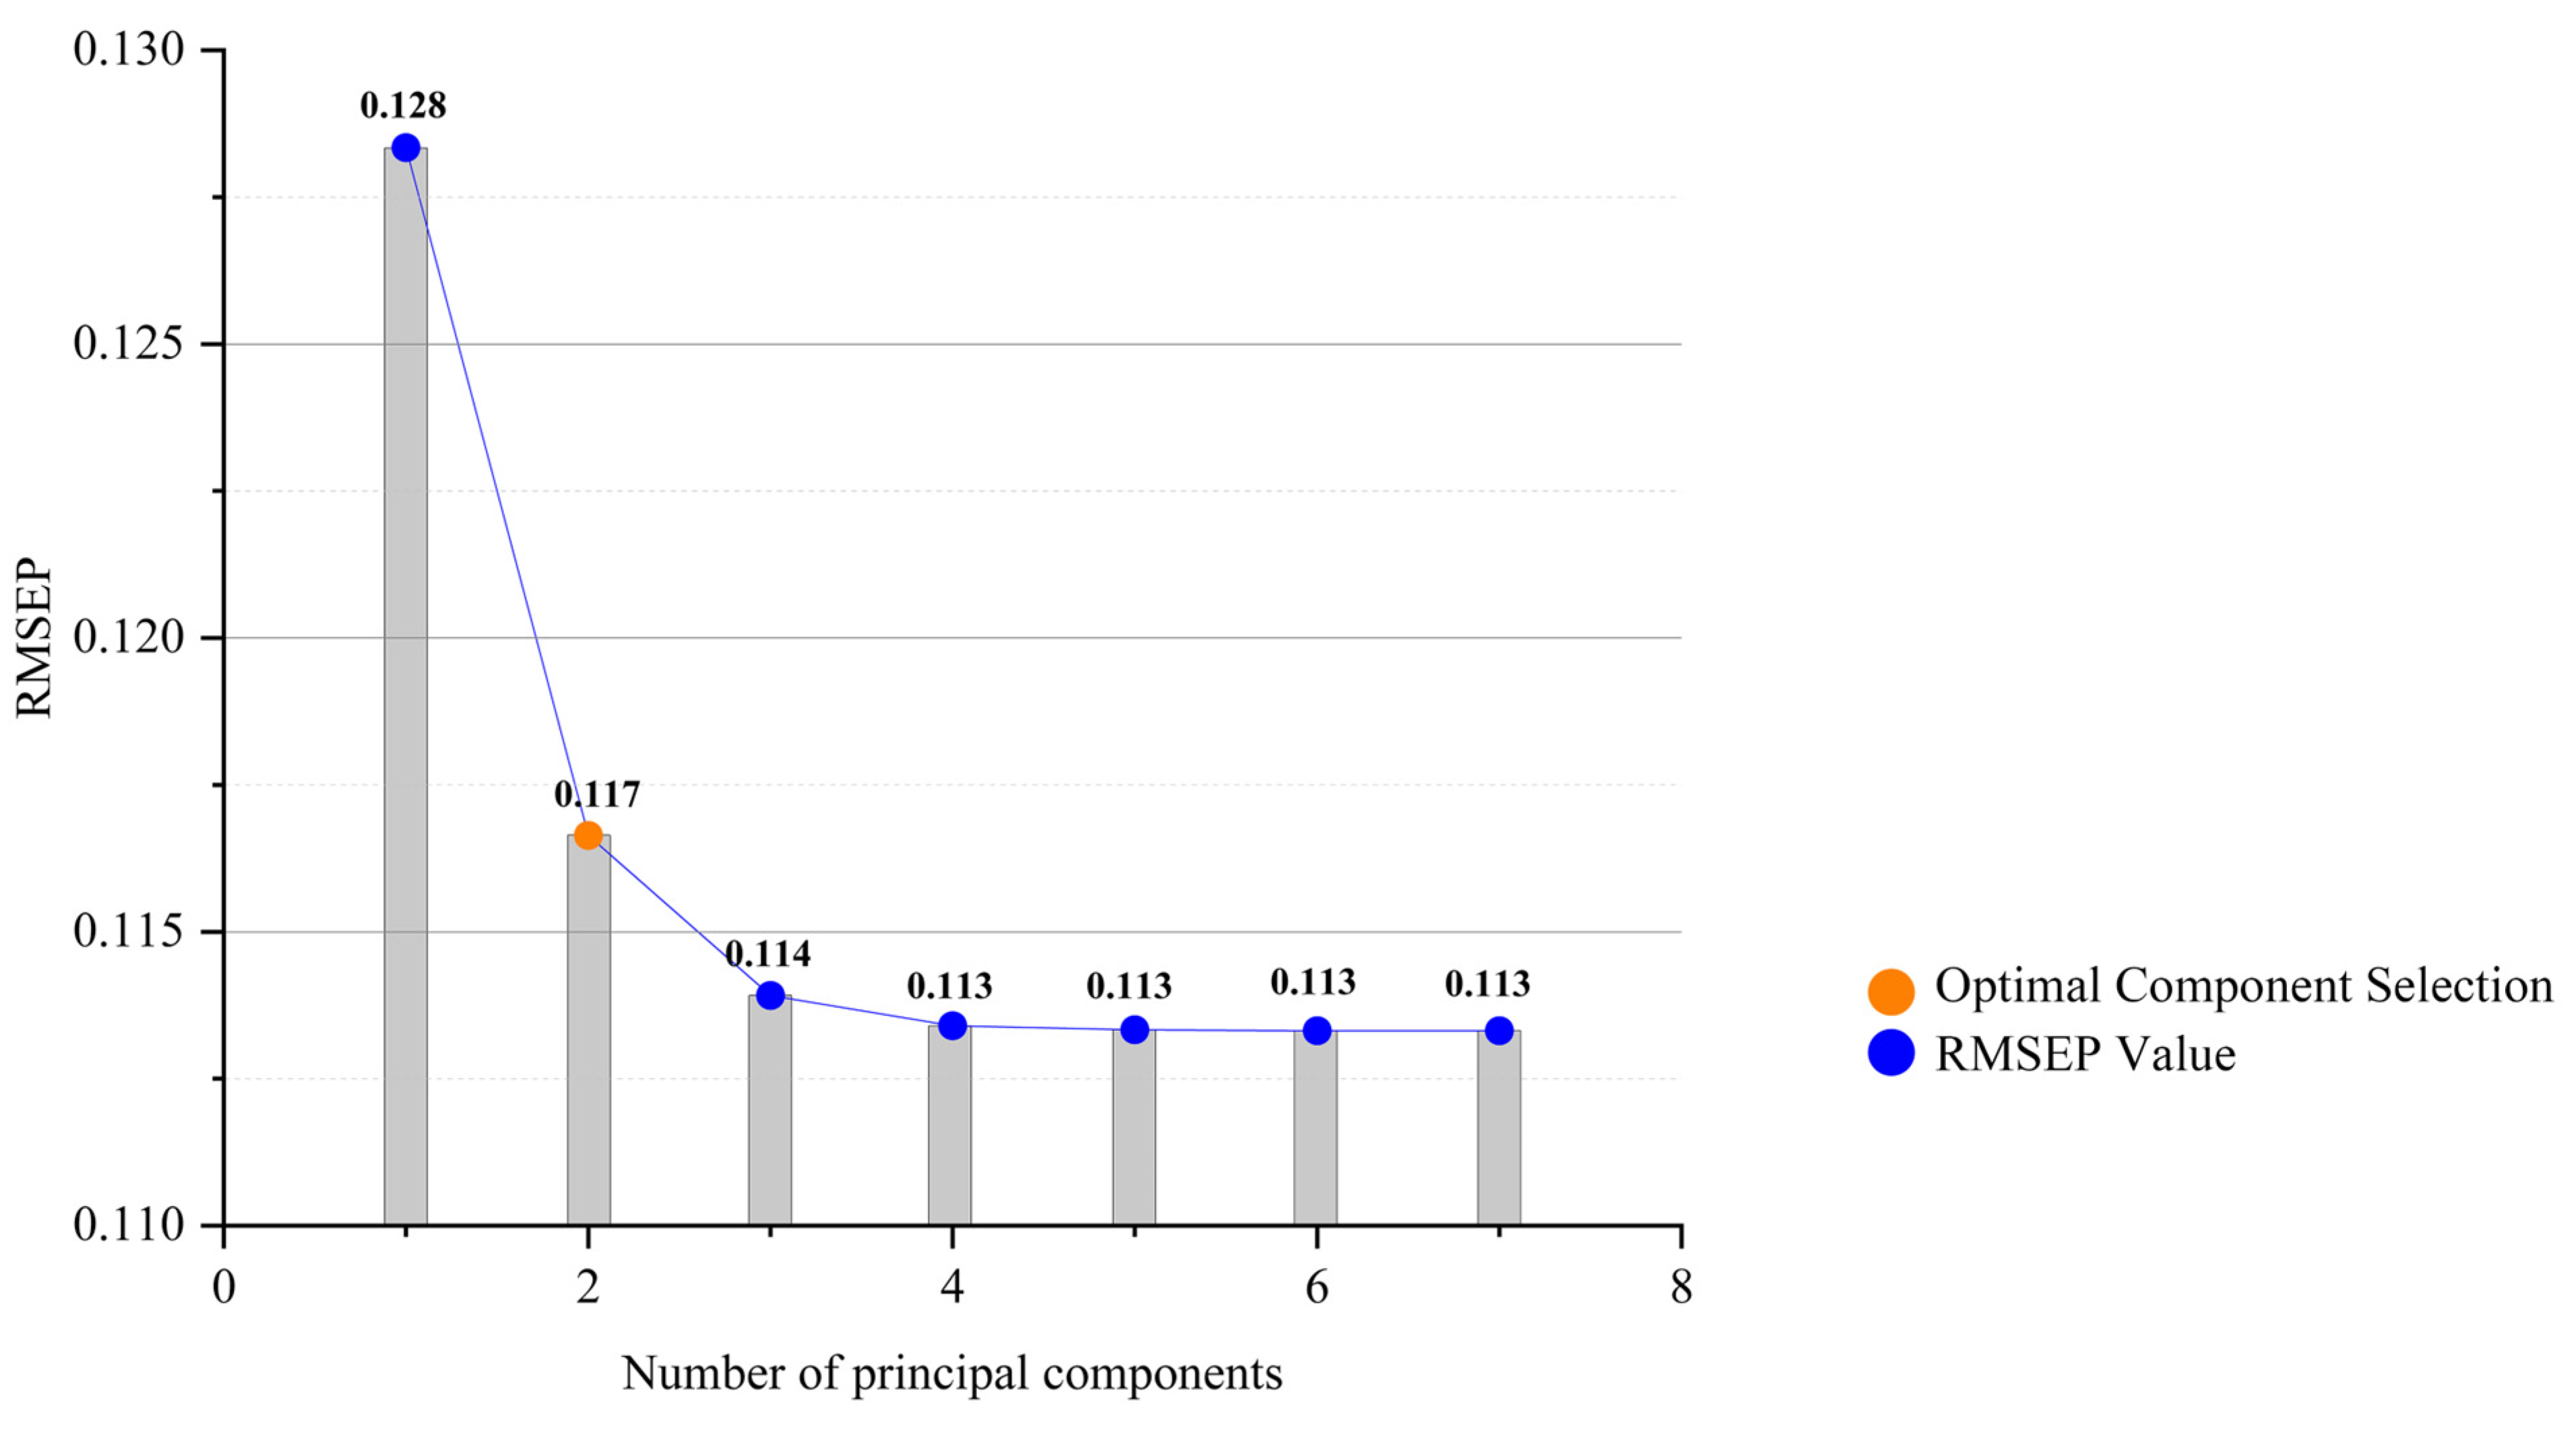
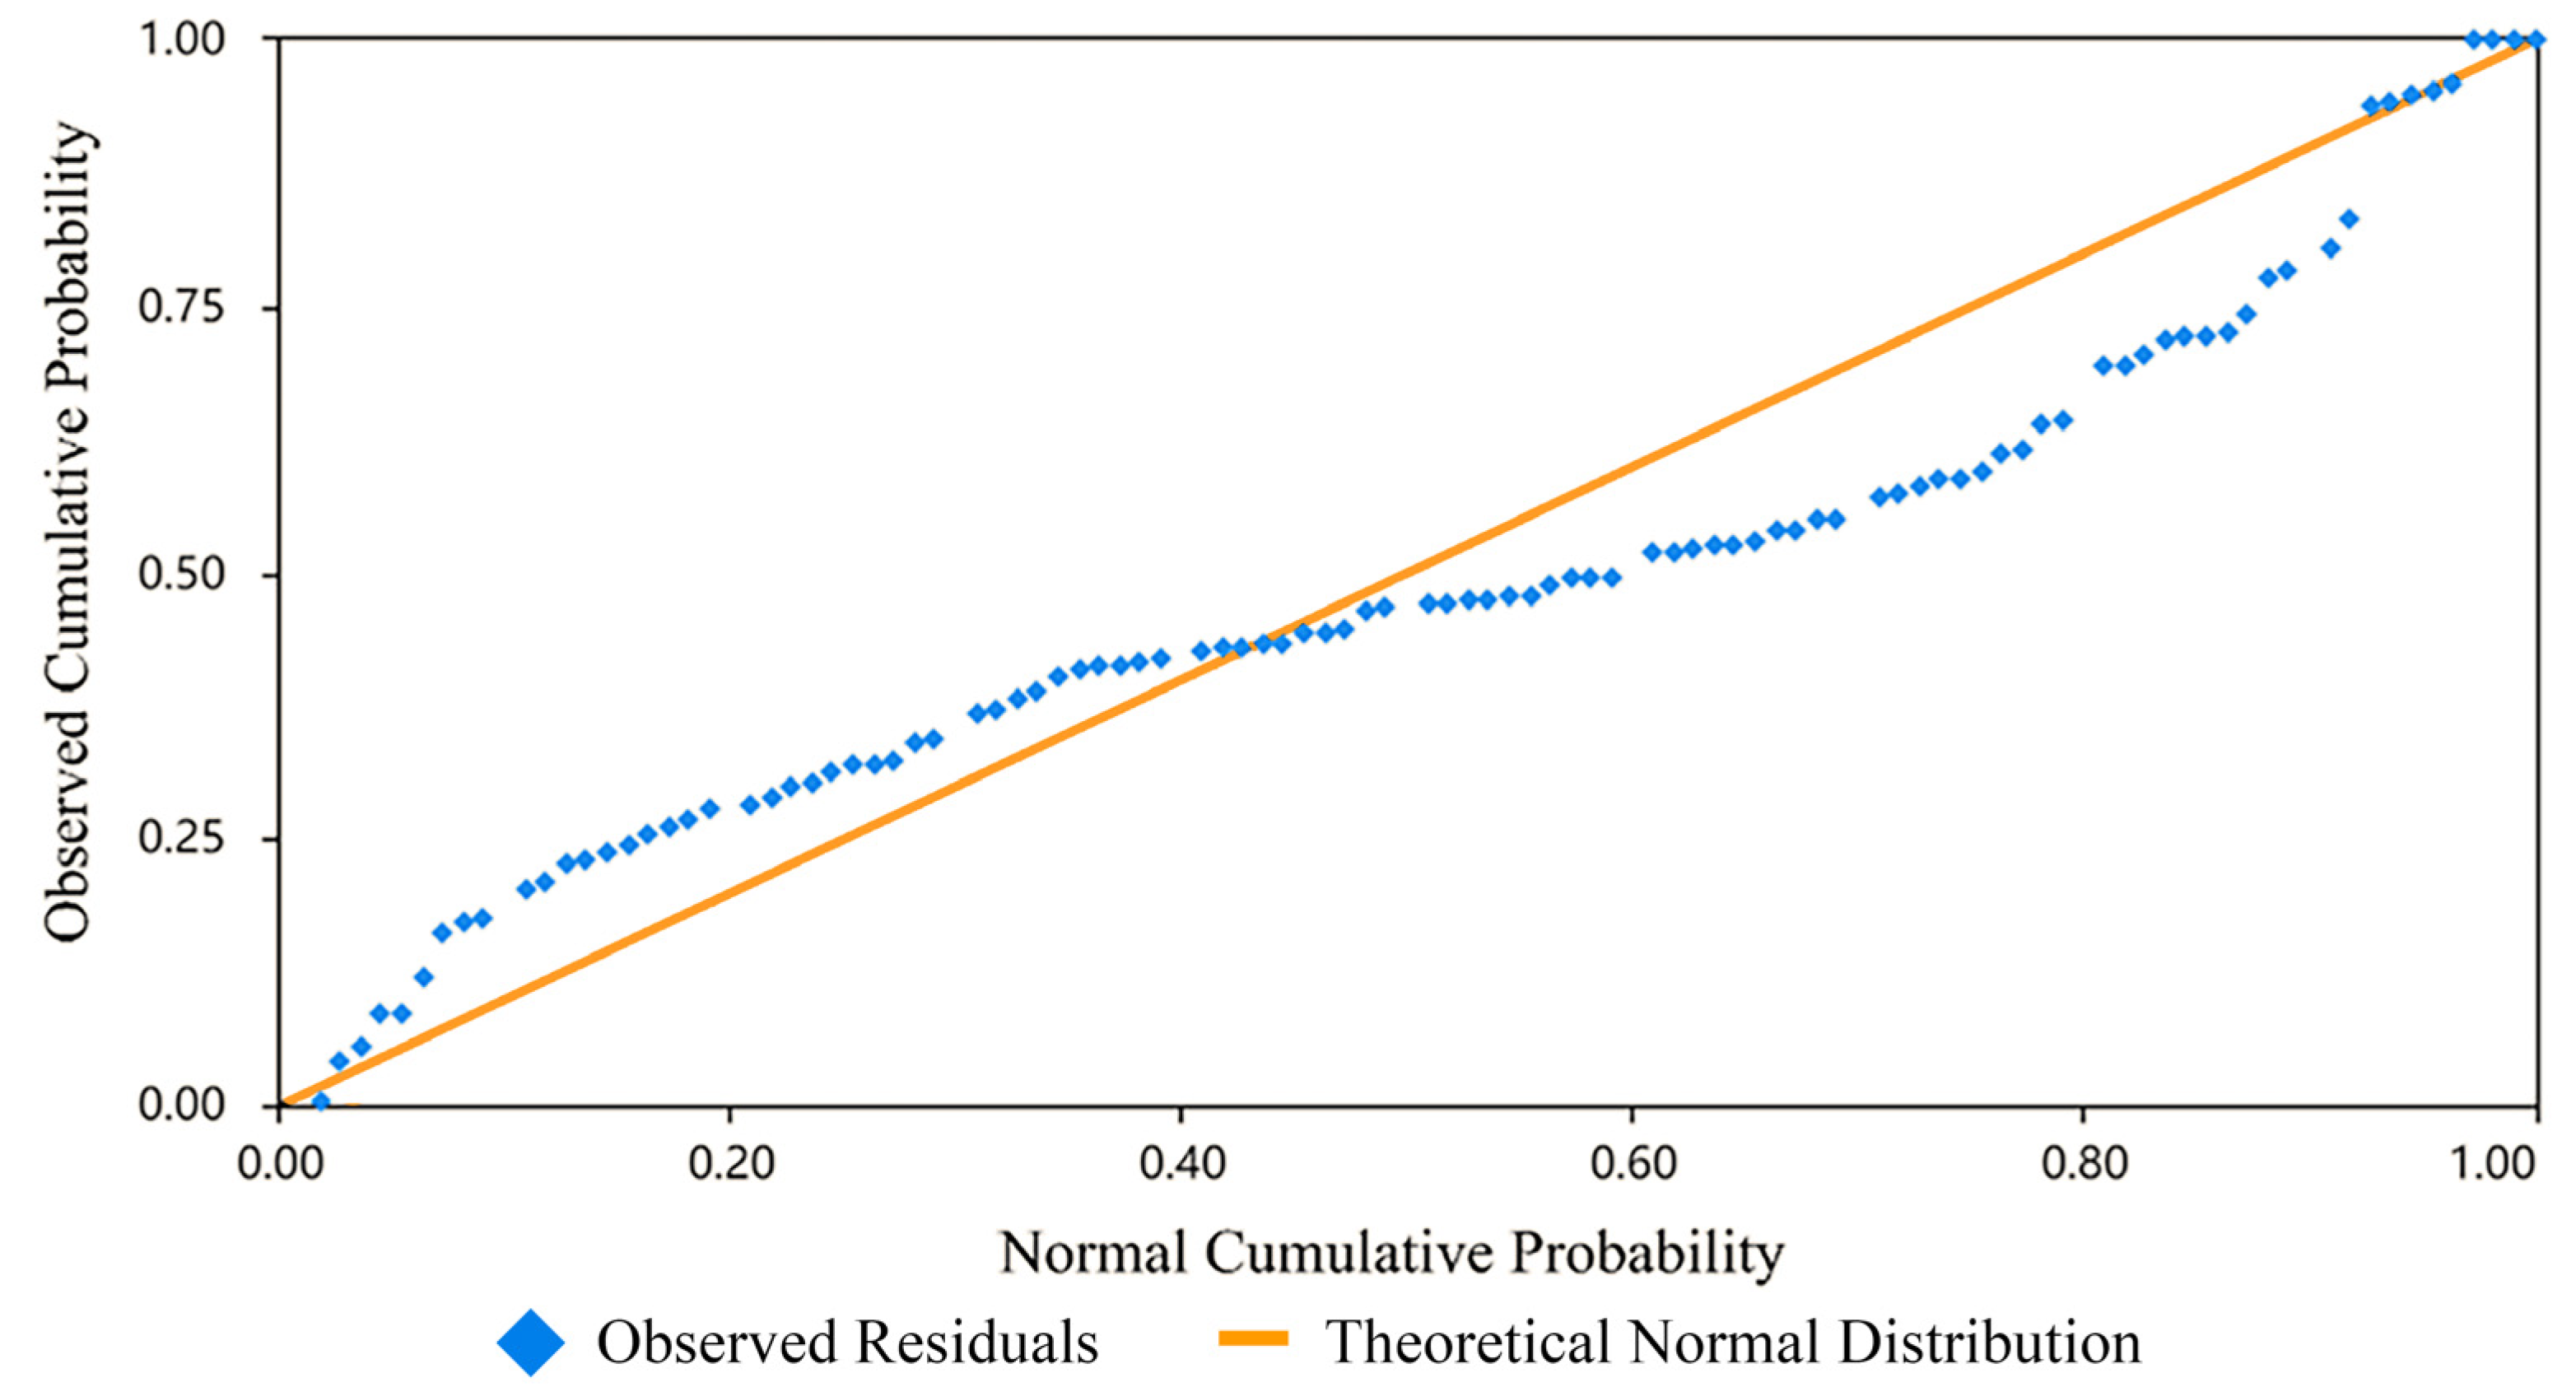
3.3.1. PLS Model Structure and Validity

Determining the optimal number of principal components and assessing model validity represent key steps in PLS regression analysis. This research evaluates how different numbers of principal components affect the model’s explanatory power (R2). Cross-validation is also performed based on the trend observed in the Root Mean Square Error of Prediction (RMSEP). The analysis of model residuals further supports the selection of the appropriate principal component count and helps assess the model’s validity.
Table 4 details the model’s explanatory power (R2) corresponding to different numbers of principal components. According to the results, the model’s explanatory power increased significantly (by 0.071) when the principal component count rose from 1 to 2. A further increase to 3 principal components yielded a smaller R2 improvement (0.016). Adding the fourth principal component resulted in only a slight R2 increase of 0.003, after which R2 stabilized with negligible further changes. Figure 4 illustrates the RMSEP trend, an indicator measuring the relative magnitude of residuals; lower RMSEP values signify better model fit. RMSEP decreased significantly (a 0.012 reduction) as the number of principal components went from 1 to 2. Incorporating the third principal component led to an RMSEP decrease of only 0.003, with changes becoming negligible upon adding the fourth and subsequent components. The P-P plot of model residuals is presented in Figure 5; its scatter plot closely follows a diagonal line, suggesting the data conforms to a normal distribution and thus satisfies the model’s underlying assumptions.
The effectiveness of the model is indicated by its relatively high explanatory power (R2 = 0.661), low prediction error (RMSE = 0.1166), and the normal distribution of its residuals; these factors suggest that selecting two principal components is the optimal choice. Two principal components sufficiently explain most of the dependent variable’s variation, achieving an R2 of 0.661, near the model’s maximum explanatory capacity. Secondly, the model maintains moderate complexity, as incorporating more principal components offers only marginal gains in both R2 and RMSEP. Such minimal performance improvements do not necessitate the increased complexity. Controlling the number of principal components also effectively helps prevent overfitting, thereby enhancing the model’s predictive accuracy while preserving its generalizability. Based on this comprehensive analysis, utilizing two principal components achieves a suitable balance between model performance and complexity reduction.

3.3.2. Contribution of Environmental Variables to Latent Components

Factor loadings (loading values) for study variables and principal components, extracted through the PLS regression method for dimensionality reduction, appear in Table 5. The contribution of each independent variable to the principal component is reflected by the factor loading coefficient; higher values signify a more significant effect of that variable on the principal component. In the analysis, Principal Component U1 demonstrated relatively high factor loadings primarily for independent variables concentrated in specific areas: park paved open space facilities, spatial form, and visual characteristics. For instance, significant contributions to U1 were produced by the number of bag storage facilities (0.46), area (0.44), and the number of green vegetation species (0.40). This pattern suggests U1 mainly reflects design features concerning spatial scale, facility provision, and visual characteristics. Principal Component U2, conversely, places greater focus on spatial accessibility and connectivity; these represent topological factors of space. Higher factor loadings for choice (0.56), connectivity (0.47), and integration (0.39) were observed for U2, indicating this component primarily reflects the paved open space’s connectivity structure and flow dynamics.

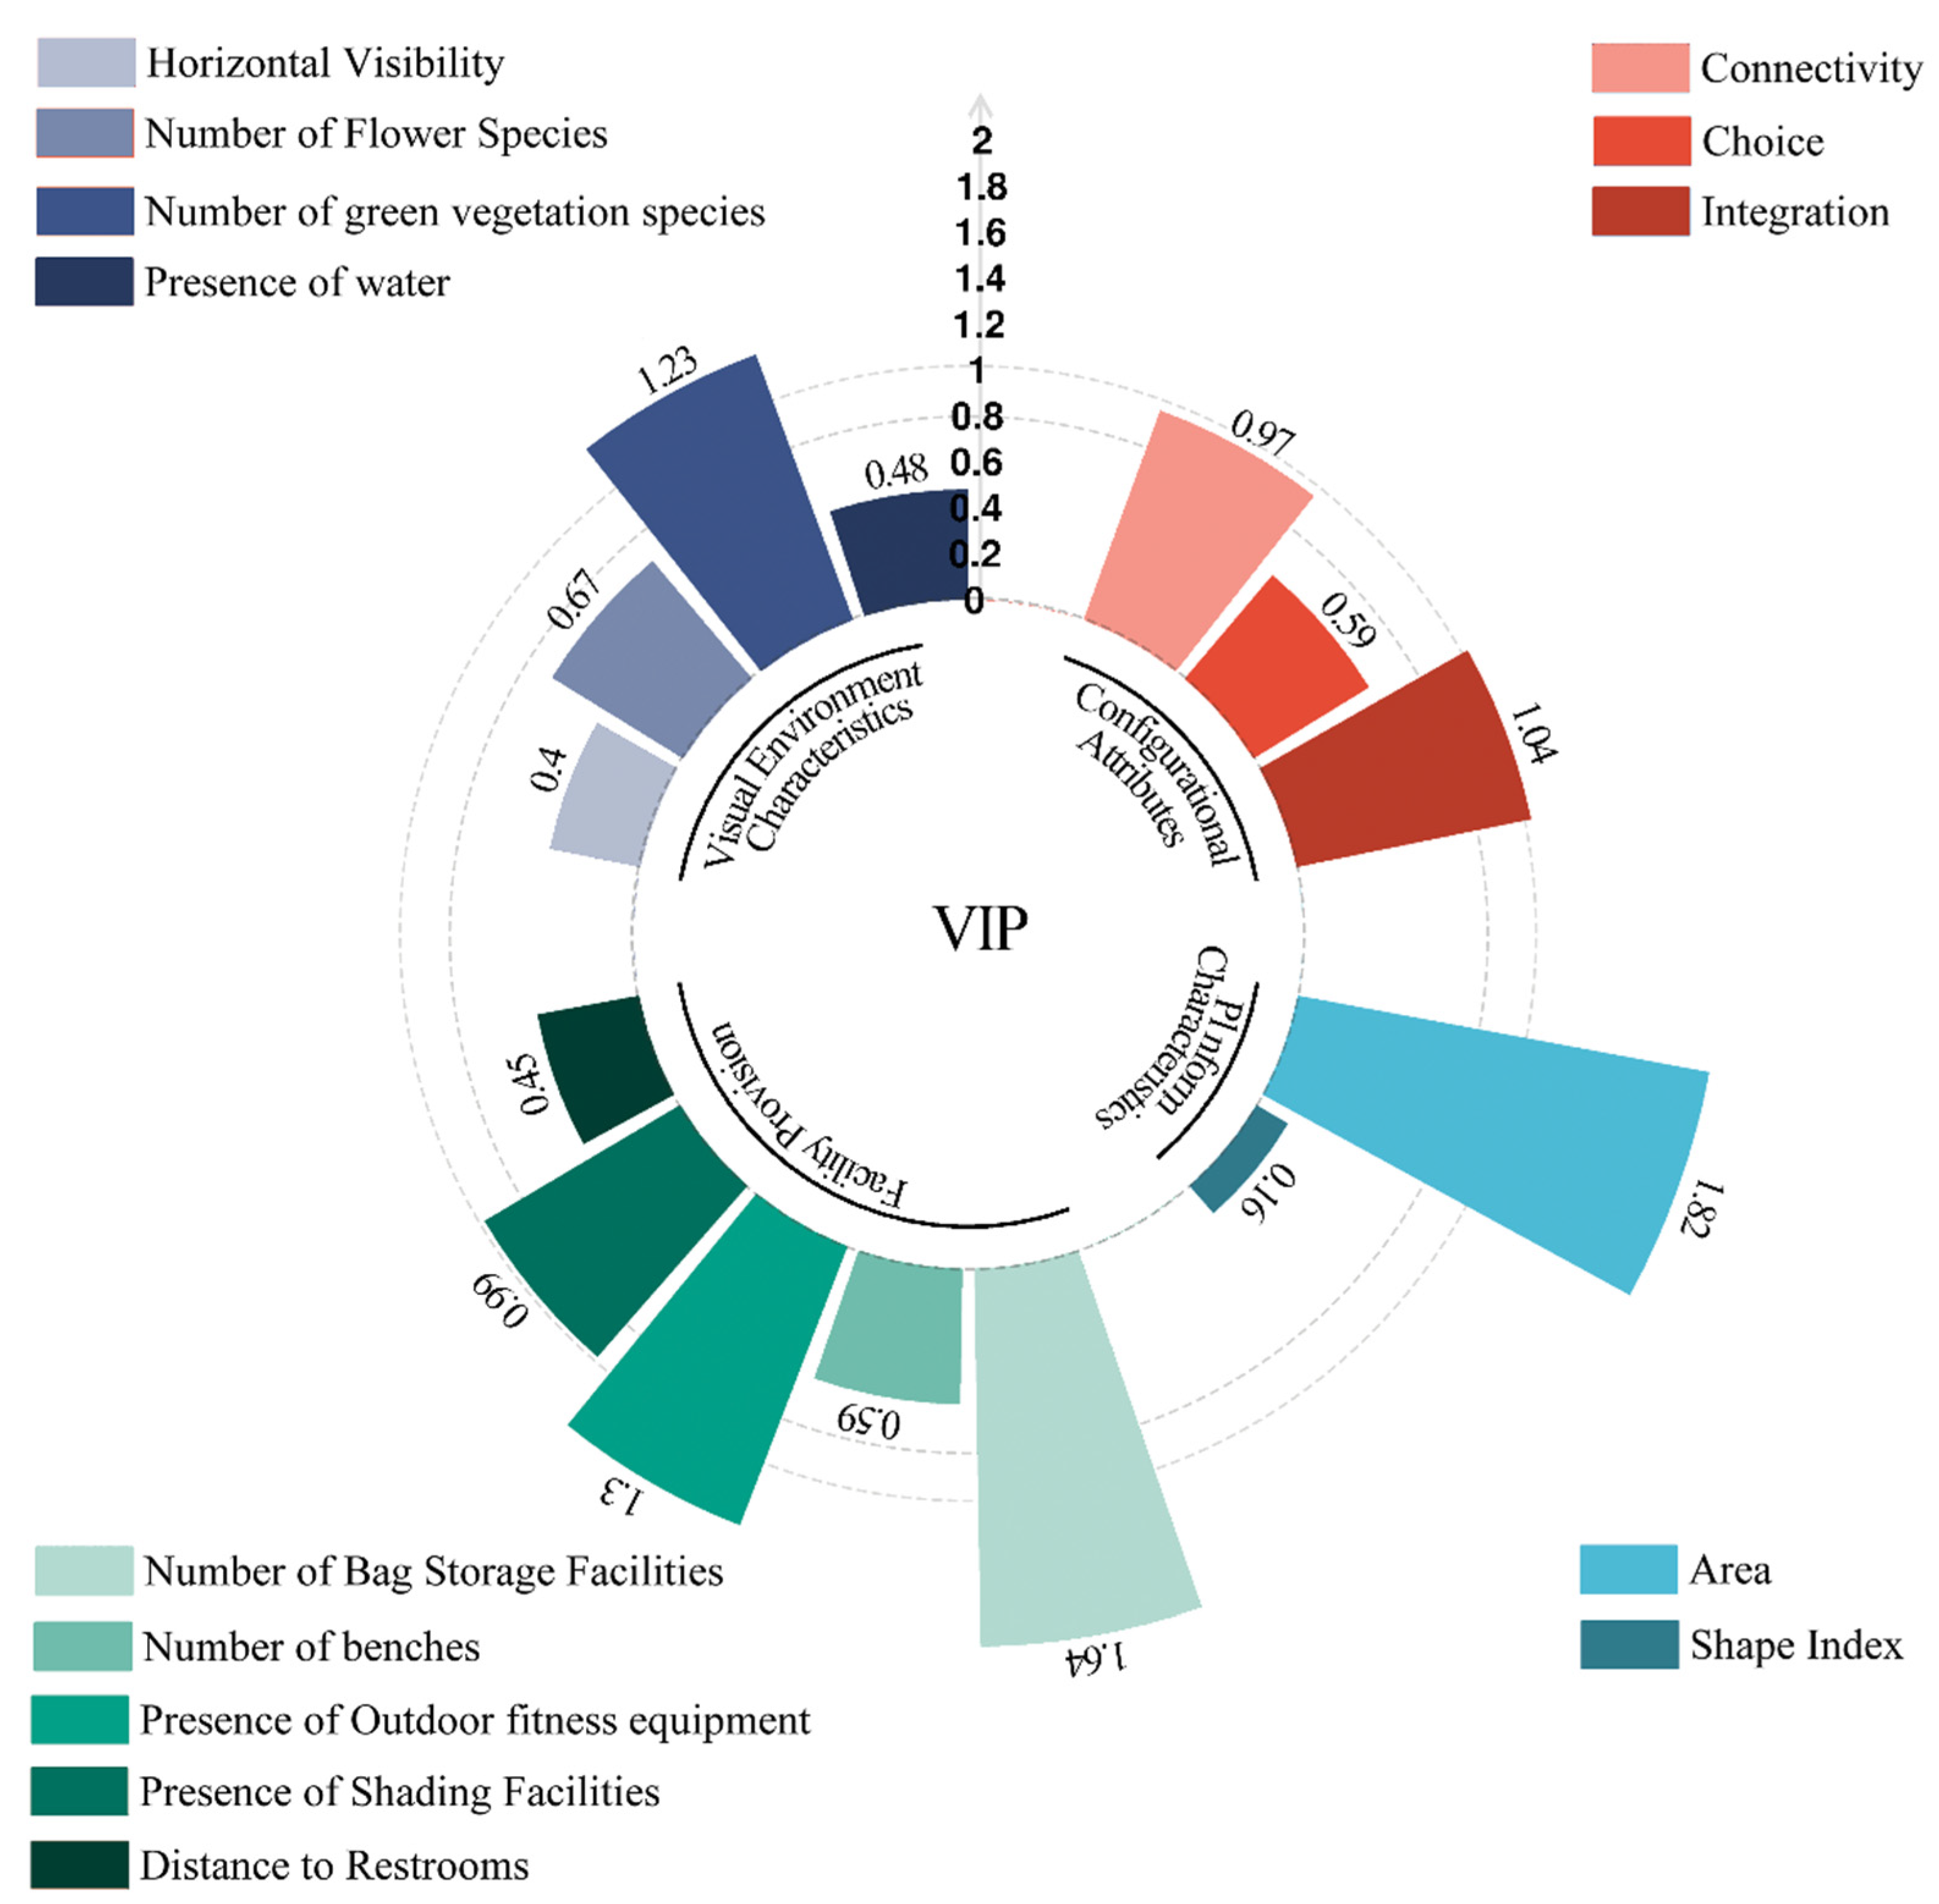
3.3.3. Variable Importance in Predicting Physical Activity (VIP)

An analysis of the effect of various paved open space environmental features on the calorie metabolism indicator was conducted with PLS regression in this study. Projection Importance (VIP) stands as a key metric in PLS regression; it measures the contribution of each independent variable to the principal component model’s explanatory power. The effect of a variable on the model is greater when its VIP value is higher, whereas a lower VIP value signifies lesser impact. Interpretation of VIP values is typically as follows: significant model contribution is signified by VIP > 1; moderate contribution corresponds to 0.8 < VIP ≤ 1; and an insignificant contribution, potentially justifying lower weight or disregard, is suggested by VIP < 0.8. The VIP values for the study variables (paved open space environmental characteristics) are reported in Figure 6. Among the structural characteristics of paved open spaces, site integration (VIP = 1.04) contributes significantly to the principal component model’s overall explanatory power. Connectivity (VIP = 0.97) also offers a contribution, albeit a lesser one. A smaller impact is observed for Choice (VIP = 0.59). Area (VIP = 1.82) appears as the most crucial independent variable concerning the spatial form of paved open spaces in the model. Its contribution is significant, potentially associated with the influence exerted by spatial scale and layout. The shape index (VIP = 0.16), conversely, offers a low contribution to the model’s explanatory power. Considering facility provision, the number of bag storage facilities (VIP = 1.64) ranks as the second most important variable following area. This variable contributes significantly to the model’s explanatory power. A significant effect on the model also comes from the presence of outdoor fitness equipment (VIP = 1.3). Meanwhile, the presence of shading facilities (VIP = 0.99) offers a moderate contribution. VIP values below 0.8 characterize the remaining facility-related variables, which suggests their contribution to the model is minor.
Regarding visual features, the number of green vegetation species (VIP = 1.23) contributes somewhat less to the model’s overall explanatory power compared to outdoor fitness equipment; however, it still fulfills a significant role. Minimal contribution to the model is indicated by the VIP values below 0.8 associated with other visual environmental variables.

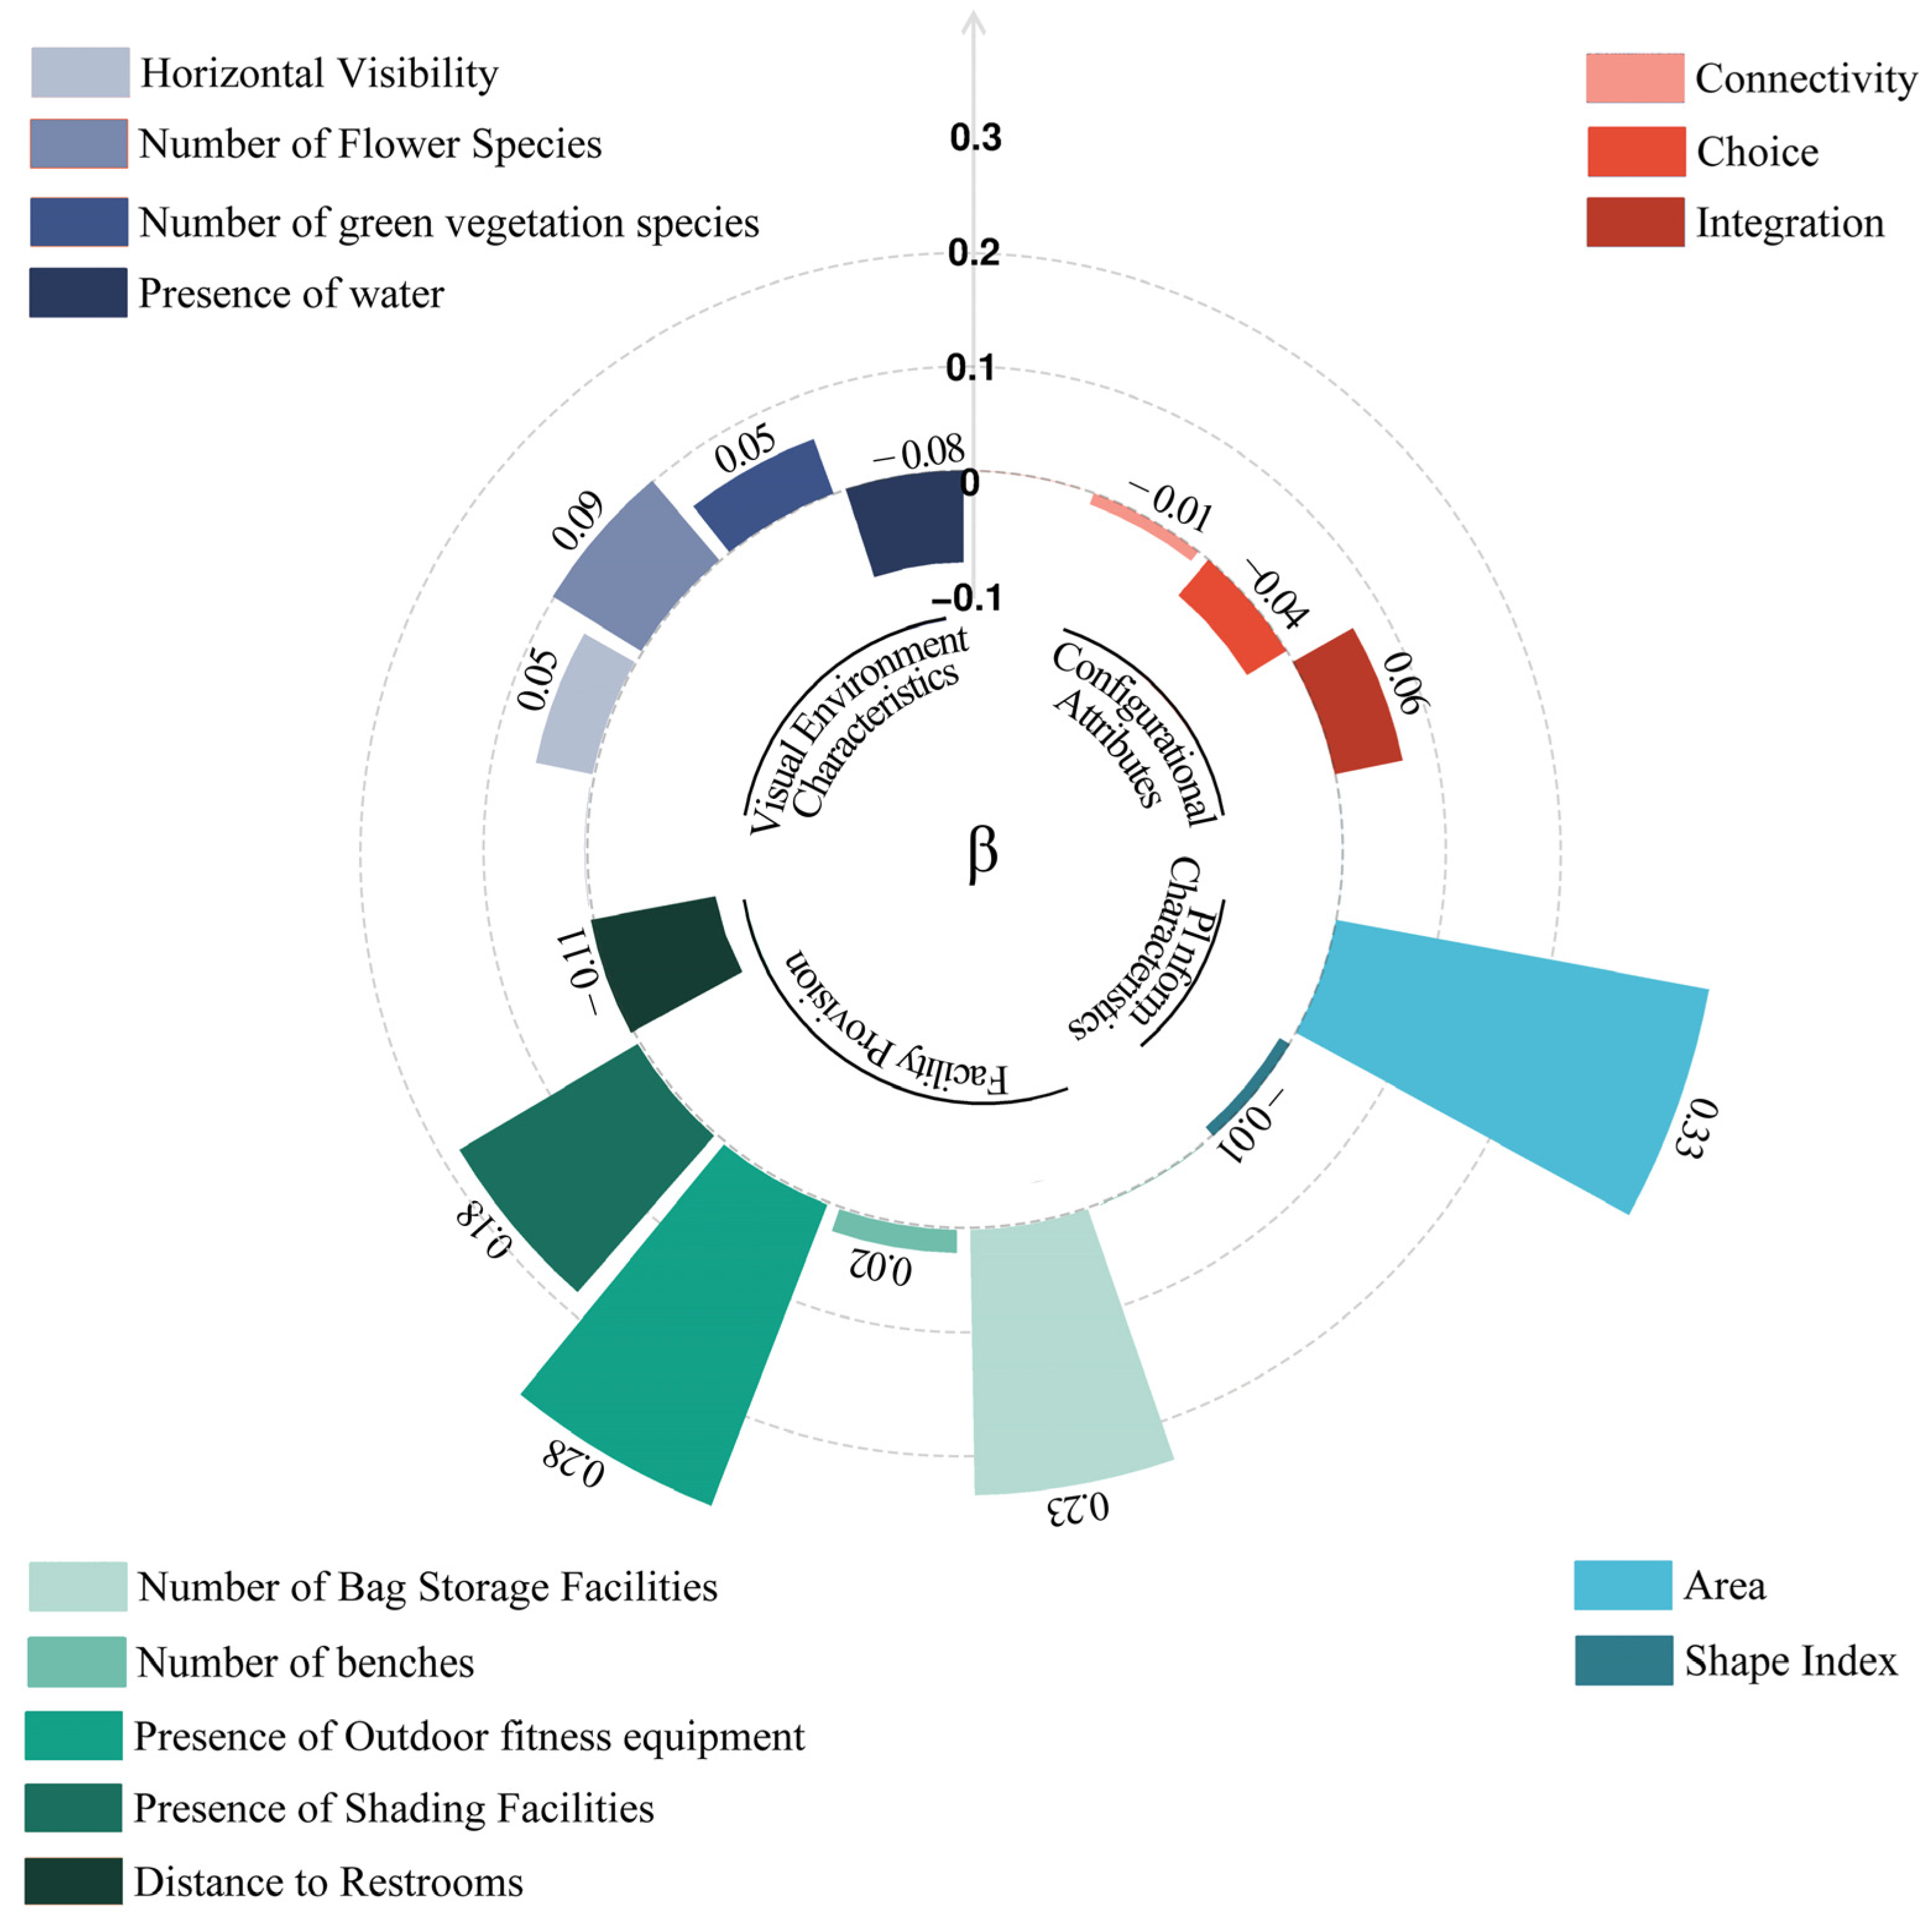
3.3.4. Direction and Strength of Predictor Effects (β)

Researchers utilize the regression coefficients from the PLS model to assess and compare how different independent variables relatively contribute to the dependent variable in the principal component model. Standardized regression coefficients for the study variables are presented in Figure 7. Integration (β = 0.06) exerts the greatest impact on the dependent variable among park space structural characteristics. Permeability (β = −0.04) and connectivity (β = −0.01) follow in terms of impact. Integration appears as the most influential factor in the model according to these results. Area (β = 0.33) demonstrates the most significant effect on the dependent variable concerning the planform of paved open spaces; this indicates a significant positive contribution. Conversely, the shape index (β = −0.01) demonstrates a minimal effect. In facility provision, the largest impact is derived from the presence of outdoor fitness equipment (β = 0.28). Following this are the number of bag storage facilities (β = 0.23) and the presence of shading facilities (β = 0.18). Smaller contributions are exhibited by the number of benches (β = −0.02) and the distance to restrooms (β = −0.11). The number of flower species (β = 0.09) holds the greatest influence regarding the visual features of paved open spaces. The presence of water (β = −0.08) follows in influence. The number of green vegetation species (β = 0.05) and horizontal visibility (β = 0.05) also contribute, though to a lesser extent.

4. Discussion

This section discusses how different features of paved open spaces affect physical activity among older adults, structured around four main categories: configurational attributes, planform characteristics, facility provision, and visual environment characteristics.

4.1. Integration Promotes Seniors’ Physical Activity More Than Other Configurational Features

One of the primary findings of this study is that configurational characteristics of paved open spaces significantly affect the physical activity of senior park users. Integration (VIP = 1.04, β = 0.06), specifically, contributes significantly to the principal component model’s explanatory power. It also demonstrates a positive effect on calorie metabolism. An active role in promoting energy expenditure appears to be played by sites with higher integration, based on this finding. The association of higher integration with higher site visitation frequency has also been demonstrated in previous studies [58,59]. The concept of integration reflects how connected a unit is in the spatial network. When a unit has a higher integration value, it indicates easier connection to other units. Such units are typically situated in the network’s core areas (e.g., squares, main roads), often representing hubs for traffic and pedestrian flow. Therefore, increased accessibility characterizes spaces with higher integration. Their resulting higher visitation frequency then further contributes to elevating the site’s calorie metabolism rate. Optimizing the distribution of open space nodes and enhancing their centrality in the park’s topological network represents a key strategy during the planning of new sites or redesign of existing spaces. This approach can attract more visitors for physical activities, thus boosting the overall energy metabolism rate. Connectivity’s VIP value (VIP = 0.97, β = −0.01) approaches the significance threshold. This indicates a partial explanatory contribution to the principal component model. However, a negative and near-zero regression coefficient is observed. This suggests only a weak independent effect of connectivity on calorie metabolism, potentially including a slight negative influence. Multicollinearity between connectivity and other variables could be responsible for this phenomenon. When multiple variables compete to explain similar variations, the independent contribution of connectivity in the model is weakened. Connectivity’s VIP value is close to significant; however, its weak β coefficient means its actual impact on calorie metabolism is rendered negligible. Choice (VIP = 0.59, β = −0.04) has a VIP value below 0.8. This indicates only a small overall contribution to the model. The low β coefficient associated with Choice offers further suggestion that its effect on calorie metabolism is relatively weak. We can therefore consider the actual role of Choice in explaining the dependent variable to be negligible.

4.2. Larger Paved Area Increases Physical Activity, Shape Has Little Effect

A significant effect on senior park users’ PA is observed from the planform characteristics of paved open spaces. Area (VIP = 1.82, β = 0.33) specifically offers the largest contribution among all variables to the principal component model’s explanatory power. In addition, it exhibits a positive effect on calorie metabolism. Barand’s study [64] also offers support for this conclusion. A potential reason involves larger spaces typically offering more spacious and open activity areas. These areas grant seniors increased freedom of movement during physical activities, potentially enhancing their comfort. Reduced risk of accidental collisions and interference from overcrowding is another benefit of larger spaces, leading to improved safety. Seniors are also offered a broader array of PA options in these expansive areas. This allows choices such as walking, jogging, or yoga without spatial constraints. Encouragement for seniors to engage more frequently in PA in larger paved open spaces results from these factors, thus resulting in higher calorie metabolism rate.
Designers consider a site’s planform characteristics a crucial design element. Theory suggests these characteristics significantly affect user perceptual preferences, attract higher visitation frequency, and then boost PA [65]. This study’s empirical results present a crucial comparison, however, as they indicate that the shape index (VIP = 0.16, β = −0.01) has a VIP of merely 0.16, suggesting its contribution to the overall model is negligible. Furthermore, the low β value accompanies the finding of no significant effect from the shape index on calorie metabolism. A further step in the study involved categorizing the sample into four groups based on area size. Univariate linear regression was then performed (Table 6). Observation across these different area conditions indicated no effect of the shape index on calorie metabolism. One potential explanation involves the influence exerted by a combination of factors—planform characteristics, elevation, and top surface variations—on senior park users. A singular planform characteristic, viewed in isolation, might not effectively impact their preferences. The implication here is that attempts to enhance senior park users’ PA merely by complicating site planform characteristics might yield limited effectiveness.

4.3. Bag Storage, Fitness Equipment, and Shade Facilities Boost Activity Levels

Our analysis concerning facility provision in paved open spaces indicated a positive effect on calorie metabolism associated with three specific features. These features include the number of bag storage facilities, the presence of outdoor fitness equipment, and the presence of shading facilities. Specifically, the contribution of the number of bag storage facilities (VIP = 1.64, β = 0.23) to the explanatory power of the principal component model was significant, surpassed only by area. In addition, a strong positive effect on calorie metabolism is indicated by the regression coefficient. This likely occurs because lowering external burdens reduces participation barriers. Therefore, individuals may exhibit enhanced willingness to engage in PA and demonstrate more sustained participation. Many senior park users typically carry bags, often as they shop or run errands following exercise. Therefore, an adequate provision of Bag Storage Facilities enables them to store personal belongings (e.g., bags, water bottles, coats) conveniently and hygienically, free from concerns of hygiene or safety. By reducing the burden associated with carrying personal items, older adults become more inclined to engage in dynamic physical activities in these paved open spaces. This increased engagement, accordingly, leads to a significant increase in calorie metabolism in these specific areas.
The study demonstrated that the presence of outdoor fitness equipment (VIP = 1.64, β = 0.28) holds a VIP value exceeding 1. This value signifies a major contribution to the model’s overall explanatory power. A strong positive impact on the dependent variable, calorie metabolism, is further demonstrated by the regression coefficient, resulting in significantly improved metabolic performance for senior park users. This conclusion finds support in previous research [66,67,68]. Firstly, older adults are offered a structured, simple, and convenient exercise option through fitness equipment, which also offers a high degree of safety. Engagement in PA faces reduced psychological and physical barriers due to this provision, thereby motivating participation among senior park users and encouraging positive feedback loops. Secondly, fitness equipment in many Chinese parks, including the study site, is typically arranged in sets. Exercise options at varying intensity levels are offered by these diverse machines, which also consist of multiple exercise zones. This variety allows seniors to select activities aligning with their personal preferences and physical states, promoting adaptive exercises and enhancing their enthusiasm for PA. Thirdly, senior park users generally carry out low- to moderate-intensity aerobic exercises when utilizing park fitness equipment. Their physical needs are well-matched by this exercise type, which aids in extending the duration of their PA. In summary, the exercise threshold is effectively lowered by the structured design and low difficulty of fitness equipment, thus establishing a safe and sustainable exercise environment for older adults.
Research findings suggest the presence of shading facilities (VIP = 0.99, β = 0.18) contributes significantly to the model’s explanatory power; its VIP value surpasses 0.8, indicating a significant impact. Its positive effect on calorie metabolism in paved open spaces is further highlighted by the relatively high regression coefficient. Two studies conducted in Asia yielded results consistent with this finding, indicating that the presence of shading facilities positively affects the metabolic equivalent of energy (MET) among senior park users [11,27]. Research on thermal comfort for older adults in outdoor environments further supports this finding. Studies have shown that shading significantly affects the microclimatic conditions (e.g., temperature, humidity, radiation), and that fully or partially shaded areas can enhance thermal comfort, physiological relaxation, and psychological well-being [69,70]. These improvements are particularly important during periods of high temperatures, when heat-related discomfort can discourage outdoor activity. Shaded areas have been found to increase dwell time and promote more frequent use of parks by older adults under such conditions. Older adults, in particular, tend to prefer engaging in physical activities in cooler and more comfortable environments, especially during hot weather. The presence of shading structures helps create localized microclimates that mitigate thermal stress and discomfort caused by physical exertion (e.g., excessive sweating). This, in turn, encourages more sustained or vigorous activity, thereby contributing to greater energy expenditure.
The importance of the number of benches for the attractiveness and comfort of paved open spaces has also been emphasized in several studies [29,71]. According to exercise physiology’s recovery theory, appropriate rest periods can lengthen the total activity duration while decreasing fatigue perception. This study, however, did not identify a significant effect of the number of benches on senior park users’ calorie metabolism (VIP = 0.59, β = 0.02). The high prevalence of benches at the studied site (mean = 4.255, median = 1) might constrain this result. The variable’s effect in the model may have been reduced owing to the limited variability in the number of benches. Moreover, the results concerning the distance to restrooms (VIP = 0.45, β = −0.11) indicate limited importance to the overall model, as indicated by its relatively low VIP value. Nevertheless, a negative effect on PA is suggested by the high negative regression coefficient when distance to restrooms increases, aligning with prior research [12,29]. It is possible that the significance of these variables was underestimated or that they possess a non-linear relationship; future detailed site experiments or contextual research should investigate this further.

4.4. More Green Vegetation Species Enhance Seniors’ Physical Activity

In terms of visual environment characteristics, a significant positive effect on the metabolic equivalent of energy (MET) for senior park users is derived from the number of green vegetation species (VIP = 1.23, β = 0.05), a finding consistent with existing studies [72]. PA is cultivated in a more attractive and enjoyable environment created by a diverse array of green vegetation. The Biophilia Hypothesis hypothesizes an inherent human preference for natural settings; exposure to such landscapes can enhance mental well-being, lower stress, and stimulate the desire for exercise [73]. Similarly, the Restorative Environment Theory proposes that natural landscapes offer psychological restorative benefits, inducing feelings of relaxation and pleasure in senior park users during nature interaction. This interaction, therefore, may extend their park visitation time and the duration of their PA [74]. The park’s appeal is enhanced by varied green vegetation species, motivating senior park users towards activity participation. This could increase the willingness of senior park users to perform PA in these paved open spaces, encouraging more active engagement in higher-level physical activities and thereby boosting calorie expenditure. It should be noted that the relatively high VIP value for the number of green vegetation species contrasts with its comparatively low PLS regression coefficient. Accordingly, the study performed additional univariate robust regression analysis. This analysis discovered a significant effect of this variable on the metabolic equivalent of energy (MET) (β = 0.435, p < 0.01) (Table 7). This finding implies the effect of green vegetation species variety on calorie metabolism might be indirect. Through correlation analysis, this variable demonstrated significant relationships with the number of bag storage facilities (r = 0.55, p < 0.01), the presence of shading facilities (r = 0.33, p < 0.01), and horizontal visibility (r = 0.29, p < 0.01). In the PLS model, its regression coefficient might therefore be attenuated by multicollinearity.
Furthermore, although this study treated shading facilities and green vegetation species as separate environmental variables, it is important to note that shade-providing trees, which are classified under green vegetation species, also serve a shading function in practice. These natural elements may contribute to thermal comfort in a manner similar to artificial shading structures. However, this study did not distinguish paved open spaces based on the presence of tree shade, which may have limited our capacity to precisely evaluate the impact of natural shading on senior physical activity levels. Considering the importance of thermal comfort and rest environments for older adults, future research could further classify open spaces into “with tree shade” and “without tree shade” categories to examine their respective effects. Such an approach would allow for more targeted and climate-responsive park design strategies that promote healthy aging.
Previous research indicates that the number of flower species aids in promoting PA among senior park users [27,75]; whereas the presence of water is thought to negatively affect PA [41]. In this study, however, their importance in the PLS regression model was low, notwithstanding univariate robust regression analysis indicating significant influences of the number of flower species (β = 0.257, p < 0.05) and the presence of water (β = −0.184, p < 0.05) on metabolic equivalent of energy (MET) in senior park users (Table 7). Neither the number of flower species (VIP = 0.67, β = 0.09) nor the presence of water (VIP = 0.48, β = −0.08) demonstrated significant effects in the PLS model. Competition among multiple variables for explanatory power in the PLS regression might explain this, potentially diluting their independent contributions. Additional correlation analysis demonstrated significant correlations for the number of flower species with the number of green vegetation species (r = 0.31, p < 0.01) and the number of bag storage facilities (r = 0.31, p < 0.01). Significant correlations were found for the presence of water with horizontal visibility (r = 0.58, p < 0.01), Area (r = 0.22, p < 0.05), number of flower species (r = 0.22, p < 0.05), and shape index (r = 0.22, p < 0.05). The previous inference gains further support from these correlations, suggesting that these two environmental features lack significant effect on the PA of senior park users.
Besides, the research findings indicate that horizontal visibility (VIP = 0.4, β = 0.05) exerts a minimal, almost negligible, effect on MET. Horizontal visibility’s effectiveness, suggested in prior studies [27,75], was not corroborated in this research by either general linear regression or PLS regression models. A possible explanation is that horizontal visibility’s effect may be context-dependent, perhaps relevant only during specific activity types.

4.5. Practical Implications for Age-Friendly Open Space Design

The findings of this study offer several valuable implications for the age-friendly planning and design of paved open spaces in urban parks. First, configurational attributes of space—particularly spatial integration—were positively associated with physical activity levels among older adults. Spaces with higher integration were more accessible and frequently visited, leading to higher overall energy expenditure. Planners should therefore prioritize the spatial centrality of activity nodes in future park designs by optimizing their distribution and enhancing their connectivity within the overall spatial network. Second, planform characteristics, especially area, played a significant role in supporting older adults’ activity. Larger paved open spaces provided more room for diverse physical activities and social interaction. While complexity of shape showed less consistent influence, ensuring that space is sufficiently wide and unobstructed remains essential for usability and safety. Third, in terms of facility provision, the presence of bag storage facilities, outdoor fitness equipment, and shading infrastructure were positively associated with increased metabolic equivalent levels. This highlights the need to prioritize practical and comfort-enhancing facilities in age-friendly open spaces—especially shaded areas to mitigate heat, and storage to facilitate ease of use. Finally, the visual environment characteristics—particularly the number of green vegetation species—demonstrated a positive relationship with older adults’ physical activity. This suggests that enhancing planting diversity in paved open spaces not only improves aesthetic quality but also encourages longer and more frequent park use by older adults. Together, these findings support a multidimensional environmental design approach that integrates structural, spatial, functional, and visual factors to better support healthy aging in urban environments.

5. Limitations and Future Directions

This study is not without certain limitations. Firstly, causal inferences cannot be drawn because the collected data are cross-sectional. Secondly, the study variables did not consist of certain potential confounding factors, including sound and smell. Thirdly, the generalizability of the findings is limited by the study’s focus on three medium-sized parks in Xi’an, a city with a temperate continental monsoon climate. Seasonal variations in weather conditions—such as extreme heat in summer or cold in winter—may influence older adults’ physical activity levels and affect the applicability of the results to other time periods. Fourthly, data collection primarily considered the daily routines of older adults and was therefore conducted only on weekdays, excluding weekends. Since older adults’ physical activity patterns may differ on weekends due to influences such as increased family interactions or peak park crowding, the findings may not be fully generalizable to weekends or public holidays. Fifthly, inaccuracies in research data might have occurred due to the inherent margin of error in mobile GPS devices, which could lead to some positioning points being incorrectly mapped outside paved open spaces. Sixthly, homogeneity was observed for some variables (e.g., the number of benches) in the chosen park samples, potentially limiting the dataset’s variability. Finally, although this study found a significant association between green vegetation species diversity and increased PA levels among senior park users, the categorization of vegetation types (e.g., shade trees vs. non-shade-providing vegetation) was not further differentiated. Since shade trees provide both visual greenery and thermal comfort, they may represent a particularly influential subset of vegetation. This dual function suggests that shade trees might play a critical role in promoting longer and more intense PA in warm seasons, especially for thermally sensitive older adults.
Future research is therefore encouraged to distinguish between different types of green vegetation and examine their specific effects on PA. Such work could offer more precise design guidance for creating supportive and age-friendly park environments. Future analyses should include more heterogeneous parks across broader geographical areas and seasons. Conducting comparative studies at various spatial levels is also recommended to achieve a more thorough understanding of the effect of paved open space environmental characteristics on PA.

6. Conclusions

This study systematically explores, for the first time, how environmental characteristics of paved open spaces in urban parks affect PA among older adults. We developed a multidimensional analytical framework by integrating key factors that previously received limited attention, including configurational characteristics, planform characteristics, and the availability of bag storage facilities. This framework comprises spatial structure, planform characteristics, facility provision, and the visual environment. To comprehensively explore the mechanisms through which these environmental characteristics influence PA in older adults, a multi-source data collection approach was implemented. This method combined GPS trajectory tracking with standardized questionnaires; then, the PLS regression modeling was applied for analysis. The results demonstrate a significant effect of integration in spatial structure characteristics (VIP = 1.04) on the PA of older adults. Such a finding confirms the applicability of the space syntax theory for predicting behavior at the park scale. Concerning planform characteristics, positive contributions to PA levels were associated with larger areas (VIP = 1.82). Similarly, adequate bag storage facilities (VIP = 1.64) and the availability of outdoor fitness equipment (VIP = 1.3) positively influenced PA. In the visual environment characteristics, analysis indicated a positive correlation between a higher number of green vegetation species (VIP = 1.23) and older adults’ PA. Collectively, these results lend strong empirical support to the principles of age-friendly park design; whereas factors previously subject to debate, including the number of flower species (VIP = 0.67) and the presence of water (VIP = 0.48), did not demonstrate significant effects on PA among older adults in this study. In addition, the shape index (VIP = 0.16) failed to exhibit a significant effect during empirical analysis, while theoretical considerations suggested it should play a key role. In general, this research contributes to bridging existing knowledge gaps regarding the effect of park environmental characteristics on the PA of older adults specifically at the activity-area level. It also offers theoretical backing and practical design guidance for creating age-friendly interventions in park environments. The research findings present novel perspectives on the relationship between paved open space environments in parks and PA among older adults. Moreover, they supply scientific evidence crucial for informing future park design, policy development, and health promotion strategies focused on older populations.

Supplementary Materials

The following supporting information can be downloaded at: https://www.mdpi.com/article/10.3390/land14061271/s1.

Author Contributions

Conceptualization, W.D.; methodology, W.D.; software, Y.W.; validation, S.Z.; investigation, S.Z.; resources, S.Z.; data curation, J.L.; writing—original draft preparation, W.D. and S.Z.; writing—review and editing, X.X.; visualization, G.W. All authors have read and agreed to the published version of the manuscript.

Funding

This research was funded by the Special Research Project of Philosophy and Social Sciences in Shaanxi Province [grant number 2024QN179].

Institutional Review Board Statement

This study has been reviewed and approved by the Academic Committee of the School of Design at Xi’an Technological University and complies with the relevant principles of the Declaration of Helsinki on human biological research.

Informed Consent Statement

The collected questionnaires and trajectory data are anonymous and do not contain any personally identifiable information. The Academic Committee has also approved the use of oral informed consent from tourists’ GPS and assigned independent reviewers to oversee and witness the data collection process.

Data Availability Statement

The original contributions presented in this study are included in the article/Supplementary Materials. Further inquiries can be directed to the corresponding author.

Conflicts of Interest

The authors declare no conflicts of interest.

Abbreviations

The following abbreviations are used in this manuscript:
GIGreen Infrastructure
GPSGlobal Positioning System
METMetabolic Equivalent
PAPhysical Activity
NBSNature-Based Solutions
PLSPartial Least Squares
RMSEPRoot Mean Square Error of Prediction
SPSSAUStatistical Product and Service Software Automatically
UAVUnmanned Aerial Vehicle
WHOWorld Health Organization

Appendix A

Table A1. Operational definitions of variables.
VariableTypeMeasurement ValueOperational DefinitionRationale
Area(m2)Numericalsquare metersThe DJI
A DJI Phantom 4 RTK was employed for surveying and mapping the three case study parks, ensuring surveying accuracy in ±0.1 m vertically and horizontally. Accuracy was further assured by on-site field measurements and verification.
Paved park spaces covering a larger total area can draw more users; this might also cultivate physical activity in older adults [64].
Shape indexNumerical The shape index S I i of a paved open space i is given by:
S I i = 0.25 E i A i
Where E i represents the perimeter of the paved open space i , and A i denotes its area.
Shapes closer to a square (indicating higher compactness) result in higher values; whereas reduced compactness is reflected in lower values [76].
Number of bag storage facilitiesNumericalNAAn observer traversed the entire site boundary specifically to count the bag storage facilities situated in the paved open space.Having convenient facilities available in parks acts to support PA [29].
Number of benchesNumericalNAWhile walking along the site boundary, an observer tallied the quantity of benches located inside the paved open space.The presence of benches may encourage walking [71] while older adults require resting opportunities [71].
Presence of outdoor fitness equipmentCategoricala. Absent;
b. Present
To assess if outdoor fitness equipment was present or absent in the paved open space, an observer walked along the site boundary.Outdoor fitness equipment is a critical influencing factor of park visitors [19], and attracts a considerable number of senior users [66,67]. It also assists in elevating levels of moderate and vigorous physical activity [68].
Presence of shading facilitiesCategoricala. Absent;
b. Present.
An observer walked along the site boundary to determine whether shading facilities were present in the paved open space.Most visitors appreciate resting facilities and shade. However, individuals might be hindered from reaching medium to high PA levels by inadequate sports facilities or shelters placed poorly [27].
Distance to restrooms(m)NumericalmetersThis measurement involved calculating the straight-line distance that connects the open space to the nearest restroom.Convenient facilities such as restrooms can motivate user engagement in active pursuits [12,29].
Number of green vegetation speciesNumericalNATo record the variety of green vegetation species visible from the paved open space boundary, an observer was required to walk along it.Park greenery is a key factor that significantly affects park visitors [19]. Reportedly, older adults favor green spaces marked by dense and varied vegetation. Besides, research suggests that time spent in outdoor green spaces with diverse plants can improve both physiological and psychological measures [77].
Number of flower speciesNumericalNAWhile walking along the boundary of the paved open space, an observer enumerated the flower species in their line of sight.Color is noted as important in affecting landscape preferences [19]. Middle-aged and older adults exhibit higher concern for the surrounding environment, including flower scent and diversity [27]. Areas rich in flowers possess a special appeal for older adults [75].
Horizontal visibilityCategoricala. Low horizontal visibility;
b. Relatively low horizontal visibility;
c. Moderate horizontal visibility;
d. Relatively high horizontal visibility;
e. High horizontal visibility.
Low horizontal visibility: Most of the horizontal sightlines around the paved open space are obstructed.
Relatively low horizontal visibility: The majority of horizontal sightlines around the paved open space are obstructed.
Moderate horizontal visibility: Some areas around the paved open space have interrupted horizontal sightlines.
Relatively high horizontal visibility: Only a few areas around the paved open space have obstructed horizontal sightlines.
High horizontal visibility: Very few horizontal sightlines around the paved open space are obstructed.
Visual access can affect user locomotion [78]. When good visibility exists, visitors generally feel safe and comfortable [27]. Additionally, the walking behaviors of older adults can be influenced by elements such as building height and enclosure elevation [79].
Presence of waterCategoricala. Not visible;
b. Visible.
Whether water was visible in the field of view was determined by observation from the paved open space boundary.A negative correlation exists between the presence of water features and activity duration [23].

References

  1. Tian, Y.; Li, C.; Shilko, T.A.; Sosunovsky, V.S.; Zhang, Y. The Relationship between Physical Activity and Diabetes in Middle-Aged and Elderly People. Medicine 2023, 102, e32796. [Google Scholar] [CrossRef] [PubMed]
  2. Tian, Y.; Shi, Z. Effects of Physical Activity on Daily Physical Function in Chinese Middle-Aged and Older Adults: A Longitudinal Study from CHARLS. J. Clin. Med. 2022, 11, 6514. [Google Scholar] [CrossRef] [PubMed]
  3. Levy-Storms, L.; Chen, L.; Loukaitou-Sideris, A. Older Adults’ Needs and Preferences for Open Space and Physical Activity in and Near Parks: A Systematic Review. J. Aging Phys. Act. 2018, 26, 682–696. [Google Scholar] [CrossRef]
  4. Li, D.; Xu, H.; Kang, Y.; Steemers, K. Systematic Review: Landscape Characteristics Correlated with Physical Activity of the Elderly People. Land 2023, 12, 605. [Google Scholar] [CrossRef]
  5. Dong, X.; Yi, X.; Ding, M.; Gao, Z.; McDonough, D.J.; Yi, N.; Qiao, W. A Longitudinal Study of a Multicomponent Exercise Intervention with Remote Guidance among Breast Cancer Patients. Int. J. Environ. Res. Public Health 2020, 17, 3425. [Google Scholar] [CrossRef]
  6. Lee, J.; Kim, Y. Application of the Social Ecological Constructs to Explain Physical Activity in Middle Aged Adults. Int. J. Sport Psychol. 2017, 48, 99–110. [Google Scholar]
  7. Delobelle, J.; Compernolle, S.; Vetrovsky, T.; Van Cauwenberg, J.; Van Dyck, D. Contexts, affective and physical states and their variations during physical activity in older adults: An intensive longitudinal study with sensor-triggered event-based ecological momentary assessments. Int. J. Behav. Nutr. Phys. Act. 2025, 22, 30. [Google Scholar] [CrossRef]
  8. Run, M.P.A. Global Action Plan on Physical Activity 2018–2030: More Active People for a Healthier World; World Health Organization: Geneva, Switzerland, 2018. [Google Scholar]
  9. Zhang, R.; Wulff, H.; Duan, Y.; Wagner, P. Associations between the Physical Environment and Park-Based Physical Activity: A Systematic Review. J. Sport Health Sci. 2019, 8, 412–421. [Google Scholar] [CrossRef]
  10. Duan, Y.; Wagner, P.; Zhang, R.; Wulff, H.; Brehm, W. Physical Activity Areas in Urban Parks and Their Use by the Elderly from Two Cities in China and Germany. Landsc. Urban Plan. 2018, 178, 261–269. [Google Scholar] [CrossRef]
  11. Zhai, Y.; Baran, P.K. Urban Park Pathway Design Characteristics and Senior Walking Behavior. Urban For. Urban Green. 2017, 21, 60–73. [Google Scholar] [CrossRef]
  12. Kaczynski, A.T.; Potwarka, L.R.; Saelens, B.E. Association of Park Size, Distance, and Features With Physical Activity in Neighborhood Parks. Am. J. Public Health 2008, 98, 1451–1456. [Google Scholar] [CrossRef] [PubMed]
  13. Fang, X.; Li, J.; Ma, Q.; Zhou, R.; Du, S. A quantitative review of nature-based solutions for urban sustainability (2016–2022): From science to implementation. Sci. Total Environ. 2024, 927, 172219. [Google Scholar] [CrossRef] [PubMed]
  14. Lafortezza, R.; Chen, J.; Van Den Bosch, C.K.; Randrup, T.B. Nature-Based Solutions for Resilient Landscapes and Cities. Environ. Res. 2017, 165, 431–441. [Google Scholar] [CrossRef]
  15. Zhang, Y.; Tian, Y. The Relationship between Physical Activity and Depressive Symptoms in Middle-Aged and Elderly People Controlling for Demographic and Health Status Variables. Sustainability 2022, 14, 13986. [Google Scholar] [CrossRef]
  16. Zhai, Y.; Baran, P.K. Do Configurational Attributes Matter in Context of Urban Parks? Park Pathway Configurational Attributes and Senior Walking. Landsc. Urban Plan. 2016, 148, 188–202. [Google Scholar] [CrossRef]
  17. Arifwidodo, S.D.; Chandrasiri, O. Association Between Park Characteristics and Park-Based Physical Activity Using Systematic Observation: Insights from Bangkok, Thailand. Sustainability 2020, 12, 2559. [Google Scholar] [CrossRef]
  18. Gong, Y.; Gallacher, J.; Palmer, S.; Fone, D. Neighbourhood Green Space, Physical Function and Participation in Physical Activities among Elderly Men: The Caerphilly Prospective Study. Int. J. Behav. Nutr. Phys. Act. 2014, 11, 40. [Google Scholar] [CrossRef] [PubMed]
  19. Donahue, M.L.; Keeler, B.L.; Wood, S.A.; Fisher, D.M.; Hamstead, Z.A.; McPhearson, T. Using Social Media to Understand Drivers of Urban Park Visitation in the Twin Cities, MN. Landsc. Urban Plan. 2018, 175, 1–10. [Google Scholar] [CrossRef]
  20. Zhang, L.; Shao, K.; Tang, W.; Lau, S.S.Y.; Lai, H.; Tao, Y. Outdoor Space Elements in Urban Residential Areas in Shenzhen, China: Optimization Based on Health-Promoting Behaviours of Older People. Land 2023, 12, 1138. [Google Scholar] [CrossRef]
  21. Zhai, Y.; Li, D.; Wu, C.; Wu, H. Urban Park Facility Use and Intensity of Seniors’ Physical Activity—An Examination Combining Accelerometer and GPS Tracking. Landsc. Urban Plan. 2021, 205, 103950. [Google Scholar] [CrossRef]
  22. Van Hecke, L.; Van Cauwenberg, J.; Clarys, P.; Van Dyck, D.; Veitch, J.; Deforche, B. Active Use of Parks in Flanders (Belgium): An Exploratory Observational Study. Int. J. Environ. Res. Public Health 2016, 14, 35. [Google Scholar] [CrossRef]
  23. Akpinar, A.; Cankurt, M. How Are Characteristics of Urban Green Space Related to Levels of Physical Activity: Examining the Links. Indoor Built Environ. 2016, 26, 1091–1101. [Google Scholar] [CrossRef]
  24. Besenyi, G.M.; Kaczynski, A.T.; Wilhelm Stanis, S.A.; Vaughan, K.B. Demographic Variations in Observed Energy Expenditure across Park Activity Areas. Prev. Med. 2013, 56, 79–81. [Google Scholar] [CrossRef] [PubMed]
  25. Zhai, Y.; Li, D.; Wu, C.; Wu, H. Spatial Distribution, Activity Zone Preference, and Activity Intensity of Senior Park Users in a Metropolitan Area. Urban For. Urban Green. 2023, 79, 127761. [Google Scholar] [CrossRef]
  26. Liu, M.; Chen, C.; Yan, J. Identifying Park Spatial Characteristics That Encourage Moderate-to-Vigorous Physical Activity among Park Visitors. Land 2023, 12, 717. [Google Scholar] [CrossRef]
  27. Lin, M.; Feng, X. Relationship between Visitor Characteristics, Physical Activity Levels and Park Environment in Subtropical Areas’ Urban Parks. Urban For. Urban Green. 2023, 85, 127958. [Google Scholar] [CrossRef]
  28. Petrunoff, N.A.; Edney, S.; Yi, N.X.; Dickens, B.L.; Joel, K.R.; Xin, W.N.; Sia, A.; Leong, D.; van Dam, R.M.; Cook, A.R.; et al. Associations of Park Features with Park Use and Park-Based Physical Activity in an Urban Environment in Asia: A Cross-Sectional Study. Health Place 2022, 75, 102790. [Google Scholar] [CrossRef]
  29. Remme, R.P.; Frumkin, H.; Guerry, A.D.; King, A.C.; Mandle, L.; Sarabu, C.; Bratman, G.N.; Giles-Corti, B.; Hamel, P.; Han, B.; et al. An Ecosystem Service Perspective on Urban Nature, Physical Activity, and Health. Proc. Natl. Acad. Sci. USA 2021, 118, e2018472118. [Google Scholar] [CrossRef]
  30. Hillier, B.; Iida, S. Network and Psychological Effects in Urban Movement. In Spatial Information Theory; Springer: Berlin/Heidelberg, Germany, 2005; pp. 475–490. [Google Scholar] [CrossRef]
  31. Zhang, T.; Lian, Z.; Xu, Y. Combining GPS and Space Syntax Analysis to Improve Understanding of Visitor Temporal–Spatial Behaviour: A Case Study of the Lion Grove in China. Landsc. Res. 2020, 45, 534–546. [Google Scholar] [CrossRef]
  32. Sami, M.; Smith, M.; Ogunseitan, O.A. Placement of Outdoor Exercise Equipment and Physical Activity: A Quasi-Experimental Study in Two Parks in Southern California. Int. J. Environ. Res. Public Health 2020, 17, 2605. [Google Scholar] [CrossRef]
  33. Bendjedidi, S.; Bada, Y.; Meziani, R. Urban Plaza Design Process Using Space Syntax Analysis. Int. Rev. Spat. Plan. Sustain. Dev. 2019, 7, 125–142. [Google Scholar] [CrossRef] [PubMed]
  34. Chen, X.; Liu, X. Quantitative Analysis of Urban Spatial Morphology Based on GIS Regionalization and Spatial Syntax. J. Indian Soc. Remote Sens. 2022, 51, 1855–1864. [Google Scholar] [CrossRef]
  35. Mahfoud, S.; Bada, Y.; Cutini, V. The Impact of the Urban Structure on the Public Squares Uses: A Syntactic Analysis. Int. Rev. Spat. Plan. Sustain. Dev. 2022, 10, 92–110. [Google Scholar] [CrossRef]
  36. Mu, B.; Liu, C.; Mu, T.; Xu, X.; Tian, G.; Zhang, Y.; Kim, G. Spatiotemporal Fluctuations in Urban Park Spatial Vitality Determined by On-Site Observation and Behavior Mapping: A Case Study of Three Parks in Zhengzhou City, China. Urban For. Urban Green. 2021, 64, 127246. [Google Scholar] [CrossRef]
  37. Sheng, Q.; Wan, D.; Yu, B. Effect of Space Configurational Attributes on Social Interactions in Urban Parks. Sustainability 2021, 13, 7805. [Google Scholar] [CrossRef]
  38. Akpinar, A. How Is Quality of Urban Green Spaces Associated with Physical Activity and Health? Urban For. Urban Green. 2016, 16, 76–83. [Google Scholar] [CrossRef]
  39. Evenson, K.R.; Wen, F.; Hillier, A.; Cohen, D.A. Assessing the Contribution of Parks to Physical Activity Using Global Positioning System and Accelerometry. Med. Sci. Sports Exerc. 2013, 45, 1981–1987. [Google Scholar] [CrossRef]
  40. Evenson, K.R.; Jones, S.A.; Holliday, K.M.; Cohen, D.A.; McKenzie, T.L. Park Characteristics, Use, and Physical Activity: A Review of Studies Using SOPARC (System for Observing Play and Recreation in Communities). Prev. Med. 2016, 86, 153–166. [Google Scholar] [CrossRef]
  41. Zheng, W.; Huang, X.; Li, Y. Understanding the Tourist Mobility Using GPS: Where Is the next Place? Tour. Manag. 2017, 59, 267–280. [Google Scholar] [CrossRef]
  42. Shaanxi Provincial Bureau of Statistics. Main Data Bulletin of the Seventh National Population Census of Xi’an (Number One); Shaanxi Provincial Bureau of Statistics: Xianyong, China, 2021. [Google Scholar]
  43. Shaanxi Provincial Bureau of Statistic. Main Data Bulletin of the Seventh National Population Census of Xi’an (Number Four); Shaanxi Provincial Bureau of Statistics: Xianyong, China, 2021. [Google Scholar]
  44. Almanza, E.; Jerrett, M.; Dunton, G.; Seto, E.; Ann Pentz, M. A Study of Community Design, Greenness, and Physical Activity in Children Using Satellite, GPS and Accelerometer Data. Health Place 2012, 18, 46–54. [Google Scholar] [CrossRef]
  45. Zeng, X.; Zhong, Y.; Yang, L.; Wei, J.; Tang, X. Analysis of Forest Landscape Preferences and Emotional Features of Chinese Forest Recreationists Based on Deep Learning of Geotagged Photos. Forests 2022, 13, 892. [Google Scholar] [CrossRef]
  46. Dong, W.; Kang, Q.; Wang, G.; Zhang, B.; Liu, P. Spatiotemporal Behavior Pattern Differentiation and Preference Identification of Tourists from the Perspective of Ecotourism Destination Based on the Tourism Digital Footprint Data. PLoS ONE 2023, 18, e0285192. [Google Scholar] [CrossRef] [PubMed]
  47. Huang, X.; Li, M.; Zhang, J.; Zhang, L.; Zhang, H.; Yan, S. Tourists’ Spatial-Temporal Behavior Patterns in Theme Parks: A Case Study of Ocean Park Hong Kong. J. Destin. Mark. Manag. 2020, 15, 100411. [Google Scholar] [CrossRef]
  48. Hahm, Y.; Yoon, H.; Choi, Y. The Effect of Built Environments on the Walking and Shopping Behaviors of Pedestrians; A Study with GPS Experiment in Sinchon Retail District in Seoul, South Korea. Cities 2019, 89, 1–13. [Google Scholar] [CrossRef]
  49. Liu, Y.; Hu, J.; Yang, W.; Luo, C. Effects of Urban Park Environment on Recreational Jogging Activity Based on Trajectory Data: A Case of Chongqing, China. Urban For. Urban Green. 2021, 67, 127443. [Google Scholar] [CrossRef]
  50. Labib, S.M.; Shuvo, F.K.; HEMBrowning, M.; Rigolon, A. Noncommunicable Diseases, Park Prescriptions, and Urban Green Space Use Patterns in a Global South Context: The Case of Dhaka, Bangladesh. Int. J. Environ. Res. Public Health 2020, 17, 3900. [Google Scholar] [CrossRef]
  51. Stewart, O.T.; Moudon, A.V.; Littman, A.J.; Seto, E.; Saelens, B.E. The Association Between Park Facilities and Duration of Physical Activity During Active Park Visits. J. Urban Health 2018, 95, 869–880. [Google Scholar] [CrossRef] [PubMed]
  52. Shephard, R.J. 2011 Compendium of Physical Activities: A Second Update of Codes and MET Values. Yearb. Sports Med. 2012, 2012, 126–127. [Google Scholar] [CrossRef]
  53. Han, J.; Kamber, M.; Pei, J.B. Data Mining: Concepts and Techniques, 3rd ed.; Morgan Kaufmann: Burlington, MA, USA, 2006; pp. 14–176. [Google Scholar]
  54. Elkhrachy, I. Accuracy Assessment of Low-Cost Unmanned Aerial Vehicle (UAV) Photogrammetry. Alex. Eng. J. 2021, 60, 5579–5590. [Google Scholar] [CrossRef]
  55. Thaler, U. Space Syntax Methodology. In Archaeological Spatial Analysis: A Methodological Guide; Routledge: London, UK, 2020; pp. 296–312. [Google Scholar] [CrossRef]
  56. Mohajer Milani, A. Analysing Complete Street Design Principles Using Space Syntax Methodology in a Case of Haft-e-Tir Square, Tehran. Int. J. Environ. Res. 2024, 18, 10–17. [Google Scholar] [CrossRef]
  57. Liang, W.; Ahmad, Y.; Mohidin, H.H.B. Spatial Form and Conservation Strategy of Sishengci Historic District in Chengdu, China. Heritage 2023, 6, 891–903. [Google Scholar] [CrossRef]
  58. Rashid, M. The Geometry of Urban Layouts; Springer International Publishing: Cham, Switzerland, 2017; ISBN 9783319307480. [Google Scholar]
  59. Pan, M.; Shen, Y.; Jiang, Q.; Zhou, Q.; Li, Y. Reshaping Publicness: Research on Correlation between Public Participation and Spatial Form in Urban Space Based on Space Syntax—A Case Study on Nanjing Xinjiekou. Buildings 2022, 12, 1492. [Google Scholar] [CrossRef]
  60. Wold, S.; Sjöström, M.; Eriksson, L. PLS-Regression: A Basic Tool of Chemometrics. Chemom. Intell. Lab. Syst. 2001, 58, 109–130. [Google Scholar] [CrossRef]
  61. Abdi, H. Partial Least Squares Regression and Projection on Latent Structure Regression (PLS Regression). Wiley Interdiscip. Rev. Comput. Stat. 2010, 2, 97–106. [Google Scholar] [CrossRef]
  62. Bastien, P.; Vinzi, V.E.; Tenenhaus, M. PLS Generalised Linear Regression. Comput. Stat. Data Anal. 2004, 48, 17–46. [Google Scholar] [CrossRef]
  63. Leguina, A. A Primer on Partial Least Squares Structural Equation Modeling (PLS-SEM). Int. J. Res. Method Educ. 2015, 38, 220–221. [Google Scholar] [CrossRef]
  64. Baran, P.K.; Smith, W.R.; Moore, R.C.; Floyd, M.F.; Bocarro, J.N.; Cosco, N.G.; Danninger, T.M. Park Use Among Youth and Adults: Examination of Individual, Social, and Urban Form Factors. Environ. Behav. 2013, 46, 768–800. [Google Scholar] [CrossRef]
  65. Ode, Å.; Fry, G.; Tveit, M.S.; Messager, P.; Miller, D. Indicators of Perceived Naturalness as Drivers of Landscape Preference. J. Environ. Manag. 2009, 90, 375–383. [Google Scholar] [CrossRef] [PubMed]
  66. Chow, H.; Mowen, A.; Wu, G. Who Is Using Outdoor Fitness Equipment and How? The Case of Xihu Park. Int. J. Environ. Res. Public Health 2017, 14, 448. [Google Scholar] [CrossRef]
  67. Stride, V.; Cranney, L.; Scott, A.; Hua, M. Outdoor Gyms and Older Adults—Acceptability, Enablers and Barriers: A Survey of Park Users. Health Promot. J. Aust. 2017, 28, 243–246. [Google Scholar] [CrossRef]
  68. Cranney, L.; Phongsavan, P.; Kariuki, M.; Stride, V.; Scott, A.; Hua, M.; Bauman, A. Impact of an Outdoor Gym on Park Users’ Physical Activity: A Natural Experiment. Health Place 2016, 37, 26–34. [Google Scholar] [CrossRef] [PubMed]
  69. Du, M.; Zheng, Y.; Wang, C.; Wang, Z.; Hong, B. Effects of Tactile Perceptions on Elderly Adults’ Thermo-Physiological Responses in Outdoor Open Spaces. Build. Environ. 2025, 278, 112958. [Google Scholar] [CrossRef]
  70. Ma, X.; Tian, Y.; Du, M.; Hong, B.; Lin, B. How to Design Comfortable Open Spaces for the Elderly? Implications of Their Thermal Perceptions in an Urban Park. Sci. Total Environ. 2021, 768, 144985. [Google Scholar] [CrossRef] [PubMed]
  71. Lu, Z. Investigating Walking Environments in and around Assisted Living Facilities: A Facility Visit Study. HERD Health Environ. Res. Des. J. 2010, 3, 58–74. [Google Scholar] [CrossRef]
  72. Edwards, N.; Hooper, P.; Knuiman, M.; Foster, S.; Giles-Corti, B. Associations between Park Features and Adolescent Park Use for Physical Activity. Int. J. Behav. Nutr. Phys. Act. 2015, 12, 21. [Google Scholar] [CrossRef]
  73. Hung, S.-H.; Chang, C.-Y. Designing for Harmony in Urban Green Space: Linking the Concepts of Biophilic Design, Environmental Qi, Restorative Environment, and Landscape Preference. J. Environ. Psychol. 2024, 96, 102294. [Google Scholar] [CrossRef]
  74. Coventry, P.A.; Brown, J.V.E.; Pervin, J.; Brabyn, S.; Pateman, R.; Breedvelt, J.; Gilbody, S.; Stancliffe, R.; McEachan, R.; White, P.C.L. Nature-Based Outdoor Activities for Mental and Physical Health: Systematic Review and Meta-Analysis. SSM—Popul. Health 2021, 16, 100934. [Google Scholar] [CrossRef]
  75. Chudyk, A.M.; Winters, M.; Moniruzzaman, M.; Ashe, M.C.; Gould, J.S.; McKay, H. Destinations Matter: The Association between Where Older Adults Live and Their Travel Behavior. J. Transp. Health 2015, 2, 50–57. [Google Scholar] [CrossRef]
  76. Zhang, J.; Li, J.; Bao, A.; Frankl, A.; Wang, H.; Bai, J.; Shen, Z.; Li, L.; De Maeyer, P.; Van de Voorde, T. Ecological Restoration Trajectory of the Taitema Lake Wetland in Arid Northwest China: A 36-Year Wetland Health Assessment Using Landsat Time Series Data. Ecol. Indic. 2024, 161, 111956. [Google Scholar] [CrossRef]
  77. Wang, X.; Rodiek, S. Older Adults’ Preference for Landscape Features Along Urban Park Walkways in Nanjing, China. Int. J. Environ. Res. Public Health 2019, 16, 3808. [Google Scholar] [CrossRef]
  78. Chang, C.; Lin, B.B.; Feng, X.; Andersson, E.; Gardner, J.; Astell-Burt, T. A Lower Connection to Nature Is Related to Lower Mental Health Benefits from Nature Contact. Sci. Rep. 2024, 14, 6705. [Google Scholar] [CrossRef] [PubMed]
  79. Borst, H.C.; de Vries, S.I.; Graham, J.M.A.; van Dongen, J.E.F.; Bakker, I.; Miedema, H.M.E. Influence of Environmental Street Characteristics on Walking Route Choice of Elderly People. J. Environ. Psychol. 2009, 29, 477–484. [Google Scholar] [CrossRef]
Figure 1. Spatial Distribution of 110 Paved Open Spaces Across Three Urban Parks.
Land 14 01271 g001
Figure 2. Measurement of the Configurational Characteristics of Paved Open Spaces. Low High.
Land 14 01271 g002
Figure 3. The Results of the Pearson Correlation Analysis.
Land 14 01271 g003
Figure 4. RMSEP (Root Mean Square Error of Prediction).
Land 14 01271 g004
Figure 5. Normality Assessment of PLS Residuals Using P-P Plot.
Land 14 01271 g005
Figure 6. VIP Projection Importance (VIP).
Land 14 01271 g006
Figure 7. Standardized Regression Coefficients.
Land 14 01271 g007
Table 1. Definitions and Calculation Formulas of Space Syntax Variables.
VariablesDefinitionFormulaExplanation of the FormulaLiterature Source
ConnectivityThe number of spaces directly connected to a space C o n i = k Where k is the number of spaces that are connected to space i . i = 1 , 2 , 3 , n is the total number of spaces in the system C o n i is the connectivity value of space i .[56]
Total DepthThe minimum number of spatial transitions required to reach other spaces in a system. D i = j = 1 n d i j Where d i j is the shortest spatial transitions between space i to space j .[57]
ChoiceThe number of times a segment is traversed along the shortest path between every pair of origins/destinations in the spatial system. C i = j k g j k ( i ) / g j k ( j < k ) Where g j k ( i ) is the number of shortest spaces between space j and space k containing i , and g j k is the number of all shortest spaces between space j and space k .[58]
IntegrationThe sum of spatial transitions from one space to all other spaces.   I i = 2 ( n ( log 2 ( n + 2 3 1 ) + 1 ) / ( n 1 ) ( n 2 ) 2 ( j = 1 n d i j n 1 ) 1 ) / ( n 2 ) Where n is the number of spaces in the urban park area considered, d i j is the shortest distance (least number of steps) between two spaces i and j . [58,59]
Table 2. Descriptive Statistics of Participant Sociodemographic Information.
CategoryTypeFrequency (%)Percentage (%)
GenderMale21756.36%
Female16843.64%
OccupationCivil servant10323.75%
Farmer328.31%
Business/Service sector employee246.23%
Other occupations22157.40%
Number of people in this tripOne person23360.52%
Two people11429.61%
Three people and above369.35%
Note: Sample validity in this study was determined using the integrity of participants’ GPS tracks as the standard. Some samples lacked sociodemographic attribute data in the survey questionnaires corresponding to the trajectories. Therefore, the sum of samples for particular characteristics demonstrated in the Table 2 statistics might not align fully with the total count of valid samples.
Table 3. Descriptive Statistics of Variables Included in the Analyses.
TypeVariable Minimum ValueMaximum ValueMeanSDFrequencyPercentage
Configurational attributesConnectivity 172.661.48
Depth 101263663442.091390.6
Choice 014,0281705.422917.23
Integration 0.391.070.620.13
Planform characteristicsArea (m2) 343066464.81580.9
Shape index 0.892.011.1640.211
Facility provisionNumber of bag storage facilities 050.390.99
Number of benches 0364.257.1
Presence of outdoor fitness equipment
No 10595.45%
Yes 54.45%
Presence of shading facilities
No 8577.27%
Yes 2522.73%
Distance to restrooms (m) 2442141.5898.67
Visual environment characteristicsNumber of green vegetation species 092.72.53
Number of flower species 051.050.84
Horizontal visibility
Low 4742.73%
Moderately low 2220%
Moderate 87.27%
Moderately high 1412.73%
High 1917.27%
Presence of water
No 7770.00%
Yes 3330.00%
DependentMET 06538.64372.64777.3
Table 4. Summary of PLS Regression Model R2 for Different Numbers of Principal Components.
Numbers of Principal Components1234567
R20.590.6610.6770.680.680.680.68
Table 5. Factor Loadings for Principal Components and Study Variables.
Variable TypeVariablePrincipal Component U1Principal Component U2
IndependentConnectivity0.310.47
Choice0.190.56
Integration0.330.39
Area0.44−0.17
Shape index−0.050.09
Number of bag storage facilities0.46−0.06
Number of benches0.190.1
Presence of outdoor fitness equipment0.25−0.56
Presence of shading facilities0.24−0.09
Distance to restrooms−0.040.21
Number of green vegetation species0.40.2
Number of flower species0.19−0.07
Horizontal visibility0.120.25
Presence of water−0.130.16
Principal Component V1Principal Component V2
DependentMET0.44−0.26
Table 6. Univariate Linear Regression by Different Area Group.
Predictor VariablesAreaCoef. (B)Robust SEt Sig.[95% Conf. Interval]R2FProb > F
Shape index≤200 m200.0180.0210.983−0.035~0.036−0.028F (1, 36) = −0.9891
201–400 m20.0710.0641.1150.265−0.054~0.195−0.005F (1, 30) = −0.1491
401–600 m20.0880.0930.9430.345−0.094~0.2690.095F (1, 8) = 0.8420.386
>600 m2−0.4320.431−1.0040.315−1.277~0.4120.046F (1, 18) = 0.8740.362
Dependent variable = MET/min
Table 7. Results of Simple Regression Analyses With Caloric Expenditure Per Minute and Predictor Variables.
Predictor VariablesCoef. (B)Robust SEt Sig.[95% Conf. Interval]BetaR2FProb > F
Horizontal visibility0.020.011.620.110.000.040.150.02F (1, 108) = 2.630.11
Number of green vegetation species0.030.014.470.000.020.050.435 0.19F (1, 108) = 19.990.00
Number of flower species0.060.023.010.000.020.100.257 0.07F (1, 108) = 9.060.00
Note: Dependent variable is MET/min. OLS regression model used.
Disclaimer/Publisher’s Note: The statements, opinions and data contained in all publications are solely those of the individual author(s) and contributor(s) and not of MDPI and/or the editor(s). MDPI and/or the editor(s) disclaim responsibility for any injury to people or property resulting from any ideas, methods, instructions or products referred to in the content.

