Article

Multi-Objective Land Use Optimization Based on NSGA-II and PLUS Models: Balancing Economic Development and Carbon Neutrality Goals

1
College of Land and Environment, Shenyang Agricultural University, Shenyang 110866, China
2
National Engineering Research Center for Efficient Use of Soil and Fertilizer, Shenyang 110866, China
*
Authors to whom correspondence should be addressed.
Land 2025, 14(8), 1585; https://doi.org/10.3390/land14081585
Submission received: 27 May 2025 / Revised: 26 July 2025 / Accepted: 1 August 2025 / Published: 3 August 2025

Abstract

Land use/land cover (LULC) change constitutes a critical driver influencing regional carbon cycling processes. Optimizing LULC structures represents a significant pathway toward the realization of carbon neutrality. This study takes Liaoning Province as a case area to analyze LULC changes from 2000 to 2020 and to assess their impacts on land use carbon emissions (LUCE) and ecosystem carbon storage (ECS). To accelerate the achievement of carbon neutrality, four development scenarios are established: natural development (ND), low-carbon emission (LCE), high-carbon storage (HCS), and carbon neutrality (CN). For each scenario, corresponding optimization objectives and constraint conditions are defined, and a multi-objective LULC optimization coupling model is formulated to optimize both the quantity structure and spatial pattern of LULC. On this basis, the model quantifies ECS and LUCE under the four scenarios and evaluates the economic value of each scenario and its contribution to the carbon neutrality target. Results indicate the following: (1) From 2000 to 2020, the extensive expansion of construction land resulted in a reduction in ECS by 12.72 × 10⁶ t and an increase in LUCE by 150.44 × 10⁶ t; (2) Compared to the ND scenario, the LCE scenario exhibited the most significant performance in controlling carbon emissions, while the HCS scenario achieved the highest increase in carbon sequestration. The CN scenario showed significant advantages in reducing LUCE, enhancing ECS, and promoting economic growth, achieving a reduction of 0.18 × 10⁶ t in LUCE, an increase of 118.84 × 10⁶ t in ECS, and an economic value gain of 3386.21 × 106 yuan. This study optimizes the LULC structure from the perspective of balancing economic development, LUCE reduction, and ECS enhancement. It addresses the inherent conflict between regional economic growth and ecological conservation, providing scientific evidence and policy insights for promoting LULC optimization and advancing carbon neutrality in similar regions.

1. Introduction

In recent decades, the rapid process of urbanization and the intensive consumption of fossil fuels have significantly exacerbated the global greenhouse effect, profoundly affecting both ecological systems and the sustainable development of socio-economic factors [1]. Global climate change has become a pressing challenge for modern society, and nations worldwide are implementing a range of measures to curb the increasing trajectory of greenhouse gas emissions [2]. As one of the world’s largest carbon emitters, China has proactively taken measures to address climate change and has pledged to achieve carbon neutrality by 2060 [3].
Low-carbon development largely depends on the involvement of land use/land cover (LULC). Changes in LULC alter the structure of terrestrial ecosystems, thereby reducing ecosystem carbon storage (ECS) [4]. Furthermore, land use carbon emissions (LUCE) have emerged as the second-largest global source of emissions, surpassed only by those from fossil fuel combustion [5]. In China, rapid urban expansion has driven the extensive conversion of high carbon sink land into land with low sequestration capacity. This process not only further diminishes the carbon sequestration potential but also significantly exacerbates greenhouse gas emissions [6].
LULC optimization targeting carbon neutrality has emerged as a current research hotspot. Currently, two dominant methodological approaches are employed in this field: ex-post evaluation based on historical data and ex-ante intervention for future-oriented planning purposes [4,6,7,8]. Ex-post evaluation aims to reveal how changes in LULC have influenced LUCE and ECS by analyzing their historical spatiotemporal dynamics, thereby providing a reference for future LULC management [7,9,10,11]. In contrast, ex-ante intervention involves constructing LULC development scenarios under different policy orientations, projecting future LULC patterns and their corresponding LUCE and ECS, and identifying key areas suitable for reducing emissions and enhancing sequestration, thus offering scientific guidance for promoting low-carbon development [12,13,14,15]. Such research involves a “top-down” optimization of the quantitative composition of LULC and a “bottom-up” optimization of its spatial configuration. For “top-down” optimization of the quantitative composition, scholars have employed models including Markov chains, System Dynamics, and grey forecasting to project future LULC quantity requirements based on current trends in LULC changes [16,17,18]. Ma et al. utilized a Markov chain to explore the optimal quantitative configuration of LULC for promoting low-carbon development in Shandong Province [3]. However, these models support only single-objective optimization, making it difficult to achieve coordinated optimization of multiple conflicting objectives, such as promoting economic growth while reducing LUCE, thus limiting their application in complex LULC decision-making. To address this limitation, scholars have proposed a range of methods, including Genetic Algorithm (GA), Simulated Annealing (SA), and the Non-dominated Sorting Genetic Algorithm-II (NSGA-II), to solve multi-objective optimization challenges [19,20,21,22]. Wu et al. investigated scenarios for multi-objective coordinated development; however, by assigning fixed weights to different objectives, they simplified the problem into a single-objective optimization, thereby making it difficult to effectively reconcile conflicts among the objectives [23]. In contrast, NSGA-II has been widely applied in LULC optimization research due to its high computational efficiency, effective ranking of non-dominated solutions, and its advantage in addressing multiple objectives without requiring predefined weights [24,25,26]. Xin et al. applied NSGA-II to optimize the LULC structure in ecologically fragile areas, aiming to coordinate ecological conservation and economic development, thereby reducing regional ecological risks [22]. Moreover, Fu et al. applied the algorithm to optimize the LULC structure, aiming to promote regional coordinated development under low-carbon constraints [27]. For the “bottom-up” optimization of the spatial layout, scholars have commonly used models such as Cellular Automata–Markov, CLUE-S, and Pattern-based Land Use Simulation (PLUS) to simulate the future spatial patterns of LULC [28,29,30,31]. Among these, the PLUS model has been extensively applied due to its integration of a random forest algorithm, which effectively captures the underlying drivers of LULC changes and significantly improves simulation accuracy [1,16,31,32].
Although existing studies have investigated the realization of carbon neutrality using multi-objective optimization algorithms, the majority of current research continues to emphasize single-objective optimization of either ECS or LUCE, while overlooking the potential synergies between them [33,34,35]. For instance, Han et al. set LUCE reduction and economic development as optimization objectives, but did not consider ECS enhancement, thus failing to achieve the synergistic optimization of LUCE reduction and ECS enhancement [34]. In fact, both objectives are equally important for achieving carbon neutrality. Moreover, China’s LULC patterns are deeply influenced by national and regional policies; however, current optimization studies rarely incorporate the role of Territorial Spatial Planning (hereinafter referred to as the “Planning”) [35,36,37,38,39]. With the release of the Planning, the Chinese government has imposed more stringent regulatory requirements on future land use scales. Therefore, under these policy constraints, achieving the dual goals of enhancing ECS and reducing LUCE has become an urgent challenge that demands immediate research attention.
In response to these challenges, this study proposes a multi-objective LULC optimization framework that takes the enhancement of ECS and the reduction in LUCE as its core objectives, while also incorporating the improvement of economic value. The aim is to accelerate progress toward carbon neutrality while ensuring economic development. In addition, guided by the LULC scale control requirements outlined in the Planning, this study delineates appropriate development boundaries for various LULC types. Based on different development scenarios, corresponding optimization goals are formulated to achieve optimization of both the quantitative structure and spatial configuration of future LULC in Liaoning Province. The main contents of this study include: (1) Analyzing the spatiotemporal evolution of LULC in Liaoning Province from 2000 to 2020, quantifying ECS and LUCE using the Integrated Valuation of Ecosystem Services and Tradeoffs (InVEST) model and the Intergovernmental Panel on Climate Change (IPCC) method, respectively, and investigating the mechanisms through which LULC changes influence ECS and LUCE; (2) Integrating NSGA-II and PLUS models to construct multiple development scenarios and simulate future LULC patterns. (3) Evaluating the contribution of each scenario to carbon neutrality, identifying the optimal LULC development model suitable for Liaoning Province, and proposing practical low-carbon LULC management strategies.

2. Data Sources and Methods

2.1. Study Area

Liaoning Province is situated in the northeastern part of China (118°53′–125°46′ E, 38°45′–43°26′ N) [40]. Its topography is mainly composed of mountains, hills, and plains, with mountainous areas located in the eastern and western regions, while the central region comprises the Liaohe Plain, as illustrated in Figure 1. Land use in Liaoning is dominated by cropland, and the province is rich in agricultural resources, with maize, rice, and wheat serving as the main staple crops. By the end of 2022, Liaoning had a permanent population of 41.394 million, and a GDP of 2.90 × 10¹² yuan, reflecting a year-on-year growth rate of 5.1%, with the tertiary sector playing a dominant role in the economy [41,42]. In addition, as a national low-carbon pilot province, Liaoning serves as a model in promoting progress toward carbon neutrality.

2.2. Data Sources and Processing

The data sources used in this study are listed in Table 1. Slope data were derived from the Digital Elevation Model (DEM) using ArcGIS. LULC, socio-economic, and climate and environmental data were resampled to a 100 m resolution and reprojected to the WGS-1984-UTM Zone 50N.

2.3. Research Framework and Methods

2.3.1. Research Framework

The framework of this study comprises four modules (Figure 2). Initially, a natural development scenario (ND) was constructed using the Markov model as a baseline reference. Three optimization scenarios were subsequently designed: low carbon emission (LCE), high carbon storage (HCS), and carbon neutrality (CN), aiming to enhance economic value, increase ECS, and reduce LUCE. NSGA-II was employed to determine the optimal LULC quantity configuration for the three optimization scenarios. Subsequently, the PLUS model was applied to simulate the spatial patterns based on multiple driving factors and the corresponding LULC quantity demands. Thereafter, ECS and LUCE were estimated using the InVEST model and the IPCC methodology, respectively, based on the optimized quantity structures and spatial layouts. Finally, the contributions of various scenarios to carbon neutrality and their associated economic values were quantified and comparatively analyzed, leading to the identification of the optimal development scenario for Liaoning Province and contributing to the scientific basis for LULC optimization strategies.

2.3.2. Estimate Ecosystem Carbon Storage

This study evaluates total ECS using the InVEST model by multiplying the carbon density of each LULC type by its corresponding area [43]. The calculation formulas are as follows:
C S T = ( C S a b o v e + C S b e l o w + C S s o i l + C S d e a d ) × A r e a i
C S a b o v e , C S b e l o w , C S s o i l , and C S d e a d represent the carbon densities of the aboveground biomass, belowground biomass, soil, and dead organic matter. C S T denotes the ECS; A r e a i denotes the area of the LULC type i.
LULC carbon densities are presented in Table 2, primarily derived from published sources and existing literature [1,5,43,44]. To minimize potential errors, carbon density values were selected from field-sampled data collected in Liaoning Province and its surrounding areas, as far as possible [44].

2.3.3. Estimating Carbon Emissions

Direct carbon emissions, which exclude those from construction land, are estimated using IPCC emission factors [3]. Indirect carbon emissions are estimated according to energy use statistics and relevant emission coefficients [45]. The calculation formulas are as follows:
C E d i r e c t = A i S i
where C E d i r e c t represents the direct carbon emissions. A i and S i denote the emission factor and area of LULC type i, respectively. According to previous studies, the emission factors for cropland, forest, grassland, water, and unused land are 0.422, −0.0613, −0.021, −0.253, and −0.005, respectively, with little interannual variation; thus, they are set as constant values [26,45].
C E i n d i r e c t = N i α i β i
where C E i n d i r e c t represents the construction land emissions. N i denotes the amount of energy consumed for energy type i; α i and β i represent the standard coal conversion coefficients and the emission factors for energy type i, respectively, as shown in Table 3.
C E = C S d i r e c t + C S i n d i r e c t
where C E represents the total carbon emissions.

2.3.4. Optimization of the Quantitative Structure of LULC

The NSGA-II strikes a balance among multiple conflicting objectives through non-dominated sorting, elitism strategy, and crowding distance calculation, thereby identifying an optimal Pareto front. Previous studies have demonstrated its strong potential in LULC allocation and optimization. Therefore, this study employs the NSGA-II to solve the objective functions of each optimization scenario and to determine the corresponding LULC quantity requirements.
(1)
Construct the Objective Function
ND Scenario assumes no human interference and follows the historical trend of LULC transitions. The area of LULC types was predicted using the Markov Chain.
LCE Scenario is designed to ensure economic development while maximizing carbon emission reduction; the objective function is as follows:
E 1 = M a x i = 1 6 A i X i
C 1 = M i n i = 1 6 B i X i
F 1 = E 1 , C 1
HCS Scenario is designed to maximize regional carbon storage while ensuring economic development; the objective function is as follows:
C 2 = M a x i = 1 6 C i X i
F 2 = E 1 , C 2
CN Scenario is designed to ensure economic development while simultaneously maximizing carbon storage and minimizing emissions; the objective function is as follows:
F 3 = E 1 , C 1 , C 2
In the formula, A i , B i , C i , respectively, represent economic coefficient (yuan/hm2 carbon emission factor (t/hm2), and carbon density (t/hm2). X i represents the area of LULC type i.
(2)
GM (1,1) Model Prediction
Economic value coefficients for cropland, forest, grassland, water, and construction land were derived from the annual average outputs of agriculture, forestry, animal husbandry, fishery, and the secondary and tertiary sectors between 2000 and 2020, as reported in the Liaoning Statistical Yearbook. For unused land, the economic value coefficient was defined as 0.0001 [46]. Additionally, the carbon emission coefficient for construction land varied significantly across different years.
In view of the unavailability of the above coefficients for the year 2030, this study employed a grey prediction model GM(1,1) to forecast the relevant coefficients (Table 4). The model establishes a differential equation for the accumulated generated data sequence and estimates the model parameters to reveal the development trend of the data, thereby achieving the prediction of future values [47].
(3)
Constraint Conditions
Total area constraint: The total area of all LULC types equals the area of the study region.
k = 1 6 X i = 14670995
Cropland area constraint: The ND scenario predicts the natural evolution trend of cropland without human intervention, reflecting its potential maximum scale under the current policy context. Accordingly, the upper bound of cropland area in the optimization scenarios is aligned with the area in the ND scenario, while the lower bound does not fall below the cropland protection redline area proposed in the Planning to ensure the baseline of regional food security.
7004907 X 1 5067334
Forest area constraint: Forest area has continuously increased in recent years. Considering the potential for further expansion under stricter ecological protection measures and policy support in the future, the upper bound of forest area in the optimization scenarios does not exceed 1.2 times that of the ND scenario. Given the Markov Chain model’s high accuracy in predicting LULC areas, this study adopts the ND scenario area as the baseline, allowing a maximum increase of 20%. The lower bound does not fall below the baseline, ensuring no degradation of forest resources.
6258472 X 2 5215393
Grassland area constraint: Grassland area has continuously declined due to urban expansion and encroachment by cropland. In recent years, the Planning has emphasized strengthening grassland protection and controlling degradation to enhance the ecological functions of grasslands. Considering the potential for expansion driven by ecological protection measures and grassland restoration policies, the upper bound of grassland area does not exceed 1.2 times that of the ND scenario. The lower bound is defined as no less than the baseline, ensuring the maintenance of basic ecosystem functionality and stability.
660727 X 3 550606
Water area constraint: In recent years, documents such as the Ecological Protection Redline Delimitation Plan have emphasized the importance of protecting and restoring water resources. Given future measures such as water resource ecological restoration, wetland restoration, and strict water resource management, water areas have a certain potential for recovery and expansion. Therefore, the upper bound of the water area does not exceed 1.2 times the water area in the ND scenario, and the lower bound does not fall below this same baseline to ensure ecological security.
200307 X 4 180307
Unused land area constraint: The upper bound of unused land does not exceed 1.2 times the area in the ND scenario, and the lower bound is not less than 0.8 times that area, to control its reasonable fluctuation range.
2551 X 5 1817
Construction land area constraint: Based on the Planning, which stipulates that its future extent should be controlled within 1.3 times its 2020 level, this study sets this value as the upper bound. Given the difficulty in converting construction land to other LULC types, the lower bound is not less than its area in 2020.
200307 X 6 180307
Economic Value Constraint: To ensure regional economic development, the economic value of LULC in the optimization scenarios must not be lower than that in the ND scenario.
k = 1 6 X i A i k = 1 6 W i A i
Carbon Emission Constraint: To achieve the regional carbon reduction target, the total carbon emissions in the optimization scenarios must not exceed the level in the ND scenario, ensuring effective emission control while optimizing LULC structure and promoting economic development.
k = 1 6 W i B i k = 1 6 X i B i
Carbon Storage Constraint: In the optimization scenarios, carbon storage should not be lower than the level in the ND scenario, in order to ensure that the carbon sequestration capacity is not compromised.
k = 1 6 X i C i k = 1 6 W i C i
Vegetation coverage constraint: To prevent vegetation degradation and maintain ecosystem stability, the regional vegetation coverage in the optimization scenarios must not be lower than that in the ND scenario. The coverage is calculated using the “Ecological Green Equivalent” method, which assigns specific vegetation coverage coefficients to land types with green vegetation, allowing for a comprehensive assessment of regional vegetation coverage [48,49,50]. In this study, the coefficients for cropland, forest, and grassland were set to 0.46, 1.00, and 0.49, respectively.
0.46 X 1 + X 2 + 0.49 X 3 14670995 0.46 W 1 + W 2 + 0.49 W 3 14670995
Landscape Diversity Constraint: To maintain the stability and diversity of regional ecological landscapes, the total proportion of ecological LULC types, including forests, grasslands, and water, in the optimization scenarios must not be lower than that in the ND scenario, to ensure the integrity of the ecosystem and enhance ecological resilience.
X 2 + X 3 + X 4 14670995 W 2 + W 3 + W 4 14670995
X i and W i represent the area of LULC type i under the optimization and ND scenario, respectively.

2.3.5. Optimization of LULC Spatial Layout

The PLUS model first identifies LULC changes by comparing historical and current data to extract land expansion information. Subsequently, it applies the random forest algorithm to estimate expansion probabilities for each LULC category and simulates future LULC spatial configurations using established transition rules and weights [51,52].

2.3.6. Accuracy Validation of the PLUS

The accuracy of the PLUS model in simulating LULC in Liaoning Province for 2030 was assessed from two perspectives: quantitative structure and spatial pattern. LULC data from 2000 and 2010 were first used in the Markov–Chain module to predict the quantity structure for 2020. This module extracts transition rules from historical data to predict future LULC quantity structures. Influenced by multiple factors, the predicted LULC outcomes may not fully align with the actual observations in 2020. However, as shown by the prediction results (Table 5), the error proportions for the six LULC types were 0.2385%, 0.194%, 0.0257%, 0.3857%, 0.0259%, and 0.0047%, respectively. The relatively small overall error suggests that the model is highly reliable in quantitative structure prediction.
Second, the Kappa coefficient and overall accuracy for the 2020 LULC spatial simulation were 0.89 and 0.93, respectively, indicating that the model has high accuracy in simulating LULC spatial configuration.

3. Results

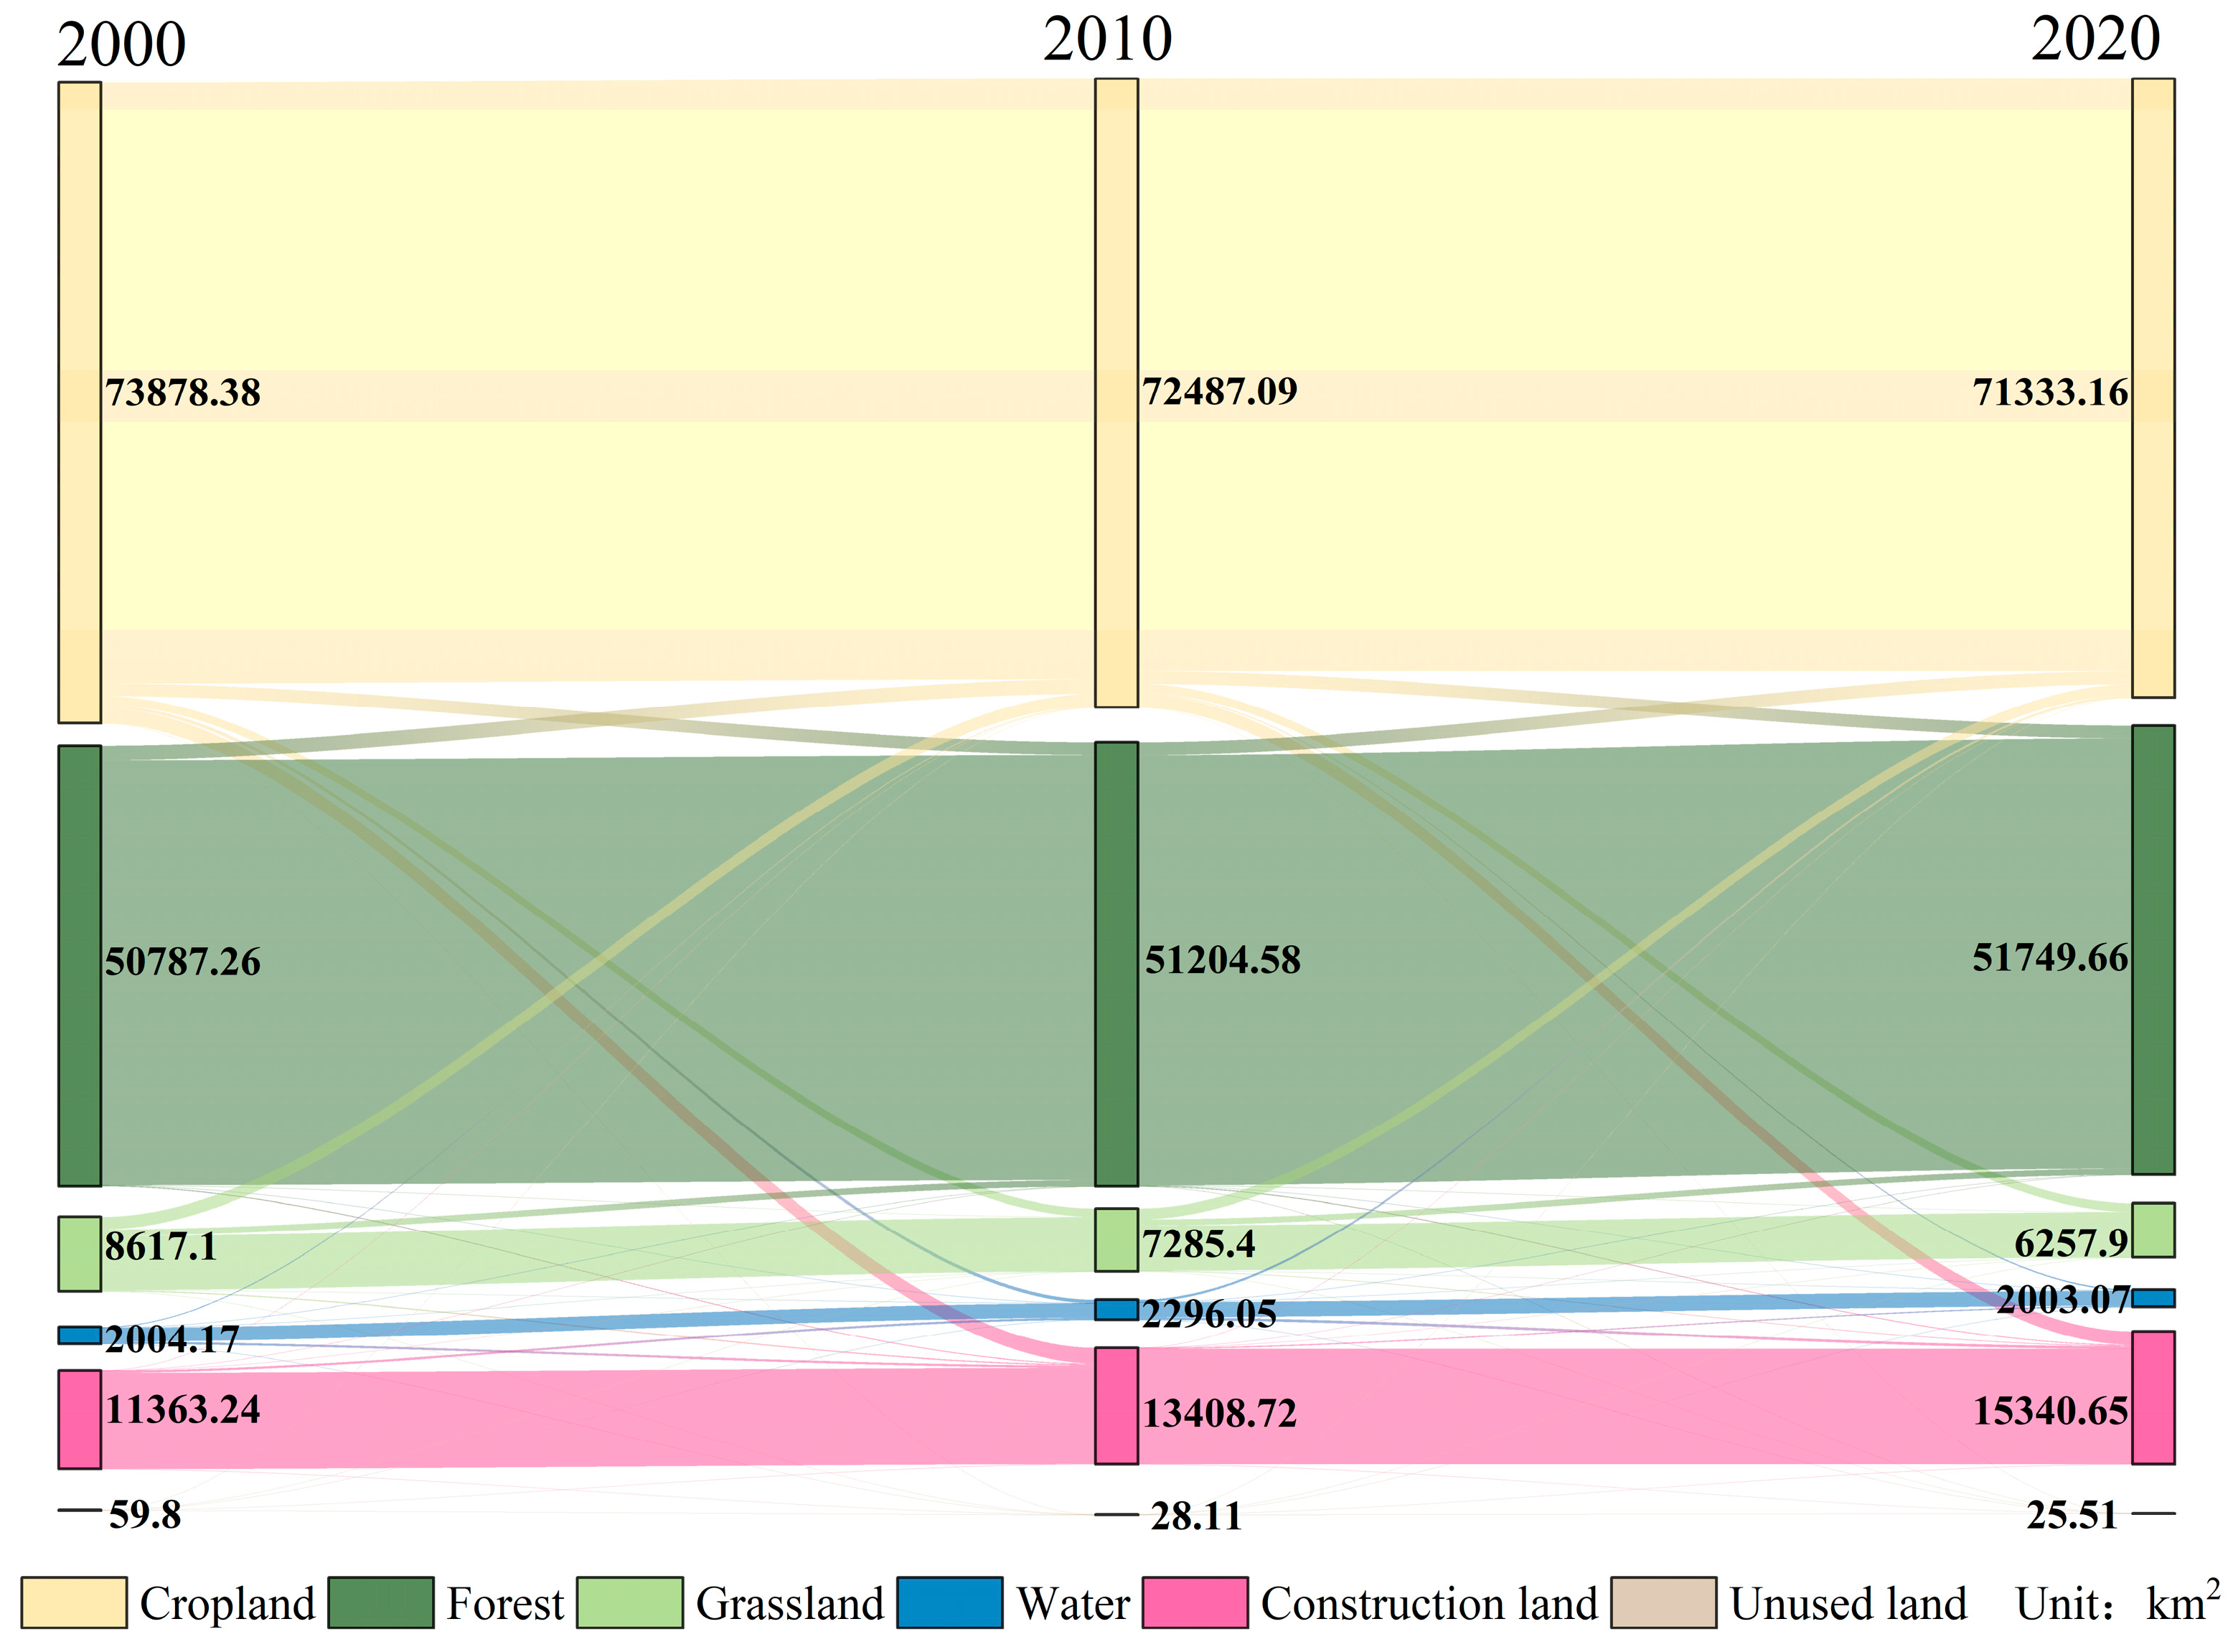
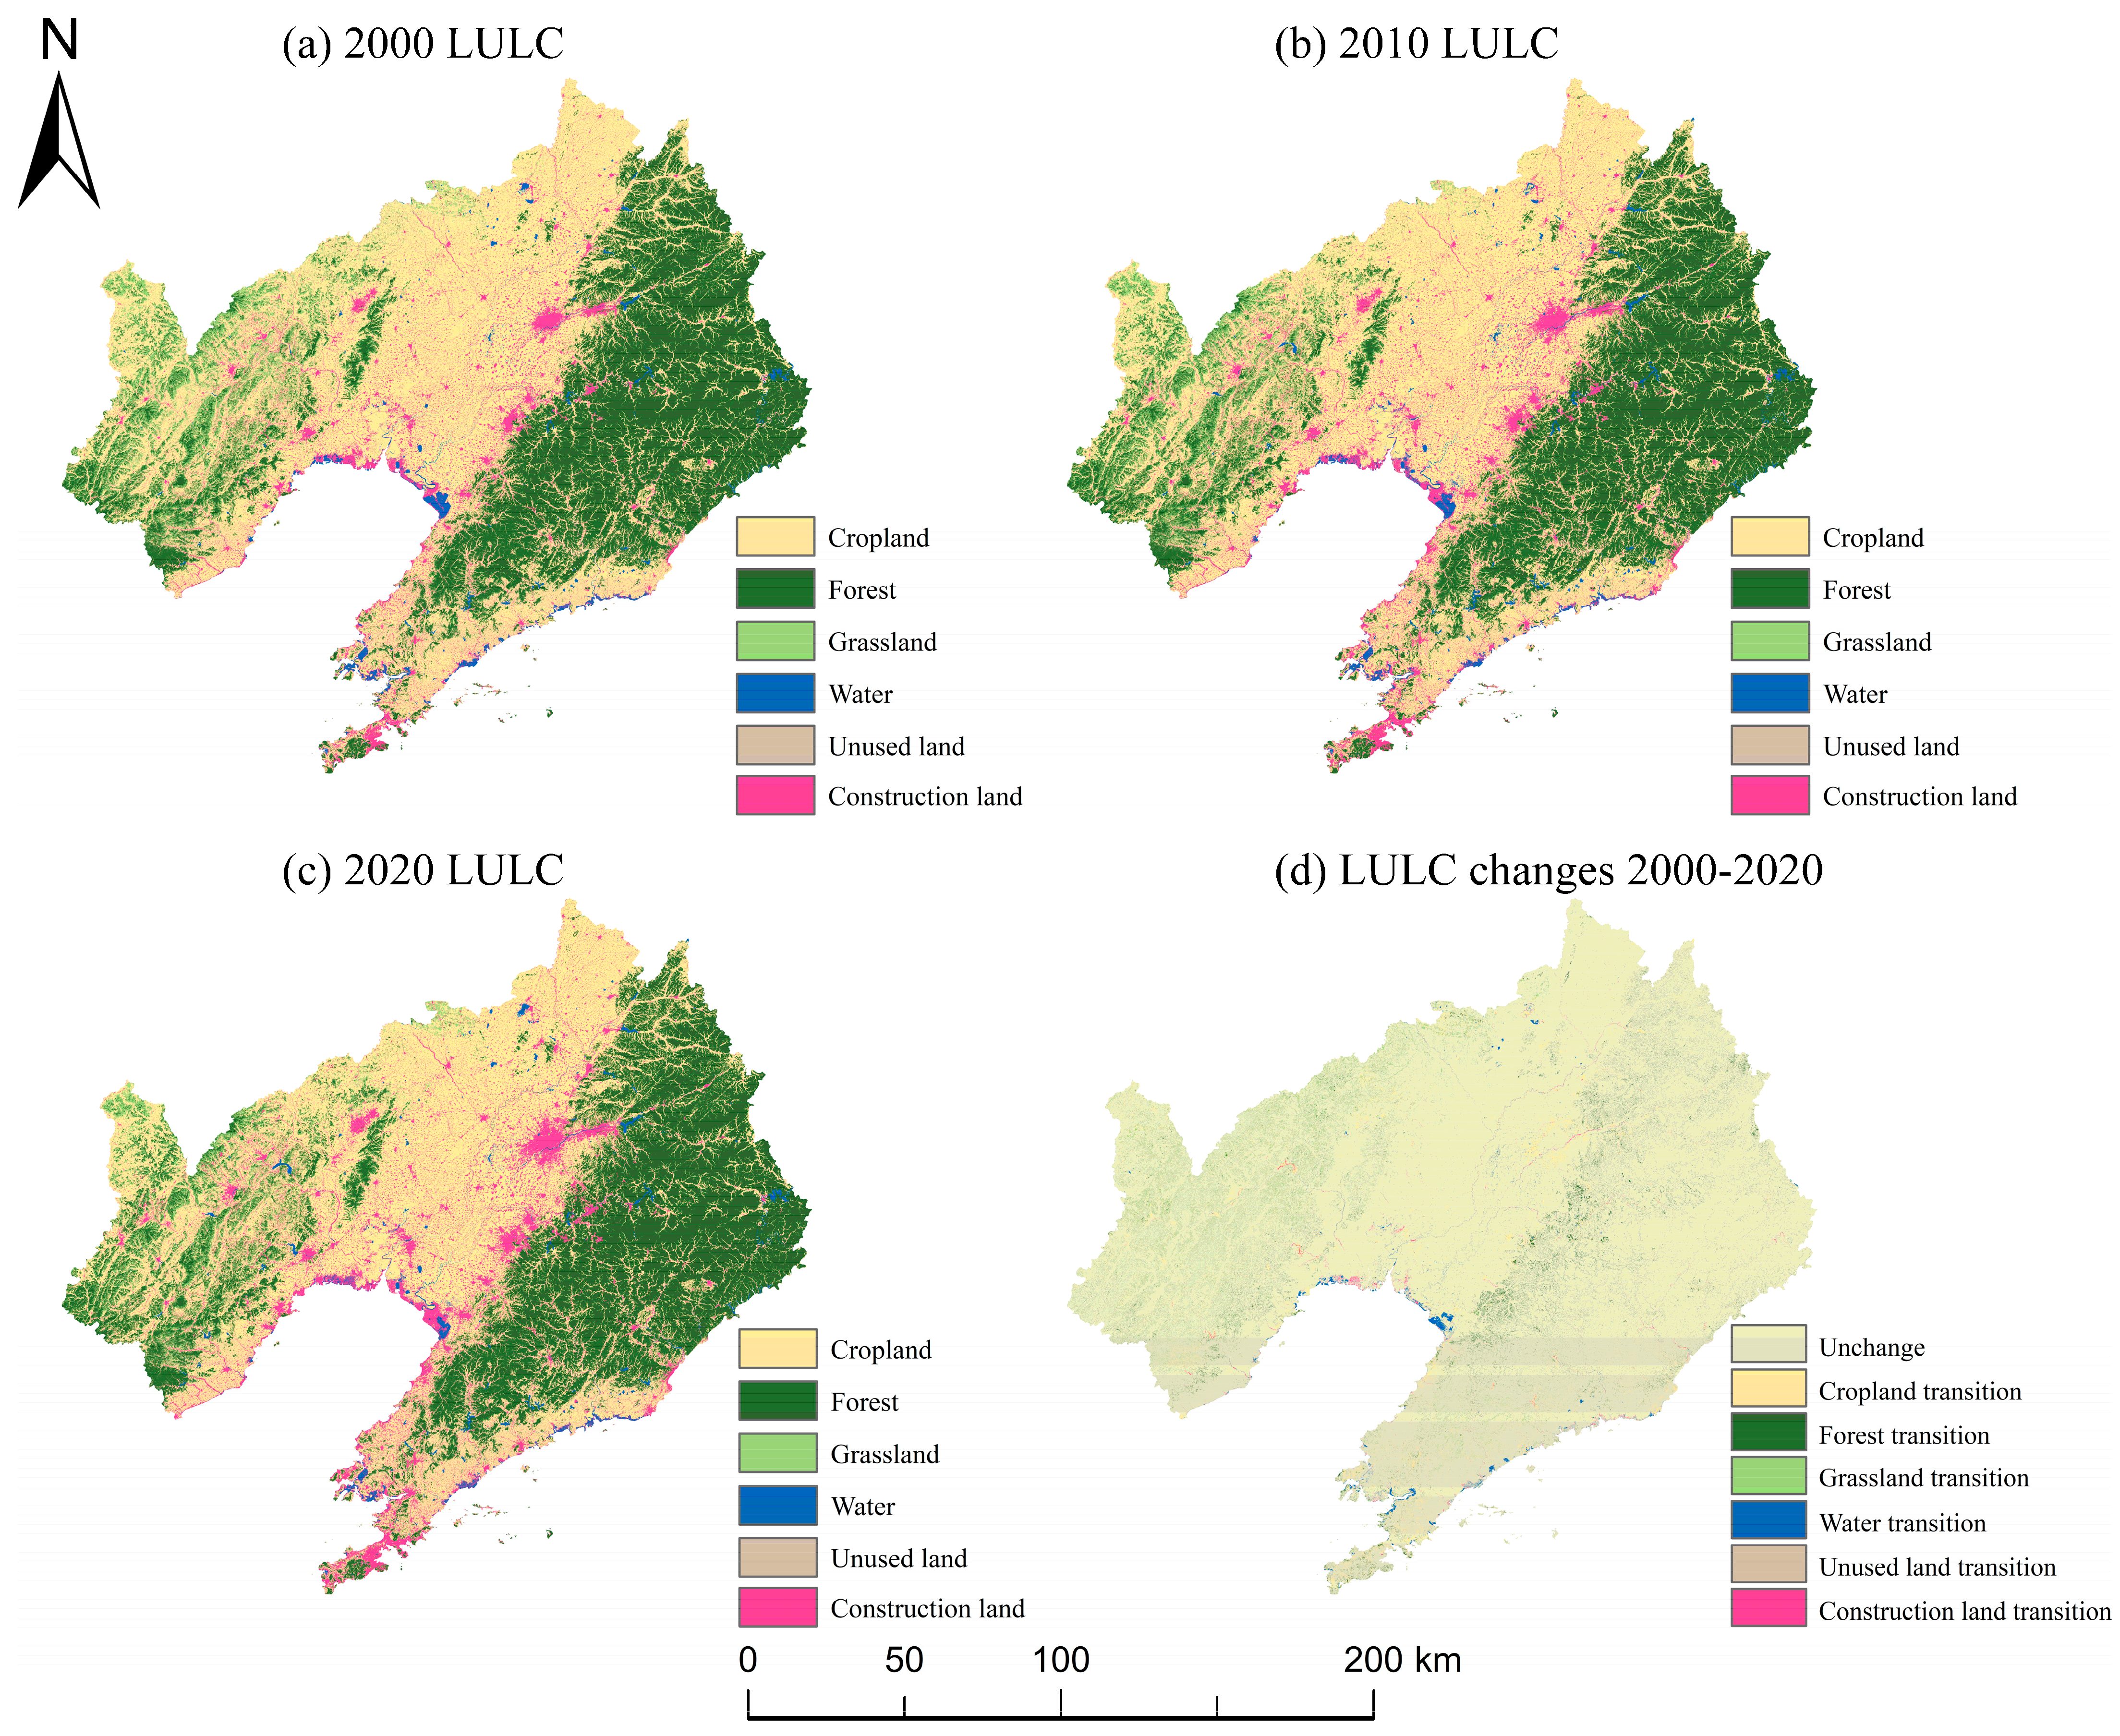
3.1. Spatiotemporal Dynamics of LULC

Between 2000 and 2020, cropland and forest were the dominant LULC types in Liaoning Province, followed by grassland and construction land as secondary landscape types, while water and unused land occupied relatively small proportions. During the study period, cropland and grassland areas declined notably, with cumulative decreases of 1.74% and 1.60%, respectively. In contrast, construction land expanded rapidly, with a cumulative increase of 2.72%. As shown in Figure 3, Liaoning Province experienced significant LULC transformations, with a total transition area of 14,110 km2, representing 9.63% of the province’s total area. Different LULC types underwent varying degrees of transformation, particularly in cropland, forest, construction land, and grassland, where substantial changes were observed. Specifically, 3360 km2 of cropland was converted to construction land, constituting 78.42% of the total area transferred into this type. Meanwhile, 1989 km2 of cropland and 1413 km2 of grassland were converted into forest, collectively accounting for 99.81% of the total area transferred into forest land.
From the perspective of LULC spatial patterns, Liaoning Province exhibits significant spatial differentiation (Figure 4). Cropland and construction land are primarily concentrated in the central region. Although urban expansion in recent years has gradually converted cropland into construction land, cropland still remains largely distributed in regions distant from major urban centers. Forests are concentrated in the eastern mountainous and western hilly regions. In the western hilly region, frequent transitions occur between grassland and forest, with a general trend of grassland being converted into forest. Construction land is distributed along the coastal economic belt and in major urban centers such as Shenyang, Dalian, and Anshan. The urbanization process in Liaoning Province has accelerated, with the continuous expansion of construction land in these areas. This expansion has significantly encroached upon surrounding cropland and grassland, forming a spatial pattern characterized by outward sprawl from urban centers.

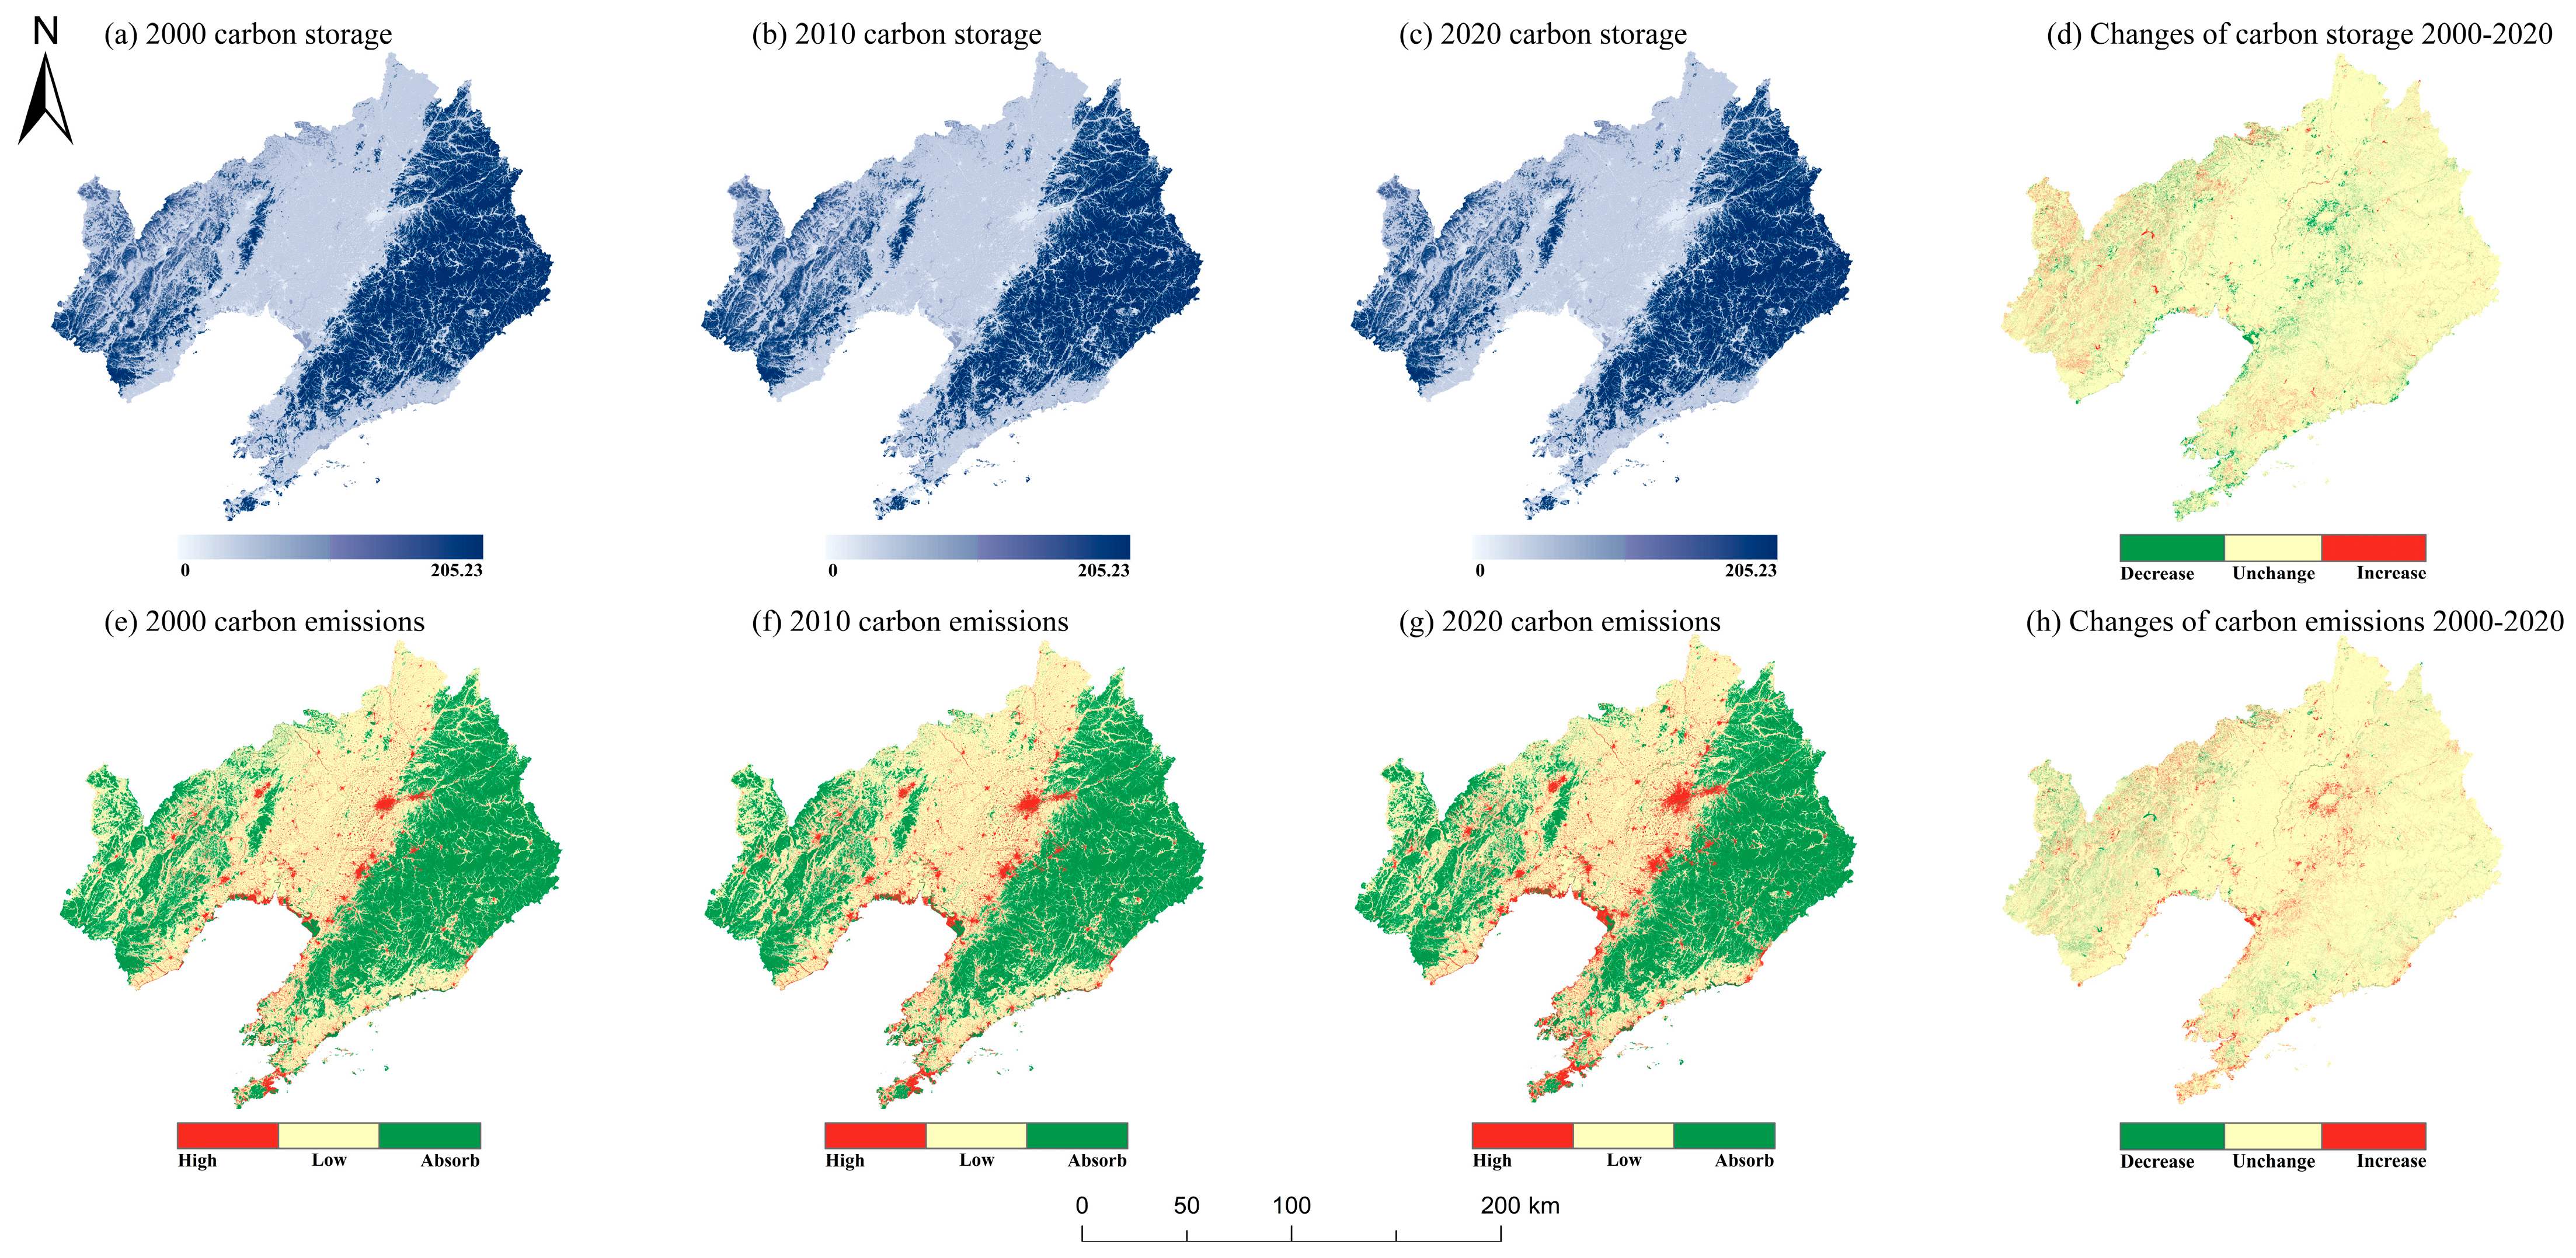
3.2. Dynamic Changes in ECS and LUCE from 2000 to 2020

From 2000 to 2020, a noticeable decline of 12.72 × 10⁶ t in total ECS was observed in Liaoning Province (Table 6). Among all LULC types, grassland experienced the most significant decline, with a reduction of 28.07 × 10⁶ t, comprising 74.22% of the total loss. In contrast, ECS in construction land and forest increased by 5.35 × 10⁶ t and 19.75 × 10⁶ t, respectively. Concurrently, LUCE increased from 95.29 × 10⁶ t in 2000 to 194.29 × 10⁶ t in 2010 and further rose to 245.73 × 10⁶ t in 2020, reaching 2.58 times the LUCE level in 2000.
Spatially, ECS displays a distinct gradient pattern, declining from the mountainous and hilly regions in the east and west toward the central Liaohe Plain (Figure 5). High ECS is predominantly distributed in the western and eastern regions, whereas low ECS is mainly distributed in the Liaohe River Plain. Across the majority of the study area, ECS remains relatively stable. Regions with increasing ECS are concentrated in the western agropastoral ecotone and eastern forest zones. Conversely, areas with declining ECS spatially coincide with the “One Circle, One Belt, and Two Zones” regional development strategy, which are largely concentrated in the Shenyang Modern Metropolitan Circle and the Liaoning Coastal Economic Belt. LUCE displays pronounced spatial clustering in major urban centers such as Shenyang, Dalian, Fuxin, Jinzhou, Yingkou, and Anshan. Although carbon emissions have remained relatively stable across most regions, notable increases are observed in areas characterized by high population density and intensive industrial activities. This spatial distribution is largely attributable to regional industrialization and urbanization processes and closely aligns with the spatial evolution trend of economic development layout in recent years.

3.3. Carbon Neutrality Potential of Different LULC Scenarios

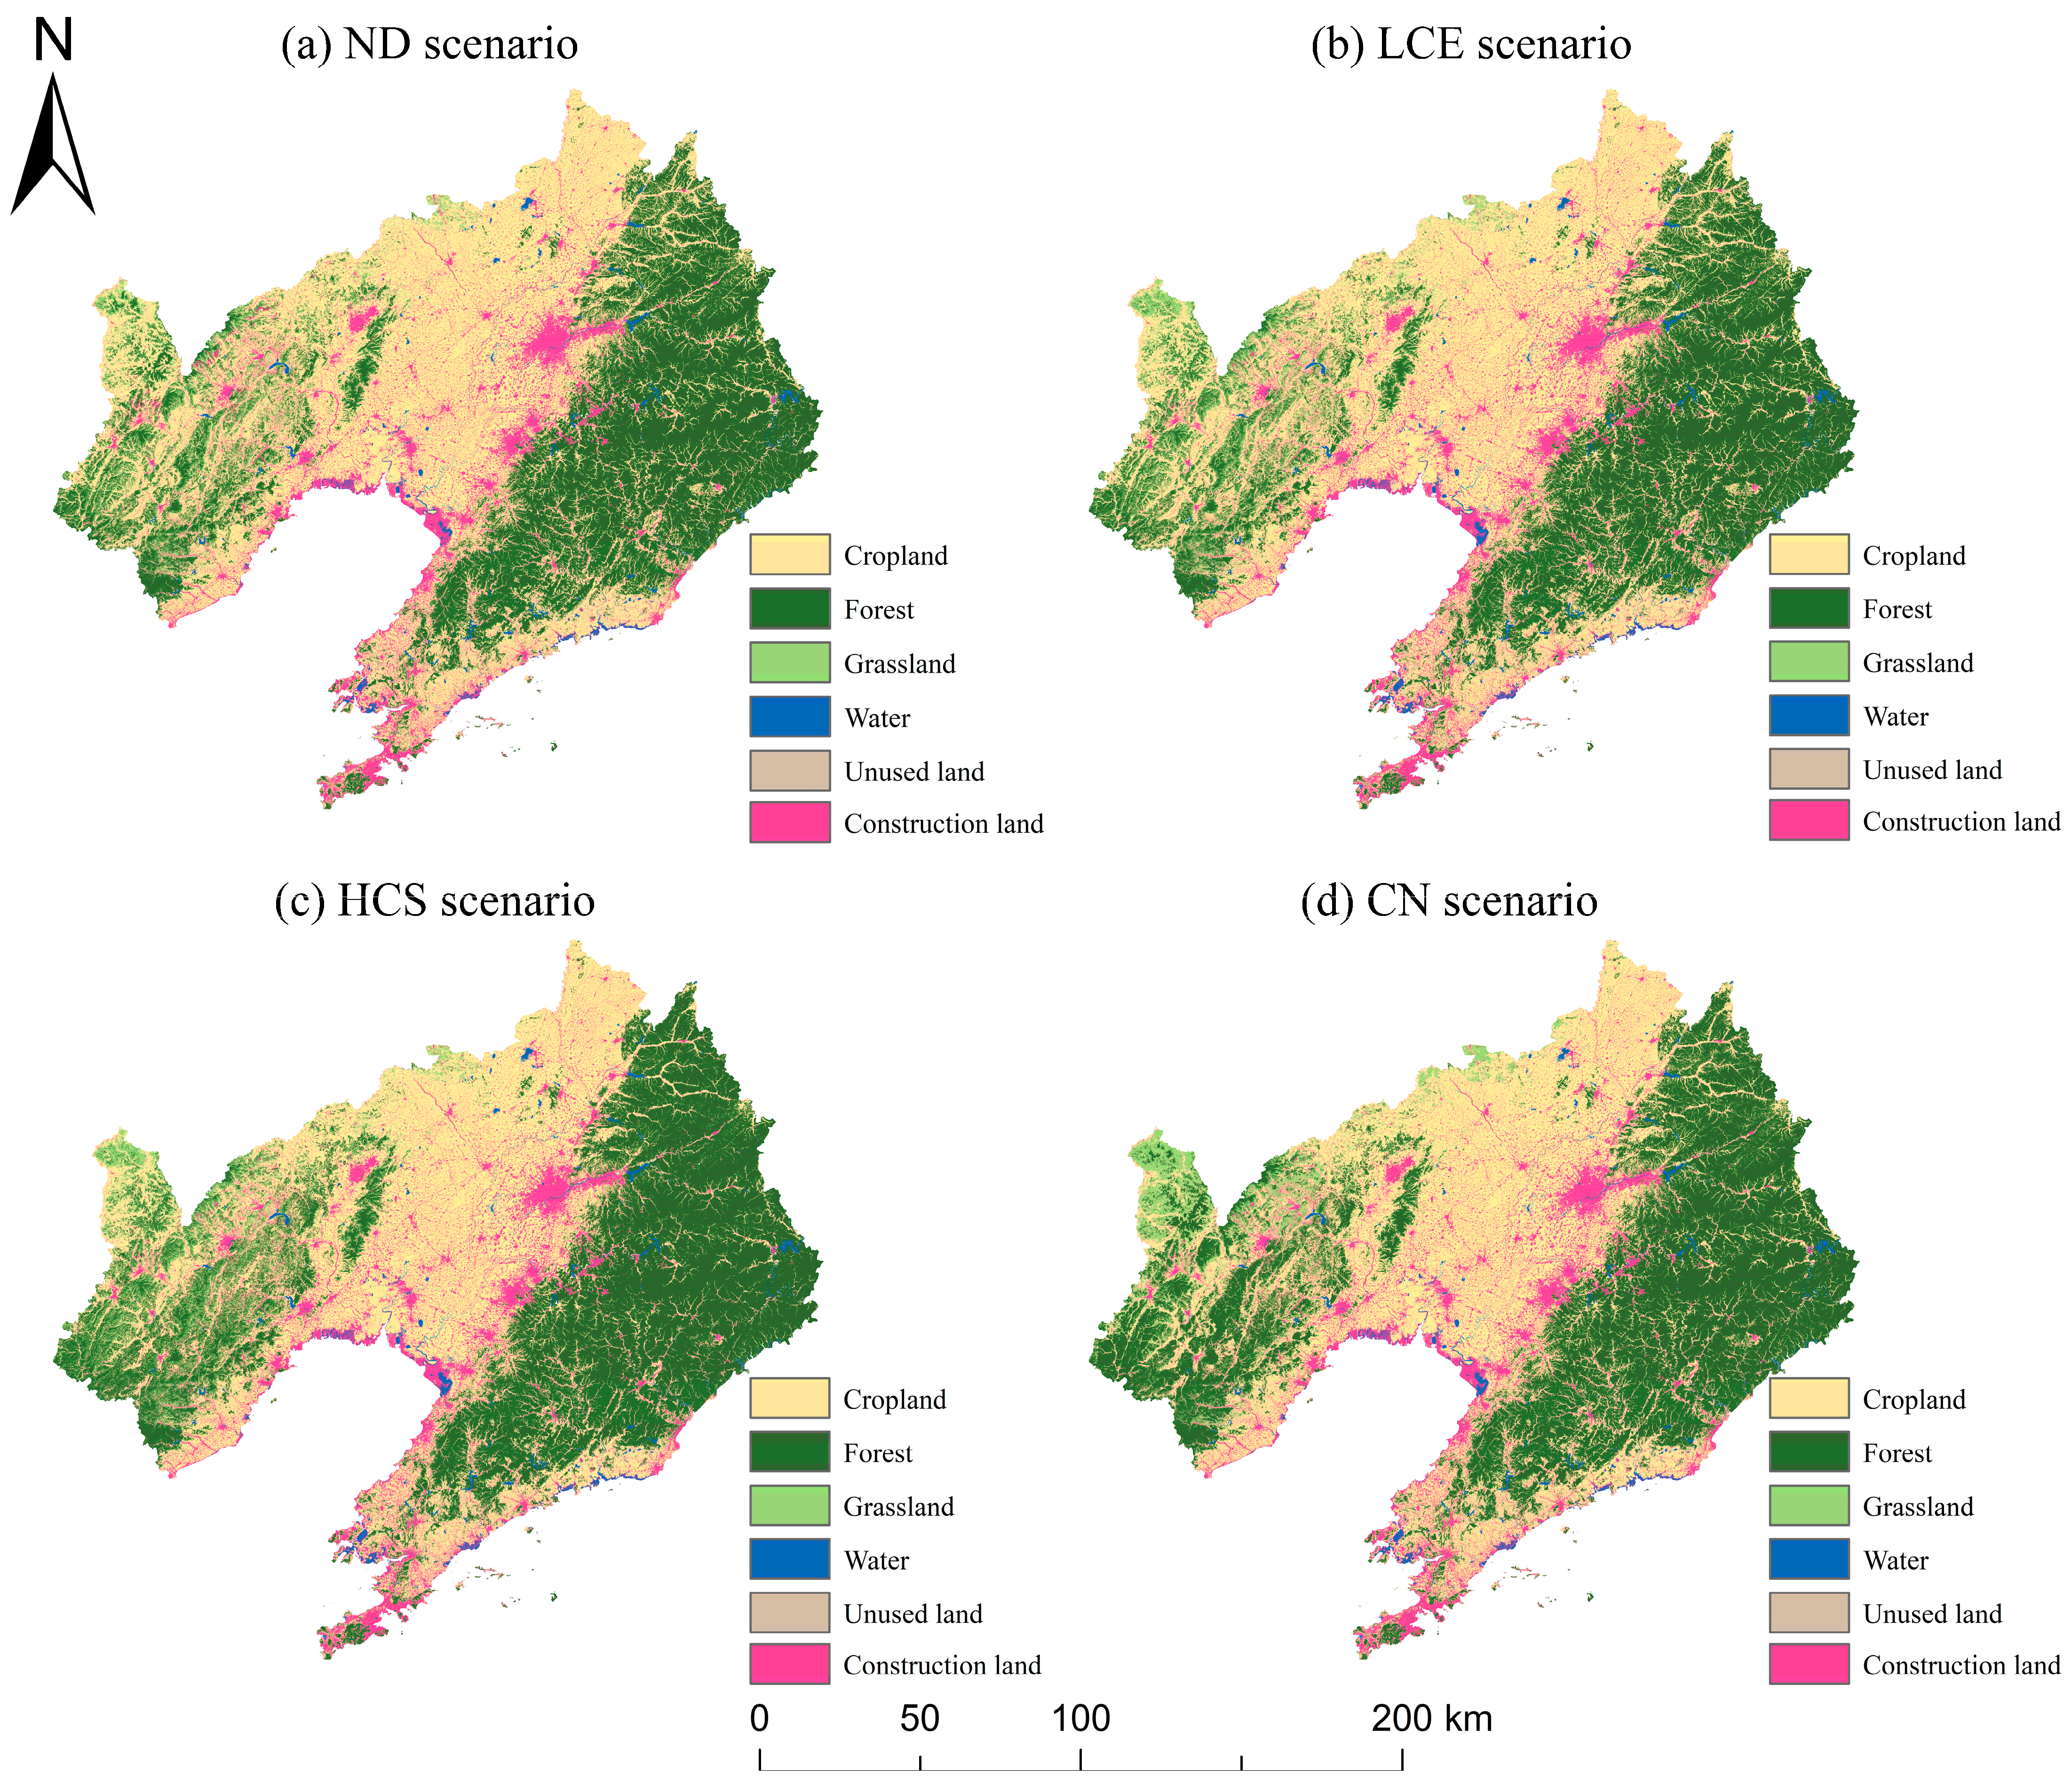
3.3.1. Future LULC Changes Under Different Scenarios

Under the four development scenarios, the LULC patterns in Liaoning Province exhibit significant variations (Table 7 and Figure 6). Under the ND scenario, the LULC structure continues historical evolution trends. Cropland exhibits the most substantial reduction, with a total decrease of 1284.09 km2, while construction land shows the most pronounced expansion, increasing by 1834.46 km2. Under the LCE scenario, construction land expanded by 1708.41 km2 between 2020 and 2030 with the objective of reducing LUCE while ensuring continued economic development. Although expansion persisted, its magnitude was effectively controlled compared to the ND scenario, reflecting a strategy of rationally guiding land expansion to reduce LUCE. Under the HCS scenario, the LULC development strategy focuses on expanding forest and grassland areas by reducing cropland, unused land, and water. Grassland and forest increased by 349.37 km2 and 7763.71 km2, respectively. Notably, among the four scenarios, this scenario exhibits the most significant expansion of construction land, indicating its capacity to enhance ECS while simultaneously meeting the demand for construction land driven by economic development. This reflects an optimized pathway for the coordinated advancement of carbon sink enhancement and economic growth. Under the CN scenario, the structure of LULC types resembles that of the HCS scenario; however, it retains more cropland, and the increases in forest and construction land are relatively limited. This reflects a more balanced development pathway.
Different LULC scenarios illustrate diverse pathways for future land resource utilization in Liaoning Province (Figure 6). Under the ND scenario, the expansion of construction land is primarily concentrated in peri-urban zones surrounding key cities such as Shenyang, Dalian, Anshan, Chaoyang, and Fuxin, demonstrating a distinct “urban core–suburban expansion” pattern. The Chaoyang region has experienced a notable increase in forest, driven by the “returning farmland to forest” policy. Under the LCE scenario, grassland and forest receive more effective protection than in the ND scenario, especially with marked expansion in the northwestern region of Chaoyang. The scale of construction land has been effectively regulated; although southern and central cities and coastal areas continue to serve as the primary expansion zones, the intensity of expansion exhibits a marked decline. This scenario reflects a strategy focused on achieving carbon emission reductions by restricting construction land expansion. In the HCS scenario, extensive and contiguous forest and grassland have developed in the western hilly and eastern mountainous regions of Liaoning. Both land types have a relatively high priority for protection and expansion, reflecting the scenario’s emphasis on enhancing regional carbon sequestration capacity and ecological functionality. The CN scenario integrates the features of both the LCE and HCS scenarios, achieving the coordinated advancement of construction land expansion control and ecological restoration. In central and southern cities, the spatial expansion of construction land becomes more concentrated, thereby meeting the rational development requirements of urban areas. Meanwhile, forest and grassland areas expand markedly in western hilly and eastern mountainous regions, enhancing the carbon sequestration capacity. This scenario achieves a favorable balance between urban growth and ecological conservation, and establishes a more coordinated, sustainable, and low-carbon land use pattern.

3.3.2. Contribution of Future LULC Scenarios to Carbon Neutrality

The contributions of LULC changes in Liaoning Province to carbon neutrality under different scenarios exhibit substantial variation (Table 8). Compared with the ND scenario, the LCE scenario achieves the most significant reduction in LUCE, amounting to 3.30 × 10⁶ t. ECS and economic value increase modestly by 10.04 × 10⁶ t and 200.30 × 10⁶ yuan, respectively, with the contribution to carbon neutrality reaching 13.34 × 10⁶ t. In the HCS scenario, LUCE is reduced and ECS shows the most substantial increase, rising by 132.60 × 10⁶ t. The contribution to carbon neutrality reaches 132.613 × 10⁶ t, while economic value experiences a substantial improvement, rising by 2230.66 × 106 yuan. Under the CN scenario, LUCE decreased by 0.18 × 10⁶ t, while ECS increased significantly by 118.84 × 10⁶ t, with a contribution of 119.02 × 10⁶ t to carbon neutrality. Meanwhile, economic value achieves the highest growth, reaching 3386.21 × 106 yuan.
Overall, the three optimization scenarios outperform the ND scenario in terms of economic benefits, LUCE reduction, and ECS enhancement. Among them, the LCE scenario demonstrates remarkable potential for LUCE reduction, while the HCS scenario excels in enhancing carbon sinks. The CN scenario achieves a relatively balanced development in LUCE reduction, ECS enhancement, and economic growth. It not only achieves the most significant increase in economic value but also exhibits a high contribution to carbon neutrality, possessing more comprehensive development potential.
Under the ND scenario, areas of increased ECS are sporadically distributed in the northwestern part of Chaoyang, while ECS reduction zones are located in western Liaoning, central cities such as Shenyang and Anshan, and coastal areas like Dalian (Figure 7). Under the LCE scenario, areas of increased ECS in regions such as Chaoyang and Fuxin have expanded, while the extent of ECS reduction has contracted, concentrated in the central urban agglomeration and the coastal area of Dalian. In the HCS scenario, areas with increased ECS are widely distributed across the western hilly region and the eastern mountainous region, forming a large-scale and contiguous spatial pattern. Under the CN scenario, the areas with increased ECS are highly consistent with those in the HCS scenario. However, the western region exhibits a more concentrated pattern, while the eastern region appears more fragmented. In addition, certain areas within Fuxin City exhibit a declining trend in ECS, which, in conjunction with the central urban agglomeration and coastal zones, constitute the primary ECS reduction zones. Spatial variation in LUCE reveals that regions with increased LUCE under different scenarios are largely spatially aligned with areas of decreased ECS, concentrated in the central urban agglomeration and coastal regions of Liaoning Province. In contrast, regions with decreased LUCE are consistent with areas of increased ECS, located in the western hilly areas and eastern mountainous regions.

4. Discussion

4.1. Impact of LULC Dynamics in Liaoning Province on Carbon Cycle

LULC changes modify the structure of terrestrial ecosystems, thereby directly affecting ECS and indirectly influencing LUCE [53]. This study investigated the impacts of LULC transitions on ECS and LUCE. Between 2000 and 2020, Liaoning Province experienced a total loss of 12.72 × 10⁶ t of ECS. This reduction was primarily driven by rapid urbanization, which resulted in the large-scale expansion of construction land, occupying a significant amount of farmland and grassland with strong carbon sequestration capabilities. Although in recent years initiatives such as the “Three-North Shelterbelt Project” and the “Grain for Green Program” have contributed to an expansion of forested areas and improved regional ECS, the additional ECS from newly afforested land has been insufficient to offset the carbon losses caused by the expansion of construction land, ultimately leading to a decline in total ECS. Li et al. noted that while ecological restoration has achieved certain improvements in ECS, it remains inadequate to fully compensate for the carbon losses driven by urban expansion [43]. Furthermore, construction land expansion is typically accompanied by increased energy consumption, which significantly elevates LUCE, thereby exacerbating the pressure of urbanization on the regional carbon cycle. In addition, this study reveals a high degree of spatial consistency between LULC changes and the carbon cycle (Figure 4d and Figure 5d,h). Specifically, regions undergoing LULC changes also exhibited corresponding dynamic changes in ECS and LUCE [26]. For example, in rapidly developing areas such as Shenyang, Anshan, and Dalian, large areas of cropland and forest have been transformed into construction land, leading to a significant decline in regional ECS. Concurrently, intensified energy consumption in these areas resulted in a significant increase in LUCE. This finding is consistent with the conclusions of Seto et al. and Wu et al., both of whom reveal that urban expansion significantly encroaches upon ecological land, reduces regional ECS, and further increases LUCE [1,54]. Some scholars believe that in areas with insignificant LULC changes, ECS and LUCE tend to remain relatively stable [35,55], and this study confirms this viewpoint. In areas with relatively stable LULC patterns, such as the Central Liaoning Plain and the Liaodong Region, overall variations in ECS and LUCE are relatively limited, due to the retention of large areas of cropland and forest.
Overall, Liaoning Province is currently facing the dual pressure of continuously decreasing ECS and increasing LUCE. Gu et al. and Fan et al. suggest that ecological protection policies can effectively enhance ECS and partially mitigate LUCE [5,53]. However, such measures often conflict with the practical needs of economic development. Therefore, integrating the objectives of enhancing ECS and reducing LUCE into the LULC optimization framework, while ensuring economic development, is of great significance for advancing the carbon neutrality process and achieving high-quality economic development.

4.2. Impact of Different Future Development Scenarios on ECS and LUCE

This study analyzed the changes in ECS and LUCE under different LULC scenarios during the period from 2020 to 2030. The results show that the optimization scenarios are superior to the ND scenario in enhancing carbon storage, reducing carbon emissions, and promoting economic growth (Table 8). Under the ND scenario, to meet economic development demands, Liaoning Province continued its historical trend of LULC transition, converting large areas of ecological land into construction land, which significantly weakened the region’s carbon sink capacity. Meanwhile, the accelerated urbanization process led to a continuous increase in energy demand, resulting in higher carbon emission levels and further intensifying the pressure to achieve carbon neutrality [56]. Given the difficulty of achieving carbon neutrality under the ND scenario, this study optimizes the LULC structure with the aim of enhancing carbon sinks, mitigating emissions, and promoting economic growth. Among them, the LCE scenario effectively curbed the rise in LUCE by restricting unregulated construction land expansion, while increasing forest and grassland areas to enhance ECS. The HCS scenario focuses on the expansion of ecological land to enhance carbon sequestration capacity. On the basis of strictly implementing the cropland protection redline policy, part of the cropland is converted into forest and grassland, with this land conversion trend being particularly evident in the eastern forest areas and the western agro-pastoral ecotone. Ren et al. analyzed the recent spatial variation trend of ECS in Liaoning Province, and found that the eastern and western regions possess strong carbon sink potential [44]. This finding is highly consistent with the spatial patterns of regions exhibiting high carbon sink enhancement potential under the HCS scenario in this study. The CN scenario significantly promoted regional economic growth through moderate expansion of construction land. Simultaneously, by increasing the proportion of ecological land, it significantly enhanced ECS, thereby absorbing a large amount of greenhouse gases and substantially reducing LUCE. This result is consistent with previous studies. Chen et al. pointed out that increasing grassland and forest significantly improves carbon sink capacity. At the same time, moderately expanding cropland and construction land to meet economic development needs helps to improve both ecological and economic value, thereby achieving carbon neutrality [26]. Similarly, Wang et al. proposed that, on the basis of expanding grassland areas, moderate expansion of construction land under strict adherence to land-use boundary regulations should be carried out to support urban development. This strategy not only ensures economic growth but also effectively controls LUCE and enhances regional ECS [50].
Among the various optimization scenarios established in this study, the CN scenario demonstrated a notable contribution to carbon neutrality while achieving the highest improvement in regional economic value, reflecting its effective coordination between low-carbon development and economic growth. These results collectively indicate that the CN scenario is the optimal LULC development pattern for the future of Liaoning Province. Under the dual context of the carbon neutrality goal and planning, the CN scenario provides theoretical guidance for LULC management in Liaoning Province to accelerate the achievement of carbon neutrality.

4.3. Policy Recommendations

This study outlines the following policy suggestions to provide guidance for future LULC planning and the accelerated achievement of carbon neutrality.
(1) To curb the disorderly growth of construction land, it is necessary to strictly implement the urban development boundaries delineated in the Planning, confine new construction land strictly within these boundaries, and prioritize meeting new land demands through redevelopment and the reuse of inefficient land within the boundaries. In addition, given the typically high carbon emissions associated with construction land, introducing a carbon tax policy can increase its cost of use, thereby discouraging its expansion.
(2) The eastern forest areas and the western agro-pastoral ecotone of Liaoning Province have significant carbon sink potential. To fully leverage the carbon sink functions of these areas, it is recommended to strengthen the constraints of ecological protection redlines, preventing forest land from being converted to high-carbon-emission land use. Meanwhile, the “returning farmland to forest” program should continue to be promoted, with priority given to areas with steep slopes, severe soil erosion, or ecological sensitivity, and the quality of afforestation should be improved by selecting species scientifically. Additionally, it is suggested to impose ecological compensation fees on activities such as resource extraction and occupation within forest areas, and to allocate these funds specifically to support afforestation programs and ecological restoration efforts.
(3) Cropland areas in Liaoning Province have shown a declining trend. To address this challenge, it is recommended to shift the focus of cropland protection from quantity assurance to quality improvement and comprehensively promote the construction of high-standard farmland. Soil fertility can be enhanced through reasonable crop rotation, while irrigation systems and farmland shelterbelts can be improved to strengthen drought resistance, disaster prevention capacity, and the overall stability and productivity of cropland. Meanwhile, develop low-carbon agriculture to transform the resource advantage of cropland into the carbon sequestration advantage of cropland ecosystems. Promote the technology of returning straw to the field to enhance the carbon sequestration capacity of cropland.

4.4. Limitations

This study developed four distinct LULC development scenarios, each designed to address specific development-oriented objectives. By quantifying the contributions of each scenario to carbon neutrality, the study explores the optimal LULC development pathways suited to the study area. However, this study has several limitations. First, the definition of constraint conditions involves a degree of subjectivity and requires adaptation to the specific developmental needs of different regions [57]. Second, in estimating ECS in Liaoning Province using the InVEST model, the effects of spatial heterogeneity and interannual variability in carbon density within the same LULC type were not taken into account [58]. Furthermore, this study selected 13 driving factors to simulate future LULC at a large spatial scale. However, the driving mechanisms of LULC change vary across space, and LULC changes in local areas may be predominantly influenced by other potential driving factors [59]. Therefore, future research should adopt a zonal simulation strategy by shifting from large-scale to small-scale simulations to better identify the dominant factors in various regions. Meanwhile, development plans of local governments should be fully considered and integrated as critical driving factors into the PLUS modeling framework, thereby enhancing the applicability of LULC simulations.

5. Conclusions

This study selects Liaoning Province, a typical heavy industrial area, as the study area to examine the effects of LULC changes on ECS and LUCE during 2000 and 2020. Based on the carbon neutrality goal, four development scenarios (ND, LCE, HCS, and CN) were constructed, and their respective contributions to carbon neutrality and economic benefits were evaluated. The findings indicate the following:
(1) Between 2000 and 2020, the LULC structure in Liaoning Province experienced significant changes, with a sustained decrease in farmland and grassland, accompanied by gradual growth in forest and construction land. The dominant transitions included the conversion of cropland to construction land and the transformation of grasslands into forest. These transitions caused a considerable drop of 12.72 × 10⁶ t in ECS and a rise of 150.44 × 10⁶ t in LUCE, indicating that the expansion of construction land outpaced the restoration of ecological land, thereby disrupting the regional carbon balance. Moreover, a strong spatial correlation was observed between LULC alterations and the spatial distribution of both ECS and LUCE.
(2) The LULC patterns in Liaoning Province in 2030 show substantial variation across four scenarios. Under the ND scenario, construction land expands significantly. In the LCE scenario, although construction land continues to expand, the intensity of expansion is significantly reduced compared to the ND scenario, and grassland and forest are effectively preserved. The HCS scenario significantly enhances the carbon sink capacity by greatly increasing forest and grassland areas. Under the CN scenario, forest and construction land expand moderately. Moreover, the contributions of different scenarios to achieving the carbon neutrality goal vary significantly. In the LCE, HCS, and CN scenarios, LUCE is reduced by 3.30 × 10⁶ t, 0.013 × 10⁶ t, and 0.18 × 10⁶ t, respectively; ECS increases by 10.04 × 10⁶ t, 132.60 × 10⁶ t, and 118.84 × 10⁶ t, and the economic value increases by 200.30 × 10⁶ yuan, 2230.66 × 106 yuan, and 3386.21 × 106 yuan, respectively. Among them, the CN scenario achieves relatively balanced development, with a significant contribution to carbon neutrality and the highest increase in economic benefits. This scenario possesses more comprehensive development potential and serves as the optimal LULC development model for Liaoning Province.

Author Contributions

Conceptualization, H.G. and S.L.; methodology, H.S.; software, S.L.; validation, C.H. and M.C.; formal analysis, H.S.; investigation, H.G.; resources, H.G.; data curation, S.L.; writing—original draft preparation, S.L.; writing—review and editing, H.G.; visualization, X.D.; supervision, X.D.; project administration, H.G.; funding acquisition, H.G. All authors have read and agreed to the published version of the manuscript.

Funding

This research was funded by the National Key R&D Program Project (2024YFD1500601).

Data Availability Statement

Dataset is available upon request from the authors.

Conflicts of Interest

The authors declare no conflicts of interest.

References

  1. Wu, Q.; Wang, L.; Wang, T.; Ruan, Z.; Du, P. Spatial–Temporal Evolution Analysis of Multi-Scenario Land Use and Carbon Storage Based on PLUS-InVEST Model: A Case Study in Dalian, China. Ecol. Indic. 2024, 166, 112448. [Google Scholar] [CrossRef]
  2. Wang, Y.; Guo, C.; Du, C.; Chen, X.; Jia, L.; Guo, X.; Chen, R.; Zhang, M.; Chen, Z.; Wang, H.; et al. Carbon Peak and Carbon Neutrality in China: Goals, Implementation Path, and Prospects. China Geol. 2021, 4, 1–27. [Google Scholar] [CrossRef]
  3. Ma, X.-Y.; Xu, Y.-F.; Sun, Q.; Liu, W.-J.; Qi, W. Contributing to Carbon Neutrality Targets: A Scenario Simulation and Pattern Optimization of Land Use in Shandong Province Based on the PLUS Model. Sustainability 2024, 16, 5180. [Google Scholar] [CrossRef]
  4. Wei, B.; Kasimu, A.; Reheman, R.; Zhang, X.; Zhao, Y.; Aizizi, Y.; Liang, H. Spatiotemporal Characteristics and Prediction of Carbon Emissions/Absorption from Land Use Change in the Urban Agglomeration on the Northern Slope of the Tianshan Mountains. Ecol. Indic. 2023, 151, 110329. [Google Scholar] [CrossRef]
  5. Gu, H.; Li, J.; Wang, S. Multi-Scenario Simulation of Land Use/Cover Change and Terrestrial Ecosystem Carbon Reserve Response in Liaoning Province, China. Sustainability 2024, 16, 8244. [Google Scholar] [CrossRef]
  6. Zhao, C.; Liu, Y.; Yan, Z. Effects of Land-Use Change on Carbon Emission and Its Driving Factors in Shaanxi Province from 2000 to 2020. Environ. Sci. Pollut. Res. 2023, 30, 68313–68326. [Google Scholar] [CrossRef] [PubMed]
  7. Wang, Y.; Zhang, Z.; Chen, X. Land Use Transitions and the Associated Impacts on Carbon Storage in the Poyang Lake Basin, China. Remote Sens. 2023, 15, 2703. [Google Scholar] [CrossRef]
  8. Zhai, Y.; Zhai, G.; Chen, Y.; Liu, J. Research on Regional Terrestrial Carbon Storage Based on the Pattern-Process-Function. Ecol. Inform. 2024, 80, 102523. [Google Scholar] [CrossRef]
  9. Tang, H.; Liu, X.; Xie, R.; Lin, Y.; Fang, J.; Yuan, J. Response of Carbon Energy Storage to Land Use/Cover Changes in Shanxi Province, China. Energies 2024, 17, 3284. [Google Scholar] [CrossRef]
  10. Chuai, X.; Huang, X.; Wang, W.; Zhao, R.; Zhang, M.; Wu, C. Land Use, Total Carbon Emissions Change and Low Carbon Land Management in Coastal Jiangsu, China. J. Clean. Prod. 2015, 103, 77–86. [Google Scholar] [CrossRef]
  11. Xia, X.; Yang, Z.; Xue, Y.; Shao, X.; Yu, T.; Hou, Q. Spatial Analysis of Land Use Change Effect on Soil Organic Carbon Stocks in the Eastern Regions of China between 1980 and 2000. Geosci. Front. 2017, 8, 597–603. [Google Scholar] [CrossRef]
  12. Dong, H.; Huang, Q.; Zhang, F.; Lu, X.; Zhang, Q.; Cao, J.; Gen, L.; Li, N. Path of Carbon Emission Reduction through Land Use Pattern Optimization under Future Scenario of Multi-Objective Coordination. Front. Environ. Sci. 2022, 10, 1065140. [Google Scholar] [CrossRef]
  13. Xia, C.; Zhang, J.; Zhao, J.; Xue, F.; Li, Q.; Fang, K.; Shao, Z.; Zhang, J.; Li, S.; Zhou, J. Exploring Potential of Urban Land-Use Management on Carbon Emissions—A Case of Hangzhou, China. Ecol. Indic. 2023, 146, 109902. [Google Scholar] [CrossRef]
  14. Niu, H.; Chen, S.; Xiao, D. Multi-Scenario Land Cover Changes and Carbon Emissions Prediction for Peak Carbon Emissions in the Yellow River Basin, China. Ecol. Indic. 2024, 168, 112794. [Google Scholar] [CrossRef]
  15. Jiang, H.; Cui, Z.; Fan, T.; Yin, H. Impacts of Land Use Change on Carbon Storage in the Guangxi Beibu Gulf Economic Zone Based on the PLUS-InVEST Model. Sci. Rep. 2025, 15, 6468. [Google Scholar] [CrossRef]
  16. He, F.; Yang, J.; Zhang, Y.; Yu, W.; Xiao, X.; Xia, J. Does Partition Matter? A New Approach to Modeling Land Use Change. Comput. Environ. Urban Syst. 2023, 106, 102041. [Google Scholar] [CrossRef]
  17. Hou, X.; Song, B.; Zhang, X.; Wang, X.; Li, D. Multi-Scenario Simulation and Spatial-Temporal Analysis of LUCC in China’s Coastal Zone Based on Coupled SD-FLUS Model. Chin. Geogr. Sci. 2024, 34, 579–598. [Google Scholar] [CrossRef]
  18. Jiao, M.; Hu, M.; Xia, B. Spatiotemporal Dynamic Simulation of Land-Use and Landscape-Pattern in the Pearl River Delta, China. Sustain. Cities Soc. 2019, 49, 101581. [Google Scholar] [CrossRef]
  19. Li, X.; Fu, J.; Jiang, D.; Lin, G.; Cao, C. Land Use Optimization in Ningbo City with a Coupled GA and PLUS Model. J. Clean. Prod. 2022, 375, 134004. [Google Scholar] [CrossRef]
  20. Feng, Y.; Liu, Y.; Tong, X.; Liu, M.; Deng, S. Modeling Dynamic Urban Growth Using Cellular Automata and Particle Swarm Optimization Rules. Landsc. Urban Plan. 2011, 102, 188–196. [Google Scholar] [CrossRef]
  21. Li, X.; Ma, X. An Improved Simulated Annealing Algorithm for Interactive Multi-Objective Land Resource Spatial Allocation. Ecol. Complex. 2018, 36, 184–195. [Google Scholar] [CrossRef]
  22. Xin, S.; Li, Z.; Chen, N.; Zhang, Z.; Zhang, X.; Chen, H.; Ma, X.; Kang, L. The Contribution of Multi-Objective Land Use Optimization to Reducing Ecological Risk: A Case Study of the Lanzhou-Xining Urban Agglomeration. Ecol. Indic. 2024, 168, 112604. [Google Scholar] [CrossRef]
  23. Wu, R.; Lan, H.; Cao, Y.; Li, P. Optimization of Low-Carbon Land Use in Chengdu Based on Multi-Objective Linear Programming and the Future Land Use Simulation Model. Front. Environ. Sci. 2022, 10, 989747. [Google Scholar] [CrossRef]
  24. Luan, C.; Liu, R.; Zhang, Q.; Sun, J.; Liu, J. Multi-Objective Land Use Optimization Based on Integrated NSGA–II–PLUS Model: Comprehensive Consideration of Economic Development and Ecosystem Services Value Enhancement. J. Clean. Prod. 2024, 434, 140306. [Google Scholar] [CrossRef]
  25. Liu, H.; Yan, F.; Tian, H. Towards Low-Carbon Cities: Patch-Based Multi-Objective Optimization of Land Use Allocation Using an Improved Non-Dominated Sorting Genetic Algorithm-II. Ecol. Indic. 2022, 134, 108455. [Google Scholar] [CrossRef]
  26. Chen, N.; Xin, C.; Zhang, B.; Xin, S.; Tang, D.; Chen, H.; Ma, X. Contribution of Multi-Objective Land Use Optimization to Carbon Neutrality: A Case Study of Northwest China. Ecol. Indic. 2023, 157, 111219. [Google Scholar] [CrossRef]
  27. Fu, M.; Ban, K.; Jin, L.; Wu, D. Balancing Economic Growth, Carbon Emissions, and Sequestration: A Multi-Objective Spatial Optimization in Zhengzhou Metropolitan Area in China. Land 2024, 13, 1526. [Google Scholar] [CrossRef]
  28. Sang, L.; Zhang, C.; Yang, J.; Zhu, D.; Yun, W. Simulation of Land Use Spatial Pattern of Towns and Villages Based on CA–Markov Model. Math. Comput. Model. 2011, 54, 938–943. [Google Scholar] [CrossRef]
  29. Jiang, W.; Deng, Y.; Tang, Z.; Lei, X.; Chen, Z. Modelling the Potential Impacts of Urban Ecosystem Changes on Carbon Storage under Different Scenarios by Linking the CLUE-S and the InVEST Models. Ecol. Model. 2017, 345, 30–40. [Google Scholar] [CrossRef]
  30. Liu, X.; Liang, X.; Li, X.; Xu, X.; Ou, J.; Chen, Y.; Li, S.; Wang, S.; Pei, F. A Future Land Use Simulation Model (FLUS) for Simulating Multiple Land Use Scenarios by Coupling Human and Natural Effects. Landsc. Urban Plan. 2017, 168, 94–116. [Google Scholar] [CrossRef]
  31. Liang, X.; Guan, Q.; Clarke, K.C.; Liu, S.; Wang, B.; Yao, Y. Understanding the Drivers of Sustainable Land Expansion Using a Patch-Generating Land Use Simulation (PLUS) Model: A Case Study in Wuhan, China. Comput. Environ. Urban Syst. 2021, 85, 101569. [Google Scholar] [CrossRef]
  32. Gu, M.; Ye, C.; Li, X.; Hu, H. Land-Use Optimization Based on Ecosystem Service Value: A Case Study of Urban Agglomeration around Poyang Lake, China. Sustainability 2022, 14, 7131. [Google Scholar] [CrossRef]
  33. Chuai, X.; Huang, X.; Lai, L.; Wang, W.; Peng, J.; Zhao, R. Land Use Structure Optimization Based on Carbon Storage in Several Regional Terrestrial Ecosystems across China. Environ. Sci. Policy 2013, 25, 50–61. [Google Scholar] [CrossRef]
  34. Han, D.; Qiao, R.; Ma, X. Optimization of Land-Use Structure Based on the Trade-Off Between Carbon Emission Targets and Economic Development in Shenzhen, China. Sustainability 2018, 11, 11. [Google Scholar] [CrossRef]
  35. Li, L.; Huang, X.; Yang, H. Optimizing Land Use Patterns to Improve the Contribution of Land Use Planning to Carbon Neutrality Target. Land Use Policy 2023, 135, 106959. [Google Scholar] [CrossRef]
  36. Ou, M.; Li, J.; Fan, X.; Gong, J. Compound Optimization of Territorial Spatial Structure and Layout at the City Scale from “Production–Living–Ecological” Perspectives. Int. J. Environ. Res. Public Health 2022, 20, 495. [Google Scholar] [CrossRef]
  37. Fu, H.; Cai, M.; Jiang, P.; Fei, D.; Liao, C. Spatial Multi-Objective Optimization towards Low-Carbon Transition in the Yangtze River Economic Belt of China. Landsc. Ecol. 2024, 39, 156. [Google Scholar] [CrossRef]
  38. Guo, W.; Teng, Y.; Yan, Y.; Zhao, C.; Zhang, W.; Ji, X. Simulation of Land Use and Carbon Storage Evolution in Multi-Scenario: A Case Study in Beijing-Tianjin-Hebei Urban Agglomeration, China. Sustainability 2022, 14, 13436. [Google Scholar] [CrossRef]
  39. Gu, H.; Liu, Y.; Qian, F.; Wang, Q.; Dong, X. An Empirical Analysis of the Factors Affecting Farmer Satisfaction Under the China Link Policy. Sage Open 2021, 11, 1–13. [Google Scholar] [CrossRef]
  40. Xiao, J.; Song, F.; Su, F.; Shi, Z.; Song, S. Quantifying the Independent Contributions of Climate and Land Use Change to Ecosystem Services. Ecol. Indic. 2023, 153, 110411. [Google Scholar] [CrossRef]
  41. Cao, A.; Zhang, J. Multi-Scenario Prediction of Ecosystem Services Value and Mechanism of Its Trade-Offs under the Township Scale—Evidence from Liaoning Province. Environ. Monit. Assess. 2025, 197, 204. [Google Scholar] [CrossRef] [PubMed]
  42. Li, Y.; Xu, B.; Li, Y.; Wan, Y. Impact of LULC in Coastal Cities on Terrestrial Carbon Storage and Ecosystem Service Value: A Case Study of Liaoning Province. Sustainability 2025, 17, 2889. [Google Scholar] [CrossRef]
  43. Li, P.; Chen, J.; Li, Y.; Wu, W. Using the InVEST-PLUS Model to Predict and Analyze the Pattern of Ecosystem Carbon Storage in Liaoning Province, China. Remote Sens. 2023, 15, 4050. [Google Scholar] [CrossRef]
  44. Ren, D.-F.; Cao, A.-H.; Wang, F.-Y. Response and Multi-Scenario Prediction of Carbon Storage and Habitat Quality to Land Use in Liaoning Province, China. Sustainability 2023, 15, 4500. [Google Scholar] [CrossRef]
  45. Zhang, C.; Zhao, L.; Zhang, H.; Chen, M.; Fang, R.; Yao, Y.; Zhang, Q.; Wang, Q. Spatial-Temporal Characteristics of Carbon Emissions from Land Use Change in Yellow River Delta Region, China. Ecol. Indic. 2022, 136, 108623. [Google Scholar] [CrossRef]
  46. Li, C.; Wu, Y.; Gao, B.; Zheng, K.; Wu, Y.; Li, C. Multi-Scenario Simulation of Ecosystem Service Value for Optimization of Land Use in the Sichuan-Yunnan Ecological Barrier, China. Ecol. Indic. 2021, 132, 108328. [Google Scholar] [CrossRef]
  47. Zhou, W.; He, J.-M. Generalized GM (1, 1) Model and Its Application in Forecasting of Fuel Production. Appl. Math. Model. 2013, 37, 6234–6243. [Google Scholar] [CrossRef]
  48. Liu, Y.; Ming, D.; Yang, J. Optimization of Land Use Structure Based on Ecological GREEN Equivalent. Geo-Spat. Inf. Sci. 2002, 5, 60–67. [Google Scholar] [CrossRef]
  49. Wang, X.; Xie, B.; Pei, T.; Chen, Y.; Shen, Y. Measurement of Spatial Conflicts and Multi-Scenario Simulation of “production-Living-Ecological” Spaces in the Lanzhou-Xining Urban Agglomeration Based on the MOP-PLUS Model. Res. Soil Water Conserv. 2025, 32, 363–372. [Google Scholar] [CrossRef]
  50. Wang, H.; Qiu, J.; Wu, J. Multi-Scenario Land Use Optimization Analysis of the Hohhot-Baotou-Ordos Urban Agglomeration under Dual Carbon Targets. Geogr. Res. 2025, 44, 656–675. [Google Scholar] [CrossRef]
  51. Qiu, J.; Ju, Z.; Wang, H.; Wu, J. The Double-Edged Sword Effects of Land Use Optimization Based on Dual Carbon Goals: A Perspective from Landscape Ecological Risk. J. Environ. Manag. 2025, 380, 125044. [Google Scholar] [CrossRef] [PubMed]
  52. Xu, L.; Liu, X.; Tong, D.; Liu, Z.; Yin, L.; Zheng, W. Forecasting Urban Land Use Change Based on Cellular Automata and the PLUS Model. Land 2022, 11, 652. [Google Scholar] [CrossRef]
  53. Fan, L.; Cai, T.; Wen, Q.; Han, J.; Wang, S.; Wang, J.; Yin, C. Scenario Simulation of Land Use Change and Carbon Storage Response in Henan Province, China: 1990–2050. Ecol. Indic. 2023, 154, 110660. [Google Scholar] [CrossRef]
  54. Seto, K.C.; Güneralp, B.; Hutyra, L.R. Global Forecasts of Urban Expansion to 2030 and Direct Impacts on Biodiversity and Carbon Pools. Proc. Natl. Acad. Sci. USA 2012, 109, 16083–16088. [Google Scholar] [CrossRef]
  55. Gong, W.; Duan, X.; Mao, M.; Hu, J.; Sun, Y.; Wu, G.; Zhang, Y.; Xie, Y.; Qiu, X.; Rao, X.; et al. Assessing the Impact of Land Use and Changes in Land Cover Related to Carbon Storage by Linking Trajectory Analysis and InVEST Models in the Nandu River Basin on Hainan Island in China. Front. Environ. Sci. 2022, 10, 1038752. [Google Scholar] [CrossRef]
  56. Zhang, Y.; Liu, Y.; Wang, Y.; Liu, D.; Xia, C.; Wang, Z.; Wang, H.; Liu, Y. Urban Expansion Simulation towards Low-Carbon Development: A Case Study of Wuhan, China. Sustain. Cities Soc. 2020, 63, 102455. [Google Scholar] [CrossRef]
  57. Zhu, L.; Song, R.; Sun, S.; Li, Y.; Hu, K. Land Use/Land Cover Change and Its Impact on Ecosystem Carbon Storage in Coastal Areas of China from 1980 to 2050. Ecol. Indic. 2022, 142, 109178. [Google Scholar] [CrossRef]
  58. Lai, J.; Qi, S.; Chen, J.; Guo, J.; Wu, H.; Chen, Y. Exploring the Spatiotemporal Variation of Carbon Storage on Hainan Island and Its Driving Factors: Insights from InVEST, FLUS Models, and Machine Learning. Ecol. Indic. 2025, 172, 113236. [Google Scholar] [CrossRef]
  59. Xu, X.; Wang, S.; Rong, W. Construction of Ecological Network in Suzhou Based on the PLUS and MSPA Models. Ecol. Indic. 2023, 154, 110740. [Google Scholar] [CrossRef]
Figure 1. Location of the study area.
Land 14 01585 g001
Figure 2. Research framework of this study.
Land 14 01585 g002
Figure 3. Sankey diagram of LULC types in Liaoning region from 2000 to 2020.
Land 14 01585 g003
Figure 4. Spatial patterns of LULC from 2000 to 2020. (ac) Spatial distribution of LULC in 2000, 2010, and 2020; (d) Changes in LULC types from 2000 to 2020.
Land 14 01585 g004
Figure 5. Spatial distribution of ECS and LUCE from 2000 to 2020. (ac) Spatial distribution of ECS in 2000, 2010, and 2020; (d) Changes in ECS from 2000 to 2020; (eg) Spatial distribution of LUCE in 2000, 2010, and 2020; (h) Changes in LUCE from 2000 to 2020.
Land 14 01585 g005
Figure 6. Spatial distribution of LULC in four different scenarios in 2030.
Land 14 01585 g006
Figure 7. Changes in ECS and LUCE from 2020 to 2030 under different scenarios. (ad) Changes in ECS from 2020 to 2030 under the ND, LCE, HCS, and CN scenarios, respectively; (eh) Changes in LUCE from 2020 to 2030 under the ND, LCE, HCS, and CN scenarios, respectively.
Land 14 01585 g007
Table 1. Data sources.
Data TypeAttributeSpatial ResolutionYear(s)Source
LULC dataLULCRaster 30 m2000–2020China Land Cover Dataset (https://doi.org/10.5281/zenodo.8176941)
(accessed on 10 June 2024)
Socio-economic
factors
Population
GDP
Raster 1 km2020Resource and Environment Science Data Center
(https://www.resdc.cn)
(accessed on 10 June 2024)
Main roads
Secondary roads
Third-class road
Government
Railway
Highway
River
Vector data2020Open Street Map
(https://www.openhistoricalmap.org)
(accessed on 17 June 2024)
Climate and environmental factorsDEM
Slope
Raster 90 m2020Geospatial Data Cloud
(https://www.gscloud.cn)
(accessed on 20 June 2024)
Temperature
Precipitation
Raster 100 m2020Resource and Environment Science Data Center (https://www.resdc.cn)
(accessed on 10 June 2024)
Statistical YearbookGDPStatistics2020–2020Liaoning Provincial Bureau of Statistics
(https://www.stats.gov.cn)
(accessed on 17 June 2024)
Table 2. Carbon density of LULC types (t/hm2).
LULC TypeAbovegroundBelowgroundSoil OrganicDead Organic
Cropland4.75033.510
Forest49.624.97128.671.99
Grassland24.3819.5952.2922.74
Water2.450.6280.110.1
Unused land0000
Construction land4.332.176.370.58
Table 3. Standard coal conversion coefficient and emission factor.
Energy TypeConversion Coefficient (t/t)Emission Factor (t/hm2)
Coal0.71430.7559
Coke0.97140.855
Crude oil1.42860.5857
Gasoline1.47140.5538
Kerosene1.47140.5714
Diesel1.45710.5921
Fuel oil1.42860.6185
Nature gas1.21430.4483
Electricity0.12290.2132
Table 4. LULC economic value coefficient and carbon emission coefficient in 2030.
LULC TypeEconomic Value (104 yuan/hm2)Carbon Emission (t/hm2)
Cropland4.510.422
Forest0.28−0.613
Grassland28.69−0.021
Water4.95−0.253
Construction land0.0001−0.005
Unused land214.89257.753
Table 5. Accuracy validation of predicted quantity structure (km2).
CroplandForestGrasslandWaterUnused LandConstruction Land
2020 actual value71,333.1651,749.666257.902003.0725.5115,340.65
Proportion48.6219%35.2734%4.2655%1.3653%0.0174%10.4564%
2020 predicted value70,983.2151,464.966295.552568.9518.6415,378.64
Proportion48.3834%35.0794%4.2912%1.7510%0.0127%10.4823%
Error proportion
(2020 predicted–actual)
−0.2385%−0.194%0.0257%0.3857%−0.0047%0.0259%
Table 6. LUCE and ECS from 2000 to 2020 (106 t).
200020102020
Cropland carbon storage282.66277.34272.92
Forest carbon storage1042.311050.871062.06
Grassland carbon storage102.5486.774.47
Water carbon storage16.6919.1216.68
Unused land carbon storage000
Construction land carbon storage15.2818.0320.63
Total carbon storage1459.481452.061446.76
Total carbon emissions95.29194.29245.73
Table 7. LULC area under different scenarios in 2030 (km2).
20202030ND2030LCE2030HCS2030CN
Cropland71,333.1670,049.0768,900.3861,363.2662,289.88
Forest51,749.6652,153.9352,155.4959,513.3758,722.57
Grassland6257.95506.066607.276607.276607.27
Water2003.071803.071979.562000.671873.49
Unused land25.5122.7118.1918.7620.23
Construction land15,340.6517,175.1117,049.0617,206.6217,196.51
Table 8. Differences in economic value (106 yuan), carbon storage, and carbon emissions (106 t) under different scenarios in 2030.
TypeEconomic ValueCarbon StorageCarbon Emissions
Actual value of ND418.821442.00442.40
Increment of LCE value200.3010.04−3.30
Increment of HCS value2230.66132.60−0.013
Increment of CN value3386.21118.84−0.18
Disclaimer/Publisher’s Note: The statements, opinions and data contained in all publications are solely those of the individual author(s) and contributor(s) and not of MDPI and/or the editor(s). MDPI and/or the editor(s) disclaim responsibility for any injury to people or property resulting from any ideas, methods, instructions or products referred to in the content.

