


Addressing Urban Vulnerability: A Comprehensive Approach


Abstract
1. Introduction
2. Background
3. Materials and Methods
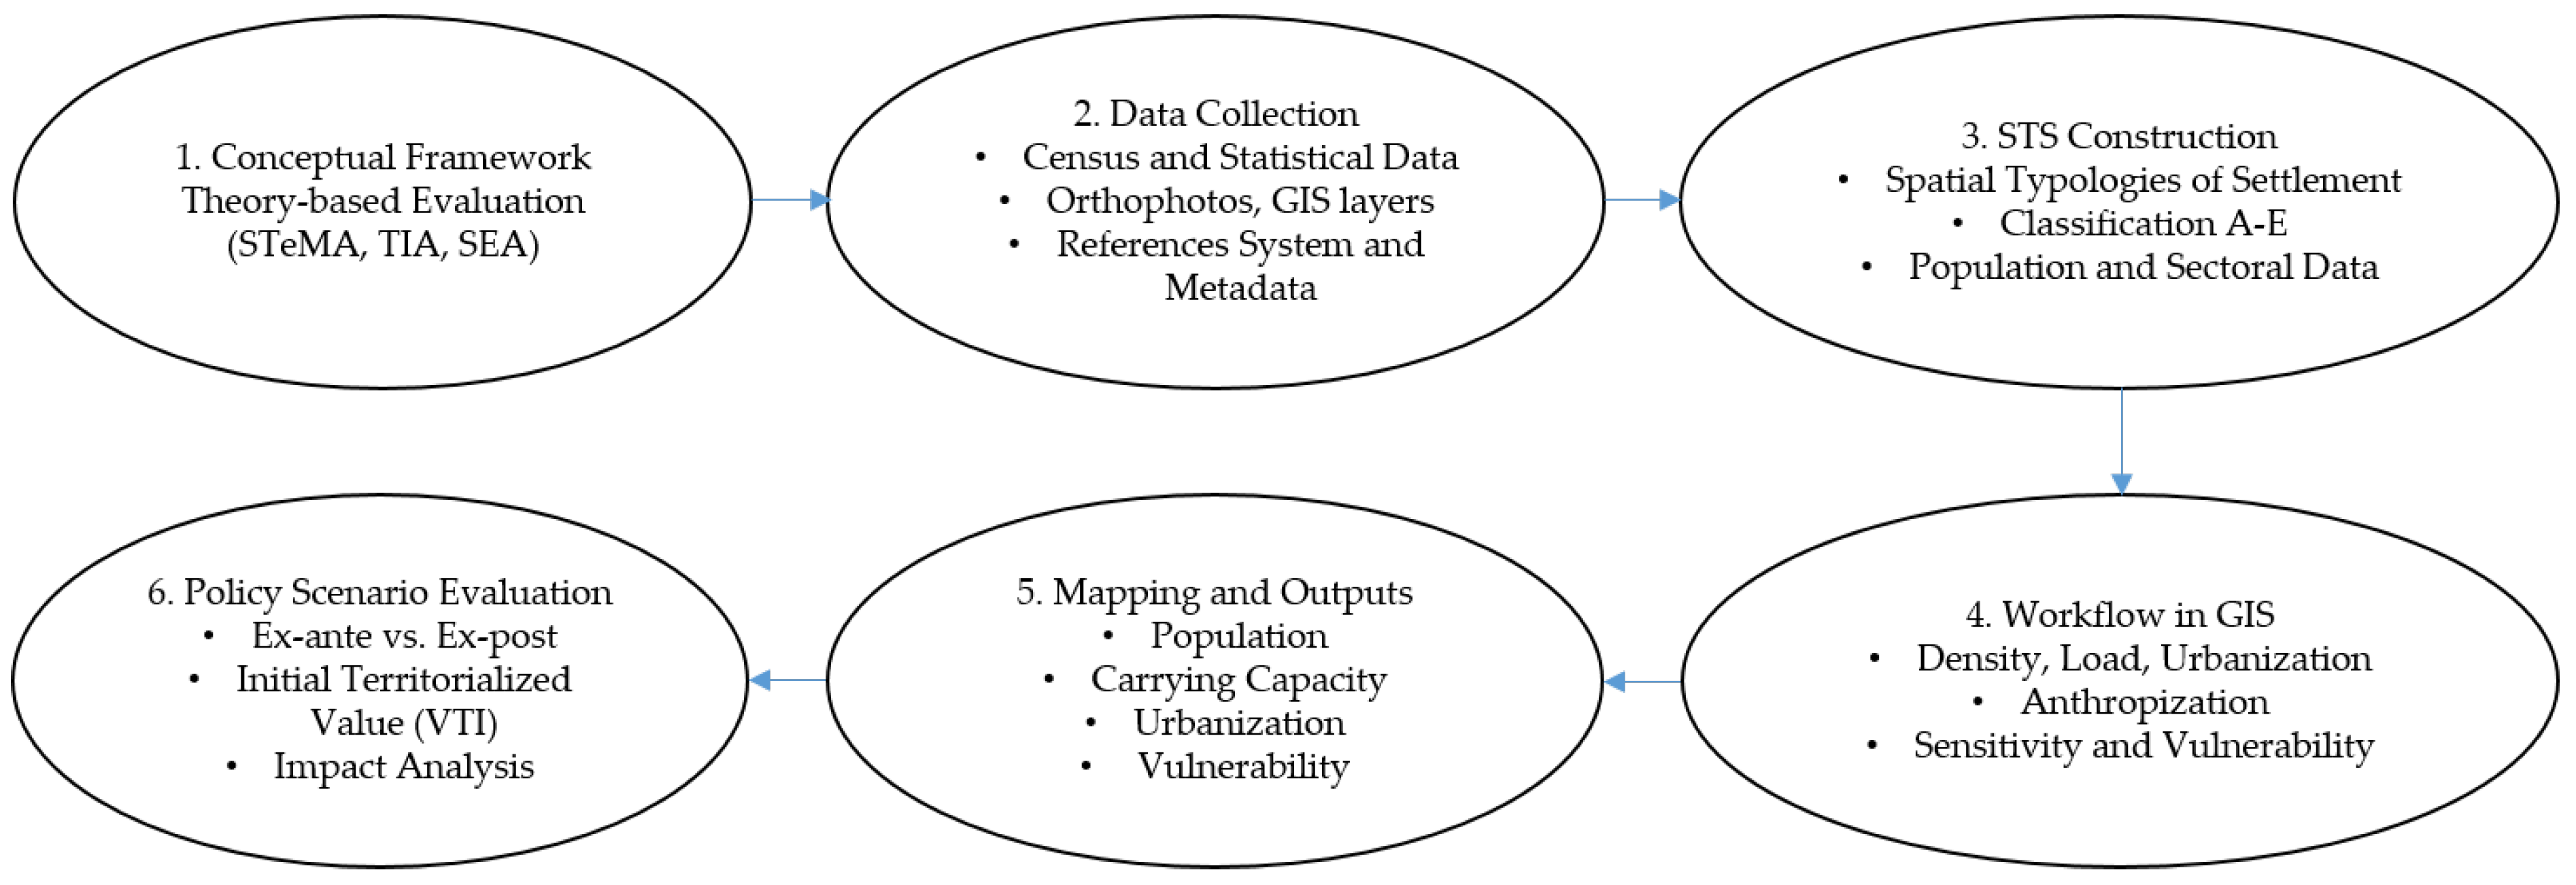
3.1. Methods: STeMA Model
STeMA Workflow
3.2. Materials
- Orthophotos of the area to be analyzed, with a reference system attached;
- Use of a reference system (EPSG) common to all maps submitted;
- Each map must be provided in shapefile format (.shp file);
- In this study, data from official statistics provided by the national statistical office were utilized, represented as census tracts in polygon format. These tracts formed the basis for analyses and served as the reference unit for creating the spatial typologies of a settlement (STSs) map, a critical element in the evaluation process.
- Application of the STeMA-TIA (Territorial Impact Assessment) process and tool to evaluate the impact of the territorial planning innovative policy at this stage. This section is not within the scope of the present paper, but an illustrative example can be found in Prezioso 2024 [51];
- Application of STeMA-SEA and its tools to assess the ex ante vulnerability of the urban system.
Data Collection and Preparation
- -
- pop: Total population in the spatial typology of a settlement;
- -
- act1: Active population in the primary sector (agriculture);
- -
- act2: Active population in the secondary sector (industry);
- -
- act3: Active population in the third sector (services);
- -
- popcor: Population of the core;
- -
- popcen: Population of the centers;
- -
- insclass: Spatial typology of the settlement class (A, B, C, D, and E).
- -
- super: The land surface area, expressed in hectares;
- -
- pcdi: Domestic pollutant pressure index (decimal number);
- -
- pcii: Industrial pressure pollutant index (decimal number);
- -
- pcai: Index of agricultural pollution pressure (decimal number);
- -
- pcti: Transport pollution pressure index (decimal number);
- -
- pop15: Population under 15 years;
- -
- pop65: Population over 65 years.
3.3. Case Study
4. Results
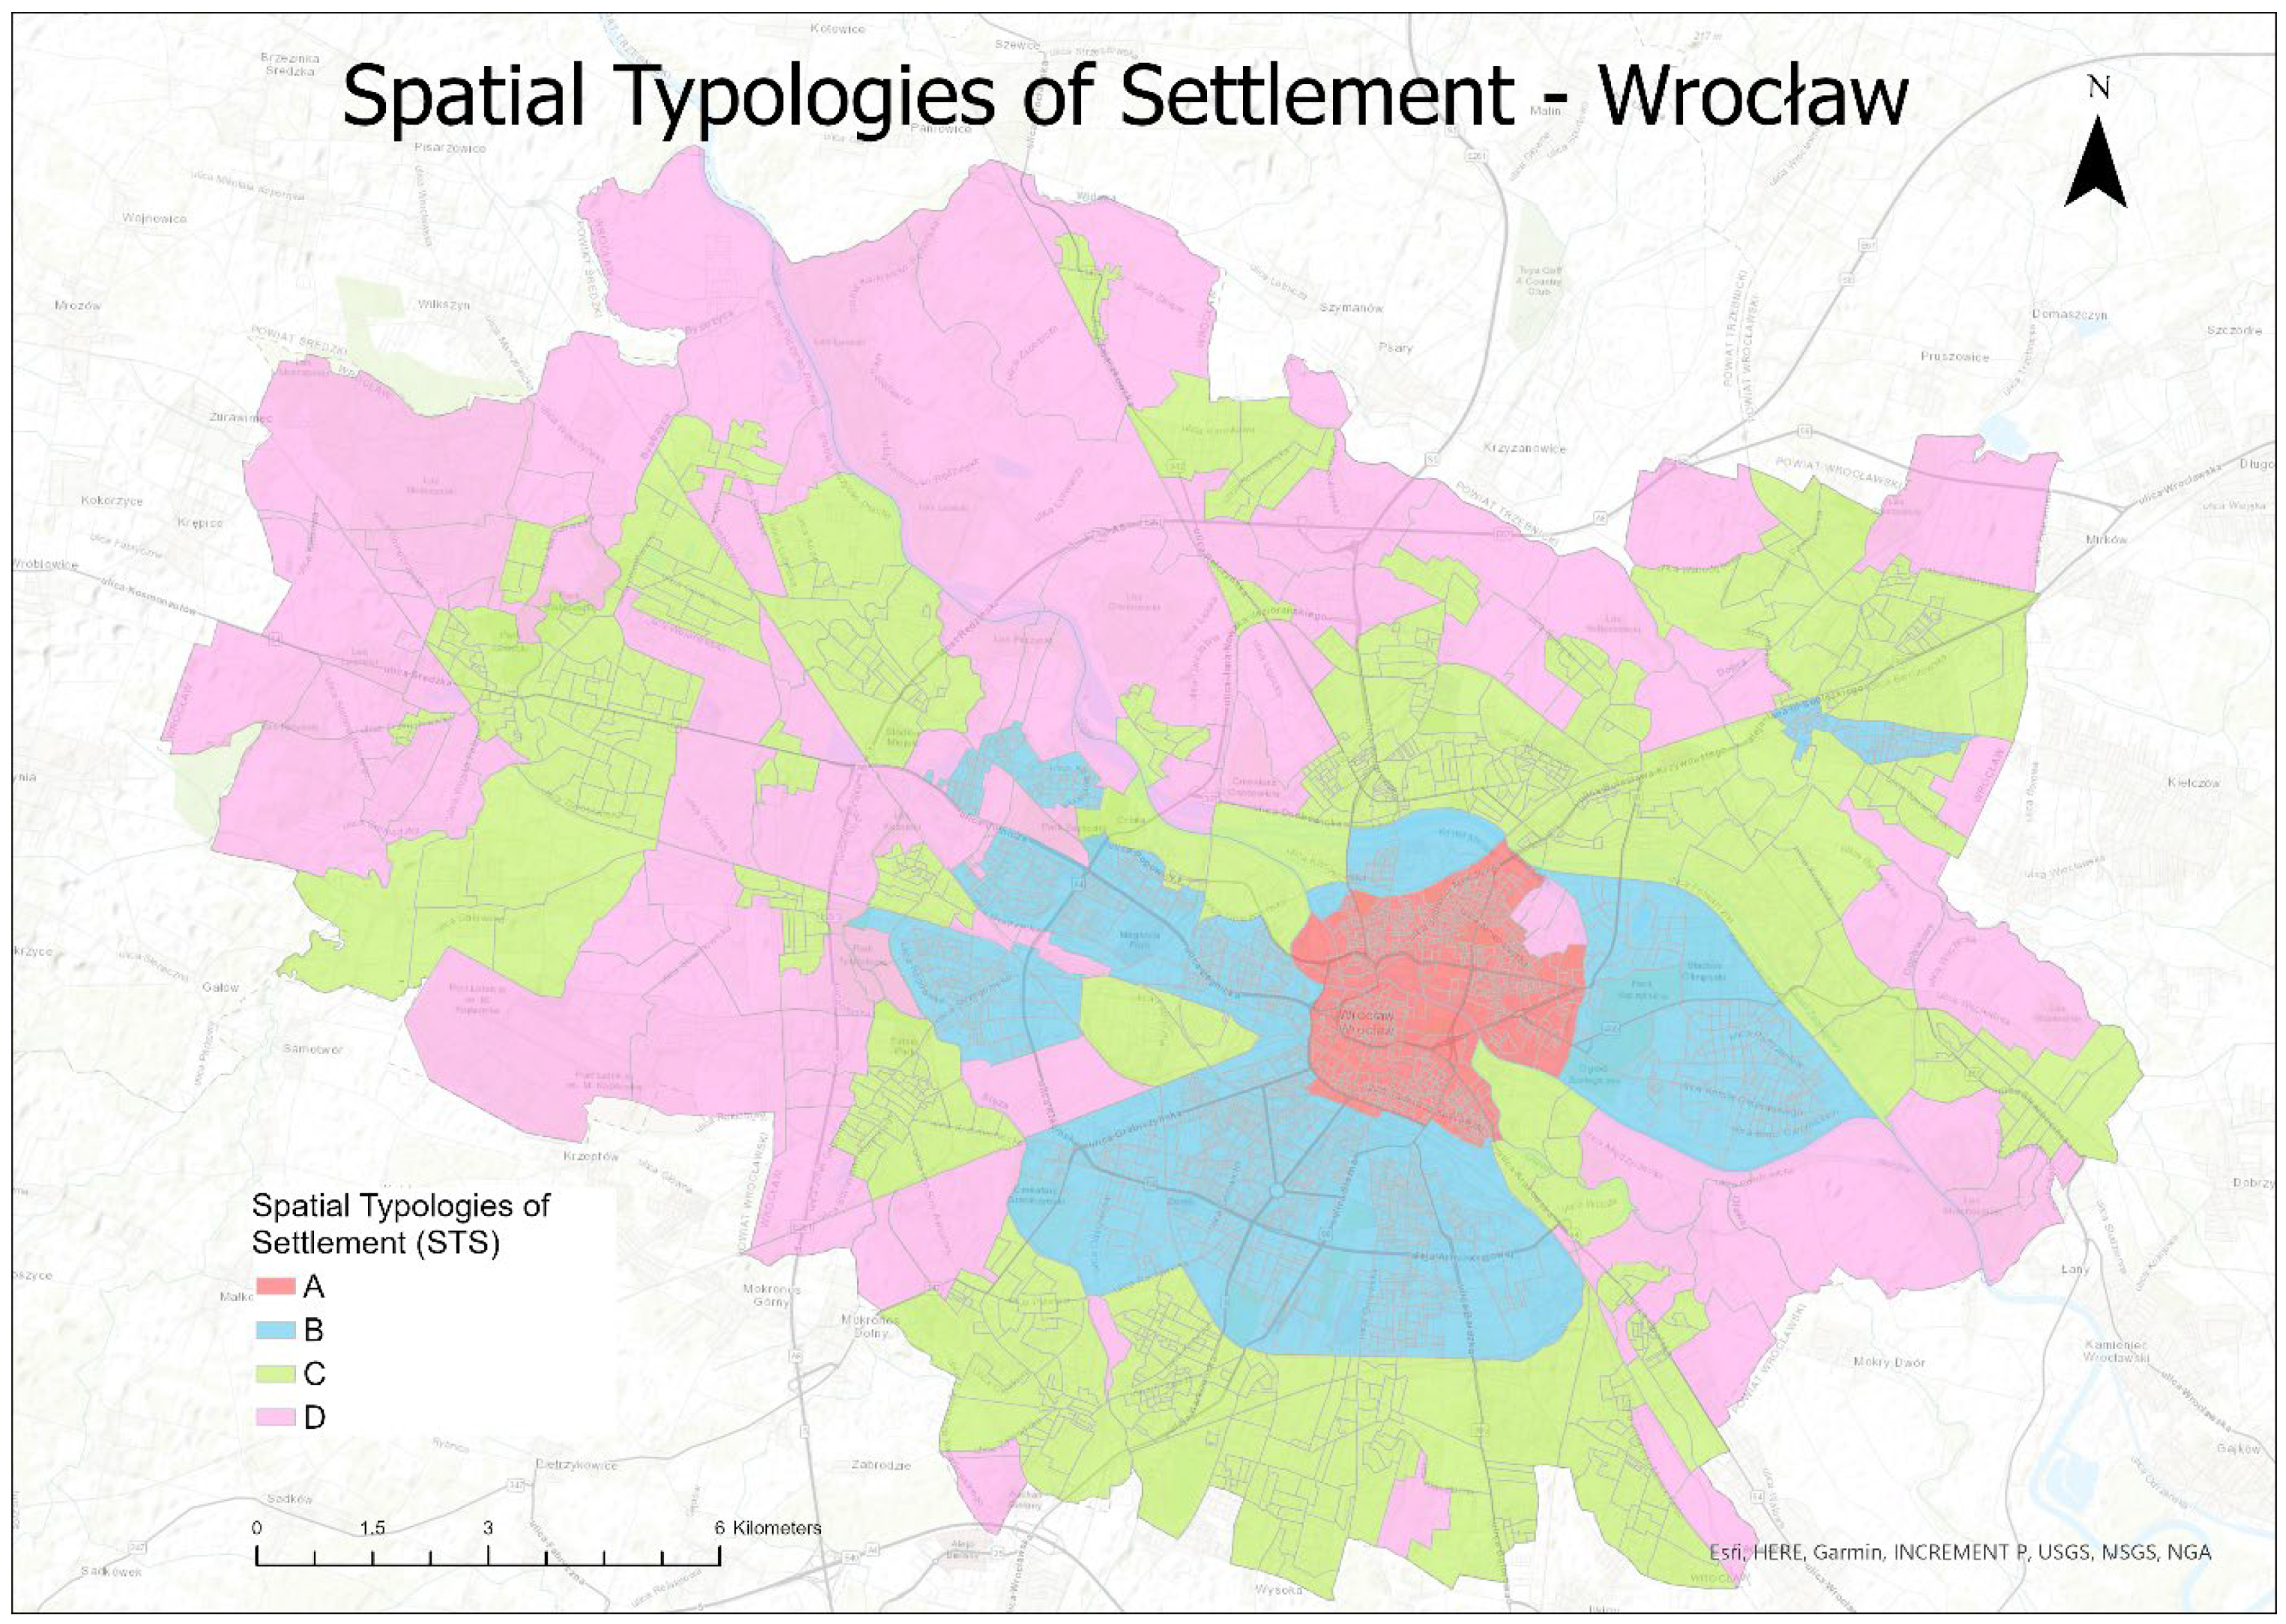
4.1. STS Units
- Population in absolute values;
- STS surface and the density of the population;
- Settlement load match between (1) and (2);
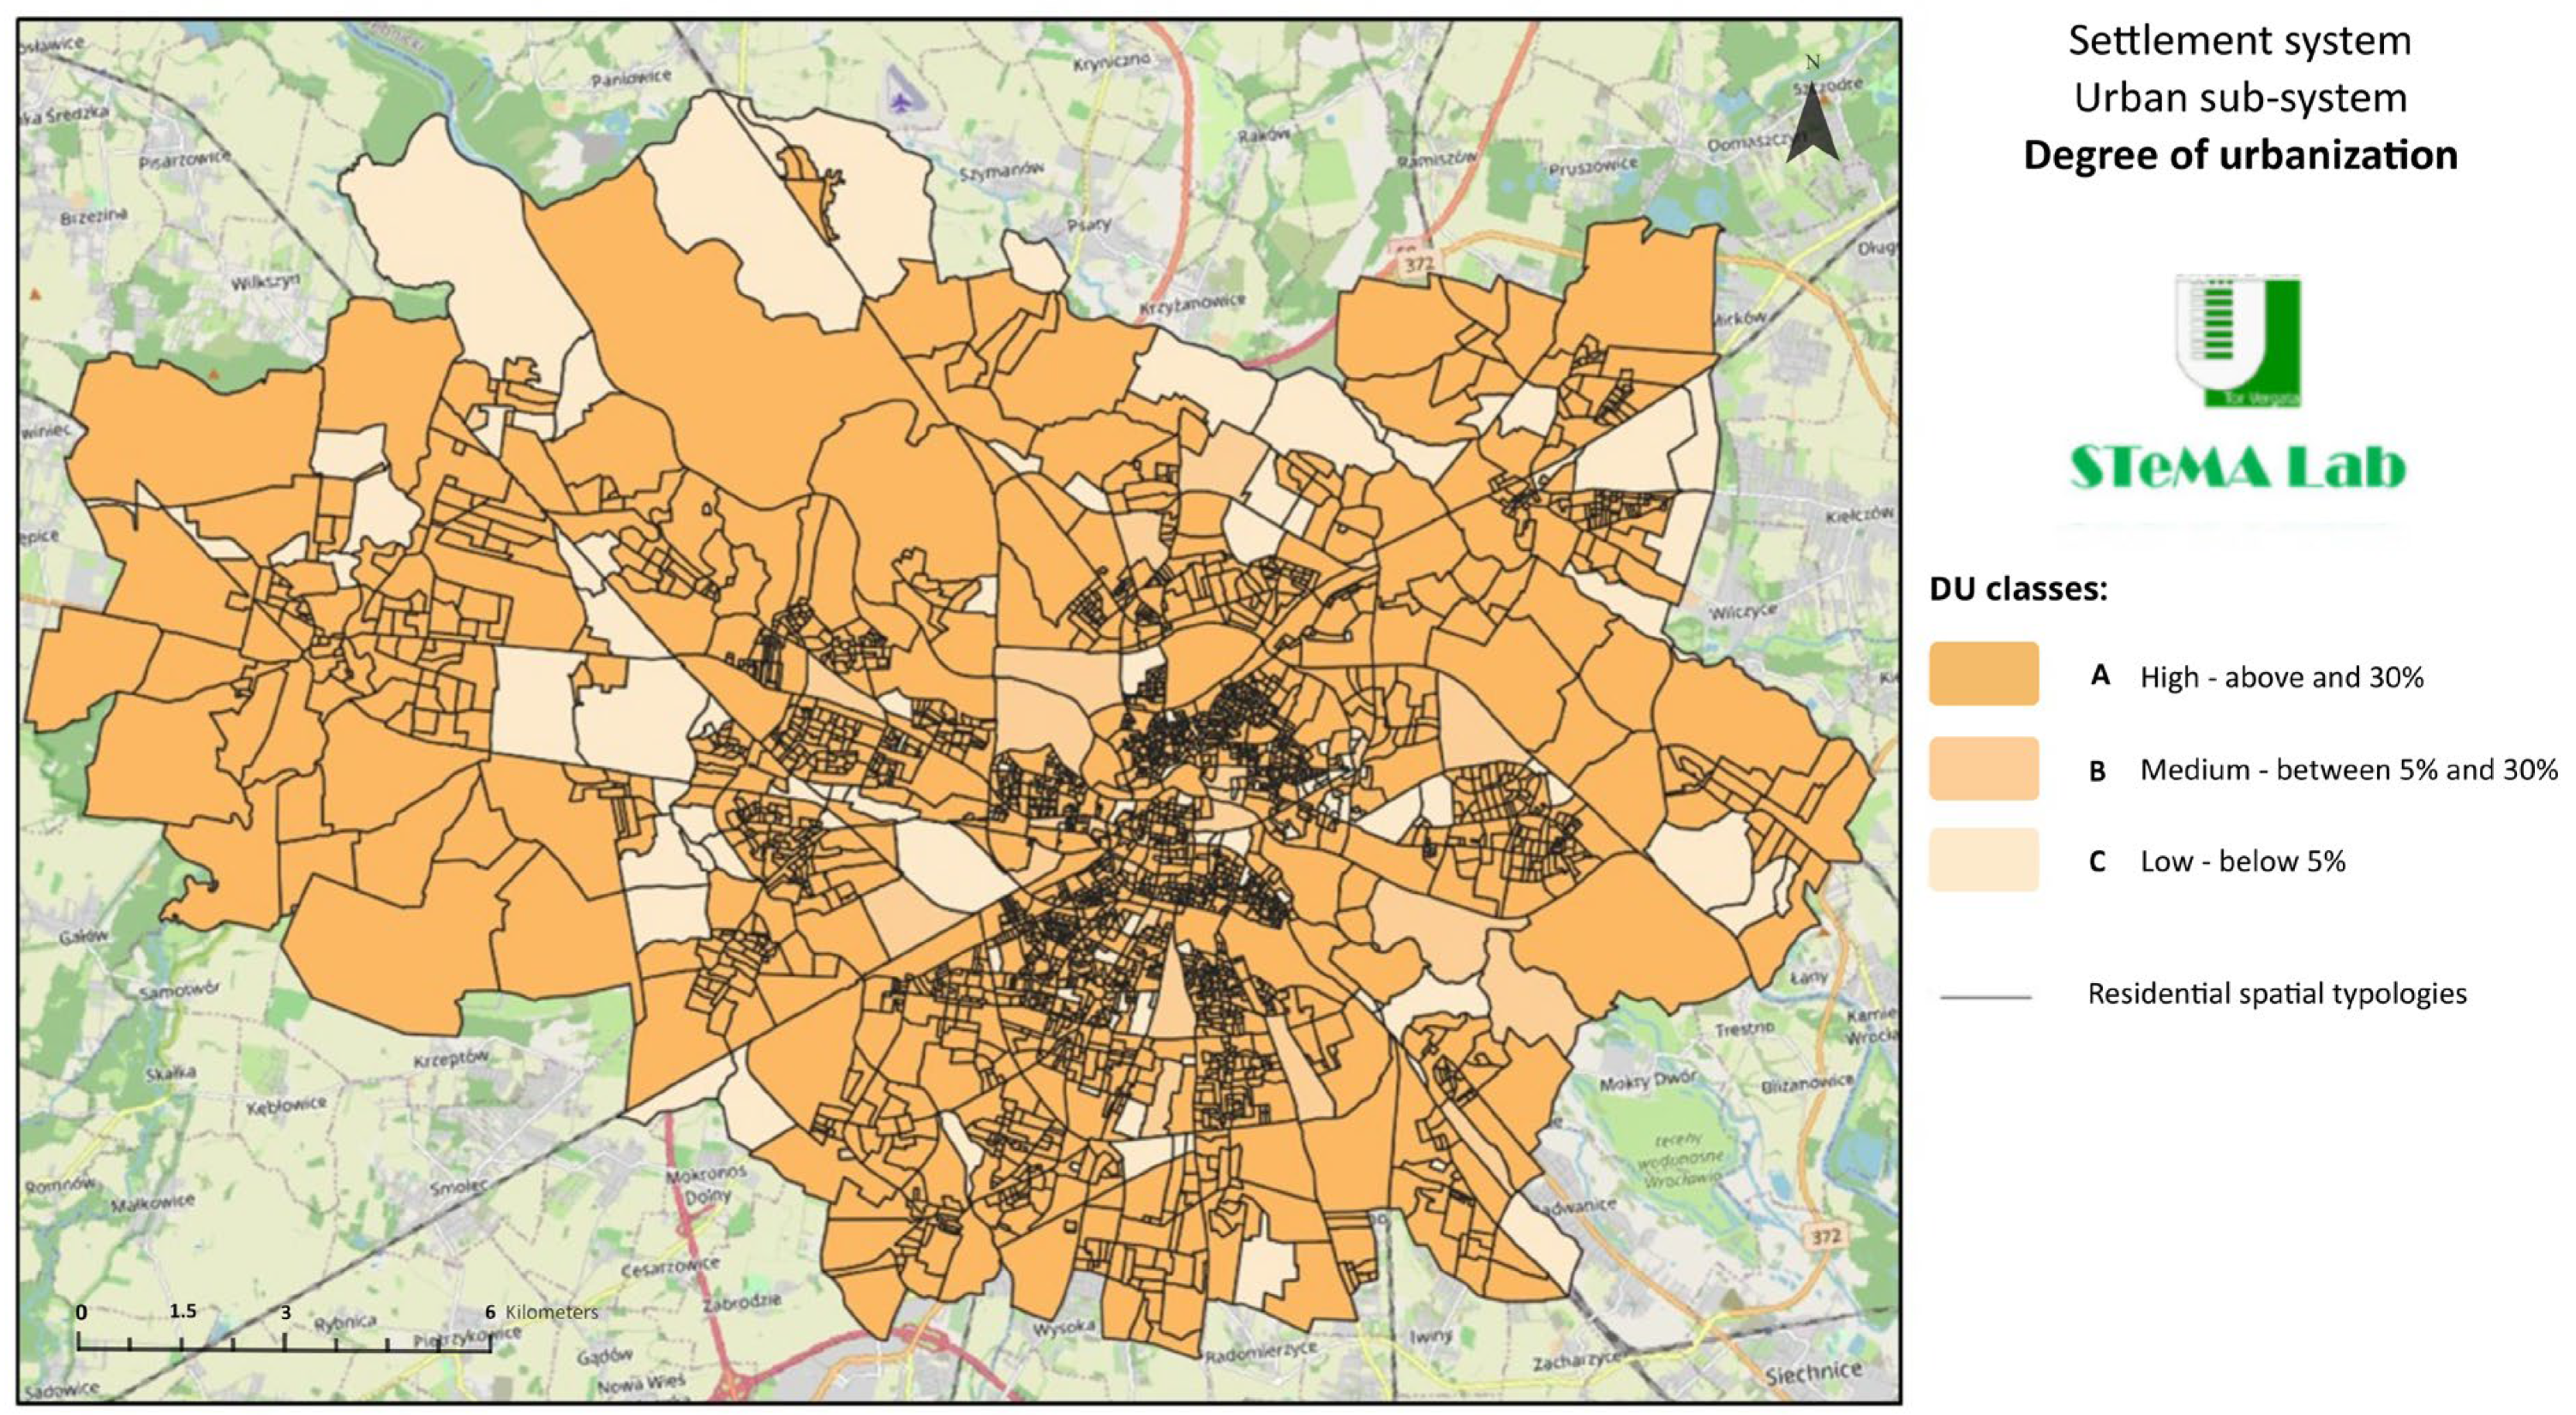
- Grade of urbanization, applying the following formula: act 2 + act3/act1;
- Level of urbanization as matched between (3) and (4);
- Vulnerability value matching (5) and STS values.
4.2. STeMA Results
5. Discussion
Study Limitations and Future Research
6. Remarks
7. Declaration of AI
Author Contributions
Funding
Data Availability Statement
Conflicts of Interest
Appendix A

| Name | RifU | RifP | RaccDif | RiskNat | SAria | AcPot | CC | IautEN |
|---|---|---|---|---|---|---|---|---|
| Plan project | Sustinable Growth | Sustinable Growth | Sustinable Growth | Sustinable Growth | Sustinable Growth | Sustinable Growth | Sustinable Growth | Sustinable Growth |
| Source of data | UTV | UTV | UTV | UTV | UTV | UTV | UTV | UTV |
| Author | UTV | UTV | UTV | UTV | UTV | UTV | UTV | UTV |
| Regional reference | NUTS 2, 3 | NUTS 2 | NUTS 2, 3 | NUTs 3 | NUTS 3–7 | NUTS2 | NUTS 3 | NUTS 3 |
| Time reference | 2016, 2021 | 2016, 2021 | 2016, 2021 | 2016, 2021 | 2015, 2021 | 2015, 2021 | 2015, 2021 | 2016, 2021 |
| Frequency of data | yearly | yearly | yearly | yearly | yearly | yearly | yearly | yearly |
| Origin of data | ISPRA—Catasto Rifiuti | ISPRA http://www.catasto-rifiuti.isprambiente.it/ (accessed on 29 January 2024) | ISPRA http://www.catasto-rifiuti.isprambiente.it/ (accessed on 29 January 2024) | MATTM, regioni, comuni, PAI | ISTAT | ISPRA | TERNA | |
| Variable name | Urban Wastes | Hazardous Wastes | Separate waste collection | Vulnerability at NUTS 2 or 3 or 4/5 | Air | water for Human use | CO2 emission | Energy self-sufficiency Index (IautEN) = Energy Dependency = Energy |
| Variable description | http://www.catasto-rifiuti.isprambiente.it/index.php?pg=provincia (accessed on 29 January 2024) | production of hazardous waste (tonn) | Separate collection = Recycling of waste | Natural Risks = Environmental Vulnerability | PM10 annual average value | Gross withdrawal of drinking water | CO2 Emission | Energy self-sufficiency |
| Theoretical postulate | Urban waste Production | production of hazardous waste (RifP) = Hazardous Waste | Separate Waste Collection(tonn) | % on the NUT 2 and 3 surface but also absolute values. About Industry (mathematical operation): the Added Value x territorial density/1000. The indicator include: seismic (main), flood, landslide risk. Take in mind: the values (A, B, etc) are reversed, than: D>C>B>A | Air Quality at NUT 2 = Air (status) | Volume of water taken for drinking use (AcPot) = Balanced use of water resources | CO2 emissions (migl tonn) (CC) = ozone level = Climate Change | % of energy produced from renewable sources (hydroelectric, wind, photovoltaic, geothermal, biomass) / total production |
| Calculation algorithm | Urban wastes Production (tonn) = Urban Waste/tot pop at NUTS 2 and 3 | tot hazardous waste/tot pop. | Separate waste collection/tot. Pop. At NUTS 2 and 3 | quali-quantitative evaluation of natural risksdei rischi naturali | reported year of mg pm 10/tot. Pop. At NUTS 2 and 3 | regional tot. water taken for drinking use/regional (NUT2) pop. x provincial (NUT3) pop. | CO2 emission/NUT2 and 3 pop | % of energy produced from renewable sources / total production of energy |
| Policy option relevant | susttainability | Wellbeing and Quality of lifeNatural Risks | Rischi naturali | Climate Change | Climate Change | Climate Change | Sustainable growth | |
| Type of data | Indicator | Indicator | Indicator | Indicator | Indicator | Indicator | Indicator | Indicator |
| Territorial Reference | NUT 2 (region) and 3 (province) | NUT 2 (region) and 3 (province) | NUT 2 (region) and 3 (province) | NUT 2 (region) and 3 (province) | NUT 2 (region) and 3 (province) | NUT 2 (region) and 3 (province) | NUT 2 (region) and 3 (province) | NUT 2 (region) and 3 (province) |
| Value | High, Medium-High, Medium-Low, Low | High, Medium-High, Medium-Low, Low | High, Medium-High, Medium-Low, Low | High, Medium-High, Medium-Low, Low | High, Medium-High, Medium-Low, Low | High, Medium-High, Medium-Low, Low | High, Medium-High, Medium-Low, Low | High, Medium-High, Medium-Low, Low |
| 1 | The critical aspects in the construction of the model’s concern (Prezioso 2018, [42]) the Critical Load Level, which is used to quantitatively estimate the “to the impacts, replaced/integrated in the policy evaluation with the “Target Load” referred to the policies of the states and regions”. |
| 2 | SEA tools are diverse and context-dependent, often varying by company, with solutions ranging from standardized methodologies to custom-built models and tools—frequently developed in GIS platforms like QGIS or ArcGIS—to meet specific organizational needs and strategic planning requirements. |
| 3 | This tool was originally developed for use with QGIS (QGIS Desktop 3.34.5), though it can also be adapted for implementation within ArcGIS environments. |
References
- Pacione, M. Urban environmental quality and human wellbeing—A social geographical perspective. Landsc. Urban Plan. 2003, 65, 19–30. [Google Scholar] [CrossRef]
- Grimm, N.B.; Faeth, S.H.; Golubiewski, N.E.; Redman, C.L.; Wu, J.; Bai, X.; Briggs, J.M. Global change and the ecology of cities. Science 2008, 319, 756–760. [Google Scholar] [CrossRef]
- Han, J. Can urban sprawl be the cause of environmental deterioration? Based on the provincial panel data in China. Environ. Res. 2020, 189, 109954. [Google Scholar] [CrossRef]
- Elhadary, Y.A.E.; Samat, N. Integrating Geographic Information System and Discriminant Analysis in Modelling Urban Spatial Growth: An example from Seberang Perai Region, Penang State, Malaysia. Asian Soc. Sci. 2015, 11, 32. [Google Scholar] [CrossRef]
- Rajput, T.S.; Singhal, A.; Routroy, S.; Dhadse, K.; Tyagi, G. Urban Policymaking for a Developing City Using a Hybridized Technique Based on SWOT, AHP, and GIS. J. Urban Plan. Dev. 2021, 147. [Google Scholar] [CrossRef]
- Sylla, M.; Solecka, I. Highly valued agricultural landscapes and their ecosystem services in the urban-rural fringe—An integrated approach. J. Environ. Plan. Manag. 2019, 63, 883–911. [Google Scholar] [CrossRef]
- Samat, N. Monitoring the expansion of built-up areas in Seberang Perai region, Penang State, Malaysia. IOP Conf. Ser. Earth Environ. Sci. 2014, 18, 012180. [Google Scholar] [CrossRef]
- Świąder, M.; Szewrański, S.; Kazak, J. Spatial-Temporal Diversification of Poverty in Wroclaw. Procedia Eng. 2016, 161, 1596–1600. [Google Scholar] [CrossRef]
- Wei, Y.D.; Ewing, R. Urban expansion, sprawl and inequality. Landsc. Urban Plan. 2018, 177, 259–265. [Google Scholar] [CrossRef]
- Szewrański, S.; Świąder, M.; Kazak, J.K.; Tokarczyk-Dorociak, K.; van Hoof, J. Socio-Environmental Vulnerability Mapping for Environmental and Flood Resilience Assessment: The Case of Ageing and Poverty in the City of Wrocław, Poland. Integr. Environ. Assess. Manag. 2018, 14, 592–597. [Google Scholar] [CrossRef]
- Cividino, S.; Halbac-Cotoara-Zamfir, R.; Salvati, L. Revisiting the “City Life Cycle”: Global urbanization and implications for regional development. Sustainability 2020, 12, 1151. [Google Scholar] [CrossRef]
- Polinesi, G.; Recchioni, M.C.; Turco, R.; Salvati, L.; Rontos, K.; Rodrigo-Comino, J.; Benassi, F. Population trends and urbanization: Simulating density effects using a local regression approach. ISPRS Int. J. Geo-Inf. 2020, 9, 454. [Google Scholar] [CrossRef]
- Turner, B.L.; Kasperson, R.E.; Matson, P.A.; McCarthy, J.J.; Corell, R.W.; Christensen, L.; Eckley, N.; Kasperson, J.X.; Luers, A.; Martello, M.L.; et al. A framework for vulnerability analysis in sustainability science. Proc. Natl. Acad. Sci. USA 2003, 100, 8074–8079. [Google Scholar] [CrossRef] [PubMed]
- Meerow, S.; Newell, J.P.; Stults, M. Defining urban resilience: A review. Landsc. Urban Plan. 2016, 147, 38–49. [Google Scholar] [CrossRef]
- McCann, P.; Soete, L. Place-Based Innovation for Sustainability; Publications Office of the European Union: Luxembourg, 2020; ISBN 978-92-76-20392-6. [Google Scholar] [CrossRef]
- Batista E Silva, F.; Kavalov, B.; Lavalle, C. Territorial Patterns of Tourism Intensity and Seasonality in the EU; Publications Office of the European Union: Luxembourg, 2019. [Google Scholar]
- Bănică, A.; Muntele, I. Urban vulnerability and resilience in post-communist Romania (comparative case studies of Iași and Bacău cities and metropolitan areas). Carpathian J. Earth Environ. Sci. 2015, 10, 157–169. [Google Scholar]
- Ghajari, Y.E.; Alesheikh, A.A.; Modiri, M.; Hosnavi, R.; Abbasi, M. Spatial modelling of urban physical vulnerability to explosion hazards using GIS and fuzzy MCDA. Sustainability 2017, 9, 1274. [Google Scholar] [CrossRef]
- Cerreta, M.; Mele, R.; Poli, G. Urban vulnerability assessment: Towards a cross-scale spatial multi-criteria approach. In Proceedings of the Computational Science and Its Applications—ICCSA 2018, Melbourne, VIC, Australia, 2–5 July 2018; Lecture Notes in Computer Science; Gervasi, O., Murgante, B., Misra, S., Stankova, E., Torre, C.M., Rocha, A.M.A.C., Taniar, D., Apduhan, B.O., Tarantino, E., Ryu, Y., Eds.; Springer: Cham, Switzerland, 2018; Volume 10962, pp. 502–517. [Google Scholar] [CrossRef]
- Diaz-Sarachaga, J.M.; Jato-Espino, D. Analysis of vulnerability assessment frameworks and methodologies in urban areas. Nat. Hazards 2020, 100, 437–457. [Google Scholar] [CrossRef]
- Simmons, D.C.; Dauwe, R.; Gowland, R.; Gyenes, Z.; King, A.G.; Riedstra, D.; Schneiderbauer, S. Qualitative and quantitative approaches to risk assessment. In Science for Disaster Risk Management 2017: Knowing Better and Losing Less; Poljansek, K., Marin Ferrer, M., De Groeve, T., Clark, I., Eds.; Publications Office of the European Union: Luxembourg, 2017; pp. 44–58. Available online: https://publications.jrc.ec.europa.eu/repository/handle/JRC102482 (accessed on 7 June 2025).
- IPCC. Climate Change 2014: Synthesis Report. Contribution of Working Groups I, II and III to the Fifth Assessment Report of the Intergovernmental Panel on Climate Change; Core Writing Team, Pachauri, R.K., Meyer, L.A., Eds.; IPCC: Geneva, Switzerland, 2014; 151p, Available online: https://www.ipcc.ch/site/assets/uploads/2018/02/AR5_SYR_FINAL_Front_matters.pdf (accessed on 4 June 2025).
- Birkmann, J.; Cardona, O.D.; Carreño, M.L.; Barbat, A.H.; Pelling, M.; Schneiderbauer, S.; Kienberger, S.; Keiler, M.; Alexander, D.; Zeil, P.; et al. Framing vulnerability, risk and societal responses: The MOVE framework. Nat. Hazards 2013, 67, 193–211. [Google Scholar] [CrossRef]
- Arif, N.; Wardhana, A.; Martiana, A. Spatial analysis of the urban physical vulnerability using remote sensing and geographic information systems (case study: Yogyakarta City). In IOP Conference Series: Earth and Environmental Science; IOP Publishing: Bristol, UK, 2022; Volume 986, p. 012067. [Google Scholar] [CrossRef]
- Patel, U.B.; Teli, B.L.; Purohit, K.C. Directions of urban growth: Spatio-temporal analysis of lucknow city. Trans. Inst. Indian Geogr. 2019, 41, 295–308. [Google Scholar] [CrossRef]
- Wolny, A.; Dawidowicz, A.; Źróbek, R. Identification of the spatial causes of urban sprawl with the use of land information systems and GIS tools. Bull. Geogr. 2017, 35, 111–122. [Google Scholar] [CrossRef]
- Van Stigt, R.; Driessen, P.P.; Spit, T.J. A user perspective on the gap between science and decision-making. Local administrators’ views on expert knowledge in urban planning. Environ. Sci. Policy 2015, 47, 167–176. [Google Scholar] [CrossRef]
- Laurini, R. A primer of knowledge management for smart city governance. Land Use Policy 2021, 111, 104832. [Google Scholar] [CrossRef]
- UN-Habitat (United Nations Human Settlements Programme). World Cities Report 2020: The Value of Sustainable Urbanization; United Nations Human Settlements Programme: Nairobi, Kenya, 2020. [Google Scholar] [CrossRef]
- Yigitcanlar, T. Innovating urban policymaking and planning mechanisms to deliver knowledge-based agendas: A methodological approach. Int. J. Knowl.-Based Dev. 2014, 5, 253–270. [Google Scholar] [CrossRef]
- Perales, F.J.; Aróstegui, J.L. The STEAM approach: Implementation and educational, social and economic consequences. Arts Educ. Policy Rev. 2021, 125, 59–67. [Google Scholar] [CrossRef]
- Prezioso, M. STeMA: A Sustainable Territorial Economic/Environmental Management Approach. In Territorial Impact Assessment; Medeiros, E., Ed.; Springer International Publishing: Cham, Switzerland, 2020; pp. 55–76. [Google Scholar] [CrossRef]
- Medeiros, E. Territorial Impact Assessment; Springer: Cham, Switzerland, 2020; ISBN 978-3-030-54501-7. [Google Scholar] [CrossRef]
- Crucitti, F.; Lazarou, N.-J.; Monfort, P.; Salotti, S. The RHOMOLO Impact Assessment of the 2014–2020 Cohesion Policy in the EU Regions; Publications Office of the European Union: Luxembourg, 2022. [Google Scholar] [CrossRef]
- European Comission. Commission Staff Working Document. Better Regulation Guidelines; European University Institute: Brussels, Belgium, 2017. [Google Scholar]
- European Commission. “Better Regulation” Toolbox; European University Institute: Brussels, Belgium, 2023. [Google Scholar]
- Wegener, M.; Eskelinen, H.; Fürst, F.; Schürmann, C.; Spiekermann, K. Criteria for the Spatial Differentiation of the EU Territory: Geographical Position. Study Programme on European Spatial Planning. Forschungen, Heft 102.2, 87. 2001. Available online: https://www.bbsr.bund.de/BBSR/EN/publications/ministries/BMVBS/Forschungen/1999_2006/102_2index.html (accessed on 2 July 2025).
- Zonneveld, W.; Waterhout, B. EU territorial impact assessment: Under what conditions. In Proceedings of the 49th Congress of the European Regional Science Association, Lodz, Poland, 25–29 August 2009; pp. 25–29. [Google Scholar]
- Fischer, T.B.; Gore, T.; Perdicoulis, Š.K.; Zonneveld, W.; Onyango, V.; Batista, L.; Azevedo, R. A Framework for Assessing the Territorial Impacts of European Directives Guidance. 2013. Available online: https://archive.espon.eu/sites/default/files/attachments/EATIAFinalGuidance.pdf (accessed on 3 June 2025).
- Prezioso, M. Reading the Territorial Cohesion. In Territorial Impact Assessment of National and Regional Territorial Cohesion in Italy Place Evidence and Policy Orientations Towards European Green Deal; Prezioso, M., Ed.; Pàtron: Bologna, Italy, 2020; pp. 26–52. Available online: https://art.torvergata.it/handle/2108/254871?mode=simple (accessed on 2 July 2024).
- Farinós-Dasí, J. Spatial Planning for Territorial Cohesion; Urban Book Series; Springer: Cham, Switzerland, 2023; pp. 145–166. [Google Scholar] [CrossRef]
- Prezioso, M. Quale Territorial Impact Assessment Della Coesione Territoriale Nelle Regioni Italiane. La Concettualizzazione del Problema; Prezioso, M., Ed.; Pàtron: Bologna, Italy, 2018; Available online: https://art.torvergata.it/handle/2108/212623 (accessed on 2 July 2024).
- ESPON; The Royal Town Planning Institute. INTERSTRAT-ESPON in Integrated Territorial Strategies|ESPON. Luxembourg. 2012. Available online: https://archive.espon.eu/programme/projects/espon-2013/interstrat-espon-integrated-territorial-strategies (accessed on 2 July 2024).
- Sadler, B.; Verheem, R. 25 years of SEA: Personal reflections on recent progress, current status and future prospects. Impact Assess. Proj. Apprais. 2023, 41, 78–82. [Google Scholar] [CrossRef]
- Patton, M.Q. Developmental Evaluation: Applying Complexity Concepts to Enhance Innovation and Use; Guilford Press: New York, NY, USA, 2011. [Google Scholar]
- von Bertalanffy, L. General System Theory: Foundations, Development, Applications; George Braziller: New York, NY, USA, 1968. [Google Scholar]
- Prezioso, M. The territorial dimension of a competitive governance in sustainability. Bol. Asoc. Geogr. Esp. 2008, 46, 163–180. [Google Scholar]
- Prezioso, M. Competitiveness in Sustainability: The Territorial Dimension in the Implementation of Lisbon/Gothenburg Processes in Italian Regions and Provinces; Pàtron: Bologna, Italy, 2011. [Google Scholar]
- Prezioso, M. Sustainable Growth: Cities and Territories can make Europe competitive again. Geogr. Econ.-Politica 2018, 51–70. [Google Scholar]
- Albrechts, L. Strategic (spatial) planning reexamined. Environ. Plan. B Plan. Des. 2004, 31, 743–758. [Google Scholar] [CrossRef]
- Prezioso, M. Innovation in the territorial impact assessment: An application to large infrastructure projects of the Italian recovery and resilience facility. Impact Assess. Proj. Apprais. 2024, 43, 123–136. [Google Scholar] [CrossRef]
- Council of Europe Conference of Ministers Responsible for Spatial Planning. Resolution N. 1. Functional Areas—Capitalisation of Local Potential in Territorial Development Policies over the European Continent; CEMAT: Bucharest, Romania, 2017; Available online: https://rm.coe.int/the-17th-session-of-the-council-of-europe-conference-of-ministers-resp/16807670ac (accessed on 3 June 2025).
- Cutter, S.L.; Boruff, B.J.; Shirley, W.L. Social vulnerability to environmental hazards. Soc. Sci. Q. 2003, 84, 242–261. [Google Scholar] [CrossRef]
- Murgante, B.; Borruso, G.; Lapucci, A. Geocomputation and urban planning: Methodologies and applications. In Computational Science and Its Applications—ICCSA 2011; Lecture Notes in Computer Science; Murgante, B., Gervasi, O., Iglesias, A., Taniar, D., Apduhan, B.O., Eds.; Springer: Cham, Switzerland, 2011; Volume 6784, pp. 622–637. [Google Scholar] [CrossRef]
- Stańczyk, E. Przemiany ludnościowe we Wrocławiu po 1945 r. [Population Changes in Wrocław after 1945]. In Miasto. Pamięć i Przyszłość: Wrocławski Rocznik Samorządowy; Uczkiewicz, K., Ed.; [City. Memory and Future: Wrocław Self-Government Yearbook]; ISSN 2543-621X. Ośrodek "Pamięć i Przyszłość": Wrocław, Poland, 2017; Available online: https://miasto.zajezdnia.org/mpp/article/view/32 (accessed on 21 July 2025).
- Miszewska, B.; Szmytkie, R. Morphological processes in the spatial structure of the southern district of Wrocław city. In Bulletin of Geography; Socio-economic Series, No. 27; Szymańska, D., Rogatka, K., Eds.; Nicolaus Copernicus University: Toruńpp, Polska, 2015; pp. 133–151. [Google Scholar] [CrossRef]
- Hegazy, I.R. Integrating strategic environmental assessment into spatial planning in Egypt. Environ. Dev. 2015, 15, 131–144. [Google Scholar] [CrossRef]
- Golobič, M.; Marot, N.; Kolarič, Š.; Fischer, T.B. Applying territorial impact assessment in a multi-level policy-making context—the case of Slovenia. Impact Assess. Proj. Apprais. 2015, 33, 43–56. [Google Scholar] [CrossRef]
- Herbst, M.; Pechcińska, A.; Hagemejer, J.; Artymowska, P. Spa(tia)—A diffusion-oriented method of territorial impact assessment. Impact Assess. Proj. Apprais. 2024, 43, 111–122. [Google Scholar] [CrossRef]
- Medeiros, E. European Union Cohesion Policy and Spain: A territorial impact assessment. Reg. Stud. 2017, 51, 1259–1269. [Google Scholar] [CrossRef]
- European Union. Territory Matters to Make Europe 2020 a Success. Joint Contribution by the Director Generals of Ministerial Departments Responsible for Territorial Development Policy in the European Union. Sevilla. 2010. Available online: https://mpgi.gov.hr/UserDocsImages//dokumenti/Prostorno/TeritorijalnaKohezija//Tekst_izjave_EU2010.pdf (accessed on 3 June 2025).
- Krkoška Lorencová, E.; Whitham, C.E.; Bašta, P.; Harmáčková, Z.V.; Štěpánek, P.; Zahradníček, P.; Farda, A.; Vačkář, D. Participatory climate change impact assessment in three Czech cities: The case of heatwaves. Sustainability 2018, 10, 1906. [Google Scholar] [CrossRef]
- Rędzińska, K.; Czarnecka, A.; Pokladok, O.; Dyda, O. Spatial Implications of Climate Actions—The Role of Spatial Planning for Climate Change Adaptation in Poland and Ukraine. FIG 2024 Proceedings. Available online: https://www.fig.net/resources/proceedings/fig_proceedings/fig2024/papers/ts04e/TS04E_redzinska_czarnecka_et_al_12722.pdf (accessed on 30 June 2025).
- Dabašinskas, G.; Sujetovienė, G. Spatial and Temporal Changes in Supply and Demand for Ecosystem Services in Response to Urbanization: A Case Study in Vilnius, Lithuania. Land 2024, 13, 454. [Google Scholar] [CrossRef]
- Hełdak, M.; Stacherzak, A.; Przybyła, K.; Kulczyk-Dynowska, A.; Płuciennik, M.; Szczepański, J.; Kempa, O.; Lipsa, J. The Form of Residential Premises Ownership vs. Residential Standard of Seniors in Poland in the Opinion of Residents. Real Estate Manag. Valuat. 2024, 32, 114–125. [Google Scholar] [CrossRef]
- Paracchini, M.L.; Pacini, C.; Calvo, S.; Vogt, J. Weighting and Aggregation of Indicators for Sustainability Impact Assessment in the SENSOR Context; Springer: Berlin/Heidelberg, Germany, 2008; pp. 349–372. [Google Scholar] [CrossRef]
- Ferreira, T.M.; Eudave, R. Assessing and Managing Risk in Historic Urban Areas: Current Trends and Future Research Directions. Front. Earth Sci. 2022, 10, 847659. [Google Scholar] [CrossRef]
- Urban Poverty Partnership. Urban Poverty Partnership: Report About Urban Deprivation/Poverty Observatories in the European Union; GIAU+S UPM (Universidad Politécnica de Madrid Research Group): Madrid, Spain, 2018; Available online: https://ec.europa.eu/futurium/en/system/files/ged/report_about_urban_deprivation_and_poverty_-_observatories_in_the_europe.pdf (accessed on 29 June 2025).
- Cordoba Hernandez, R.; González García, I.; Guerrero Periñán, G. Report About Urban Deprivation/Poverty Observatories in the EU; Universidad Politécnica de Madrid: Madrid, Spain, 2018; Available online: https://ec.europa.eu/futurium/en/urban-poverty/report-about-urban-deprivationpoverty-observatories-eu-universidad-politecnica-de.html (accessed on 18 July 2025).


| Feature | TIA | SEA | STeMA |
|---|---|---|---|
| Primary Focus | Spatial/policy impacts on territorial cohesion | Environmental risks of plans and programs | Urban vulnerability and sustainability integration |
| Application Level | Multi-scale: EU, national, regional, local | Mostly regional/local; policy/program level | NUTS 1–4; urban and regional |
| Main Use | Evaluate policy coherence, socio-economic outcomes | Ensure environmental compliance and mitigation | Support integrated planning and decision-making |
| Methods Used | Delphi method, preference analysis, simulations | Impact modeling, scenario analysis | Indicator-based matrix, GIS mapping, pairwise comparisons |
| Output | Spatial impact maps, policy recommendations | Environmental impact statements, mitigation plans | Vulnerability maps, sensitivity analysis, and planning recommendations |
| Data Required | Quantitative + qualitative indicators | Environmental, ecological, and regulatory data | Mixed: census, environmental, spatial, and historical data |
| Strengths | Policy alignment, spatial equity, and EU-wide applications | Early-stage environmental integration, risk avoidance | Holistic, multi-criteria analysis tailored to urban and territorial planning |
| Tool Integration | ESPON, RHOMOLO | SEA software2, EIA platforms | Custom GIS-supported STeMA software, integrated with SDSS3 |
| STS Class | Description | Avg. Population | Population Density (pop/ha) | Settlement Load (pop/ha) |
|---|---|---|---|---|
| A | Central urban cores | >15,000 | High | High |
| B | Reticular/grid patterns | 4000–15,000 | Medium–High | Medium |
| C | Linear settlements | 1400–4000 | Medium | Medium–Low |
| D | Rural and scattered settlements | <1400 | Low | Low |
| E | Natural/uninhabited areas | 0 | N/A | N/A |
| Carrying Capacity Class | Description | Dominant Area(s) |
|---|---|---|
| C1 | High | Central and downtown zones |
| D1 | Average | Intermediate and peripheral zones |
| E1 | Weak | Peripheral/rural zones |
| F1 | Poor | Outskirts, underdeveloped zones |
| Urbanization Class | Evaluation Criteria (act2 + act3/act1) | Dominant Zone Type |
|---|---|---|
| A—High | >threshold ratio | Most of the city, including the periphery |
| B—Medium | Moderate ratio | Downtown pockets |
| C—Low | Low ratio | Western intermediate zone |
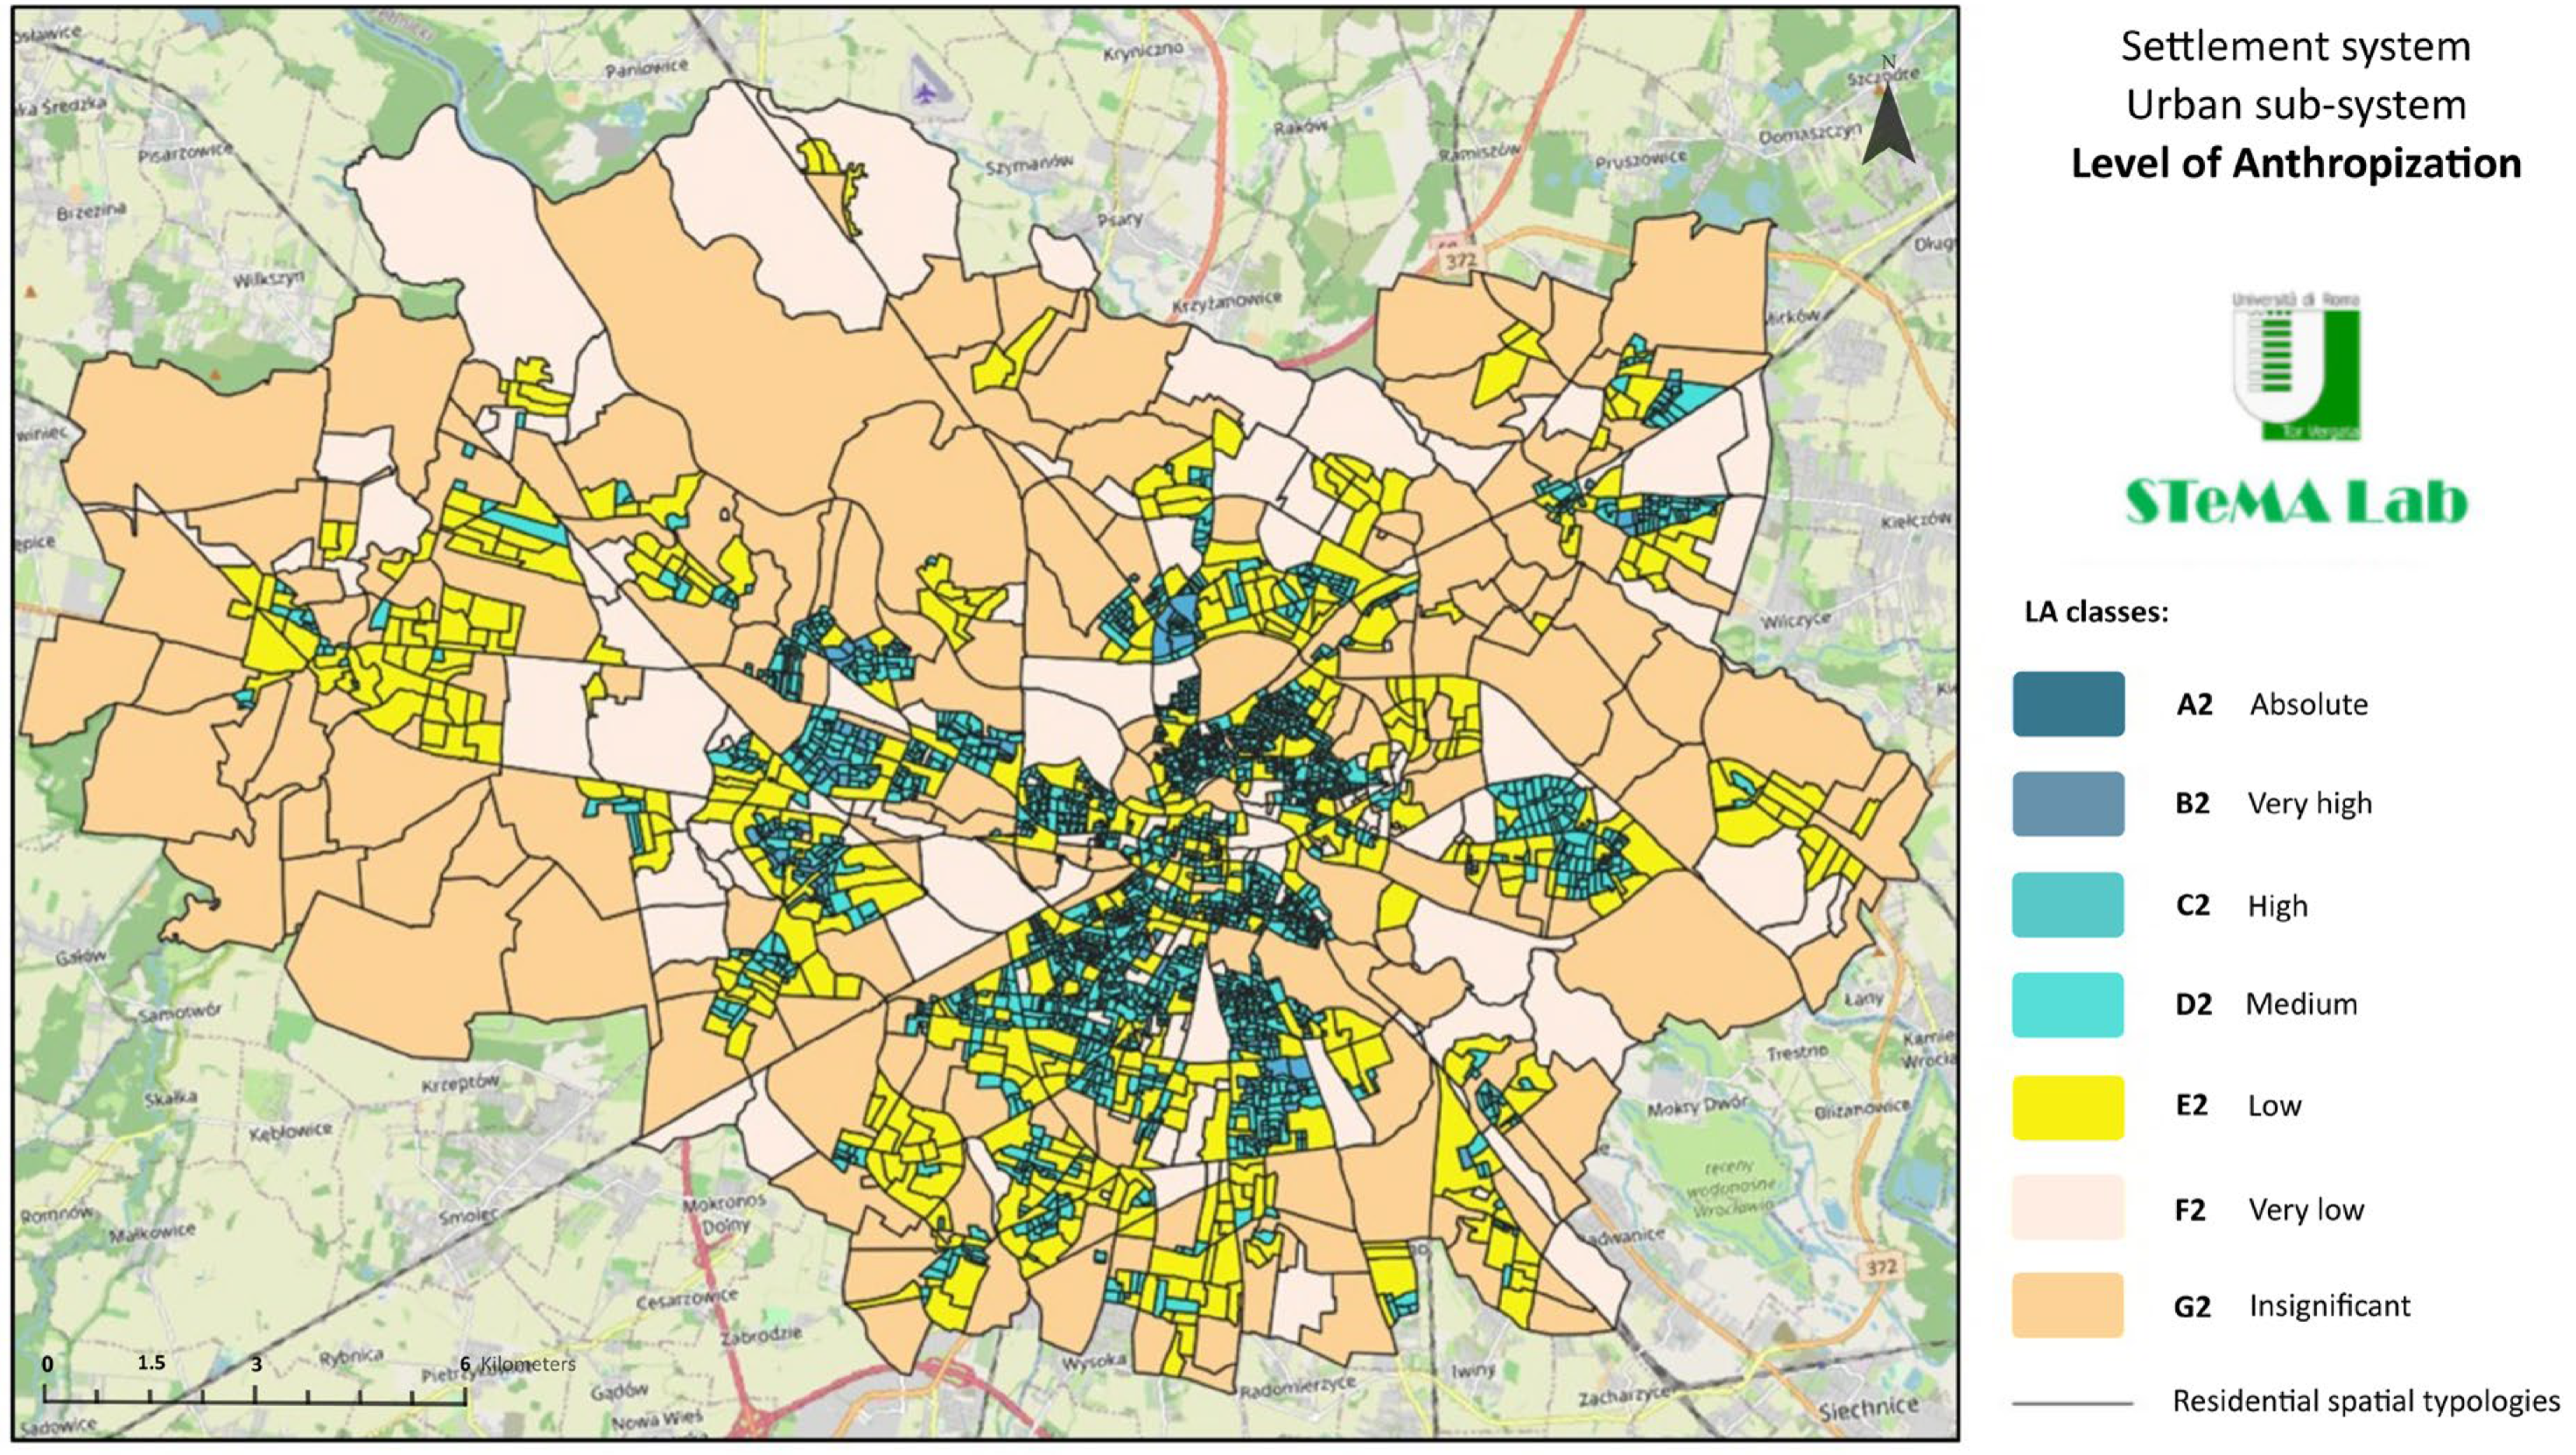
| Rank | Description | Observed Areas |
|---|---|---|
| B2 | Very High | Inner-city clusters, near dense cores |
| C2 | High | Downtown and intermediate zones |
| D2 | Medium | Housing estate areas, central districts |
| E2 | Low | Most are built-up but less dense areas |
| F2 | Very Low | Peripheral or transitional urban zones |
| G2 | Insignificant | Outskirts with minimal human influence |
| A2 | Absolute (None) | Not observed |
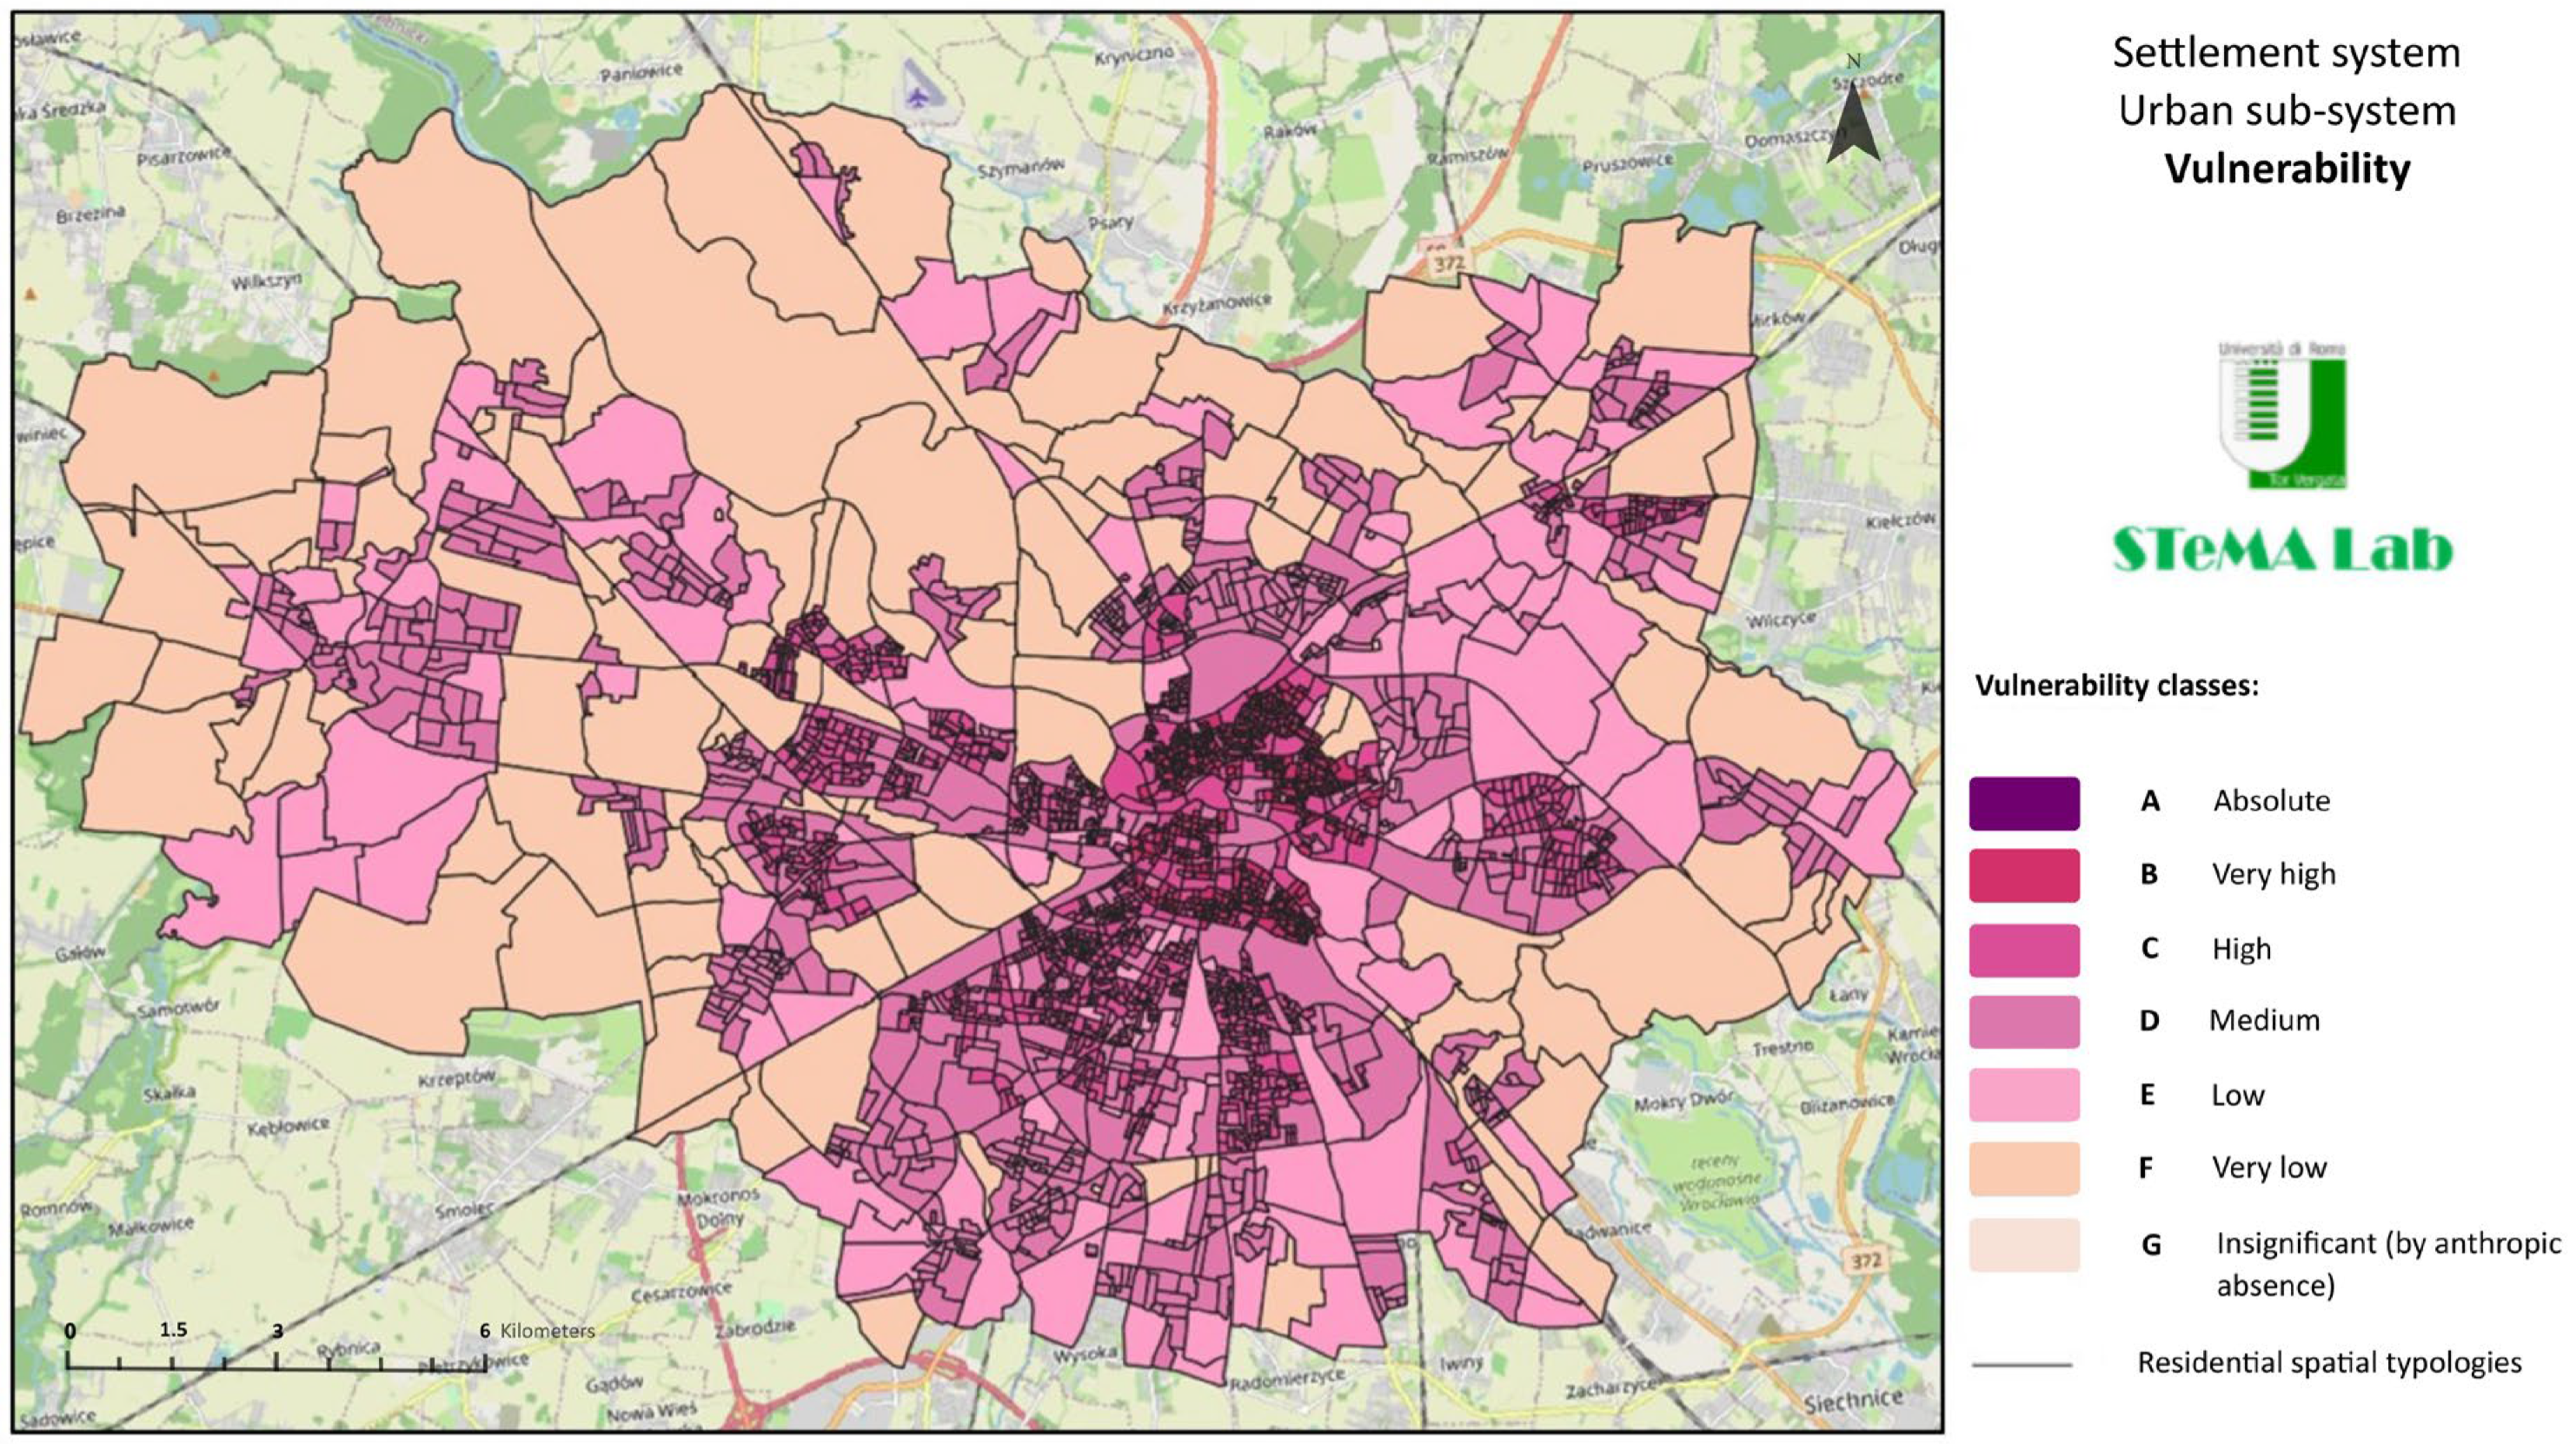
| Vulnerability Rank | Description | Zone Characteristics |
|---|---|---|
| A | Absolute | Not observed |
| B | Very High | Historic downtown, subsidized housing zones |
| C | High | Cameral zones, inner urban fabric |
| D | Average | South and west development corridors |
| E | Weak | Eastern districts, lower urban intensity areas |
| F | Poor | Peripheral natural/rural zones |
Disclaimer/Publisher’s Note: The statements, opinions and data contained in all publications are solely those of the individual author(s) and contributor(s) and not of MDPI and/or the editor(s). MDPI and/or the editor(s) disclaim responsibility for any injury to people or property resulting from any ideas, methods, instructions or products referred to in the content. |
© 2025 by the authors. Licensee MDPI, Basel, Switzerland. This article is an open access article distributed under the terms and conditions of the Creative Commons Attribution (CC BY) license (https://creativecommons.org/licenses/by/4.0/).
Share and Cite
Kaczmarek, I.; Świąder, M.; Hełdak, M.; Prezioso, M. Addressing Urban Vulnerability: A Comprehensive Approach. Land 2025, 14, 1527. https://doi.org/10.3390/land14081527
Kaczmarek I, Świąder M, Hełdak M, Prezioso M. Addressing Urban Vulnerability: A Comprehensive Approach. Land. 2025; 14(8):1527. https://doi.org/10.3390/land14081527
Chicago/Turabian StyleKaczmarek, Iwona, Małgorzata Świąder, Maria Hełdak, and Maria Prezioso. 2025. "Addressing Urban Vulnerability: A Comprehensive Approach" Land 14, no. 8: 1527. https://doi.org/10.3390/land14081527
APA StyleKaczmarek, I., Świąder, M., Hełdak, M., & Prezioso, M. (2025). Addressing Urban Vulnerability: A Comprehensive Approach. Land, 14(8), 1527. https://doi.org/10.3390/land14081527