Abstract
As part of the post-conflict reconstruction and recovery, the development of Kabul New City aims to bring relief to the existing capital city, Kabul, which has experienced exponential population growth, putting heavy pressure on its existing resources. Kabul New City is divided into four subsectors, and each of them is being developed and is expected to reach a target population by 2025, as defined by the master plan. The study’s objective is to determine which of the four zones are in demand and need to be prioritized for development, as per the model results. The data collection involves an online questionnaire, and the responses are collected from residents of Kabul and Herat. Agent-based modeling (ABM) is an emerging method of simulating urban dynamics. Cities are evolving continuously and are forming unique spatial patterns that result from the movement of residents in search of new locations that accommodate their needs and preferences. An agent-based model is developed using the weighted random selection process based on household size and income levels. The agents are the residents of Kabul and Herat, and the environment is the land use classification image using the Sentinel 2 image of Kabul New City. The barren class is treated as the developable area and is divided into four sub-sectors. The model simulates three alternative growth rate scenarios, i.e., ambitious, moderate, and steady. The results of the simulation reveal that the sub-sector Dehsabz South, being closer to Kabul city, is in higher demand. Barikab is another sub-sector high in demand, which has connectivity through the highway and is an upcoming industrial hub.
1. Introduction
Managing urbanization in a sustainable manner is a challenge for developing countries and, more so, for the countries in conflict. Especially for the latter category, the resources and capacities to make strategic decisions are not available, and the spatial developments are seemingly random and discretionary. A specific case concerns Afghanistan. Afghan cities experienced a rapid increase in their population after the fall of the Taliban in 2001. Kabul, the capital, faced the maximum brunt of this increase in the population. During the US-led NATO operation, Kabul witnessed a large-scale migration of refugees and the internally displaced rural population to Kabul, and the recent deportation of Afghan refugees from Pakistan has resulted in overcrowding in Kabul and the need for creating sustainable housing to ease this pressure. Most of the refugees are looking for suitable housing facilities at various economic strata to settle themselves afresh, as they have been uprooted. The rapid growth in population has brought new urban challenges, including an increase in housing demand, leading to the mushrooming of informal settlements, shortage of drinking water, inadequate infrastructure facilities, unemployment, traffic congestion, lack of green spaces, recreation facilities, waste management, water, air, and noise pollution. To offset these challenges, the expansion of the city of Kabul is proposed, creating an area referred to as the Kabul New City. Although there exists a master plan developed by the Japanese Development Cooperation Agency (JICA) [1], several factors may influence how and where this area will grow and what sort of land will be used for this. Mirwais [2] analyzed the spatial structure of Kabul New City in comparison with major Japanese cities, and highlighted key spatial mismatches that may affect implementation. This suggests that, despite strong planning intentions, contextual adaptation remains a critical challenge in Kabul’s urban development.
Compared to other post-conflict cities such as Mosul in Iraq, Aleppo in Syria, or Tripoli in Libya, Kabul presents a distinct urban trajectory. At the time of the NATO-led operation starting in 2001, its population was 1 million, and as of 2023, it is now a thriving city of 5 million. Mosul was under ISIS from 2014 to 2017, during which time it suffered massive destruction [3], while in the case of Kabul, under NATO presence, Operation Enduring Freedom brought stability and security to the city. This relative security made Kabul a more attractive destination for rural migrants seeking safety and opportunities, contributing to rapid urbanization. However, this population surge has placed enormous pressure on the city’s infrastructure and housing systems. Unlike cities such as Mosul, which suffered extensive damage, Kabul’s challenge has been managing unplanned growth, rather than the post-war reconstruction of physical assets.
Given this unknown, and considering the limited availability of data on people’s preferences and behavior in Kabul, the objective of this paper is to develop a land use model to model and predict the relationship between household size and income levels with the preferred region for relocation. With the growth of the population, various land use types compete to meet the needs of the growing population. The model relies on the various factors that people consider when choosing a place to live, especially when moving to a newly developed city. The decisions that households make are largely dependent on their existing location, the size of the household, and income levels. Some of the factors that influence households to relocate are employment opportunities, transportation, weather, healthcare, basic amenities, cost of living, safety, affordable housing, etc. Other than economic and physical factors, social and cultural factors play an important role while choosing a residential location, and, more importantly, religious factors [4]. Ref. [5] carried out a study on the residential preferences on the basis of socio-demographic groups and the neighborhood. The spatial distribution of residential preferences of different age groups of individuals suggests that the younger people prefer to live closer to their place of work, the middle-aged group prefer to be closer to family and friends and within a clean environment, and, as for the older-aged group, it is proximity to family and a clean and quiet environment that matters. With respect to sociodemographic determinants of residential preferences, there is a strong relationship between preferences and the existing neighborhood environment [6]. Cities that are academic centers with a large student population have preferences for residential location that are more in harmony with the commute and the access to transportation [7]. Residential preferences of the elderly largely depend on their education level, health status, and income level [8].
To accommodate for the various factors influencing the choices of people and thus determining urban growth, agent-based modeling (ABM) is a useful tool. ABM has been utilized in a variety of application domains, including modeling complex situations such as emergency evacuation, spread of epidemics, urban dynamics, growth patterns, land use change, and several others, to find solutions to practical problems. ABM allows us to model human behavior and their interaction with one another and with their environment. ABM has been extensively used to simulate urban dynamics. For example, Crooks et al. [9] used an ABM to simulate the spread of informal settlements in Addis Ababa, showing how household decisions respond to institutional and spatial constraints. Benenson [10] used ABM for modeling residential mobility. In land use change simulation, one of the primary strengths of ABM is the ability to simulate human decision-making processes using human behavior, environment, and a set of policies or rules [11]. Ali Termos et al. [12] developed an agent-based model of West Asian urban dynamics, explicitly designed to capture refugee and migrant flows and their effects on urban housing markets and segregation in the Middle Eastern capital of Beirut.
Although the Kabul New City master plan defines broad land use categories, it does not specify how different household groups—particularly low-income, displaced, or returnee populations—will interact with these spaces over time. Given Afghanistan’s dynamic and uncertain post-conflict context, the ABM developed in this study provides a means of identifying likely settlement hotspots within the planned zones and informs how service rollout and infrastructure investment can be prioritized in a phased and demand–responsive manner. The model does not seek to alter designated land uses, but to enhance implementation planning through behavioral insights.
The study seeks to answer the following research questions: (1) How do household-level characteristics, specifically household size and income levels, shape residential preferences within the planned zones of Kabul New City? (2) To what extent can ABM be used to simulate bottom-up housing demand in a post-conflict urban context marred by displacement, informal settlements, and institutional uncertainty? And (3) Which sub-areas in Kabul New City are likely to experience early concentrations of demand under different population growth scenarios, and how can this help planners, decision makers, and investors to decide which areas to prioritize for development?
This paper first introduces the main tenets of ABM, followed by a description of the study area, the methodology of data collection, data analysis, discussion, and conclusion.
2. Theory
ABM follows the bottom-up approach for simulating a system [13]. ABM learning-embedded models have been used for simulating land growth by learning from the past growth patterns to aid in decision-making [14]. A shift in residential preference is studied with respect to the imposed restrictions and perceived accessibility to facilities, mobility by car and public transport amongst sociodemographic groups during the COVID-19 pandemic [15]. The results of the study reveal a preference for a compact urban location, despite the restrictions imposed.
Several agent-based models have been designed to model the location preferences of households, but very few are based on studies conducted on cities under post-war reconstruction and recovery. ABM models have been applied to study the effect of housing policies on housing choices [16]. Several methods of modeling involve the coupling of ABM with other methods for analyzing the complex urban dynamics. Jing Wu et al. [17], in their study, used cellular automata and ABM to emulate the spatial evolution of the population and the driving forces behind changes in the spatial pattern. In another study, Shirzadi Babakan and Alimohammadi [18] used ABM and the NSGA-II algorithm to simulate residents’ choice of location according to their preferences and characteristics, which include housing rent, accessibility to facilities, environmental pollution, and distance from workplace and previous residence, wherein the agents compete with each other for their desired alternative location. In a stylized ABM model, the relationship between urban sprawl and income segregation was studied, based on the Alonso bid rent theory, resulting in the emergence of urban patterns [19].
While ABM provides a valuable tool for simulating residential decision-making, it is essential to examine these preferences in a post-conflict context through a broader theoretical foundation, one that incorporates socio-cultural, institutional, and spatial dynamics. Studies on post-conflict displacement reveal that housing decisions extend beyond economic factors. Fagen [20] highlights that returnees often avoid returning due to insecurity, lack of services, and inadequate housing in areas of origin. Designers of post-conflict housing schemes for IDPs emphasize socio-cultural congruence, participation, and flexibility in site and design choices [21]. UN-Habitat and UN-HCR frameworks further affirm that secure land tenure and the restoration of housing, land, and property rights are critical for stable resettlement [22]. Hébert et al. [23] developed an ABM to simulate how forced migrants make relocation decisions based on safety, social networks, and infrastructure. Barbé [24] estimates that over 70% of Kabul’s population resides in informal settlements, which lack basic urban services and tenure security. The master plan proposes relocating these communities to the newly planned city in Deh-Sabz, aiming to curb unplanned sprawl in central Kabul and provide a higher standard of infrastructure and living conditions in a formally recognized urban environment. This introduces an institutional aspect to residential preferences, where decisions are shaped not only by residential choice, but also by the possibility of tenure security, trust in the governance, and access to basic amenities.
3. Materials and Methods
3.1. Study Area
The study area is the Kabul New City, which is part of the Kabul Metropolitan area and is located at 69°36′18″ longitude, 34°20′42″ latitude, at an elevation of 1847 m, approximately 10 km northeast of Kabul (Figure 1). Kabul New City is situated in the Dehsabz and Barikab districts and other areas lying between Kabul’s International Airport and Bagram Airbase. The new city is divided into four sub-areas: Barikab in the north, Dehsabz North in the east, Paymonar in the west, and Dehsabz South in the south. It is an Urban Development mega-project started by the Afghan government in 2006, covering an area of 744 km2. The city’s master plan was developed with the support of the Japanese International Cooperation Agency [1]. The project aims to tackle the challenges faced by the capital city, Kabul. Some of the challenges include the growth in the population exceeding the sustainable limit and the pressure on the available water resources.
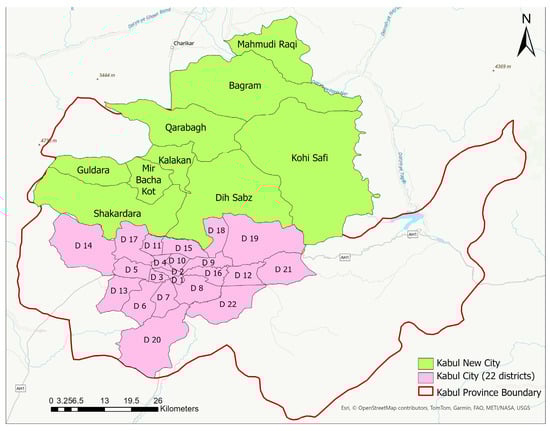
Figure 1.
Map showing the location of Kabul New City, along with Kabul City and Kabul Province boundary.
Kabul New City is divided into four sub-centers. All four zones have been allocated development projects, including the Industrial, Commercial District, Agriculture, and Residential zones. The ABM model maps the residential preferences of people, based on their household size and income levels.
3.2. Data Source
The research utilizes Sentinel 2 harmonized images for classification using the cloud computing platform Google Earth Engine. The image is from 2024 for the months between March and June. A Random Forest classifier is adopted for the classification of the image. The image is classified into five classes: Built, Fields, Water, Hills, and Barren. Training and testing samples are collected for each of the classes by visual interpretation and Google Earth, in combination with Google Maps satellite view. The overall classification accuracy achieved is 77%, with a Kappa of 0.72. The following indices (Table 1) are employed to obtain the best results.

Table 1.
Indices used for classification.
Apart from the indices mentioned in the Table, the Grey Level Cooccurrence Matrix (GLCM), Digital Elevation Model (DEM), and the bands ‘B2’, ‘B3’, ‘B4’, ‘B8’, ‘B11’, ‘B12’ are used. The classified image is then prepared for use in the agent-based model for modeling the city’s growth, to reach a target population for 2025, as mentioned in the JICA report on the basis of the location preference-based survey. The barren class is divided into four sub-sectors: Barikab, Dehsabz South, Paymonar, and Dehsabz North, as shown in Figure 2. The total area under the barren land is 733 km2, and the area under the barren class for each of the sub-sectors is given in Table 2.
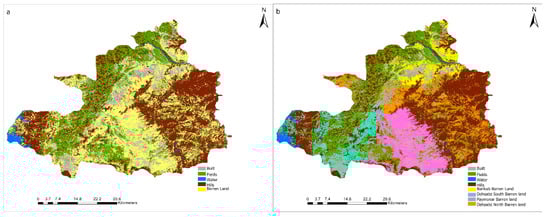
Figure 2.
(a) Classified image with 5 classes. (b) Barren class subdivided into the four sub-areas.
Table 2.
Total areas covered by each class.
The model is simulated using the NetLogo 6.3.0 software, which is a platform for developing ABM. To bring the classified image to NetLogo, the image is down-sampled using 4 × 4 mode aggregation, reducing the original grid size from 398 × 562 to 99 × 140. The initial population of the Kabul New City is 140,000 [33]. The initial population for each sub-sector is assigned to the classes as given in the Table 3, and the targets to be achieved are provided in Table 4.
Table 3.
Initial population.
Table 4.
Target population.
3.3. Questionnaire-Based Survey for Location-Based Preference
An online questionnaire (Supplementary Materials) was prepared in the native language, Dari, and English, and the responses were collected from residents of Kabul and Herat. The questions ranged from their willingness to move to a new location and their reasons for location choice, to their household size and income levels. The questionnaire was shared through an online form, and the respondents were randomly selected on an informal basis. A total of 100 online surveys were distributed to residents of Kabul and Herat. Due to the ongoing political instability and security concerns, only 51 valid responses were received. Many internally displaced persons (IDPs) and refugees lacked access to email or internet-enabled devices, which limited their participation. To address this, assistance was sought from former colleagues and local contacts to help facilitate data collection through informal networks. Carrying out a survey in a post-conflict situation comes with its own challenges. Flexibility in methodology is required in conflict and post-conflict zones [34]. A mixed research methodology was adopted, which includes in-depth interviews with households of varying sizes, with a focus on refugees and internally displaced persons (IDPs), to record conflict-related migration motivation. A few respondents were unwilling to share personal information, but were willing to participate in the survey, which did not require disclosing information related to them, but opinions on the preferences for relocating to the KNC. The study ensured gender inclusion and respondents from diverse professional backgrounds, i.e., farmers, engineers, shop owners, community leaders, and homemakers. The ethics of informed consent were implemented before sharing the survey form with respondents [35]. The respondents were made aware of the purpose of the research, its potential benefits, and the final outcome.
3.3.1. Agent-Based Model
ABM simulation outputs were based on three population growth-rate scenarios, which JICA describe in their Final Report for the Kabul New City: ambitious growth rate at 19%, moderate growth rate at 14.5%, and steady growth rate at 9.9%. The weights assigned to household size and income levels are shown in Table 5. The model calculates the weighted demand and the number of years to reach the target population for 2025. The weighted demand tracks the number of people who preferred each class based on the combination of household size and income levels, and the weights from the weighted preference table. A weighted preference table is calculated from the responses received from the survey. The weight represents the proportion of time each region was selected for a given household size and income level. The results obtained from running the ABM model were based on the three growth scenarios.
Table 5.
Example of Weighted Preference Table Used in the Model.
The agent-based model simulates urban population growth and spatial distribution across four sub-areas of the Kabul New City, i.e., Barikab (class 10), Dehsabz South (class 11), Paymonar (class 12), and Dehsabz North (class 13). The aim is to analyze how household attributes, specifically income and household size, influence locational preference, population growth patterns, and the time required for each region to reach a specified target population. The study used the Netlogo software for the ABM, which comes with a number of choices and selections to make the model run. These include defining the agents, spatial environment, spatial scale, temporal scale, initialization, preference assignment, probabilistic region allocation, growth dynamics, stopping condition, output, and visualization. The process workflow is described in the flowchart in Figure 3.
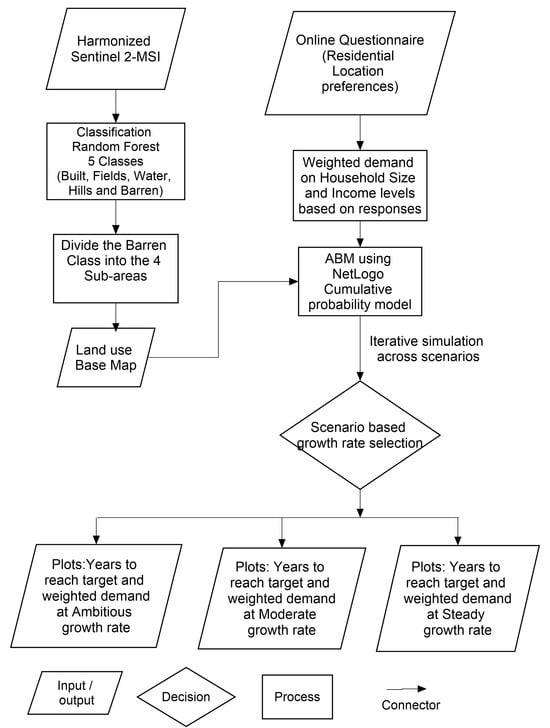
Figure 3.
Process flow for scenario-based modeling of relocation preferences in Kabul New City using ABM.
3.3.2. Agent (Households)
Agents in this model represent individual households, a unit of analysis for residential location preference models. Each household is described by three attributes.
- Ri: Region class: Refers to the specific planning sub-region within Kabul New City (e.g., Barikab, Dehsabz South).
- Ii: Income category.
- Hi: Household size (e.g., 7, 13, 33).
The attributes selected directly govern the reproduction probability and spatial preferences, which are the key factors of urban growth.
3.3.3. Spatial Environment
The environment is composed of discrete grid cells (“patches”) within the NetLogo platform, each assigned a class label representing one of the four sub-regions derived from the classification of the Sentinel 2 satellite image. The environment allows the model to assign the agents to the preferred discrete cells. Patches labeled as one of the four planning classes (10 = Barikab, 11 = Dehsabz South, 12 = Paymonar, 13 = Dehsabz North) are active for settlement. These regions were chosen because they represent the developable land identified in the master plan of Kabul New City, ensuring planning relevance.
3.3.4. Temporal Scale
The model runs in discrete steps, with each tick representing one calendar year. This time resolution balances computational efficiency with urban planning timelines, where population and infrastructure changes typically occur annually.
Initialization
- Region Mapping: a spatial input file parsed through a load-image-only procedure initializes patch class labels, converting raster imagery into a structured simulation space.
- Population Seeding: the create-region-population procedure seeds each region with an initial population, ensuring that each sub-region starts with a baseline number of households.
3.3.5. Preference Assignment, Probabilistic Region Allocation, and Stopping Condition
Households make locational choices based on a weighted preference, as shown in Table 5, which maps combinations of income levels and household sizes to preferred regions. This table determines the probabilistic assignment of preferred regions for new households, based on income and household size. These weights are derived from survey data and introduce heterogeneity and stochasticity into agent behavior. A weighted random selection algorithm assigns new households to regions, based on normalized weights. This reflects context-driven preferences, acknowledging that households may not always choose the optimal location, but tend to prefer certain regions more strongly.
At each tick, households reproduce with the probability determined by the model’s growth rate parameter (e.g., in the case of an ambitious growth rate of 19.3%). Offspring households inherit parental attributes and are assigned a preferred region. They are only placed in regions that have not yet met their target population. This ensures that growth is demand-driven. The simulation terminates once all four regional populations meet their predefined targets, aligning with the planning objective of controlled urban expansion. The formulas explaining the process are described in Table 6.
Table 6.
Key model formulas.
3.3.6. Output and Visualization
The model generates two plots: “Years to Reach Target” and “Weighted Demand”, which track temporal changes in population accumulation and regional settlement preferences. These plots allow for the monitoring of both the pace and spatial concentration of urban growth, offering planners insights into when and where population thresholds are reached or exceeded. By visualizing demand pressure on each sub-region, the outputs facilitate prioritization of infrastructure investments, assessment of planning interventions, and evaluation of alternative development scenarios. In this way, the model serves not only as a predictive tool, but also as a decision-support system for urban policy formulation under conditions of uncertainty and demographic changes.
4. Results
The basis of the research is the responses received from an online survey, which was conducted with residents from Kabul and Herat, the two key cities experiencing population growth and pressures of migration. A total of 51 respondents participated in the survey, and their responses are utilized for calculating the weights to assess the demand for the four sub-sectors.
Drawing on the choices in the ABC model, the NetLogo software first populated the patches with the initial population, resulting in Figure 4a. It then ran the model for each year, and populated each class/region with the turtles on the basis of the weights assigned to the preferred location. The model was simulated for the three alternative growth rate scenarios as projected by JICA in their master plan report, using the predicted population growth rate in the period 2008–2025 (ambitious growth rate of 19%, moderate growth rate of 14.5%, and steady growth rate of 9.9%). The simulation ran till the target population for each of these scenarios was reached. Figure 4b portrays the results for the ambitious growth rate scenario.
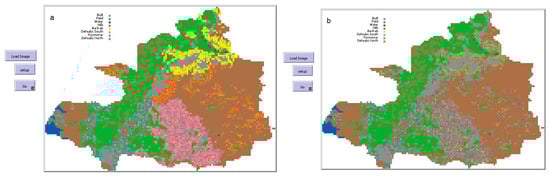
Figure 4.
(a) Populate patches with the initial population. (b) Reaching the target population for all four regions in the case of an ambitious growth rate of 19.3%.
The model simulates the number of years to reach the target and the weighted demand for the regions at thresholds of 100,000 and 300,000. As can be seen from the plots in Figure 5, under the ambitious growth rate, it will take 17 years to reach the target, 22 years under the moderate growth rate scenarios, and 34 years under the steady growth rate scenario.
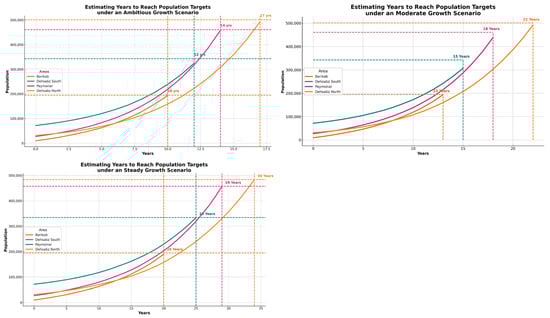
Figure 5.
Number of years to reach the target.
Weighted demand thresholds are determined by assigning weights given to the preferred class based on the household size and income levels, based on a weighted random selection. As can be seen from Figure 6, for the ambitious growth rate, Dehsabz South is the first to reach the 100,000 threshold in 7 years and will take 12 years to reach the 300,000 threshold. The second region to reach the 100,000 threshold is Barikab, in 8 years. Paymonar reaches the 300,000 threshold in 13 years. Dehsabz North takes 9 years to reach the 100,000 threshold, and 15 years to reach the 300,000 threshold. In the case of the moderate growth rate, Barikab and Dehsabz South are the first to reach the 100,000 threshold, in 10 years, followed by Paymonar in 11 years and Dehsabz North in 12 years. Dehsabz South is the first to reach the 300,000 threshold, in 16 years, followed by Paymonar in 17 years and Dehsabz North in 19 years. The results of the simulation under the steady growth rate reveal Barikab and Dehsabz South reaching the 100,000 threshold in 14 years, followed by Paymonar in 15 years and Dehsabz North in 17 years. Dehsabz South reaches the 300,000 threshold in 23 years, followed by Paymoar in 24 years and Dehsabz North in 27 years.
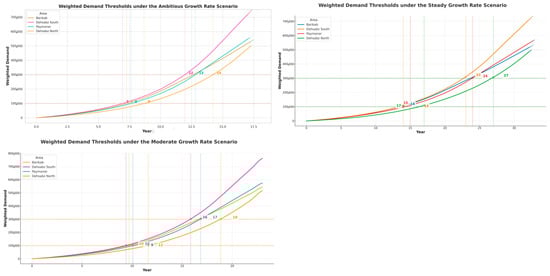
Figure 6.
Weighted demand at 100,000 and 300,000 thresholds.
The results of the simulation for the three alternative growth rates demonstrate that Dehsabz South is the first to reach the threshold in all three scenarios, due to its moderate size and proximity to Kabul. Barikab quickly reaches the weighted demand thresholds of 100,000 and stops growing further, as the target population for Barikab is 194,841. One of the reasons Barikab meets the target early is because of the default household size of 33. Paymonar builds demand over time, due to wider preferences and decent land availability. Dehsabz North is the last to reach the weighted demand thresholds, due to poor terrain and the low weights in the preference table.
5. Discussion
Whilst the ABM using the Netlogo software helps to create predictions of urban growth, which could help with preparatory, mitigation, or regulatory actions, the results also need to be critically evaluated. There are four issues that require further investigation: the weighting of influencing factors, the choice of scenarios, the role of the probability functions in the individual choices and aggregation of individual choices, and finally, the choice of the Netlogo software for the ABM.
First, the weighting of factors may be contested. The model simulates how and where households decide to rank and choose locations for their residence, assuming that household size and income levels are the most probable factors influencing this choice. The aggregate of individual choices of the households results in the emergent behavior at the system level. It incorporates a growth mechanism via a probabilistic reproduction rate, which is defined by the three alternative growth rates. However, this model has some drawbacks. All the preferred weights are fixed. They do not evolve or change according to regional conditions, which may vary, such as available space, quality of life, etc. The model does not enforce land use limits, and the population can grow, irrespective of the space constraint.
Secondly, the simulation results across the three growth scenarios, i.e., ambitious, moderate, and steady, consistently show that Dehsabz South and Barikab are the first regions to meet the weighted demand threshold (100,000 and 300,000, respectively). This makes the two regions attractive for relocation when weighted against household size and income levels. Barikab is being developed as an agricultural economic zone and is located between Parwan and Kabul, next to the highway and close to Bagram airbase, giving the strategic advantage for the new settlers for employment opportunities in the upcoming industrial park and the agro-processing sector. It also has a relatively flat land area, making it attractive for residential development. The industrial park will be developed, and industrial subsidies will be granted to open businesses, making Barikab a preferred location. Proximity to Kabul and the recent development of highway and road connectivity from Tarakhel to Dehsabz make Dehsabz South attractive for relocation. Dehsabz South also has the largest area under barren land, approximately 241 km2, for development. A large portion of the Dehsabz South land consists of brick kilns, which were originally located in the Kabul district [31]. The area, which was subject to land grabbing by warlords, was considered unsafe; however, with the arrest of the warlords, the security situation has improved [36]. Although Paymonar consists of the largest flat land, it has poor accessibility to the existing Kabul city, which could be the reason why it ranks lower in the preferred sectors for relocation. Most of the area of Dehsabz North is in the hilly tract, with a steeper slope, leaving a very small area under flat land, making it the least favorable for relocation. These findings suggest that geographical features, accessibility to Kabul city, and economic development plans are the key drivers of relocation dynamics in the location preference model.
A third remark concerns the use of probability functions on the basis of which the ABM runs. The advantage of the turtle model is that it can simulate uncertain and emergent behavior in the social system of residential house seekers. Not every house seeker uses the same factors and makes the same choices, and thus, the probability functions help to map randomness in this behavior. By varying probability, one can even create different scenarios to test sensitivity and critical tipping points. As such, the model proves to be helpful in predicting and mitigating certain actions. On the other hand, the probabilistic outcomes may not seem realistic, and may hide or fail to reveal unexpected behavior. In the choices for residential areas, there may be much more isomorphic mimicry than one would normally expect; i.e., people may choose not based on their individual rationality, but rather mimicking what other people have done. This may propel certain attractions to certain areas, which the model itself may not have foreseen. Tuning the ‘right’ probability may thus be more complex than initially modelled by the software.
A fourth critical issue is the choice of the Netlogo software in making the predictions. Even though Netlogo is a popular and frequently used software for researchers in the geospatial domain, running the software when the number of agents and interactions increases and aiming to obtain visual outputs may take a long time. For in-depth spatial analyses, one still needs to rely on additional GIS software (any GIS software, version 3.5) and/or programming languages. In our case, we could have opted for alternative software packages with more GIS integration capabilities (such as MASON or GAMA), but as the main emphasis of this study was to obtain initial predictions of urban growth in a context where limited data are available or accessible, we opted to rely on the more mainstream software. What we did obtain was at least a number of first spatio-temporal scenarios, which can be used as the basis for further longitudinal studies on this specific case.
The simulation results obtained from the ABM model not only provide a theoretical insight, but are also relevant for urban policy formulation for Kabul New City. Kabul New City is a multi-stakeholder project. According to the land use plan drafted in the master plan report (JICA), all four sub-areas cater for residential housing projects, and the private sector will play a major part in the development. The private developers are obliged to allocate affordable housing under government policy, and this should be implemented in all four sub-areas. The demand for relocation to Dehsabz South is higher than that of other sub-areas. Dehsabz South is the first to cross the weighted demand threshold of 300,000 households, according to all three growth rate scenarios, and as such, the current allocation of 1500 ha is projected to fall short under the standard density assumption. It will cross the 300,000 threshold in 12 years under the ambitious growth rate, which is approximately short of 643 ha. This would require an expansion of residential land or densification through vertical housing and compact development with sustainable infrastructure, and should be accompanied by a mass transit system. In light of the results derived, ABM provides a valuable framework for testing policy alternatives like the regularization of informal settlements, relocation compensation, or land redistribution in a post-conflict context in Afghanistan, where insecure land rights, absence of formal land tenure, and limited institutional trust influence urban development.
While the current ABM incorporates household size and income as the primary determinants of relocation, it is important to recognize that, in a post-conflict context such as Kabul, agent behavior is also significantly influenced by cultural and socio-political legacies. Kabul is a city characterized by ethnically diverse settlements. Ethnically-based clustering in Kabul has deepened over time, mostly due to insecurity, lack of formal land access, and lack of inclusive planning. The new master plan drafted by JICA seeks to address the issue of ethnic segregation by connecting the proposed Kabul New City with the existing urban fabric through integrated transport networks, inclusive zoning policies, and the equitable distribution of public services, challenges that were not adequately addressed in previous master plans [37]. Insights from in-depth interviews revealed that many respondents lost government employment following the regime change and were subsequently forced into the informal economy, taking up work as street vendors and day laborers. Due to limited financial capacity, these individuals are often unable to afford formal rental housing, and are pushed into informal settlements. Interviewees also highlighted a growing concern around water scarcity in Kabul. According to the Kabul Urban Design Framework, the municipality is now permitting the construction of high-rise buildings in areas previously designated for low-rise structures. This has encouraged speculative investment in real estate, particularly by wealthier individuals seeking to capitalize on housing demand. However, these developments largely depend on groundwater extraction, and, in several districts, groundwater levels have reportedly declined by 50 to 60 m. This trend, if unchecked, could exacerbate Kabul’s looming water crisis and disproportionately impact low-income and displaced populations who lack access to resilient infrastructure.
6. Conclusions
In the context of uncertain urban growth in a country with limited data, the objective of this study was to generate a land use model that could predict the behavior of house-seeking citizens in choosing their preferred residential location, based on their household size and income levels. We argue that ABM models are best suited to simulate people’s behavior in making relocation choices, as they are ideal for studying urban growth and demand for residential land, as in the case of Kabul New City. The model we created relied on using the Netlogo software, and was based on the online survey and the responses received from the residents of Kabul and Herat. In parallel interviews with the CRIDA staff, refugees and IDPs’ insight was provided into the status of development of the Kabul New City Development and the challenges faced by them to attract investments, feasibility, and constraints in the housing provision and service delivery.
While the model is grounded in household size and income, and quantifiable and observable traits, its usefulness in a post-conflict setting lies in identifying how displaced and economically vulnerable populations interact with formal spatial plans. The findings, though derived from a modest dataset, reflect how socio-economic stressors (e.g., job loss, relocation after deportation, housing affordability) influence residential demand in new developments. Thus, the ABM becomes a proxy for understanding broader post-conflict urban behaviors in the absence of reliable institutional data.
Although the results indicate most likely scenarios of urban land demand, there are some limitations: (1) they require micro-level data to calibrate behavior, (2) there is high computation cost in the case of large-scale models, (3) there is oversimplification of behavioral assumptions, and (4) validation and verification require comparison with observed data, which is often lacking.
Since the results of the sample are too small and are not representative of the population, the model may have a bias, due to insufficient sample size. However, a trend can be established from the results of the model. Dehsabz South is the most preferred region for relocation, which matches the satellite growth scenario due to its proximity to the capital, Kabul. In the case of Barikab, it quickly reaches the weighted demand threshold due to the survey data, where, a large household-size preferred location being Barikab, it absorbs the demand fast. The household size preferring Paymonar is moderate-to-low, and therefore, it falls third in the preferred region for relocation. Dehsabz North is the least preferred, and forms a deferred growth pattern. Dehsabz North is a predominantly hilly region with elevation gradually increasing towards the north, which makes it less attractive for relocation. However, other than being the least preferred location in the model, the household size has impacted the result, with the smaller household size preferring Dehsabz North for relocation, making it the slowest in the absorption of the new turtles. Finally, to make the model realistic and futuristic, integrating factors like accessibility and GDP will influence the choice of relocation. This will bring a shift in the model from a static preference simulator to a spatial-economic behavior model, making it more realistic and policy-oriented.
In a context where land use has already been predesignated through a master plan, the added value of this agent-based model lies in its ability to identify areas of high residential preference, particularly among displaced and low-income households. Given that Kabul New City is a multi-stakeholder initiative involving government planners, international donors, and private investors, the model supports more targeted development and investment planning. By highlighting zones with higher anticipated demand under different growth scenarios, it enables stakeholders to prioritize infrastructure rollout, minimize investment risk, and optimize returns, ensuring that the implementation of the urban plan is responsive to actual behavioral patterns and not just top-down zoning.
To make the model more realistic, and also useful for other cases with similar characteristics, further research would be necessary. Introducing land price and zoning rules will make the model more realistic. Adding different types of agents, like developers, policy makers, planners, and government agencies, will influence the growth pattern. Future studies should consider connectivity and economic opportunities, as these factors have a direct influence on household decision-making in an agent-based framework.
Supplementary Materials
The following supporting information can be downloaded at: https://www.mdpi.com/article/10.3390/land14071502/s1, online questionnaire.
Author Contributions
Conceptualization, V.C. and W.T.d.V.; methodology, V.C.; software, V.C.; validation, V.C. and W.T.d.V.; formal analysis, V.C.; data curation, V.C.; writing—original draft preparation, V.C.; supervision, W.T.d.V.; project administration, W.T.d.V.; All authors have read and agreed to the published version of the manuscript.
Funding
This research received no external funding.
Data Availability Statement
Research conducted using high-resolution satellite imagery hosted on Google Earth Engine and an online survey using Google Forms.
Acknowledgments
We are grateful for the discussions with a former employee of CRIDA (Capital Region Independent Development Authority) and the support provided in collecting data for the online survey.
Conflicts of Interest
The authors declare no conflicts of interest.
References
- Japan International Cooperation Agency (JICA); Dehsabz City Development Authority (DCDA); Ministry of Urban Development (MoUD). JICA Report. Japan International Cooperation Agency (JICA): Tokyo, Japan, 2009. [Google Scholar]
- Jamali, M. An Analysis of Spatial Structure of Kabul New City: A Comparison with Infrastructure Framework and Land Use of Japanese Major Cities. 2021, pp. 1101–1114. Available online: https://www.academia.edu/download/76057104/IRJET_V8I11176.pdf (accessed on 2 July 2025).
- Saeed, Z.O.; Almukhtar, A.; Abanda, H.; Tah, J. Mosul City: Housing Reconstruction after the ISIS War. Cities 2022, 120, 103460. [Google Scholar] [CrossRef]
- Sinniah, G.K.; Shah, M.Z.; Vigar, G.; Aditjandra, P.T. Residential Location Preferences: New Perspective. Transp. Res. Procedia 2016, 17, 369–383. [Google Scholar] [CrossRef]
- Dökmeci, V.; Berköz, L. Residential-location preferences according to demographic characteristics in Istanbul. Landsc. Urban Plan. 2000, 48, 45–55. [Google Scholar] [CrossRef]
- Li, J.; Auchincloss, A.H.; Rodriguez, D.A.; Moore, K.A.; Diez Roux, A.V.; Sánchez, B.N. Determinants of Residential Preferences Related to Built and Social. Environments and Concordance between Neighborhood Characteristics and Preferences. J. Urban Health 2020, 97, 62–77. [Google Scholar] [CrossRef] [PubMed]
- Jaroszewicz, J.; Majewska, A. Group spatial preferences of residential locations—Simplified method based on crowdsourced spatial data and mcda. Sustainability 2021, 13, 4690. [Google Scholar] [CrossRef]
- Li, H.; Duan, C.; Chunyu, M.D. A study of the factors influencing the residential preferences of the elderly in China. Sustainability 2021, 13, 5488. [Google Scholar] [CrossRef]
- Patel, A.; Crooks, A.; Koizumi, N. Slumulation: An agent-based modeling approach to slum formations. J. Artif. Soc. Social. Simul. 2012, 15, 2. [Google Scholar] [CrossRef]
- Benenson, I. Multi-agent simulations of residential dynamics in the city. Comput. Environ. Urban Syst. 1998, 22, 25–42. [Google Scholar] [CrossRef]
- Ralha, C.G.; Abreu, C.G.; Coelho, C.G.C.; Zaghetto, A.; Macchiavello, B.; Machado, R.B. Environmental Modelling & Software: A multi-agent model system for land-use change simulation. Environ. Model. Softw. 2013, 42, 30–46. [Google Scholar] [CrossRef]
- Termos, A.; Picascia, S.; Yorke-Smith, N. Agent-based simulation of west Asian urban dynamics: Impact of refugees. Jasss 2021, 24, 2. [Google Scholar] [CrossRef]
- Macal, C.M.; North, M.J. Agent-based modeling and simulation: ABMS examples. In Proceedings of the Winter Simulation Conference, Miami, FL, USA, 7–8 December 2008; pp. 101–112. [Google Scholar] [CrossRef]
- Li, F.; Li, Z.; Chen, H.; Chen, Z.; Li, M. An agent-based learning-embedded model (ABM-learning) for urban land use planning: A case study of residential land growth simulation in Shenzhen, China. Land Use Policy 2020, 95, 104620. [Google Scholar] [CrossRef]
- Wolday, F.; Böcker, L. Exploring changes in residential preference during COVID-19: Implications to contemporary urban planning. Environ. Plan. B Urban. Anal. City Sci. 2023, 50, 1280–1297. [Google Scholar] [CrossRef] [PubMed]
- Jordan, R.; Birkin, M.; Evans, A. An agent-based model of residential mobility: Assessing the impacts of urban regeneration policy in the EASEL district. Comput. Environ. Urban Syst. 2014, 48, 49–63. [Google Scholar] [CrossRef]
- Wu, J.; Mohamed, R.; Wang, Z. Agent-based simulation of the spatial evolution of the historical population in China. J. Hist. Geogr. 2011, 37, 12–21. [Google Scholar] [CrossRef]
- Babakan, S.; Alimohammadi, A. An Agent-Based Simulation of Residential Location Choice of Tenants in Tehran, Iran. Trans. GIS 2016, 20, 101–125. [Google Scholar] [CrossRef]
- Guo, C.; Buchmann, C.M.; Schwarz, N. Linking urban sprawl and income segregation—Findings from a stylized agent-based model. Environ. Plan. B Urban Anal. City Sci. 2019, 46, 469–489. [Google Scholar] [CrossRef]
- Fagen, P.W. Refugees and IDPs After Conflict: Why They Do Not Go Home (Special Report No. 268); United States Institute of Peace: Washington, DC, USA, 2011; Available online: https://www.usip.org/publications/2011/04/refugees-and-idps-after-conflict (accessed on 7 April 2025).
- Afolabi, A.O.; Oluwatayo, A.; Oyeyipo, O. Assessment of designers’ perception of post-conflict housing reconstruction. Constr. Econ. Build. 2018, 18, 27–47. [Google Scholar] [CrossRef]
- Roy, A. Urban informality: Toward an epistemology of planning. J. Am. Plan. Assoc. 2005, 71, 147–158. [Google Scholar] [CrossRef]
- Hébert, G.A.; Perez, L.; Harati, S. An Agent-Based Model to Identify Migration Pathways of Refugees: The Case of Syria; Advances in Geographic Information Science; Springer International Publishing: Cham, Germany, 2018; pp. 45–58. [Google Scholar] [CrossRef]
- Barbé, D. Population Displacement and Urban Transition in Kabul City: Current Spatial Structure, Social Issues and Recommendations for a New Development Plan. Sci. Po-Fall. 2013. Available online: https://www.researchgate.net/publication/260796612_Population_Displacement_and_Urban_Transition_in_Kabul_City_Current_Spatial_Structure_Social_Issues_and_Recommendations_for_a_New_Development_Plan (accessed on 2 July 2025).
- Huang, C.; Zhang, C. Characterizing urban growth in Vientiane from 2000 to 2019 using time-series optical and SAR-based estimates of urban land. Int. J. Appl. Earth Obs. Geoinf. 2022, 109, 102798. [Google Scholar] [CrossRef]
- Abdi, A.M. Land cover and land use classification performance of machine learning algorithms in a boreal landscape using Sentinel-2 data. GIScience Remote Sens. 2020, 57, 1–20. [Google Scholar] [CrossRef]
- Mzid, N.; Pignatti, S.; Huang, W.; Casa, R. An analysis of bare soil occurrence in arable croplands for remote sensing topsoil applications. Remote Sens. 2021, 13, 474. [Google Scholar] [CrossRef]
- Osgouei, P.E.; Kaya, S.; Sertel, E.; Alganci, U. Separating built-up areas from bare land in Mediterranean cities using Sentinel-2A imagery. Remote Sens. 2019, 11, 345. [Google Scholar] [CrossRef]
- Gitelson, A.A.; Kaufman, Y.J.; Stark, R.; Rundquist, D. Novel algorithms for remote estimation of vegetation fraction. Remote Sens. Environ. 2002, 80, 76–87. [Google Scholar] [CrossRef]
- Tran, D.X.; Dominati, E.; Lowry, J.; Mackay, A.; Vibart, R.; Pearson, D.; Devantier, B.; Noakes, E. Effects of spatial data resolution on the modelling and mapping of soil organic carbon content in hill country grassland landscapes. Soil Use Manag. 2024, 40, e12966. [Google Scholar] [CrossRef]
- Dewitt, J.D.; Chirico, P.G.; Alessi, M.A.; Boston, K.M. Remote sensing inventory and geospatial analysis of brick kilns and clay quarrying in Kabul, Afghanistan. Minerals 2021, 11, 296. [Google Scholar] [CrossRef]
- Talukdar, S.; Singha, P.; Mahato, S.; Pal, S. Land-Use Land-Cover Classification by Machine Learning Classifiers for Satellite Observations—A Review. Remote Sens. 2020, 12, 1135. [Google Scholar] [CrossRef]
- Habibi, S.M.; Ono, H.; Shukla, A. Geographical Information System (GIS) Based Multi-Criteria Decision Analysis for Categorization of the Villages: In the Case of Kabul New City Villages. Urban Sci. 2021, 5, 65. [Google Scholar] [CrossRef]
- Rafiqul Islam, M. Field research in the conflict zone: An empirical study of the Chittagong Hill Tracts in Bangladesh. In Field Guide for Research in Community Settings (December); Edward Elgar Publishing: Gloucestershire, UK, 2021; pp. 154–166. [Google Scholar] [CrossRef]
- Moss, S.M.; Uluğ, Ö.M.; Acar, Y.G. Doing research in conflict contexts: Practical and ethical challenges for researchers when conducting fieldwork. Peace Confl. 2019, 25, 86–99. [Google Scholar] [CrossRef]
- Foschini, F. Land Grabs (2): Deh Sabz, the New and the Old. 2013. Available online: https://www.afghanistan-analysts.org/en/reports/rights-freedom/land-grabs-2-deh-sabz-the-new-and-the-old/ (accessed on 2 July 2025).
- Sarwari, F.; Ono, H. An Analysis of Urban Ethnic Inclusion of Master Plans—In the Case of Kabul City, Afghanistan. Urban Sci. 2023, 7, 3. [Google Scholar] [CrossRef]
Disclaimer/Publisher’s Note: The statements, opinions and data contained in all publications are solely those of the individual author(s) and contributor(s) and not of MDPI and/or the editor(s). MDPI and/or the editor(s) disclaim responsibility for any injury to people or property resulting from any ideas, methods, instructions or products referred to in the content. |
© 2025 by the authors. Licensee MDPI, Basel, Switzerland. This article is an open access article distributed under the terms and conditions of the Creative Commons Attribution (CC BY) license (https://creativecommons.org/licenses/by/4.0/).