Article

Evaluating Urban Park Utility in Seoul: A Distance-to-Area Discounting Model

1
Department of Urban and Transportation Engineering, Korea National University of Transportation, Chungju 27469, Republic of Korea
2
Department of Landscape Architecture, Gyeongsang National University, Jinju 52725, Republic of Korea
*
Author to whom correspondence should be addressed.
Land 2025, 14(7), 1449; https://doi.org/10.3390/land14071449
Submission received: 18 June 2025 / Revised: 8 July 2025 / Accepted: 10 July 2025 / Published: 11 July 2025

Abstract

This study proposes a novel method to assess urban park accessibility by incorporating perceived utility based on both park area and distance. Departing from conventional models that treat accessibility as a function of geometric proximity alone, we define park utility as a distance-discounted benefit of park area, thereby allowing for a more behaviorally grounded measure. A customized discounting function is introduced, where larger park sizes proportionally reduce perceived travel cost, and walking speed adjustments are applied based on demographic user profiles (children, adults, and older adults). The methodology was implemented using a Python-based v.3.12.9 geospatial workflow with network-based distance calculations between 18,614 census block groups and all urban parks in Seoul. Population-weighted utility scores were computed by integrating park size, distance, and age-specific mobility adjustments. The results reveal significant intra-urban disparities, with a citywide deficit of 4,066,046 m in population-weighted distance, particularly in areas with large populations but insufficient proximity to high-utility parks. Simulation analyses of 30 candidate sites demonstrate that strategic park placement can yield substantial utility improvements (maximum gain: 493,436 m), while indiscriminate expansion may not. These findings offer spatial decision support for optimizing limited public resources in urban green infrastructure planning and underscore the need to consider both park scale and user-specific walking behavior in evaluating accessibility.

1. Introduction

Urban parks serve as essential infrastructure in contemporary cities, contributing significantly to public health, environmental quality, and social well-being [1,2,3,4,5]. As such, urban planners and policymakers have increasingly emphasized the equitable distribution of access to these green spaces [6,7,8]. However, despite ongoing efforts to improve both the quantity and quality of urban parks, disparities in access to parks remain evident across different residential areas. Although some studies suggest that vulnerable groups (e.g., the elderly or low-income populations) may enjoy relatively better spatial access to parks [9,10], this does not necessarily reflect equitable provision. When park supply is not aligned with actual usage patterns, preferences, or quality of experience, such distribution may inadvertently reinforce socio-spatial inequality.
In exploring the concept of park equity, it is essential to distinguish between quantitative and qualitative aspects of park accessibility. In this study, perceived accessibility is defined as a cognitively adjusted measure of access in which physical travel distance is discounted according to the park’s size. This reflects the behavioral assumption that users are more willing to travel longer distances to larger, more attractive parks. Accordingly, perceived accessibility is operationalized as park utility expressed in distance-equivalent terms.
Building on this definition, park equity is conceptualized as the extent to which perceived accessibility—measured through distance-discounted utility—varies across different residential locations. The present study focuses specifically on spatial equity, identifying patterns of inequity in perceived park utility across Seoul’s 18,614 census block groups. Although temporal dynamics are beyond the scope of this analysis, the proposed methodology can be extended to future longitudinal studies.
Traditional approaches to evaluating unequal park distribution have predominantly focused on measuring the physical proximity between park supply and residential demand. These methods can largely be categorized into two types: the container method, which examines whether a given park falls within a defined administrative boundary, and the coverage method, which measures the distance between supply and demand points. While these methods provide a foundational understanding of spatial accessibility, recent advances in measurement techniques have expanded the scope of analysis beyond mere physical distance [11,12].
Emerging studies have incorporated diverse factors to reflect more realistic park accessibility patterns. For instance, Tan and Samsudin [13] introduced the concept of spatial scale to evaluate park accessibility equity, while Zhang et al. [14] proposed a multi-dimensional framework that included park entry benefits, small space benefits, and intermediate space benefits. Wang et al. [15] enhanced the accuracy of accessibility evaluations by using network-based distances rather than simple Euclidean measures. Recognizing the importance of travel behavior, scholars have also sought to differentiate accessibility by travel mode, including walking, bicycling, and driving [16]. In particular, Hu et al. [4] demonstrated that single-mode accessibility models may overestimate park accessibility and proposed a multi-modal Gaussian-based two-step floating catchment area (2SFCA) method to address this limitation. Collectively, these studies reflect an ongoing evolution toward more sophisticated and realistic methodologies for measuring park accessibility.
The 3-30-300 rule has recently emerged as a new standard for ensuring equitable access to parks [17,18,19]. This rule stipulates that everyone should have a view of at least three trees from their home (visual connection), reside in an area with a minimum of 30% canopy coverage (environmental quality), and be no more than 300 m from the nearest public green space (spatial accessibility) [17]. Increasingly, this guideline has been formally integrated into urban greening strategies or adopted informally in numerous cities across Europe and beyond and has been formally and informally adopted in numerous cities across Europe and globally [18]. It implicitly combines the container approach (neighborhood-based criteria) and the cover approach (distance-based accessibility) while highlighting user-centric awareness. This trend signifies the multidimensional expansion of “equity” in the planning of green infrastructure, including parks.
Alongside this quantitative advancement, an increasing body of research has emphasized the importance of qualitative measures in evaluating park accessibility [20,21,22]. Especially in urban contexts where the physical expansion of park space is limited, qualitative improvements have emerged as critical alternatives. Biernacka and Kronenberg [23] argued that the concept of attractiveness should complement the conventional criteria of availability and accessibility in assessing urban parks. While earlier approaches often treated accessibility and park attractiveness as separate dimensions, this study conceptualizes them as inherently linked. Specifically, park attractiveness—proxied by park area—is used to discount physical travel distance, thereby embedding qualitative perception directly into the accessibility metric. In doing so, our model operationalizes perceived accessibility as a unified, behaviorally grounded measure of park utility. Similarly, Hu et al. [4] and subsequent studies have introduced qualitative dimensions of park attractiveness, including facilities, amenities, services, management quality, and aesthetic features [11,24]. These qualitative factors are not only crucial for enhancing user experience but also for safeguarding small parks from being overlooked or replaced in future urban development plans. In densely built environments, where large parks are often infeasible—as is the case in Seoul—small parks are prevalent and often critical to achieving walkable access within short distances. This focus aligns with the study area’s policy context and the practical role of small parks in neighborhood-level service provision. In this regard, the recognition of qualitative values expands the evaluative framework of usefulness within discussions of park equity.
While conventional approaches often consider quantitative and qualitative aspects of park accessibility separately, recent research has emphasized the need to integrate these dimensions. In real-world contexts, users’ perceived accessibility frequently diverges from objective measurements of physical distance. Wolff et al. [25] highlight that users may perceive parks to be closer based on factors such as attractiveness, size, or available facilities, even when actual distance remains unchanged. In this context, a park’s high usage can be interpreted as reflecting a perceived reduction in travel burden, driven by qualitative attributes [23]. Park usage, therefore, serves as a practical indicator of a park’s ability to deliver its intended benefits [17,24]. This study builds on these insights by incorporating qualitative attributes—proxied by park size—into a network-based accessibility model. We argue that such an integrated approach offers a more behaviorally grounded measure of perceived accessibility and, in turn, provides a more realistic basis for evaluating spatial equity in urban park distribution. Accordingly, this study aims to address the following research question: To what extent does perceived park accessibility, as measured through distance-discounted utility, reveal spatial inequities in urban park distribution?
Nevertheless, relatively few studies have empirically integrated qualitative and quantitative dimensions to assess how perceived park accessibility is shaped by both physical distance and park attributes. This integration can be operationalized through a distance reduction function, in which perceived travel burden decreases in proportion to park attractiveness. By adopting this framework, our analysis moves beyond conventional distance-based metrics to better capture user perception. This approach offers actionable insights for urban policymakers aiming to ensure equitable access to green spaces. Building on this concept, we use park size as a proxy for attractiveness and incorporate it into a weighted distance model that combines objective proximity with qualitative value. Focusing on Seoul—a densely populated metropolitan area with complex spatial dynamics—the model identifies spatial disparities in perceived accessibility and locates areas with insufficient effective park supply.
Through this approach, we aim to bridge a key gap in the literature by proposing a unified, utility-based accessibility model that expresses perceived park accessibility in distance-equivalent terms. This enables consistent spatial comparison across population groups and urban subregions and contributes to advancing theoretical and practical understanding of urban environmental equity.

2. Methodology

2.1. Conceptualizing Park Accessibility as Utility

Despite growing recognition that park accessibility is shaped by both physical and qualitative factors, few studies have formalized how these dimensions interact to influence user behavior. While earlier research has noted that park features such as size and amenities can affect perceived accessibility and usage frequency [4,20,22], such effects have often been discussed descriptively or treated as separate from spatial metrics like distance. Yet in practice, individuals implicitly evaluate both the attractiveness of a park and the effort required to access it, often tolerating greater distances when the expected benefit is higher.
To reflect this behavioral logic, this study introduces the concept of park utility—a metric that synthesizes spatial cost and perceived benefit within a unified framework. Here, park size functions not only as a proxy for attractiveness but as a behavioral amplifier that reduces the perceived cost of access. In this formulation, utility increases when large parks justify longer travel distances, thereby discounting the effective burden of distance. This trade-off aligns with observed usage patterns and supports a more realistic, benefit-adjusted interpretation of accessibility. By formalizing this compensatory relationship, the proposed framework offers an operational way to estimate perceived accessibility across spatial units. The following section presents the structure of this utility model and its application to equity analysis in the Seoul metropolitan area.

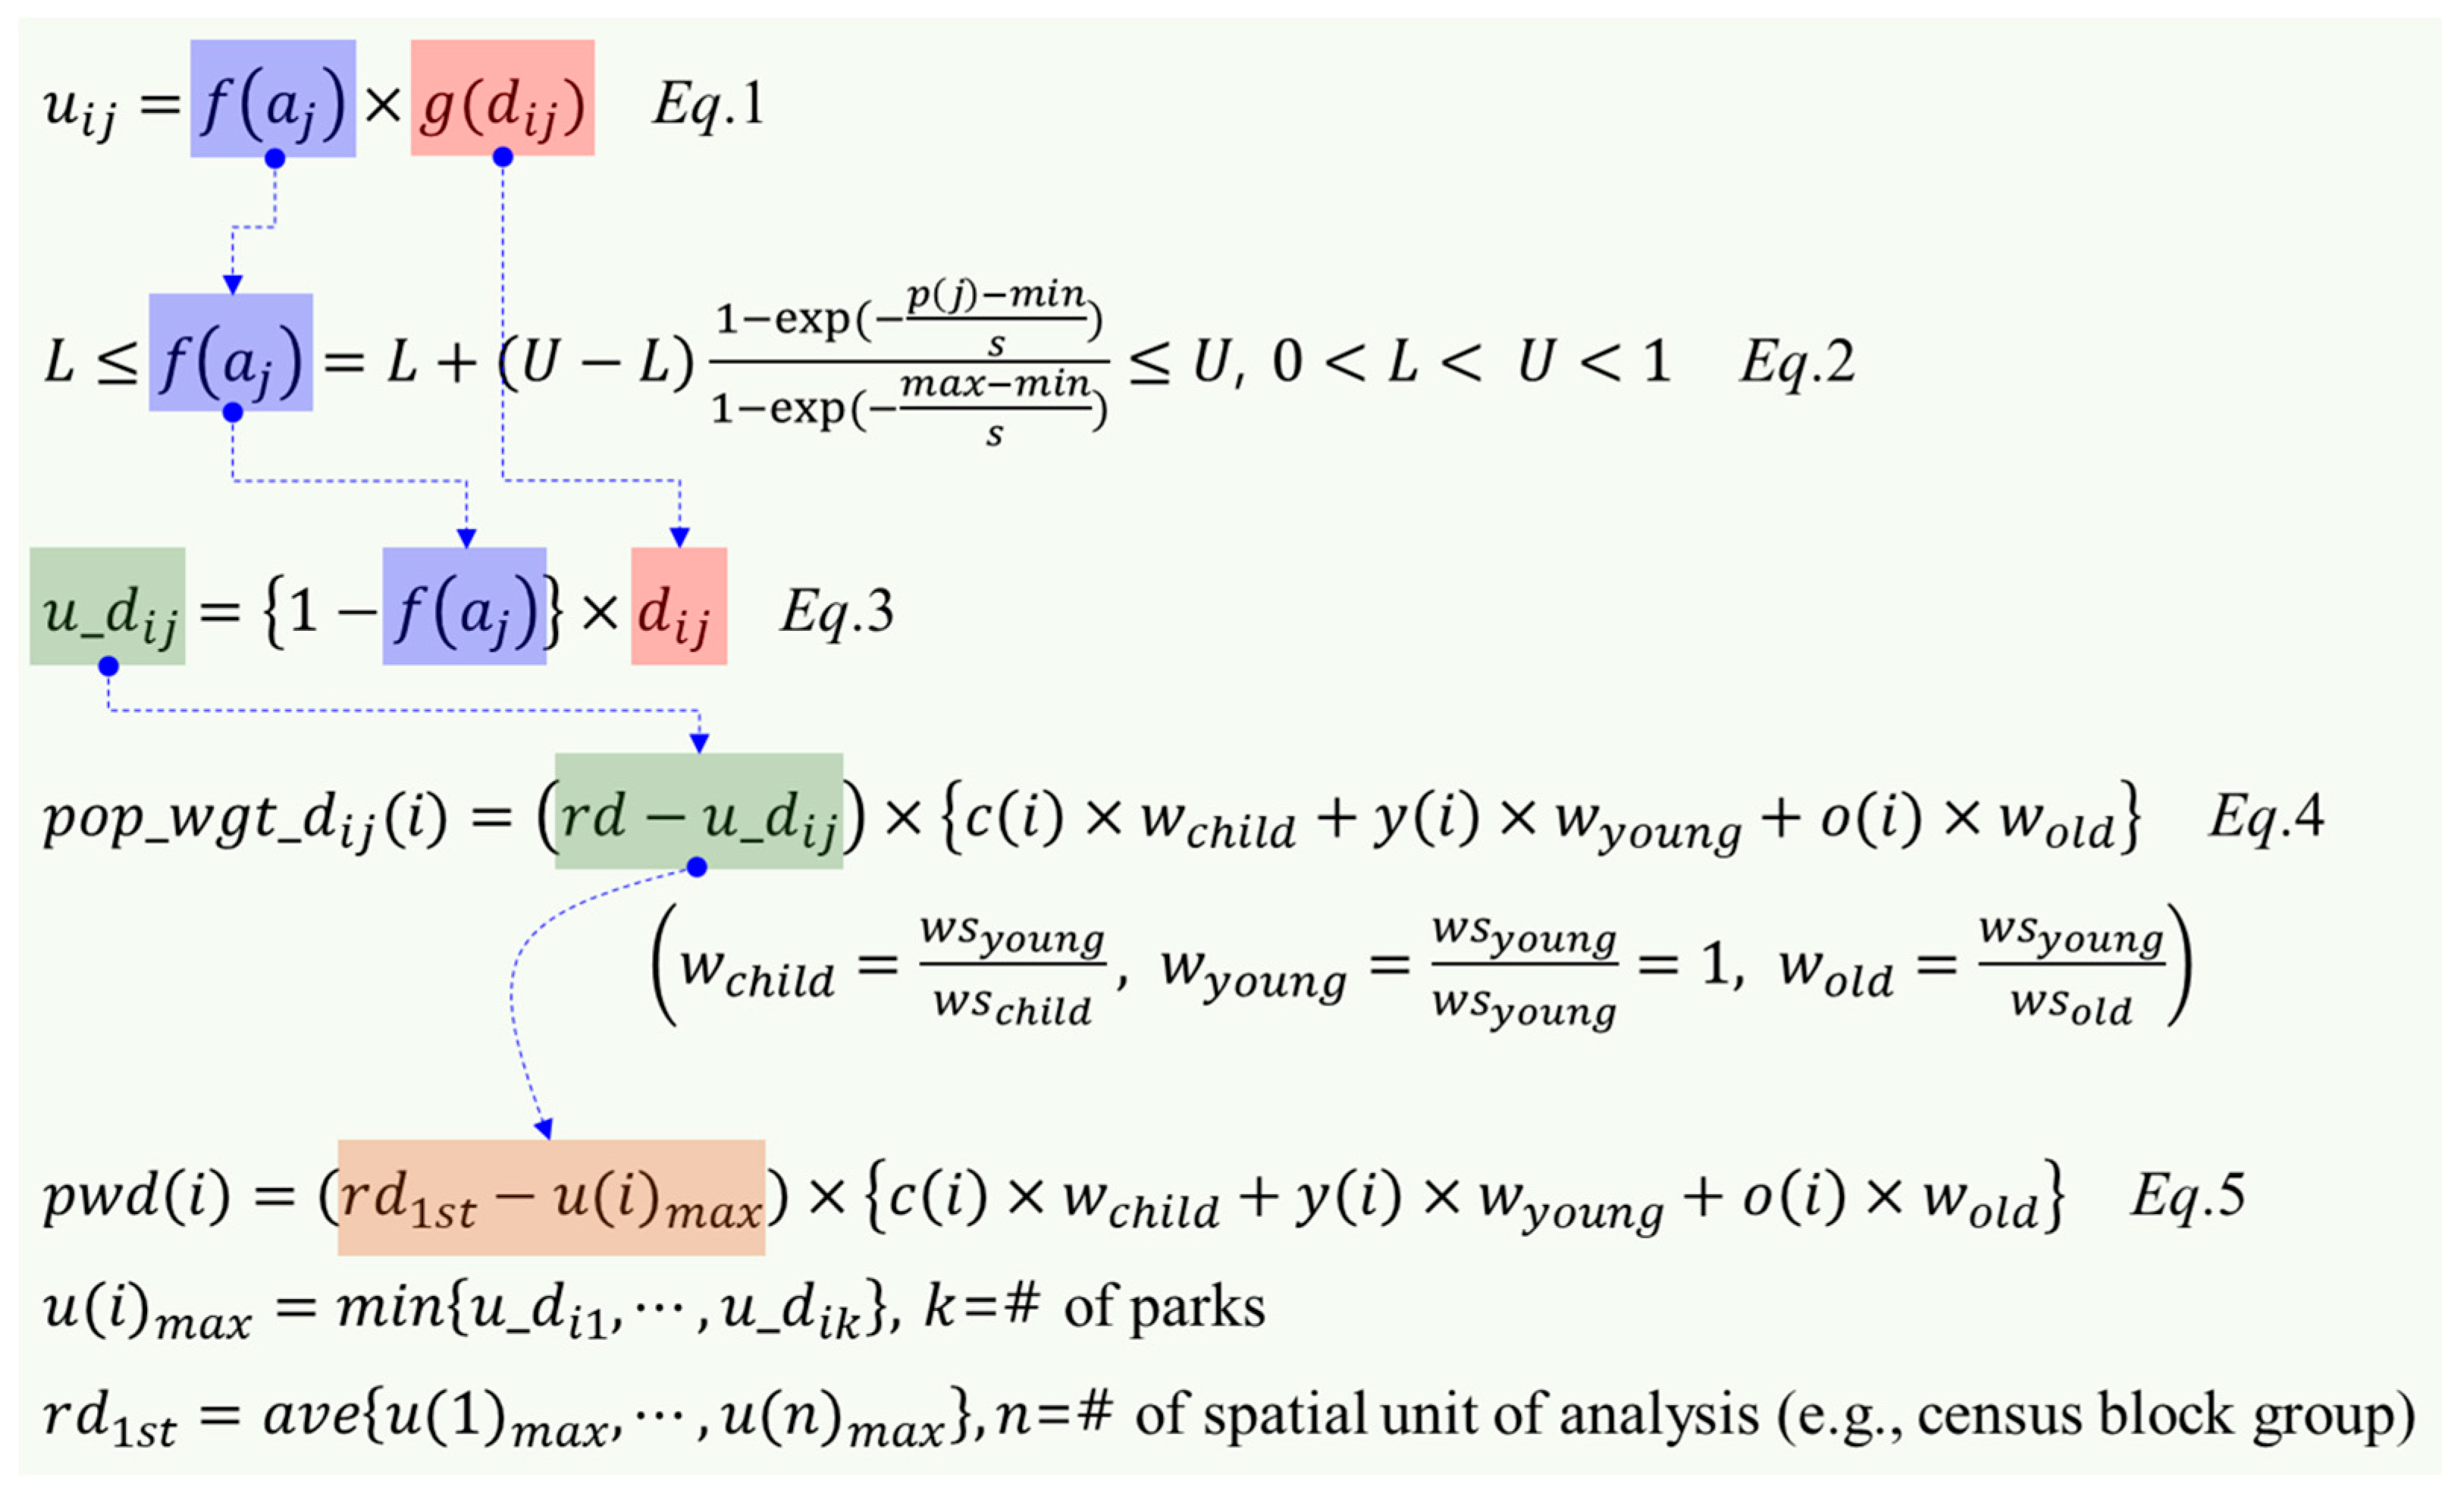
2.2. Definition of Park Utility

Citizens derive utility from visiting urban parks. In this context, park utility refers to the public service benefits that are realized on the premise of park visitation. Conceptually, park utility encompasses both the benefits provided by the park and the costs incurred in accessing it. Although park benefits can be multi-dimensional—encompassing aesthetic, ecological, social, and recreational values—they are often empirically approximated by park area due to data availability constraints. Brown et al. [26] empirically demonstrated a significant positive correlation between park size and the diversity of park-related activities and benefits, suggesting that park area is a useful proxy for quantifying park utility. On the cost side, it is generally assumed that the cost of park usage increases with geographic distance between the citizen’s residence and the park location. Accordingly, a citizen residing near a large park is expected to enjoy a higher level of utility than one living farther away from smaller parks. This cost–benefit formulation has been conceptually explored in studies of spatial equity and environmental justice, where accessibility is evaluated as a function of both opportunity and effort [27,28].
Building on this conceptual foundation, the analytical model in this study is developed in a stepwise manner. First, park utility is defined based on park size and physical distance (Equation (1)). This is then adjusted through a size-based discount function (Equation (2)), yielding a distance-equivalent utility measure (Equation (3)). Demographic walking profiles are incorporated to calculate population-weighted accessibility (Equation (4)), which is ultimately refined to derive a final spatial utility index (Equation (5)).
Park utility can be formally expressed as Equation (1), incorporating both the size of the park and the distance decay effect relative to the user’s location. While park attractiveness may include various qualitative aspects—such as amenities, safety, and maintenance—this study uses park area as a proxy to ensure empirical consistency and model simplicity. This approach aligns with previous studies demonstrating a strong correlation between park size and user activity patterns. Future research may refine this framework by incorporating additional qualitative variables when such data become available.
u i j = f ( a j ) × g ( d i j )
In Equation (1), u i j represents the utility that user i derives from visiting park j . The term f ( a j ) denotes the park attractiveness function, defined based on the area ( a j ) of park j . The variable g ( d i j ) indicates the distance that user i must travel to reach park j . Since greater distance generally implies higher travel cost, g ( d i j ) is modeled as an inverse function of distance. Accordingly, utility is defined as a function that simultaneously accounts for both the size of the park and the distance required to access it. A larger (more attractive) park located near user i is expected to yield greater service utility. Empirical evidence supports this formulation. Cohen et al. [29] found that the most significant predictors of park usage were park size and the number of organized activities. Similarly, Shu et al. [30] empirically demonstrated a generally negative correlation between park visitation frequency and distance to urban parks, suggesting that individuals living closer to parks are more likely to visit them frequently.
If the distances to multiple available parks are equal, the park with the larger area is expected to yield greater utility. Since utility is defined as a function of both benefit and cost, for a given level of utility, a higher benefit must correspond to a proportionally lower cost. This implies that a small park located nearby and a large park located farther away may provide the same level of utility. In other words, when utility is conceptualized as a function of both park benefits (e.g., size) and access costs (e.g., distance), a trade-off or compensatory relationship between the two emerges. Assuming that the cost of distance is relatively reduced when accessing a larger park, this can be interpreted as a size-based discount on distance. The notion of distance discounting has been employed in gravity-based models and spatial choice frameworks, where attractiveness reduces perceived travel impedance [31]. In this study, we propose a methodological framework for estimating park utility by discounting the cost of distance with the benefit of park size. This framework is then empirically validated through case analysis.
To capture this discounting effect, the attractiveness function f ( a j ) in Equation (1) is defined as a monotonically increasing function of park area a j . This allows us to estimate how the distance cost is reduced as park size increases. The function f ( a j ) is formally defined in Equation (2).
L f a j = L + U L 1 e x p ( p j m i n s ) 1 e x p ( m a x m i n s ) U ,   0 < L < U < 1
In Equation (2), p ( j ) denotes the area of park j . The terms m i n and m a x represent the minimum and maximum values of park area across all parks, respectively. The parameter s is a scaling factor that controls the rate of change in f a j as park area increases. Specifically, as p ( j ) increases from the minimum toward the maximum, f a j exhibits a steep rise up to approximately the s -th quantile, followed by a more gradual increase thereafter.
The parameters L and U indicate the magnitude of distance discounting at the minimum and maximum park areas, respectively. By setting the cost function in Equation (1) as g ( d i j ) =   d i j , and applying the size-based discount function f a j defined in Equation (2), we obtain the adjusted utility u _ d i j , which discounts distance by park area. This is formally expressed in Equation (3).
u _ d i j = 1 f a j × d i j
Caution is required when interpreting utility as defined in Equation (3), denoted u _ d i j . Since this expression represents utility in terms of the equivalent travel cost (i.e., distance), a lower value of u _ d i j implies higher utility. In other words, as the adjusted distance decreases, the implied utility increases.
In Equation (3), the term f a j , which reflects park attractiveness based on area, increases with larger park size. Consequently, the discount factor 1 f a j decreases. Given that 1 f a j is always less than 1, a larger park (with higher f a j ) leads to a smaller adjusted distance u _ d i j , since it scales down the original distance d i j more significantly.
For example, if d i j = 500 m meters and f a j = 0.1 , then u _ d i j = 1 f a j × d i j = 1 0.1 × 500 = 450 m. This means that the original travel cost of 500 m is effectively reduced by 50 m due to the utility associated with park size. From the perspective of user i , this reflects a perceived saving in travel effort, proportional to the benefit of the park’s area. Thus, in this framework, park utility is translated into distance-equivalent units, where a reduction in adjusted distance reflects an increase in perceived utility.
Utility expressed in terms of travel distance may vary depending on user characteristics. For example, older adults with slower walking speeds may perceive a higher travel cost than younger adults when covering the same distance. If the walking speed of an elderly individual is approximately 50% that of a younger adult, a 50 m trip would require twice the travel time. This implies that, from the perspective of time and physical exertion, the travel cost for older adults may effectively be double that of younger users. Accordingly, user-specific walking behavior—shaped by age, gender, family structure, and other demographic factors—should be incorporated into the utility estimation framework. Recognizing these behavioral differences allows for a more equitable and realistic assessment of accessibility and utility across diverse user groups. In this study, we assume that most park access occurs by foot and thus focus on walking-based accessibility. While different populations may exhibit varying walking speeds and tolerances, a 10 min walking distance—typically equivalent to 500–700 m—is implicitly used as a behavioral reference point in both distance calculation and park utility estimation. These assumptions align with common practice in the walkability and park access literature and reflect the empirical context of Seoul, where walking is the predominant mode of short-distance travel.
All related distance metrics were preprocessed using the pedestrian street network to ensure realistic estimation of travel paths. Specifically, to calculate the network-based distance between spatial units and parks, it is important to note that both census block groups ( i ) and parks ( j ) are originally represented as polygon vector data. While various methods exist for computing distances between polygons, this study defines d i j as the shortest network distance from the geometric centroid of spatial unit i to the nearest edge of park j . Based on this approach, a full origin–destination (OD) distance matrix was constructed, encompassing all combinations of spatial units and parks across the study area. These calculations were performed using a Python-based geospatial workflow incorporating open-source libraries such as OpenStreetMap (OSM), GeoPandas, and other routing tools capable of estimating network-based pedestrian distances.
Building on this foundation, the study hypothesizes that perceived utility systematically varies across demographic groups due to differences in walking speed. Accordingly, we explicitly incorporate age-specific mobility profiles into the model structure to reflect heterogeneous travel burdens among user types.
When users are aggregated at a spatial unit level, both the population size and the geometric centroid of each unit can be derived. These metrics allow for estimating population-weighted distances to the nearest park. Equation (4) defines the population-weighted distance, p o p _ w g t _ d i j ( i ) , by incorporating walking speed adjustments for different user types.
p o p _ w g t _ d i j ( i ) = r d u _ d i j × c i × w c h i l d + y i × w y o u n g + o ( i ) × w o l d
w c h i l d = w s y o u n g w s c h i l d ,   w y o u n g = w s y o u n g w s y o u n g = 1 ,   w o l d = w s y o u n g w s o l d
In Equation (4), r d denotes the reference distance, representing a benchmark value of u _ d i j that is considered typical within the study area. This reference value is often operationalized as the average of all u _ d i j values. When r d u _ d i j < 0 , it implies that user i must travel a greater distance than the average user in the study area, and thus experiences relatively lower utility. This reflects a utility reduction due to increased travel costs. Conversely, when r d u _ d i j > 0 , user i is required to travel a shorter distance than the average and therefore enjoys relatively higher utility.
Let c i , y i , and o i denote the number of children, young adults, and older adults, respectively, residing in spatial unit i . Correspondingly, let w s c h i l d , w s y o u n g , w s o l d represent the walking speeds of each demographic group. Given that the walking speed of young adults serves as the reference group, both children and older adults are assigned slower walking speeds. As a result, their relative walking speed weights, w c h i l d and w o l d , are greater than 1. This adjustment reflects the assumption that slower walkers effectively incur greater travel costs, even when the distance remains constant. In other words, for children and older adults, the same physical distance represents a higher perceived burden and thus a lower utility.
To facilitate understanding of Equation (4), consider a hypothetical scenario in which spatial unit i has a reference distance difference r d u _ d i j = 100 m and a total population of 60 individuals—comprising 10 children, 40 young adults, and 10 older adults. The discount function f a j is designed to flexibly reflect the non-linear effect of park size on perceived effort. The walking speed weights ( w s c h i l d , w s o l d ) are set based on empirical averages reported in the mobility and urban health literature [25,26]. While these parameter values are simplified in the current study, they can be calibrated in future applications to reflect more granular behavioral differences. In this example, we assume that both children and older adults walk at half the speed of young adults, implying that the walking speed weights w c h i l d and w o l d are both equal to 2. This assumption is grounded in empirical findings from urban mobility and health research, which report that the average walking speed of older adults and children is approximately half that of healthy young adults. For instance, some studies document age-related differences in walking pace, which justify assigning a relative weight of 2 for slower groups [32,33]. While simplified in this study for interpretive clarity, these values can be calibrated in future applications using finer-grained behavioral data. Using these assumptions, the population-weighted distance for unit i , p o p _ w g t _ d i j ( i ) , can be calculated as follows:
p o p w g t d i j i = 100 × 10 × 2 + 40 × 1 + 10 × 2 = 8000   m
In this case, the 60 residents of unit i collectively enjoy a utility gain equivalent to a reduction of 8000 m in travel burden relative to the average distance. This reflects the influence of both demographic structure and walking behavior on perceived accessibility. Conversely, if r d u _ d i j = 100 , it implies that residents would need to travel an additional 8000 m, corresponding to a reduction in utility of the same magnitude.
Now consider a second scenario where the population distribution in unit i remains at 60 but consists of 5 children, 50 young adults, and 5 older adults. Applying the same walking speed weights (2 for children and older adults and 1 for young adults), the population-weighted distance becomes the following:
p o p w g t d i j i = 100 × 5 × 2 + 50 × 1 + 5 × 2 = 7000   m
Although the total population remains constant, the smaller proportion of children and older adults results in a lower population-weighted distance. This illustrates how demographic composition affects the perceived utility of park access, even when aggregate population size is identical.
The study area contains multiple parks distributed across space. In this study, Equation (4) is applied to the park that offers the highest utility to each spatial unit. While the same analytical framework can be extended to the second- and third-ranked parks in terms of utility, the analysis focuses on the park with maximum utility in order to clarify the conceptual framework and practical implications of the proposed methodology.
Because the population distribution (i.e., demand side) is fixed, the maximum utility occurs at the park where u _ d i j —the adjusted travel distance—is minimized. Reflecting this, Equation (4) can be reformulated into Equation (5), which defines p w d i , or the population-weighted distance for unit i , based on the park providing the minimum adjusted distance.
p w d i = r d 1 s t u ( i ) m a x × c i × w c h i l d + y i × w y o u n g + o i × w o l d
u ( i ) m a x = m i n u _ d i 1 , , u _ d i k ,   k = #   of   parks
r d 1 s t = a v e u ( 1 ) m a x , , u ( n ) m a x ,   n = #   of   spatial   unit   of   analysis
In Equation (5), u ( i ) m a x refers to the maximum utility available to spatial unit i , which occurs at the park where u _ d i j is minimized. The term r d 1 s t denotes the average value of u ( i ) m a x across all spatial units in the study area. Using the above parameter values, p w d i was computed for all 18,614 census block groups in Seoul.
The value of p w d i , calculated using Equation (5), represents the deviation of a given spatial unit from this average. A larger value of p w d i in the negative direction indicates that residents must travel a longer distance than the average user to access the most beneficial park. Such areas may therefore be interpreted as having relatively lower utility and can be prioritized in future planning for new park developments. Conversely, a larger value of p w d i in the positive direction implies that the travel distance to the park providing maximum utility is shorter than the average. These areas are thus considered to enjoy relatively higher levels of park utility.
Figure 1 summarizes the conceptual framework for defining park utility by applying a distance discount proportional to park area. As shown in Equation (1), utility is formulated as the product of a benefit component, f a j , and a cost component, g d i j . Equation (2) specifies the distance discount rate as a function of park area, representing the extent to which benefits reduce the perceived travel cost. Equation (3) shows that as the discount increases with park size, the term 1 f a j decreases, thereby reducing the adjusted distance u _ d i j = d i j × 1 f ( a j ) and leading to higher utility. Equation (4) computes the population-weighted distance for spatial unit i by multiplying the difference between the reference distance r d and the adjusted utility u _ d i j by the sum of the population in unit i , weighted by their walking behavior across demographic groups. Equation (5) refines this measure by applying only the minimum u _ d i j —that is, the park providing maximum utility—for each spatial unit, defining p w d i as the final utility index derived through this analytical process. A larger value of p w d i indicates higher relative utility for that spatial unit within the study area. The index p w d i serves as the final spatial utility indicator and can be visualized as a choropleth map to support exploratory identification of areas with below-average utility, thus informing spatial equity assessments and priority setting for future park development.
While this framework focuses on park area as a key determinant of utility, it is important to recognize that park size often acts as a proxy for broader experiential qualities, including recreational offerings and aesthetic appeal. This approach aligns with prior studies that link larger parks to higher perceived accessibility due to their multifunctionality. By operationalizing this relationship in a distance-discounting utility model, the framework offers a practical tool for informing park planning decisions. Specifically, it enables planners to evaluate whether increasing park size or reducing walking distance would be more effective in enhancing accessibility in different urban contexts.
In summary, Figure 1 illustrates the sequential framework for estimating utility for each spatial unit, incorporating park size-based distance discounting, user-specific walking behavior, and the calculation of population-weighted utility indices, p w d i .
Some of the functions that comprise p w d i involve parameters that must be specified to derive the final results. For example, the function f a j , which reflects park attractiveness, includes the parameters L , U , and s . Likewise, the values of w s c h i l d , w s y o u n g , and w s o l d required for calculating Equation (4) should be grounded in findings from prior empirical studies. The specific values assigned to these parameters, along with the rationale for their selection, are detailed in the empirical analysis section.

2.3. Simulating Utility Changes from New Park Locations

The spatial distribution of utility changes when a new park is introduced, depending on the park’s size and location. For each candidate site within the study area where a new park could potentially be located, the change in utility can be estimated by calculating the increase in p w d i as defined in Equation (5). The magnitude of this increase reflects the degree to which the new park contributes to improved utility across space. A larger increase in p w d i suggests a higher gain in utility resulting from the park’s placement and, by extension, indicates greater effectiveness in the allocation of limited public resources. If a candidate site for a new park is located near an area currently exhibiting low p w d i values—i.e., an area of low existing utility—then the addition of a park is likely to yield a substantial increase in utility. However, candidate sites are not always situated near low-utility areas. Therefore, it is important to evaluate all potentially developable sites based on the projected increase in p w d i and prioritize those that yield the greatest gains. Equation (6) defines P W D , representing the aggregate increase in utility due to the addition of a new park. This is calculated as the sum of increases in p w d i across all spatial units in the study area, capturing the overall spatial impact of a new park location on utility.
P W D = i = 1 n p w d i s i m p w d i
In Equation (6), p w d i s i m denotes the recalculated utility value for spatial unit i under a simulated scenario in which a single new park is introduced. If there are m candidate sites for new park development within the study area, a total of m distinct p w d i s i m values can be generated. It is important to note that the reference distance r d may change depending on the location and size of the newly added park, which can affect the calculation of p w d i s i m . For instance, even if the maximum utility value u m a x for a particular spatial unit i remains unchanged, the overall reduction in r d due to a new park may result in r d u m a x < 0 . As shown in Equation (5), even a small negative value of r d u m a x can result in a substantial change in p w d i when multiplied by the population, especially when weighted by age-specific walking speed adjustments. Since the final value is expressed in meters, the magnitude of change in p w d i can be large despite seemingly minor differences in utility. This is an important consideration when interpreting the results, as it highlights the sensitivity of the metric to both demographic structure and spatial accessibility. This outcome should not be interpreted as a decline in utility but rather as a byproduct of a lowered reference distance—an artifact of the system-wide adjustment. Nevertheless, the simulation remains highly valuable as a strategic planning tool. Despite the system-wide adjustment of the reference distance, the results provide critical insights into the spatial redistribution of utility gains. The apparent reduction in aggregate utility should not be interpreted as a methodological flaw but rather as evidence of the model’s sensitivity to systemic shifts, highlighting the importance of precision in measuring perceived accessibility. More importantly, the simulation effectively identifies underserved areas where a new park would yield significant localized utility improvements. Even when citywide utility changes appear minimal or negative, these results offer a rigorous evidence base for prioritizing park placement in a manner that supports equitable and efficient allocation of limited public resources.
When multiple parks are introduced simultaneously, the number of possible combinations for calculating P W D increases combinatorially. Specifically, if n candidate sites exist and k new parks are to be selected, the number of possible configurations is given by the binomial coefficient n k = n ! k ! ( n k ) ! . For example, if n = 10 and k = 3 , then 120 different combinations are possible. As the number of candidate sites and selected parks increases, the total number of combinations expands exponentially. This combinatorial explosion makes exhaustive enumeration computationally infeasible, indicating that the problem may fall into the class of NP-hard problems. In such cases, heuristic or approximation algorithms may be necessary to reduce the solution space and enable tractable analysis. However, the development and application of such optimization methods are beyond the scope of this study and remain an important area for future research.
A larger value of P W D indicates a greater reduction in distance—discounted by park area—across the study area resulting from the introduction of a new park. The larger this reduction, the more significant the utility gain, implying that the newly added park contributes substantially to improving spatial accessibility and service equity. By calculating Equation (6) for each potential site for new park development and mapping the results, the spatial distribution of sites with high utility-enhancement potential can be visualized. This enables planners to identify areas where the introduction of a park would yield the greatest improvement in utility. Accordingly, prioritizing candidate sites based on the magnitude of P W D allows for a more efficient allocation of limited public resources. Such an approach provides a valuable form of spatial decision support for urban planning, particularly in the context of green space and park system development. While this study focuses on evaluating ∆PWD for each candidate site individually—effectively assuming the addition of one new park at a time—this simplification enables direct comparison of spatial utility gain across potential locations. However, it also presents a limitation in that it does not account for possible interaction effects between multiple parks. Future research should explore optimization strategies for selecting multiple park locations simultaneously, using heuristics or spatial multi-criteria decision analysis to overcome combinatorial constraints.

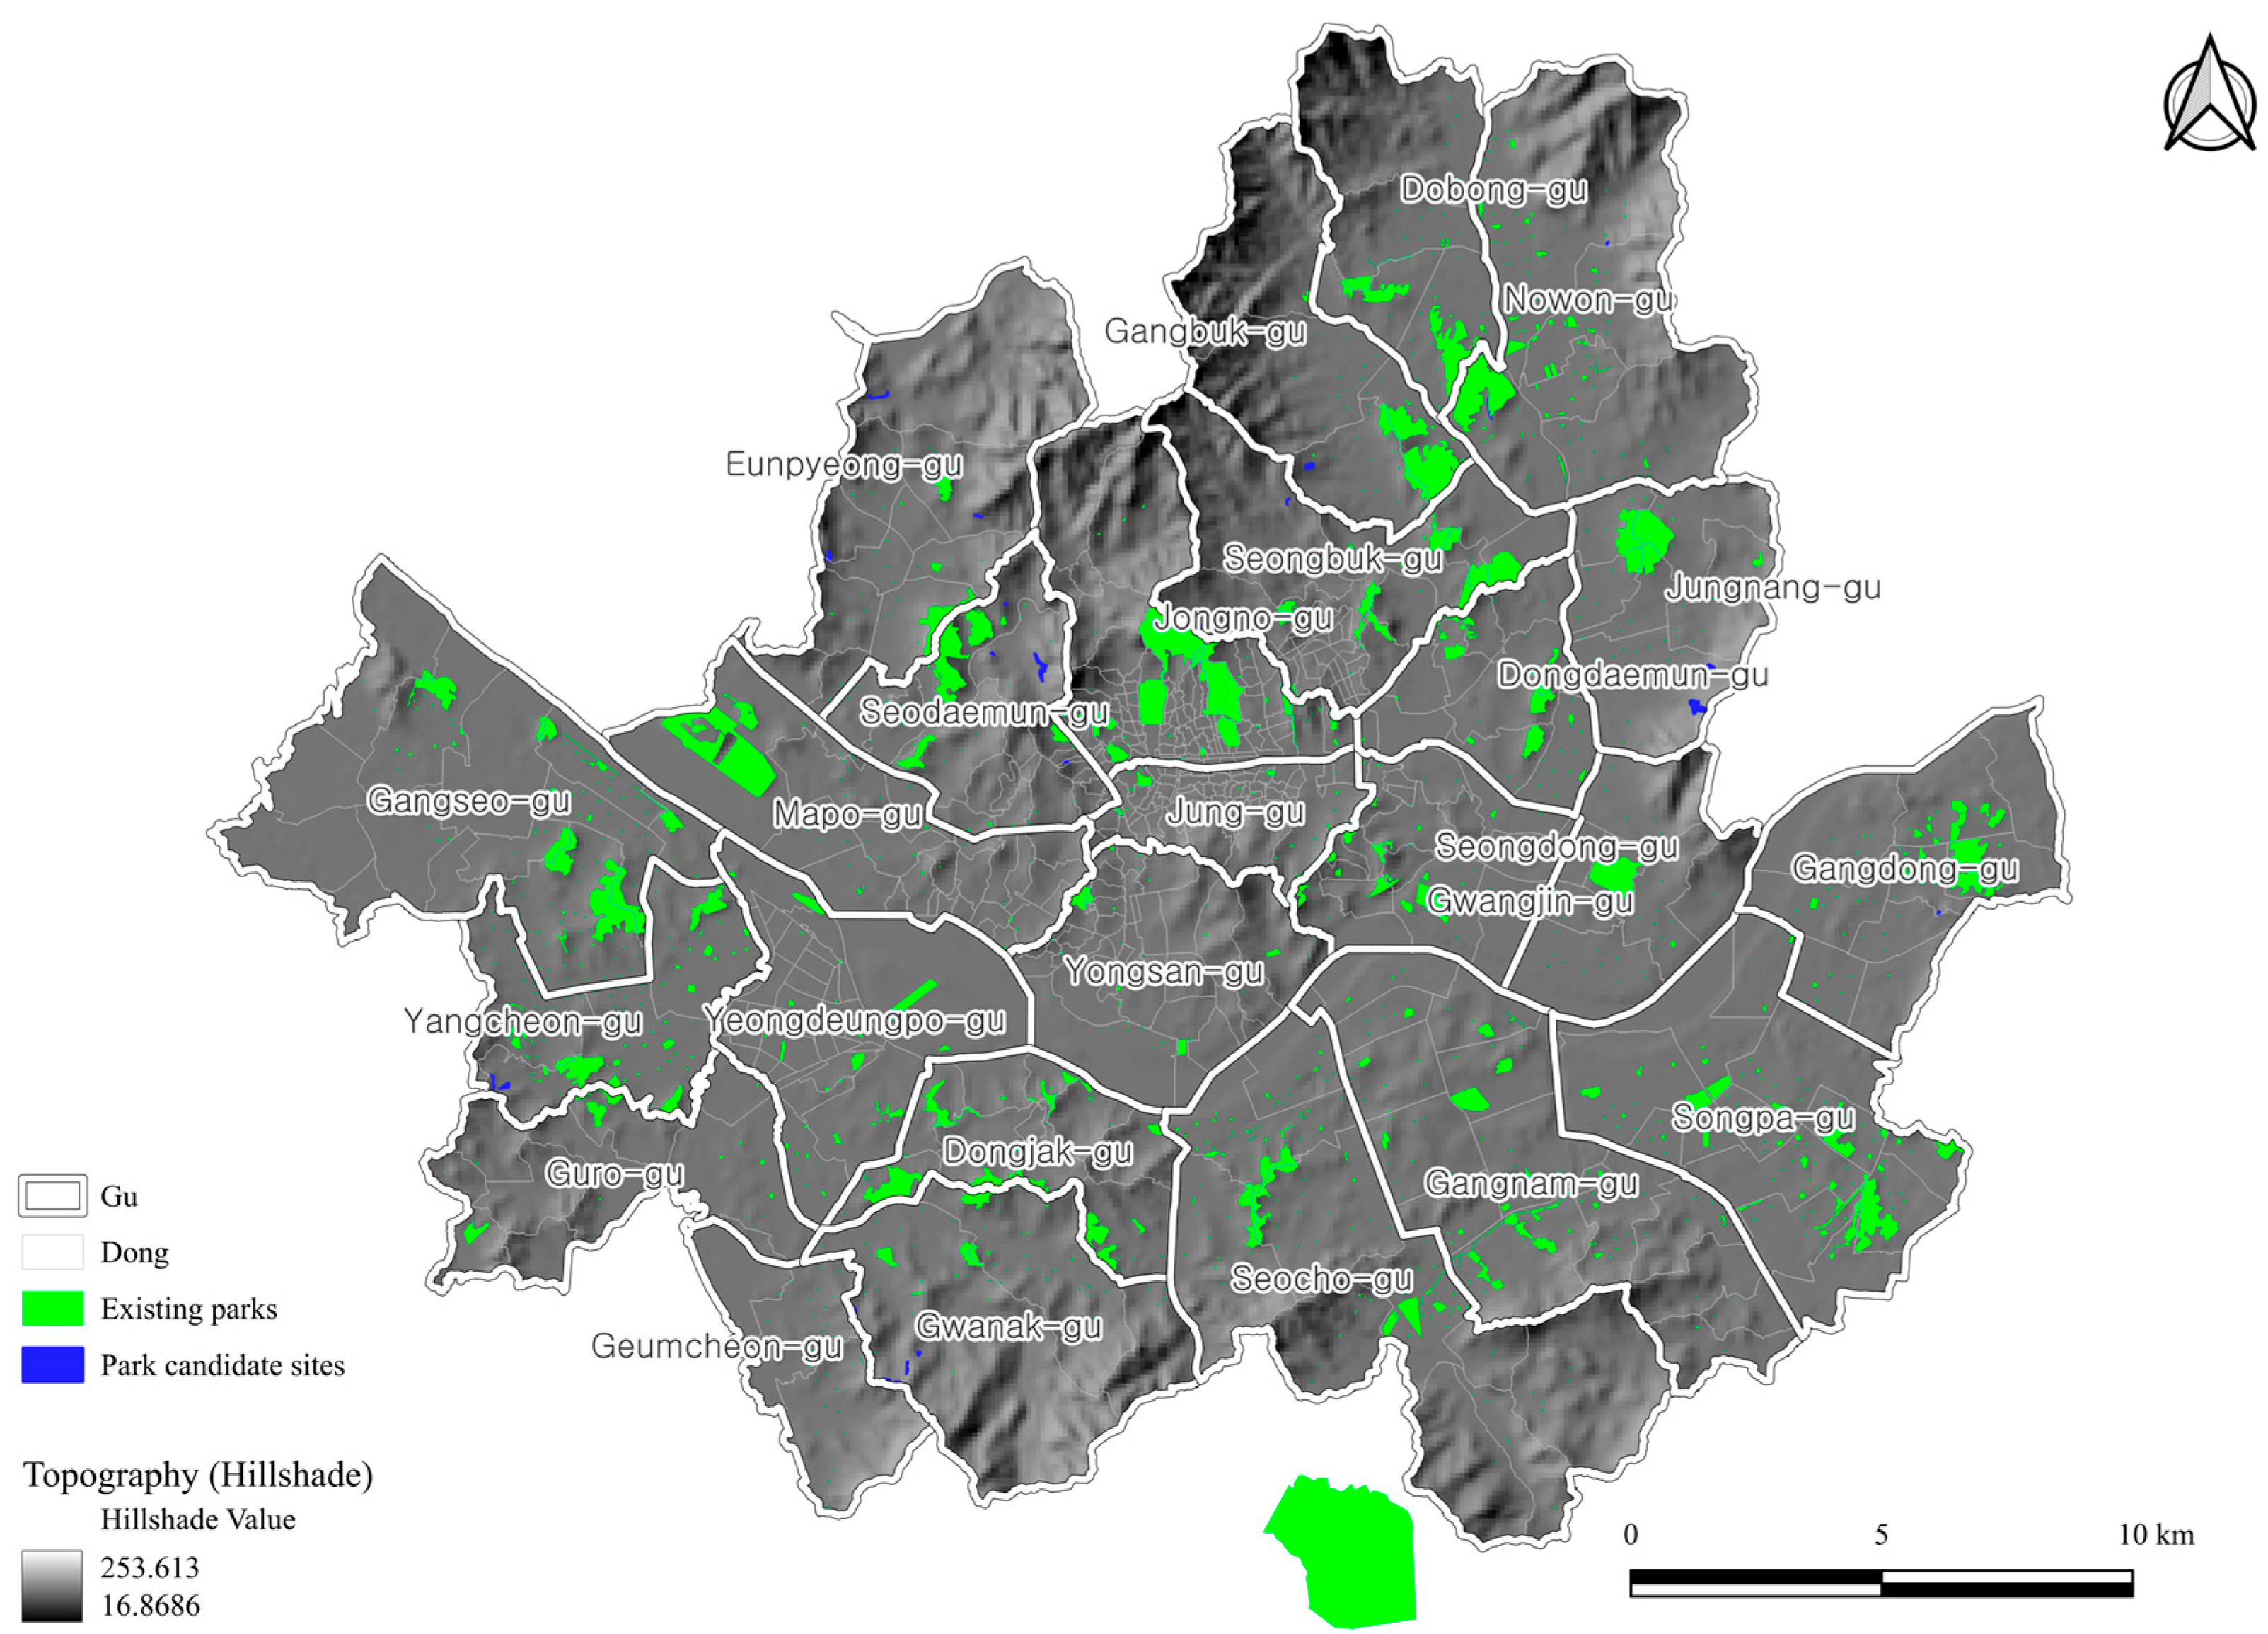
3. Study Area and Data

This study selects Seoul, the capital city of South Korea, as the empirical case study area. Seoul comprises 25 autonomous districts (gu) and 426 administrative neighborhoods (dong), and the spatial unit of analysis employed in this study is the census block group. The census block group is an intermediate spatial unit formed by aggregating several statistical small-area units, which represent the smallest spatial divisions designated by Statistics Korea for the Population and Housing Census conducted every five years. In total, 18,614 census block groups within Seoul are used for analysis.
Figure 2 visualizes the administrative boundaries in Seoul, along with the spatial distribution of urban parks. Census block groups are statistical spatial units that include demographic information such as age and gender composition. Notably, Seoul Grand Park is shown outside the administrative boundary of Seoul in the southwestern part of the map. Although it is geographically located in Gwacheon, Gyeonggi Province, the park is operated by the Seoul Metropolitan Government and is thus functionally regarded as part of Seoul’s park system. Its inclusion in the dataset reflects its practical relevance to Seoul residents in terms of access and public service provision. The dataset comprises 1372 existing urban parks and 30 proposed candidate sites for new parks. Existing parks vary widely in size, ranging from just 12 m2 to over 6.4 million m2, with an average area of approximately 37,277.9 m2 and a median of 1495.7 m2. This large discrepancy is largely due to a few extremely large parks—such as Seoul Grand Park—that significantly skew the distribution. In contrast, the candidate sites for new parks are more uniform in scale, ranging from 1597.4 m2 to 53,811.9 m2, with an average of 10,302.8 m2 and a median of 3221.2 m2. These figures suggest that although fewer in number, the new sites may be strategically impactful in enhancing spatial equity in park accessibility due to their relatively larger and more consistent size.
As seen on the map, these units tend to have relatively uniform size and shape, which makes them advantageous for minimizing geometric distortion when calculating network distances from centroid locations.
In summary, Seoul was selected as the study area primarily for the following reasons, all of which align with the analytical aims of this research. First, as a high-density metropolis with over nine million residents, Seoul presents complex spatial challenges related to equitable park accessibility. The city exhibits diverse urban morphology—including dense residential clusters, mountainous terrain, and a heterogeneous distribution of park sizes—making it an ideal setting to examine how perceived park utility varies across socio-spatial contexts. Second, Seoul has adopted a “10 min living zone” policy that emphasizes the provision of essential public services, including parks, within walkable distances. This policy orientation is well-aligned with the study’s focus on distance-discounted, user-centered measures of accessibility. Third, the city offers high-resolution spatial and demographic data at the census block group level, enabling detailed quantitative estimation of park utility that incorporates both physical and behavioral variables. Although urban parks in Seoul vary considerably in size, they are relatively evenly distributed across the city, providing an empirically robust setting to test the model of distance-discounted utility. Taken together, these characteristics enhance the validity, generalizability, and policy relevance of Seoul as a case study area for evaluating urban park accessibility through a utility-based lens.

4. Results

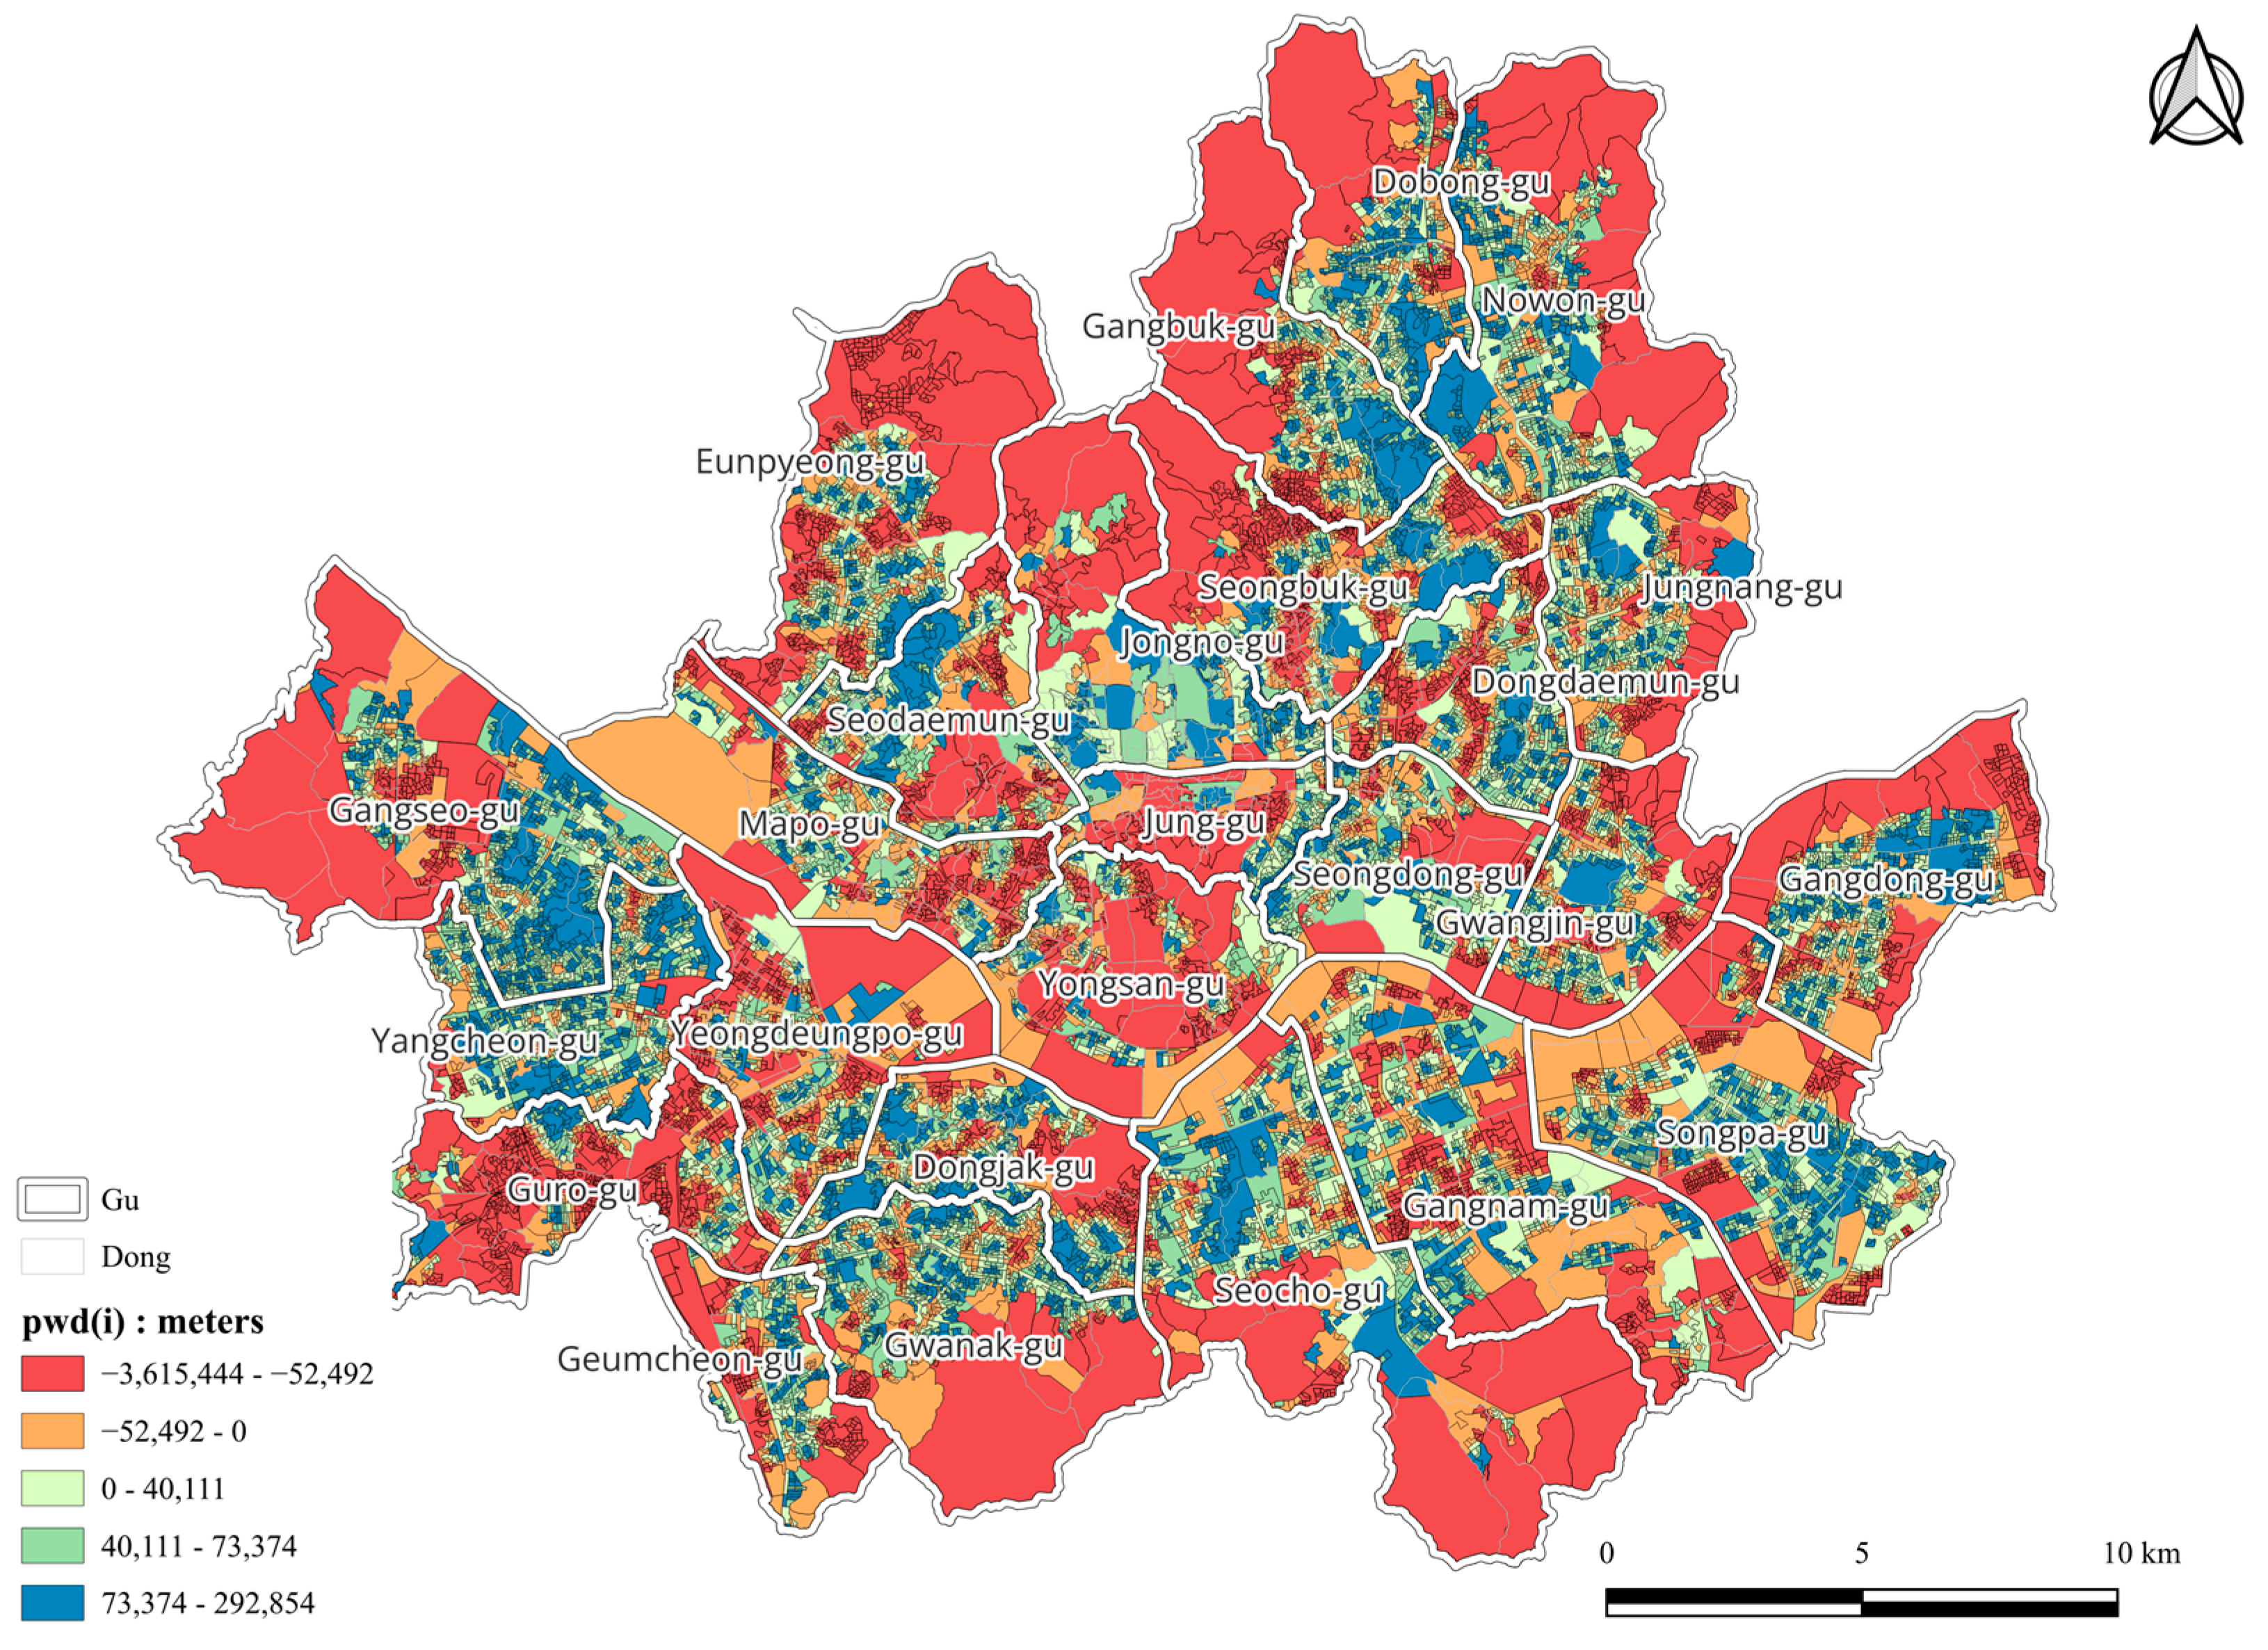
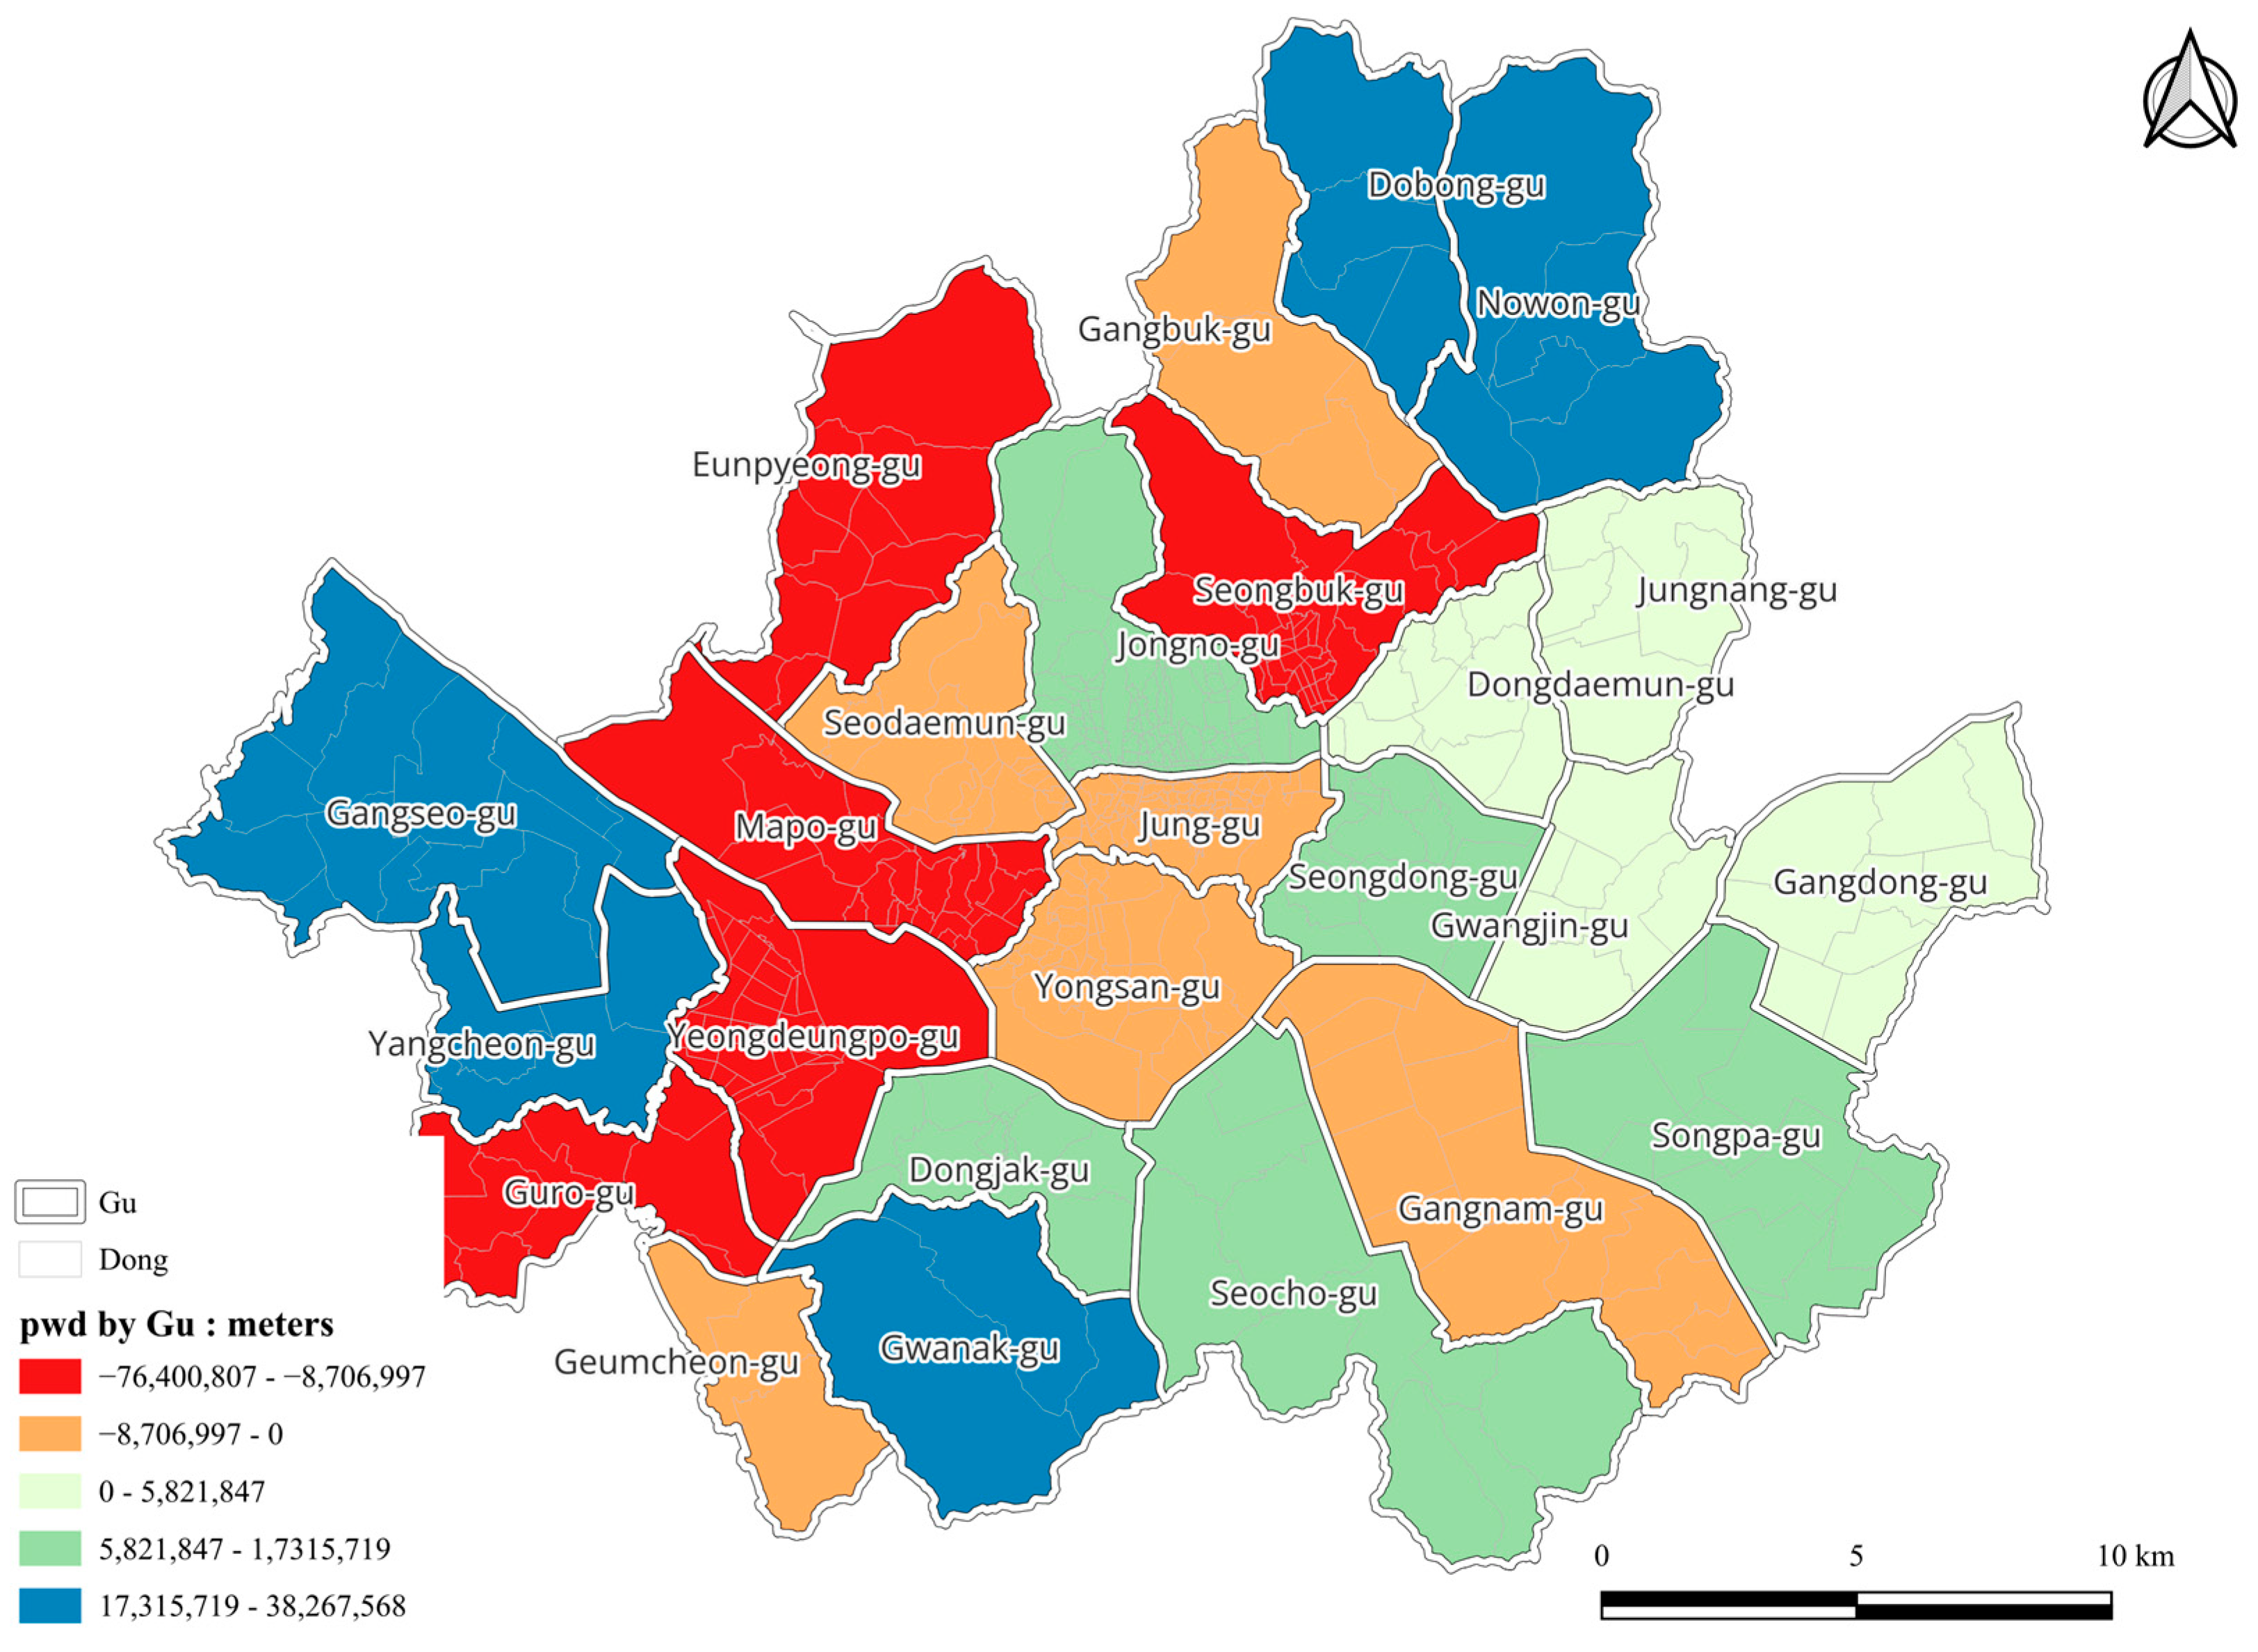
4.1. Park Accessibility

Through the analytical procedure illustrated in Figure 1, the empirical values of the utility index p w d i , as defined in Equation (5), were derived for each spatial unit i . As previously mentioned, generating these results requires the specification of several parameters embedded in the equations defined at each step of the framework.
For Equation (2), which computes f a j , the parameters L and U were set to 0.01 and 0.5, respectively, while the scale parameter s was set to 2. The lower bound L = 0.01 was chosen because discount values smaller than this threshold would offer minimal practical effect, thereby limiting the interpretability of utility estimation based on park area. Conversely, the upper bound U = 0.5 was adopted under the assumption that even very large parks should not be assumed to reduce travel distance by more than 50%, which would be an overly optimistic assumption.
For Equations (4) and (5), the walking speeds for each demographic group—children, young adults, and older adults—were set to 684 m, 762 m, and 618 m, respectively. These values correspond to a 10 min walking distance and were adopted based on prior empirical research [34]. Using the walking speed for young adults as the reference group, relative walking speed ratios w s c h i l d , w s y o u n g , and w s o l d were calculated and applied in the analysis accordingly.
Figure 3 presents the spatial distribution of p w d i values visualized as a choropleth map, classified using a quantile-based interval scheme. In Figure 3, darker red tones indicate census block groups where p w d i values increase in the negative direction. A negative value of p w d i occurs when r d 1 s t u ( i ) m a x is negative. When this difference is multiplied by the population—adjusted by age-specific walking speed weights—the resulting p w d i value becomes larger in the negative direction. This implies that residents in those areas must travel farther than the citywide average to access the park that provides the highest utility. Moreover, if the weighted population is large, it means a greater number of people must travel relatively longer distances, which corresponds to lower overall utility in those areas. Conversely, darker blue tones indicate areas where the highest-utility park is located closer than the average reference distance. In such areas, the greater the population, the more substantial the resulting utility. Thus, regions shaded in red in Figure 3 indicate areas where targeted policy interventions may be needed to enhance park accessibility and utility. The results in Figure 3 reveal that such low-utility areas are widely distributed throughout the city but are particularly concentrated in the outer districts of Seoul. These peripheral regions are largely mountainous, which may constrain the development of formal neighborhood parks within a 10 min walking distance. While these areas may contain natural green spaces such as forests or trails, such spaces may not provide the same level of accessibility or functionality—particularly for older adults or families with children—as designated neighborhood parks. However, some red-shaded areas also appear in the urban core, indicating that efforts to improve park utility are needed even within central districts of the city.
Figure 4 aggregates the p w d i values from Figure 3 at the gu (district) level, visualizing the total population-weighted distance across administrative units. A quantile-based interval scheme was applied to classify the values, allowing for clearer comparisons across districts. Figure 4 provides a clearer picture of utility disparities at the district (gu) level, enabling the identification of administrative areas with relatively low park utility. Districts such as Guro-gu, Yeongdeungpo-gu, Mapo-gu, Eunpyeong-gu, and Seongbuk-gu exhibit notably lower levels of utility when aggregated at the district scale. In contrast, several outer districts—such as Gangseo-gu, Yangcheon-gu, Gwanak-gu, Dobong-gu, and Nowon-gu—are characterized by relatively high levels of utility. This pattern diverges from the visual impression in Figure 3, where red tones appeared more prevalent in peripheral areas. For instance, while Dobong-gu and Nowon-gu are located in the mountainous northeastern outskirts of Seoul, Figure 4 reveals that utility levels in their densely populated urban zones are relatively high. This suggests that the red shading in Figure 3—which highlights outer areas with lower utility—may not fully reflect the concentrated population and localized accessibility conditions. Therefore, the blue-shaded districts in Figure 4 can be interpreted as areas where high park utility in populated zones offsets the lower utility in surrounding mountainous areas. The district-level aggregation thus captures a more nuanced representation of park accessibility and utility by incorporating both geographic and demographic characteristics. In summary, Figure 4 is valuable for identifying the overall spatial pattern of utility across Seoul, offering a macroscopic perspective rather than detailing local complexity. In contrast, Figure 3 complements this by providing micro-scale information on how utility varies within each district, capturing intra-district heterogeneity that may be masked at the aggregated level.
As a supplement to Figure 4, Table 1 presents a tabular summary of the district-level statistics visualized in the map. Notably, the bottom row of the table shows a total value of −4,066,046 m. This figure represents the cumulative population-weighted excess distance that residents must walk, on average, beyond the 10 min threshold, when compared to the citywide reference standard. This highlights a critical spatial gap in achieving Seoul’s strategic urban planning objective of a “10 min living zone”, and underscores the need for targeted policy interventions to improve park utility and accessibility. The aggregated statistics in Table 1 are particularly useful for identifying where utility shortfalls are most pronounced, at a district level, in a quantitatively rigorous manner. Furthermore, within the districts identified as red in Figure 4, the block-level analysis in Figure 3 can help pinpoint specific subareas where utility deficits are most severe.

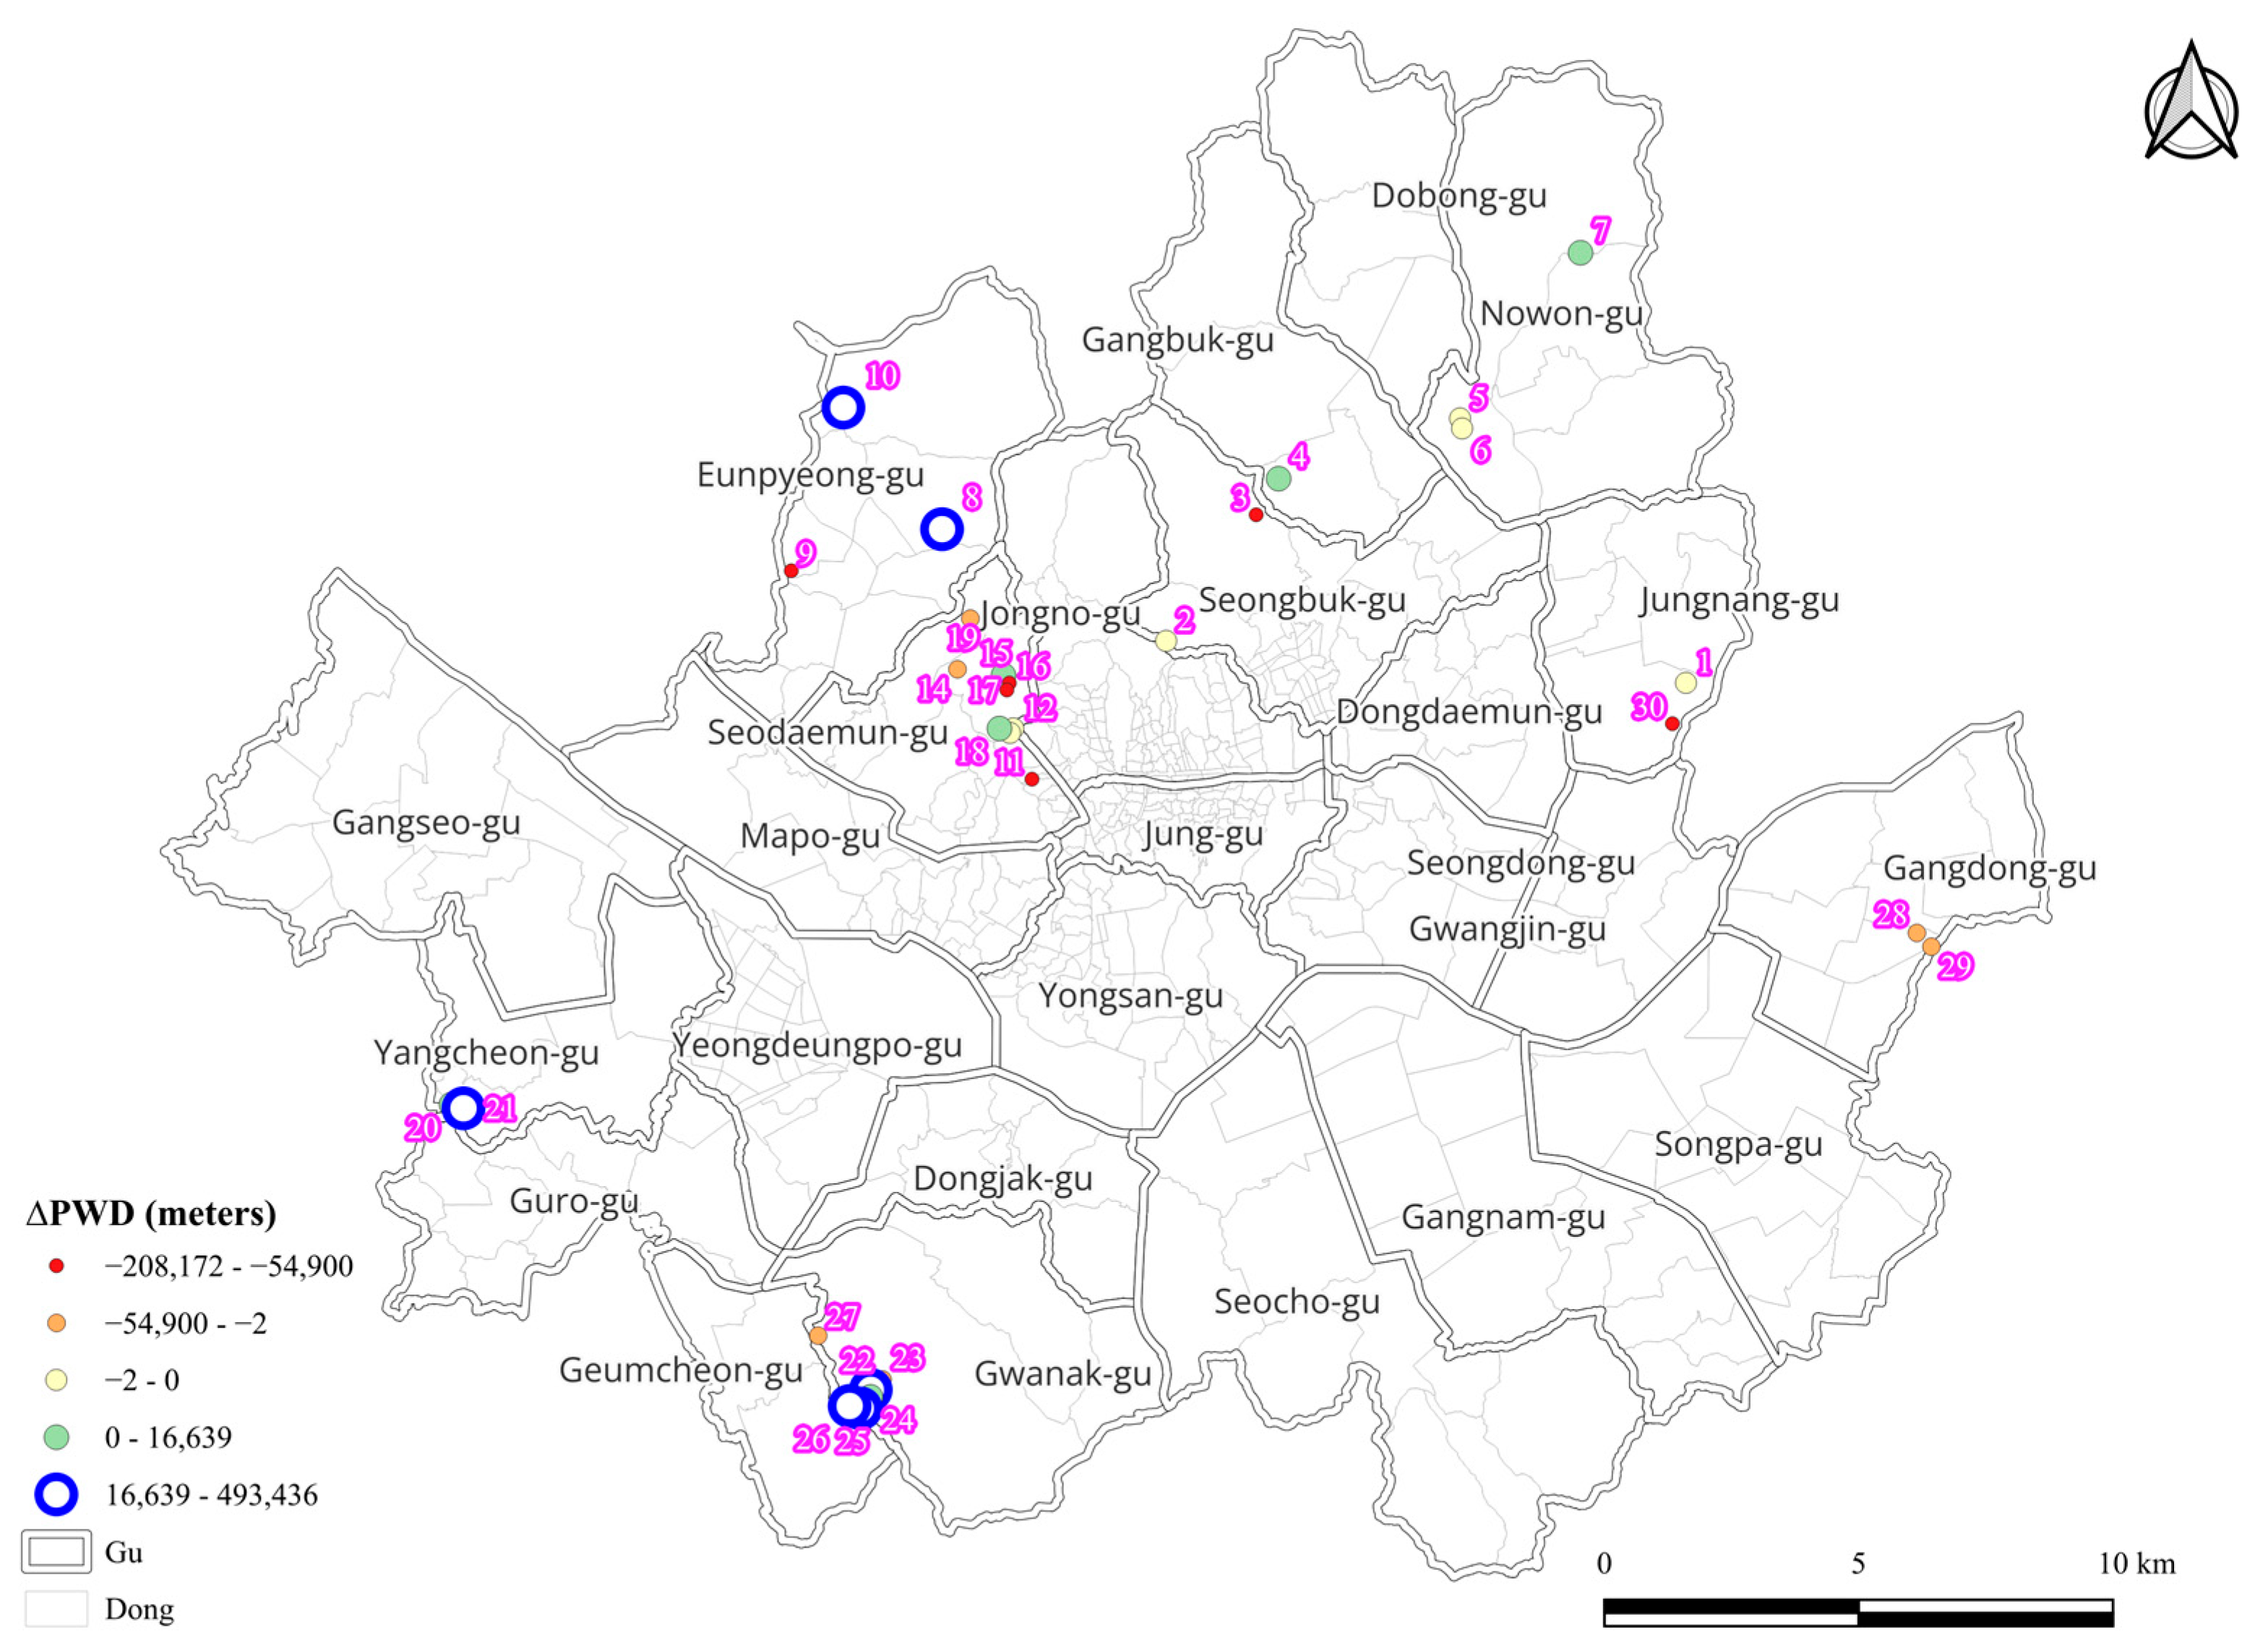
4.2. Interpretation of Simulation Results ( P W D )

Table 2 presents the simulated changes in total population-weighted distance ( P W D ) for each of the 30 candidate sites, under the assumption that a new park is introduced at one site at a time.
This simulation is based on the analytical framework proposed in this study, which evaluates park utility by incorporating area-based distance discounting and population-weighted walking behavior. As previously defined, a positive P W D value indicates a net gain in utility—i.e., a reduction in distance costs adjusted by park size—while a negative P W D reflects a relative decline in utility under the updated reference condition.
The simulation results show substantial variation across candidate sites. Site 10 produces the largest positive P W D (approximately 493,436 m), followed by Sites 21, 25, and 26, each of which yields significant utility gains. These sites are likely located near underserved but densely populated areas, where the introduction of a new park substantially improves local accessibility.
In contrast, several sites—such as Sites 3, 9, 11, and 17—show large negative P W D values. Importantly, these values do not necessarily indicate that the new park reduces accessibility or service level. Instead, they reflect the systemic effect of shifting the reference distance ( r d ). When a new park is introduced and significantly reduces the citywide average r d , some areas that were previously better than average may now fall below the updated threshold, even though their own accessibility has not changed. This phenomenon represents a kind of relative positional loss caused by re-benchmarking, not by actual service degradation.
This interpretation is further supported by the overall sum of P W D values, which is approximately −9932 m. At first glance, this might imply a slight decrease in citywide utility. However, this aggregate result merely reflects the arithmetic sum of many localized effects, including both genuine utility gains and relative benchmark shifts. In particular, it highlights how improvements in one part of the system can subtly recalibrate the utility hierarchy elsewhere. This systemic sensitivity underscores the importance of careful interpretation when using relative utility metrics in spatial equity assessments.
Despite these complexities, this interpretive nuance does not diminish the value of the P W D metric. On the contrary, it offers meaningful academic insight by highlighting the relational nature of spatial equity indicators. The fact that reference values such as r d can shift due to new park placements underscores the need for careful interpretation of relative metrics. Rather than treating this as a limitation, it calls for further methodological refinements—such as hybrid or adjusted utility models—that can better capture both absolute and relative dimensions of urban park accessibility.
To supplement the tabular results, Figure 5 visualizes the spatial distribution of ∆PWD values using a choropleth map classified by a quantile-based interval scheme. Candidate sites with larger positive P W D indicate areas where a new park would produce a strong distance discount effect, thus resulting in significant utility improvements. These locations represent high-priority intervention points for targeted park development. Conversely, sites with negative P W D values identify areas where new parks may have limited or even negative system-wide effects, often due to shifts in the reference distance.
From a policy perspective, the simulation remains highly valuable. It reveals that not all candidate sites contribute equally to utility improvement and that some sites offer disproportionately high returns. More importantly, it demonstrates that non-prioritized expansion of park infrastructure may not guarantee sound spatial equity outcomes. Instead, targeted investment in high-impact locations—identified through P W D analysis—can yield more effective and efficient improvements in urban park accessibility. Furthermore, the simulation allows policymakers to explore trade-offs between equity and efficiency. Even if the net citywide change is small or slightly negative, some districts may still experience significant local utility gains.
In conclusion, the P W D simulation provides a nuanced and analytically grounded decision-support tool. By capturing both the absolute and relative impacts of new park placement, it enables planners to allocate resources in ways that maximize marginal utility gains and address spatial disparities in park accessibility more effectively.

5. Discussion

5.1. Understanding Spatial Disparities in Perceived Accessibility

This study advances the discourse on urban park accessibility by moving beyond conventional approaches that predominantly emphasize spatial proximity. Instead, it proposes and empirically validates a novel cognitive accessibility evaluation framework that adjusts perceived distance to a park based on its physical size. Park size is widely regarded as a fundamental determinant of perceived attractiveness, based on the premise that larger parks can mitigate psychological or perceived walking distance by offering enhanced recreational opportunities and aesthetic experiences [35]. The aesthetic qualities of a park—such as its natural landscape, spatial openness, and the variety of facilities—can elicit positive emotional responses and promote a stronger desire to remain within the space, thereby influencing cognitive assessments of spatial accessibility [20,36,37,38]. In this context, large parks, often situated in suburban or peri-urban areas, tend to be destinations for purposeful visits, driven by the pursuit of visual richness and diverse leisure options. In contrast, smaller urban parks are typically favored for their convenience and ease of access, serving the needs of routine, short-duration visits. Accordingly, variations in perceived utility—arising from differences in park typology and user motivation—should be explicitly considered in accessibility assessments.
Empirical results reveal that although Seoul maintains a relatively high park-to-total land area ratio—approximately 10%—in comparison to other metropolitan areas in Korea, substantial intra-city disparities in park accessibility persist. These disparities are attributed to a combination of factors, including the average network distance from each census block to the nearest park, the extent to which perceived distance is adjusted according to park size, and age-specific variations in walking speed.
Specifically, areas exhibiting low values of perceived park accessibility (denoted as p w d i ) were predominantly found in the peripheral zones of Seoul, based on census block-level analysis. When scaled to larger administrative units, or “gu”, the districts of Eunpyeong-gu, Seongbuk-gu, Mapo-gu, Yeongdeungpo-gu, and Guro-gu emerged as having the lowest levels of park accessibility. These districts are generally located on the city’s periphery and are characterized by either a limited presence of large parks or substantial distances between large parks and residential clusters. Furthermore, Gangnam-gu, despite having a relatively high child population, and Jung-gu, which has a high proportion of elderly residents, exhibited diminished accessibility due to the slower walking speeds associated with these age groups. Unlike areas with planned housing developments and younger demographics, park accessibility vulnerability in elderly-concentrated districts is expected to worsen in tandem with the broader demographic trend of population aging in Seoul [39].
Under Korea’s Parks and Green Spaces Act, the mandated minimum provision of park space is 6 m 2 per capita. As of 2024, Seoul slightly exceeds this standard with 7.26 m 2 per person, based on a total population of 9,063,012 and an aggregate park area of 65,704,037.43 m 2 . However, this standard—established in the 1960s in reference to benchmarks used in developed countries—has remained unchanged and fails to account for the evolving recreational demands of contemporary urban populations [40,41]. The standard’s exclusive reliance on quantitative metrics such as aggregate park area and total population neglects the qualitative dimension of regional accessibility. Furthermore, the prevalence of mountainous parks in Seoul exacerbates this issue, as such topographical characteristics reduce practical and perceived accessibility [42]. Notably, peripheral districts suffer from particularly low perceived accessibility levels. These findings underscore the importance of spatially reasonably planned park placement strategies to ensure equitable access.
To enhance the practical validity of the simulation results, this study limited potential park locations to areas with realistic prospects for future development. Under these constraints, the simulation produced a cumulative P W D value of approximately –9932 m across all spatial units in Seoul. As previously discussed, this negative value does not indicate an overall decline in utility. Rather, it reflects the combined effects of localized improvements in park accessibility and relative decreases elsewhere caused by adjustments in the reference distance ( r d ). That is, when certain areas experience substantial utility gains due to new park placements, they shift the baseline against which other areas are evaluated—sometimes lowering the relative utility of previously well-served regions. This illustrates how localized actions in urban green space (UGS) planning can lead to redistributive impacts across the broader urban area, especially concerning spatial equity. While new parks mainly enhance accessibility for local residents, they can also alter the perceived value of the surrounding area. This underscores the need to account for both relative and absolute accessibility in planning efforts. The results emphasize the nuanced role of perceived utility, showing that parks with high perceived utility can attract more visitors and offset physical distance, even if they are situated far away.

5.2. Methodological Contributions

This study introduces methodological advancements in the evaluation of park accessibility by proposing an integrated utility-based accessibility model that incorporates not only the geographic location of parks but also their physical attributes and user-specific characteristics. Unlike conventional models that rely primarily on spatial proximity or network distance, this framework explicitly quantifies perceived differences in accessibility and perceived equity in public service provision within the urban environment.
In contrast to existing models that are predominantly based on network distance calculations [43,44,45], this study advances the field by integrating qualitative dimensions—such as the perceived value of park accessibility—into the accessibility metric. Prior research has repeatedly pointed out the limitations of traditional approaches that exclude subjective and experiential aspects of park use [2,3,46], yet few have successfully operationalized these qualitative factors within a quantitative framework. By embedding a utility function that reflects both park area and walking distance, this study provides a methodologically robust and intuitively interpretable approach to assessing perceived accessibility. This innovation allows policymakers to identify spatial inequities more accurately, pinpointing areas where perceived accessibility deficits are most severe and where future park development efforts should be prioritized.
Moreover, this research addresses a notable shortcoming in many prior studies that have applied a uniform walking speed to all population groups, disregarding physiological differences in mobility [39,47,48]. Such simplifications may result in an overestimation of actual accessibility levels, particularly in neighborhoods with high concentrations of vulnerable groups such as children and the elderly. By incorporating age-specific walking speeds into the accessibility equation, this study offers a refined assessment of user-specific perceived accessibility, enhancing the reliability of the findings and supporting more equitable planning interventions. Methodologically, this represents a significant step forward, as it moves beyond prior attempts that merely adjusted for user speed by integrating differentiated movement speeds directly into the utility function.
Nevertheless, several methodological limitations warrant consideration. First, while the utility function employed in this study captures the influence of park area on perceived accessibility, it does not account for a broader array of qualitative attributes. A growing body of literature has emphasized the importance of factors such as park management quality, the availability and diversity of recreational facilities, programming, and landscape aesthetics in shaping park attractiveness and reducing perceived distance [21,36,49,50]. In the future, when incorporating these qualitative factors into the utility function of parks, a more nuanced approach is necessary, rather than merely reducing them to the presence or absence of facilities or the aesthetic appeal of the landscape. Previous research has demonstrated that the harmony of spatial composition, eco-friendly design, connectivity with nature, and visual openness significantly influence a park’s attractiveness [51,52,53,54]. Additionally, elements such as planting design, the harmony of facilities, and landscape seasonality are likely to impact perceived accessibility. Therefore, future research could achieve a more comprehensive and multidimensional understanding of park accessibility by categorizing and integrating these diverse qualitative variables into models.
Second, the empirical scope of this study is confined to Seoul, a high-density metropolis with unique socio-spatial characteristics, which may limit the generalizability of the findings to lower-density or topographically distinct urban contexts. Moreover, focusing the study specifically on Seoul might lead to significant inaccuracies in the results. This is because Seoul is not spatially isolated from neighboring local governments, and the potential use of parks in those adjacent areas was not taken into account. Future research should assess perceived accessibility beyond Seoul and incorporate other regions. An alternative approach could involve including parks from nearby regions within a certain distance from Seoul’s census block groups.
Third, the generalizability of the distance decay function used in this study presents another limitation. Although the discount rate was derived from existing empirical studies and deemed statistically appropriate for the current context, its applicability to other cities or countries with differing cultural, geographical, and behavioral characteristics may be limited. To enhance external validity, future research should involve comparative analyses across diverse urban settings to establish standardized or regionally adaptive distance decay parameters.
Fourth, this study is limited by its emphasis on relative changes in perceived accessibility, as it does not explicitly differentiate the impacts of new park interventions on specific subpopulations, particularly underserved versus well-served communities. Although the P W D framework effectively captures spatial redistributions in utility, it does not provide a disaggregated assessment of equity outcomes based on socioeconomic status or demographic characteristics. Future work should include more comprehensive equity metrics to enhance the analysis of how accessibility improvements are distributed among and vary across different social groups.

5.3. Policy Implications and Practical Applications

This study introduces a novel user-centered framework for evaluating park services, shifting the analytical focus beyond traditional proximity-based assessments of accessibility. By incorporating cognitive perceptions of park utility, the study aligns with contemporary urban planning and policy objectives that seek to achieve both social equity and environmental efficiency in the context of rapidly urbanizing and spatially heterogeneous cities [55,56].
This multi-scalar analytical approach offers both strategic and operational insights for enhancing spatial equity in urban green space planning. By quantifying park utility at both micro and macro scales, the results presented in Figure 3, Figure 4 and Figure 5 provide a practical decision-support tool for diagnosing accessibility gaps and prioritizing intervention areas. Notably, even small variations in candidate park locations were shown to produce substantial differences in aggregate utility, highlighting the importance of spatial precision in policy design—especially when public resources are constrained.
The policy implications of this study are as follows: First, addressing park service deficiencies should move beyond a purely quantitative approach that focuses on increasing the number of parks. Instead, a strategic locational approach informed by cognitive utility is required. Specifically, future park development efforts should prioritize siting new parks in areas with demonstrably low levels of perceived accessibility, rather than pursuing uniform distribution or coverage-based targets. This approach enables more targeted interventions to reduce subjective accessibility gaps across diverse urban neighborhoods.
Second, from a spatial equity perspective, relocation and siting strategies should place particular emphasis on vulnerable population groups, such as children and the elderly. In South Korea, urban planning regulations mandate the provision of dedicated “children’s parks” within residential areas, which are subject to legal requirements concerning minimum area, facility composition, and distance thresholds. Similarly, new housing developments with a high proportion of children must meet statutory green space ratios. However, equivalent provisions for elderly populations—who are increasingly susceptible to park access limitations due to reduced mobility—remain underdeveloped. In anticipation of a super-aged society, future policies must expand their scope to include age-specific park typologies, accessibility benchmarks, and relocation strategies. Furthermore, tailored park programming and management models that enhance the qualitative aspects of accessibility for older adults will be essential.
Third, this study recommends a hybrid spatial strategy that integrates both concentrated and dispersed park development, informed by the “distance discount effect” associated with large-scale parks. While implementing a dispersed system of parks of varying sizes poses significant policy and spatial challenges in built-up urban environments, strategic initiatives—such as the transformation of former U.S. military bases into national parks (e.g., Yongsan Park), greenway conversions atop roads, and ongoing urban forest development—could serve as anchor projects for integrated green space planning. These projects, if aligned with the city’s overarching park green space master plan, would enhance both feasibility and public acceptance.
Fourth, the development of a GIS-based, real-time decision support system (DSS) is proposed, leveraging the “cognitive park accessibility map” conceptualized in this study. Such a tool could facilitate data-informed policy design by visualizing spatial imbalances in perceived park accessibility and simulating the potential utility gains of alternative park siting scenarios. This would enable planners and decision-makers to evaluate trade-offs between spatial equity and environmental efficiency and to formulate evidence-based, adaptive strategies for green infrastructure provision.

6. Conclusions

This study introduces and empirically validates a novel framework for assessing park accessibility by incorporating a distance-adjustment mechanism that reflects park attractiveness from the perspective of users’ total perceived utility. This approach addresses key limitations in conventional accessibility analyses, which often rely solely on quantitative spatial metrics such as physical distance or network proximity. By shifting the conceptual lens from “distance” to “perceived utility”—a composite measure that integrates both park attributes (e.g., size, facilities, attractiveness) and user characteristics (e.g., age, mobility)—the study offers a more nuanced and behaviorally grounded evaluation model. This reconceptualization provides not only an analytical advancement but also practical implications for urban planning and green space policy.
The developed distance-adjustment mechanism reflects the assumption that larger or more attractive parks may offset the deterrent effects of greater distances, effectively recalibrating accessibility in terms of user experience rather than spatial geometry alone. As such, this approach offers both theoretical advancement and practical value, particularly in diagnosing why proximate parks may remain underutilized while more distant parks attract higher user engagement. The resulting metric provides a comprehensive criterion that incorporates both functional efficiency and experiential quality, offering a robust foundation for determining the optimal size, distribution, and design of parks in urban contexts.
The results reveal substantial spatial disparities in perceived park utility across census blocks in Seoul, thereby evidencing a clear imbalance in perceived park accessibility at the intra-city level. These findings are particularly relevant in the context of current planning paradigms that emphasize inclusive urbanism and equitable access to green infrastructure. The empirical insights presented here can serve as foundational data for strategic public space planning, including the siting of not only parks but also broader categories of community infrastructure. In particular, this framework aligns well with emergent models such as the 15 min city and urban regeneration strategies that aim to localize essential services within walkable distances.
Future research should expand the application of this model to a wider range of cities with varying demographic, geographic, and morphological conditions to assess its adaptability and robustness. Furthermore, the reliability of the cognitive utility framework could be significantly strengthened through the implementation of parallel empirical studies, including perception-based surveys and virtual reality (VR)-based behavioral experiments. Such efforts would enhance the methodological validity of this approach and support its development as a transferable, policy-relevant evaluation tool.

Author Contributions

Conceptualization, G.L.; methodology, G.L.; software, G.L. and Y.K.; validation, G.L.; formal analysis, G.L.; investigation, G.L.; data curation, Y.K.; writing—original draft preparation, G.L.; writing—review and editing, Y.K.; visualization, G.L. and Y.K.; supervision, G.L.; funding acquisition, G.L. All authors have read and agreed to the published version of the manuscript.

Funding

This study was supported by the Korea Agency for Infrastructure Technology Advancement (KAIA) grant funded by the Ministry of Land, Infrastructure, and Transport (Grant RS-2022-00143336).

Data Availability Statement

Data can be shared upon request.

Conflicts of Interest

The authors declare that they have no known competing financial interests or personal relationships that could have appeared to influence the work reported in this paper.

References

  1. Zhang, S.; Zhou, W. Recreational Visits to Urban Parks and Factors Affecting Park Visits: Evidence from Geotagged Social Media Data. Landsc. Urban Plan. 2018, 180, 27–35. [Google Scholar] [CrossRef]
  2. Zhang, J.; Tan, P.Y. Demand for Parks and Perceived Accessibility as Key Determinants of Urban Park Use Behavior. Urban For. Urban Green. 2019, 44, 126420. [Google Scholar] [CrossRef]
  3. Wang, D.; Brown, G.; Liu, Y. The Physical and Non-Physical Factors That Influence Perceived Access to Urban Parks. Landsc. Urban Plan. 2015, 133, 53–66. [Google Scholar] [CrossRef]
  4. Hu, S.; Song, W.; Li, C.; Lu, J. A Multi-Mode Gaussian-Based Two-Step Floating Catchment Area Method for Measuring Accessibility of Urban Parks. Cities 2020, 105, 102815. [Google Scholar] [CrossRef]
  5. Reyes, M.; Páez, A.; Morency, C. Walking Accessibility to Urban Parks by Children: A Case Study of Montreal. Landsc. Urban Plan. 2014, 125, 38–47. [Google Scholar] [CrossRef]
  6. Dai, D. Racial/Ethnic and Socioeconomic Disparities in Urban Green Space Accessibility: Where to Intervene? Landsc. Urban Plan. 2011, 102, 234–244. [Google Scholar] [CrossRef]
  7. Rigolon, A.; Browning, M.H.E.M.; McAnirlin, O.; Yoon, H. Green Space and Health Equity: A Systematic Review on the Potential of Green Space to Reduce Health Disparities. Int. J. Environ. Res. Public Health 2021, 18, 2563. [Google Scholar] [CrossRef]
  8. Zhang, J.; Tan, P.Y. Assessment of Spatial Equity of Urban Park Distribution from the Perspective of Supply-Demand Interactions. Urban For. Urban Green. 2023, 80, 127827. [Google Scholar] [CrossRef]
  9. Ashik, F.R.; Islam, M.S.; Alam, M.S.; Tabassum, N.J.; Manaugh, K. Dynamic Equity in Urban Amenities Distribution: An Accessibility-Driven Assessment. Appl. Geogr. 2024, 164, 103199. [Google Scholar] [CrossRef]
  10. Nicoletti, L.; Sirenko, M.; Verma, T. Disadvantaged Communities Have Lower Access to Urban Infrastructure. Environ. Plan. B Urban Anal. City Sci. 2023, 50, 831–849. [Google Scholar] [CrossRef]
  11. Xu, M.; Xin, J.; Su, S.; Weng, M.; Cai, Z. Social Inequalities of Park Accessibility in Shenzhen, China: The Role of Park Quality, Transport Modes, and Hierarchical Socioeconomic Characteristics. J. Transp. Geogr. 2017, 62, 38–50. [Google Scholar] [CrossRef]
  12. You, H. Characterizing the Inequalities in Urban Public Green Space Provision in Shenzhen, China. Habitat Int. 2016, 56, 176–180. [Google Scholar] [CrossRef]
  13. Tan, P.Y.; Samsudin, R. Effects of Spatial Scale on Assessment of Spatial Equity of Urban Park Provision. Landsc. Urban Plan. 2017, 158, 139–154. [Google Scholar] [CrossRef]
  14. Zhang, R.; Sun, F.; Shen, Y.; Peng, S.; Che, Y. Accessibility of Urban Park Benefits with Different Spatial Coverage: Spatial and Social Inequity. Appl. Geogr. 2021, 135, 102555. [Google Scholar] [CrossRef]
  15. Wang, S.; Wang, M.; Liu, Y. Access to Urban Parks: Comparing Spatial Accessibility Measures Using Three GIS-Based Approaches. Comput. Environ. Urban Syst. 2021, 90, 101713. [Google Scholar] [CrossRef]
  16. Dony, C.C.; Delmelle, E.M.; Delmelle, E.C. Re-Conceptualizing Accessibility to Parks in Multi-Modal Cities: A Variable-Width Floating Catchment Area (VFCA) Method. Landsc. Urban Plan. 2015, 143, 90–99. [Google Scholar] [CrossRef]
  17. Konijnendijk, C.C. Evidence-Based Guidelines for Greener, Healthier, More Resilient Neighbourhoods: Introducing the 3-30-300 Rule. J. For. Res. 2023, 34, 821–830. [Google Scholar] [CrossRef]
  18. Lopez, M.A.; De Marco, A.; Anav, A.; Sorrentino, B.; Paoletti, E.; Manzini, J.; Hoshika, Y.; Sicard, P. The 3-30-300 Rule Compliance: A Geospatial Tool for Urban Planning. Landsc. Urban Plan. 2025, 261, 105396. [Google Scholar] [CrossRef]
  19. Nieuwenhuijsen, M.J.; Dadvand, P.; Márquez, S.; Bartoll, X.; Barboza, E.P.; Cirach, M.; Borrell, C.; Zijlema, W.L. The Evaluation of the 3-30-300 Green Space Rule and Mental Health. Environ. Res. 2022, 215, 114387. [Google Scholar] [CrossRef]
  20. Park, K. Psychological Park Accessibility: A Systematic Literature Review of Perceptual Components Affecting Park Use. Landsc. Res. 2017, 42, 508–520. [Google Scholar] [CrossRef]
  21. Maroko, A.R.; Maantay, J.A.; Sohler, N.L.; Grady, K.L.; Arno, P.S. The Complexities of Measuring Access to Parks and Physical Activity Sites in New York City: A Quantitative and Qualitative Approach. Int. J. Health Geogr. 2009, 8, 34. [Google Scholar] [CrossRef] [PubMed]
  22. Oviedo, M.; Drescher, M.; Dean, J. Urban Greenspace Access, Uses, and Values: A Case Study of User Perceptions in Metropolitan Ravine Parks. Urban For. Urban Green. 2022, 70, 127522. [Google Scholar] [CrossRef]
  23. Biernacka, M.; Kronenberg, J. Classification of Institutional Barriers Affecting the Availability, Accessibility and Attractiveness of Urban Green Spaces. Urban For. Urban Green. 2018, 36, 22–33. [Google Scholar] [CrossRef]
  24. Zhang, R.; Peng, S.; Sun, F.; Deng, L.; Che, Y. Assessing the Social Equity of Urban Parks: An Improved Index Integrating Multiple Quality Dimensions and Service Accessibility. Cities 2022, 129, 103839. [Google Scholar] [CrossRef]
  25. Wolff, M.; Mascarenhas, A.; Haase, A.; Haase, D.; Andersson, E.; Borgström, S.T.; Kronenberg, J.; Łaszkiewicz, E.; Biernacka, M. Conceptualizing Multidimensional Barriers: A Framework for Assessing Constraints in Realizing Recreational Benefits of Urban Green Spaces. Ecol. Soc. 2022, 27, 17. [Google Scholar] [CrossRef]
  26. Brown, G. A Theory of Urban Park Geography. J. Leis. Res. 2008, 40, 589–607. [Google Scholar] [CrossRef]
  27. Boone, C.; Buckley, G.; Grove, M.; Sister, C. Parks and People: An Environmental Justice Inquiry in Baltimore, Maryland. Ann. Assoc. Am. Geogr. 2009, 99, 767–787. [Google Scholar] [CrossRef]
  28. Higgs, G.; Fry, R.; Langford, M. Investigating the Implications of Using Alternative GIS-Based Techniques to Measure Accessibility to Green Space. Environ. Plan. B Plan. Des. 2012, 39, 326–343. [Google Scholar] [CrossRef]
  29. Cohen, D.A.; Marsh, T.; Williamson, S.; Derose, K.P.; Martinez, H.; Setodji, C.; McKenzie, T.L. Parks and Physical Activity: Why Are Some Parks Used More than Others? Prev. Med. 2010, 50, S9–S12. [Google Scholar] [CrossRef]
  30. Shu, D.; Peng, Y.; Zhang, Z.; Shi, R.; Wu, C.; Gan, D.; Li, X. Distance Decay of Urban Park Visitation: Roles of Personal Characteristics and Visitation Patterns. Forests 2024, 15, 1589. [Google Scholar] [CrossRef]
  31. Handy, S.L.; Niemeier, D.A. Measuring Accessibility: An Exploration of Issues and Alternatives. Environ. Plan. A Econ. Space 1997, 29, 1175–1194. [Google Scholar] [CrossRef]
  32. Bohannon, R.W. Comfortable and maximum walking speed of adults aged 20–79 years: Reference values and determinants. Age Ageing 1997, 26, 15–19. [Google Scholar] [CrossRef] [PubMed]
  33. Yang, Y.; Diez-Roux, A.V. Walking distance by trip purpose and population subgroups. Am. J. Prev. Med. 2012, 43, 11–19. [Google Scholar] [CrossRef] [PubMed]
  34. Yoon, N.M.; Yoon, H.J.; Park, J.; Jung, H.; Kim, G. The comparative study on age-associated gait analysis in normal Korean. J. Korean Soc. Phys. Ther. 2010, 22, 15–24. [Google Scholar]
  35. Giles-Corti, B.; Broomhall, M.H.; Knuiman, M.; Collins, C.; Douglas, K.; Ng, K.; Lange, A.; Donovan, R.J. Increasing Walking: How Important Is Distance to, Attractiveness, and Size of Public Open Space? Am. J. Prev. Med. 2005, 28, 169–176. [Google Scholar] [CrossRef]
  36. Mohamed, A.A.; Kronenberg, J. Users’ Experiences of Park Accessibility and Attractiveness Based on Online Review Analytics. Sci. Rep. 2025, 15, 4268. [Google Scholar] [CrossRef]
  37. Zhao, Z.; He, Q.; Zhang, Y.; Liu, S.; Yang, Y. Assessing Cross Cultural Urban Park Emotional Wellbeing Impact in Shanghai and London. Sci. Rep. 2025, 15, 18892. [Google Scholar] [CrossRef]
  38. Li, Y.; Li, W.; Liu, Y. Remedies from Nature: Exploring the Moderating Mechanisms of Natural Landscape Features on Emotions and Perceived Restoration in Urban Parks. Front. Psychol. 2024, 15, 1502240. [Google Scholar] [CrossRef]
  39. Li, C.; Wang, J. Using an Age-Grouped Gaussian-Based Two-Step Floating Catchment Area Method (AG2SFCA) to Measure Walking Accessibility to Urban Parks: With an Explicit Focus on Elderly. J. Transp. Geogr. 2024, 114, 103772. [Google Scholar] [CrossRef]
  40. Jeon, Y.; Jung, S. Spatial Equity of Urban Park Distribution: Examining the Floating Population within Urban Park Catchment Areas in the Context of the 15-Minute City. Land 2024, 13, 24. [Google Scholar] [CrossRef]
  41. Tong, A.; Qian, X.; Xu, L.; Wu, Y.; Ma, Q.; Shi, Y.; Feng, M.; Lu, Z. Demand-Led Optimization of Urban Park Services. Forests 2023, 14, 2371. [Google Scholar] [CrossRef]
  42. Choi, J.; Kim, G. History of Seoul’s Parks and Green Space Policies: Focusing on Policy Changes in Urban Development. Land 2022, 11, 474. [Google Scholar] [CrossRef]
  43. Zhao, Z.; Li, X.; Xu, Y.; Yang, S.; Jiang, Y.; Wang, S. Evaluating Spatial Accessibility of Cultural Urban Land Use by Using Improved 2SFCA Method in Xi′an, China. Heliyon 2022, 8, e11993. [Google Scholar] [CrossRef]
  44. Semenzato, P.; Costa, A.; Campagnaro, T. Accessibility to Urban Parks: Comparing GIS Based Measures in the City of Padova (Italy). Urban For. Urban Green. 2023, 82, 127896. [Google Scholar] [CrossRef]
  45. Wei, F. Greener Urbanization? Changing Accessibility to Parks in China. Landsc. Urban Plan. 2017, 157, 542–552. [Google Scholar] [CrossRef]
  46. Zhao, X.; Lu, Y.; Huang, W.; Lin, G. Assessing and Interpreting Perceived Park Accessibility, Usability and Attractiveness through Texts and Images from Social Media. Sustain. Cities Soc. 2024, 112, 105619. [Google Scholar] [CrossRef]
  47. Luo, W.; Chen, H.; Yang, Z.; Liu, J. Accessibility and Equity of Park Green Spaces: Considering Differences in Walking Speeds Across Age Groups. Land 2024, 13, 2240. [Google Scholar] [CrossRef]
  48. Bohannon, R.W.; Williams Andrews, A. Normal Walking Speed: A Descriptive Meta-Analysis. Physiotherapy 2011, 97, 182–189. [Google Scholar] [CrossRef]
  49. McCormack, G.R.; Rock, M.; Toohey, A.M.; Hignell, D. Characteristics of Urban Parks Associated with Park Use and Physical Activity: A Review of Qualitative Research. Health Place 2010, 16, 712–726. [Google Scholar] [CrossRef]
  50. Mao, Z.; Wang, W.; Ren, Z.; Zhang, D.; He, X. Recreational Attractiveness of Urban Parks and Implications for Their Management: A Case Study in Changchun, China. Chin. Geogr. Sci. 2022, 32, 456–466. [Google Scholar] [CrossRef]
  51. Wang, Y.; Su, T. The Impacts of Friendly Designs on the Long-Term Sustainability of Modern Urban Parks. Sustainability 2025, 17, 830. [Google Scholar] [CrossRef]
  52. Hung, S.H.; Chang, C.Y. Designing for Harmony in Urban Green Space: Linking the Concepts of Biophilic Design, Environmental Qi, Restorative Environment, and Landscape Preference. J. Environ. Psychol. 2024, 96, 102294. [Google Scholar] [CrossRef]
  53. Lis, A.; Zalewska, K.; Pardela, Ł.; Adamczak, E.; Cenarska, A.; Bławicka, K.; Brzegowa, B.; Matiiuk, A. How the Amount of Greenery in City Parks Impacts Visitor Preferences in the Context of Naturalness, Legibility and Perceived Danger. Landsc. Urban Plan. 2022, 228, 104556. [Google Scholar] [CrossRef]
  54. Maurice, A.C.; Deguines, N.; Baudry, E. Preference for More Informal Vegetation in Urban Parks: The Impeding Role of Need for Structure among the French Population. Landsc. Urban Plan. 2025, 253, 105177. [Google Scholar] [CrossRef]
  55. Dsouza, N.; Devadason, A.; Senerat, A.M.; Watanatada, P.; Rojas-Rueda, D.; Sebag, G. Sustainability and Equity in Urban Development (S&EUD): A Content Analysis of “Bright Spots” from the Accelerating City Equity (ACE) Project. Sustainability 2023, 15, 7318. [Google Scholar] [CrossRef] [PubMed]
  56. Trudeau, D. Integrating Social Equity in Sustainable Development Practice: Institutional Commitments and Patient Capital. Sustain. Cities Soc. 2018, 41, 601–610. [Google Scholar] [CrossRef]
Figure 1. Conceptual flow for deriving park utility for each spatial unit i .
Land 14 01449 g001
Figure 2. Administrative boundaries, park distribution, and topography in Seoul.
Land 14 01449 g002
Figure 3. Spatial distribution of p w d i at the census block group level in Seoul.
Land 14 01449 g003
Figure 4. Spatial distribution of aggregated p w d i at the district (Gu) level in Seoul.
Land 14 01449 g004
Figure 5. Spatial distribution of P W D values by candidate park site in Seoul.
Land 14 01449 g005
Table 1. Tabulated summary of p w d i at the district (Gu) level in Seoul.
GuChildrenOlder AdultsYoung Adults p w d ( i )
(Meters)
Jongno-gu10,74224,420101,5158,106,033
Jung-gu845921,14084,398−505,324
Yongsan-gu17,68533,362152,248−5,847,387
Seongdong-gu26,42442,555205,18213,828,071
Gwangjin-gu27,91946,972250,9103,647,212
Dongdaemun-gu28,53157,577240,472366,575
Jungnang-gu32,15366,702271,7294,299,057
Seongbuk-gu42,57269,283307,308−24,440,709
Gangbuk-gu22,65960,457202,270−1,749,140
Dobong-gu27,29860,330216,12520,507,928
Nowon-gu51,97881,736360,15236,885,920
Eunpyeong-gu43,44681,031323,698−69,662,955
Seodaemun-gu27,68749,463220,346−629,807
Mapo-gu34,93248,897266,329−11,517,446
Yangcheon-gu52,00562,537309,87738,267,568
Gangseo-gu55,38084,978407,10030,540,225
Guro-gu38,60067,218274,771−76,400,807
Geumcheon-gu17,18537,790165,472−8,004,385
Yeongdeungpo-gu33,88756,725266,295−15,032,779
Dongjak-gu33,65261,044276,38710,744,667
Gwanak-gu29,69673,925366,19921,644,993
Seocho-gu50,71454,244277,04510,030,306
Gangnam-gu58,80569,792361,029−6,611,274
Songpa-gu73,25088,648458,22616,517,667
Gangdong-gu52,27568,458320,711949,744
Total897,9341,469,2846,685,794−4,066,046
Table 2. Simulated P W D values for each candidate park site.
Candidate Site P W D Candidate Site P W D Candidate Site P W D
1011−144,6552157,132
2012022−20,192
3−208,1721302327,607
4456114−11,864247507
501513,8972558,619
6016−61,9242639,514
78317−75,32627−5
843,07418294528−31,753
9−76,06419−53,14429−18,501
10493,43620734030−64,046
Disclaimer/Publisher’s Note: The statements, opinions and data contained in all publications are solely those of the individual author(s) and contributor(s) and not of MDPI and/or the editor(s). MDPI and/or the editor(s) disclaim responsibility for any injury to people or property resulting from any ideas, methods, instructions or products referred to in the content.

