Urban Densification and Outdoor Thermal Comfort: Scenario-Based Analysis in Zurich’s Altstetten–Albisrieden District
Abstract
1. Introduction
2. Methods
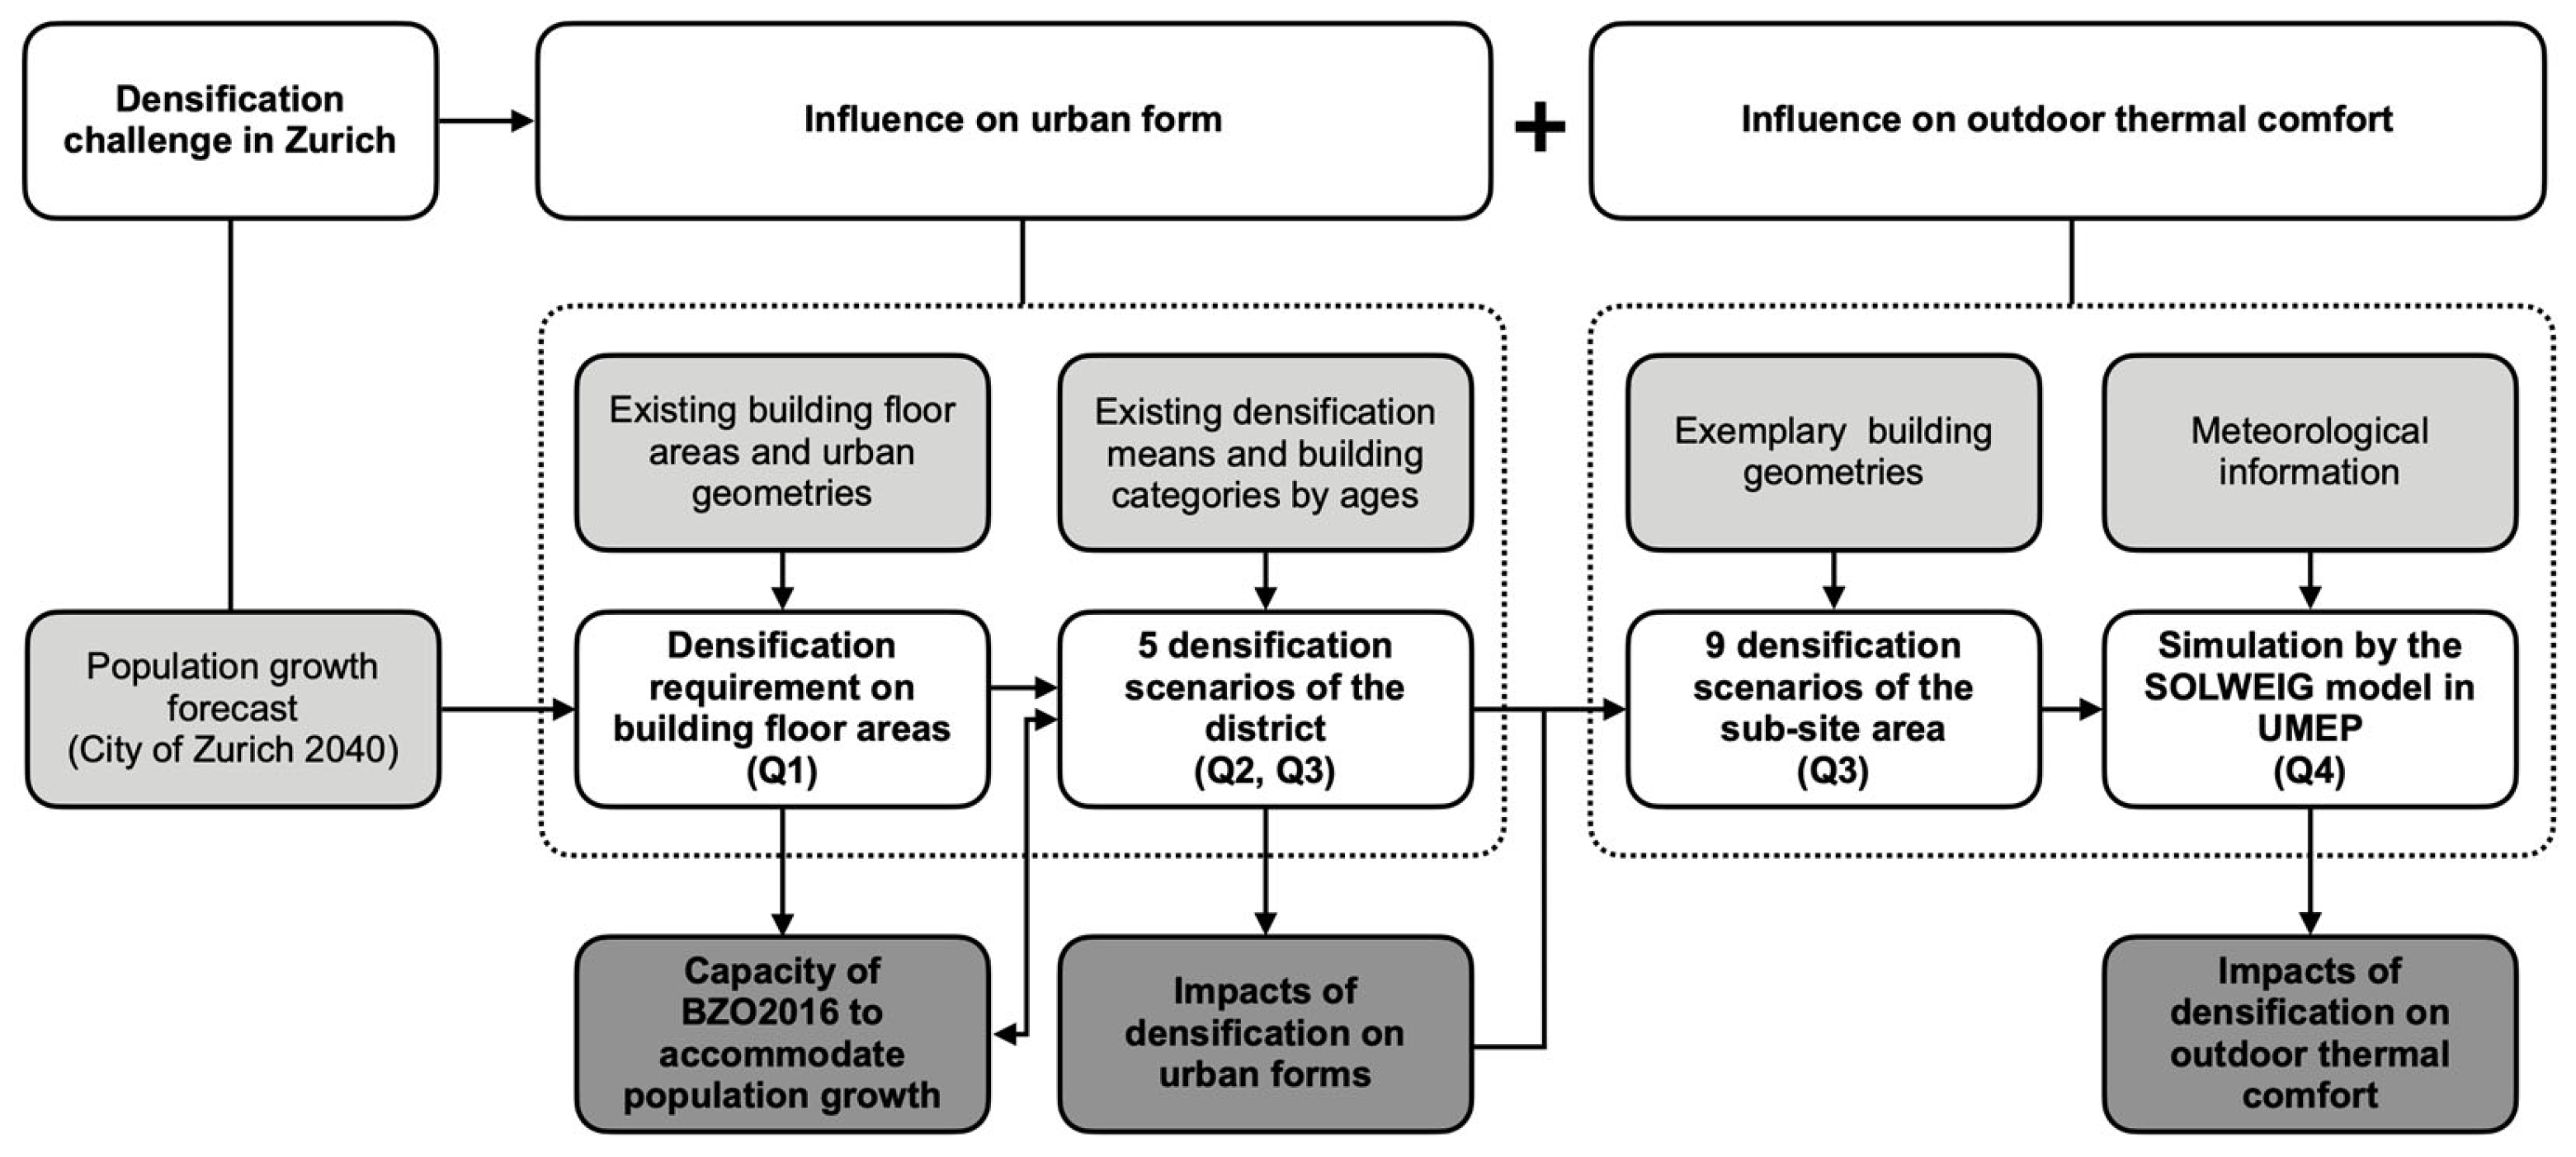
2.1. Methodologies and Framework
- Question 1: To what extent must building floor areas be increased to accommodate the anticipated population growth in the selected district?
- Question 2: In which locations should these building floor areas be expanded?
- Question 3: What methods of densification can be employed to facilitate the enhancement of building floor areas?
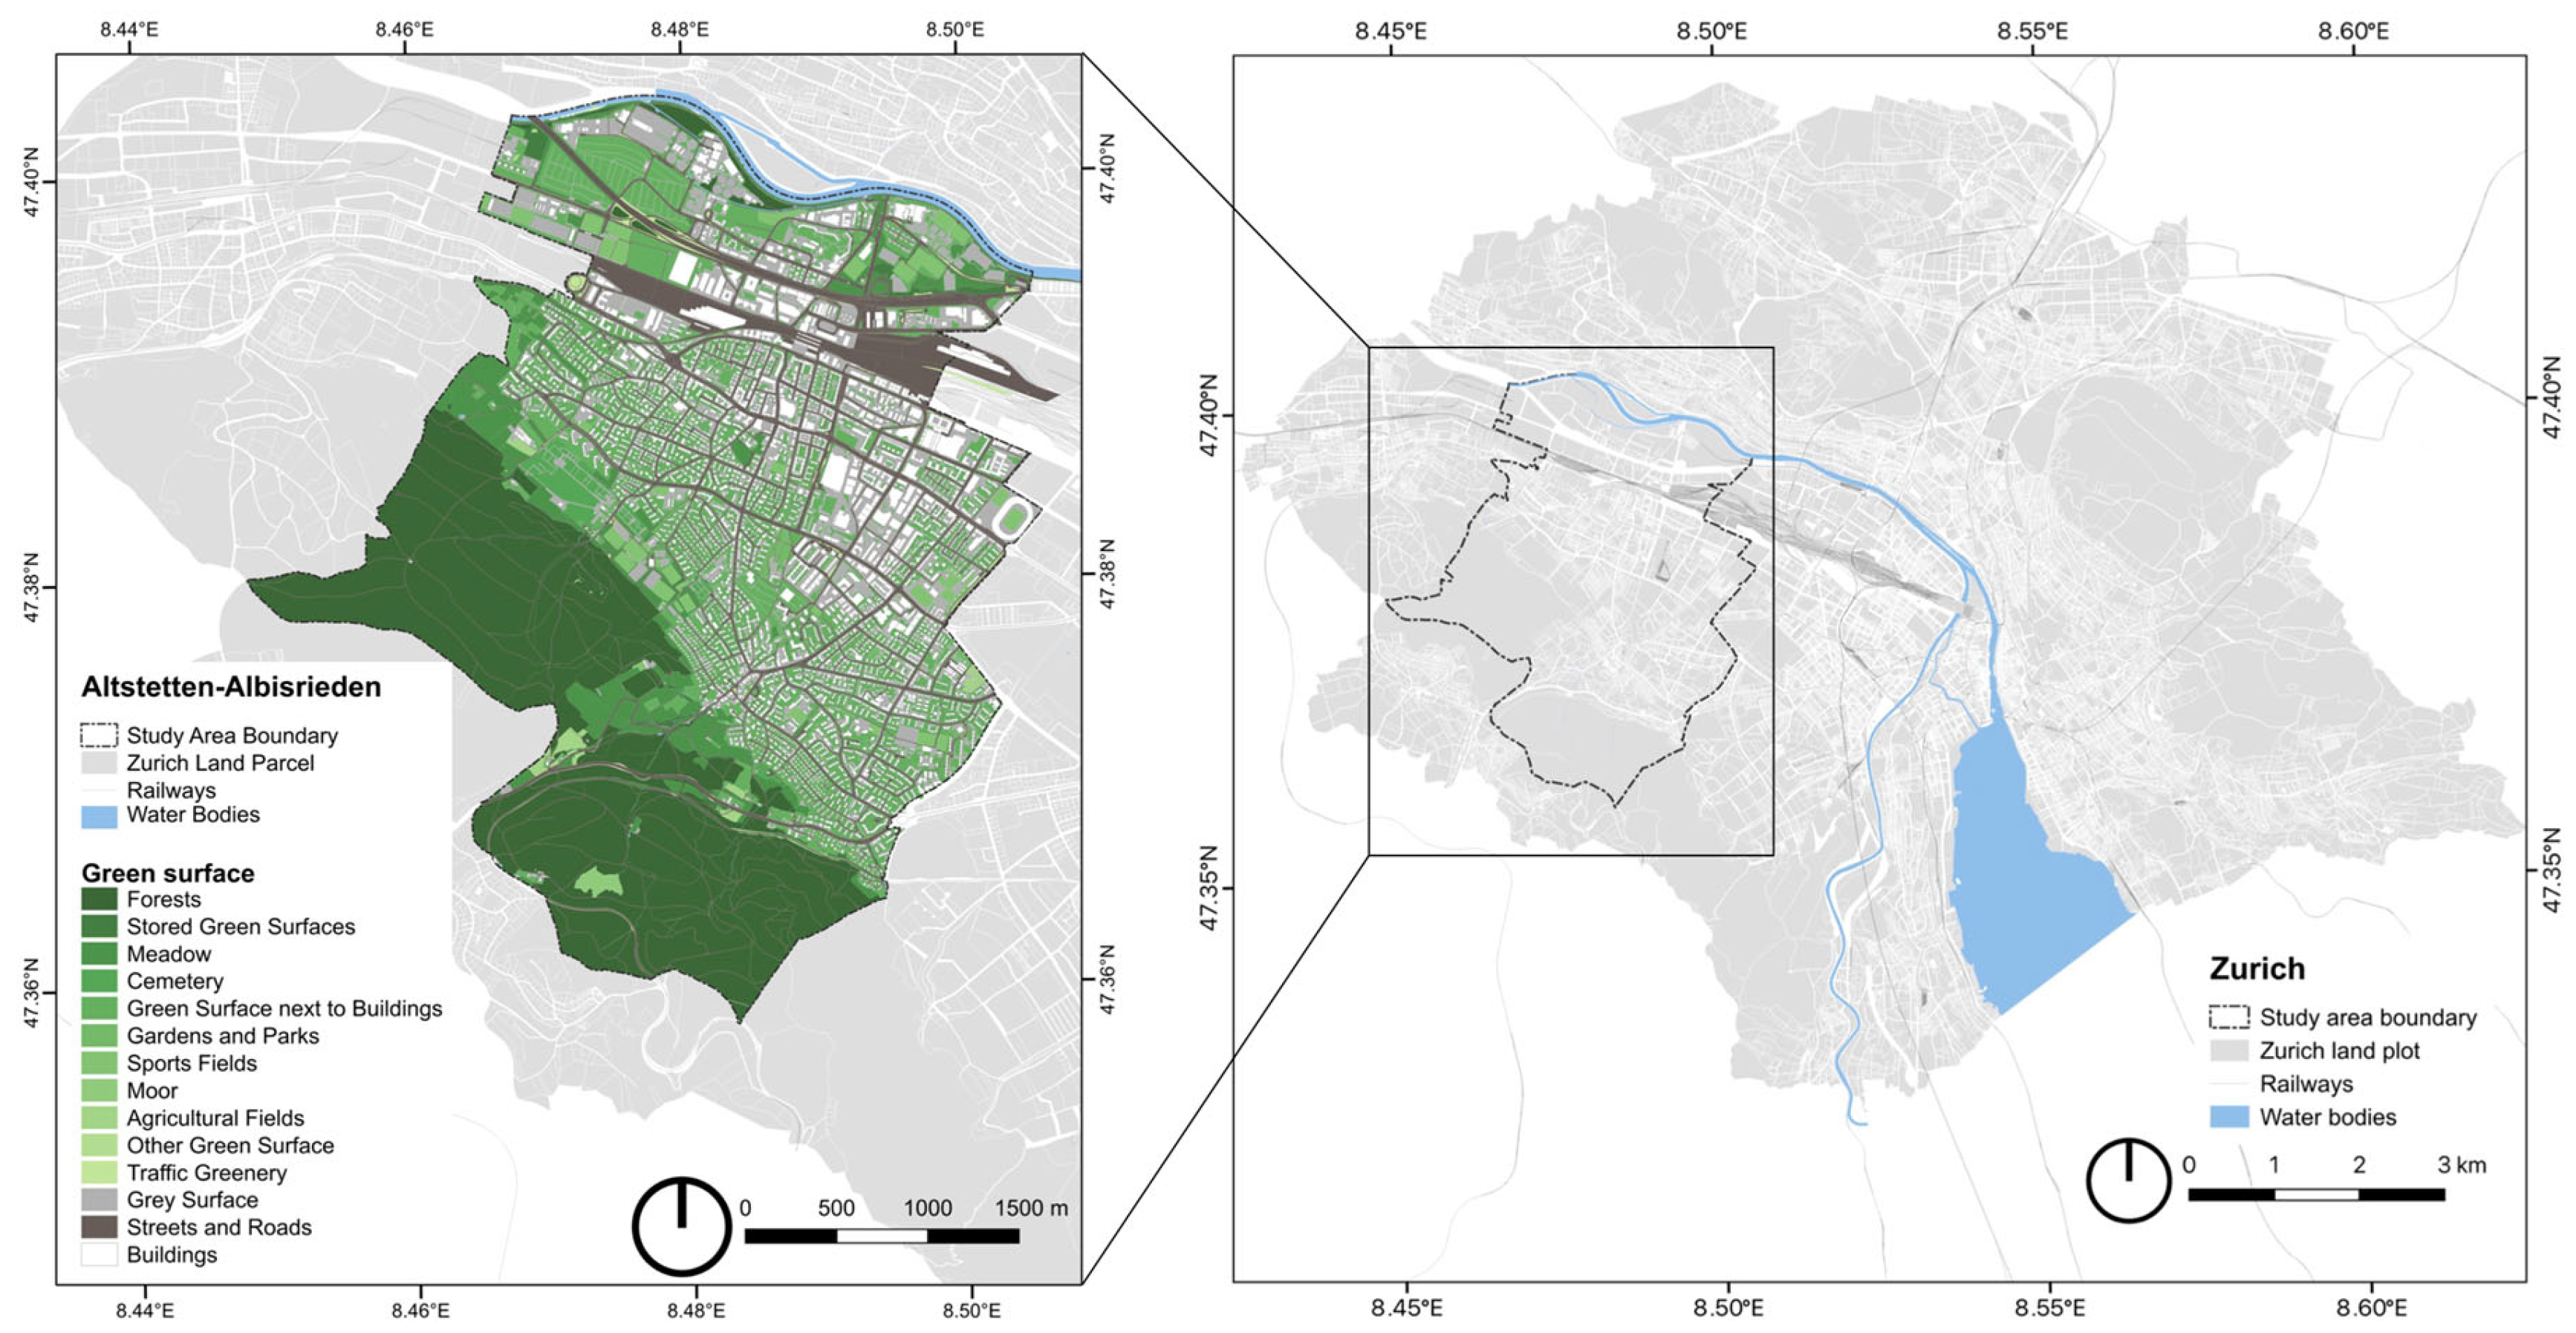
2.2. Study Area
2.3. Data
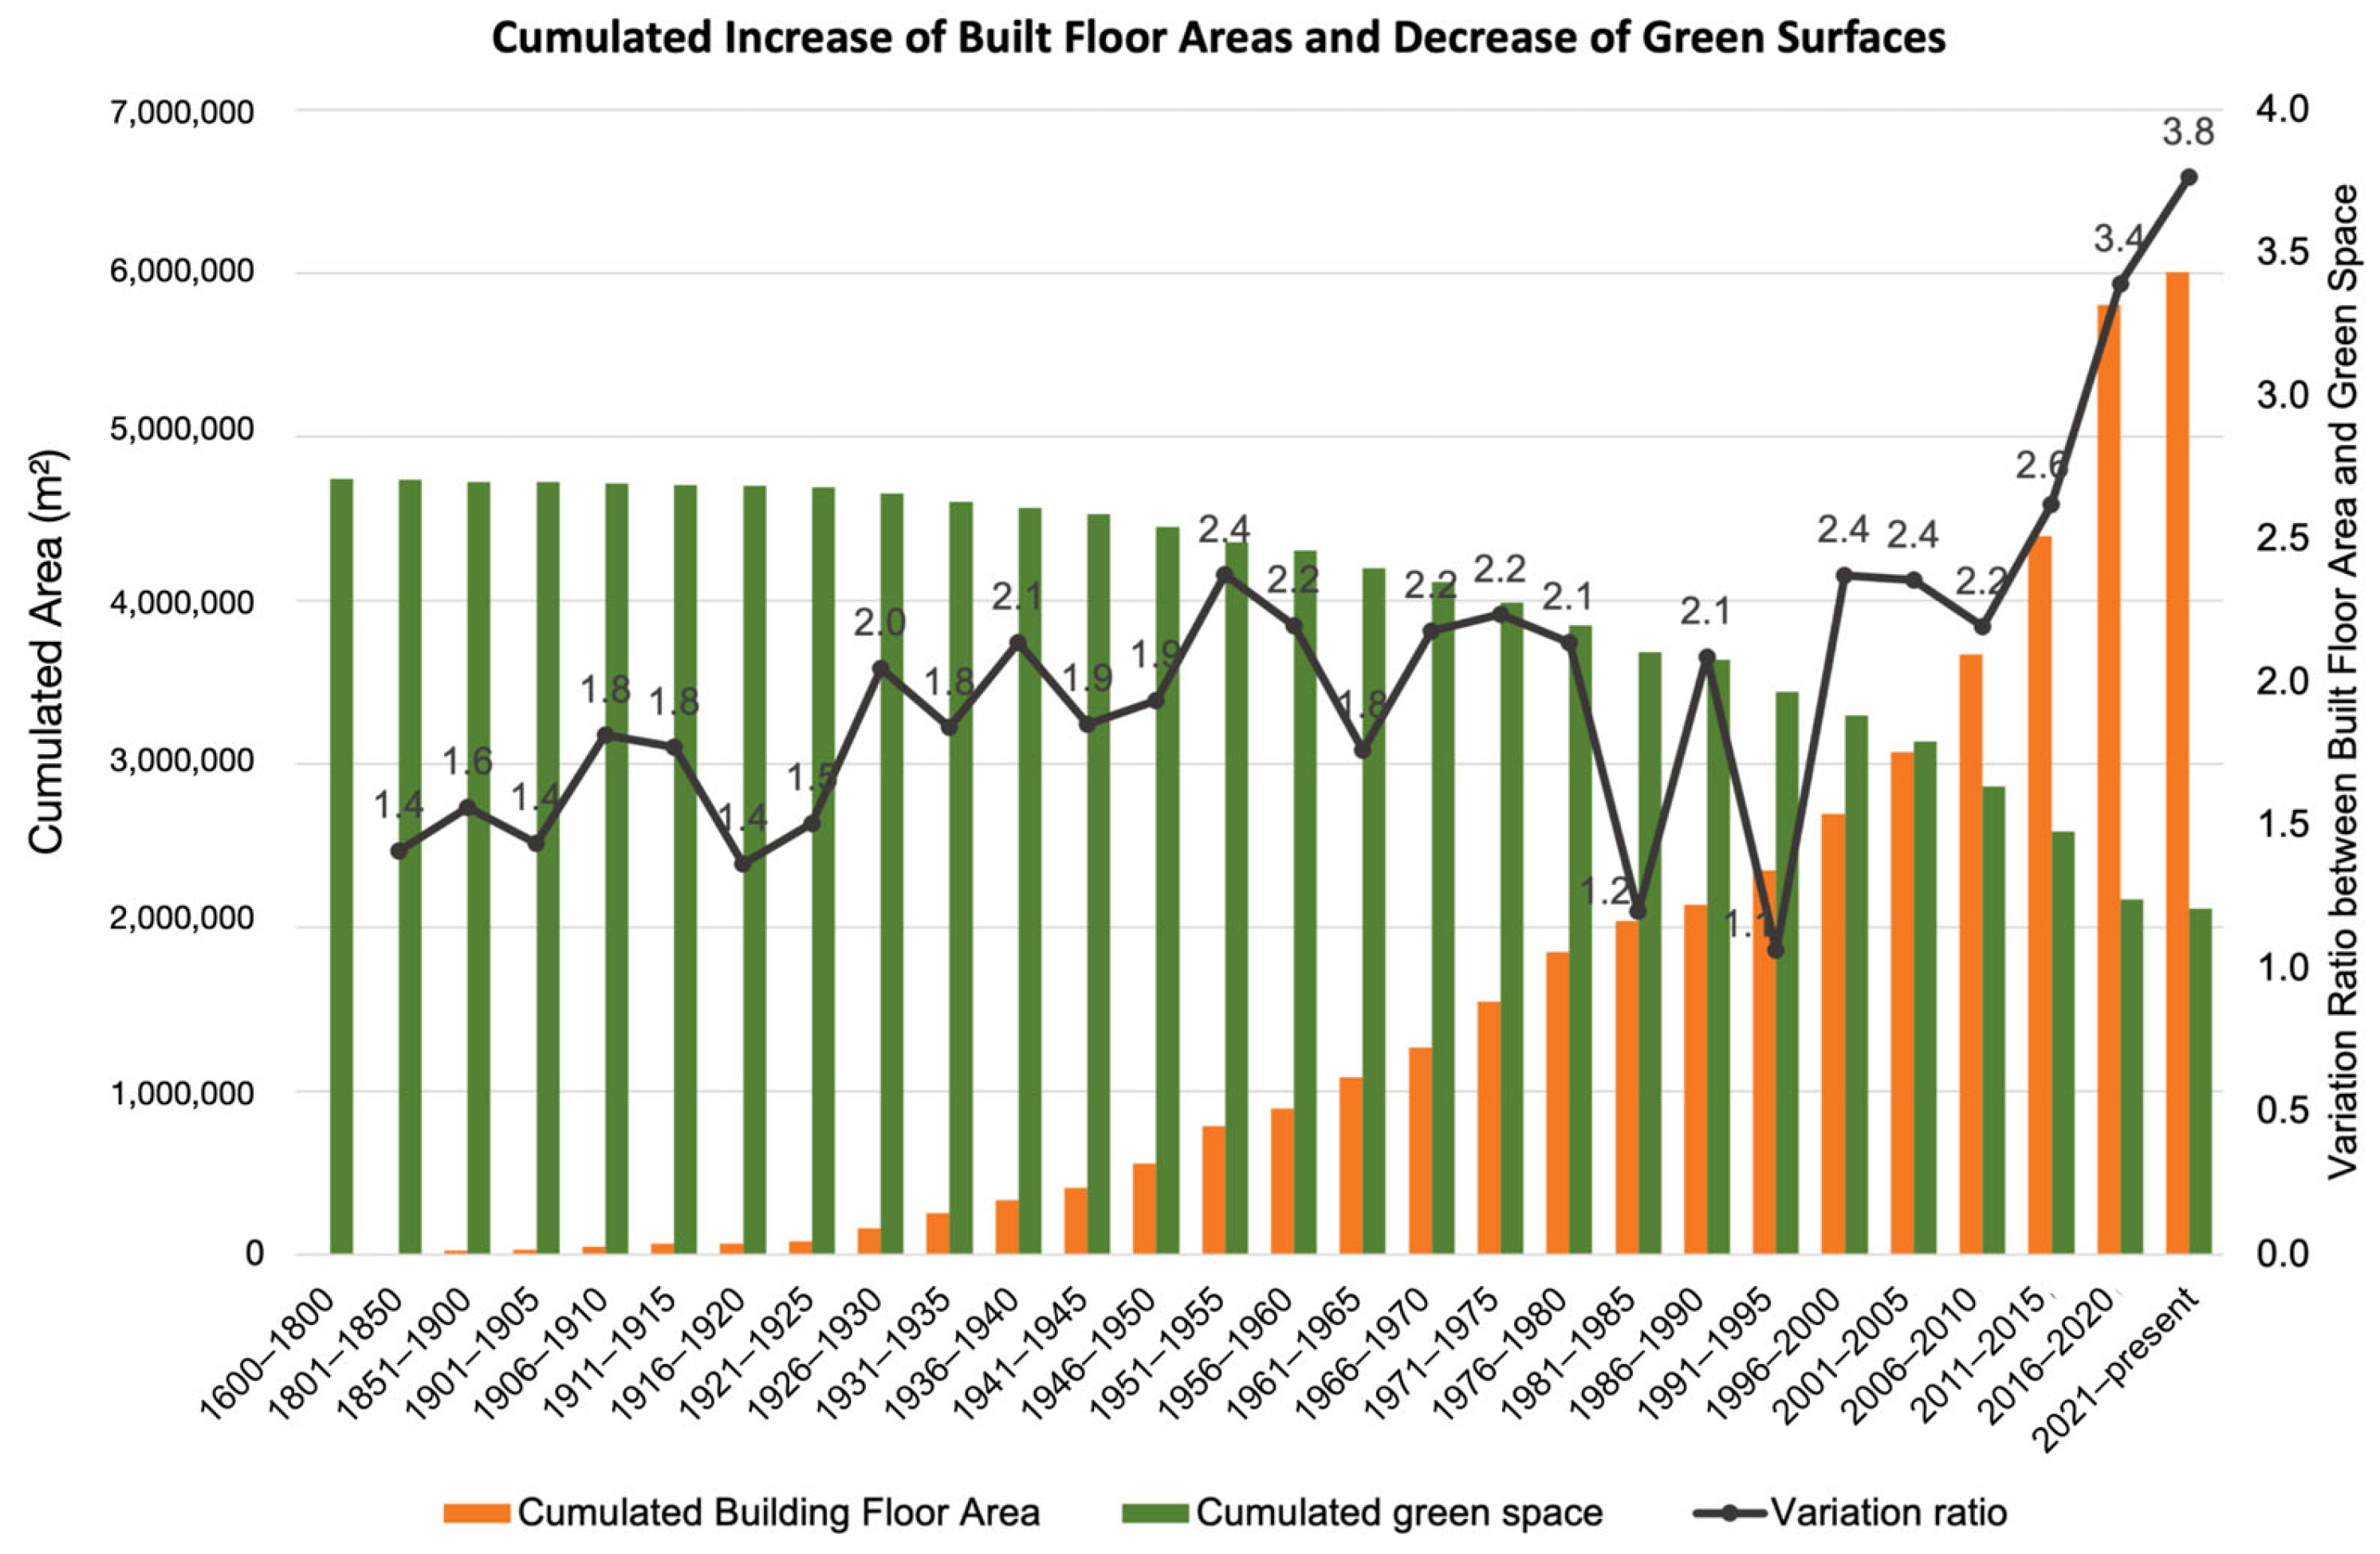
2.3.1. Geographic Data and Building Information
2.3.2. Meteorological Information
2.4. Premises of Densification Calculation and Scenario Analysis
- Recent Buildings: Structures that were built or redeveloped after 1975;
- Rebuildable Buildings: Structures that were constructed or redeveloped between the years 1925 and 1975;
- Remarkable Buildings: Structures that have been preserved for over one hundred years, possess significant historical value, and have not undergone redevelopment since 1925.
2.5. Approaches and Methods for Densification Influencing Urban Forms
2.5.1. Calculating the Demands of Population Growth
| Resident Population | Job Positions | Rate Job/Resident | |
|---|---|---|---|
| Altstetten–Albisrieden 2014 | 50,685 | 47,117 | 0.93 |
| Altstetten–Albisrieden 2020 | 56,610 | 54,001 | 0.954 |
| Altstetten–Albisrieden 2022 | 58,517 | 59,149 | 1.011 |
| Altstetten–Albisrieden 2024 | 59,841 | 64,840 | 1.084 |
| Altstetten–Albisrieden 2040 | 68,100 (+16.4% refer to 2022) | 77,112 (refer to Appendix A.2) | 1.132 |
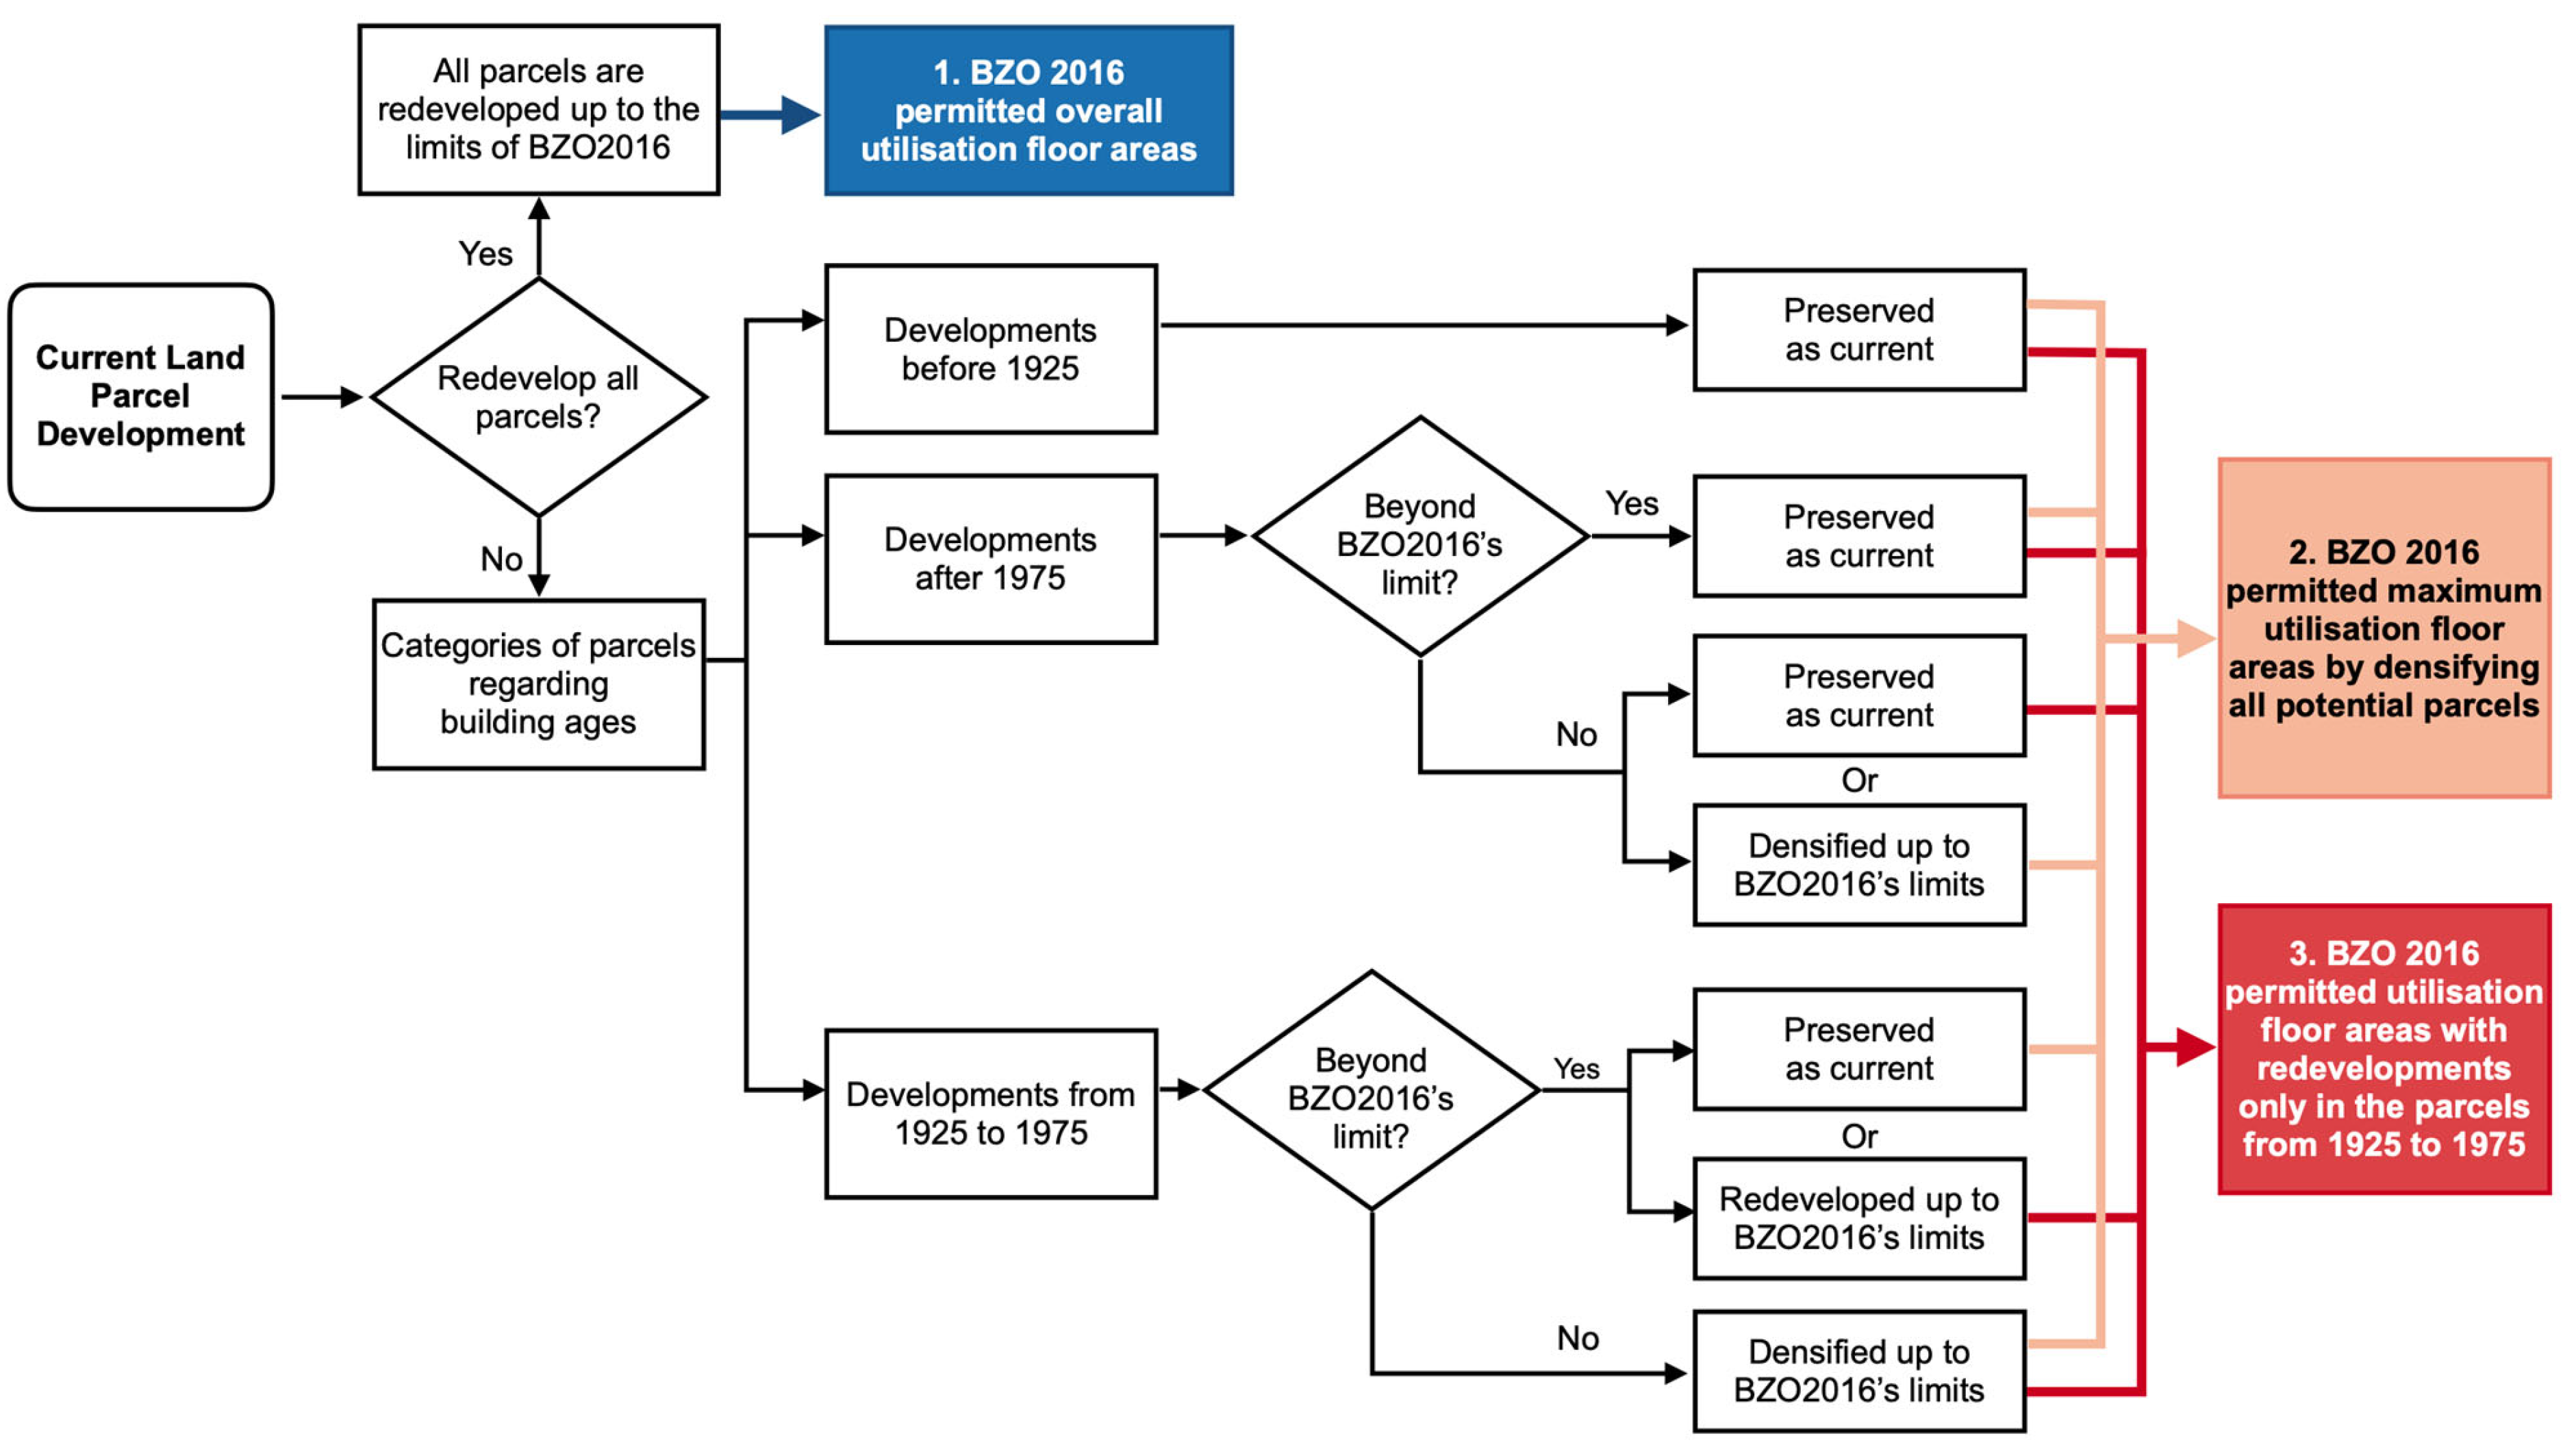
2.5.2. Calculating Permitted Building Floor Areas by BZO2016
2.5.3. Identifying Densification and Urban Redevelopment Means
- Developments after 1975: Considering the addition of floors to the existing structure as the primary measure;
- Developments between 1925 and 1975: Considering building replacement as the principal densification strategy;
- Development before 1925: Preserving the building structure without alteration or densification.
2.5.4. Generating Densification Scenarios over Altstetten–Albisrieden
2.6. Evaluating Densification Impacts on Microclimate in the Urban Environment
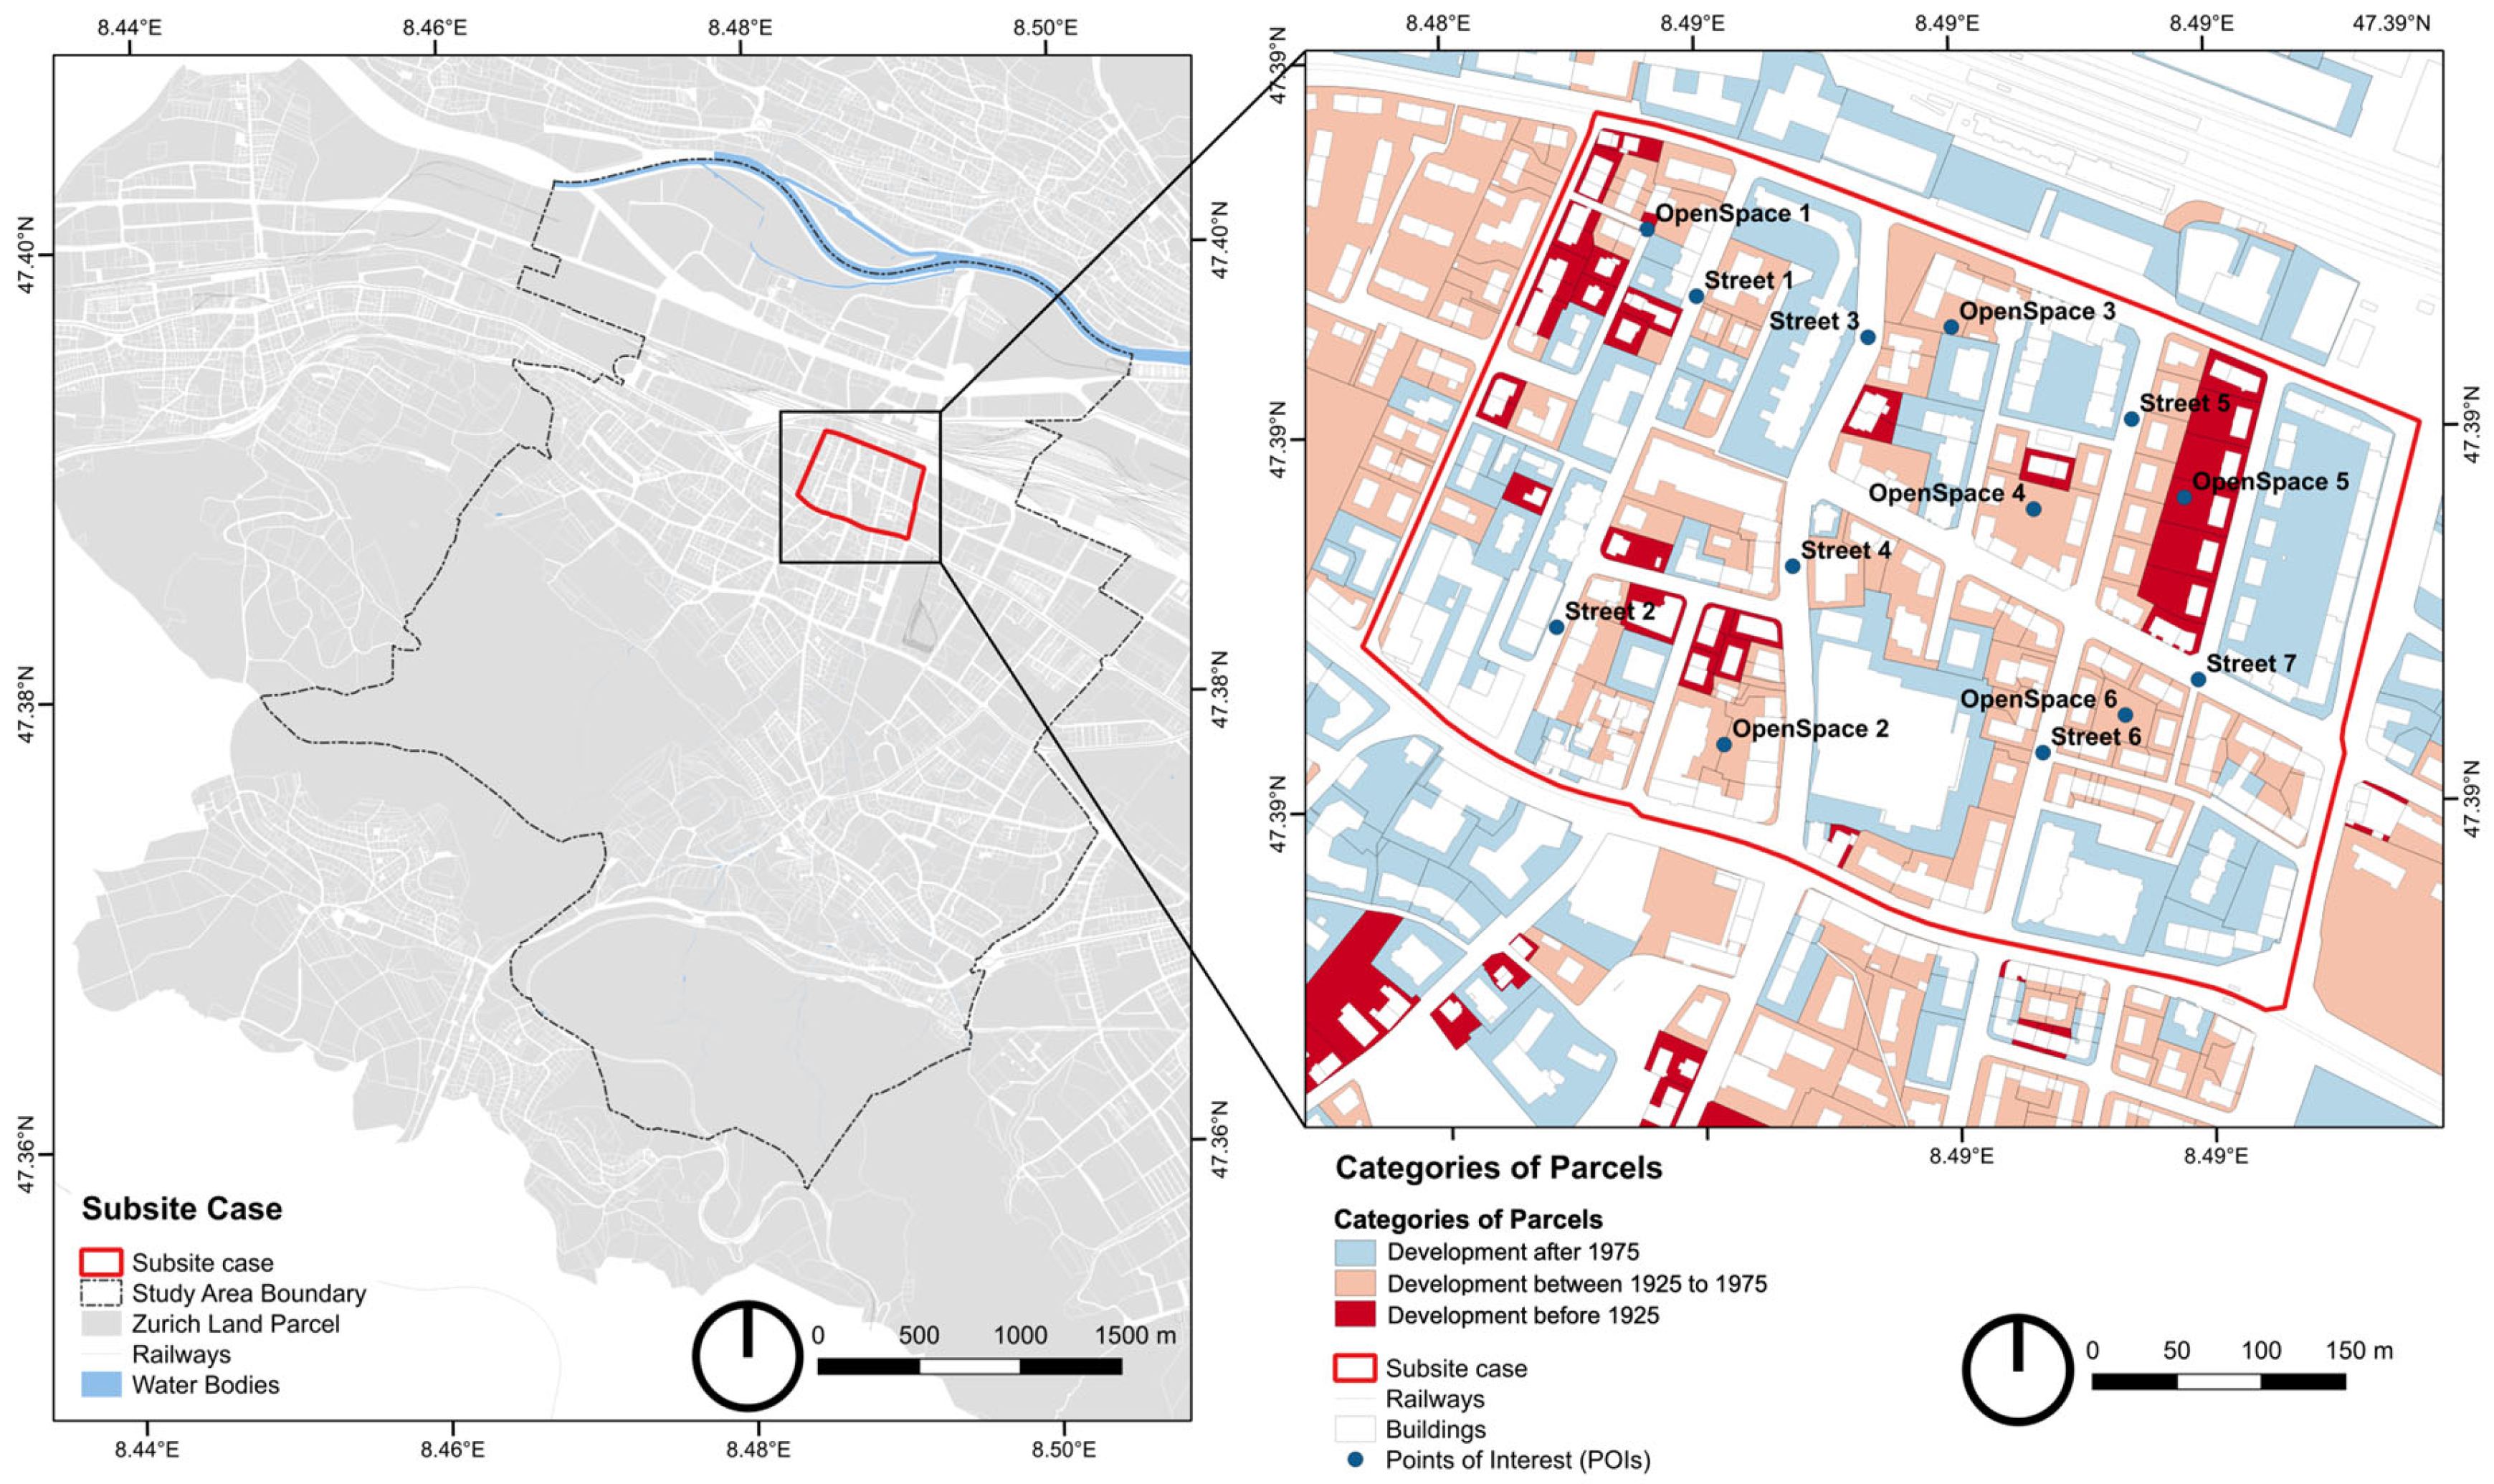
2.6.1. Subsite Area for Densification Modelling and Simulation
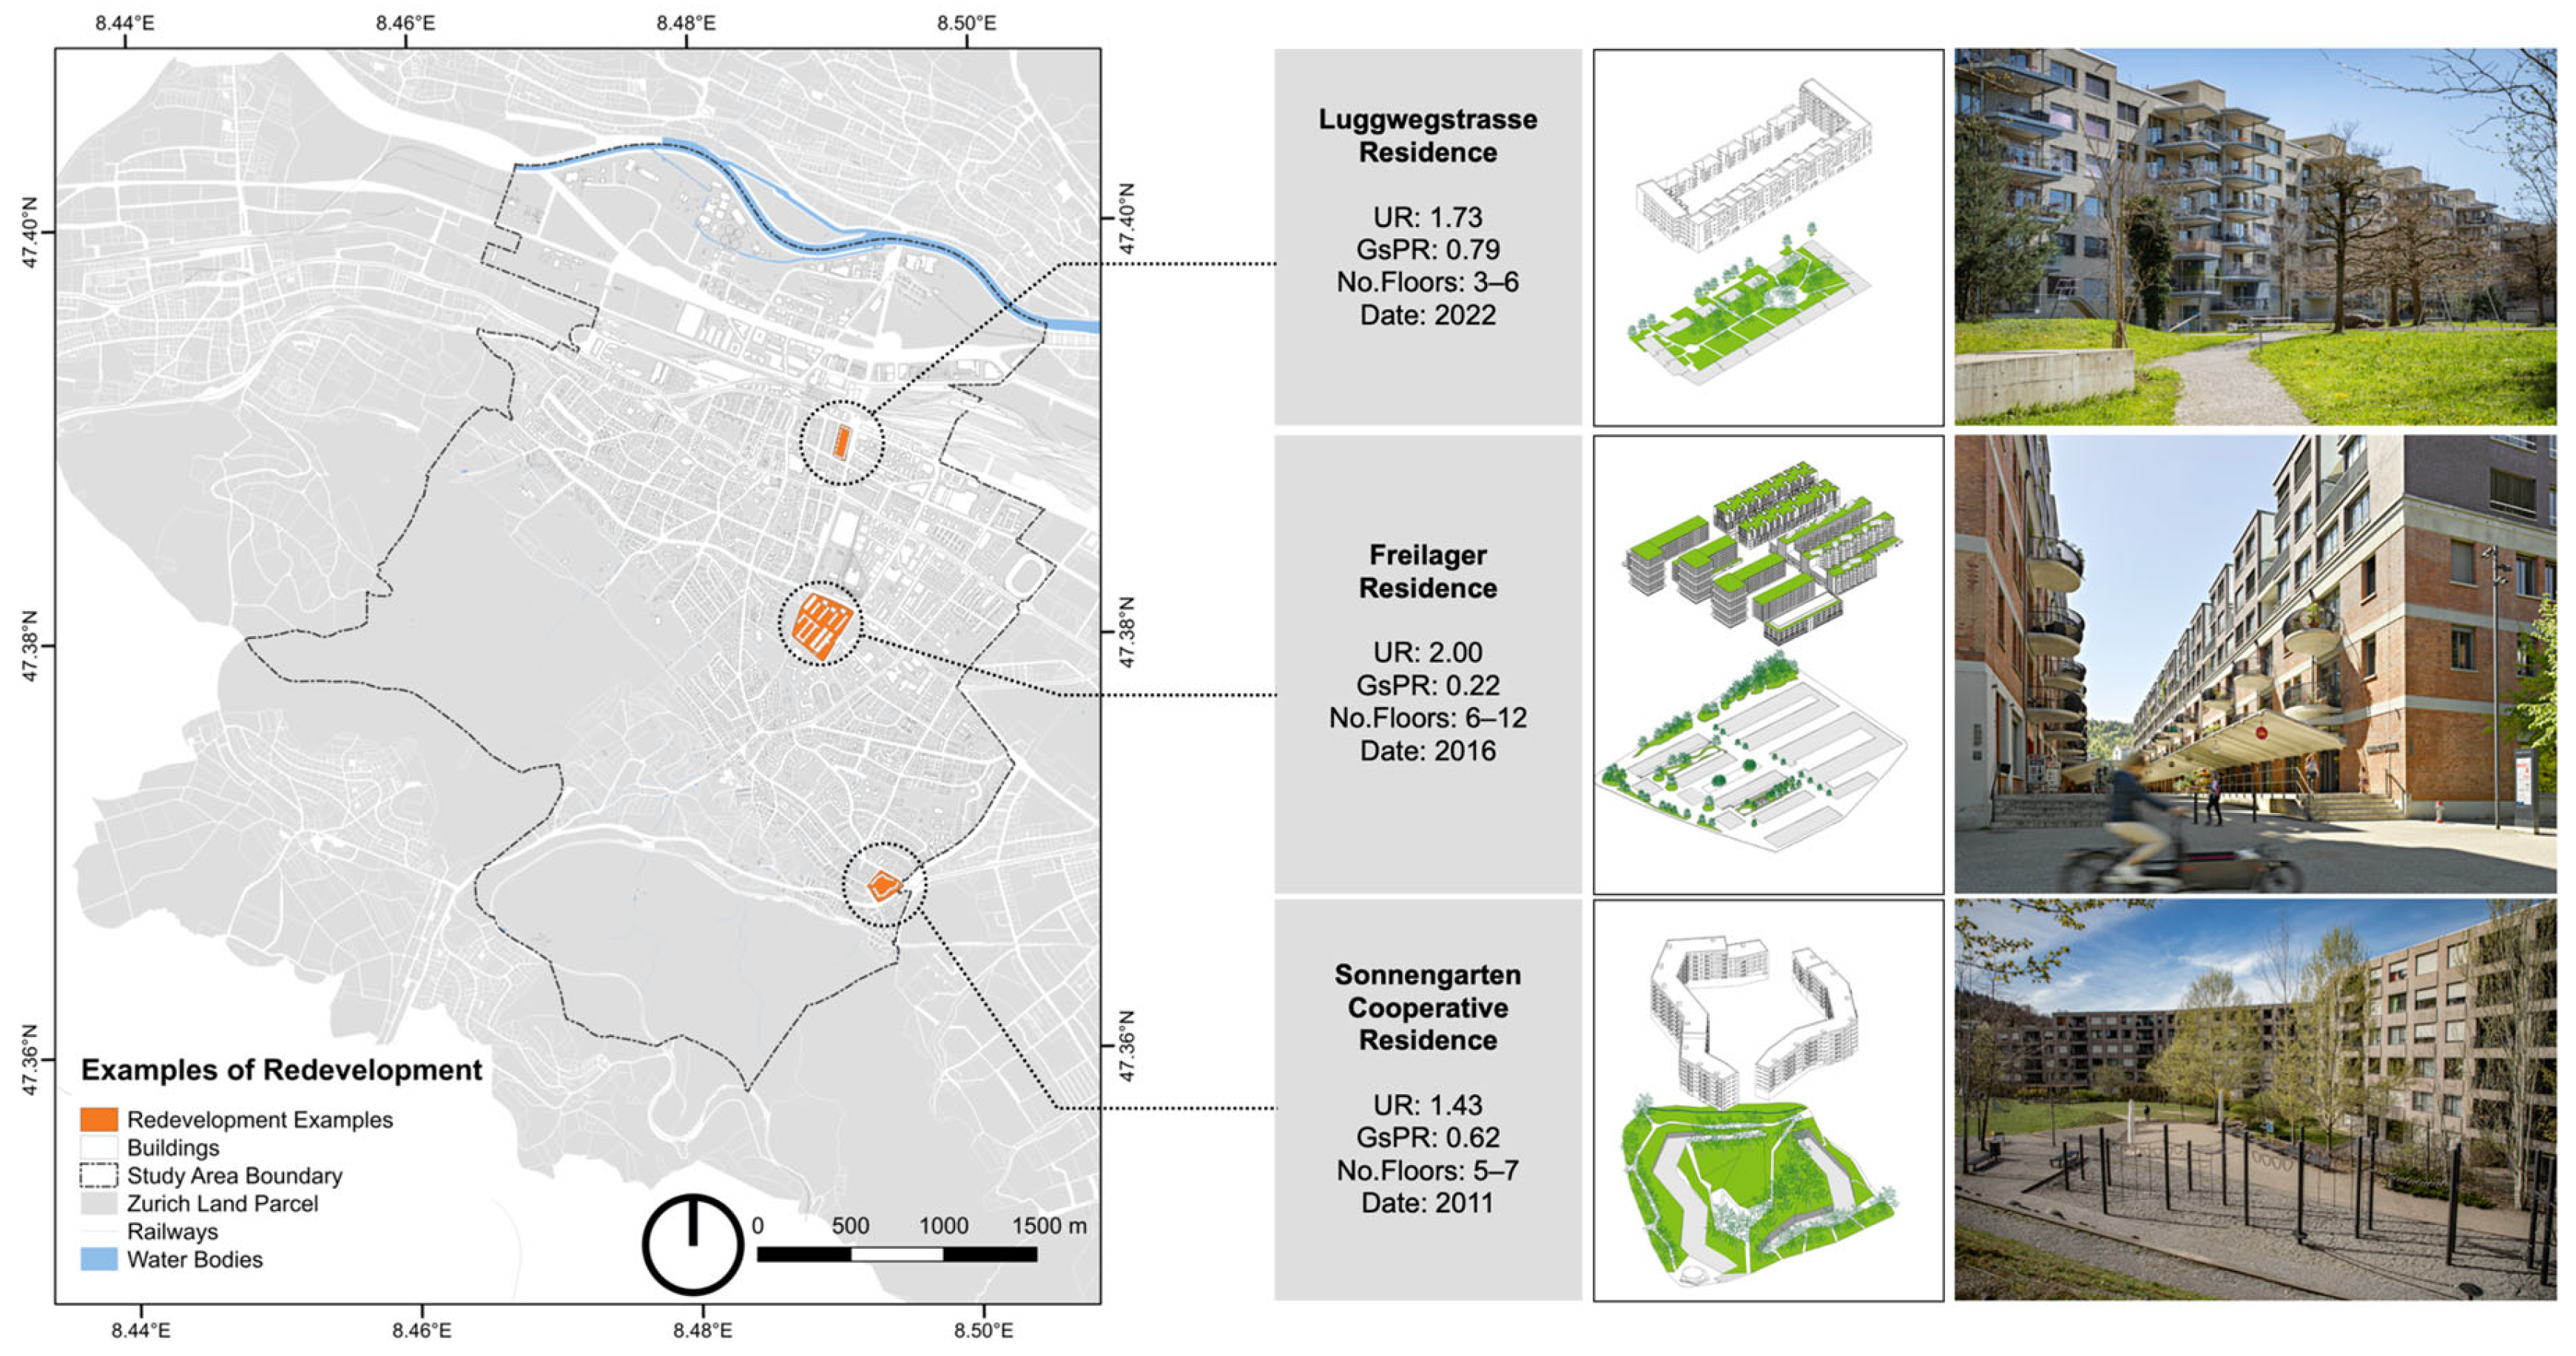
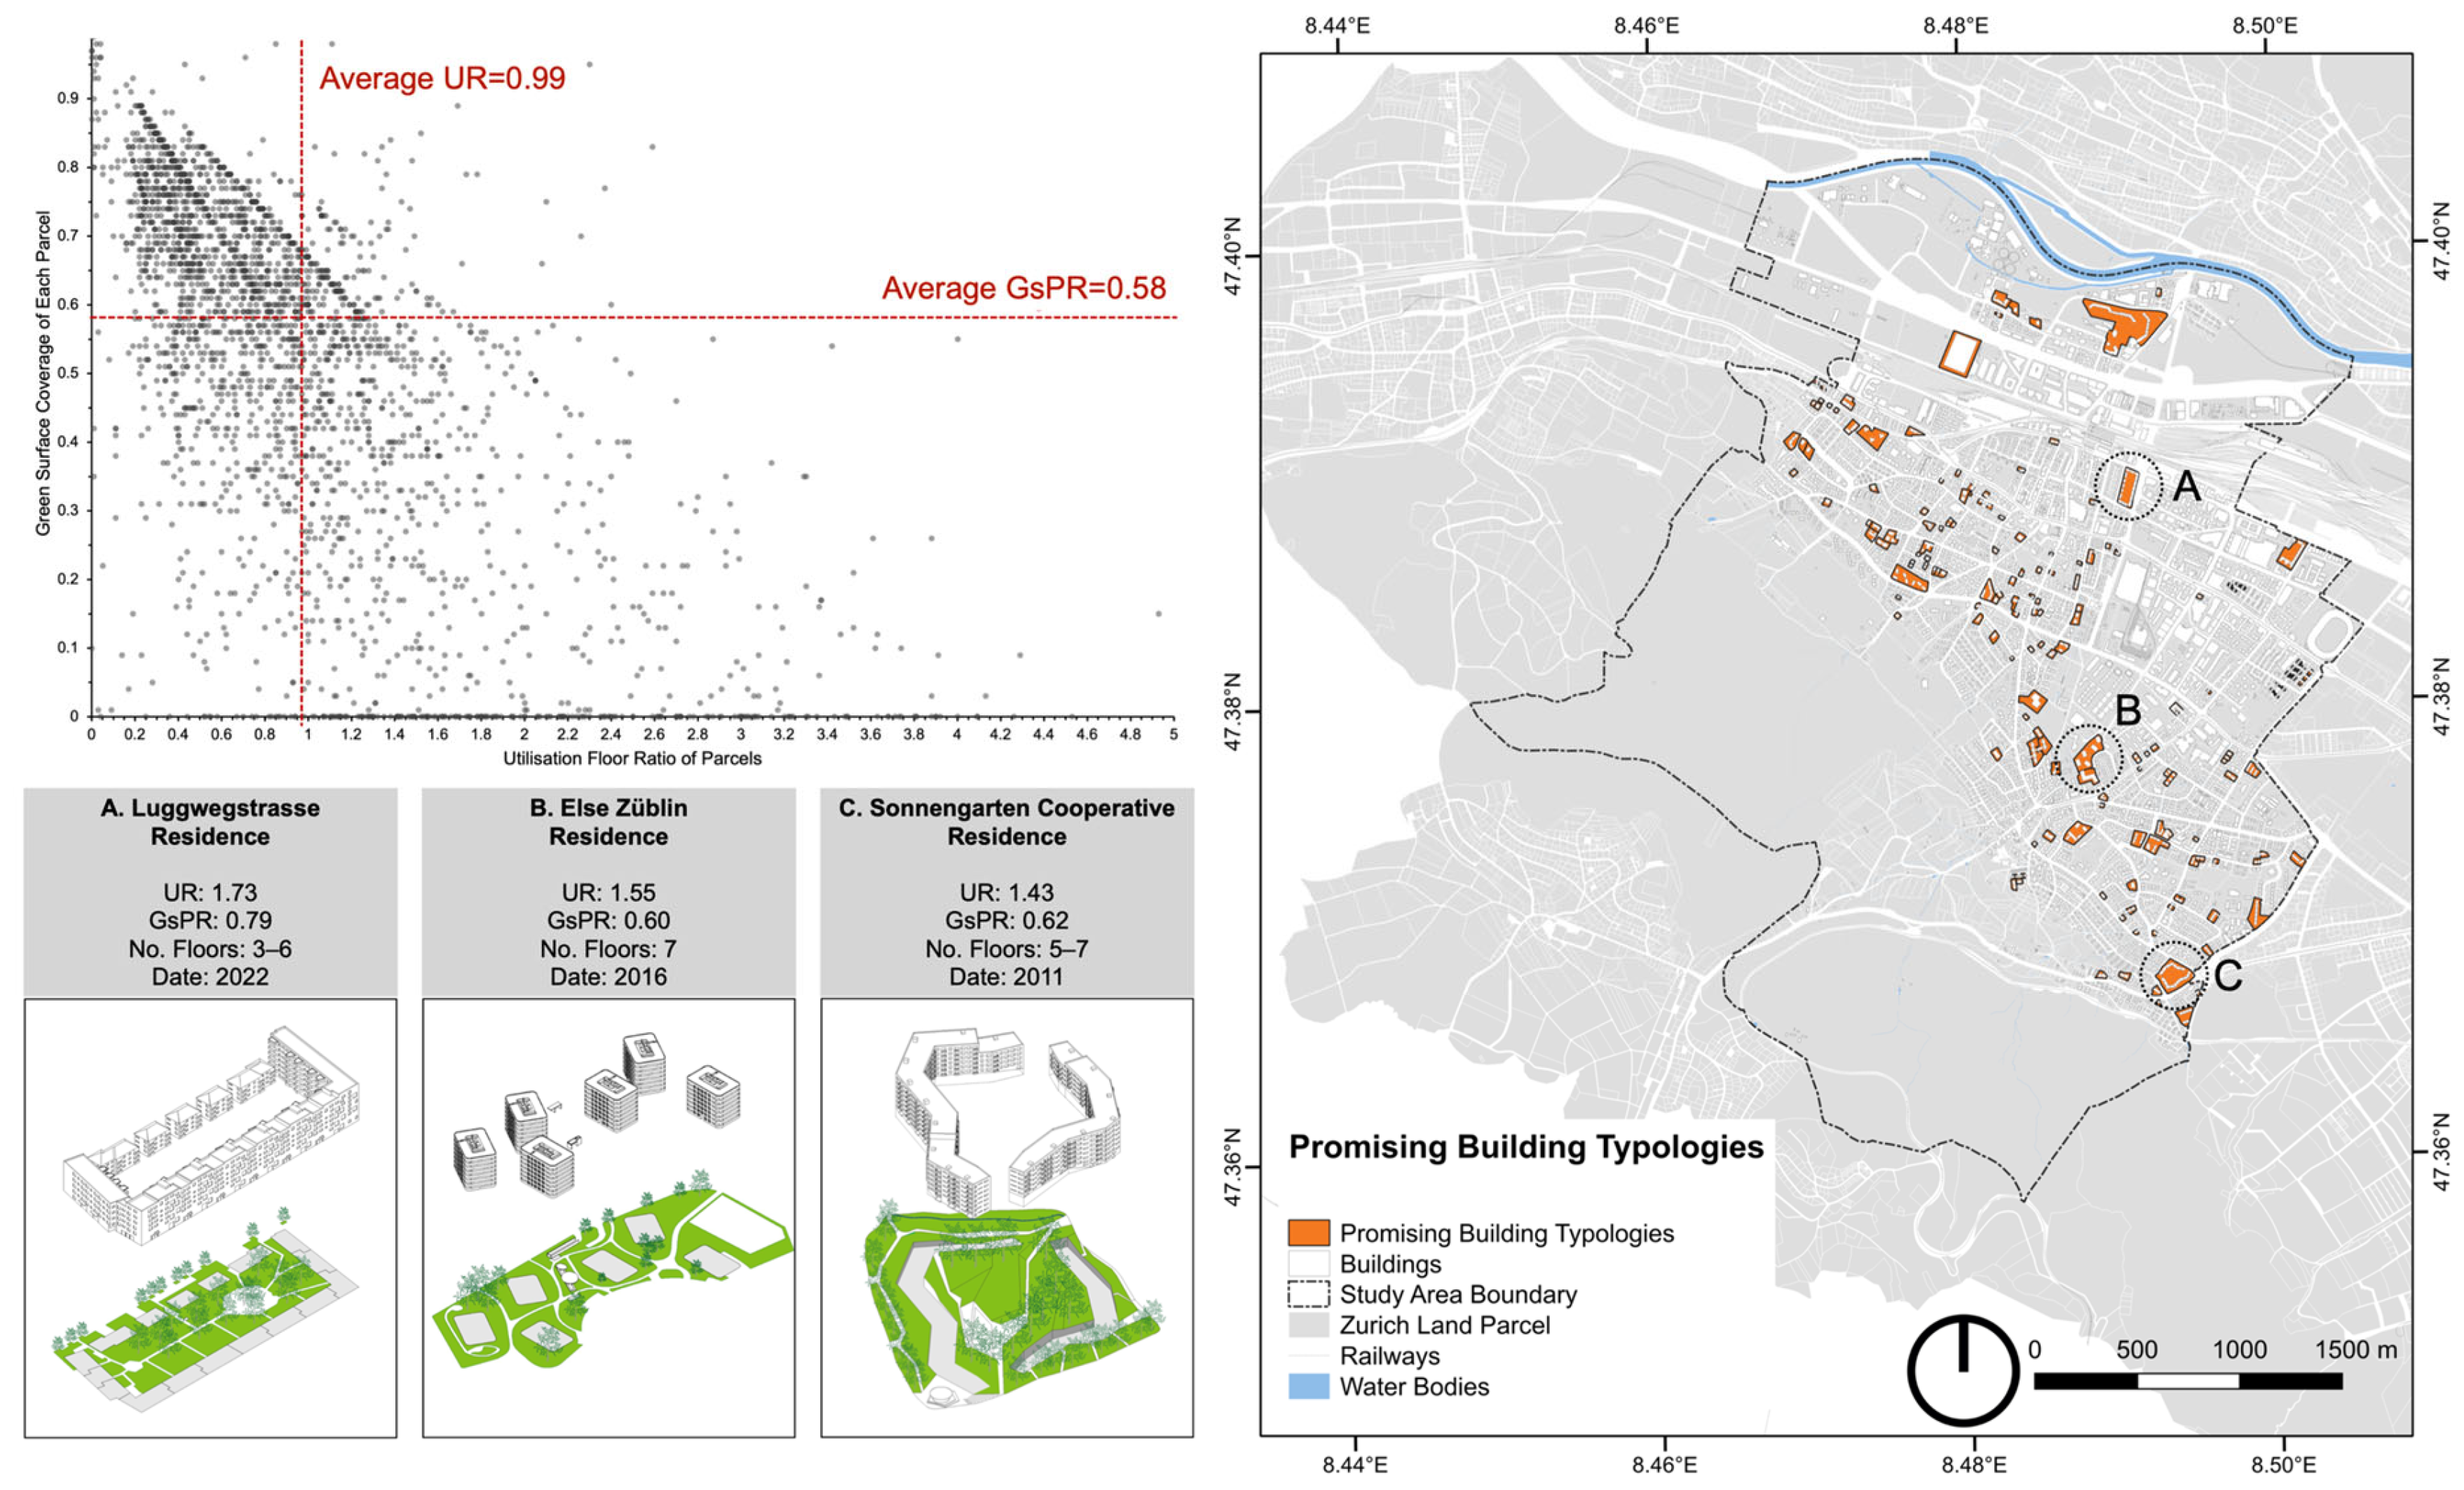
2.6.2. Determining Exemplary Building Geometries for Densification Scenarios
2.6.3. Urban Multi-Scale Environmental Predictor (UMEP)
- First, the study lacked precise information regarding green surfaces and vegetation, particularly concerning trees and plants in private gardens.
- Second, during the modelling of densification scenarios with selected exemplary building geometries, ground surfaces were consequently modified; as there are no universal standards for designing green spaces, the scenario modelling could not establish uniformity in the provision of green surfaces and greenery across all scenarios.
3. Results
3.1. Capacity of BZO2016
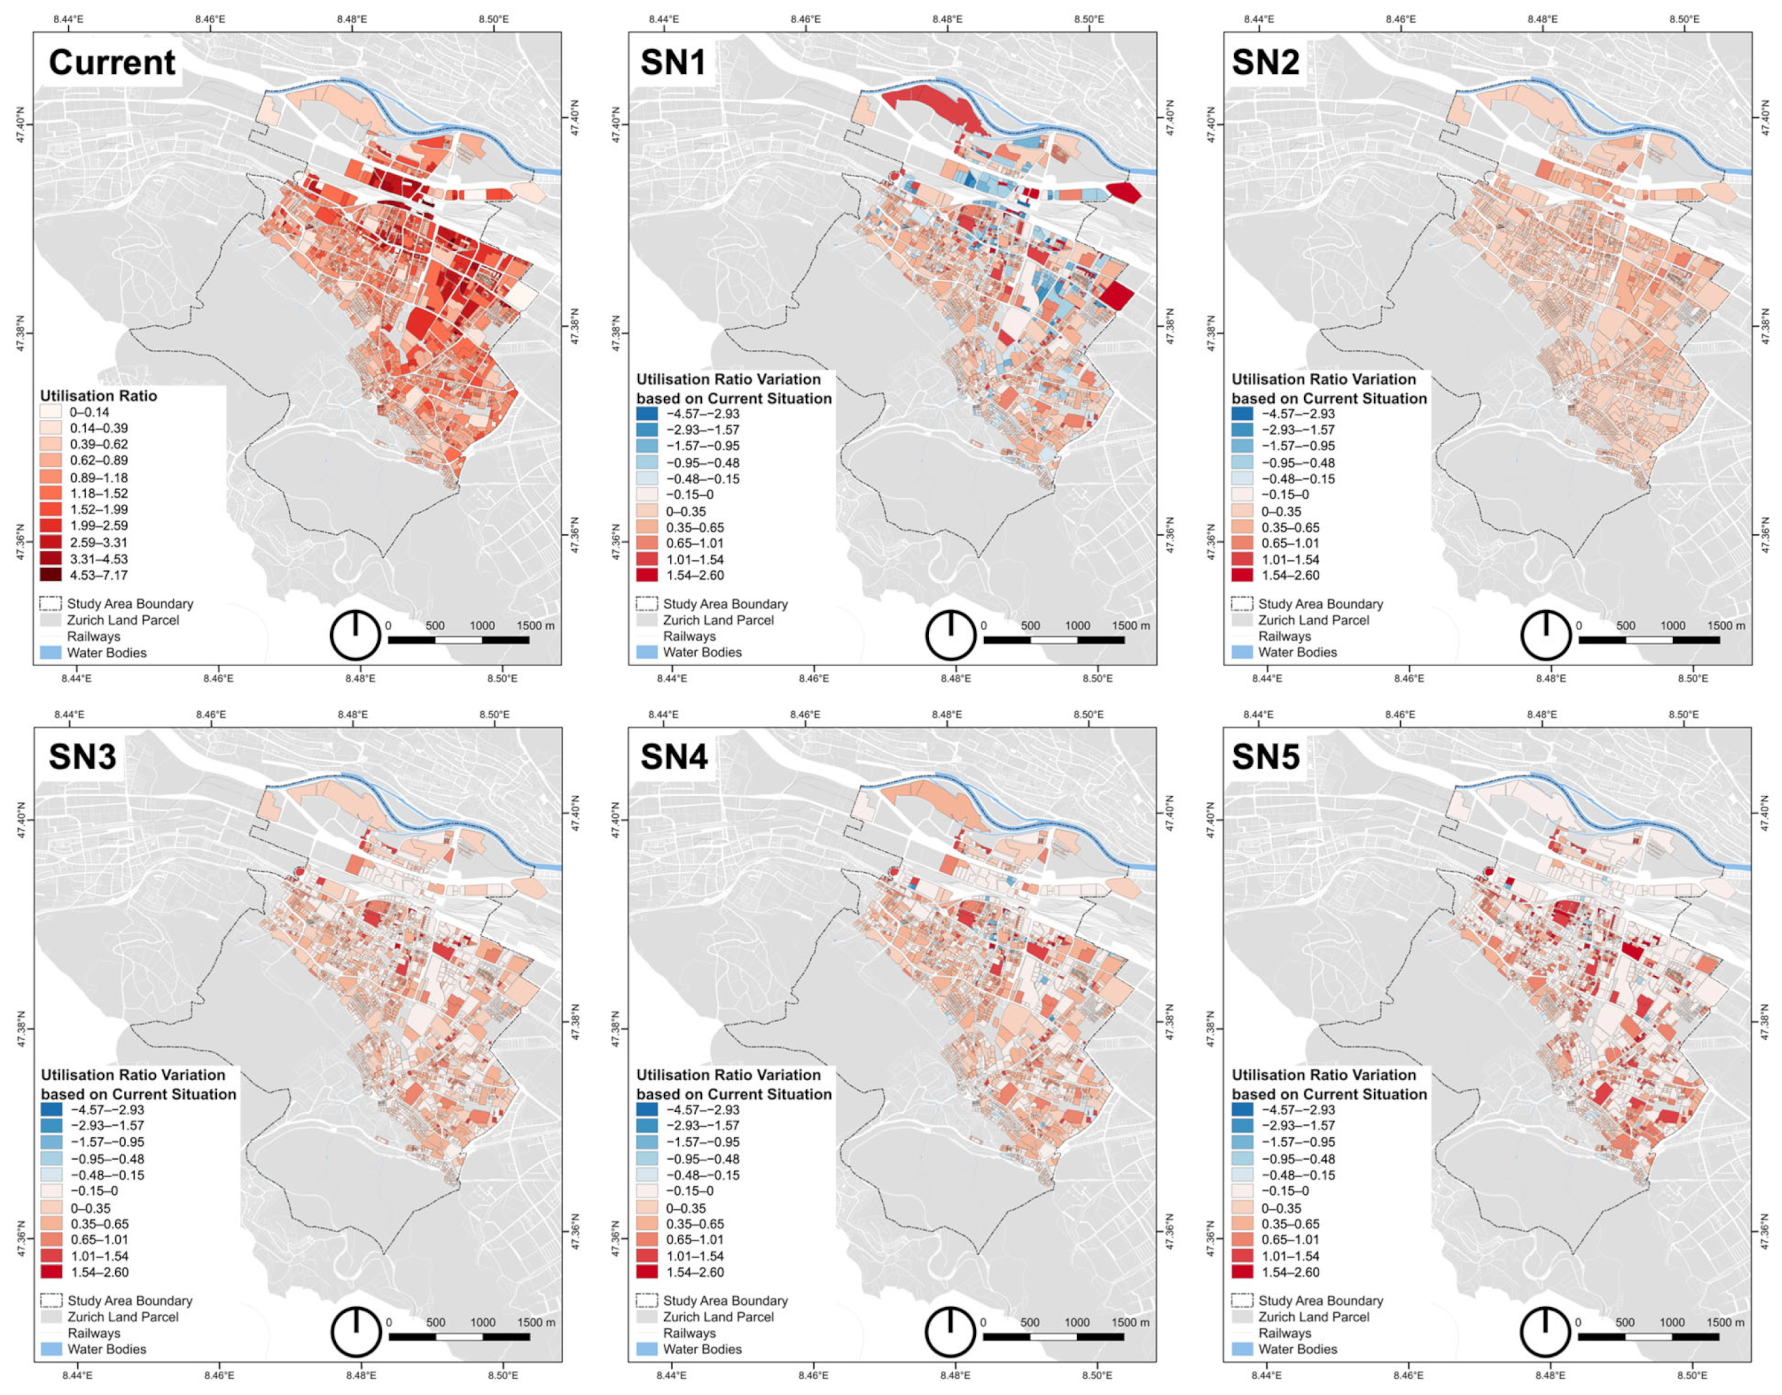
3.2. Densification Scenarios and Their Impacts on Urban Form
- Scenario 1 (SN1): This scenario involved all parcels. All developments were replaced to achieve the maximum UR defined by BZO2016.
- Scenario 2 (SN2): This scenario investigated the addition of one floor to all existing buildings to satisfy the demand for an increased population, excluding developments before 1925 and those within zones where densification is prohibited (Zone K).
- Scenario 3 (SN3): This scenario modelled the maximisation of building density permitted by BZO 2016. It preserved the developments before 1925 while densifying parcels that have not yet reached the limits of BZO2016 within the remaining land parcels. Developments between 1925 and 1975 were replaced, while additional floors were added to developments after 1975.
- Scenario 4 (SN4): This scenario evaluated the moderate densification of developments after 1925. Developments between 1925 and 1975 were replaced in accordance with the restrictions of BZO2016, and additional floors were added to developments after 1975.
- Scenario 5 (SN5): This scenario focused on densification solely within developments between 1925 and 1975. Those developments were replaced with a 27% increase in the UR as defined by BZO2016. All other buildings remained unchanged in accordance with the current situation.
3.3. Impacts on the Simulated Outdoor Thermal Comfort
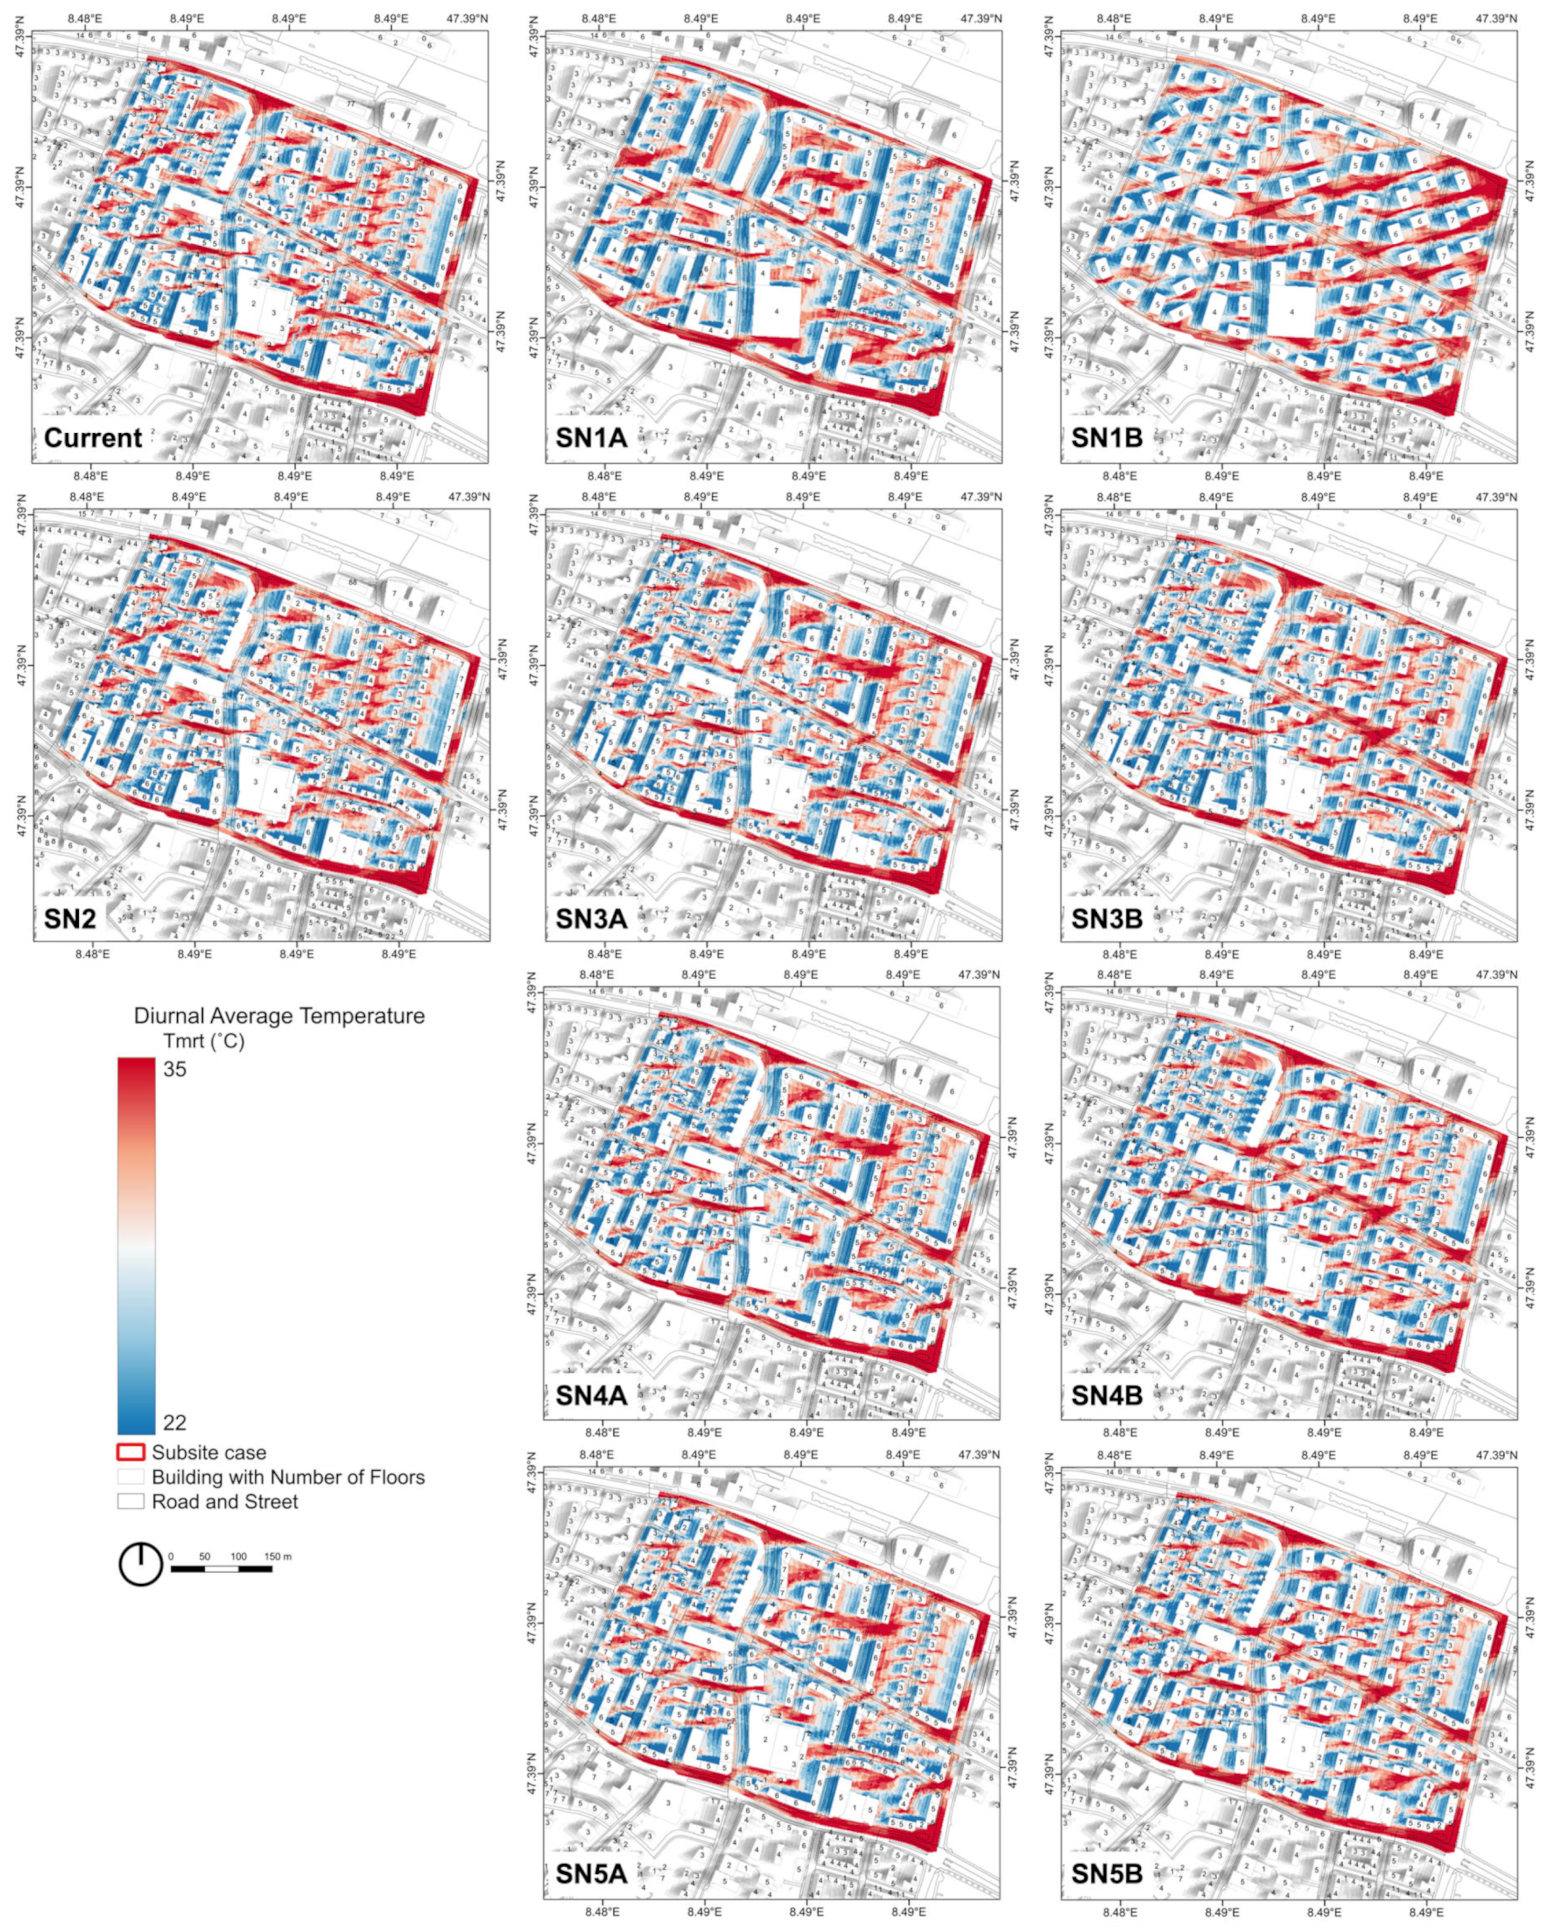
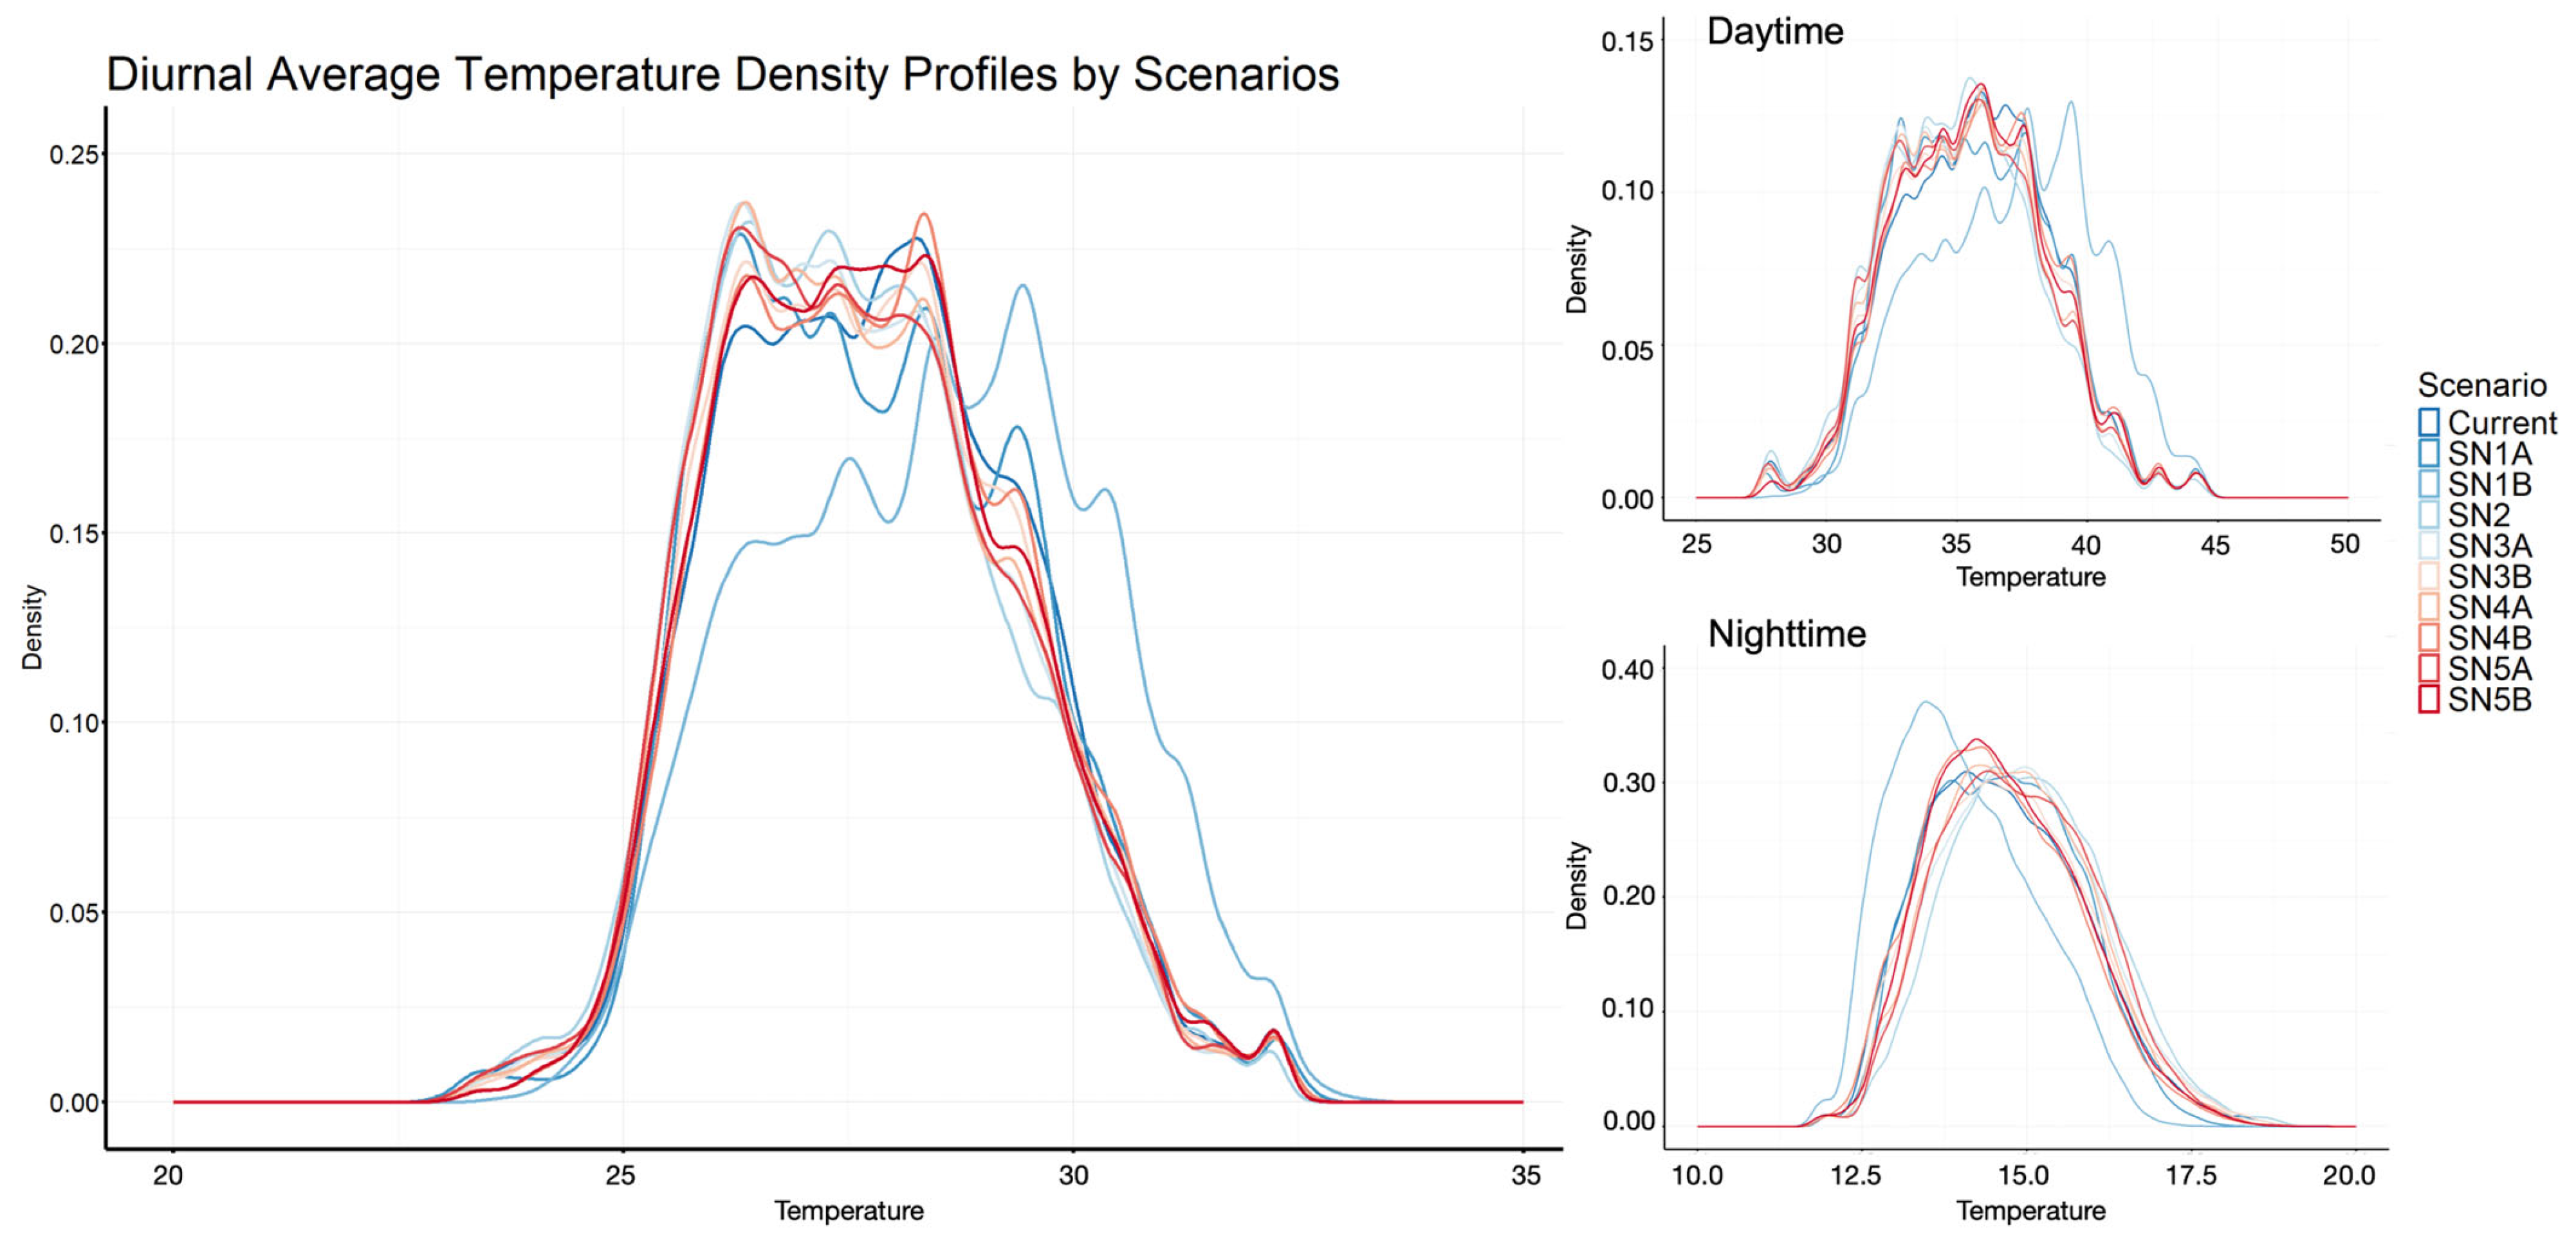
3.3.1. Mean Radiant Temperature over the Subsite Area
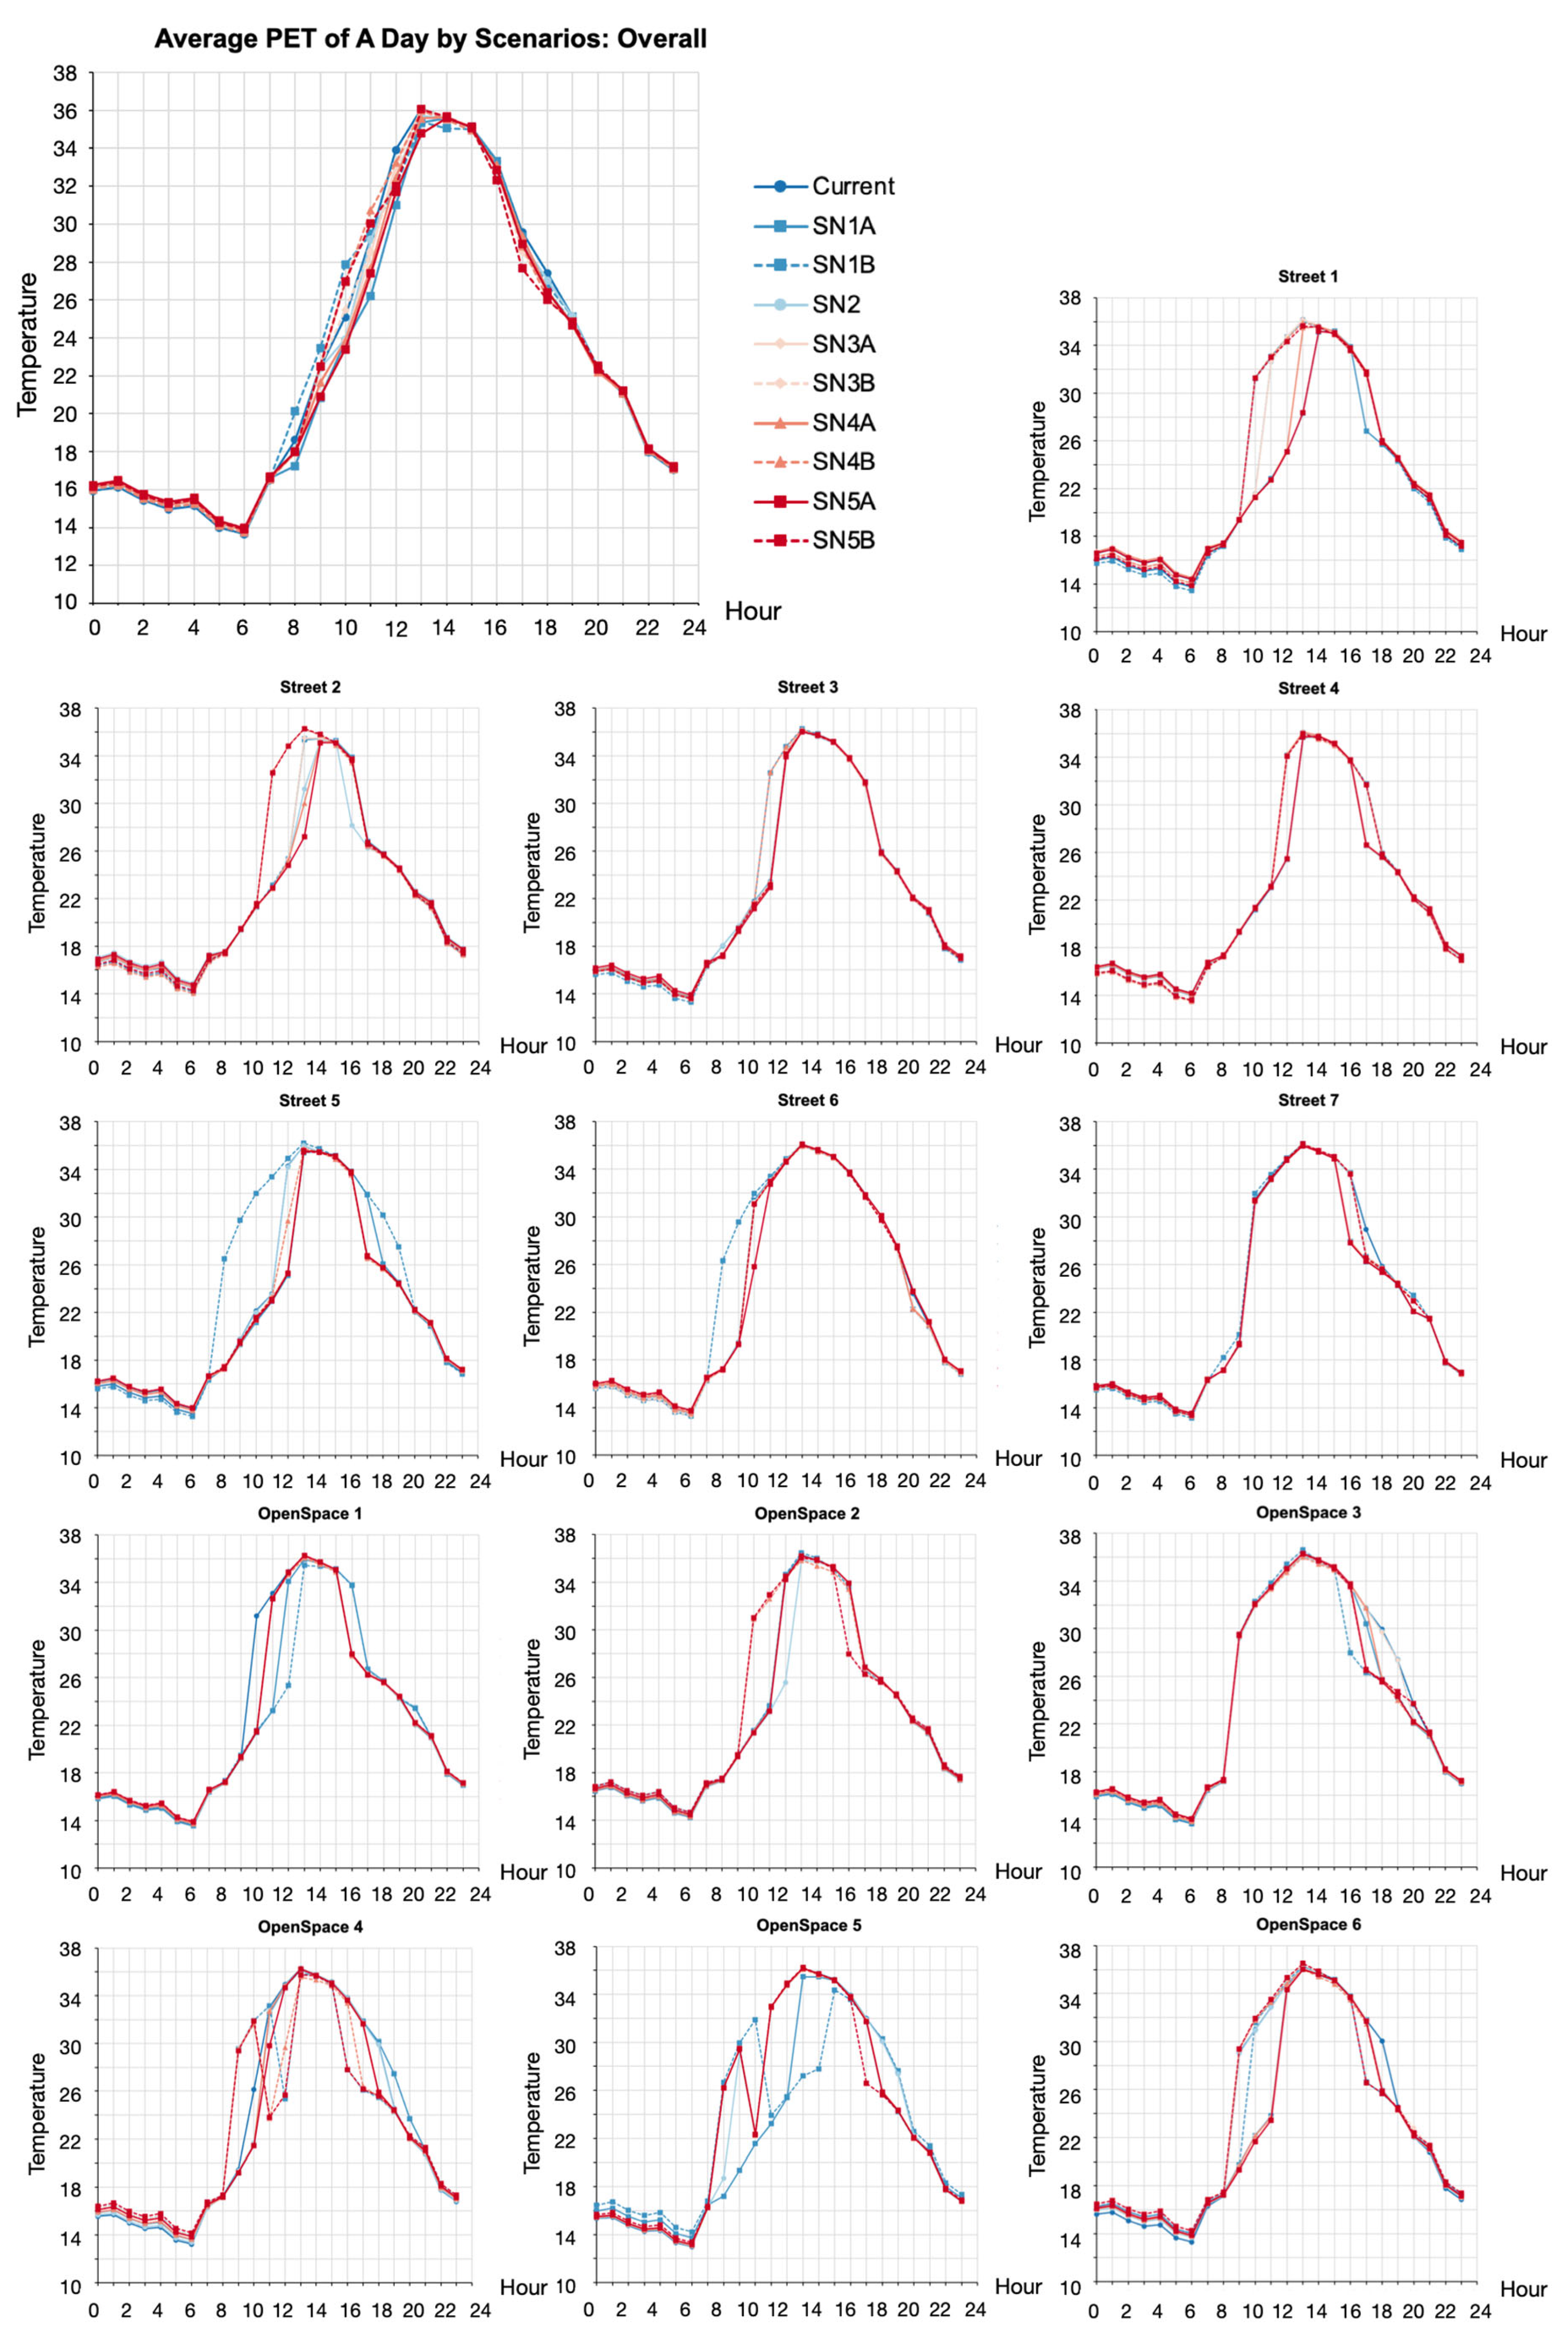
3.3.2. Physiological Equivalent Temperature at POIs
4. Discussion
4.1. Impacts of Densification on Existing Urban Form
4.2. Impacts of Densification on the Overall Mean Radiant Temperature
4.3. Impacts of Densification on PET
4.4. Limitations and Future Development
5. Conclusions
- To accommodate population growth without significantly altering the current urban fabric, it is advisable that future densification strategies incorporate building replacements and the addition of floors to existing structures.
- Densification of buildings can increase shaded areas during the day and contribute to lower temperatures. Nonetheless, it is recommended that building heights should not exceed forty metres within regulatory frameworks to maintain the cooling benefits.
- The simulation additionally indicated a warming effect during the night in most scenarios, implying that the assessment of new urban redevelopment should place a greater emphasis on performance during the blue hours.
- Given the complex interactions affecting outdoor thermal comfort and the microclimate, a more meticulous selection of building geometries should be incorporated in the process of redevelopment and urban transformation.
Author Contributions
Funding
Data Availability Statement
Acknowledgments
Conflicts of Interest
Abbreviations
| BZO2016 | Building and Zoning Regulation, Version 2016 |
| BZO99 | Building and Zoning Regulation, Version 1999 |
| DEM | Digital Elevation Model |
| DSM | Digital Surface Model |
| EPW | Energy Plus Weather |
| FAR | Floor Area Ratio |
| GsPR | Green Surface Plot Ratio |
| PET | Physiological Equivalent Temperature |
| POI | Point of Interest |
| SN1 | Densification Scenario 1 |
| SN1A | Sub-Scenario 1 with Courtyard Geometry |
| SN1B | Sub-Scenario 1 with Tower Geometry |
| SN2 | Densification Scenario 2 |
| SN3 | Densification Scenario 3 |
| SN3A | Sub-Scenario 3 with Courtyard Geometry |
| SN3B | Sub-Scenario 3 with Tower Geometry |
| SN4 | Densification Scenario 4 |
| SN4A | Sub-Scenario 4 with Courtyard Geometry |
| SN4B | Sub-Scenario 4 with Tower Geometry |
| SN5 | Densification Scenario 5 |
| SN5A | Sub-Scenario 5 with Courtyard Geometry |
| SN5B | Sub-Scenario 5 with Tower Geometry |
| SOLWEIG | Solar and Longwave Environmental Irradiance Geometry Model |
| Tmrt | Mean Radiant Temperature |
| UHI | Urban Heat Island |
| UMEP | Urban Multi-Scale Environmental Predictor |
| UR | Utilisation Ratio |
Appendix A. Details in the Methods
Appendix A.1. Collected Data and Information for This Study
| Data/Information | Contents |
|---|---|
| Demographic information | |
| Demographic Statistics of Zurich | Annual statistics of resident population in each quartier and district, as well as projected population until 2045 [51]. |
| Quartierspiegel: Altstetten | Biennial reports of the Quartier, including information of resident population and job positions, of the year 2014, 2020, 2022, and 2024 [38,39,46,48]. |
| Quartierspiegel: Albisrieden | Biennial reports of the Quartier, including information of resident population and job positions, of the year 2014, 2020, 2022, and 2024 [45,47,49,50]. |
| Meteorological information | |
| Repository of Building Simulation Climate Data (Affoltern Zurich Station, period: July 6th to 12th) | Meteorological information formatted in Energy Plus Weather (EPW) acquired from the Ladybug Tools website [40,41]: a year’s worth of hourly measurements, including the following:
|
| Geographic Information | |
| Amtlichen Vermessung (Official Survey) | 2D open-source data of Zurich, including Building information:
|
| 3D-Blockmodell LoD1 (3D Building Block Model) | 3D open-source building model of Zurich, including Building information:
|
| SwissALTI3D | Open-source digital elevation model of Switzerland |
| Zoning Plans | |
| Zonenplan 1999 and 2016 (Zoning Plan 1999 and 2016) | The shapefile and regulations of the zoning plan developed in 1999 and 2016, including land parcel development rules:
|
Appendix A.2. Correlation Between Resident Population and Job Positions in Altstetten–Albisrieden

Appendix A.3. Input Information for the SOLWEIG Model Simulation in UMEP
| Input Information | Description |
|---|---|
| Spatial data | |
| Building and ground DSM | Generated by Pre-Processor of UMEP, based on scenario building shapefiles and DEM of Zurich, 1 m by 1 m resolution |
| SkyViewFactor | Generated by Pre-Processor of UMEP, based on scenario building shapefiles |
| Vegetation scheme (optional) | No |
| Land cover scheme (optional) | No |
| Ground DEM | DEM of Zurich, 1 m by 1 m resolution |
| Save generated building grid | Yes |
| Wall aspect raster | Generated by Pre-Processor of UMEP, based on scenario building shapefiles |
| Wall height raster | Generated by Pre-Processor of UMEP, based on scenario building shapefiles |
| Use anisotropic model | No |
| Meteorological data | |
| Use continuous meteorological dataset | Yes, converted by Pre-Processor of UMEP, based on the meteorological data downloaded from EPW map: Affoltern Zurich Station, period: July 6th to 12th |
| UTC offset (hours) | 2 |
| Environmental parameters | |
| Emissivity (walls) | 0.90 |
| Emissivity (ground) | 0.95 |
| Albedo (walls) | 0.20 |
| Albedo (ground) | 0.15 |
| Tmrt parameters | |
| Absorption of shortwave radiation | 0.70 |
| Absorption of longwave radiation | 0.95 |
| Posture of the body | Standing |
| PET parameters | |
| Age | 35 |
| Weight (kg) | 75.0 |
| Activity (w) | 80.0 |
| Height (cm) | 180 |
| Clothing (clo) | 0.90 |
| Sex | male |
| Include POIs | Yes, the shapefile generated in QGIS |
| Consider human as cylinder | Yes |
References
- Swiss Federal Council. Sustainable Development Strategy 2016–2019; Swiss Federal Council: Bern, Switzerland, 2016; Available online: https://www.are.admin.ch/are/en/home/media/publications/sustainable-development/strategie-nachhaltige-entwicklung-2016---2019.html (accessed on 19 March 2023).
- Jenks, M.; Burton, E.; Williams, K. (Eds.) The Compact City: A Sustainable Urban form? 1st ed.; E & FN Spon: London, UK, 1996. [Google Scholar]
- Gehl, J.; Rogers, L.R. Cities for People; Island Press: Washington, DC, USA, 2010. [Google Scholar]
- Tillie, N.; Borsboom-van Beurden, J.; Doepel, D.; Aarts, M. Exploring a Stakeholder Based Urban Densification and Greening Agenda for Rotterdam Inner City—Accelerating the Transition to a Liveable Low Carbon City. Sustainability 2018, 10, 1927. [Google Scholar] [CrossRef]
- Li, Y.; Schubert, S.; Kropp, J.P.; Rybski, D. On the influence of density and morphology on the Urban Heat Island intensity. Nat. Commun. 2020, 11, 2647. [Google Scholar] [CrossRef]
- Loibl, W.; Vuckovic, M.; Etminan, G.; Ratheiser, M.; Tschannett, S.; Österreicher, D. Effects of Densification on Urban Microclimate—A Case Study for the City of Vienna. Atmosphere 2021, 12, 511. [Google Scholar] [CrossRef]
- Chapman, S.; Watson, J.E.M.; Salazar, A.; Thatcher, M.; McAlpine, C.A. The impact of urbanization and climate change on urban temperatures: A systematic review. Landsc. Ecol. 2017, 32, 1921–1935. [Google Scholar] [CrossRef]
- Nasar-u-Minallah, M.; Haase, D.; Qureshi, S.; Zia, S.; Fatima, M. Ecological monitoring of urban thermal field variance index and determining the surface urban heat island effects in Lahore, Pakistan. Environ. Monit. Assess. 2023, 195, 1212. [Google Scholar] [CrossRef]
- Deng, X.; Cao, Q.; Wang, L.; Wang, W.; Wang, S.; Wang, S.; Wang, L. Characterizing urban densification and quantifying its effects on urban thermal environments and human thermal comfort. Landsc. Urban Plan. 2023, 237, 104803. [Google Scholar] [CrossRef]
- Lan, H.; Lau, K.K.-L.; Shi, Y.; Ren, C. Improved urban heat island mitigation using bioclimatic redevelopment along an urban waterfront at Victoria Dockside, Hong Kong. Sustain. Cities Soc. 2021, 74, 103172. [Google Scholar] [CrossRef]
- Li, J.; Yang, Z.; Zhao, X.; Li, Y.; Huang, X.; Chen, Y.; Shi, F. Study of the Correlation between the Urban Wind–Heat Environment and Urban Development Elements in High-Density Urban Areas: A Case Study of Central Shanghai. Buildings 2024, 14, 315. [Google Scholar] [CrossRef]
- Chen, X.; Yang, J.; Zhu, R.; Wong, M.S.; Ren, C. Spatiotemporal impact of vehicle heat on urban thermal environment: A case study in Hong Kong. Build. Environ. 2021, 205, 108224. [Google Scholar] [CrossRef]
- Chow, W.T.L.; Salamanca, F.; Georgescu, M.; Mahalov, A.; Milne, J.M.; Ruddell, B.L. A multi-method and multi-scale approach for estimating city-wide anthropogenic heat fluxes. Atmos. Environ. 2014, 99, 64–76. [Google Scholar] [CrossRef]
- Fung, K.Y.; Tam, C.; Lee, T.C.; Wang, Z. Comparing the Influence of Global Warming and Urban Anthropogenic Heat on Extreme Precipitation in Urbanized Pearl River Delta Area Based on Dynamical Downscaling. J. Geophys. Res. Atmos. 2021, 126, e2021JD035047. [Google Scholar] [CrossRef]
- Iamarino, M.; Beevers, S.; Grimmond, C.S.B. High-resolution (space, time) anthropogenic heat emissions: London 1970–2025. Int. J. Climatol. 2012, 32, 1754–1767. [Google Scholar] [CrossRef]
- Singh, V.K.; Mughal, M.O.; Martilli, A.; Acero, J.A.; Ivanchev, J.; Norford, L.K. Numerical analysis of the impact of anthropogenic emissions on the urban environment of Singapore. Sci. Total Environ. 2022, 806, 150534. [Google Scholar] [CrossRef]
- Wanner, H.; Hertig, J.-A. Studies of Urban Climates and Air Pollution in Switzerland. J. Clim. Appl. Meteorol. 1984, 23, 1614–1625. [Google Scholar] [CrossRef][Green Version]
- Canton, J.; Dipankar, A. Climatological analysis of urban heat island effects in Swiss cities. Int. J. Climatol. 2024, 44, 1549–1565. [Google Scholar] [CrossRef]
- Federal Office of Meteorology and Climatology MeteoSwiss. (n.d.). Urban Heat. The Climate of Switzerland. Retrieved 13 May 2025. Available online: https://www.meteoswiss.admin.ch/climate/the-climate-of-switzerland/urban-heat.html#:~:text=In%20Swiss%20cities%2C%20the%20temperature%20at%20night,higher%20than%20in%20the%20surrounding%20rural%20areas.&text=In%20the%20”No%20climate%20change%20mitigation”%20scenario%2C,year%20by%20the%20end%20of%20this%20century (accessed on 13 May 2025).
- Center for Climate System Modeling; Federal Office of Meteorology and Climatology MeteoSwiss; ETH Zurich, NCCR Climate Swiss Climate Research; Organe Consultatif sur les Changements Climatiques. Swiss Climate Change Scenarios CH2011; C2SM, MeteoSwiss, ETH, NCCR Climate, and OcCC: Zurich, Switzerland, 2011; p. 88. ISBN 978-3-033-03065-7. Available online: http://www.ch2011.ch/pdf/CH2011reportHIGH.pdf (accessed on 14 May 2025).
- National Centre for Climate Services NCCS. CH2018—Climate Scenarios for Switzerland: Technical Report; National Centre for Climate Services: Bern, Switzerland, 2023; p. 271. ISBN 978-3-9525031-4-0. Available online: https://www.nccs.admin.ch/nccs/en/home/climate-change-and-impacts/swiss-climate-change-scenarios/technical-report.html (accessed on 14 May 2025).
- Rippstein, V.; De Schrijver, E.; Eckert, S.; Vicedo-Cabrera, A.M. Trends in tropical nights and their effects on mortality in Switzerland across 50 years. PLoS Clim. 2023, 2, e0000162. [Google Scholar] [CrossRef]
- Emmanuel, R.; Steemers, K. Connecting the realms of urban form, density and microclimate. Build. Res. Inf. 2018, 46, 804–808. [Google Scholar] [CrossRef]
- Lai, D.; Liu, W.; Gan, T.; Liu, K.; Chen, Q. A review of mitigating strategies to improve the thermal environment and thermal comfort in urban outdoor spaces. Sci. Total Environ. 2019, 661, 337–353. [Google Scholar] [CrossRef]
- Imran, H.M.; Kala, J.; Ng, A.W.M.; Muthukumaran, S. Effectiveness of vegetated patches as Green Infrastructure in mitigating Urban Heat Island effects during a heatwave event in the city of Melbourne. Weather. Clim. Extrem. 2019, 25, 100217. [Google Scholar] [CrossRef]
- Yin, Y.; Li, S.; Xing, X.; Zhou, X.; Kang, Y.; Hu, Q.; Li, Y. Cooling Benefits of Urban Tree Canopy: A Systematic Review. Sustainability 2024, 16, 4955. [Google Scholar] [CrossRef]
- Papangelis, G.; Tombrou, M.; Dandou, A.; Kontos, T. An urban “green planning” approach utilizing the Weather Research and Forecasting (WRF) modeling system. A case study of Athens, Greece. Landsc. Urban Plan. 2012, 105, 174–183. [Google Scholar] [CrossRef]
- Santamouris, M.; Gaitani, N.; Spanou, A.; Saliari, M.; Giannopoulou, K.; Vasilakopoulou, K.; Kardomateas, T. Using cool paving materials to improve microclimate of urban areas—Design realization and results of the flisvos project. Build. Environ. 2012, 53, 128–136. [Google Scholar] [CrossRef]
- Yang, J.; Wang, Z.-H.; Kaloush, K.E.; Dylla, H. Effect of pavement thermal properties on mitigating urban heat islands: A multi-scale modeling case study in Phoenix. Build. Environ. 2016, 108, 110–121. [Google Scholar] [CrossRef]
- Rosso, F.; Pisello, A.L.; Cotana, F.; Ferrero, M. On the thermal and visual pedestrians’ perception about cool natural stones for urban paving: A field survey in summer conditions. Build. Environ. 2016, 107, 198–214. [Google Scholar] [CrossRef]
- Lan, Y.; Zhan, Q. How do urban buildings impact summer air temperature? The effects of building configurations in space and time. Build. Environ. 2017, 125, 88–98. [Google Scholar] [CrossRef]
- Wang, C.; Zhang, H.; Ma, Z.; Yang, H.; Jia, W. Urban Morphology Influencing the Urban Heat Island in the High-Density City of Xi’an Based on the Local Climate Zone. Sustainability 2024, 16, 3946. [Google Scholar] [CrossRef]
- Zhou, B.; Rybski, D.; Kropp, J.P. The role of city size and urban form in the surface urban heat island. Sci. Rep. 2017, 7, 4791. [Google Scholar] [CrossRef]
- Yang, J.; Shi, Q.; Menenti, M.; Wong, M.S.; Wu, Z.; Zhao, Q.; Abbas, S.; Xu, Y. Observing the impact of urban morphology and building geometry on thermal environment by high spatial resolution thermal images. Urban Clim. 2021, 39, 100937. [Google Scholar] [CrossRef]
- Straka, M.; Sodoudi, S. Evaluating climate change adaptation strategies and scenarios of enhanced vertical and horizontal compactness at urban scale (a case study for Berlin). Landsc. Urban Plan. 2019, 183, 68–78. [Google Scholar] [CrossRef]
- Widiyannita, E.N.; Hariyadi, A.; Syafii, N.I. Impact of Urban Density on the Outdoor Thermal Comfort Case Study: Yogyakarta Tugu Station Area, TOD Based Planning. IOP Conf. Ser. Earth Environ. Sci. 2021, 764, 012017. [Google Scholar] [CrossRef]
- Stadt Zürich. Kommunaler Richtplan Siedlung, Landschaft, Öffentliche Bauten und Anlagen: Richtplantext; Stadt Zürich Hochbaudepartement Amt für Städtebau: Zurich, Switzerland, 2021. [Google Scholar]
- Stadt Zürich. Quartierspiegel: Altstetten 2022; Statistik Stade Zürich: Zurich, Seitzerland, 2022. [Google Scholar]
- Stadt Zürich. Quartierspiegel: Altstetten 2024; Stadt Zürich Präsidialdepartement, Statistik Stadt Zürich: Zurich, Switzerland, 2024; Available online: https://www.stadt-zuerich.ch/de/politik-und-verwaltung/statistik-und-daten/publikationen-und-dienstleistungen/publikationen/quartierspiegel/quartier-092.html (accessed on 8 April 2025).
- Esri, DeLorme, & NAVTEQ. Ladybug Tools: EPW Map. Available online: https://www.ladybug.tools/epwmap/ (accessed on 11 April 2025).
- Climate.OneBuilding.Org. Zurich Affoltern ZH CHE 066640 TMYx. Repository of Building Simulation Climate Data 2024. Available online: https://climate.onebuilding.org/default.html (accessed on 19 May 2025).
- Federal Statistical Office. Floor Space Per Occupant; Federal Statistical Office: Wiesbaden, Germany, 2023; Available online: https://www.bfs.admin.ch/bfs/en/home/statistics/construction-housing/dwellings/housing-conditions/floor-area-person.html (accessed on 25 February 2025).
- Schwehr, P.; Fischer, R.; Geier, S. Retrofit Strategies Design Guide: Advanced Retrofit Strategies & 10 Steps to a Prefab Module (IEA ECBCS Annex 50 Prefabricated Systems for Low Energy Renovation of Residential Buildings); Empa, Building Science and Technology Lab: Dübendorf, Switzerland, 2011; Available online: https://www.ecbcs.org/Data/publications/EBC_PSR_Annex50.pdf (accessed on 30 October 2024).
- Zimmermann, M. ECBCS Annex 50: Prefabricated Systems for Low Energy Renovation of Residential Buildings: Project Summary Report. 2012. Available online: http://www.uk.ecbcs.org/Data/publications/EBC_PSR_Annex50.pdf (accessed on 30 October 2024).
- Stadt Zürich. Quartierspiegel: Albisrieden 2015 (Quartierspiegel); Stadt Zürich Präsidialdepartement, Statistik Stadt Zürich: Zurich, Switzerland, 2015; Available online: https://commons.wikimedia.org/wiki/File:Quartierspiegel_091-Albisrieden_2015.pdf (accessed on 8 April 2025).
- Stadt Zürich. Quartierspiegel: Altstetten 2015 (Quartierspiegel); Stadt Zürich Präsidialdepartement, Statistik Stadt Zürich: Zurich, Switzerland, 2015; Available online: https://upload.wikimedia.org/wikipedia/commons/5/50/Quartierspiegel_092-Altstetten_2015.pdf (accessed on 8 April 2025).
- Stadt Zürich. Quartierspiegel: Albisrieden 2020 (Quartierspiegel); Stadt Zürich Präsidialdepartement, Statistik Stadt Zürich: Zurich, Switzerland, 2020; Available online: https://zop.zb.uzh.ch/server/api/core/bitstreams/f6bbf6b1-6a56-4de2-b772-180bd8981e41/content (accessed on 10 March 2021).
- Stadt Zürich. Quartierspiegel: Altstetten 2020 (Quartierspiegel); Stadt Zürich Präsidialdepartement, Statistik Stadt Zürich: Zurich, Switzerland, 2020; Available online: https://zop.zb.uzh.ch/server/api/core/bitstreams/604c19d0-8f89-440a-b5c6-c84d71169b72/content (accessed on 10 March 2021).
- Stadt Zürich. Quartierspiegel: Albisrieden 2022; Statistik Stadt Zürich: Zurich, Switzerland, 2022. [Google Scholar]
- Stadt Zürich. Quartierspiegel: Albisrieden 2024 (1002125 (elektronisch: 1002125); Quartierspiegel); Stadt Zürich Präsidialdepartement, Statistik Stadt Zürich: Zurich, Switzerland, 2024; Available online: https://www.stadt-zuerich.ch/de/politik-und-verwaltung/statistik-und-daten/publikationen-und-dienstleistungen/publikationen/quartierspiegel/quartier-091.html (accessed on 8 April 2025).
- Altstetten_BEV341QM1000_Zukuenftige_Bevoelkerung. 2024. Available online: https://www.stadt-zuerich.ch/statistik (accessed on 8 April 2025).
- European Environment Agency (Ed.) Land Take and Land Degradation in Functional Urban Areas; Publications Office of the European Union: Luxembourg, 2022. [Google Scholar] [CrossRef]
- Teller, J. Regulating Urban Densification: What Factors Should Be Used? Build. Cities 2021, 2, 302–317. [Google Scholar] [CrossRef]
- Hartmann, T.; Dembski, S.; Hengstermann, A.; Dunning, R. Viewpoint—Land for Densification: How Land Policy and Property Matter. Town Plan. Rev. 2022, 94, 465–473. [Google Scholar] [CrossRef]
- Touati-Morel, A. Hard and Soft Densification Policies in the Paris City-Region. Int. J. Urban Reg. Res. 2015, 39, 603–612. [Google Scholar] [CrossRef]
- Angel, S.; Lamson-Hall, P.; Blei, A.; Shingade, S.; Kumar, S. Densify and Expand: A Global Analysis of Recent Urban Growth. Sustainability 2021, 13, 3835. [Google Scholar] [CrossRef]
- Lindberg, F.; Grimmond, C.S.B.; Gabey, A.; Huang, B.; Kent, C.W.; Sun, T.; Theeuwes, N.E.; Järvi, L.; Ward, H.C.; Capel-Timms, I.; et al. Urban Multi-scale Environmental Predictor (UMEP): An integrated tool for city-based climate services. Environ. Model. Softw. 2018, 99, 70–87. [Google Scholar] [CrossRef]
- Lindberg, F.; Holmer, B.; Thorsson, S. SOLWEIG 1.0—Modelling spatial variations of 3D radiant fluxes and mean radiant temperature in complex urban settings. Int. J. Biometeorol. 2008, 52, 697–713. [Google Scholar] [CrossRef]
- Gál, C.V.; Kántor, N. Modeling mean radiant temperature in outdoor spaces, A comparative numerical simulation and validation study. Urban Clim. 2020, 32, 100571. [Google Scholar] [CrossRef]

| Total | Development After 1975 | Development 1925–1975 | Development Before 1925 | |
|---|---|---|---|---|
| Number of parcels | 176 | 39 | 100 | 37 |
| Parcel area (m2) | 157,522 | 74,051 | 65,090 | 18,381 |
| Current floor area (m2) | 258,450 | 126,555 | 113,113 | 18,782 |
| Residents | Job Positions | |
|---|---|---|
| Altstetten–Albisrieden in 2022 | 58,517 | 59,149 |
| Expected to increase by 2040 | 9583 | 17,963 |
| Total in 2040 | 68,100 | 77,112 |
| Average area per resident or position (m2) | 45 | 40 |
| Expected to increase floor area (m2) | 431,235 | 718,520 |
| Expected total floor area after an overall redevelopment (m2) | 3,064,500 | 3,084,480 |
| Total expected to increase floor area (m2) | 1,149,755 | |
| Expected total floor area after an overall redevelopment (m2) | 6,148,980 | |
| All Development (n = 2894) | Developments 1925–1975 (n = 1545) | Developments After 1975 (n = 1129) | Developments Before 1925 (n = 220) | |
|---|---|---|---|---|
| Current floor areas (m2) | 5,150,971 | 1,403,751 | 3,664,680 | 82,540 |
| In the parcels already beyond BZO2016 | 2,574,985 | 423,091 | 2,114,720 | 22,394 |
| In the parcels lower than BZO2016 | 2,588,556 | 980,660 | 1,549,960 | 60,146 |
| BZO-permitted floor areas (m2) | 6,255,359 | 2,042,820 | 4,065,850 | 146,689 |
| In the parcels already beyond BZO2016 | 1,846,436 | 328,830 | 1,499,000 | 16,396 |
| In the parcels lower than BZO2016 | 4,408,923 | 1,713,990 | 2,566,850 | 130,293 |
| Total | Demand for Population Growth | Difference | |
|---|---|---|---|
| BZO 2016-permitted floor areas (m2) | 6,255,359 | 6,148,980 | 106,367 (+1.7%) |
| Maximum increase permitted by BZO 2016 (m2) | 1,750,220 | 1,149,755 | 600,453 (+52.2%) |
| Only redeveloping those older than 50 years to reach the limits of BZO2016 (m2) | 639,069 | 1,149,755 | −510,698 (−44.4%) |
| Developments Before 1925 | Developments 1925–1975 | Developments After 1975 | ||||
|---|---|---|---|---|---|---|
| Beyond BZO 2016 | Lower Than BZO 2016 | Beyond BZO 2016 | Lower Than BZO 2016 | Beyond BZO 2016 | Lower Than BZO 2016 | |
| Scenario 1 (SN1) | Replacing all buildings of parcels to reach the limits of the BZO 2016 | |||||
| Scenario 2 (SN2) | Maintain | Adding one floor to existing buildings | ||||
| Scenario 3 (SN3) | Maintain | Maintain | Redevelop as BZO2016 | Maintain | Add floors | |
| Scenario 4 (SN4) | Maintain | Redevelop to meet the limits of the BZO 2016 | Maintain | Add floors | ||
| Scenario 5 (SN5) | Maintain | UR +27% upon BZO2016 | Maintain | |||
| Total Floor Area (m2) | Average UR | Max. Building Footprint (m2) | Min. Open/Green Surface (m2) | |
|---|---|---|---|---|
| Current | 5,150,971 | 0.99 | 1,337,030 | 3,326,100 |
| Scenario 1 (SN1) | 6,255,359 | 1.14 | 2,141,980 | 2,521,150 |
| Scenario 2 (SN2) | 6,433,550 | 1.29 | 1,337,030 | 3,326,100 |
| Scenario 3 (SN3) | 6,313,150 | 1.21 | 1,571,180 | 3,091,950 |
| Scenario 4 (SN4) | 6,345,680 | 1.20 | 1,546,940 | 3,116,190 |
| Scenario 5 (SN5) | 6,327,040 | 1.25 | 1,546,940 | 3,116,190 |
| Total Floor Area (m2) | Building Footprint (m2) | Average Floor Number | Average UR | Ground Coverage | |
|---|---|---|---|---|---|
| Current | 258,449 | 67,277 | 3.6 | 1.64 | 32.11% |
| Scenario 1 (SN1) | |||||
| SN1A (Courtyard) | 281,138 | 57,461 | 5.0 | 1.78 | 27.43% |
| SN1B (Tower) | 283,505 | 52,493 | 5.6 | 1.80 | 25.05% |
| Scenario 2 (SN2) | 320,797 | 67,277 | 4.4 | 2.00 | 32.11% |
| Scenario 3 (SN3) | |||||
| SN3A (Courtyard) | 294,987 | 67,124 | 4.3 | 1.87 | 32.04% |
| SN3B (Tower) | 289,730 | 66,038 | 4.2 | 1.84 | 31.52% |
| Scenario 4 (SN4) | |||||
| SN4A (Courtyard) | 285,656 | 64,267 | 4.3 | 1.81 | 30.67% |
| SN4B (Tower) | 283,611 | 63,399 | 4.3 | 1.80 | 30.26% |
| Scenario 5 (SN5) | |||||
| SN5A (Courtyard) | 292,881 | 64,391 | 4.6 | 1.86 | 30.73% |
| SN5B (Tower) | 293,906 | 63,465 | 4.3 | 1.87 | 30.29% |
| Daytime Tmrt (°C) | Nighttime Tmrt (°C) | Diurnal Tmrt (°C) | |||||
|---|---|---|---|---|---|---|---|
| Max. | Min. | Average | Max | Min | Average | Average | |
| Current | 44.616 | 27.393 | 35.684 | 19.515 | 11.668 | 14.652 | 27.797 |
| SN1A | 44.576 | 27.370 | 35.675 | 19.538 | 11.752 | 14.625 | 27.781 |
| SN1B | 44.739 | 27.749 | 37.103 | 18.449 | 11.643 | 14.026 | 28.449 |
| SN2 | 44.533 | 27.310 | 35.083 | 19.538 | 11.746 | 15.030 | 27.563 |
| SN3A | 44.614 | 27.353 | 35.236 | 19.538 | 11.668 | 14.889 | 27.606 |
| SN3B | 44.614 | 27.354 | 35.512 | 19.538 | 11.668 | 14.737 | 27.721 |
| SN4A | 44.590 | 27.349 | 35.348 | 19.538 | 11.726 | 14.802 | 27.643 |
| SN4B | 44.590 | 27.354 | 35.734 | 19.538 | 11.726 | 14.583 | 27.803 |
| SN5A | 44.616 | 27.315 | 35.274 | 19.538 | 11.668 | 14.868 | 27.622 |
| SN5B | 44.616 | 27.354 | 35.592 | 19.515 | 11.668 | 14.678 | 27.749 |
Disclaimer/Publisher’s Note: The statements, opinions and data contained in all publications are solely those of the individual author(s) and contributor(s) and not of MDPI and/or the editor(s). MDPI and/or the editor(s) disclaim responsibility for any injury to people or property resulting from any ideas, methods, instructions or products referred to in the content. |
© 2025 by the authors. Licensee MDPI, Basel, Switzerland. This article is an open access article distributed under the terms and conditions of the Creative Commons Attribution (CC BY) license (https://creativecommons.org/licenses/by/4.0/).
Share and Cite
Jiang, Y.; Menz, S. Urban Densification and Outdoor Thermal Comfort: Scenario-Based Analysis in Zurich’s Altstetten–Albisrieden District. Land 2025, 14, 1516. https://doi.org/10.3390/land14081516
Jiang Y, Menz S. Urban Densification and Outdoor Thermal Comfort: Scenario-Based Analysis in Zurich’s Altstetten–Albisrieden District. Land. 2025; 14(8):1516. https://doi.org/10.3390/land14081516
Chicago/Turabian StyleJiang, Yingying, and Sacha Menz. 2025. "Urban Densification and Outdoor Thermal Comfort: Scenario-Based Analysis in Zurich’s Altstetten–Albisrieden District" Land 14, no. 8: 1516. https://doi.org/10.3390/land14081516
APA StyleJiang, Y., & Menz, S. (2025). Urban Densification and Outdoor Thermal Comfort: Scenario-Based Analysis in Zurich’s Altstetten–Albisrieden District. Land, 14(8), 1516. https://doi.org/10.3390/land14081516


