Article

Analyses of MODIS Land Cover/Use and Wildfires in Italian Regions Since 2001

by
Ebrahim Ghaderpour
1,2,*,
Francesca Bozzano
1,2,
Gabriele Scarascia Mugnozza
1,2 and
Paolo Mazzanti
1,2
1
Department of Earth Sciences & CERI Research Centre, Sapienza University of Rome, P.le Aldo Moro, 5, 00185 Rome, Italy
2
NHAZCA s.r.l., Via Vittorio Bachelet, 12, 00185 Rome, Italy
*
Author to whom correspondence should be addressed.
Land 2025, 14(7), 1443; https://doi.org/10.3390/land14071443
Submission received: 18 June 2025 / Revised: 3 July 2025 / Accepted: 8 July 2025 / Published: 10 July 2025
(This article belongs to the Special Issue Integration of Remote Sensing and GIS for Land Use Change Assessment)

Abstract

Monitoring land cover/use dynamics and wildfire occurrences is very important for land management planning and risk mitigation practices. In this research, moderate-resolution imaging spectroradiometer (MODIS) annual land cover images for the period 2001–2023 are utilized for the twenty administrative regions of Italy. Monthly MODIS burned area images are utilized for the period 2001–2020 to study wildfire occurrences across these regions. In addition, monthly Global Precipitation Measurement images for the period 2001–2020 are employed to estimate correlations between precipitation and burned areas annually and seasonally. Boxplots are produced to show the distributions of each land cover/use type within the regions. The non-parametric Mann–Kendall trend test and Sen’s slope are applied to estimate a linear trend, with statistical significance being evaluated for each land cover/use time series of size 23. Pearson’s correlation method is applied for correlation analysis. It is found that grasslands and woodlands have been declining and increasing in most regions, respectively, most significantly in Abruzzo (−0.88%/year for grasslands and 0.71%/year for grassy woodlands). The most significant and frequent wildfires have been observed in southern Italy, particularly in Basilicata, Apulia, and Sicily, mainly in grasslands. The years 2007 and 2017 experienced severe wildfires in the southern regions, mainly during July and August, due to very hot and dry conditions. Negative Pearson’s correlations are estimated between precipitation and burnt areas, with the most significant one being for Basilicata during the fire season (r = −0.43). Most of the burned areas were mainly within the elevation range of 0–500 m and the lowlands of Apulia. In addition, for the 2001–2020 period, a high positive correlation (r > 0.7) is observed between vegetation and land surface temperature, while significant negative correlations between these variables are observed for Apulia (r ≈ −0.59), Sicily (r ≈ −0.69), and Sardinia (r ≈ −0.74), and positive correlations (r > 0.25) are observed between vegetation and precipitation in these three regions. This study’s findings can guide land managers and policymakers in developing or maintaining a sustainable environment.

1. Introduction

Land cover/use data show how much of a region is covered by forests, impervious surfaces, crops, water, etc., and how people use landscapes, e.g., urbanization, agriculture, industry, etc. Monitoring land cover/use is an important task that can guide policymakers and urban planners in developing sustainable land management. For example, planting trees and vegetation can effectively combat urban heat islands [1]. Proper deforestation practices are essential for agricultural use and wildfire risk mitigation. Likewise, informed afforestation practices can help balance carbon storage, reduce air pollution, and support biodiversity. Gradual warming, long periods of drought, and reduction of snow cover, sometimes accompanied by extreme weather events, such as windstorms and heavy rainfall, increasing the risk of floods and landslides, are all related to land cover/use change [2,3]. These events have been observed more frequently in Central Europe and other regions in recent years [4,5].
Satellite remote sensing imagery has been utilized to effectively monitor land cover/use and wildfire occurrences in vast areas. The moderate-resolution imaging spectroradiometer (MODIS) is a sensor on board the Terra and Aqua satellites used to acquire Earth observation data since the beginning of the twenty-first century. MODIS products have been employed in numerous studies. Chen et al. [6] employed MODIS land cover/use data from 2001 to 2020 to investigate interannual changes in global land cover types. They found a general global decrease in barren lands, shrublands, forests, and snow-covered areas and a general increase in grasslands, croplands, water bodies, and urban areas. Ghaderpour et al. [5] investigated the interconnection between climate and land cover across Italian ecoregions. They observed significant annual coherency between the normalized difference vegetation index (NDVI) and land surface temperature (LST). They also observed a general greening trend across Italian ecoregions for all calendar months, mainly due to a gradual decrease in grasslands and an increase in woodlands.
Recently, wildfires have drawn remarkable attention because of their significant ecological and socioeconomic influences. Wildfires can have both beneficial and negative impacts on ecosystems. Fuel availability, topography, weather conditions (e.g., hot and dry), and source of ignition (e.g., lightning, human-induced fires) are the main factors causing wildfires, also affecting their occurrence and severity [7,8]. Monitoring wildfires is crucial for mitigating socioeconomic damage, including harm to lives, the environment, and infrastructure. Long-term monitoring of wildfire occurrences and severity can significantly help in prevention practices and post-fire restoration strategies and mitigation of post-fire events, such as shallow landslides and debris flows [9,10]. MODIS fire products have been utilized in many studies for various purposes. For example, using MODIS products, Fan et al. [11] estimated trends of carbon gas emissions from wildfires in mainland China for the period of 2011–2021. Hardtke et al. [12] calculated the normalized burned ratio index from Terra and Aqua MODIS data to map burned areas in western Argentina from 2001 to 2011. Dadkhah et al. [13] employed the MODIS FireCCI product to study wildfire patterns in the provinces of Campania, Italy, during the 2001–2020 period and observed relatively higher burned areas in 2007 and 2017. They also employed high-resolution Sentinel-2 and Dynamic World data and calculated the differenced normalized burn ratio (dNBR) to quantify burn severity in Ischia Island. They observed that MODIS FireCCI could not detect burned areas on the island due to the wildfire that occurred in August 2017, primarily because of its coarser spatial resolution. However, MODIS products are excellent for regional studies where the purpose is to gain a general overview of environmental and climate dynamics at the regional scale, which is the primary purpose of the present study.
Wildfires and climate interact with each other in two different ways. Pattern changes in temperature and precipitation can influence fire regime. On the other hand, vegetation burning contributes to greenhouse and aerosol gases, affecting atmospheric chemistry, regional warming, and precipitation pattern change [14,15]. Many researchers have studied relations between climate and wildfires [13,16,17,18,19]. In situ measurements for climate studies are limited and sparse in space and time; however, satellite sensors can often provide continuous measurements for climate studies, covering regions without weather stations [20]. Global Precipitation Measurement (GPM) is an international satellite mission that has been providing precipitation measurements worldwide since June 2000. GPM data have been utilized in many studies, including environmental monitoring, landslides, geohazard risk assessments, etc. [5,7,20,21,22]. Herein, monthly GPM values are utilized to study the relationship between burned areas and precipitation across two decades.
In [5], MODIS–LST data were employed for the 2000–2021 period, and a gradual warming trend was observed across all Italian ecoregions. In [23], precipitation trends for each calendar month and each Italian administrative region were estimated for the 2000–2021 period, and a general drying trend was observed in most of the regions. In [5], using linear regression, the MODIS land cover/use images were employed for 2001–2020 to estimate the trend for each Italian ecoregion. However, in the present research, MODIS land cover/use data for 2001–2023 are employed to study how each land cover/use type changes within each Italian administrative region using non-parametric Mann–Kendall trend analysis. Therefore, the present work focuses on the Italian administrative regions, not Italian ecoregions. In addition, MODIS burned area images for 2001–2020 are employed to study wildfire occurrences across Italian regions and their potential triggering factors, such as vegetation (fuel), precipitation, and land surface temperature. The main contributions of the present study are as follows:
  • Demonstrating the distribution of each land cover/use type within each Italian region by boxplots, utilizing MOD12Q1 images for 2001–2023;
  • Estimating linear trends and their statistical significance for each land cover/use type within each Italian administrative region for 2001–2023;
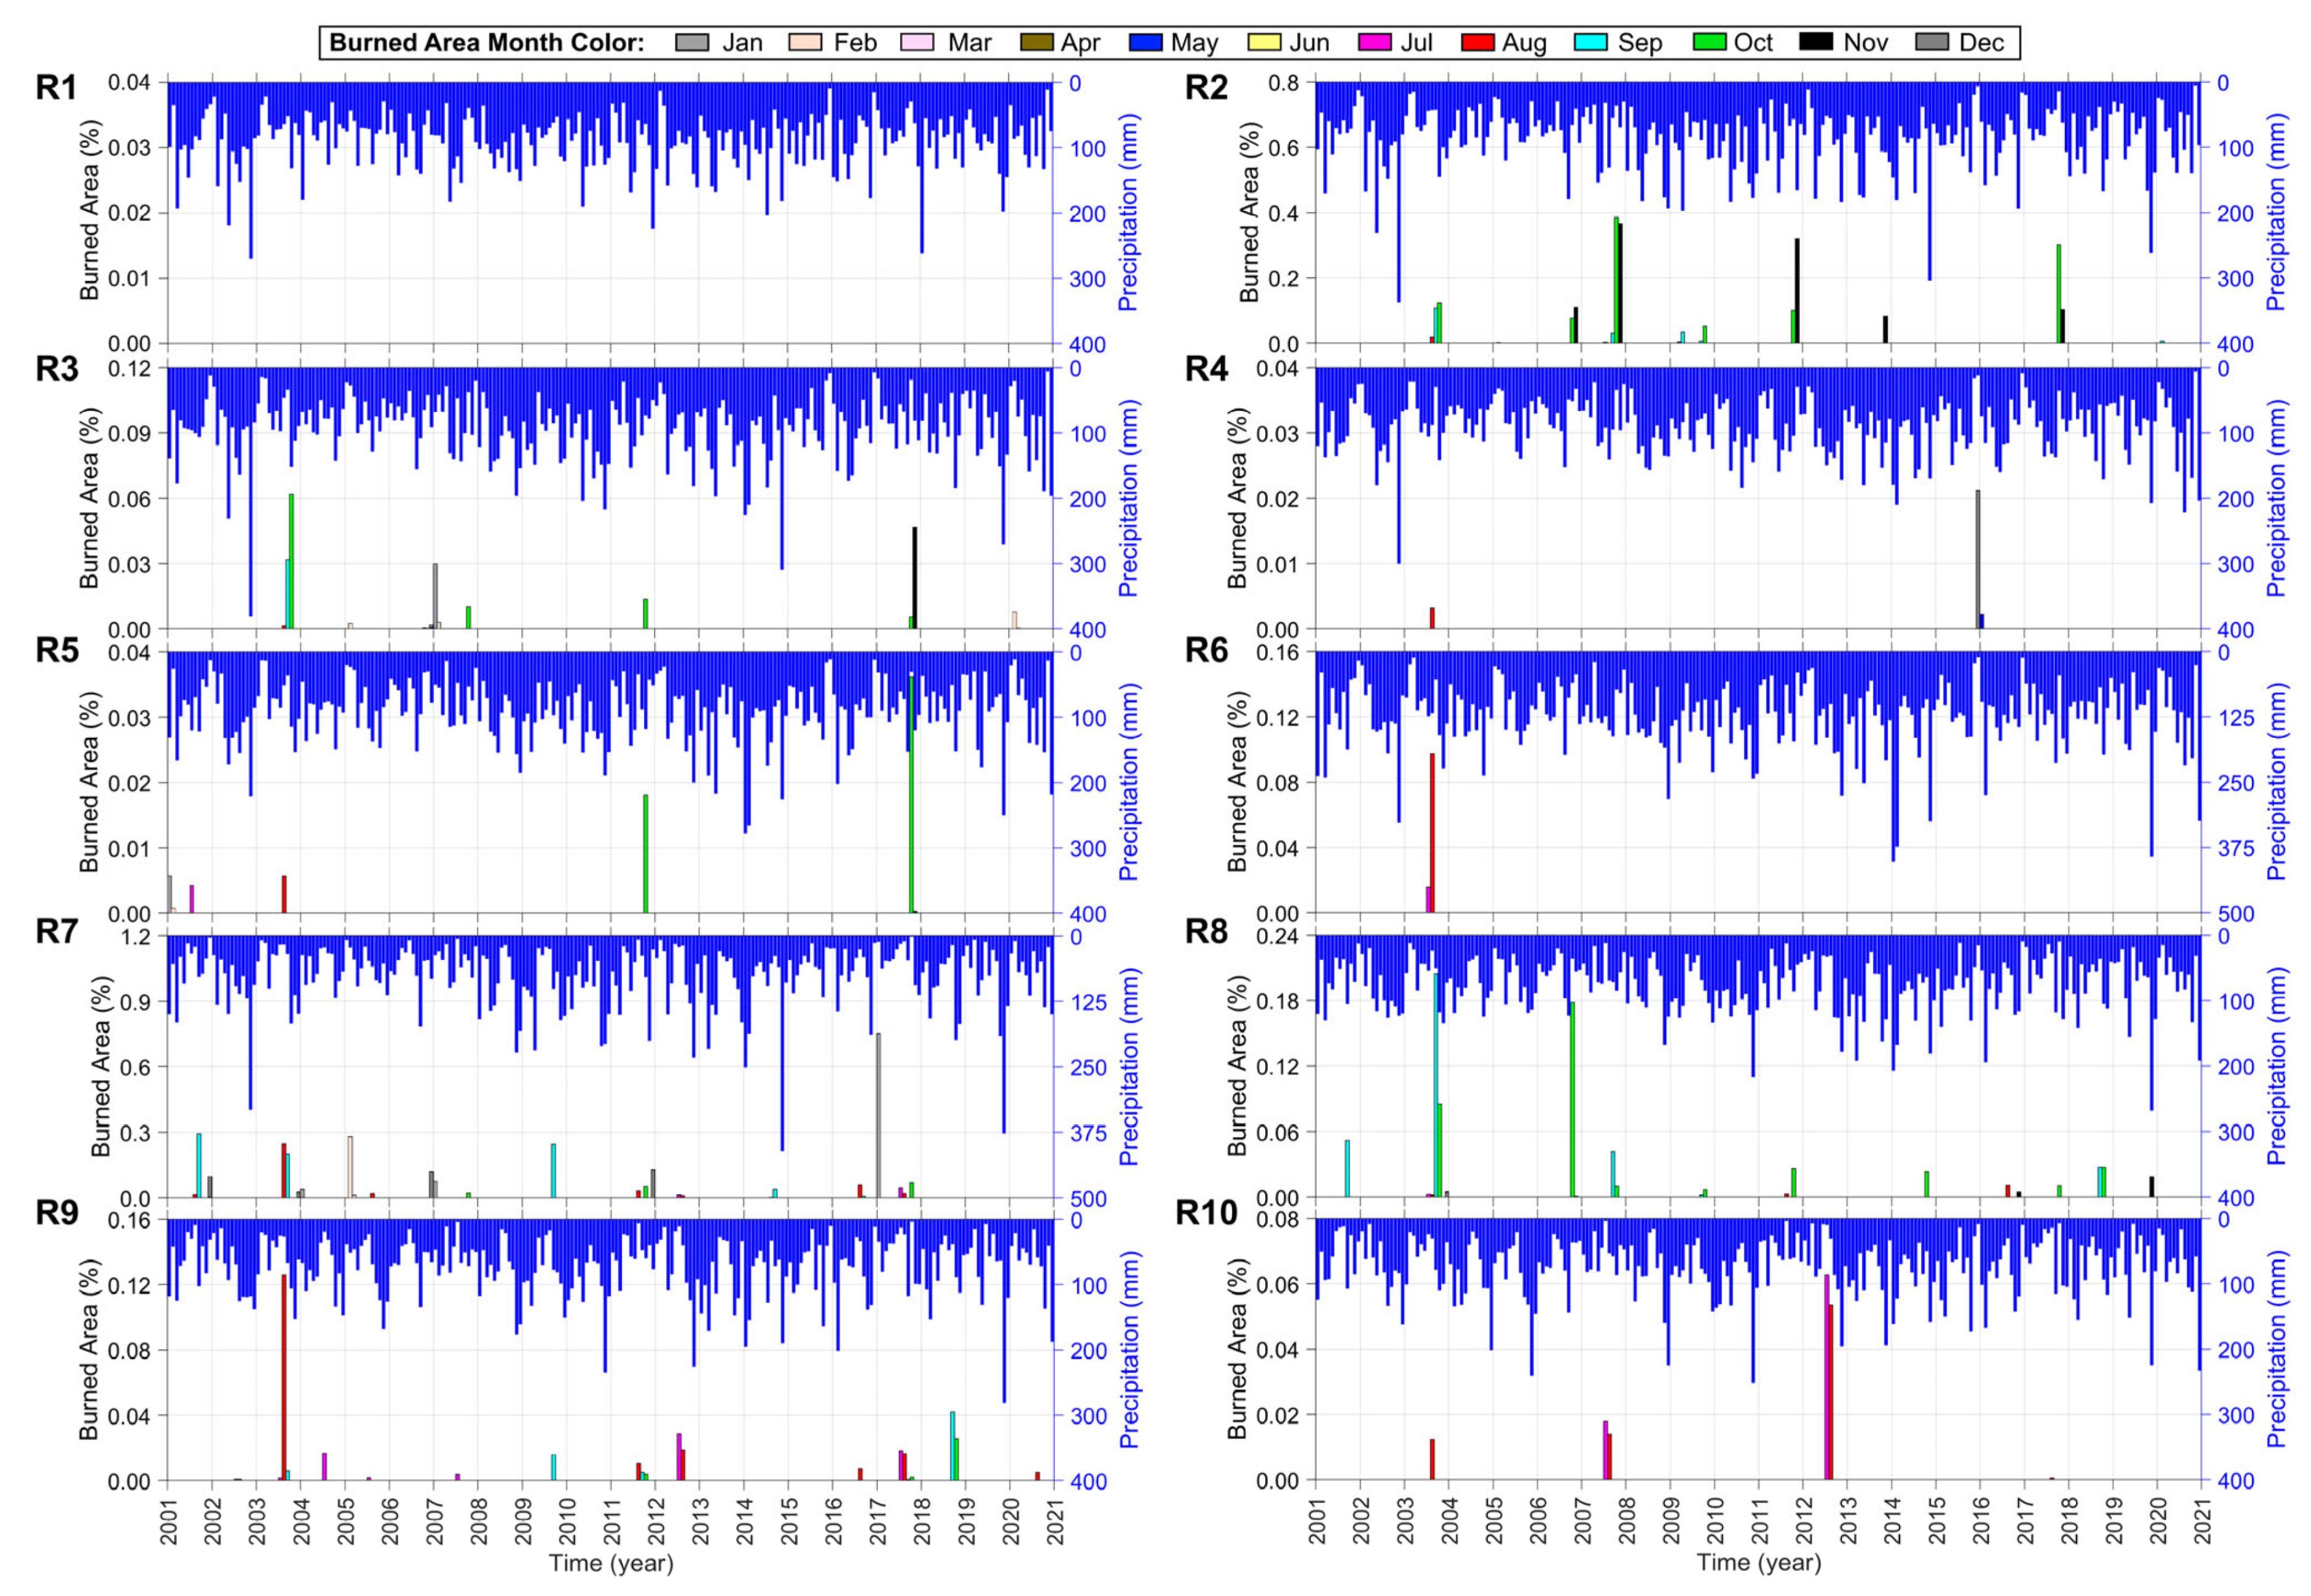
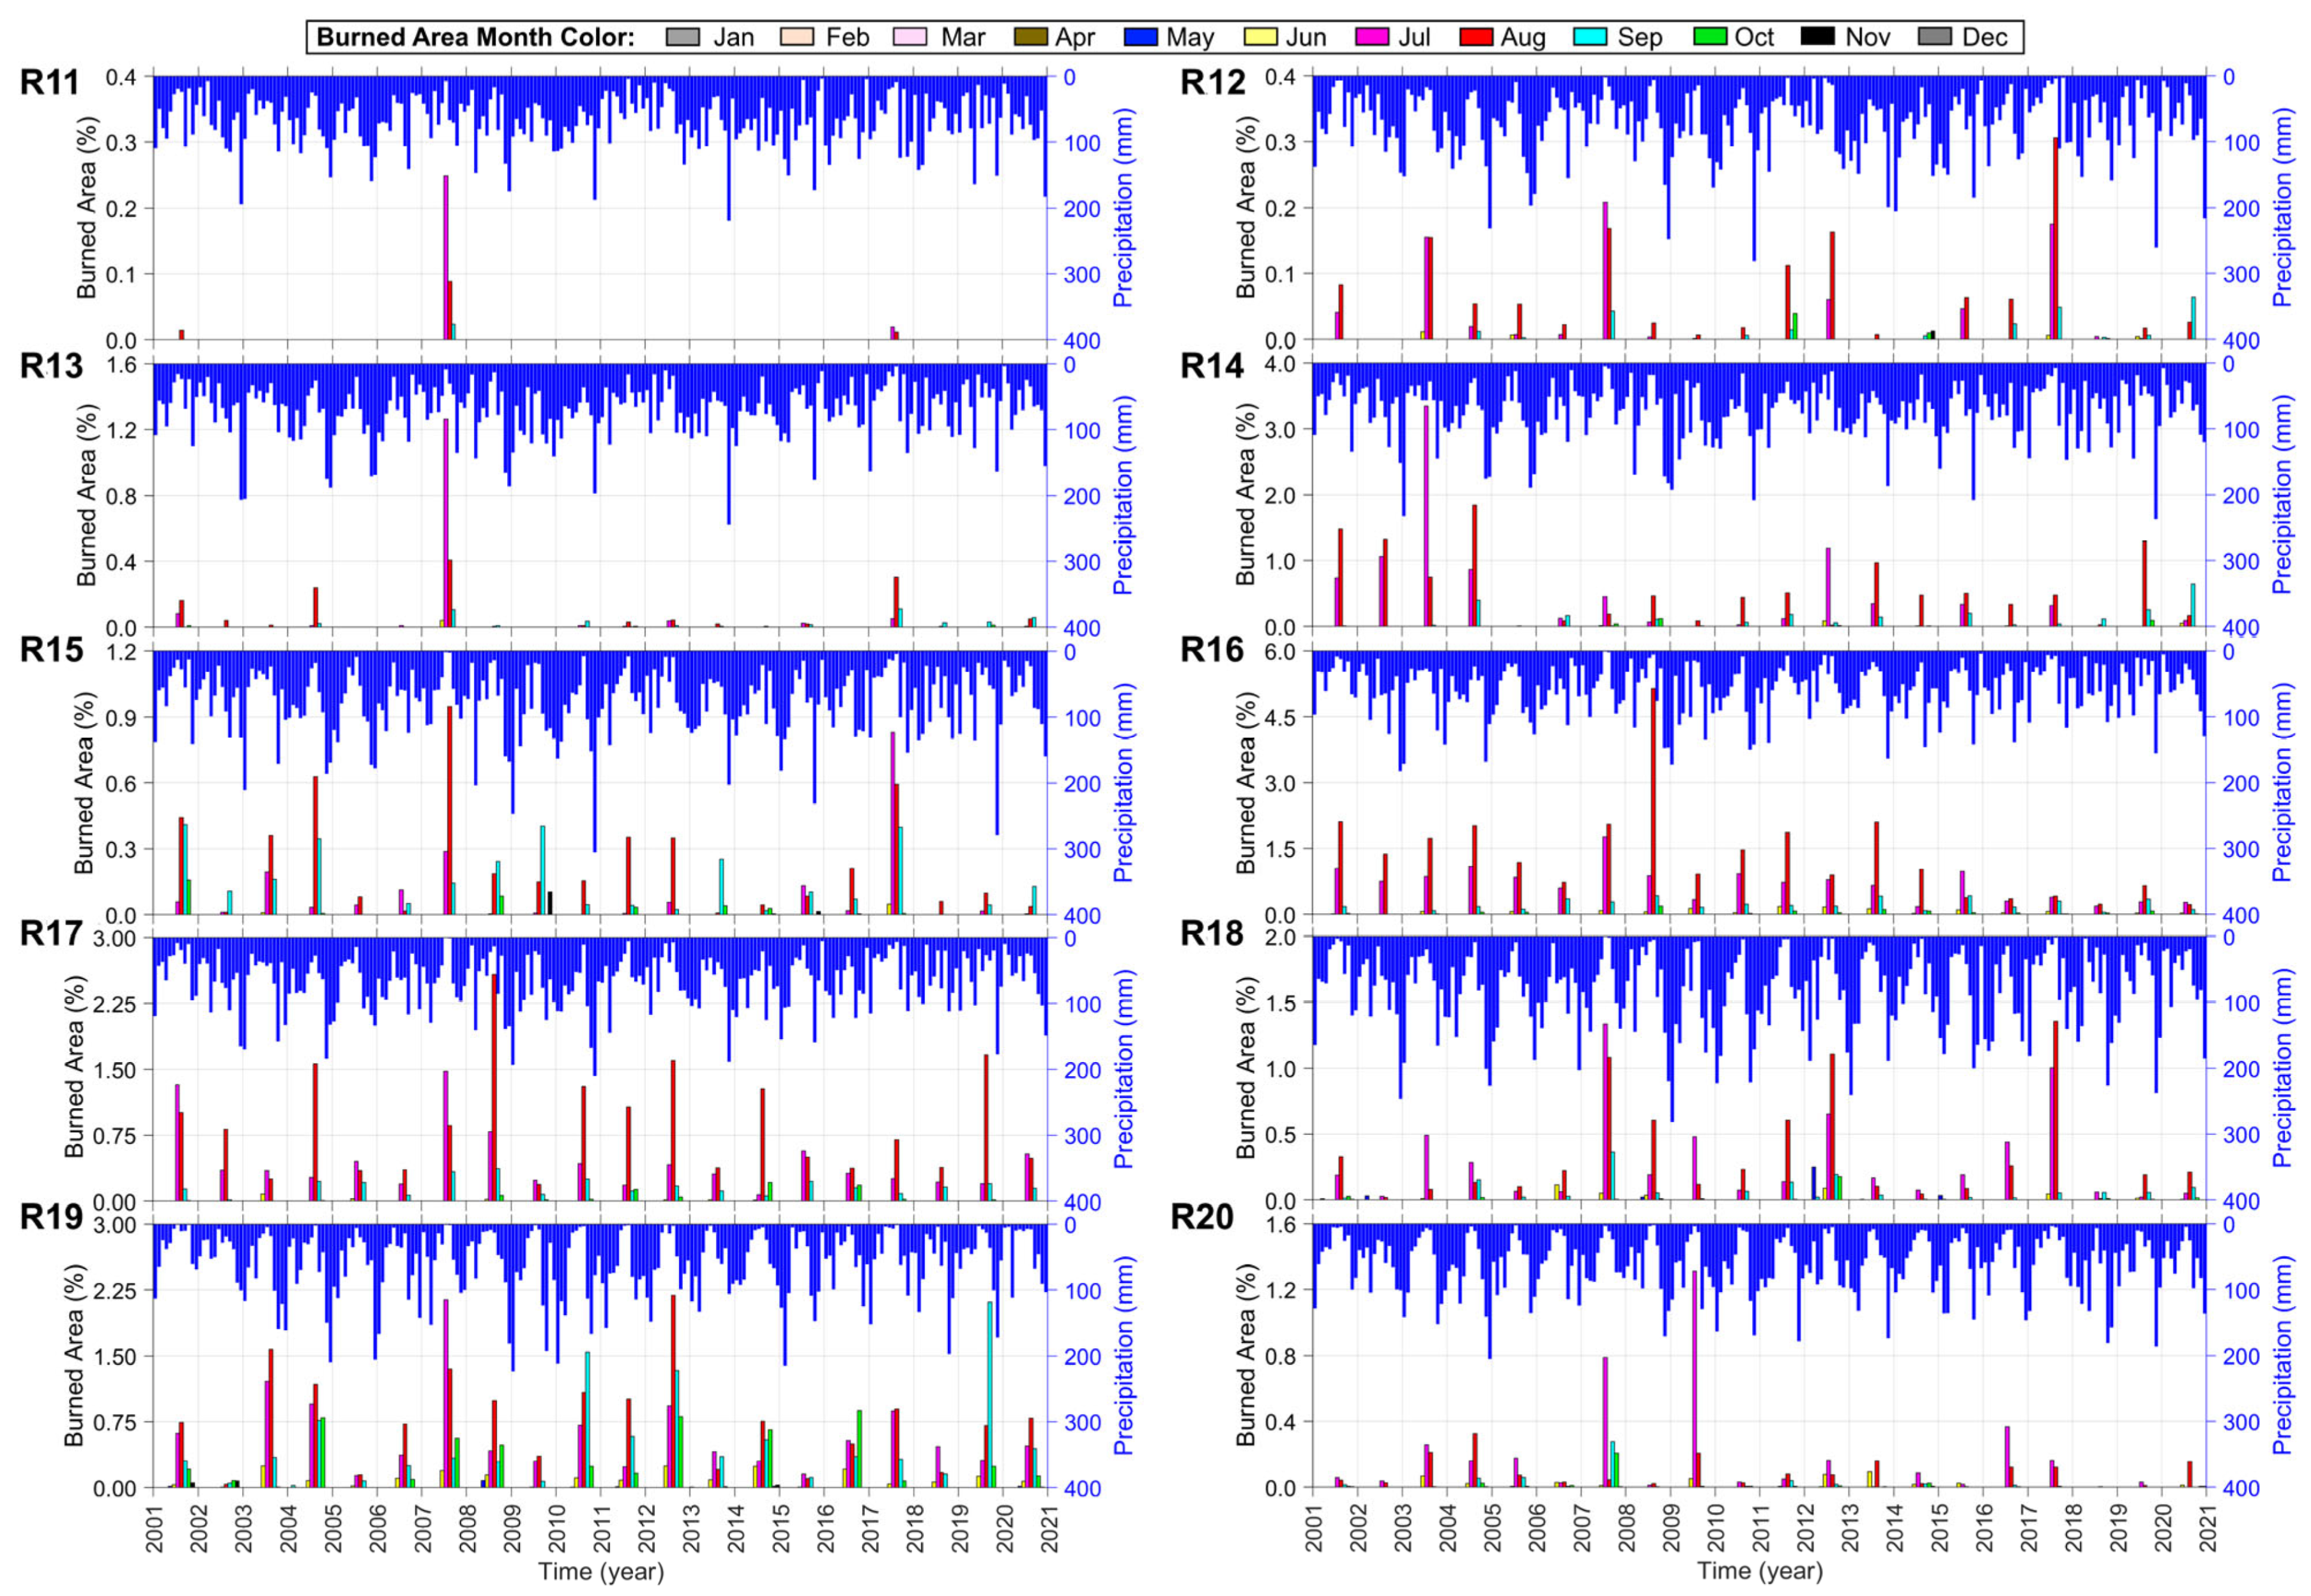
  • Illustrating the monthly MODIS burned area and GPM precipitation time series for each Italian region in the 2001–2020 period and estimating the correlation between them;
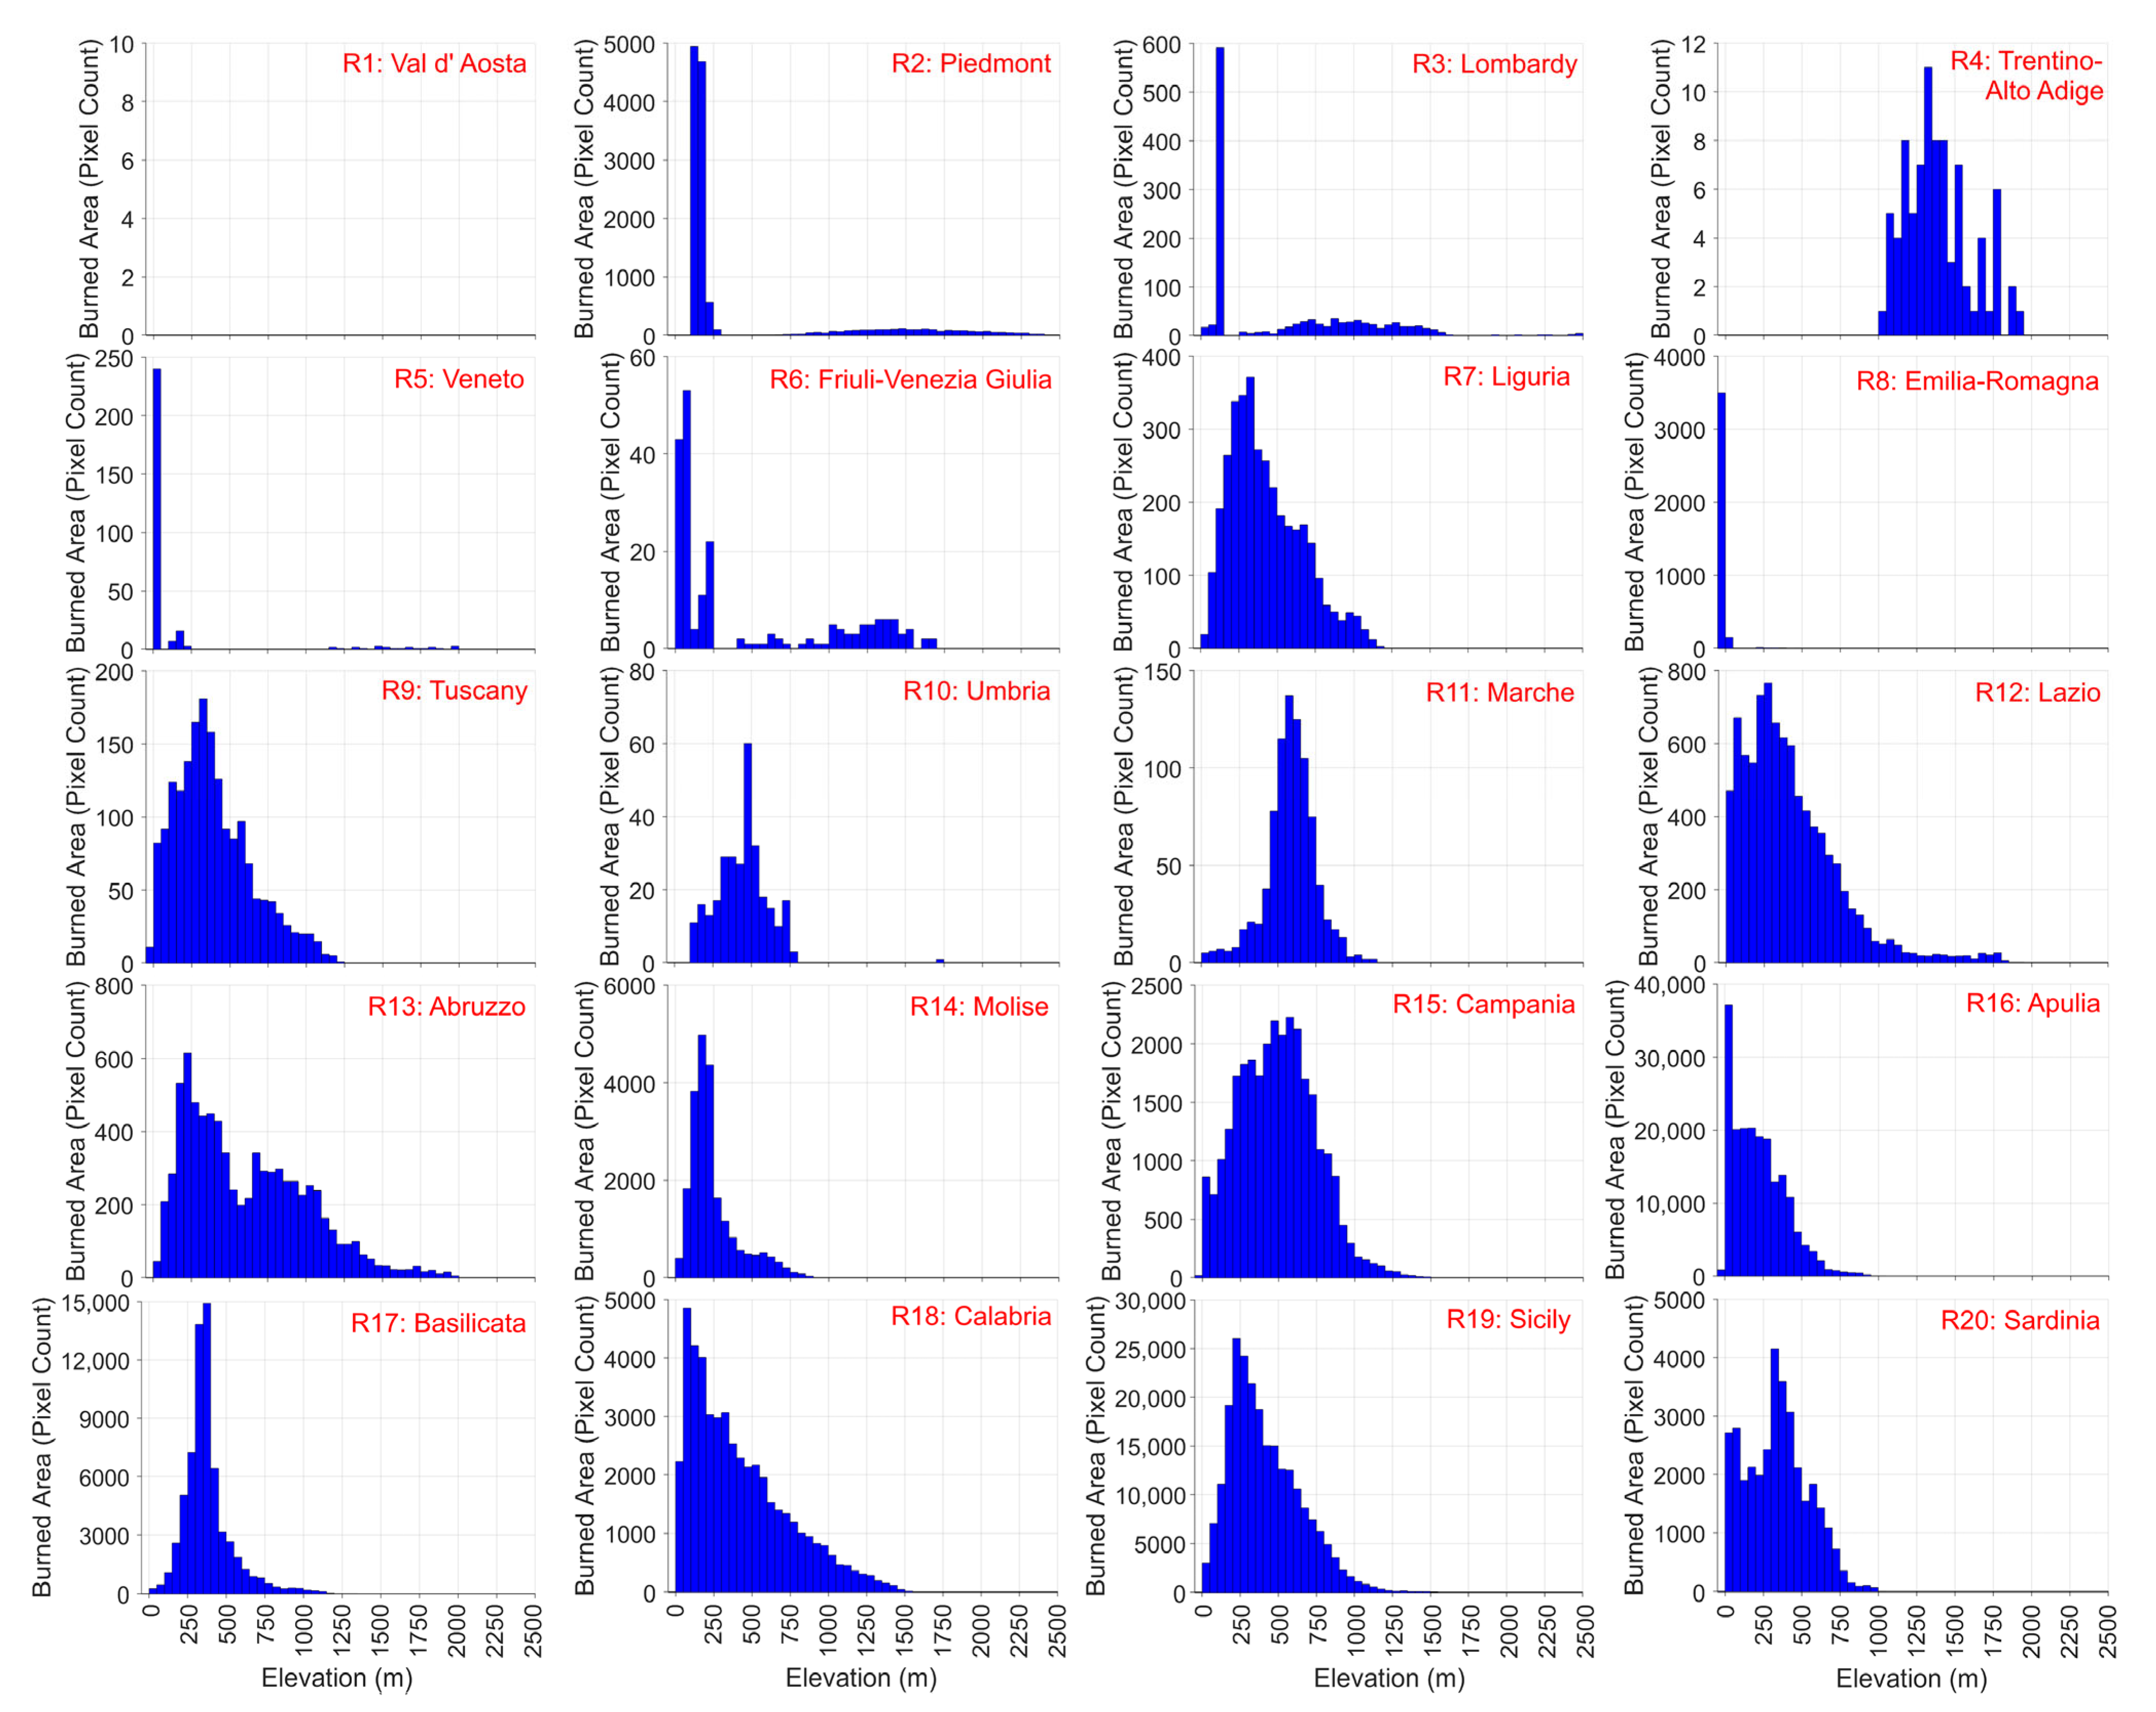
  • Classifying and depicting the burned areas based on elevation ranges for each region;
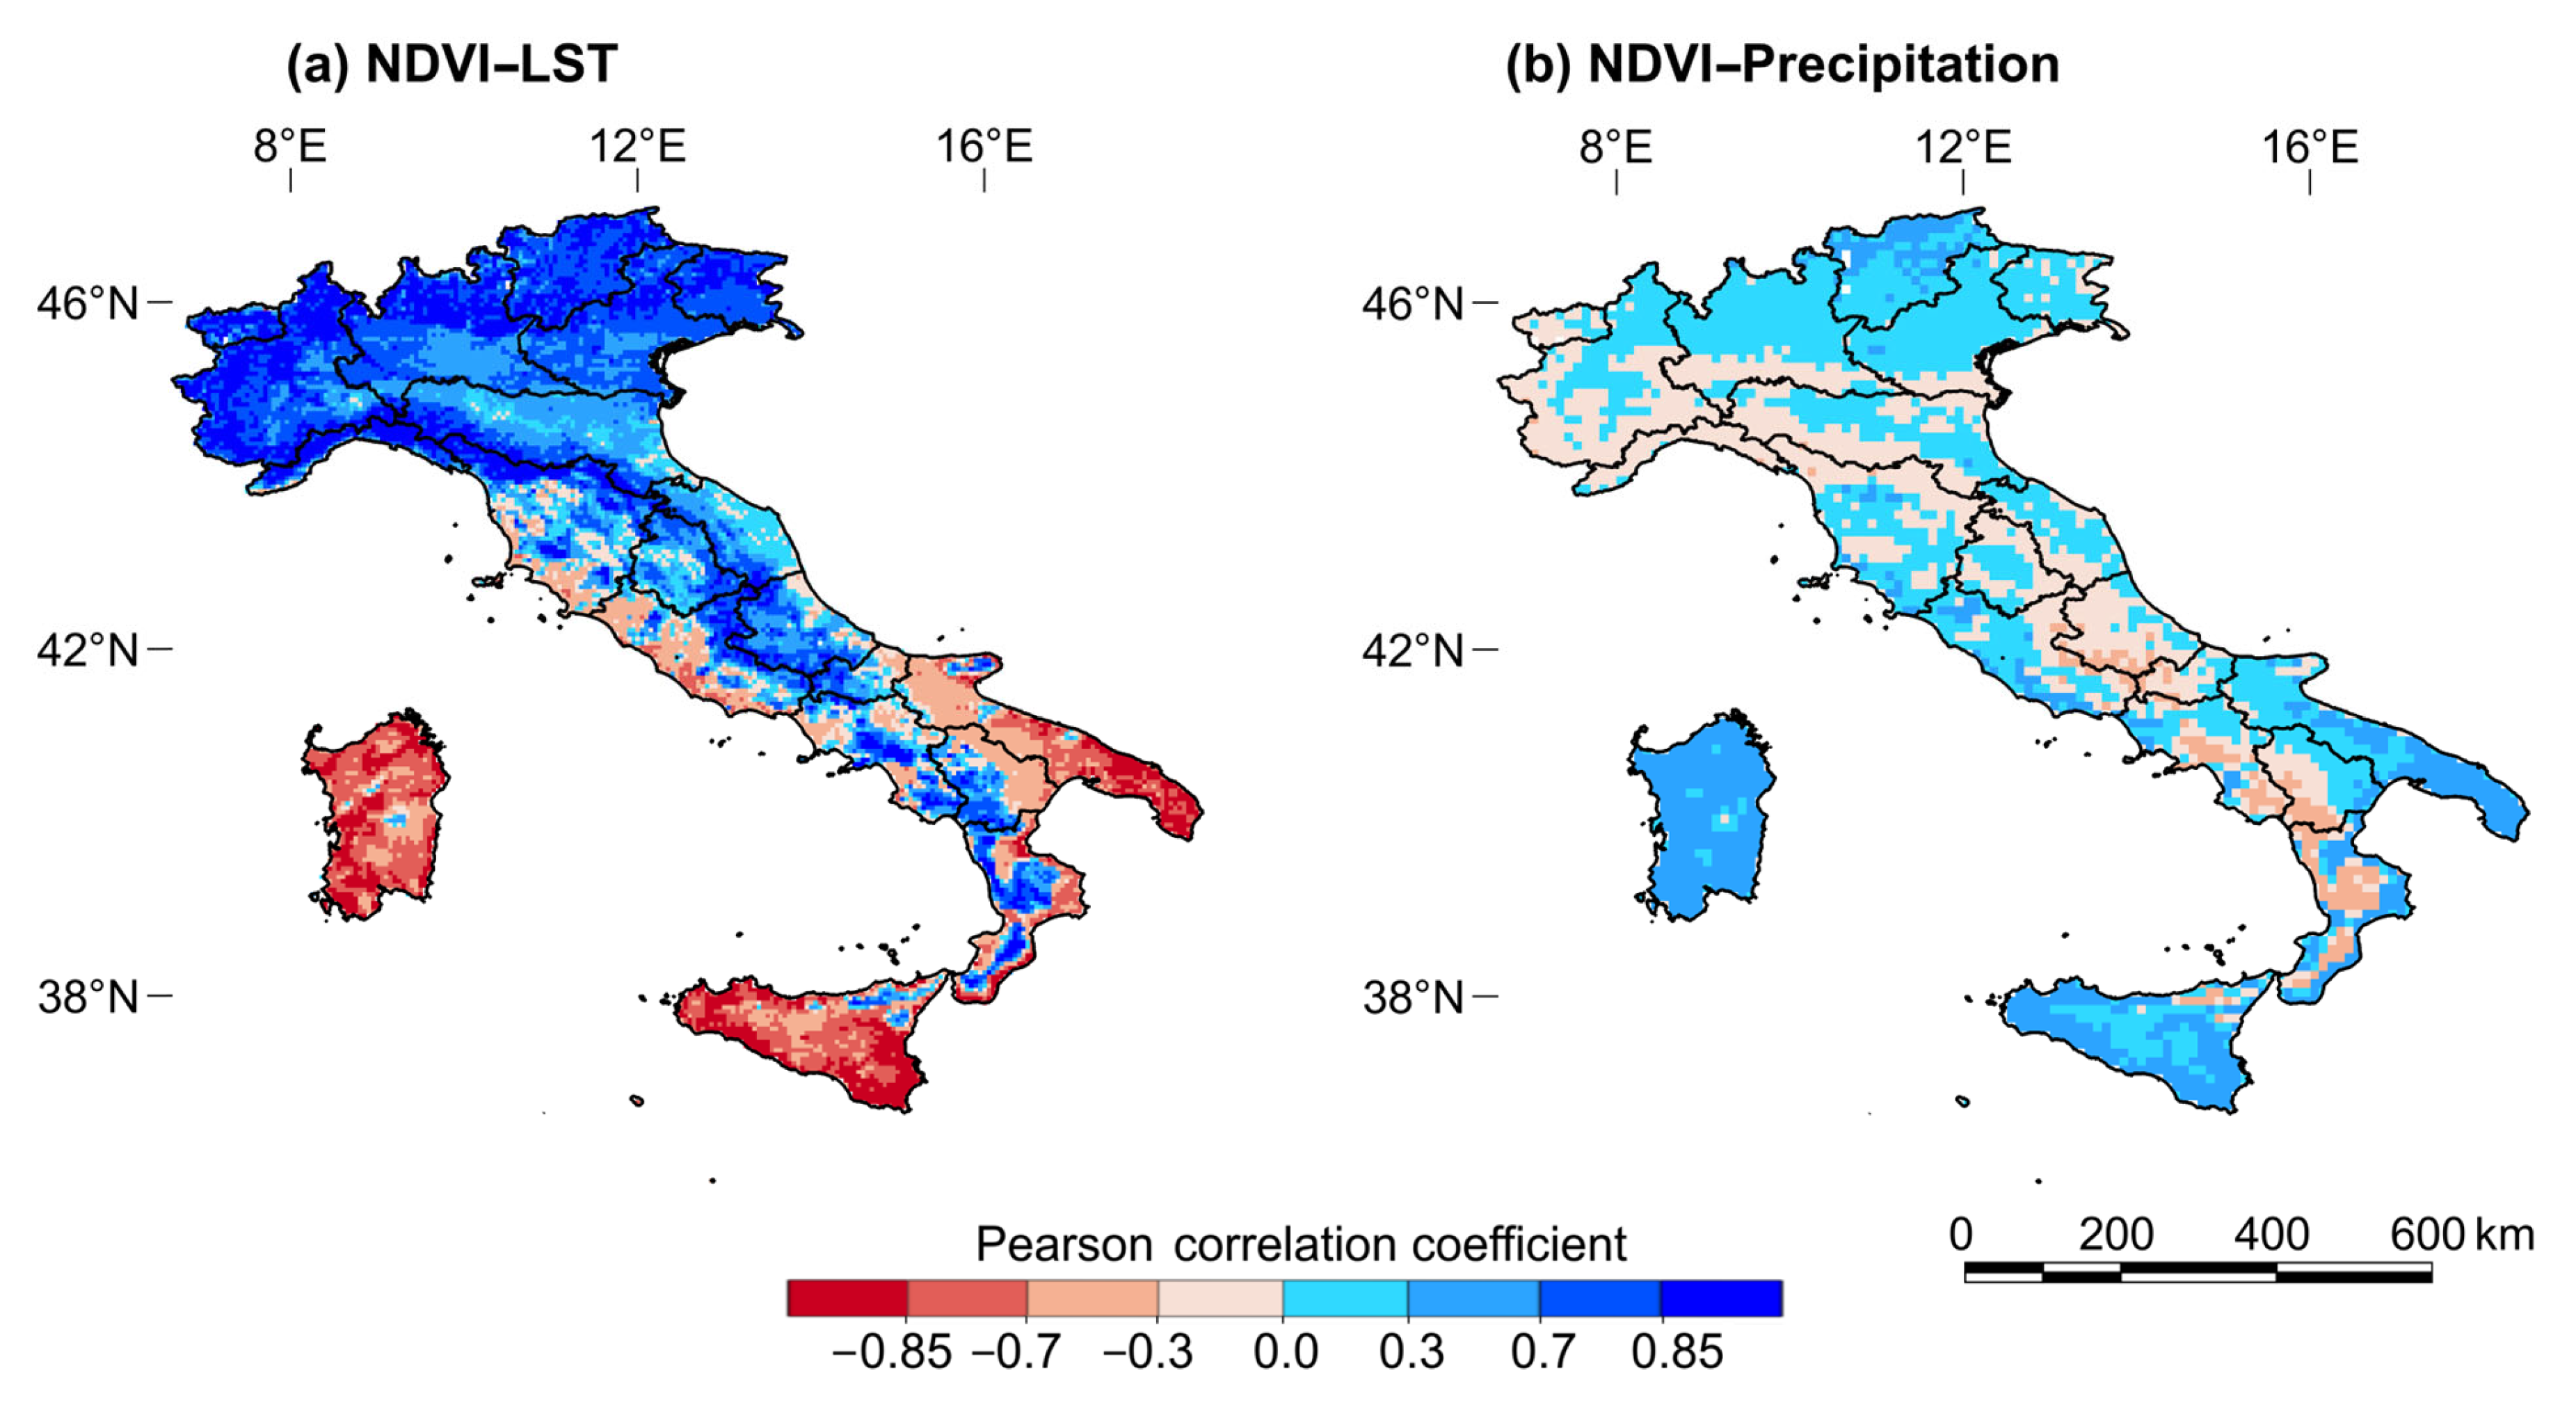
  • Demonstrating correlation results between vegetation and land surface temperature and between vegetation and precipitation for Italian regions for 2001–2020;
  • Comparing the results with the results of other studies and discussing the potential impact of land cover/use change on ecosystems.
The present research aims to fill a research gap, providing a comprehensive region-wise analysis of land cover/use change, wildfire occurrences, and their correlation with climate and topography. The remainder of this work is organized as follows: Section 2 describes Italy’s vegetation, topography, and climatic conditions. It also describes the satellite data employed and the methods utilized. Section 3 presents the results, including the results of our land cover/use trend analysis, our burned area analysis, and precipitation results, along with their correlations and the classification results of burned areas based on topography. The results are compared with those of similar studies in Section 4, where the potential causes of wildfires, the factors affecting their severity, the correlations between vegetation and climatic variables, and the study’s limitations are also discussed. Lastly, Section 5 concludes this study.

2. Materials and Methods
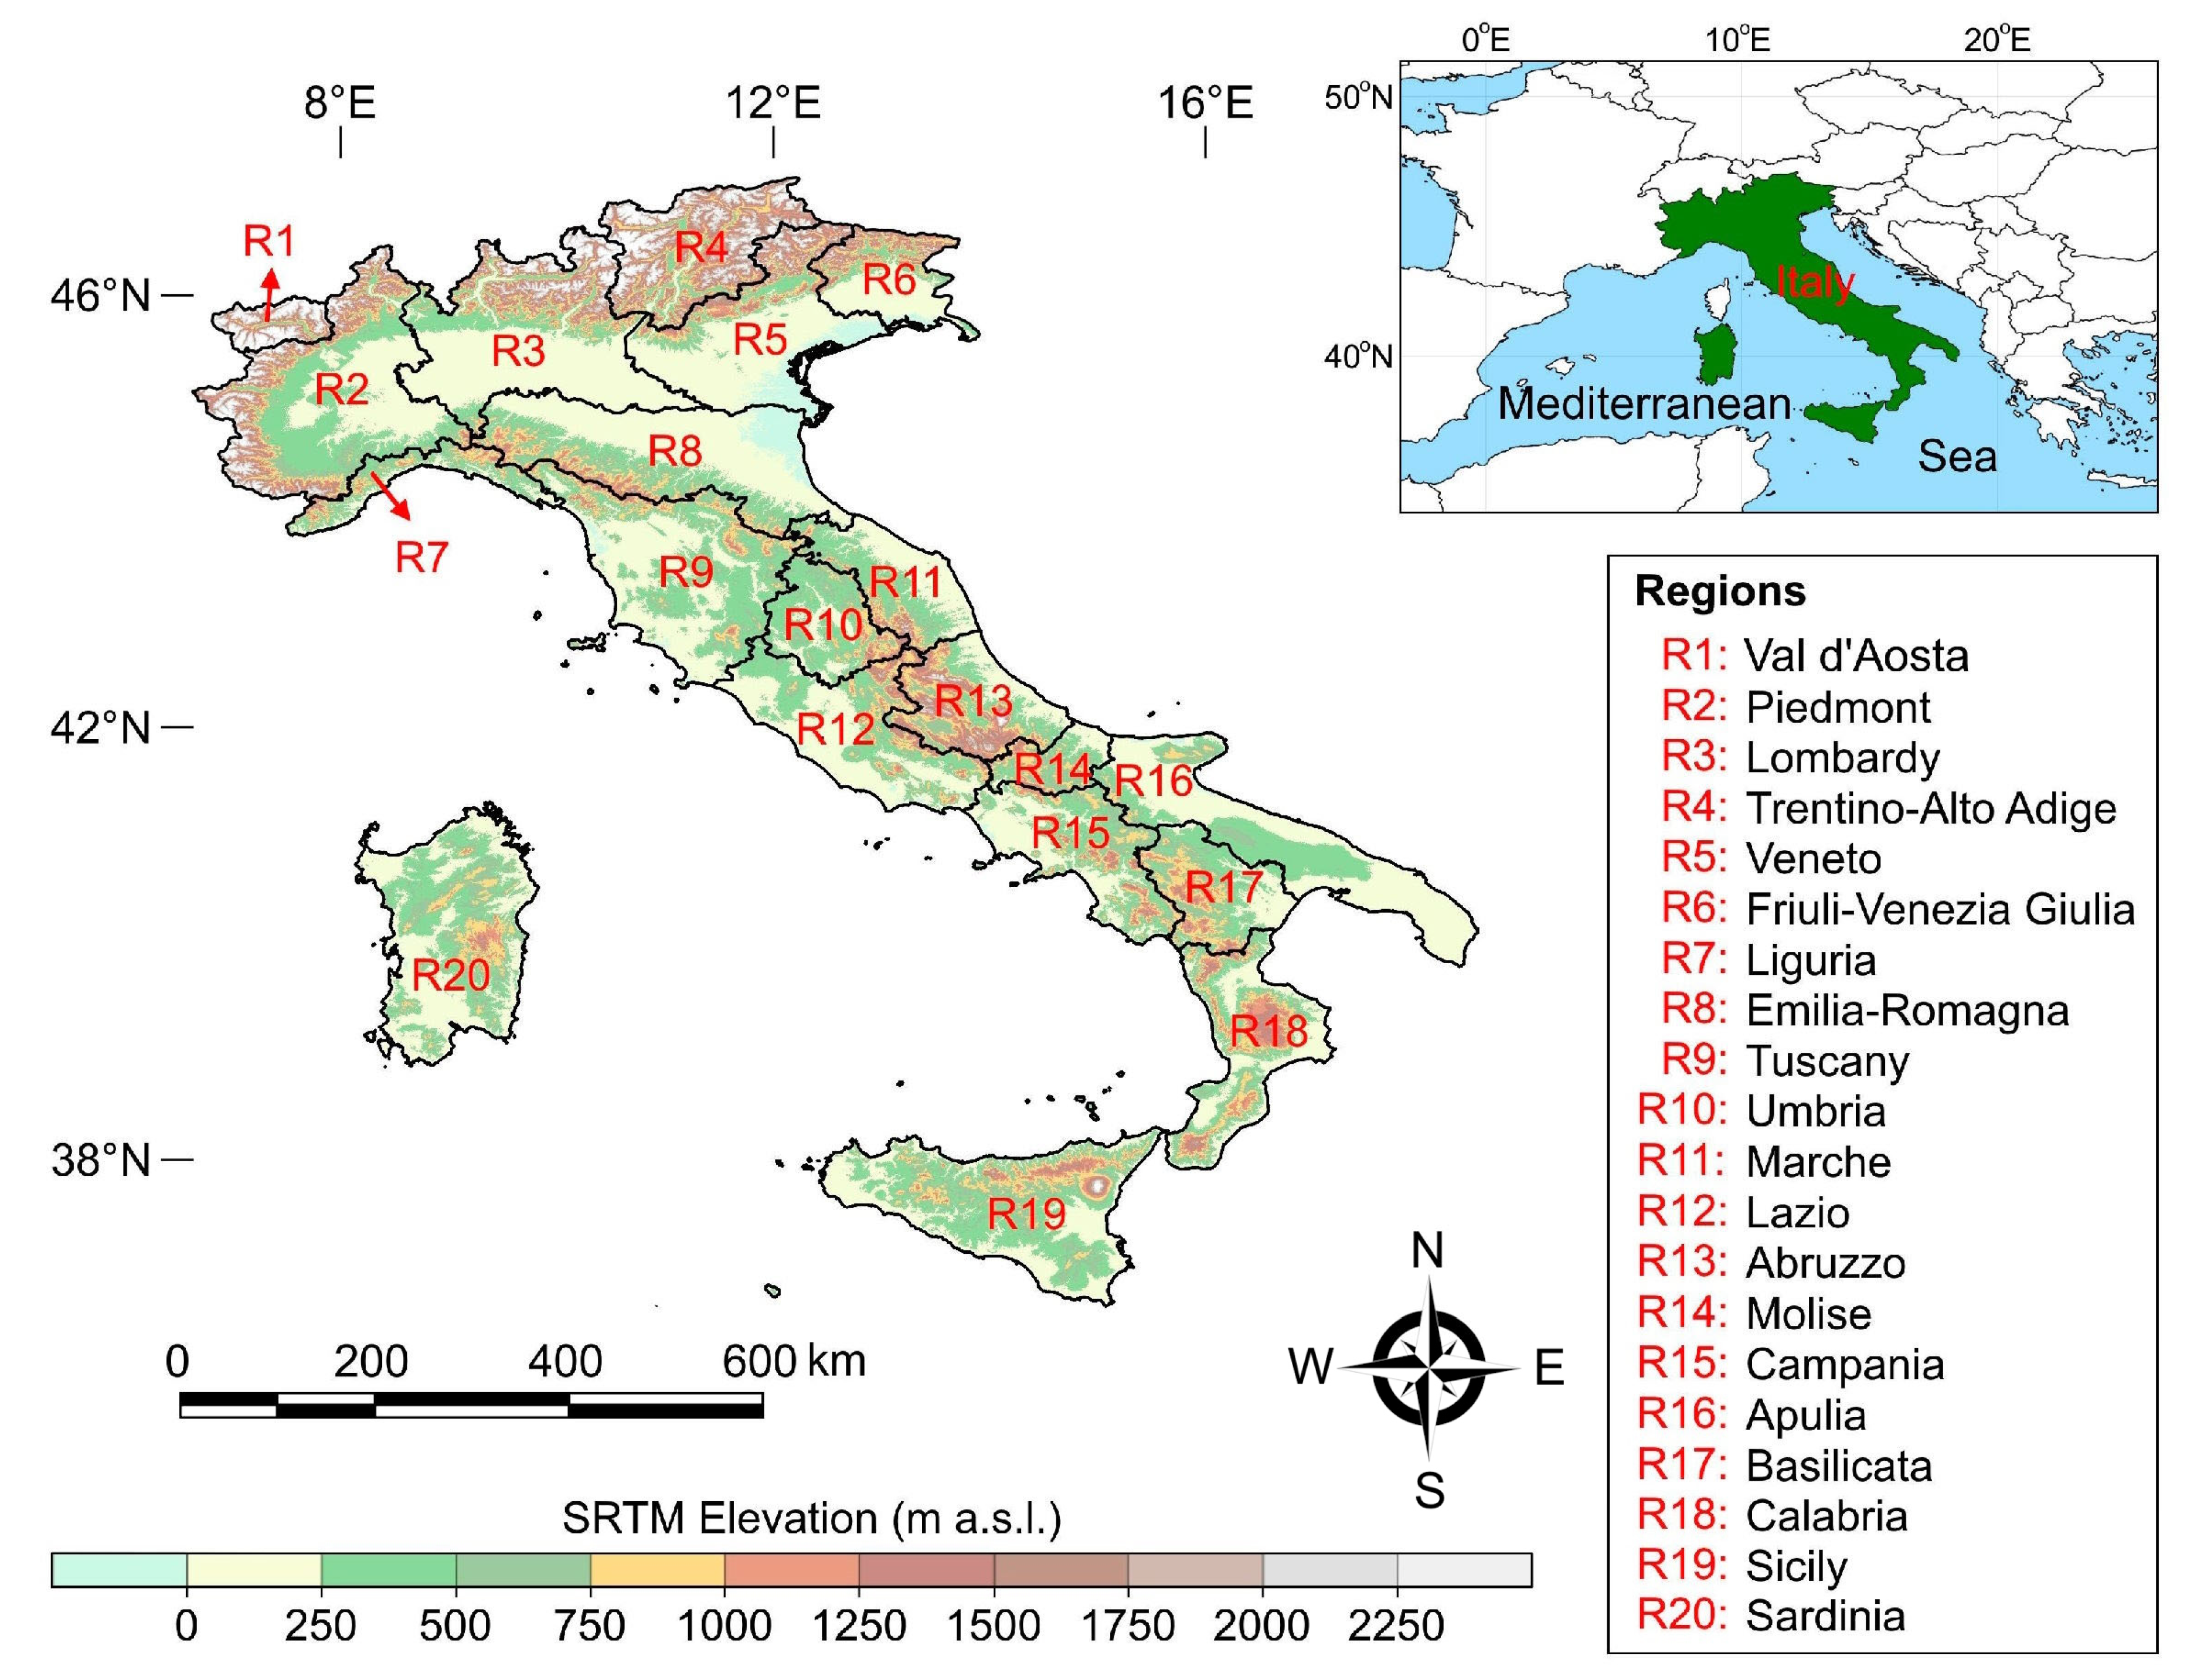
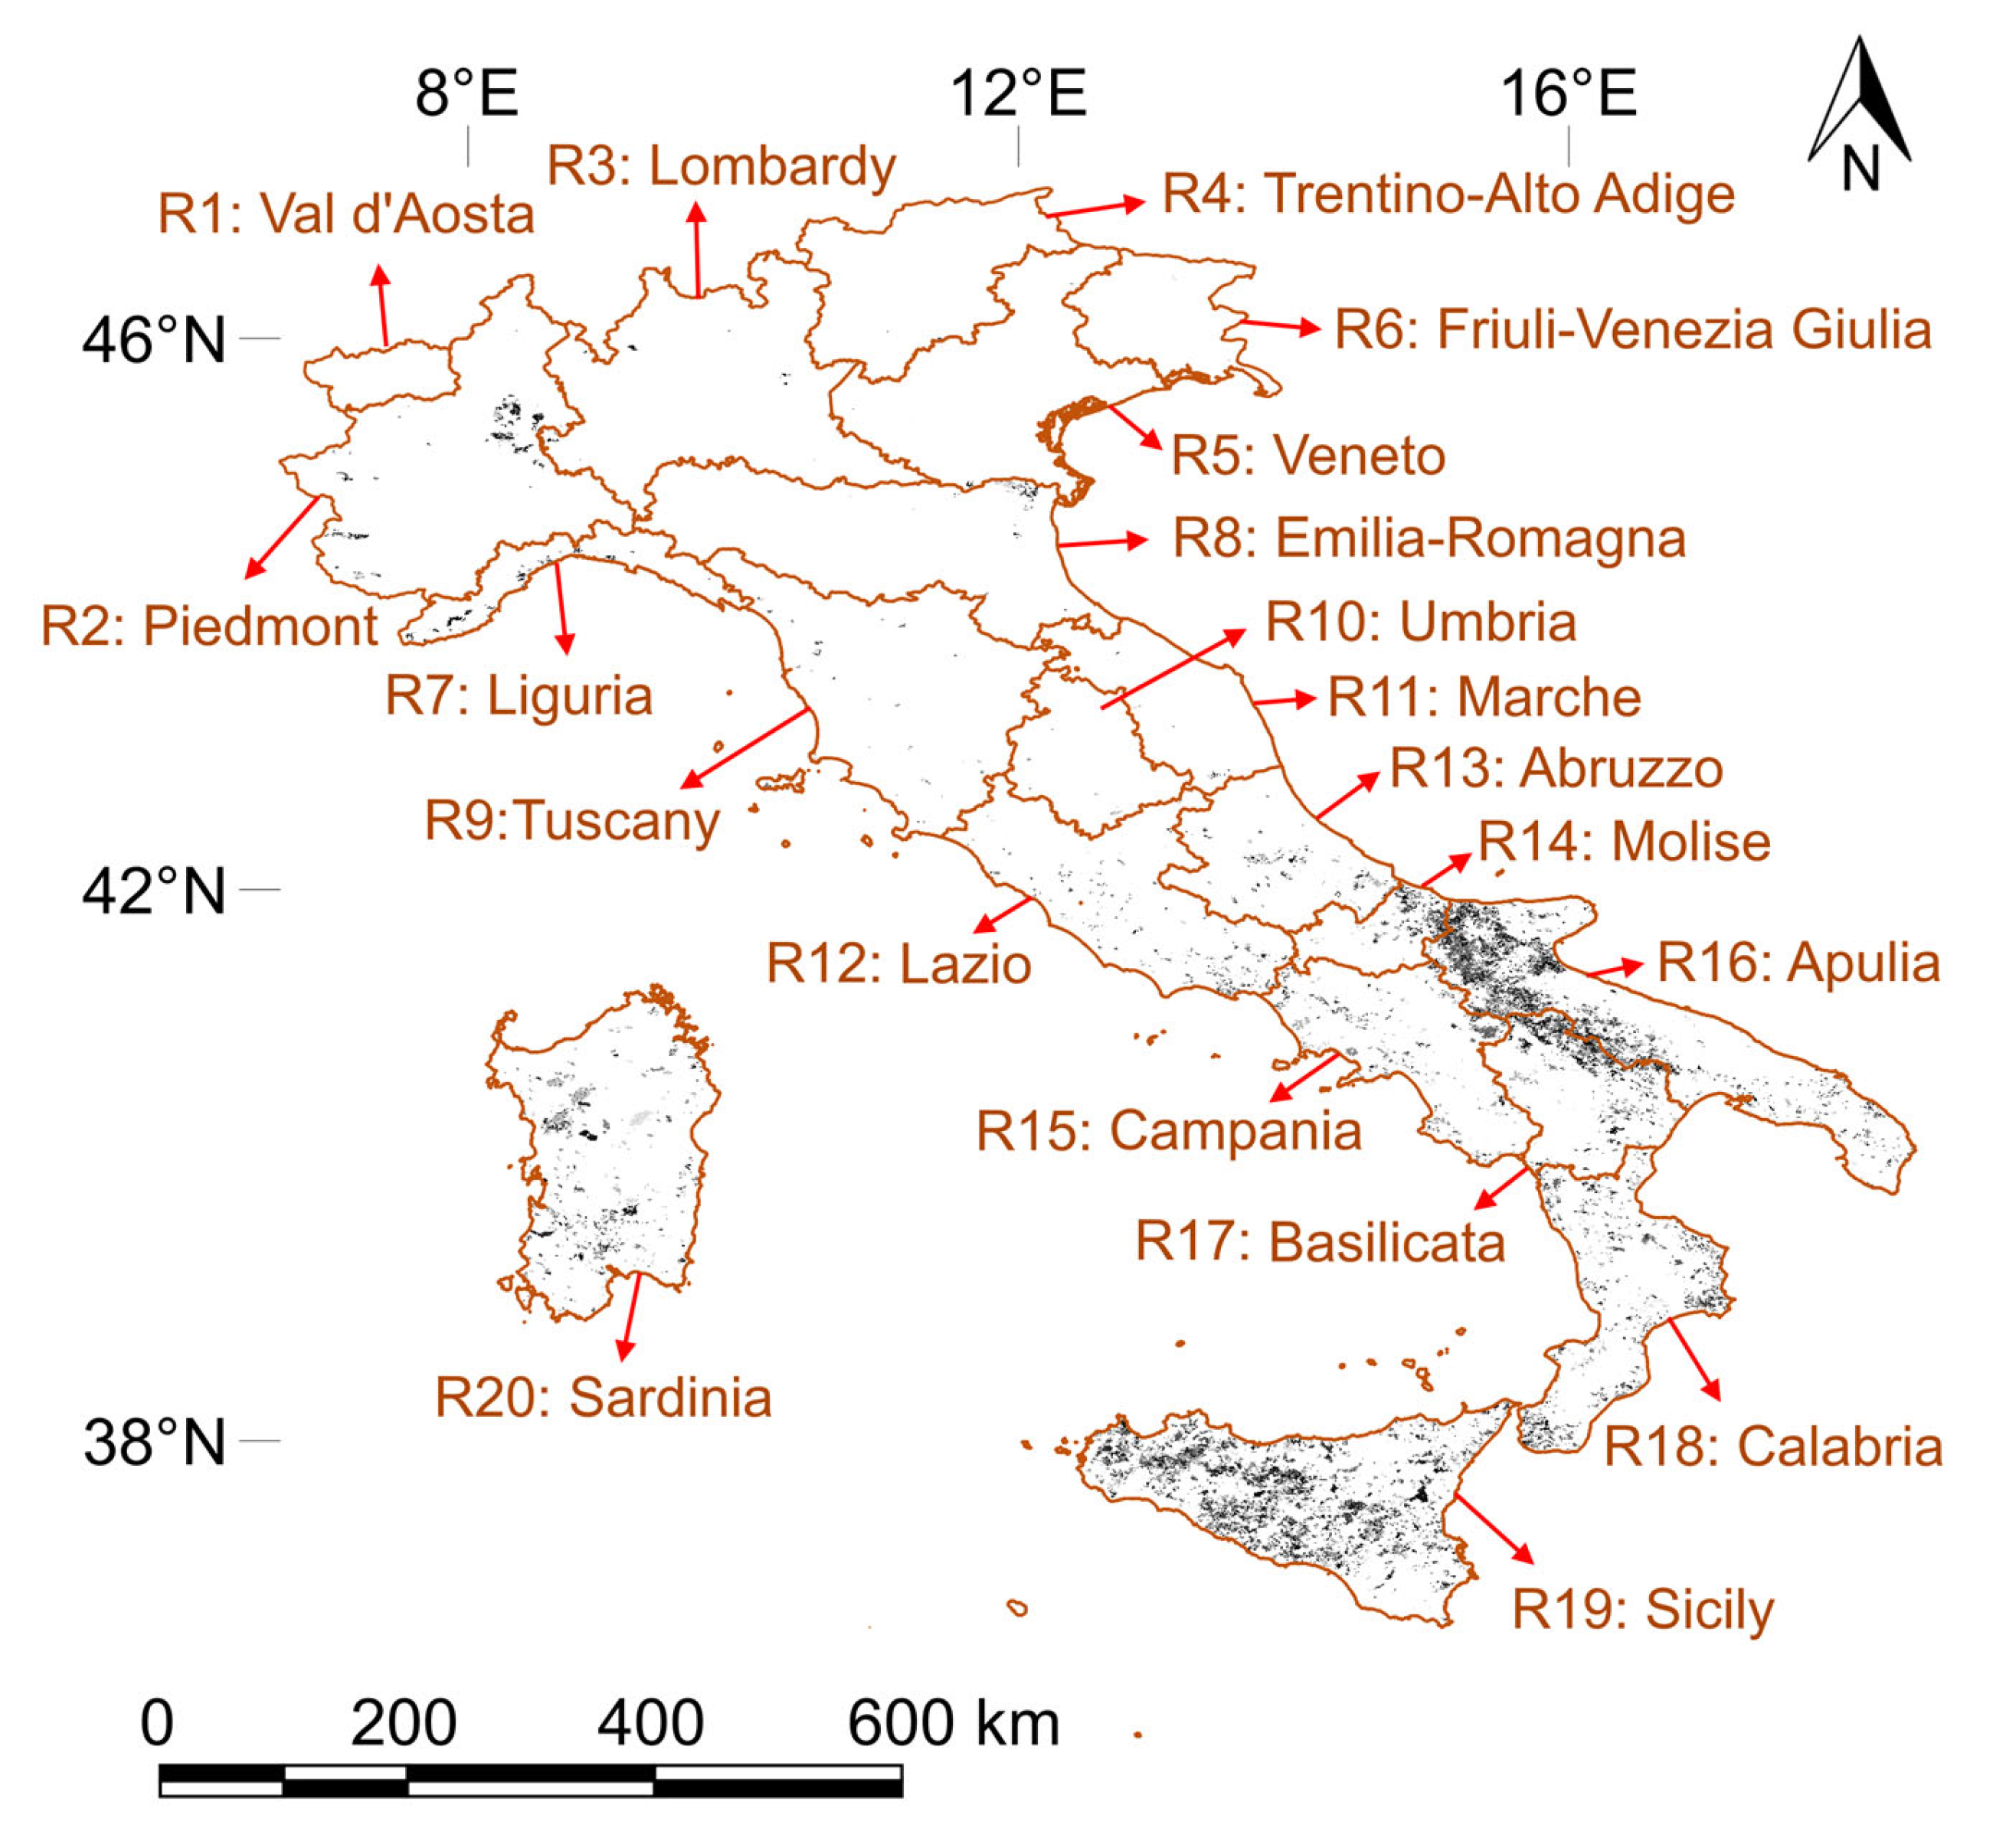
2.1. Study Region

Italy has a diverse climate: Alpine (north), Apennine (north and center), Peninsular, and Mediterranean. Its diverse climatic and soil conditions create a favorable environment for various plants and trees, including oleander plants, olive trees, European nettle trees, cypress trees, cherry laurel plants, etc. Grasslands and forests are the main land covers across Italy, and July and August are Italy’s warmest and driest months [5,23]. Italy has 20 administrative regions, labeled herein as R1, R2, …, and R20, as defined in Figure 1. The northern regions have colder winters with snowfall events and more humid summers, especially in regions with mountains, e.g., R1–R6, while the central, southern, and coastal regions usually have hot and dry summers and mild and wet winters [5].

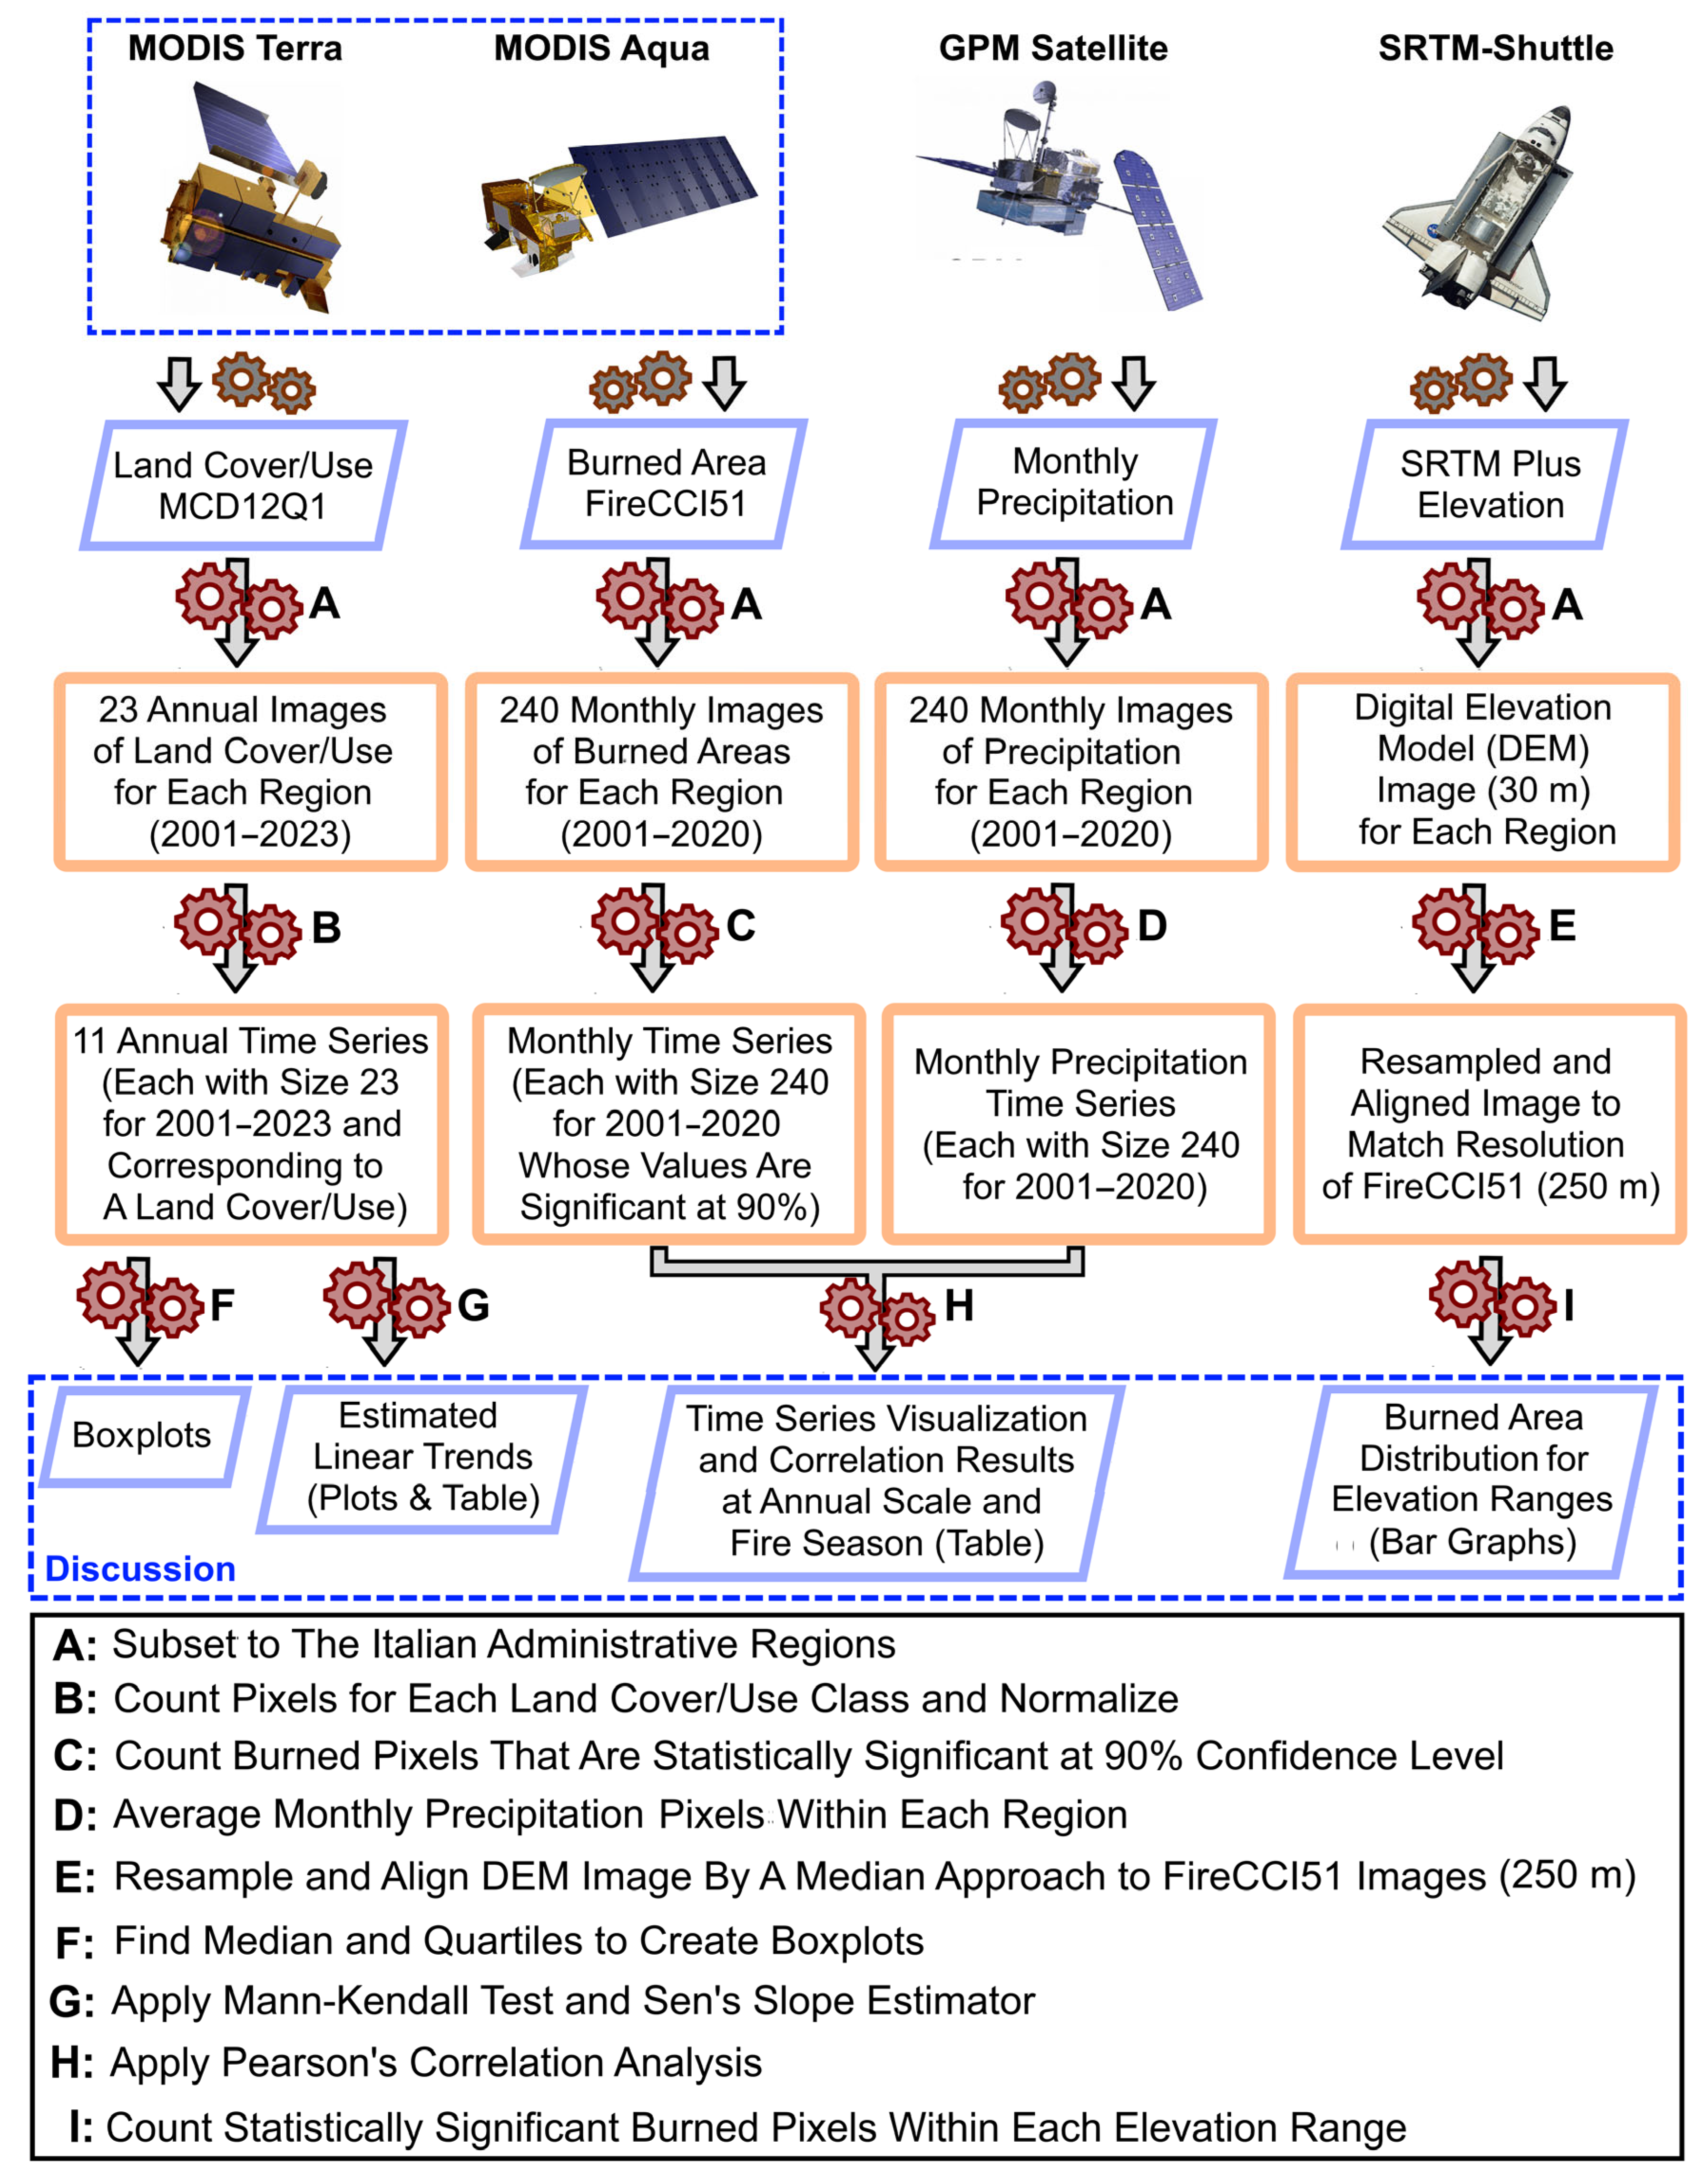
2.2. Datasets and Preprocessing

The datasets utilized in the present study are listed in Table 1. The MODIS land cover/use product employed herein is version 6.1 of MCD12Q1, obtained from supervised classifications of MODIS Terra and Aqua reflectance data [24]. This product is available in raster TIF format with a spatial resolution of 500 m and an annual temporal resolution.
For the current research, 23 MCD12Q1 images from 2001 to 2024 were downloaded for Italy and then clipped to each Italian region. For each calendar year and region, the total number of pixels for each land cover/use type was calculated and divided by the total number of pixels within that region. Then, the result was multiplied by 100 to obtain the percentage area coverage of each land cover/use type for that year and that region. With 23 years of data, 20 Italian regions, and 11 land cover/use types, this process provides 220 time series, each with a size of 23. In other words, each time series shows the percentage area coverage of a given land cover/use type in a given region during the 2001–2023 period.
Monthly MODIS Fire_cci Burned Area images (Fire Climate Change Initiative version 5.1: FireCCI51) at a spatial resolution of 250 m for the period 2001–2020 were employed in the present research. The process of deriving these images was based on a hybrid model. First, pixels with a high chance of being burned were detected according to the active fires. Then, the fire patch was detected using a contextual growing phase, controlled by adaptive thresholding, and the near-infrared (NIR) drop between pre- and post-fire images was used in the detection stage [25]. The confidence level band of this product was also used to select the burned areas that are statistically significant at a 90% confidence level.
Global Precipitation Measurement (GPM) monthly precipitation images were also employed for the 2001–2020 period. GPM values are obtained using a model that intercalibrates, merges, and interpolates all satellite microwave precipitation estimates, microwave-calibrated infrared satellite estimates, and precipitation gauge analyses [26]. In the present research, the number of burned pixels within each region was calculated to generate a monthly time series for temporal analysis and estimate the correlation between the number of burned pixels and monthly GPM precipitation for each region.

2.3. Boxplot

Boxplot generation is a popular data visualization technique that shows the distribution of a dataset, i.e., the locality, spread, and skewness. A boxplot conventionally has five values: lower extreme (minimum value before the lower fence), first quartile (greater than 25% of the data and less than the other 75%), second quartile (median), third quartile (larger than 75% of the data and smaller than the remaining 25%), and upper extreme (maximum value before the upper fence) [27]. In a boxplot, values falling outside the lower and upper fences are considered outliers.

2.4. Mann–Kendall Analysis and Sen’s Slope Estimator

Mann–Kendall trend analysis is a non-parametric model that determines whether there is a statistically significant increasing or decreasing trend in a time series. Sen’s slope of a time series is obtained by taking the median value of all the slopes calculated between every two points in the time series. The mathematical description of Mann–Kendall analysis and its associated Sen’s slope (MK-Sen) can be found in [28,29]. MK-Sen has been successfully applied to study the trend changes in land cover, vegetation, and climate time series in numerous studies [28,29,30]. Assume that [ t ,   f ] is a time series, where t is the time vector and f is the series vector; then, the estimated linear trend is given by Equation (1):
y = m e d i a n   f + S e n × t m e d i a n   t
where ‘Sen’ represents Sen’s slope.

2.5. Pearson’s Correlation Method

Pearson’s correlation is a metric which shows the amount of linear dependency between two variables [31,32]. Let p i be the monthly precipitation measurements and b i be the monthly burned areas. Pearson’s correlation between precipitation and burned areas is given by Equation (2):
r = i = 1 n ( p i p ¯ ) ( b i b ¯ ) i = 1 n p i p ¯ 2 i = 1 n b i b ¯ 2
where bar signifies the average, and n is the total number of months. Herein, n = 240 for the 2001–2020 period, and n = 80 for the fire season in 2001–2020. The correlation value in Equation (2) is a value between −1 and 1. Correlation values between −0.3 and 0.3 are weak, while values between −0.7 and −0.3 indicate a moderate negative linear dependency between the two variables, and those between 0.3 and 0.7 indicate a moderate positive linear dependency between the two variables. Correlations whose absolute values are greater than 0.7 indicate a strong linear dependency between the two variables [28,32].
Figure 2 shows a flowchart of the present research. Pearson’s correlation maps for NDVI–LST and NDVI–Precipitation are also illustrated in the Discussion section, modified from [5] to Italian administrative regions instead of Italian ecoregions. Still, they have not been incorporated into this flowchart for brevity. Briefly, MODIS–NDVI and MODIS–LST images for the 2001–2020 period were utilized to generate correlation maps for NDVI–LST and NDVI–Precipitation, thereby advancing the study of the interconnections between vegetation and climate, as well as their relationships with wildfires in Italian regions. The details and preprocessing steps for these datasets are described in [5].
All calculations, including image subsetting, spatial resampling, and image alignment, were performed in the Python programming language (Version 3.7.6) via the commands gdal.Warp() and gdal.ReprojectImage() with gdalconst.GRA_Med, and geospatial maps were generated using QGIS software (Version 3.30.1). For correlation maps, images of higher resolution were downsampled and aligned with those of lower resolution using a median approach. To match the temporal resolution of NDVI to LST and precipitation, a weighted method was used to bring 16-day intervals to monthly intervals [5]. Then, for NDVI–LST, the images were resampled to ~5.5 km, and for NDVI–Precipitation, the images were resampled to a GPM resolution, i.e., ~11 km, using a median approach [5].

3. Results

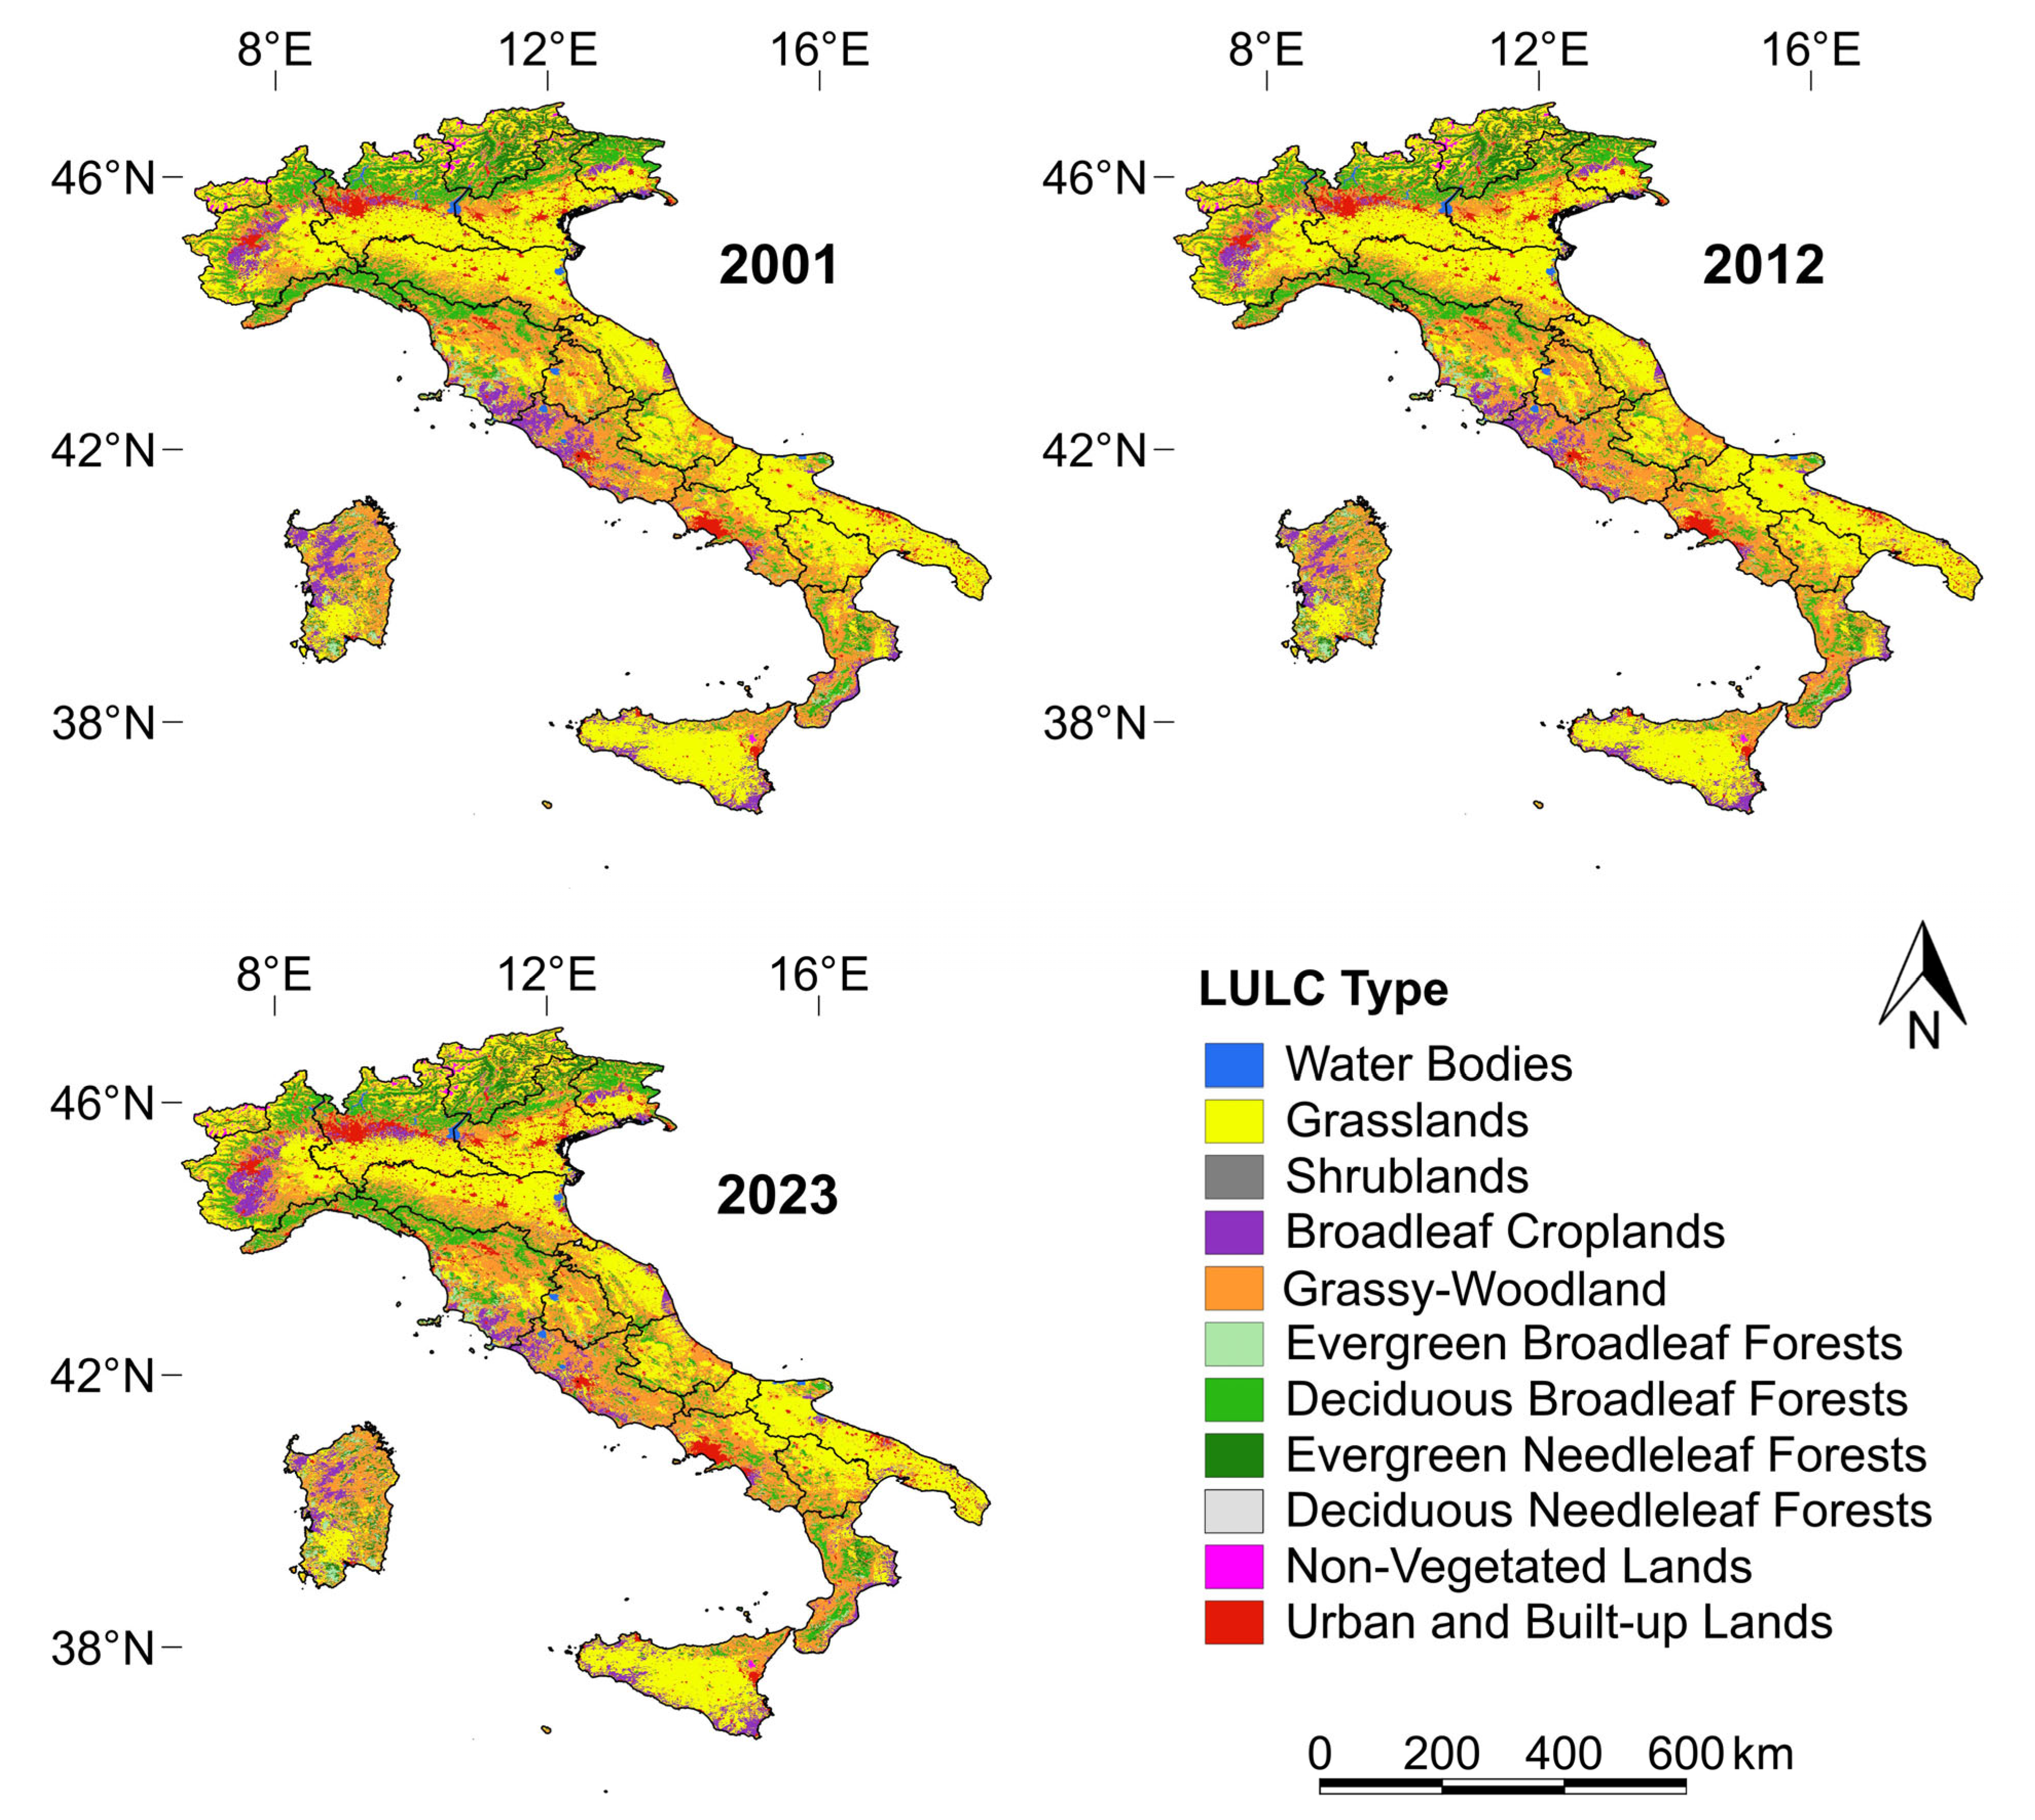
3.1. Distributions of Land Cover/Use Types

Three years are selected as examples to visualize the spatial distribution of land cover/use types: 2001, 2012, and 2023. The land cover/use maps for these three years are illustrated in Figure 3. One can observe that grasslands and grassy woodlands are dominant land cover types in most Italian regions. To demonstrate the distributions of each land cover/use type within each region over 23 years, a boxplot for the corresponding land cover/use time series (size 23) was generated. Figure 4 depicts the boxplots. One can observe that deciduous needleleaf forests are very insignificant, followed by shrublands. However, grasslands, grassy woodlands, deciduous broadleaf forests, and broadleaf croplands are the most significant land cover types with the most variations across the regions.

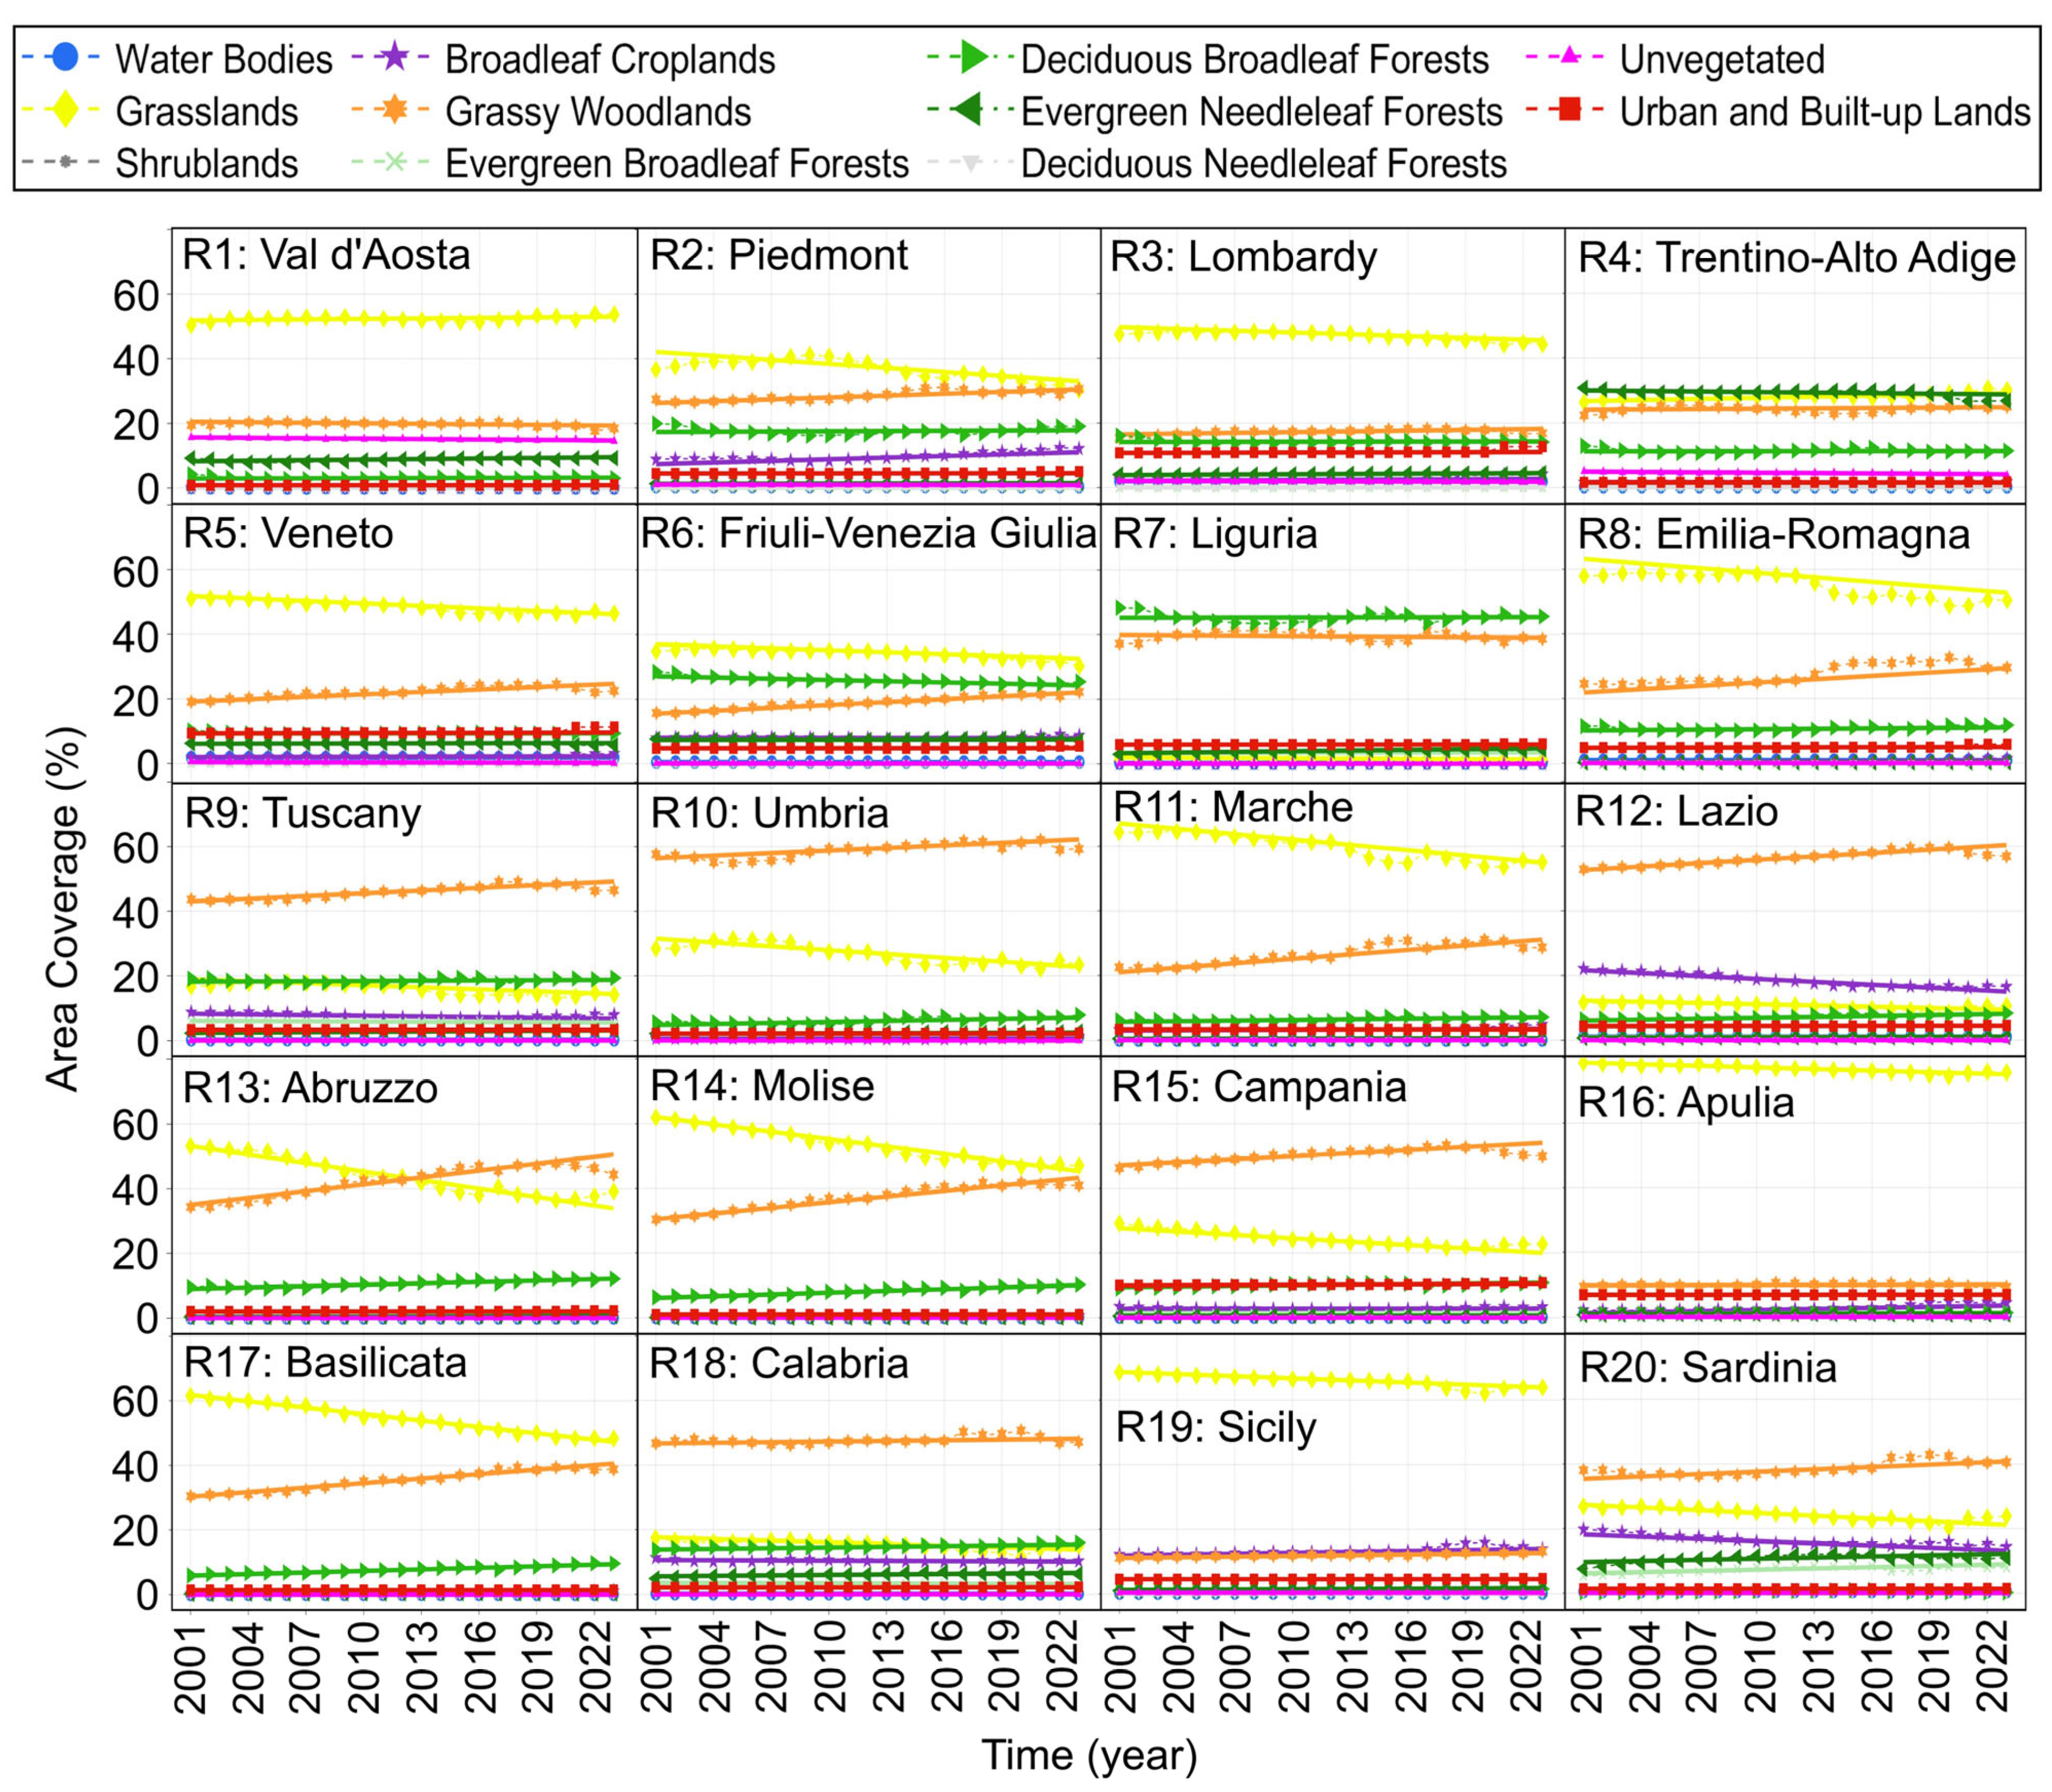
3.2. Trend Analysis of Land Cover/Use Time Series

The results of applying MK-Sen to 220 land cover/use time series are illustrated in Figure 5 and Table 2. It can be seen that grasslands have been significantly reducing since 2001 in many regions, more significantly in Abruzzo (−0.88%/year), Molise (−0.76%/year), Basilicata (−0.66%/year), Marche (−0.55%/year), Emilia-Romagna (−0.48%/year), Piedmont (−0.41%/year), Umbria (−0.40%/year), and Campania (−0.35%/year). Conversely, woodlands have been significantly increasing in these regions, i.e., grasslands have been transitioning to woodlands. Figure 5 also shows that, in some regions, woodlands have been transitioning back into grasslands since 2020, as is evident in Abruzzo and Campania. A significant decline in croplands is also observed in Lazio (−0.30%/year) and Sardinia (−0.23%/year), while Piedmont shows an increase in croplands (+0.17%/year).

3.3. Spatial Distribution of Wildfires Across Italy Since 2001

Figure 6 was produced by the union of all the monthly images of FireCCI51 for 2001–2020. It can be seen that central and southern Italy have experienced more wildfires over the two studied decades than northern Italy. Sicily, Apulia, and Basilicata had the most burned areas compared to other regions; see Table 3. On the other hand, northern regions, particularly Val d’Aosta, Trentino-Alto Adige, and Friuli-Venezia Giulia, had the fewest burned areas, which can be explained by the cooler and wetter climate conditions during the summer.

3.4. Temporal Distribution of Wildfires and Precipitation in Italian Regions Since 2001

Monthly GPM precipitation measurements and monthly burned areas at a 90% confidence level for each Italian administrative region were calculated, and the results are illustrated in Figure 7 and Figure 8. The y-axis values in these figures represent the percentage burned areas, calculated by dividing the total number of burned pixels at a 90% confidence level by the total number of pixels within each region, multiplied by 100. Figure 7 shows the graphs of all the northern regions, as well as those for Tuscany and Umbria, i.e., R1–R10. It can be seen that the burned areas are not significant in the northern regions, with their significance value being less than 0.5%. From the monthly precipitation time series (shown in blue), one can also observe a relatively wetter summer as compared to the southern regions. One can observe that most severe wildfires occurred during the summertime (July and August), with almost zero rainfall. Examples include the summer of 2012 in Umbria (Figure 7: R10), as well as the summers of 2007 and 2017 in most of the southern regions, such as Lazio, Abruzzo, Campania, Apulia, Basilicata, Calabria, and the islands of Sicily and Sardinia (Figure 8). One can also observe that the years 2007 and 2017 experienced the most fire events in most of the Italian regions

3.5. Correlation Results for Precipitation and Burned Areas

Pearson’s correlation results for monthly precipitation and monthly burned areas for each region are listed in Table 4. To investigate the impact of heat on wildfire occurrences, the correlation results between precipitation and monthly burned areas in the fire season (June, July, August, September) for the entirety of the study period (2001–2020) are also listed in Table 4.
The northern regions show weak negative correlations, while the southern regions, particularly in Apulia, Basilicata, and Calabria, show moderate negative correlations between precipitation and burned areas. The correlations are stronger during the fire season than most regions’ annual values, highlighting the role of temperature in influencing wildfire occurrences and severity.

3.6. Burned Area Distribution for Elevation Ranges

As shown in Figure 2, the SRTM-DEM images were resampled to a 250 m pixel size using the median method in Python and spatially aligned with the FireCCI images. Then, for each Italian administrative region, the number of burned pixels at a 90% confidence level within each elevation range (50 m intervals) was calculated, and bar graphs illustrating elevation range versus fire frequency are presented in Figure 9.
In Apulia, the mode of burned areas (maximum fire frequency) is in the lowlands, with an elevation range of 0–50 m. In Basilicata and Sicily, the maximum fire occurrences are within elevation ranges of 300–400 m and 200–300 m, respectively. The distribution of fire frequency based on elevation is bimodal. Careful examination of Figure 9 reveals that the burned areas occurred mainly in the elevation range of 0–500 m, except for Marche and Trentino-Alto Adige, as shown in Figure 1.

4. Discussion

4.1. Potential Driving Factors of Wildfires in Italy

During recent decades, progressive expansion of woodlands and forests has been observed in Italy, especially in hilly and mountainous areas, e.g., due to the abandoning of rural and agricultural lots [33,34]. The results of the present study confirm this woodland expansion, particularly in Central Italy, as also observed in [28]. Many researchers have suggested that land abandonment is a potential driving factor for increasing Italy wildfires [34]. Expanding woodlands in hilly and mountainous areas may increase the risk of wildfires and post-fire landslides [35]. This risk can increase further due to the gradual warming and drying trends observed across Italy during the past few decades, increasing the chance of heavy rainfalls after a prolonged hot and dry period.
Several factors cause wildfires in Italy. Wildfires in southern Italy, e.g., Sicily, are mainly human-driven [36,37]. Hot, dry, windy conditions spread the fires fast across the regions. As observed in Figure 7 and Figure 8, wildfires most often occurred in the central and southern regions in 2007 and 2017. It was reported that, in 2007, a total area of 27,730 ha was burned, and in 2017, a total area of 161,987 ha was burned [38]. In 2007 and 2017, temperatures were 1.2 °C and 1.3 °C above the average, and total precipitation was about 16% and 22% lower than the average, respectively [38,39,40]. In particular, July and August in 2007 and 2017 experienced relatively hotter and drier weather compared to other years (see Figure 8), favoring wildfires started mainly by humans [37]. Ghaderpour et al. [5,28] found a significant negative correlation between elevation and LST, which may be one of the reasons why most burned areas are observed in lowlands and areas with an elevation range of 0–500 m in most Italian regions, as seen in Figure 9.
Forest expansion has been observed across Italy over the past few decades due to factors such as agricultural land abandonment, which likely increases fire proneness across Italy [5,34]. The present research, using MODIS land cover/use images, confirms the earlier studies, with a decline in grasslands and an increase in woodlands, particularly in central regions (see Figure 5 and Table 2). Considering the gradual warming trend observed across Italy during the summertime [5] and the gradual drying trend during the spring (e.g., April) [5], and from the significant wildfire decadal pattern observable in Figure 8 (i.e., 2007 and 2017), severe wildfires are likely to occur in the next couple of years in central and southern regions, as fuel connectivity and build-up and climatic conditions can exacerbate wildfire severity, necessitating the implementation of prevention measures, such as fire bans, especially for areas that experience prolonged hot and dry conditions.
Adapted from Figure 4 in [5], Pearson’s correlation maps between the normalized difference vegetation index (NDVI) and land surface temperature (LST) and between the NDVI and GPM precipitation for the 2001–2020 period are illustrated in panels (a) and (b) of Figure 10, respectively. These maps were obtained by employing 16-day MODIS–NDVI (MOD13Q1 V6.1) images, monthly MODIS–LST (MOD11C3 V6.1) images, and monthly GPM (see Table 1) after spatiotemporal resampling and pixel alignment, as described in detail in [5]. However, in the current research, the borders of the administrative regions are overlaid on the maps instead of ecoregions. The average of Pearson’s correlation values within each region is also calculated, and the results are listed in Table 5. One can see that significant positive correlations ( r > 0.7) exist between the NDVI and LST in northern regions (R1–R7), while significant negative correlations exist between the NDVI and LST in Apulia ( r 0.59 ), Sicily ( r 0.69 ), and Sardinia ( r 0.74 ). The two islands of Sicily and Sardinia also show a relatively high positive correlation ( r > 0.3) between the NDVI and precipitation. This indicates vegetation stress during hot and dry summers in Apulia, Sicily, and Sardinia and high susceptibility to wildfires during this period, as shown in Figure 6 and Table 3. It is worth noting that human-made fires are also a significant contributor to wildfires in these regions, as mentioned earlier.

4.2. Ecological and Planning Implications

Hidalgo et al. [41] studied fragmented landscapes in Mediterranean regions and observed a high rate of transformation in fragmented landscapes in vulnerable areas, such as Apulia, where species migration is complex. An increase in patch fragmentation or density can reduce connectivity and the number of habitat patches, which, in turn, can decrease the ecosystem’s potential to provide essential services, such as clean water, pollination, and carbon sequestration, thereby negatively affecting the value of ecosystem services [42]. Therefore, regional sustainability planning and proper land use management have become crucial.
Several studies have investigated the potential impact of climate change on wildfires and ecosystems in Italy. For example, Lozano et al. [43] simulated wildfires using the minimum travel time fire spread model and projected an increase in burn probability and fire size for the 2041–2070 period, which may significantly impact Mediterranean ecosystems. In another study, Ferrara et al. [44] examined 174 indicators and found significant relationships between socioeconomic contexts and wildfire regimes on a municipal scale in Italy from 2001 to 2007. They also suggested that specific wildfire protection plans are required for rural areas. Michetti and Pinar [45] analyzed monthly burned areas for Italian regions during the 2000–2011 period and used climate change projections for the 2016–2035 period to project burned areas across Italy. They also highlighted the role of education and the suppression of fraudulent activity in controlling the fire regime. The present study provides further elaboration on wildfire events and their influential factors for Italian administrative regions over a two-decade period (2001–2020).

4.3. Limitations and Recommendations

This study has some limitations. There are uncertainties involved in the satellite images and preprocessing steps. For example, despite the daily revisiting of MODIS satellites and annual estimates of land cover/use utilizing sophisticated classification models, clouds and atmospheric noise may remain unfiltered and potentially bias the land cover estimates [5]. Pixel counting is a popular method of estimating class areas; however, this estimation might be biased due to counterbalancing between omission and commission errors [46]. The spatial resolution of satellite images and mixed pixels can impact classification accuracy [46]. The use of different trend analysis models may also result in significantly different outcomes. For example, median-based models like MK-Sen are less sensitive to outliers than average-based models like linear regression. As observed in Figure 3, there were not many outliers in each land cover/use time series, so MK-Sen and traditional linear regression models produce approximately the same outcomes. In [5], a significant declining trend in grasslands and a rising trend in grassy woodlands were observed in Italian ecoregions, particularly in Central Italy and the Apennine region, utilizing linear regression, which confirms the results of the present study.
Despite the low resolution of the MOD12Q1 product, this study still provides insight into how the land cover/use types have been changing over the years. Higher-resolution satellite images, such as Landsat (30 m) and Sentinel 2 (10 m), are recommended for more localized studies. Likewise, the MODIS burned area product performs well in detecting large-sized fires during the summer season, as it is less affected by cloud contamination, but this product is less likely to detect small-sized burned areas. For instance, Fusco et al. [47] showed that, in the western United States, fire events can be effectively detected in the summer season for tree and herb land cover classes; however, small fire events on shrublands may be undetected, and so ground-based data or higher-resolution satellite images are useful. Nevertheless, the FireCCI51 product has been validated in various regions, including in the Mediterranean, Latin America, and the Caribbean, by numerous researchers, demonstrating its effectiveness in detecting burned areas [48,49].

5. Conclusions

This paper employed MODIS land cover/use images from 2001 to 2024 (23 years) to study the interannual changes in each land cover/use type within each Italian administrative region. A total of 220 time series, each with 23 observations, were analyzed by MK-Sen for estimating linear trends. The results demonstrated a significant gradual reduction in grasslands and an increase in grassy woodlands and forests, particularly in central regions. This study also analyzed the MODIS burned area product FireCCI51and monthly GPM precipitation measurements for 2001–2020 (two decades) and estimated the correlation between them annually and seasonally. It was found that southern regions have experienced many more wildfires than northern regions, particularly in Sicily, Apulia, and Basilicata. Moderate negative correlations between precipitation and burned areas were also observed in Lazio, Apulia, Basilicata, and Calabria, and these correlations were more significant during the summertime. In many regions, most of the burned areas were observed within the elevation range of 0–500 m. Furthermore, significant positive correlations between the NDVI and LST were observed in northern regions with relatively fewer burned areas. In Apulia, Sicily, and Sardinia, a significant negative correlation exists between the NDVI and LST, where vegetation stress and dryness can contribute to wildfire occurrences and spread. Additionally, a positive correlation was observed between the NDVI and precipitation, highlighting the importance of rainfall events for greening. The increase in woodlands, gradual warming, and prolonged drought periods could potentially increase the risk of wildfires and post-fire landslides in the future, especially in central and southern regions, suggesting an urgent need for proper policymaking, forest management, education, and training.

Author Contributions

Conceptualization, E.G., F.B., G.S.M., P.M.; software, E.G., formal analysis, E.G., writing—original draft preparation, E.G.; writing—review and editing, F.B., G.S.M., P.M. All authors have read and agreed to the published version of the manuscript.

Funding

This research was funded by Space It Up project funded by ASI and the Ministry of University and Research, MUR, under contract n. 2024–5-E.0 CUP n. I53D24000060005. This research was also supported by CERI research center at Sapienza University of Rome.

Data Availability Statement

The MODIS burned area product is freely available at https://doi.org/10.5285/58f00d8814064b79a0c49662ad3af537. The MODIS Land Cover product is freely available at https://doi.org/10.5067/MODIS/MCD12Q1.061. The GPM monthly precipitation product is publicly available at https://doi.org/10.5067/GPM/IMERG/3B-MONTH/07. MODIS–LST and MODIS–NDVI images are also publicly available online at https://doi.org/10.5067/MODIS/MOD11C3.061 and https://doi.org/10.5067/MODIS/MOD13Q1.061, respectively. The SRTM–DEM raster is also available at https://doi.org/10.1029/2005RG000183.

Acknowledgments

The authors acknowledge the scientists and personnel in NASA JPL for providing the MODIS land cover and SRTM datasets utilized in this research. The authors acknowledge Space It Up project funded by ASI and the Ministry of University and Research, MUR, under contract n. 2024–5-E.0 CUP n. I53D24000060005. Thanks to CERI research center at Sapienza University of Rome for their support.

Conflicts of Interest

Authors Ebrahim Ghaderpour, Francesca Bozzano, Gabriele Scarascia Mugnozza and Paolo Mazzanti were employed by the company NHAZCA s.r.l. All authors declare that the research was conducted in the absence of any commercial or financial relationships that could be construed as a potential conflict of interest.

References

  1. Berčák, R.; Holuša, J.; Kaczmarowski, J.; Tyburski, Ł.; Szczygieł, R.; Held, A.; Vacik, H.; Slivinský, J.; Chromek, I. Fire Protection Principles and Recommendations in Disturbed Forest Areas in Central Europe: A Review. Fire 2023, 6, 310. [Google Scholar] [CrossRef]
  2. González-Marín, A.; Garrido-Cumbrera, M. Assessing urban vegetation inequalities: Methodological insights and evidence. Ecol. Inform. 2025, 86, 102987. [Google Scholar] [CrossRef]
  3. Murgia, I.; Vitali, A.; Giadrossich, F.; Tonelli, E.; Baglioni, L.; Cohen, D.; Schwarz, M.; Urbinati, C. Effects of Land Cover Changes on Shallow Landslide Susceptibility Using SlideforMAP Software (Mt. Nerone, Italy). Land 2024, 13, 1575. [Google Scholar] [CrossRef]
  4. Patacca, M.; Lindner, M.; Lucas-Borja, M.E.; Cordonnier, T.; Fidej, G.; Gardiner, B.; Hauf, Y.; Jasinevičius, G.; Labonne, S.; Linkevičius, E.; et al. Significant increase in natural disturbance impacts on European forests since 1950. Glob. Change Biol. 2023, 29, 1359–1376. [Google Scholar] [CrossRef]
  5. Ghaderpour, E.; Mazzanti, P.; Scarascia Mugnozza, G.; Bozzano, F. Coherency and phase delay analyses between land cover and climate across Italy via the least-squares wavelet software. Int. J. Appl. Earth Obs. Geoinf. 2023, 118, 103241. [Google Scholar] [CrossRef]
  6. Chen, S.; Zhuang, Q.; Taheripour, F.; Yuan, Y.; Benavidez, L. Assessment of global land cover changes using satellite data: Intermittent and long-term land cover changes from 2001 to 2020. Environ. Res. Lett. 2025, 20, 034045. [Google Scholar] [CrossRef]
  7. Salavati, G.; Saniei, E.; Ghaderpour, E.; Hassan, Q.K. Wildfire Risk Forecasting Using Weights of Evidence and Statistical Index Models. Sustainability 2022, 14, 3881. [Google Scholar] [CrossRef]
  8. Farid, A.; Alam, M.K.; Goli, V.S.N.S.; Akin, I.D.; Akinleye, T.; Chen, X.; Cheng, Q.; Cleall, P.; Cuomo, S.; Foresta, V.; et al. A Review of the Occurrence and Causes for Wildfires and Their Impacts on the Geoenvironment. Fire 2024, 7, 295. [Google Scholar] [CrossRef]
  9. Culler, E.S.; Livneh, B.; Rajagopalan, B.; Tiampo, K.F. A data-driven evaluation of post-fire landslide susceptibility. Nat. Hazards Earth Syst. Sci. 2023, 23, 1631–1652. [Google Scholar] [CrossRef]
  10. Akosah, S.; Gratchev, I. Systematic Review of Post-Wildfire Landslides. GeoHazards 2025, 6, 12. [Google Scholar] [CrossRef]
  11. Fan, D.; Wang, M.; Liang, T.; He, H.; Zeng, Y.; Fu, B. Estimation and trend analysis of carbon emissions from forest fires in mainland China from 2011 to 2021. Ecol. Inform. 2024, 81, 102572. [Google Scholar] [CrossRef]
  12. Hardtke, L.A.; Blanco, P.D.; del Valle, H.F.; Metternicht, G.I.; Sione, W.F. Semi-automated mapping of burned areas in semi-arid ecosystems using MODIS time-series imagery. Int. J. Appl. Earth Obs. Geoinf. 2015, 38, 25–35. [Google Scholar] [CrossRef]
  13. Dadkhah, H.; Rana, D.; Ghaderpour, E.; Mazzanti, P. Analyzing wildfire patterns and climate interactions in Campania, Italy: A multi-sensor remote sensing study. Ecol. Inf. 2025, 90, 103249. [Google Scholar] [CrossRef]
  14. Lizundia-Loiola, J.; Franquesa, M.; Boettcher, M.; Kirches, G.; Pettinari, M.L.; Chuvieco, E. Implementation of the Burned Area Component of the Copernicus Climate Change Service: From MODIS to OLCI Data. Remote Sens. 2021, 13, 4295. [Google Scholar] [CrossRef]
  15. Moritz, M.A.; Parisien, M.-A.; Batllori, E.; Krawchuk, M.A.; Van Dorn, J.; Ganz, D.J.; Hayhoe, K. Climate change and disruptions to global fire activity. Ecosphere 2012, 3, 49. [Google Scholar] [CrossRef]
  16. Liu, Y.; Stanturf, J.; Goodrick, S. Wildfire potential evaluation during a drought event with a regional climate model and NDVI. Ecol. Inform. 2010, 5, 418–428. [Google Scholar] [CrossRef]
  17. Zahura, F.T.; Bisht, G.; Li, Z.; McKnight, S.; Chen, X. Impact of topography and climate on post-fire vegetation recovery across different burn severity and land cover types through random forest. Ecol. Inform. 2024, 82, 102757. [Google Scholar] [CrossRef]
  18. Pereira, M.G.; Gonçalves, N.; Amraoui, M. The Influence of Wildfire Climate on Wildfire Incidence: The Case of Portugal. Fire 2024, 7, 234. [Google Scholar] [CrossRef]
  19. Xepapadeas, P.; Douvis, K.; Kapsomenakis, I.; Xepapadeas, A.; Zerefos, C. Assessing the Link between Wildfires, Vulnerability, and Climate Change: Insights from the Regions of Greece. Sustainability 2024, 16, 4822. [Google Scholar] [CrossRef]
  20. Ghaderpour, E.; Masciulli, C.; Zocchi, M.; Bozzano, F.; Scarascia Mugnozza, G.; Mazzanti, P. Estimating Reactivation Times and Velocities of Slow-Moving Landslides via PS-InSAR and Their Relationship with Precipitation in Central Italy. Remote Sens. 2024, 16, 3055. [Google Scholar] [CrossRef]
  21. Tapiador, F.J.; Turk, F.J.; Petersen, W.; Hou, A.Y.; García-Ortega, E.; Machado, L.A.T.; Angelis, C.F.; Salio, P.; Kidd, C.; Huffman, G.J.; et al. Global precipitation measurement: Methods, datasets and applications. Atmos. Res. 2012, 104–105, 70–97. [Google Scholar] [CrossRef]
  22. Kirschbaum, D.; Stanley, T. Satellite-Based Assessment of Rainfall-Triggered Landslide Hazard for Situational Awareness. Earth’s Future 2018, 6, 505–523. [Google Scholar] [CrossRef] [PubMed]
  23. Ghaderpour, E.; Dadkhah, H.; Dabiri, H.; Bozzano, F.; Scarascia Mugnozza, G.; Mazzanti, P. Precipitation Time Series Analysis and Forecasting for Italian Regions. Eng. Proc. 2023, 39, 23. [Google Scholar] [CrossRef]
  24. Sulla-Menashe, D.; Gray, J.M.; Abercrombie, S.P.; Friedl, M.A. Hierarchical mapping of annual global land cover 2001 to present: The MODIS Collection 6 Land Cover product. Remote Sens. Environ. 2019, 222, 183–194. [Google Scholar] [CrossRef]
  25. Lizundia-Loiola, J.; Otón, G.; Ramo, R.; Chuvieco, E. A spatio-temporal active-fire clustering approach for global burned area mapping at 250 m from MODIS data. Remote Sens. Environ. 2020, 236, 111493. [Google Scholar] [CrossRef]
  26. Huffman, G.J.; Bolvin, D.T.; Braithwaite, D.; Hsu, K.; Joyce, R. NASA Global Precipitation Measurement (GPM) Integrated Multi-SatellitE Retrievals for GPM; NASA Goddard Earth Sciences Data and Information Services Center: Greenbelt, MD, USA, 2017. [Google Scholar] [CrossRef]
  27. McGill, R.; Tukey, J.W.; Larsen, W.A. Variations of box plots. Am. Stat. 1978, 32, 12–16. [Google Scholar] [CrossRef]
  28. Ghaderpour, E.; Mazzanti, P.; Bozzano, F.; Scarascia Mugnozza, G. Trend Analysis of MODIS Land Surface Temperature and Land Cover in Central Italy. Land 2024, 13, 796. [Google Scholar] [CrossRef]
  29. Khosravi, Y.; Homayouni, S.; Ouarda, T.B.M.J. Spatio-temporal evaluation of MODIS temperature vegetation dryness index in the Middle East. Ecol. Inform. 2024, 84, 102894. [Google Scholar] [CrossRef]
  30. Dash, P.; Shekhar, S.; Paul, V.; Feng, G. Influence of Land Use and Land Cover Changes and Precipitation Patterns on Groundwater Storage in the Mississippi River Watershed: Insights from GRACE Satellite Data. Remote Sens. 2024, 16, 4285. [Google Scholar] [CrossRef]
  31. Ratner, B. The correlation coefficient: Its values range between +1/−1, or do they? J. Target. Meas. Anal. Mark. 2009, 17, 139–142. [Google Scholar] [CrossRef]
  32. Warne, R.T. Correlation. In Statistics for the Social Sciences: A General Linear Model Approach; Cambridge University Press: Cambridge, UK, 2020; pp. 334–374. [Google Scholar] [CrossRef]
  33. Garbarino, M.; Morresi, D.; Urbinati, C.; Malandra, F.; Motta, R.; Sibona, E.M.; Vitali, A.; Weisberg, P.J. Contrasting land use legacy effects on forest landscape dynam-ics in the Italian Alps and the Apennines. Landsc. Ecol. 2020, 35, 2679–2694. [Google Scholar] [CrossRef]
  34. Ascoli, D.; Moris, J.V.; Marchetti, M.; Sallustio, L. Land use change towards forests and wooded land correlates with large and frequent wildfires in Italy. Ann. Silvic. Res. 2021, 46, 177–188. [Google Scholar] [CrossRef]
  35. Carabella, C.; Miccadei, E.; Paglia, G.; Sciarra, N. Post-Wildfire Landslide Hazard Assessment: The Case of The 2017 Montagna Del Morrone Fire (Central Apennines, Italy). Geosciences 2019, 9, 175. [Google Scholar] [CrossRef]
  36. Trucchia, A.; Meschi, G.; Fiorucci, P.; Gollini, A.; Negro, D. Defining Wildfire Susceptibility Maps in Italy for Understanding Seasonal Wildfire Regimes at the National Level. Fire 2022, 5, 30. [Google Scholar] [CrossRef]
  37. Lovreglio, R.; Leone, V.; Giaquinto, P.; Notarnicola, A. Wildfire cause analysis: Four case-studies in southern Italy. iForest 2010, 3, 8–15. [Google Scholar] [CrossRef]
  38. Malandra, F.; Vitali, A.; Morresi, D.; Garbarino, M.; Foster, D.E.; Stephens, S.L.; Urbinati, C. Burn Severity Drivers in Italian Large Wildfires. Fire 2022, 5, 180. [Google Scholar] [CrossRef]
  39. Baffo, F.; Desiato, F.; Fioravanti, G.; Frascehtti, P.; Perconti, W.; Toreti, A.; Morucci, S.; Pavan, V.; Cacciamani, C.; Stel, F.; et al. Gli Indicatori del Clima in Italia nel 2007; Agenzia per la Protezione Dell’ambiente e per i Servizi Tecnici: Roma, Italy, 2007. [Google Scholar]
  40. Desiato, F.; Fioravanti, G.; Fraschetti, P.; Perconti, W.; Piervitali, E.; Pavan, V. Gli Indicatori del Clima in Italia 2017; ISPRA—Istituto Superiore per la Protezione e la Ricerca Ambientale: Roma, Italy, 2018; ISBN 978-88-448-0904-1. [Google Scholar]
  41. Hidalgo, P.J.; Hernández, H.; Sánchez-Almendro, A.J.; López-Tirado, J.; Vessella, F.; Porras, R. Fragmentation and Connectivity of Island Forests in Agricultural Mediterranean Environments: A Comparative Study between the Guadalquivir Valley (Spain) and the Apulia Region (Italy). Forests 2021, 12, 1201. [Google Scholar] [CrossRef]
  42. Biswas, G.; Sengupta, A.; Alfaisal, F.M.; Alam, S.; Alharbi, R.S.; Jeon, B.-H. Evaluating the effects of landscape fragmentation on ecosystem services: A three-decade perspective. Ecol. Inf. 2023, 77, 102283. [Google Scholar] [CrossRef]
  43. Lozano, O.M.; Salis, M.; Ager, A.A.; Arca, B.; Alcasena, F.J.; Monteiro, A.T.; Finney, M.A.; Del Giudice, L.; Scoccimarro, E.; Spano, D. Assessing Climate Change Impacts on Wildfire Exposure in Mediterranean Areas. Risk Anal. 2017, 37, 1898–1916. [Google Scholar] [CrossRef]
  44. Ferrara, C.; Salvati, L.; Corona, P.; Romano, R.; Marchi, M. The background context matters: Local-scale socioeconomic conditions and the spatial distribution of wildfires in Italy. Sci. Total Environ. 2019, 654, 43–52. [Google Scholar] [CrossRef]
  45. Michetti, M.; Pinar, M. Forest Fires Across Italian Regions and Implications for Climate Change: A Panel Data Analysis. Environ. Resour. Econ. 2019, 72, 207–246. [Google Scholar] [CrossRef]
  46. Waldner, F.; Defourny, P. Where can pixel counting area estimates meet user-defined accuracy requirements? Int. J. Appl. Earth Obs. Geoinf. 2017, 60, 1–10. [Google Scholar] [CrossRef]
  47. Fusco, E.J.; Finn, J.T.; Abatzoglou, J.T.; Balch, J.K.; Dadashi, S.; Bradley, B.A. Detection rates and biases of fire observations from MODIS and agency reports in the conterminous United States. Remote Sens. Environ. 2019, 220, 30–40. [Google Scholar] [CrossRef]
  48. Katagis, T.; Gitas, I.Z. Assessing the Accuracy of MODIS MCD64A1 C6 and FireCCI51 Burned Area Products in Mediterranean Ecosystems. Remote Sens. 2022, 14, 602. [Google Scholar] [CrossRef]
  49. Gonzalez-Ibarzabal, J.; Franquesa, M.; Rodriguez-Montellano, A.; Bastarrika, A. Sentinel-2 Reference Fire Perimeters for the Assessment of Burned Area Products over Latin America and the Caribbean for the Year 2019. Remote Sens. 2024, 16, 1166. [Google Scholar] [CrossRef]
Figure 1. The study region: Italy and the boundaries of its 20 administrative regions, along with an elevation map from Shuttle Radar Topography Mission (SRTM) plus, derived from [23].
Land 14 01443 g001
Figure 2. Flowchart of this study.
Land 14 01443 g002
Figure 3. MODIS land cover of Italy in the years 2001, 2012, and 2023.
Land 14 01443 g003
Figure 4. The boxplots of MODIS land cover areas for the 20 Italian administrative regions; see Figure 1 for the names of the regions, labeled here as R1, R2, …, R20. There are 23 observations (23 years) for the generation of each individual boxplot.
Land 14 01443 g004
Figure 5. Annual MODIS land cover time series for Italian regions during the 2001–2023 (23 years) period, along with their estimated MK-Sen trends (solid lines).
Land 14 01443 g005
Figure 6. Total burned areas (in black) during the 2001–2020 period across the twenty Italian administrative regions.
Land 14 01443 g006
Figure 7. Monthly precipitation and monthly burned areas for Italian administrative regions ((R1R10): northern and central Italy); see Figure 6 and Table 3 for more details.
Land 14 01443 g007
Figure 8. Monthly precipitation and monthly burned areas for Italian administrative regions ((R11R20): central and southern Italy).
Land 14 01443 g008
Figure 9. Bar graphs of fire frequency vs. elevation ranges (50 m intervals) for Italian administrative regions.
Land 14 01443 g009
Figure 10. Pearson’s correlation maps (a) between NDVI and LST and (b) between NDVI and precipitation, created using spatially aligned per-pixel time series over two decades (2001–2020). The borders in the maps represent the borders of Italian administrative regions; see Figure 1 or 6 for their names.
Land 14 01443 g010
Table 1. Descriptions of the datasets employed in this research. The “Date” column shows the period when specific data were available (true at the time of when this study was conducted).
Product NameSpatial ResolutionDateDescription Source
STRM Plus30 m2000Shuttle Radar Topography
Mission (SRTM) plus—Digital Elevation Model (DEM)
https://doi.org/10.1029/2005RG000183 (accessed on 11 May 2025)
MCD12Q1500 m2001–2023
Annual
MODIS Land Cover Type
(11 classes)
https://doi.org/10.5067/MODIS/MCD12Q1.061 (accessed on 11 May 2025)
FireCCI51250 m2001–2020
Monthly
MODIS Fire_cci Burned
Area Pixel Product
https://doi.org/10.5285/58f00d8814064b79a0c49662ad3af537
(accessed on 11 May 2025)
GPM0.1 × 0.1 degree2001–2020
Monthly
Monthly Global
Precipitation Measurement
https://doi.org/10.5067/GPM/IMERG/3B-MONTH/07
(accessed on 11 May 2025)
LST0.05 × 0.05 degree2001–2020
Monthly
Monthly Land Surface
Temperature
https://doi.org/10.5067/MODIS/MOD11C3.061 (accessed on 11 June 2025)
NDVI250 m2001–2020
16-day
Normalized Difference
Vegetation Index
https://doi.org/10.5067/MODIS/MOD13Q1.061 (accessed on 11 June 2025)
Table 2. The MK-Sen results for MODIS land cover/use types in Italian regions. The first column shows the labels of the regions, as defined in Figure 1. Also, “*” and “**” mean that the estimated Sen’s slope is statistically significant at 95% and 99% confidence intervals, respectively. Note that the land cover class “Deciduous Needleleaf Forests” was insignificant. For the form a.aa + b.bb t, a.aa is the estimated intercept (predicted value in % in 2001), and b.bb is Sen’s slope in %/year. The boldface values are significant.
RWater BodiesGrasslandsShrublandsBroadleaf Croplands Grassy
Woodlands
Evergreen
Broadleaf Forests
Deciduous Broadleaf ForestsEvergreen Needleleaf ForestsUnvegetatedUrban
and Built-Up Lands
10.04 + 0.00 t51.87 + 0.05 t0.00 + 0.00 t0.09 + 0.00 **t20.50 − 0.05 **t00.00 − 0.00 t2.88 + 0.01 t8.25 + 0.06 **t15.64 − 0.04 **t0.83 + 0.00 **t
20.39 + 0.00 **t42.11 − 0.41 **t0.02 + 0.00 **t7.36 + 0.17 **t26.30 + 0.19 **t0.00 + 0.00 t17.31 + 0.03 t1.25 + 0.01 **t1.01 − 0.01 **t4.45 + 0.00 **t
31.95 + 0.00 **t49.67 − 0.19 **t0.01 + 0.00 *t2.04 + 0.03 t16.48 + 0.08 **t0.00 + 0.00 t14.11 + 0.01 t3.86 + 0.03 **t2.06 − 0.01 **t10.73 + 0.01 **t
40.13 + 0.00 **t26.68 + 0.11 **t0.01 + 0.00 **t1.57 − 0.01 t24.02 + 0.03 t0.00 + 0.00 t11,11 + 0.00 t29.97 − 0.06 *t4.82 − 0.04 **t1.45 + 0.00 **t
51.80 + 0.00 *t51.85 − 0.26 **t0.00 + 0.00 **t1.92 + 0.01 **t19.14 + 0.25 **t0.00 + 0.00 t9.26 + 0.00 t6.08 + 0.01 t0.40 − 0.01 **t9.32 + 0.01 **t
60.51 + 0.00 **t37.00 − 0.20 **t0.01 + 0.00*t8.06 − 0.01 t15.52 + 0.30 **t0.00 + 0.00 t27.10 − 0.13 **t7.40 + 0.01 t0.12 + 0.00 **t4.76 + 0.00 **t
70.25 + 0.00 *t1.94 − 0.03 **t0.00 + 0.00 t0.06 + 0.00 **t39.87 − 0.04 t3.37 + 0.01 t45.21 + 0.01 t3.24 + 0.07 **t0.04 + 0.00 **t5.93 + 0.00 **t
80.87 + 0.00 **t63.25 − 0.48 **t0.00 + 0.00 t0.14 + 0.03 **t21.86 + 0.34 **t0.00 + 0.00 t10.09 + 0.04 t0.14 + 0.00 **t0.00 + 0.00 t4.70 + 0.01 **t
90.26 + 0.00 **t18.97 − 0.21 **t0.06 + 0.00 **t8.26 − 0.07 **t43.06 + 0.28 **t6.05 − 0.03 **t18.19 + 0.03 t2.35 + 0.03 **t0.01 + 0.00 t3.27 + 0.00 **t
101.31 + 0.00 t31.55 − 0.40 **t0.00 + 0.00 t0.61 + 0.00 *t56.43 + 0.26 **t1.93 + 0.00 *t4.75 + 0.11 **t2.21 + 0.02 **t0.02 + 0.00 *t2.15 + 0.00 **t
110.07 + 0.00 t67.09 − 0.55 **t0.00 + 0.00 t2.96 + 0.02 **t21.01 + 0.46 **t0.05 + 0.00 **t5.61 + 0.07 **t0.38 + 0.01 **t0.01 + 0.00 t3.27 + 0.00 **t
121.09 + 0.00 **t12.24 − 0.13 **t0.02 + 0.00 **t21.64 − 0.30 **t52.66 + 0.35 **t0.86 + 0.01 **t6.00 + 0.10 **t0.74 + 0.01 **t0.01 + 0.00 **t4.32 + 0.00 **t
130.07 + 0.00 **t53.25 − 0.88 **t0.03 + 0.00 **t0.23 + 0.01 **t35.04 + 0.71 **t0.01 + 0.00 t8.99 + 0.14 **t0.33 + 0.01 **t0.01 + 0.00 **t2.03 + 0.00 **t
140.06 + 0.00 **t62.11 − 0.76 **t0.00 + 0.00 t0.14 + 0.01 t30.48 + 0.58 **t0.05 + 0.00 **t6.11 + 0.18 **t0.04 + 0.00 **t0.00 + 0.00 *t0.97 + 0.00 **t
150.18 + 0.00 **t27.68 − 0.35 **t0.01 + 0.00 **t2.76 + 0.00 t47.18 + 0.32 **t1.37 − 0.01 **t9.42 + 0.06 **t0.55 + 0.00 t0.02 + 0.00 **t9.95 + 0.03 **t
160.94 + 0.00 **t78.57 − 0.16 **t0.04 + 0.00 t1.20 + 0.11 **t9.77 + 0.01 t0.51 + 0.02 **t0.88 + 0.02 **t0.87 + 0.00 t0.04 + 0.00 t6.84 + 0.00 **t
170.13 + 0.00 t61.79 − 0.66 **t0.02 + 0.00 **t0.14 + 0.01 **t30.33 + 0.47 **t0.06 + 0.00 **t5.90 + 0.16 **t0.30 + 0.01 *t0.01 + 0.00 *t1.41 + 0.00 **t
180.02 + 0.00 t17.67 − 0.17 **t0.03 + 0.00 *t10.60 − 0.02 **t46.72 + 0.07 **t3.58 − 0.02 **t13.84 + 0.07 **t5.57 + 0.05 **t0.01 + 0.00 **t2.12 + 0.00 **t
190.29 + 0.00 t68.71 − 0.22 **t0.13 + 0.00 t11.87 + 0.09 **t11.13 + 0.07 **t0.54 + 0.00 t1.19 + 0.02 **t1.26 + 0.03 **t0.40 + 0.00 **t4.57 + 0.00 **t
200.55 + 0.00 t27.38 − 0.28 **t0.07 + 0.00 **t18.18 − 0.23 **t35.40 + 0.25 **t6.13 + 0.13 **t0.34 + 0.01 t9.62 + 0.12 **t0.09 + 0.00 **t1.40 + 0.00 **t
Table 3. Total number of MODIS-based burned pixels for the entire 2001–2020 period for the Italian administrative regions (before and after applying the 90% confidence level threshold). Note that some burned pixels corresponding to the same area may have been counted multiple times over the study period due to vegetation recovery and new wildfires.
RegionNumber of Burned PixelsNumber of Burned Pixels (90% Confidence)RegionNumber of Burned PixelsNumber of Burned Pixels (90% Confidence)
R1: Val d’Aosta00R11: Marche948866
R2: Piedmont14,41412,774R12: Lazio12,3478872
R3: Lombardy12231188R13: Abruzzo10,1507873
R4: Trentino-Alto Adige8684R14: Molise30,25622,255
R5: Veneto323289R15: Campania40,48529,411
R6: Friuli-Venezia Giulia223203R16: Apulia257,143193,027
R7: Liguria39173583R17: Basilicata89,94264,518
R8: Emilia-Romagna39563697R18: Calabria58,19447,536
R9: Tuscany20711814R19: Sicily290,246235,715
R10: Umbria516298R20: Sardinia40,71434,327
Table 4. Pearson’s correlation results between monthly burned areas and precipitation for entire calendar years and fire seasons (June, July, August, September) for the entire study period (2001–2020). The values in bold are significant.
RegionAnnualFire SeasonRegionAnnualFire Season
R1: Val d’Aosta------R11: Marche−0.11−0.17
R2: Piedmont−0.06−0.15R12: Lazio−0.27−0.35
R3: Lombardy−0.03−0.19R13: Abruzzo−0.17−0.28
R4: Trentino-Alto Adige−0.12−0.07R14: Molise−0.20−0.17
R5: Veneto−0.05−0.06R15: Campania−0.27−0.24
R6: Friuli-Venezia Giulia−0.01−0.03R16: Apulia−0.32−0.35
R7: Liguria−0.13−0.04R17: Basilicata−0.34−0.43
R8: Emilia-Romagna−0.03−0.00R18: Calabria−0.33−0.39
R9: Tuscany−0.14−0.17R19: Sicily−0.29−0.10
R10: Umbria−0.14−0.21R20: Sardinia−0.27−0.25
Table 5. Pearson’s correlation results between NDVI and LST and between NDVI and precipitation for Italian administrative regions. The values in bold are significant.
RegionNDVI-LSTNDVI-PrecipRegionNDVI-LSTNDVI-Precip
R1: Val d’Aosta0.79−0.03R11: Marche0.38−0.02
R2: Piedmont0.80−0.03R12: Lazio0.050.06
R3: Lombardy0.750.09R13: Abruzzo0.49−0.15
R4: Trentino-Alto Adige0.810.28R14: Molise0.29−0.11
R5: Veneto0.750.12R15: Campania0.19−0.05
R6: Friuli-Venezia Giulia0.820.06R16: Apulia−0.590.25
R7: Liguria0.74−0.15R17: Basilicata0.04−0.03
R8: Emilia-Romagna0.54−0.01R18: Calabria−0.020.03
R9: Tuscany0.310.00R19: Sicily−0.690.30
R10: Umbria0.48−0.02R20: Sardinia−0.740.49
Disclaimer/Publisher’s Note: The statements, opinions and data contained in all publications are solely those of the individual author(s) and contributor(s) and not of MDPI and/or the editor(s). MDPI and/or the editor(s) disclaim responsibility for any injury to people or property resulting from any ideas, methods, instructions or products referred to in the content.

