Abstract
Ulmus glabra Huds. is a mesophilic, montane broadleaf tree with high ecological value, commonly found in temperate riparian and floodplain forests across Türkiye. Its populations in Türkiye have declined due to anthropogenic disturbances and climatic pressures that cause habitat fragmentation and threaten the species’ long-term survival. In this research, we used Maximum Entropy (MaxEnt) to build species distribution models (SDMs) and applied the Restoration Planner (RP) tool to identify and prioritize critical restoration sites under both current and projected climate scenarios (SSP245, SSP370, SSP585). The SDMs highlighted areas of high suitability, primarily along the Black Sea coast. Future projections show that habitat fragmentation and shifts in suitable areas are expected to worsen. To systematically compare restoration options across different future scenarios, we derived and applied four spatial network status indicators using the RP tool. Specifically, we calculated Restoration Pixels (REST_PIX), Average Distance of Restoration Pixels from the Network (AVDIST_RP), Change in Equivalent Connected Area (ΔECA), and Restoration Efficiency (EFFIC) using the RP tool. For the 1 <-> 2 restoration pathways, the highest efficiency (EFFIC = 38.17) was recorded under present climate conditions. However, the largest improvement in connectivity (ΔECA = 60,775.62) was found in the 4 <-> 5 pathway under the SSP585 scenario, though this required substantial restoration effort (REST_PIX = 385). Temporal analysis noted that the restoration action will have most effectiveness between 2040 and 2080, while between 2081 and 2100, increased habitat fragmentation can severely undermine ecological connectivity. The result indicates that incorporation of habitat suitability modeling into restoration planning can help to design cost-effective restoration actions for degraded land. Moreover, the approach used herein provides a reproducible framework for the enhancement of species sustainability and habitat connectivity under varying climate conditions.
1. Introduction
The wych elm (Ulmus glabra Huds.) is a tree species that is economically and ecologically important in temperate zones, including Türkiye. U. glabra is a widespread broadleaf species that occurs in mesophilic ravines and montane mixed deciduous woodlands of the Tilio–Acerion alliance [1,2]. It plays a significant role in forest structure and supports diverse plant and animal communities. It also contributes to soil stability and water regulation on steep slopes in humid forest landscapes. Türkiye’s climate is highly diverse, shaped by complex topography that forms several bioclimatic zones ranging from humid temperate conditions along the Black Sea coast to semi-arid and Mediterranean climates in inland and southern regions [3]. These diverse climatic settings provide the fertile, humid soils that U. glabra depends on, especially in montane and riparian sites. Its remaining populations in Türkiye, mostly in shaded valleys and north-facing slopes, represent relict and rear-edge elements of its range, underlining its biogeographical significance and conservation value [4,5]. U. glabra prefers humid climates and fertile soils, which are key elements in supporting forest ecosystems and biodiversity [4]. However, the species is facing serious threats from habitat fragmentation, deforestation, and the spread of Dutch elm disease by an invasive pathogen, Ceratocystis ulmi [5,6,7]. Furthermore, climate change is a major factor that increases the vulnerability of U. glabra populations. With rising temperatures, changing patterns of precipitation, and longer droughts, the species’ habitat suitability is changing, moving it into more fragmented and unsuitable landscapes [8]. These factors have led to drastic decreases in U. glabra population numbers, emphasizing the need for effective conservation management and restoration efforts to sustain its natural distribution [8,9].
Climate change driven by global warming has affected ecosystems across diverse landscapes, including urban centers, rural forested areas, and coastal seascapes [10,11]. In addition to this, it has severely disrupted the ecological connectivity and functionality of forest landscapes globally [12,13,14]. Changing climatic conditions have altered tree species’ composition and distribution, resulting in the formation of novel forest ecosystems [15,16,17]. Such structural changes in forests, encompassing the loss of dominant species and the invasion of non-native species, can dramatically affect habitat functioning for forest-interior species and the flow of ecological connectivity [18,19]. The implementation of adaptive forest management strategies is therefore critical to tackling these complex challenges [20,21,22]. The existing literature points out the need to promote resilient forest ecosystems by establishing climate-appropriate species, multimodal species richness and legislative practices that are consistent with ecological connectivity [18]. In this sense, the protection of intact forest landscapes and restoring degraded areas are also important to sustain ecosystem services and to provide pathways for species to adapt to the ongoing impacts of climate change [23,24,25,26].
When implementing forest restoration, it is relevant to identify key forest patches for restoration, as these patches often form the core of ecological networks [27,28,29]. Critical patches play a significant role for connectivity as they provide stepping stones for the movement of species and facilitate the flow of ecological processes across fragmented landscapes [30]. By restoring and protecting these key areas, it is possible to increase the resilience of ecosystems, particularly with climate change and the increasing pressure of human [31,32]. It should be noted that conservation strategies, whose ultimate goal is to ensure that a given intervention produces meaningful and long-lasting effects, can optimize their ecological return on investment (i.e., the ecological benefit per unit of resources expended) by focusing on restoration to these relatively high-priority patches [33,34,35,36]. Consequently, the identification of PAs is one of the primary imperatives in constructing restoration trajectories that mitigate both existing fragmentation and avoid future transformations of the landscape [37,38].
Recent developments in ecological modeling are playing a key role in the preparation of restoration plans and can inform comprehensive assessments of landscape-level connectivity [39,40]. The traditional approaches such as least-cost path analysis [41] and circuit theory [42] have always offered important conceptual frameworks, the former identifying pathways by minimizing resistance, and the latter modeling connectivity through a set of possible routes. Graph-based methods have been widely used for the analysis of habitat networks as a framework of nodes (patches) and edges (connections), enabling the prioritization of critical areas for conservation managers [43,44,45]. However, these approaches typically treat individual facets of connectivity independently, restricting their relevance in complex and diverse scenarios [46]. Conversely, integrated approaches that consider both structural and functional connectivity mapping have been developed to provide a more holistic understanding of landscape processes [47,48]. A recent innovation in this area is the Restoration Planner (RP) in GuidosToolbox—which integrates these methods into a robust, data-driven platform for restoration planning [47]. The RP is a practical tool used in ecological modeling, particularly for integrating connectivity analyses and guiding restoration efforts [28]. The RP assesses structural and functional connectivity, identifies key patches and corridors of high habitat value, and ranks areas for restoration based on ecological importance. By modeling different restoration options, such as the creation of new habitat patches or the enhancement of the existing habitat patches, the RP is able to assess their effects on connectivity and identifies the most cost-effective solutions to address the needs of species with specific ecological requirements. Furthermore, the flexibility of the RP across different ecosystem types and spatial scales makes it a powerful method for tackling complex restoration problems in terrestrial ecosystems [37,49].
The aim of this study is to identify key forest patches of U. glabra in the context of climate change impacts and to propose practical solutions for restoring connectivity. The study uses a hybrid method of Maximum Entropy (MaxEnt) species distribution modeling [50,51] and the RP tool to identify and prioritize habitat restoration areas. MaxEnt modeling offers insights into habitat suitability and the spatial distribution of ecological niches, whereas RP enables quantification of the connectivity of networks and interactive assessment of restoration scenarios. The novelty of this study lies in its identification of restoration areas for U. glabra with the aim of improving habitat connectivity and ecological benefits under current and under future climate conditions. The emphasis on landscape connectivity is especially significant because continuous habitat networks help reduce the isolation of small and fragmented populations. These networks also restrict the movement of pathogens and insect vectors that cause Dutch elm disease and limit the establishment of infections across forest patches. Such a focus on habitat connectivity provides a foundation for a broader framework to evaluate forest fragmentation as a function of climate projections. The identification of restoration pathways improves the exchange of genetic material between disjunct populations and preserves access to key refuges as temperatures rise. The restoration of these pathways also supports the recovery of forest structure and composition over time. It will also reaffirm the conservation value of forest networks under present and future climate scenarios. The findings will provide new insights that could inform on-target management actions, thereby facilitating the development of resilient forest management strategies that will mitigate the adverse effects global change on landscape resilience and biodiversity.
2. Material and Methods
2.1. Target Species, Study Area, and Methodological Framework
Ulmus glabra Huds. can reach 20 m in height with a characteristic dense crown [52]. The bark is smooth, gray-brown in youth, with stout, drooping branches. It does not develop sucker shoots from the root system, like some other elms [53]. The leaves are rough, asymmetric, serrated, and dark green; the petiole is very short, and the surface of the leaf is hairy. Their leaves are larger than most trees—around 5–17 cm long and 4–12 cm wide. The flowers are brown-purple and bloom before the leaves. They have wind-pollinated, hermaphroditic, bell-shaped flowers [54]. Between each fruit, there are several seeds in the center of a papery wing, in familiar clustered green balls about 2.5 cm across [4,55]. U. glabra has also been recorded in mixed woods alongside other broad-leaved species that possess analogous ecological and environmental preferences [4,55]. The main threats to its populations are anthropic impacts, climate change, and diseases [6]. Ceratocystis ulmi presents a significant danger to the distribution of U. glabra in Türkiye, as this fungus causes severe wilting and mortality of elm trees [5,7]. It is activated under environmental conditions, such as droughts, which predispose the species to infection in impacted regions [5,9]. Consequently, the species requires monitoring, and its reaction to fluctuating climatic conditions must be comprehended.
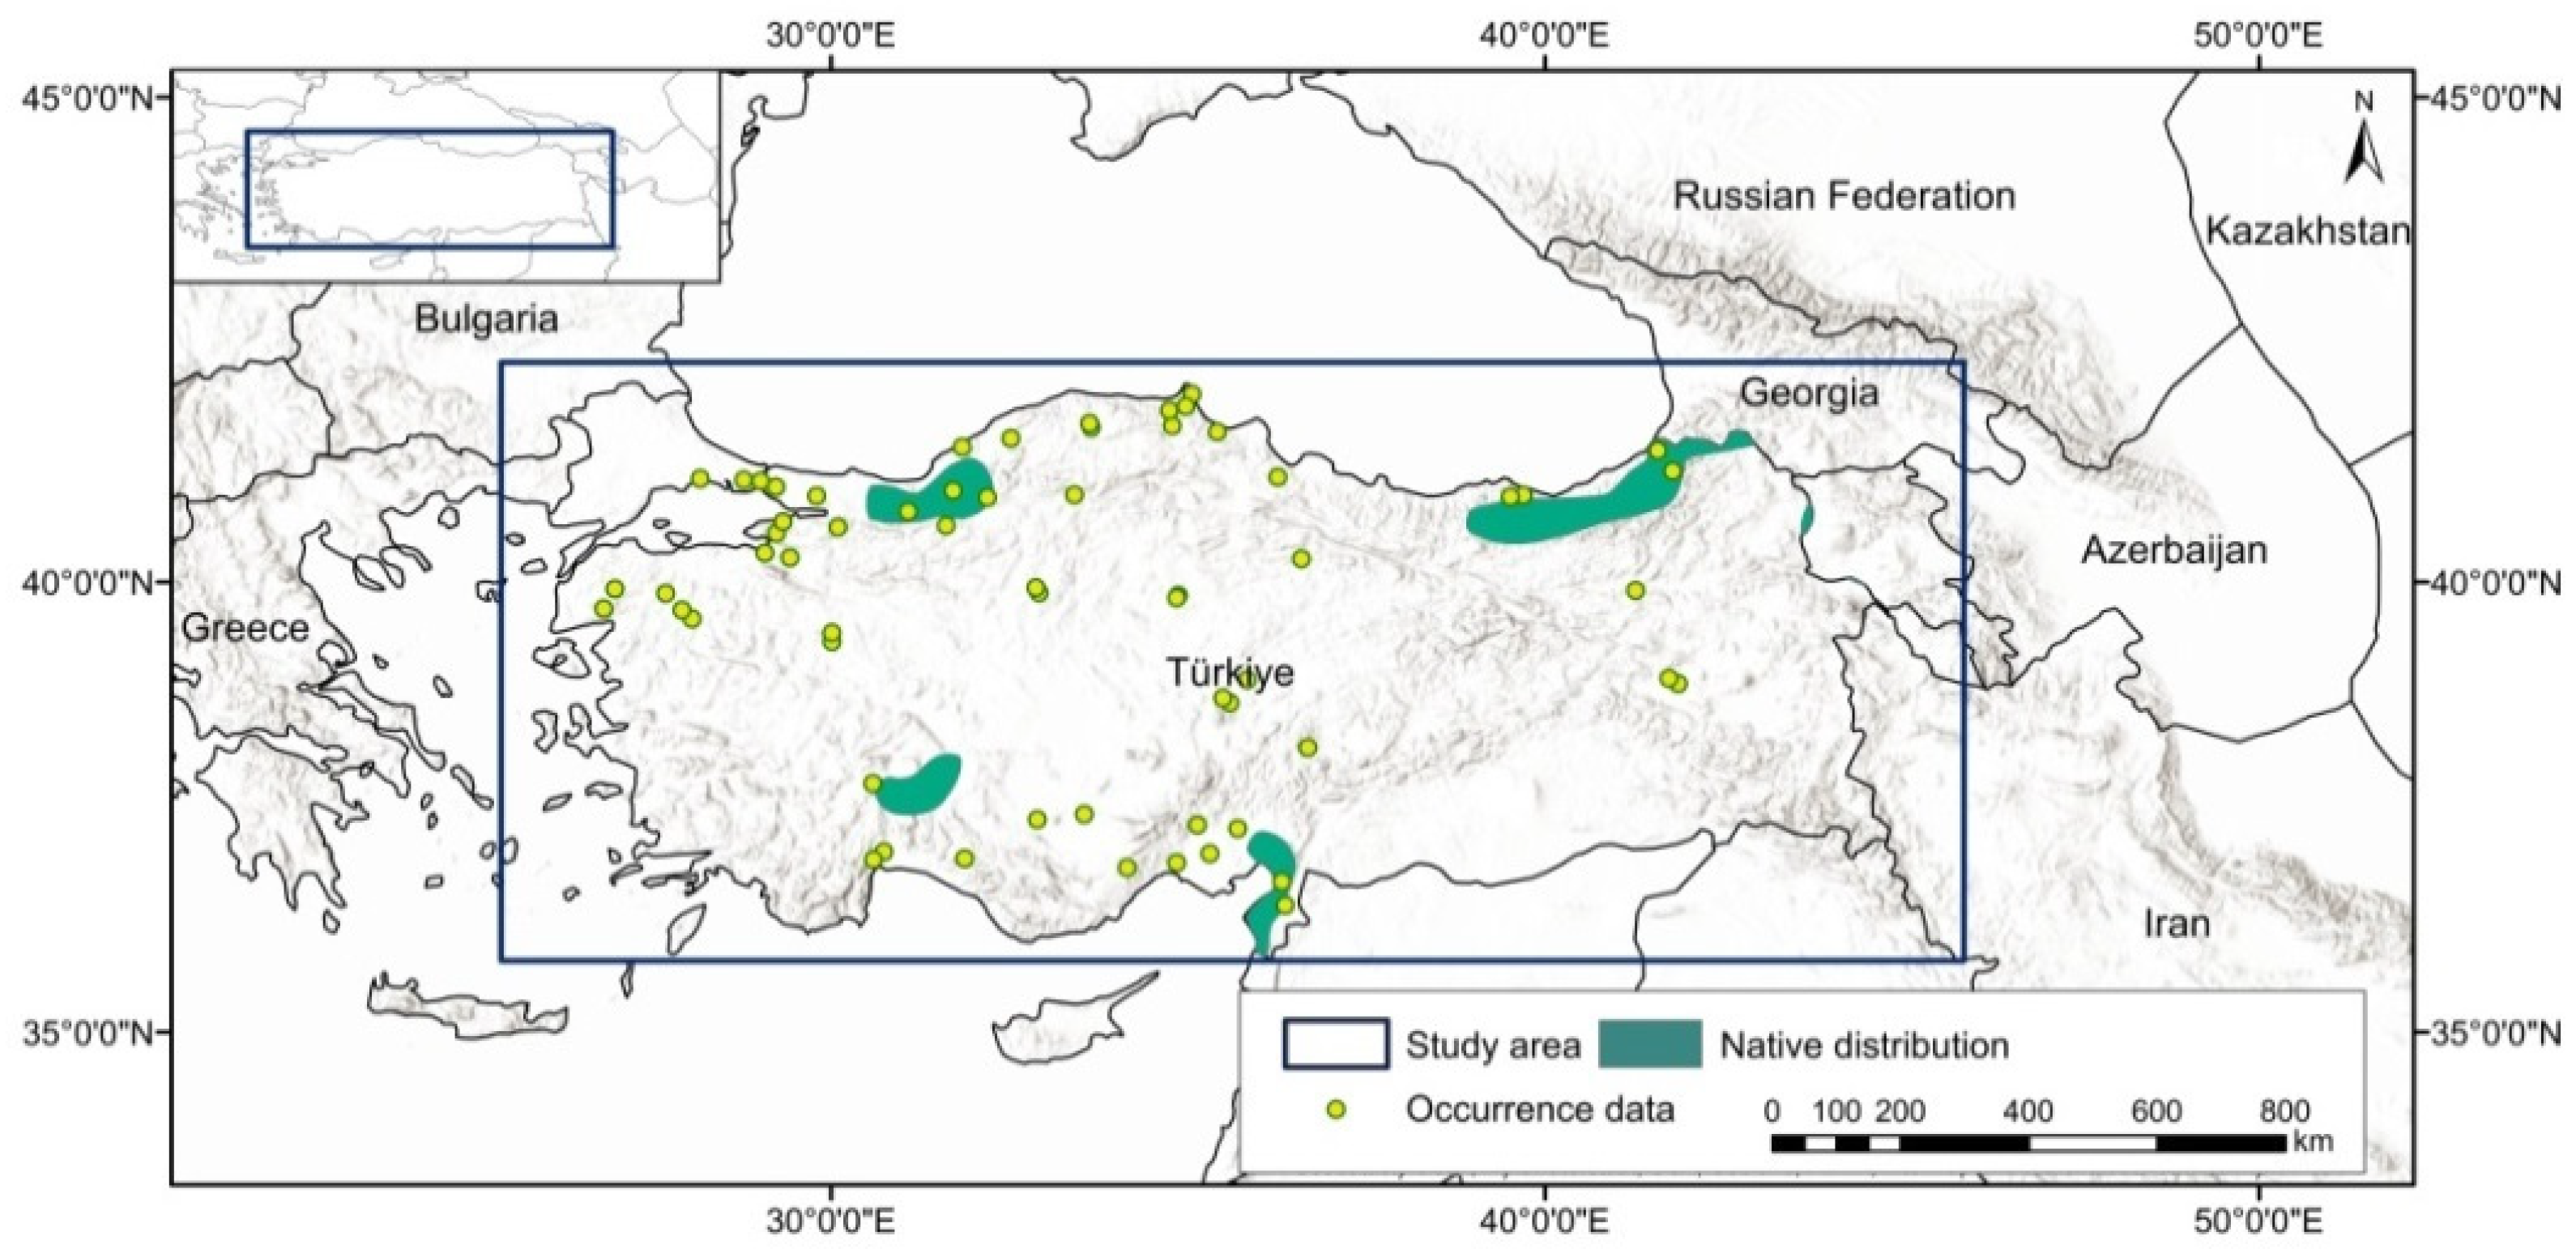
Species occurrence data were obtained from open access resources and the relevant literature. The data were thinned at a scale of 5 km to avoid spatial autocorrelation and to evaluate at the same resolution as the bioclimatic variables. In the next phase, a total of 402 occurrence records were used [52,56,57,58]. The area of study encompasses the border region of Türkiye. The current distribution of U. glabra in Türkiye is marked by diverse geographical regions and is extensively dispersed along the eastern shore of the Black Sea, reaching westward from the Georgian border (Figure 1).
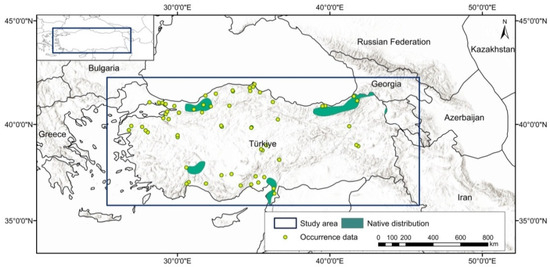
Figure 1.
Native species distribution and occurrence records for the study area, displayed in the WGS84 geographic coordinate system.
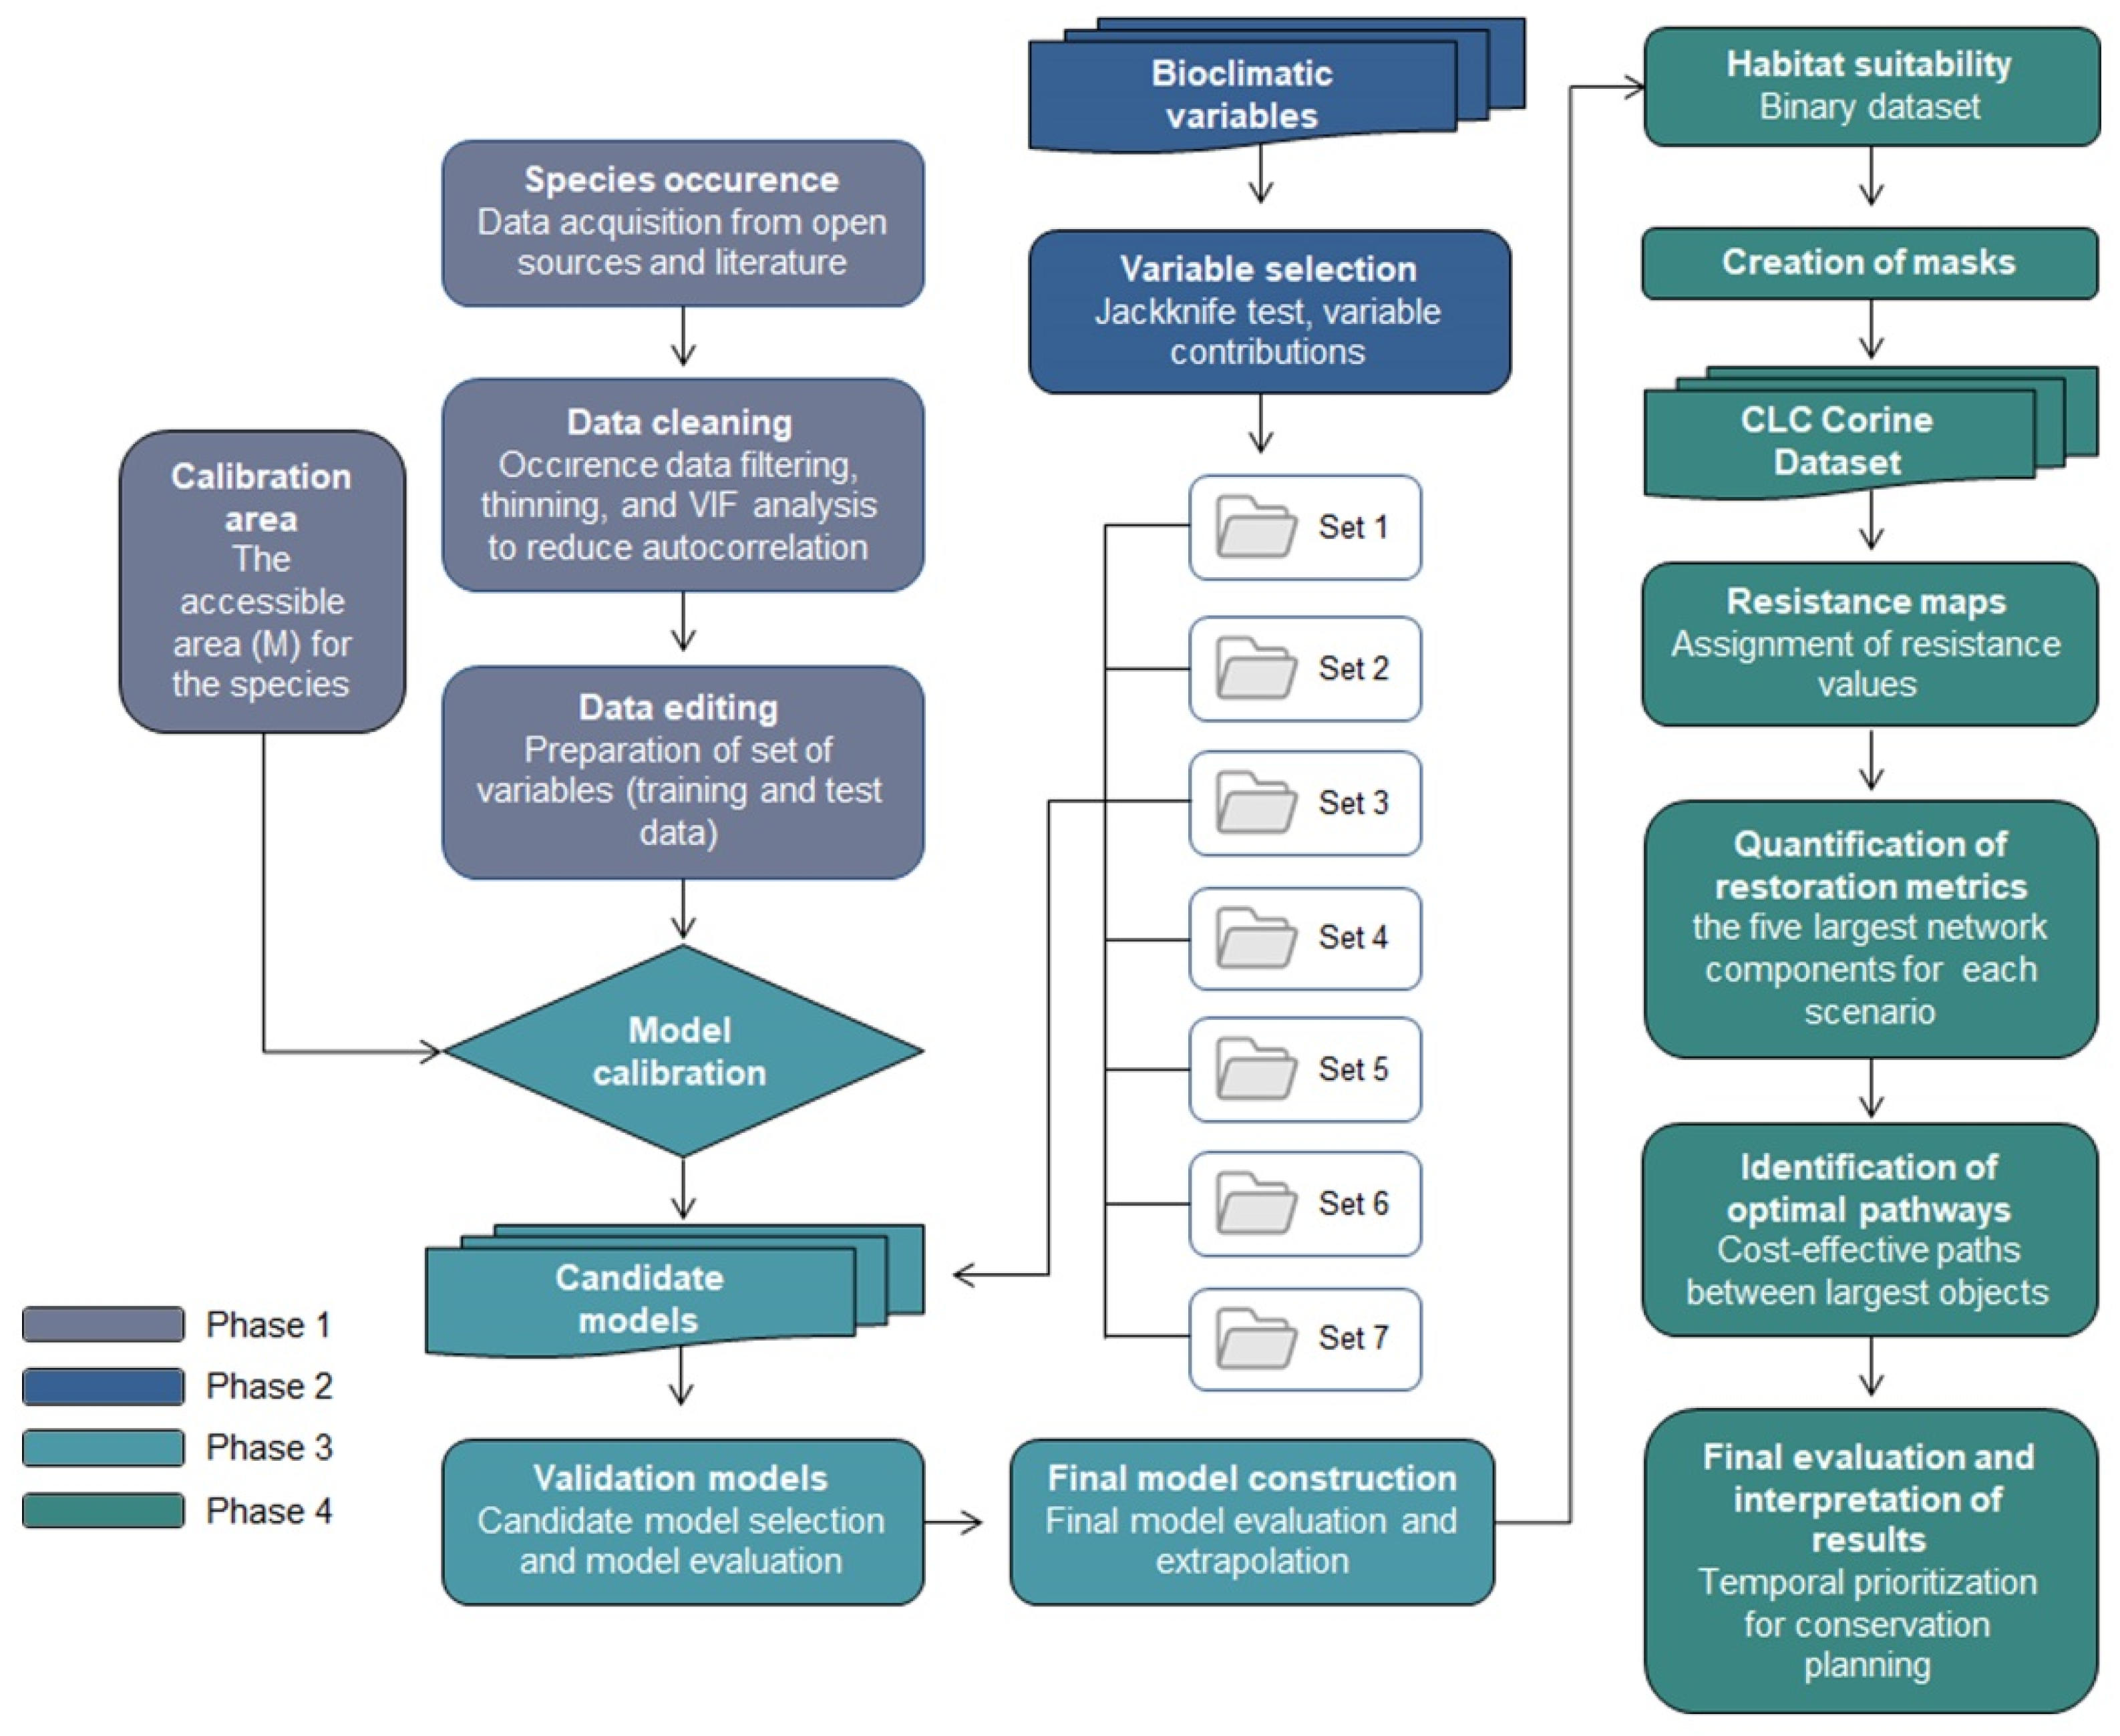
This study is based on the MaxEnt models implemented in Ar et al. [8] (please see Ar et al. [8] for further details). The previous study had done modeling, but the presented study applied RP on it and identified key restoration areas with optimal pathways (corridors). The MaxEnt model was chosen because it is well-suited for presence-only data and is widely regarded as a robust tool for predicting species distributions under current and future climate scenarios. The Restoration Planner (RP) tool was selected because it enables systematic identification of priority restoration areas and supports the evaluation of landscape connectivity and cost-effective conservation strategies. The methodology follows four main phases to determine optimal restoration pathways that support the long-term sustainability of the target species, using its projected distribution under different climate scenarios (Figure 2). The first phase of the study involves modeling the potential distribution of the species based on occurrence records (GBIF, Copenhagen, Denmark) and environmental data. This includes data cleaning (filtering, thinning, and VIF analysis), data editing (preparation of training and test datasets), and the definition of the calibration area (accessible area, M). Phase 2 focuses on the selection of bioclimatic variables through jackknife tests and analysis of variable contributions across seven variable sets. Phase 3 includes model calibration, the development of candidate models, their selection and evaluation, and the construction of the final model through extrapolation. Phase 4 addresses landscape connectivity by generating resistance maps derived from land cover (Corine land cover-CLC, Copernicus Land Monitoring Service, Copenhagen, Denmark) and infrastructure data, which are combined with the binary habitat suitability map. These are used to compute restoration metrics based on the five largest network components and to identify cost-effective optimal pathways. The results are then interpreted spatially and temporally to prioritize areas for conservation under future climate scenarios (SSPs).
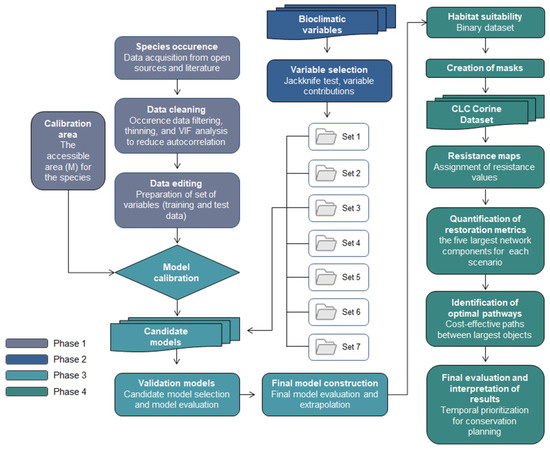
Figure 2.
Methodological framework.
2.2. Bioclimatic Variables
The WorldClim v2.1 database was used to retrieve climate data at a resolution of 2.5′ (about 4.7 km) [59]. The candidate variable collection included 15 bioclimatic variables (Table A1), from which we excluded 4 variables (BIO8, BIO9, BIO18, and BIO19) that earlier studies indicated were influenced by recognized spatial artifacts (i.e., [60]). These artifacts included irregular interpolation surfaces, abrupt climate breaks across grid cell boundaries, and unrealistic local gradients that do not reflect observed bioclimatic variation across landscapes and may introduce bias into species distribution models. We eliminated bioclimatic variables with an average variance inflation factor below 10 and applied a threshold of 0.75 to discard correlated bioclimatic variables, as recommended by Guisan et al. [61,62] to alleviate the effects of multicollinearity and to avoid correlations among the selected variables [63]. We implemented this through the “usdm” package [64] According to ecological requirements of the species, six bioclimatic variables were selected as predictors. These include BIO2, BIO3, BIO5, BIO12, BIO14, and BIO15 (please see the correlation matrix in Figure A1).
In order to assess future habitat suitability, the best fit models were projected for five climate models (GCMs), BCC-CSM2-MR [65], CNRM-CM6-1 [66], CNRM-ESM2-1 [67], CanESM5 [68], and MIROC6 [69] in order to account for a reasonable degree of uncertainty in climate model projections [70]. The necessary datasets were extracted from the Climate Model Inter-comparison Project (CMIP6) (www.wcrp-climate.org/wgcm-cmip/wgcm-cmip6 [accessed on 10 November 2023]), for three shared socioeconomic pathways, SSP245, SSP370, and SSP585.
2.3. Modeling of Species Distribution
We used species distribution models (SDMs)—MaxEnt algorithm [71] to predict the habitat suitability for the current and future potential geographical distribution of the target species throughout the study area. The calibration of SDMs was performed using the R package “kuenm” in the R v3.6.3, which was employed to establish diverse MaxEnt models across different combinations of parameter settings [72]. In R v4.3, for the 1 environment, 10 regularization multiplier values (0.1, 0.5, 1, 1.5, 2, 3, 4, 5, 8, and 10) [73], and 5 combinations of feature classes were all used to produce multiple candidate models under different combinations of parameter settings. These settings corresponded to the different environmental variables and feature classes they represented, as indicated by the following abbreviations: 1 = l, 2 = lq, 3 = lqp, 4 = lqpt, 5 = lqpth where l = linear; q = quadratic; p = product; t = threshold; h = hinge. The significance (p < 0.05) was considered where partial receiver operating characteristics (ROCs) with up to 500 permutations and bootstrapping at 50% data omission (quantity per complexity ≤ 5% omitted) were applied. The AICc was used to select final models [74] using AICc < 2. Both for current and future scenarios, the ensemble method was used to apply the models in the study area. In the final estimation, the partial ROC calculation and omission rate were performed with an independent dataset. The calculation of species distribution results was performed using the median value of all replicates. The habitat suitability was displayed on a scale of 0 (unsuitable) and 1 (suitable). The 10 percentile training presence logistic threshold [75] was employed to transform maps that were visualized using the RasterVis package [76].
2.4. Resistance Layer and Input for Restoration Planning Analyses
A resistance raster layer was generated following Gurrutxaga et al. [77] and de la Fuente et al. [78]. This layer is indicative of an area’s resistance to the movement of terrestrial species. This was based on the resistance values assigned to each CLC18 land use class existing in Türkiye (Table A2), as well as different types of transportation infrastructure (roads, railways) (Table A3), with a pixel resolution of 250 m (scale 1:25,000). This was done by summing the various resistance values and then recalibrating them in percentage format to be used with the Restoration Planner (RP) software v.3.1 (Table A4). The lowest resistance value (1) was given to natural forests, while the highest values (1000) were assigned to artificial surfaces and impermeable built infrastructures. Resistance values range from 2 (foreground/network pixels such as natural forests) to 100 (highly impervious features such as built-up areas), with 0 reserved for absolute barriers (e.g., water bodies or infrastructure that cannot be restored [79]. The resulting raster acts as the cost surface in least-cost path analysis, thus representing the relative ecological resistance to movement across the landscape.
2.5. Planning the Restoration of Connectivity for the Scenarios of Analysis
The restoration scenarios for U. glabra were assessed using the RP of GuidosToolbox [80]. The RP is a spatially explicit protocol that has been developed to simulate improvements in fragmented ecological networks by virtually inserting restoration areas and quantifying the resulting gains in network connectivity. In this framework, functional habitat networks are represented by discrete elements—patches of potentially suitable habitat identified through species distribution modeling. For each of the thirteen future scenarios, we employed the “Show Optimum Big 5” feature of RP, which automatically computes the most efficient pairwise pathways between the five largest disconnected network components. The algorithm calculates pixel-level least-cost paths based on resistance values, without predefined corridor widths, and incorporates the effect of intermediate “stepping-stone” patches to maximize connectivity gain. It is important to understand that, although they are called “pathways”, these pathways are one-pixel-wide least-cost paths, based on calculated resistance, not formal ecological corridors (which are wider, managed areas). The RP-based paths demonstrate optimal routes based on resistance values, without pre-defined buffers or official designation. So here, the term “pathways” is employed to denote the functional restoration corridors that are characterized by their cost-effectiveness. The term “objects” refers core habitat patches for restoration planning. Recommendations for detailed examples can be found in the RP product sheet (Vogt 2024) [80].
The effectiveness of each restoration pathway was evaluated using four core indicators: Restoration Pixels (REST_PIX), Average Distance of Restoration Pixels from the Network (AVDIST_RP), Change in Equivalent Connected Area (DELTA_ECA), and Restoration Efficiency (EFFIC). These metrics, respectively, quantify the following: (i) the amount of land area requiring restoration; (ii) the spatial remoteness of restored pixels relative to existing habitat patches; (iii) the net gain in functional connectivity achieved; and (iv) the cost-efficiency of restoration, measured as connectivity gain per unit of resistance-weighted effort. Table 1 summarizes the four restoration metrics used in this study, along with their definitions and mathematical formulations.

Table 1.
Four restoration metrics used in this study, along with their definitions and mathematical formulations.
3. Results
3.1. Model Selection and Results of the Species Distribution
With variance inflation factor VIF values ranging from 1.78 to 6.32, the analysis found multicollinearity in 8 of 15 bioclimatic variables, resulting in the retention of six predictors (Figure A1): annual mean temperature (BIO1), isothermality (BIO3), temperature seasonality (BIO4), annual precipitation (BIO12), precipitation of the driest month (BIO14), and precipitation seasonality (BIO15). By combining regularization multipliers, feature classes, and environmental variable groups, 350 candidate models were created using these variables. With a low omission rate (0.058), minimal complexity (AICc = 7990.84), and an AUC of 0.958, the optimal model (M_1.5_F_lqpt_Set_4) showed excellent performance. Annual precipitation (BIO12, 31.9%) and temperature seasonality (BIO4, 31.8%) were the main factors influencing the suitability of the habitat for U. glabra. Precipitation seasonality (BIO15, 24%), annual mean temperature (BIO1, 8.5%), and isothermality (BIO3, 3.7%) were the next most important factors [81,82], where we obtained the AUC values of 0.889 and 0.823 for training and test data, respectively.
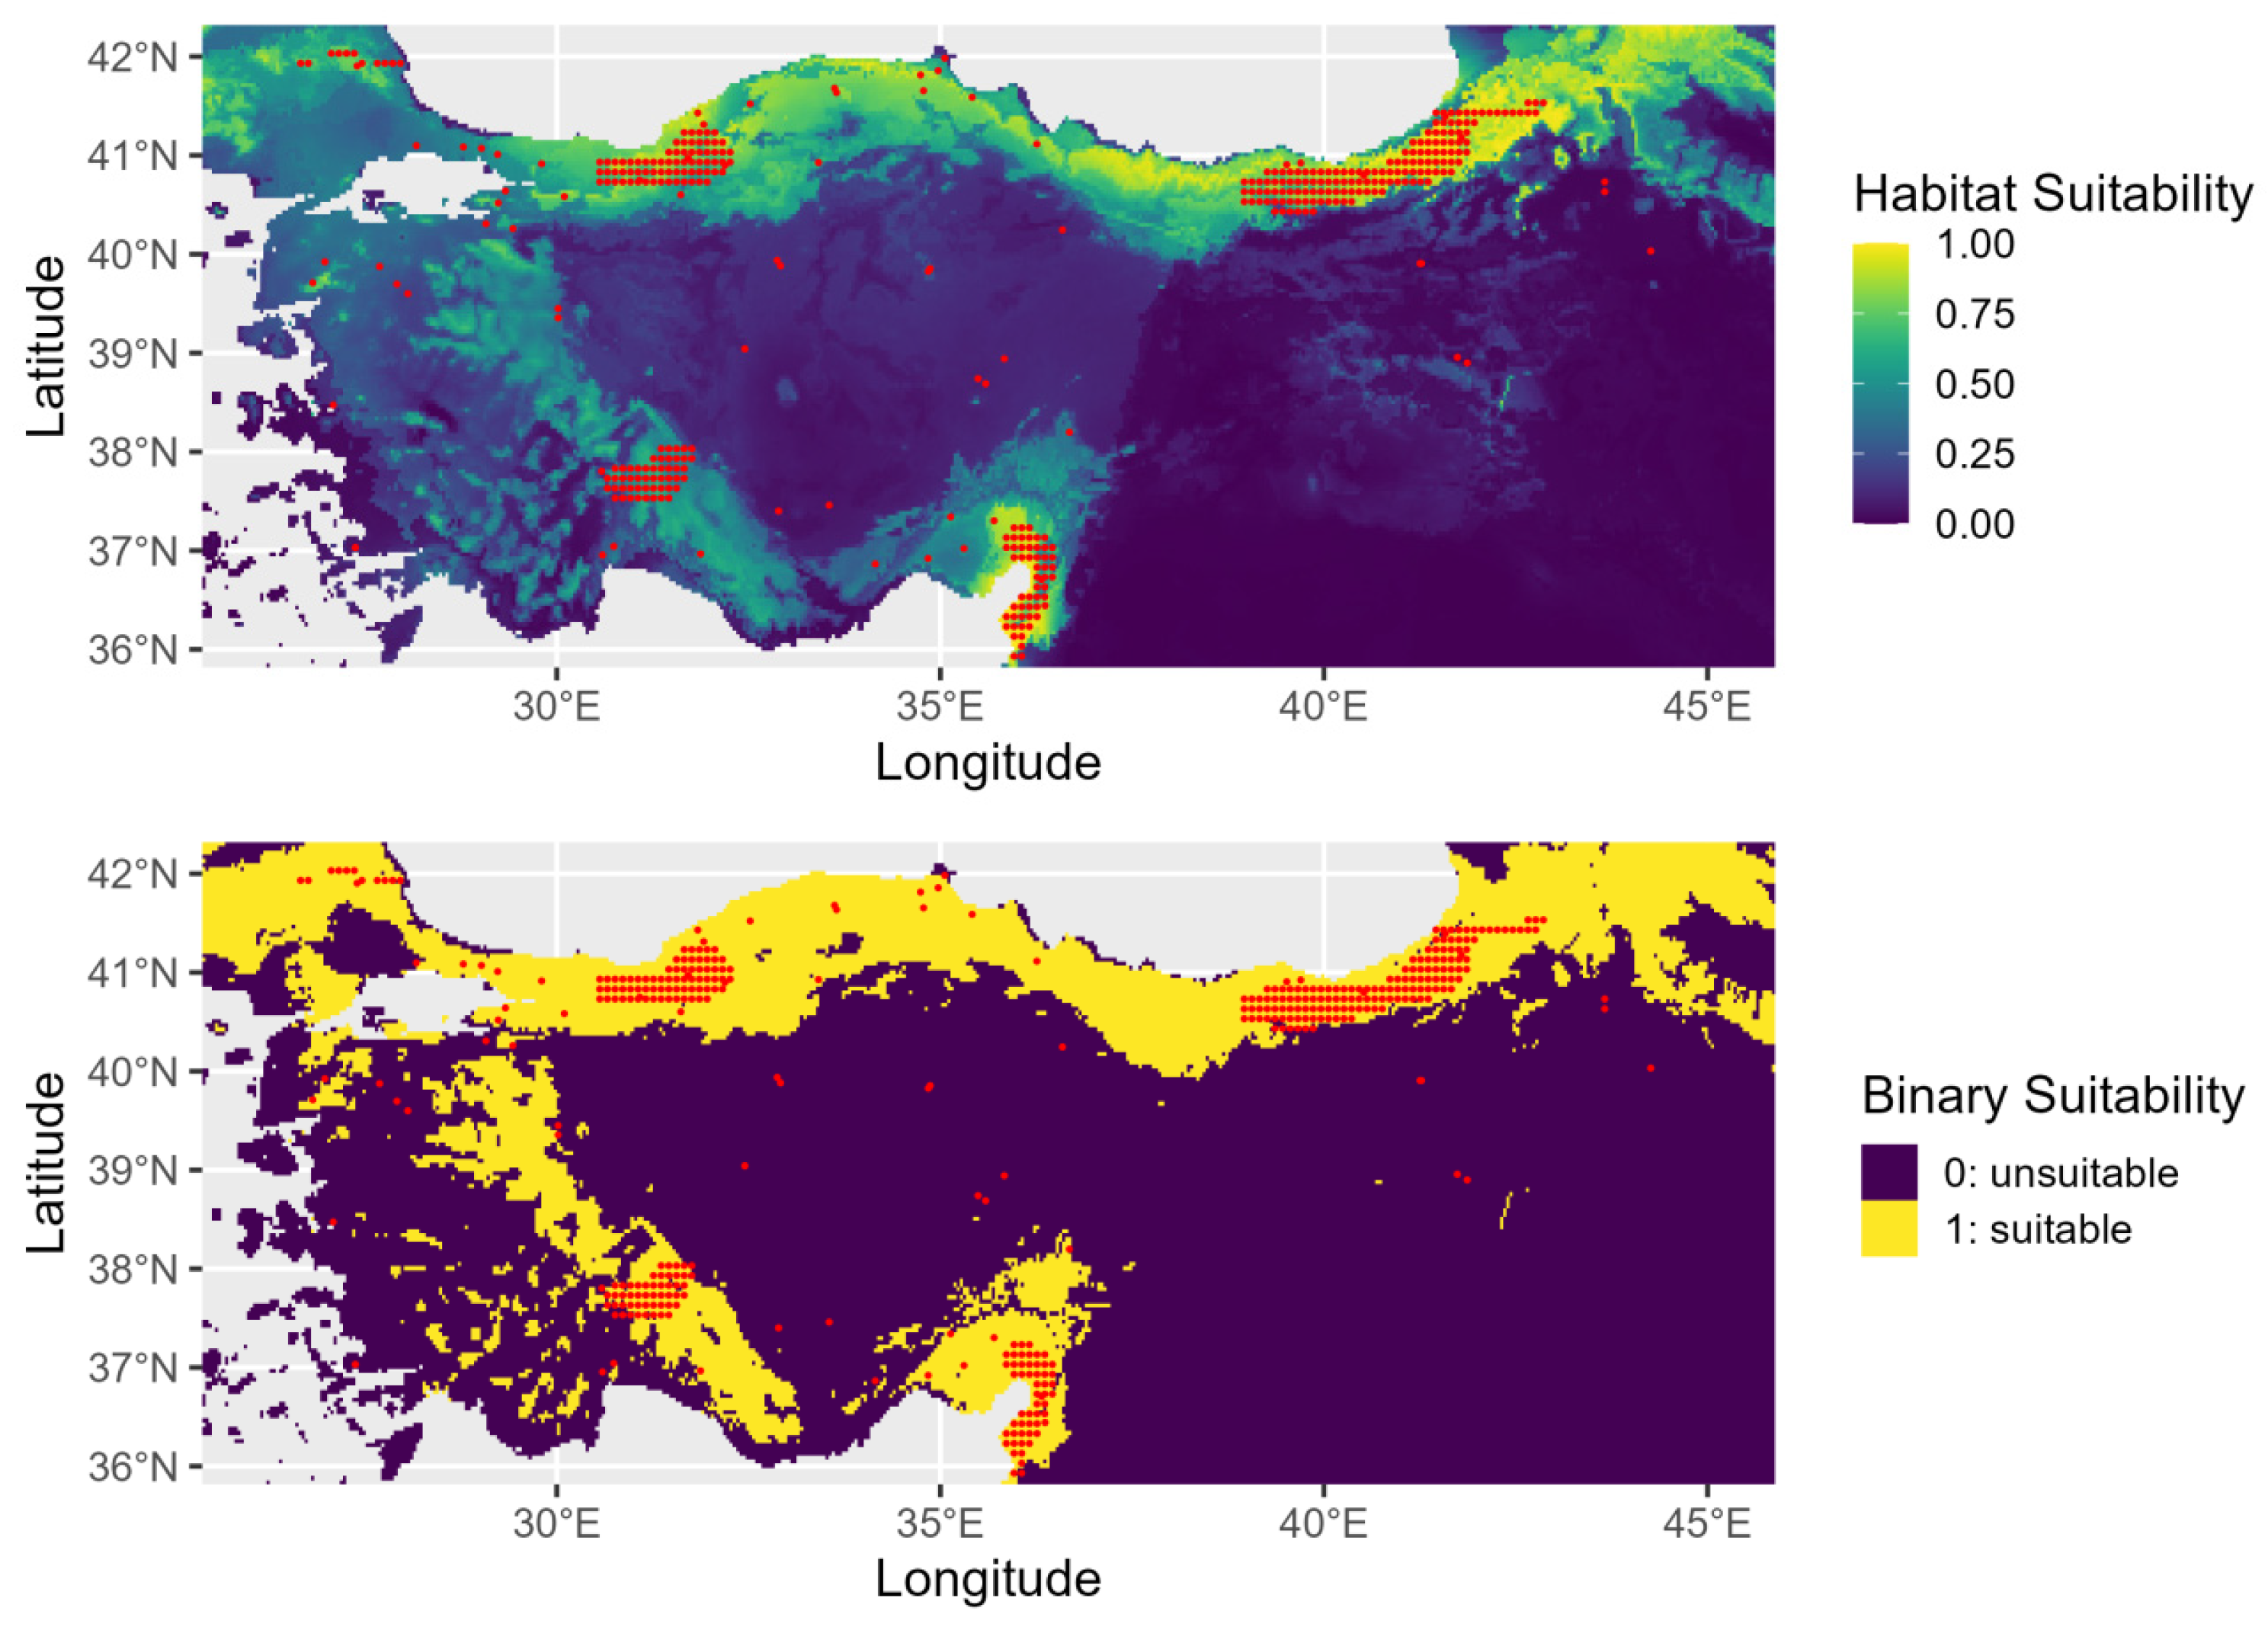
The AUC value of the training set shown in Figure A2 indicates that the model does have greater predictive power in comparison to random prediction. The jackknife test results of the selected variables in the model are given in Figure A3. SDM performed better against the areas with the highest potential for species’ present-day distributions (Figure 3). When compared to the distributions in previous periods, there is more clustering along the Black Sea coast, especially in northern Türkiye. Habitat suitability declines progressively as the species extends from this region toward inland southern areas.
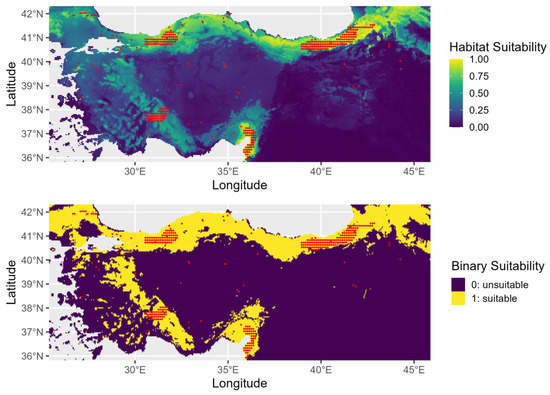
Figure 3.
Present-day habitat suitability for Ulmus glabra in Türkiye. The top panel shows continuous suitability and the bottom panel a binary classification of suitable (yellow) and unsuitable (purple) areas.
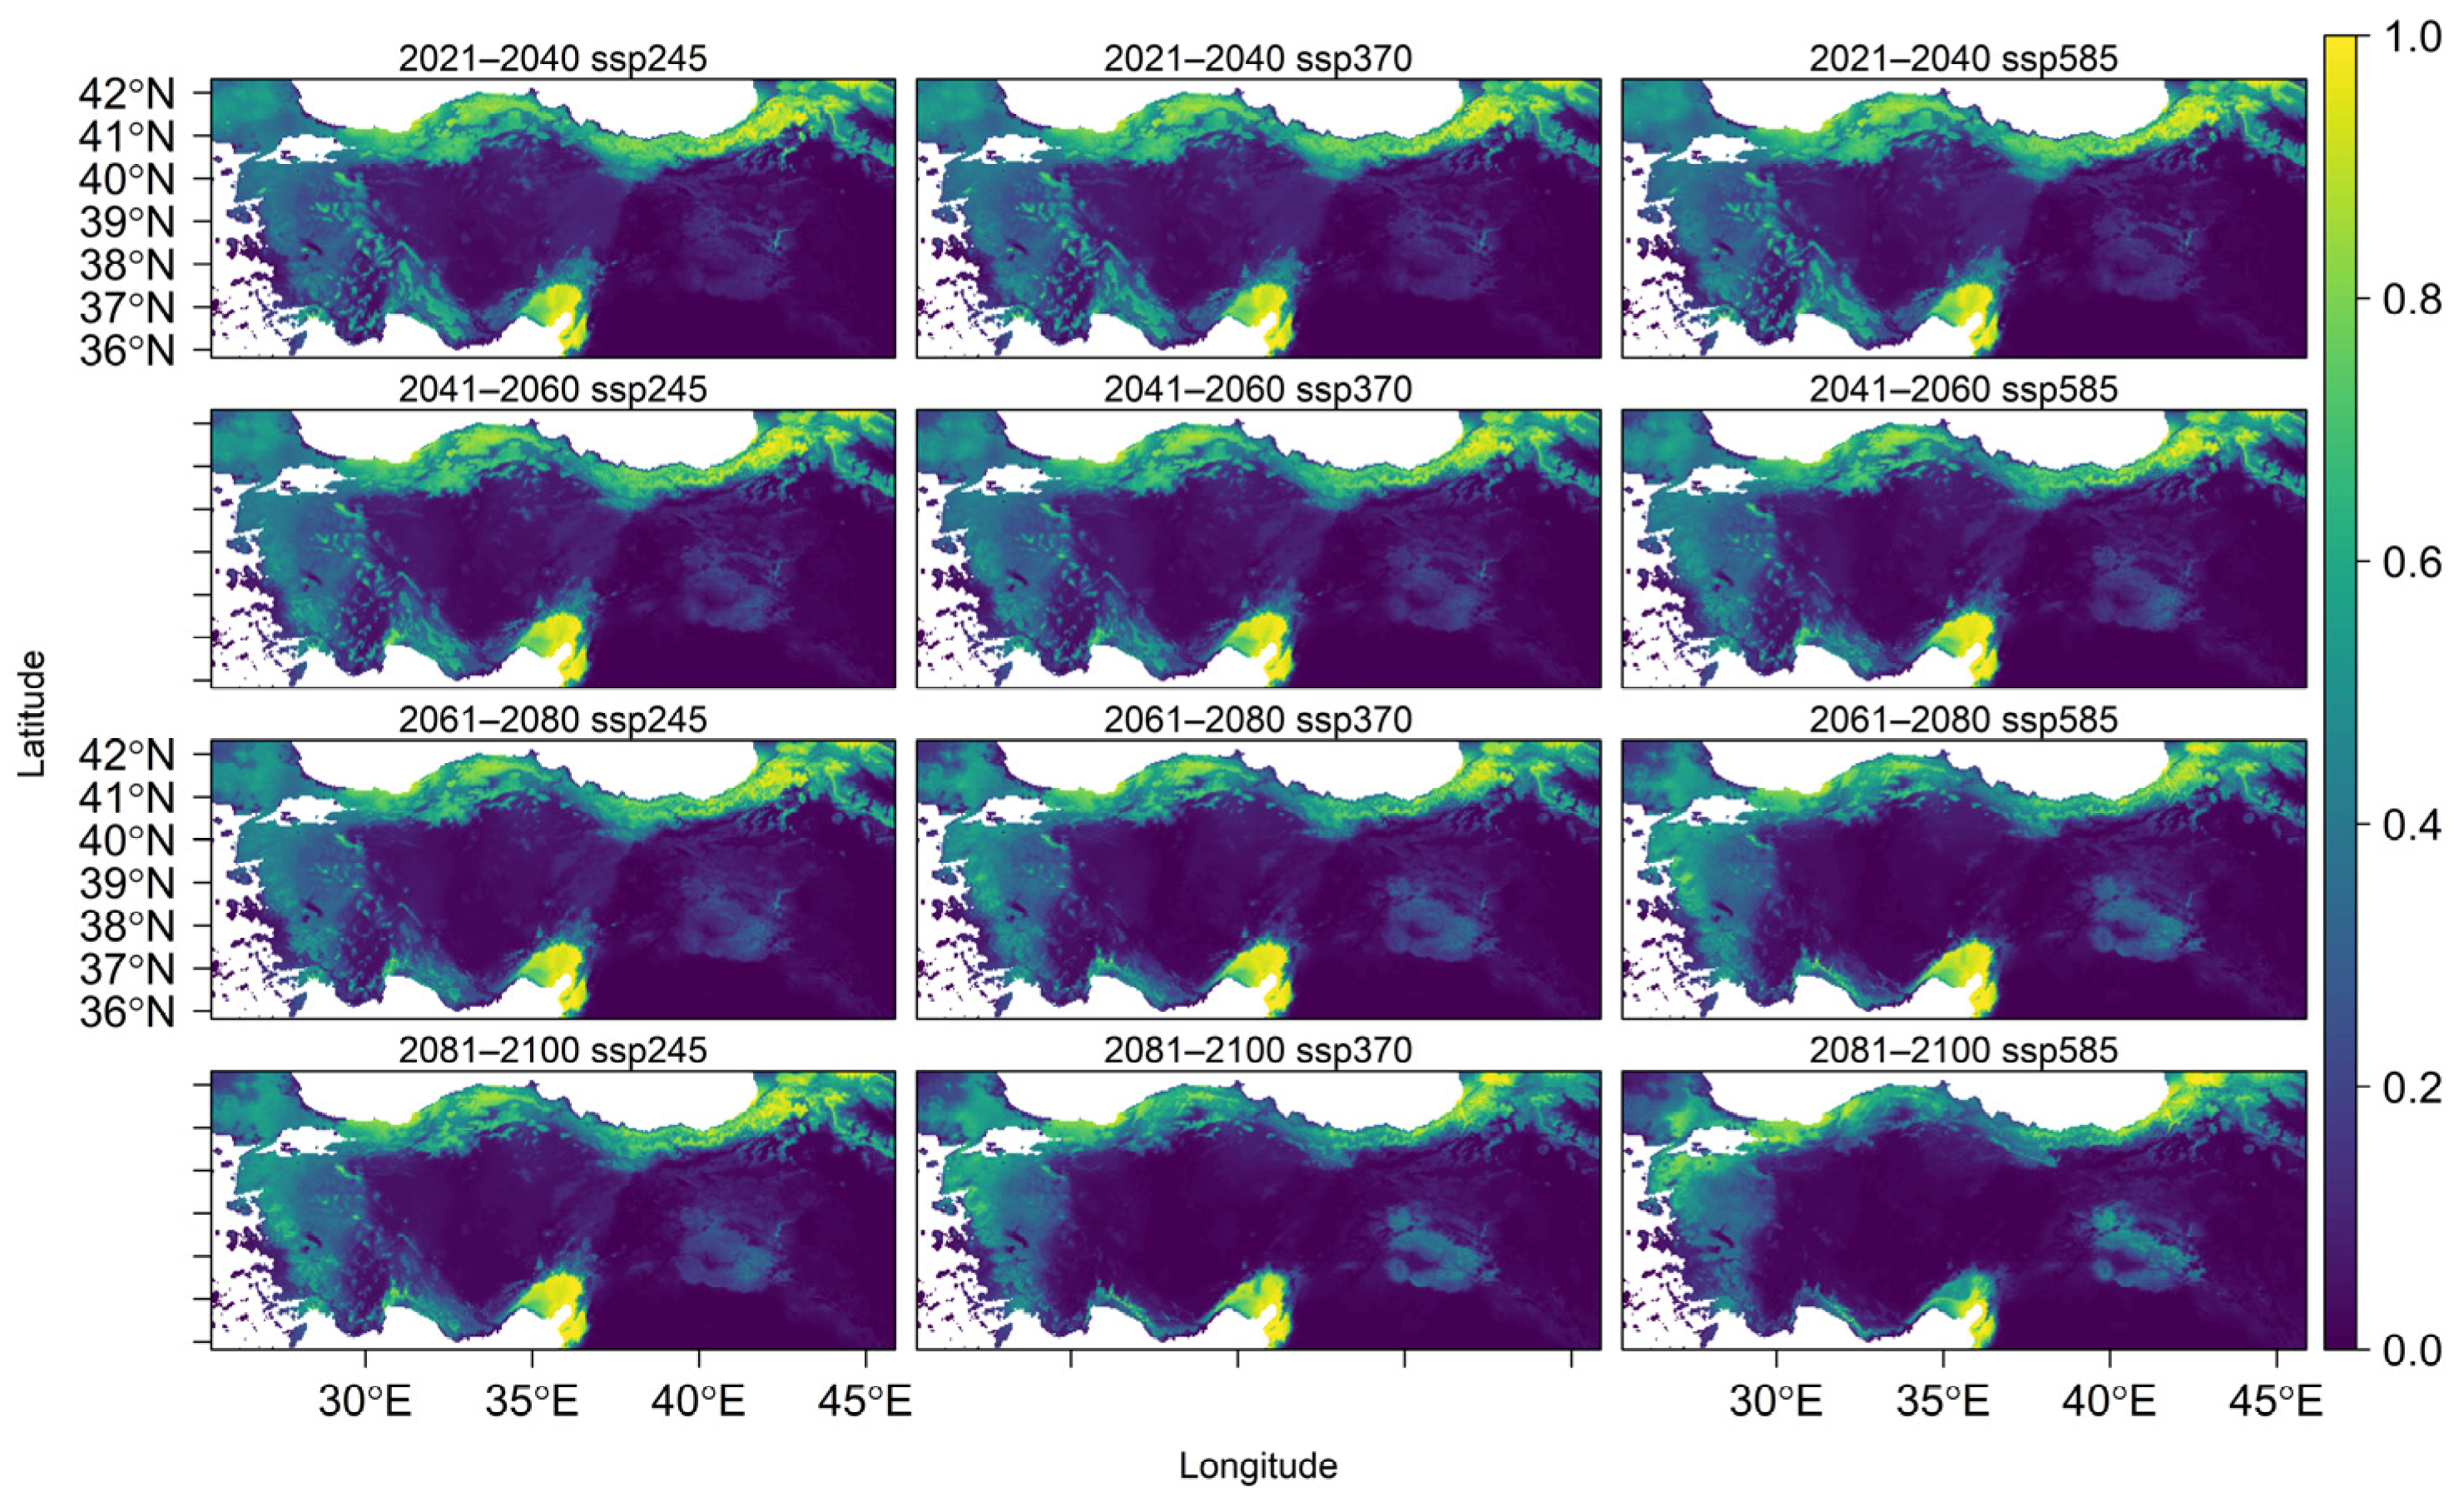
U. glabra presents in a climatically suitable area, but with a scattered distribution in the western part of the Marmara region, the southern slopes of the Black Sea region, and the eastern Black Sea Mountain range. Additional occurrences are expected in the eastern Anatolia region, the Mediterranean region (particularly on the southern slopes of the Western and Central Taurus Mountains), as well as in Central Anatolia and the Aegean region (Figure 4). With core populations concentrated along this coastal zone, the species presently inhabits the eastern Black Sea region close to Georgia. According to future projections under three different climate scenarios (SSP245, SSP370, and SSP585), there will be dynamic range shifts throughout the twenty-first century, marked by coastal migration, habitat loss, and regional persistence (Figure A4).
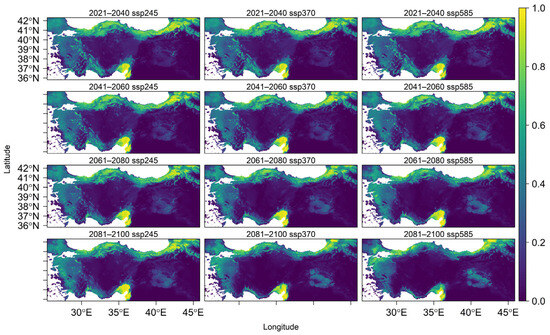
Figure 4.
Predicted average habitat suitability of Ulmus glabra under future climate scenarios. Maps show mean projections across four future time periods (2021–2040, 2041–2060, 2061–2080, and 2081–2100) under three Shared Socioeconomic Pathways (SSP): SSP245 (optimistic), SSP370 (intermediate), and SSP585 (pessimistic). Suitability values range from 0 (low probability of occurrence, yellow) to 1 (high probability of occurrence, dark blue).
High-elevation regions such as the Erzurum-Kars Plateau, eastern Black Sea mountains, Küre-Ilgaz-Köroğlu ranges, and western Taurus are expected to experience significant habitat contraction by 2100 under SSP245. With brief expansions in eastern Marmara and the western Black Sea coast (2021–2060) and subsequent declines after that, the species is expected to stabilize in the northern Samanlı Mountains, western Kaz Mountains, and Aegean interior.
The more extreme SSP370 scenario predicts coastal resilience: the eastern and southern coasts of Marmara, the northern Samanlı Mountains, and the coastal zones of western Taurus become refugia, but it also predicts sharper declines in Anatolian plateaus and northern mountain ranges. The species spreads into the western Taurus coast between 2021 and 2060, and then retreats after that. By 2081–2100, it has colonized the northern Aegean coast, the Kayacı Mountains, and northwest Thrace.
SSP585 (high emissions) limits the species to fragmented coastal strongholds and intensifies losses in the interiors of Ilgaz, Köroğlu, Uludağ, and the Aegean. With slight variations, it continues to exist in the eastern Black Sea and Çukurova regions. It also occupies the coastal mountains of the Aegean until 2080, after which it drastically decreases in these regions by 2100.
3.2. Restoration of Connectivity Under Different Climate Change Scenarios
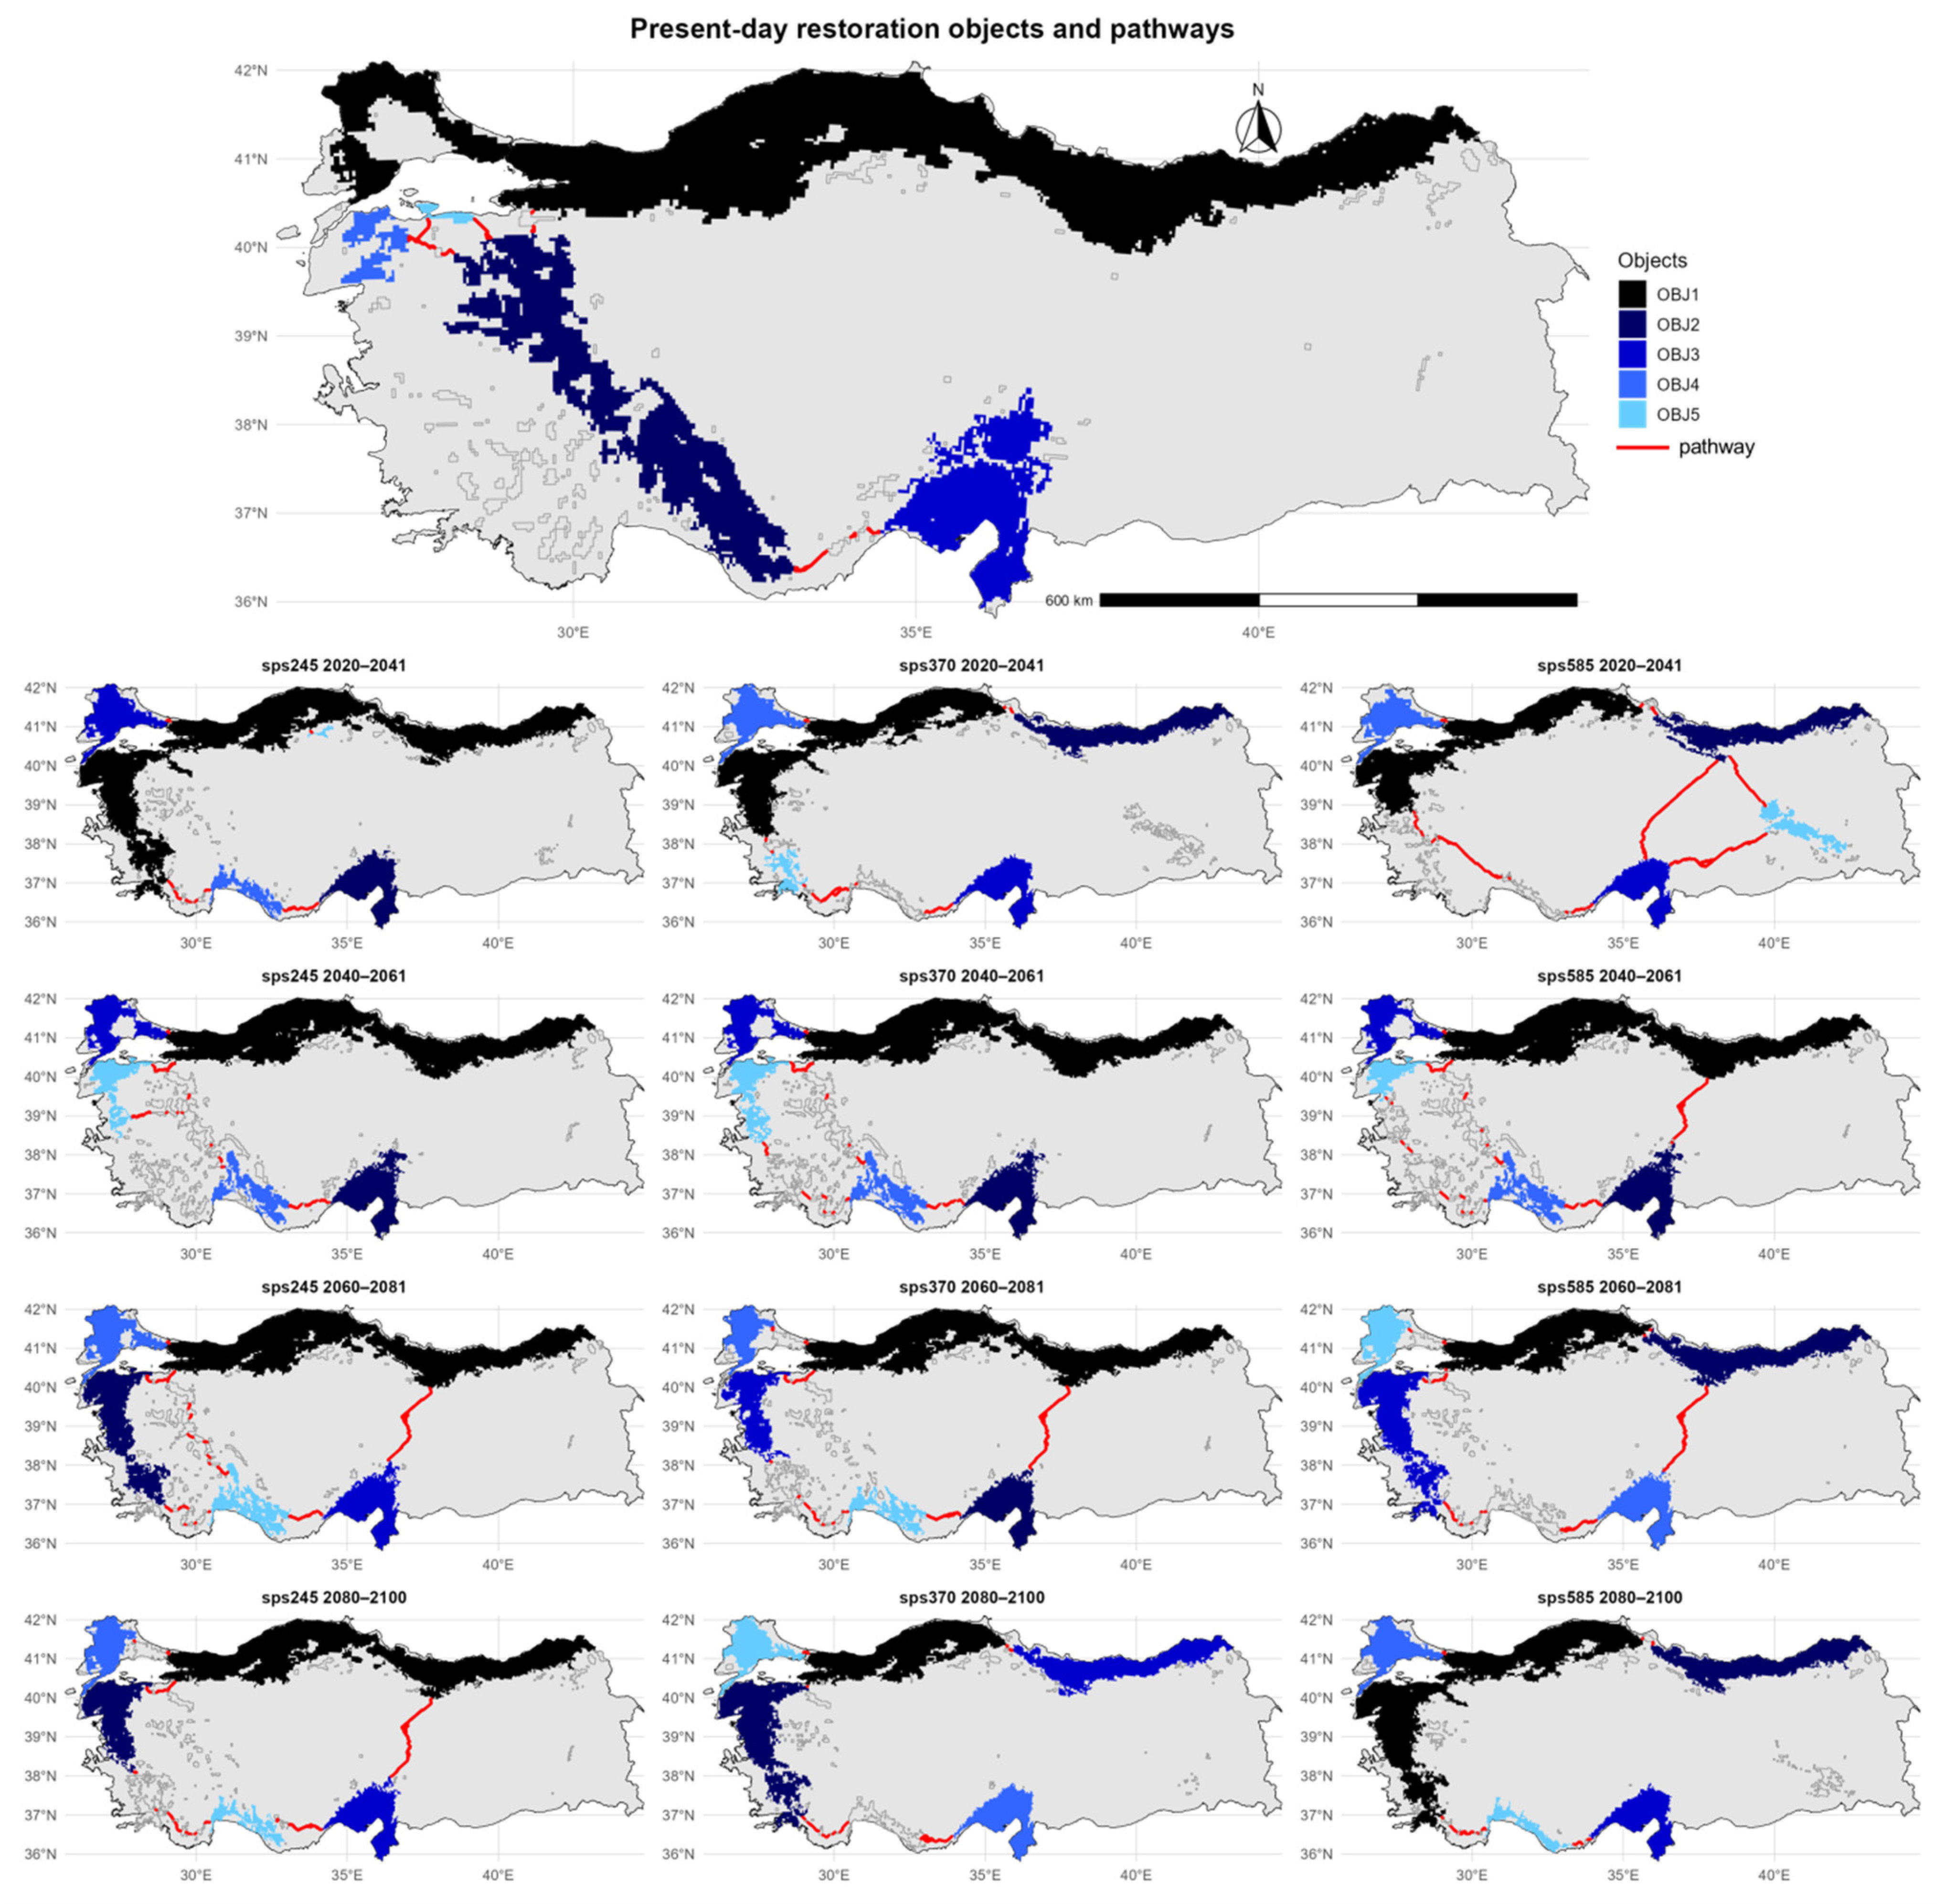
The regions with major prospects for the ecological restoration of U. glabra in contemporary Türkiye are predominantly located in the northwestern, western, and southern areas of the nation. The five largest objects are mostly located along the Marmara, Aegean, and Mediterranean regions (Figure 5).
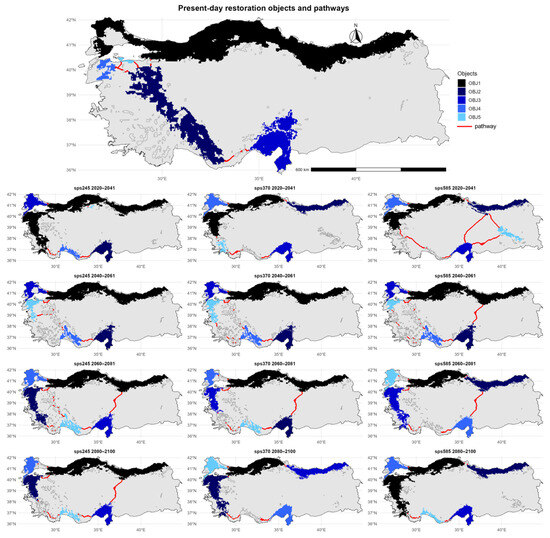
Figure 5.
Predicted restoration pathways (indicated in red) connecting the five largest habitat patches of Ulmus glabra (depicted in a gradient from dark to light blue, representing decreasing patch size) across Türkiye under different future climate scenarios (SSP245, SSP370, SSP585) and time periods (2020–2041, 2040–2061, 2060–2081, and 2080–2100).
The restoration pathways extend from the northwestern coast through the interior parts of the Aegean region and southern Taurus Mountains toward the southeastern parts of the country, connecting these key core areas. Under the SSP245 scenario for 2020–2041, key restoration areas are sustained in the northwest and southwest, with some eastward expansion into central Türkiye. The restoration pathway continues to connect the western and southwestern objects. In the 2040–2061 period, the most significant core objects remain in the west and south, while new core areas begin to emerge across central parts of the country. By 2060–2081, the distribution of key habitat patches shifts more toward the southern regions, and the restoration pathway is redirected accordingly. In the period of 2080–2100, the restoration areas are increasingly concentrated along the coastal zones of the west and south, and the restoration pathway follows this west-to-south coastal distribution. The SSP370 scenario shows a similar pattern during 2020–2041, with the majority of core areas located in the northwest and southwest. The restoration pathway is initially restricted to the western region, with the key habitats being linked. Between 2040 and 2061, new core habitats form towards the center of the area, prompting the corridor to extend and connect with them. By 2060–2081, the core areas shift more towards the southwest and south, and the corridor expands to the southeast. In the final projection for 2080–2100, the remaining core habitats are limited to a narrow belt along the Aegean and Mediterranean coasts, and the restoration pathway aligns with this coastal concentration. The SSP585 scenario demonstrates the most significant change in the spatial configuration of areas with high restoration potential for U. glabra. Between 2020 and 2041, the core areas will remain in both the northwest and interior parts of Türkiye, while the restoration pathway will begin to take on a diagonal direction, linking the Marmara region with the east. As key restoration areas in the central Anatolian region become more spatially dispersed by 2040–2061, the corridor shifts its direction to link newly fragmented patches in the southeast. During 2060–2081, core objects are located mainly in the southwestern and far southeastern parts of the country, with very limited distribution in the central region. By 2080–2100, only a few key habitat areas with high potential for the restoration of U. glabra remain along the western Mediterranean and southern coasts, and the restoration pathway becomes considerably narrower.
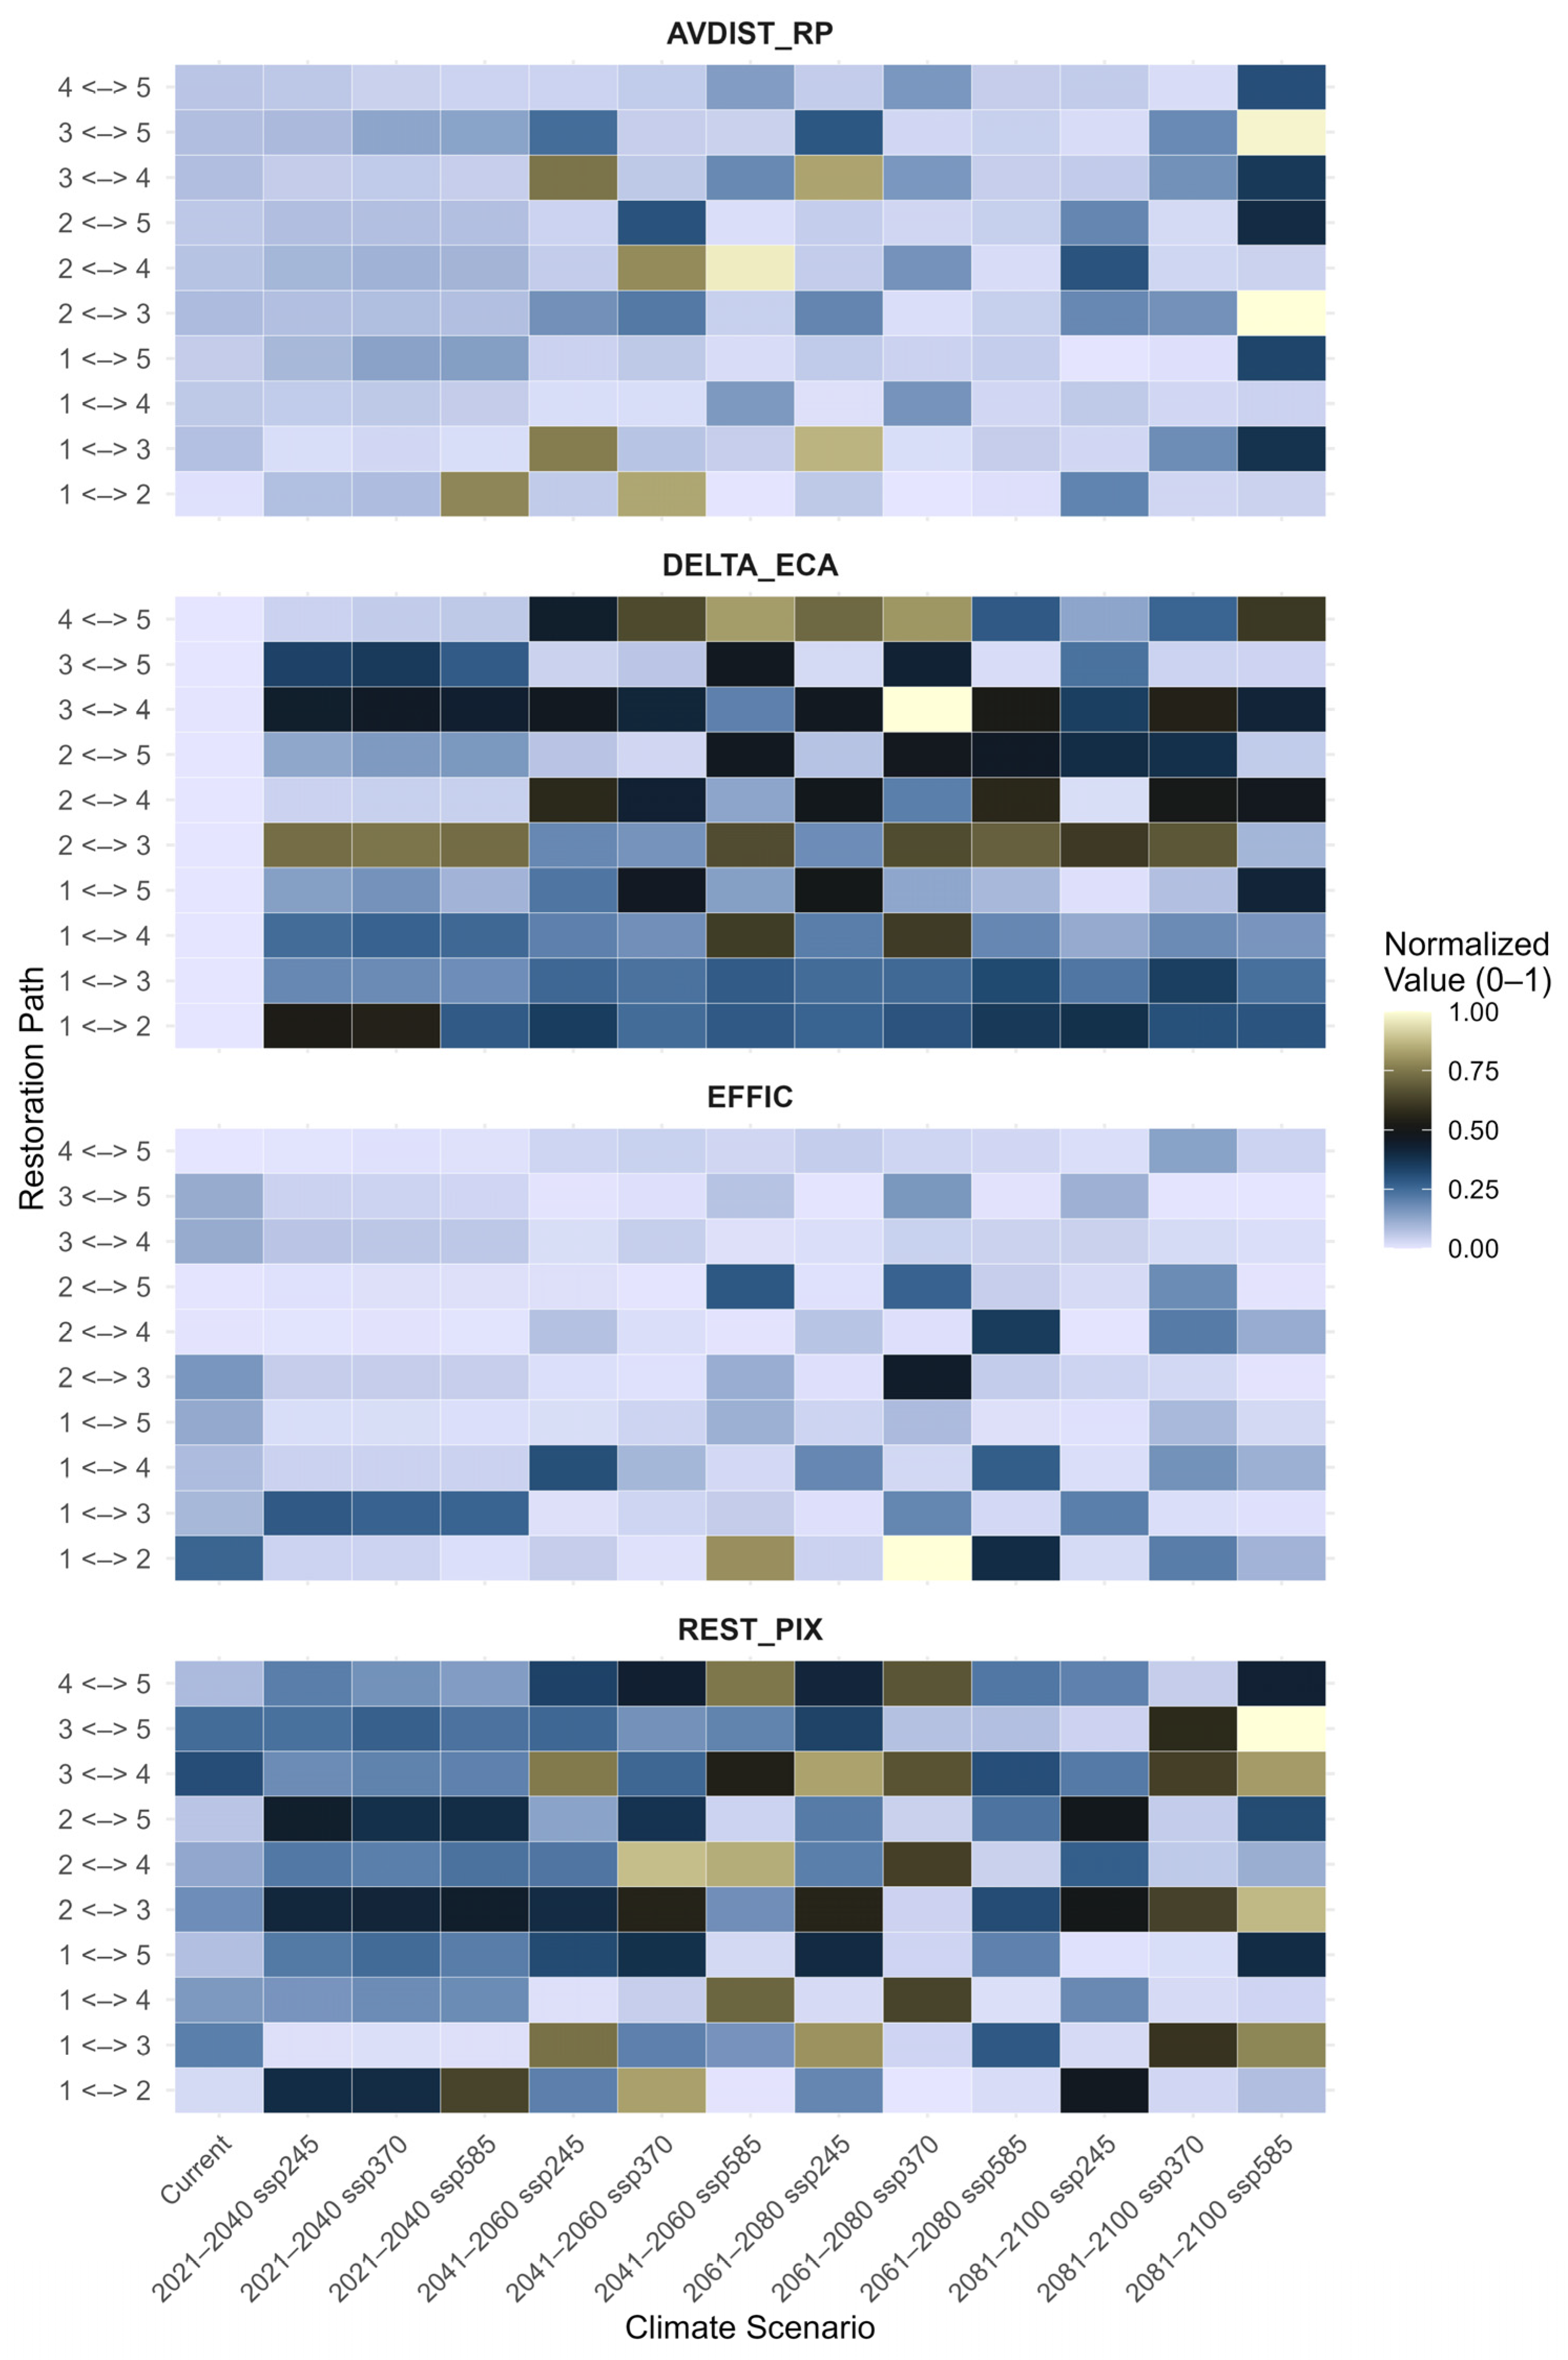
The heat maps display the normalized values (0–1) of three key connectivity metrics—AVDIST_RP (Average Distance between Restoration Patches), DELTA_ECA (Change in Effective Connectivity Area), and EFFIC (Functional Connectivity Efficiency). These metrics demonstrate substantial variation between current conditions and projected future climate scenarios (Figure 6). Under current conditions, the 1 <-> 2 (0.01) and 1 <-> 3 (0.07) pathways exhibit the lowest AVDIST_RP values (Table A5). However, the metric values of future climate scenarios demonstrate enormous increases in inter-patch distances. For example, the 1 <-> 2 pathway sharply increases under 2041–2060 SSP370 (0.84), and 2 <-> 4 hits one of the highest values of 0.97 under 2041–2060 SSP585, indicating a high fragmentation. The 1 <-> 3 and 3 <-> 4 pathways similarly show notable increases in distance under the 2061–2080 SSP245 scenario, with values of 0.86 and 0.83, respectively. Whilst this progression may suggest a consistent trend, the AVDIST_RP values fluctuate across scenarios, indicating that the increase is not strictly linear from optimistic to pessimistic projections. On the other hand, corridors like 1 <-> 5 and 2 <-> 5 have very similar AVDIST_RP values across all scenarios.
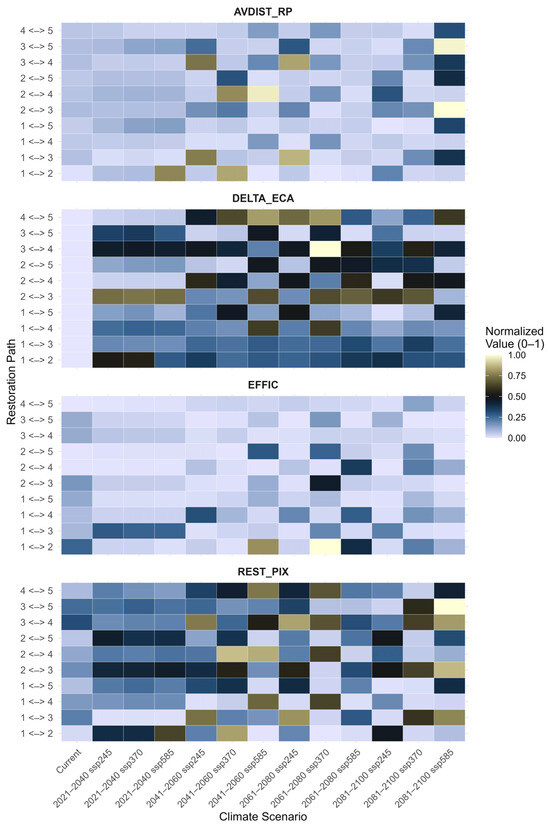
Figure 6.
Heat maps representing the normalized values (ranging from 0 to 1) of four metrics used for restoration planning under different climatic scenarios: Restoration Pixels (REST_PIX), Average Distance of Restoration Pixels from the Network (AVDIST_RP), Change in Equivalent Connected Area (DELTA_ECA), and Restoration Efficiency (EFFIC).
The DELTA_ECA shows high values under current conditions, particularly for 2 <-> 3 (0.79), 1 <-> 3 (0.57), and 2 <-> 4 (0.57). Future projections highlight these trends more clearly. This is reflected in the 3 <-> 4 path returning a maximum normalized value under the 2041–2060 SSP585 scenario (1.00). In a similar way, 1 <-> 5 also demonstrates a high possibility in 2041–2060 SSP245 (0.93), whereas 2 <-> 5 and 3 <-> 5 have moderate to high values among several pathways. However, despite expectations of steady transitions from current to future scenarios, some fluctuations in value patterns appear across both SSP245 and SSP585 timelines. This suggests varying sensitivity of ecological gains to different climate trajectories.
The current scenario yielded relatively low values for EFFIC for most of the paths, except for 1 <-> 2 (0.12), 2 <-> 3 (0.22), and 1 <-> 5 (0.15). It is anticipated that the 1 <-> 2 path will exhibit a substantial growth under the 2041–2060 SSP370 scenario, attaining its maximum efficiency score of 1.00. This path also emerges as highly valuable (0.78) under the 2061–2080 SSP245 scenario, confirming it as a repeatedly optimal corridor. While a few other paths, such as 1 <-> 4 and 2 <-> 3, show slight improvements, the majority continue to perform below average in terms of cost-effective connectivity. Across scenarios, efficiency improvements do not follow a strict gradient, instead appearing sporadically, particularly under intermediate pathways such as SSP245 and SSP370.
The area of pixels targeted for restoration, indicated by REST_PIX, exhibits relatively high values across numerous paths, even under current conditions. Importantly, 1 <-> 3 (0.30), 2 <-> 3 (0.25), and 3 <-> 4 (0.30) already cover large areas identified for potential restoration. These values are forecasted to increase in future scenarios. Conversely, the 3 <-> 5 pathway under 2081–2100 SSP585 is predicted to achieve the maximum level of normalization (1.00), and the 2 <-> 3 path also reaches its maximum value under the same scenario (0.99). However, the 1 <-> 2 path consistently shows the lowest restoration potential, remaining as low as 0.03 in the 2081–2100 SSP370 scenario. Although some high values emerge in the later, more pessimistic scenarios, the overall pattern does not indicate a monotonic rise with increasing severity, pointing instead to localized restoration needs sensitive to both climate and spatial context.
4. Discussion
In order to tackle the issues of habitat fragmentation and climate change that impact the distribution of U. glabra in Türkiye, this study combined species distribution modeling with restoration planning and suggested optimal pathways among important core areas. The MaxEnt model used in this study demonstrated high predictive performance (AUC_train = 0.889; AUC_test = 0.823). Thus, the results support the reliability of the selected bioclimatic variables, especially annual precipitation (BIO12) and temperature seasonality (BIO4), which were determined as the most influential variables. The current distribution of suitable habitats was primarily concentrated along the Black Sea coastline, showing a strong alignment with the current distribution patterns of U. glabra in Türkiye. Annual precipitation (BIO12) and temperature seasonality (BIO4) appear to exert strong constraints on the habitat of U. glabra in Türkiye. This species is typically restricted to humid montane and riparian forests, where moisture remains relatively stable and seasonal temperature fluctuations are less extreme. These requirements reflect its ecological specialization: U. glabra depends on fertile soils and shaded topography, and it is highly sensitive to water deficits and sharp thermal contrasts. Forest types belonging to the Tilio–Acerion alliance and other mesophilic communities across Europe share these stable microclimatic properties, which partly explain the species’ persistence in these habitats [1,2]. Previous studies also support this view. They describe U. glabra as a relict species surviving in damp valleys and ravines that buffer against drought and cold [55,83]. Its populations in Türkiye, especially those along the Black Sea coast and in topographically sheltered refuges, likely owe their persistence to such conditions. Here, maritime influences and complex terrain reduce summer heat and winter cold, allowing the species to persist despite surrounding landscape pressures.
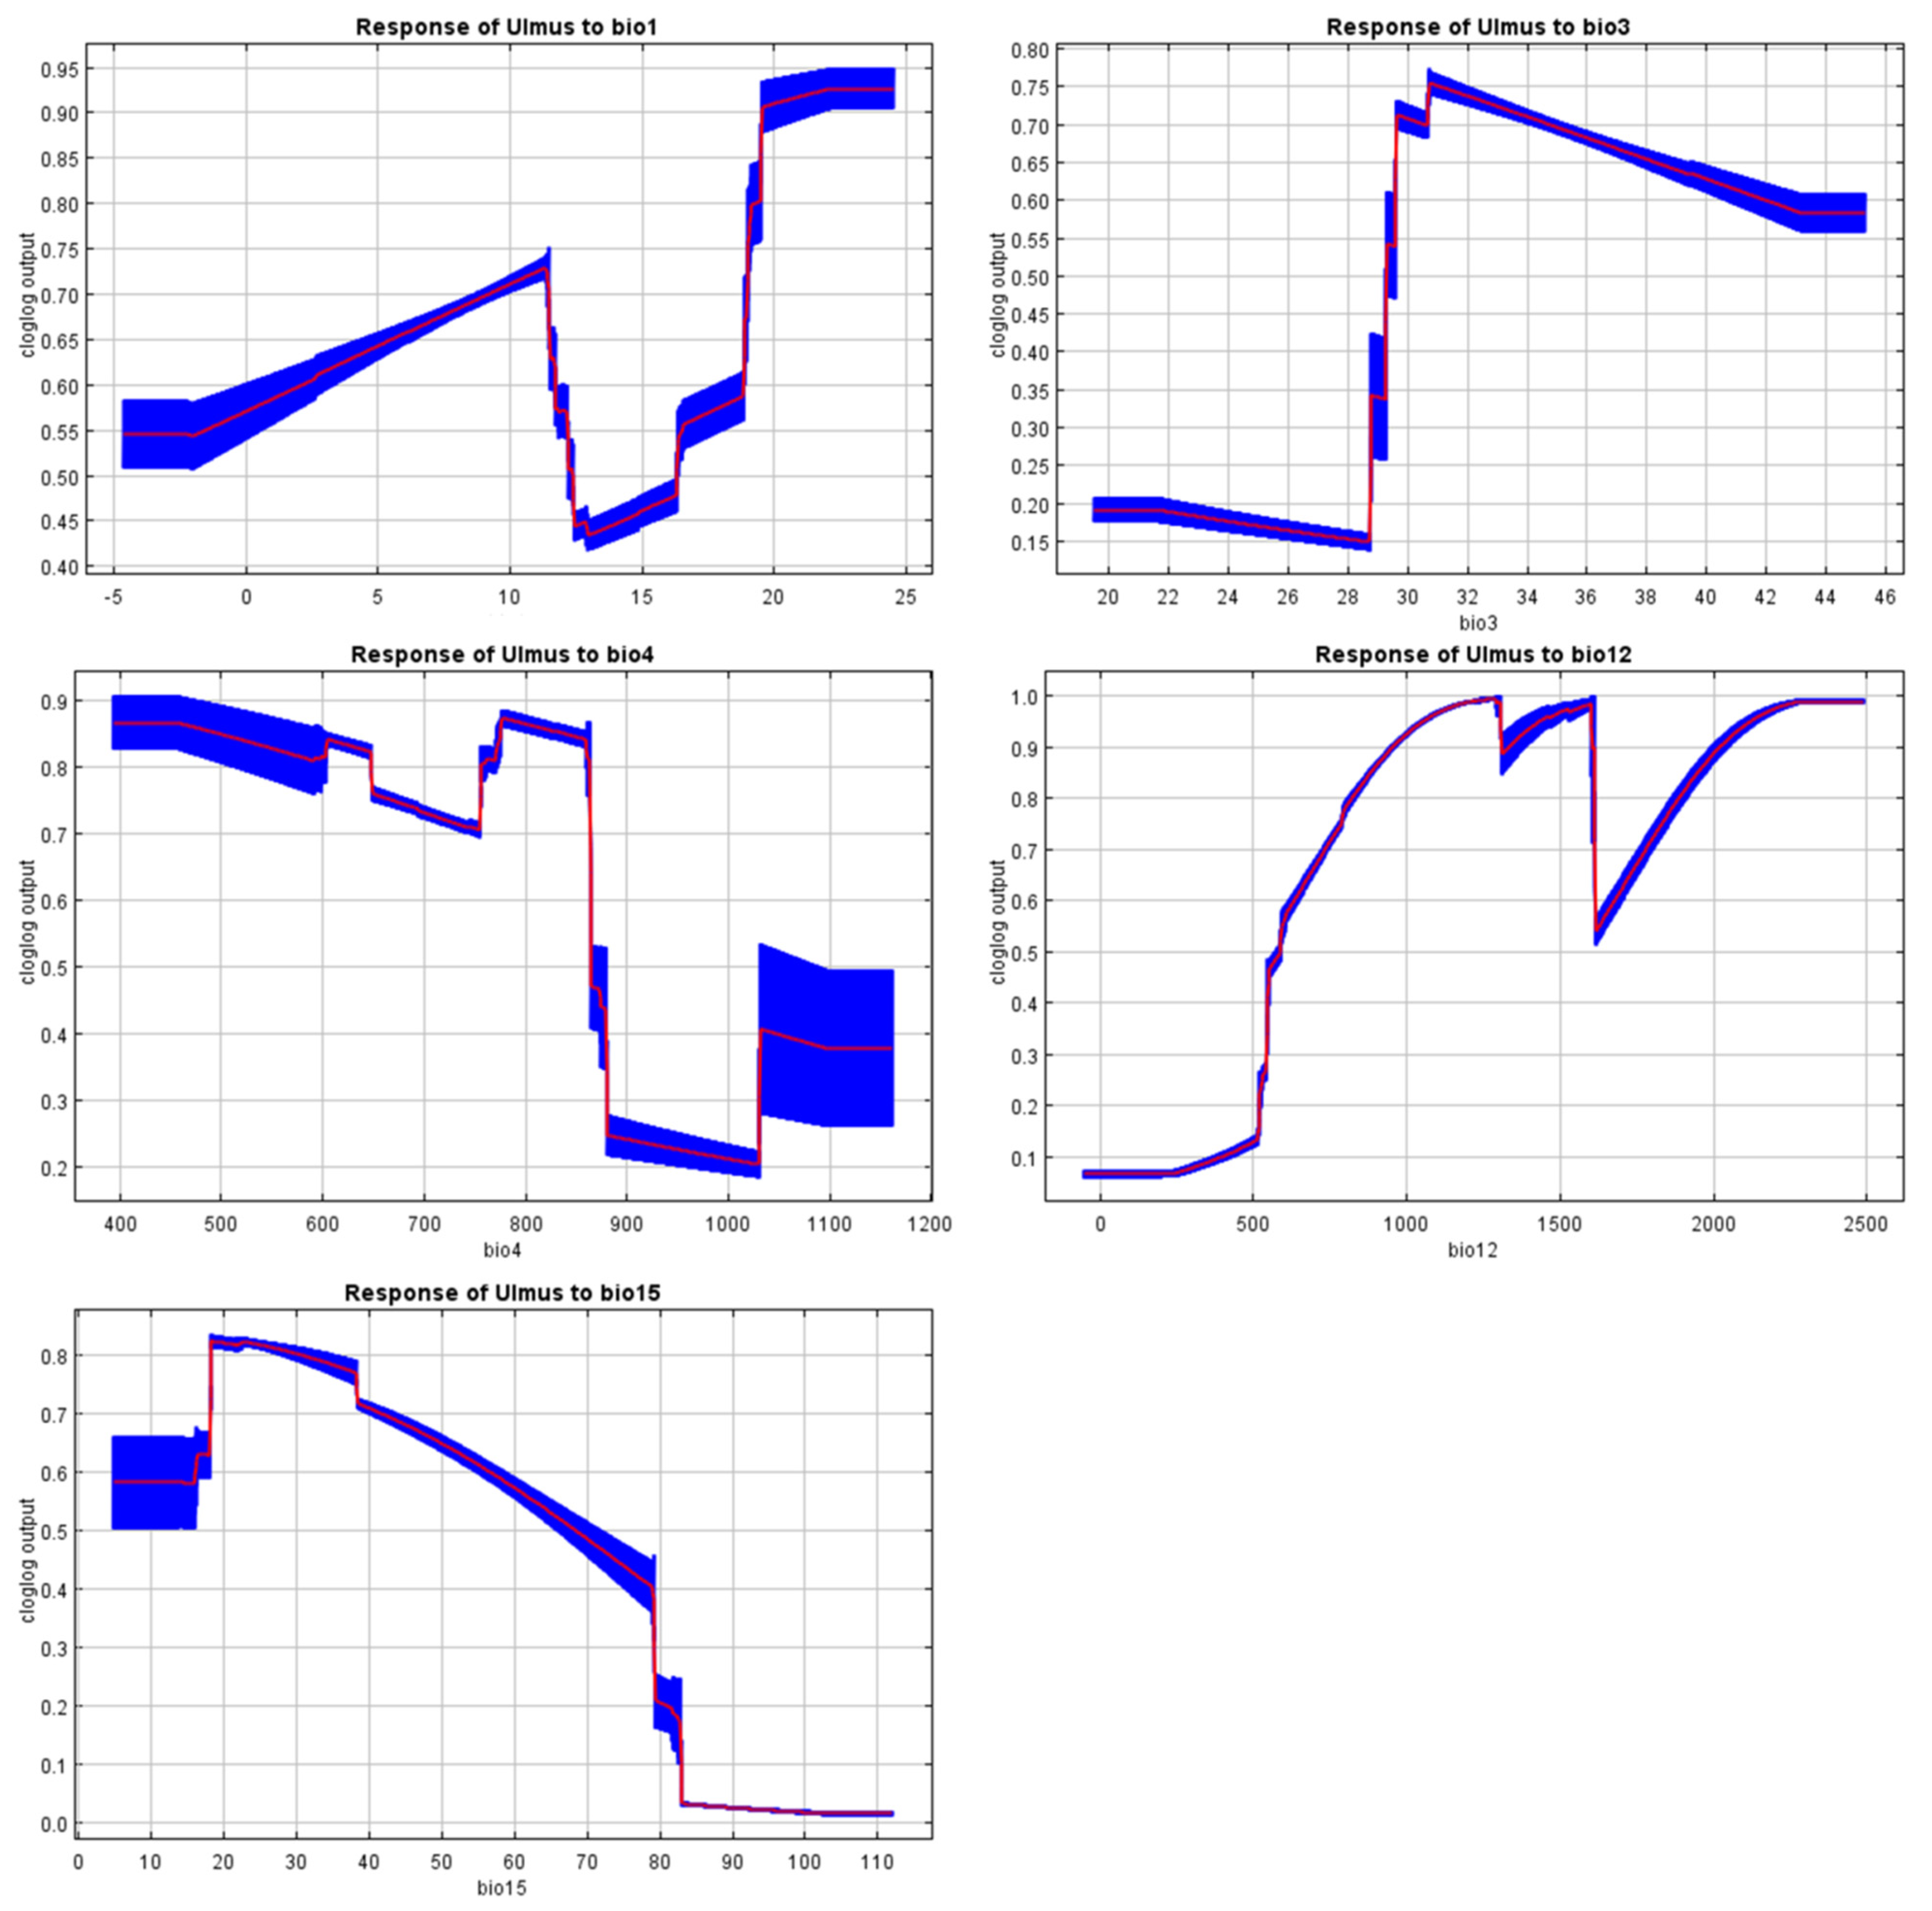
Although the minimum temperature of the coldest month (BIO6) and the mean temperature of the coldest quarter (BIO11) often determine the range of broadleaf trees, these variables were excluded due to multicollinearity with other predictors. This choice reflects a limitation of the present analysis, as winter cold tolerance is also recognized as an important factor for U. glabra elsewhere in Europe. Even so, the response curves for temperature seasonality (BIO4) and precipitation (BIO12, BIO15) suggest that narrow thermal and moisture requirements restrict its range (Figure A5). These findings highlight that conservation and restoration strategies must give careful attention to water availability and thermal stability. They also indicate a need for further work to disentangle multicollinearity among temperature variables, so that future models can explicitly examine the role of winter cold in shaping the species’ distribution under present and projected climates. Projections under SSP245, SSP370, and SSP585 scenarios indicate a considerable decrease in the geographical range of the species, with a projected geographical shift towards the higher altitudes and the coastal regions by 2081–2100. This finding is consistent with the results of previous study, which forecasted the distribution of the species is likely to become increasingly restricted to mountainous and coastal regions, where stable climates exist under climate change pressures. Given that U. glabra is a thermophilic species highly sensitive to cold extremes, projected increases in BIO6 or BIO11 under future climate scenarios could, paradoxically, reduce these constraints and create milder winter conditions in some parts of its range. This change may allow U. glabra to establish or persist in areas that are currently too cold, potentially opening new habitat patches and improving habitat quality at higher elevations or marginal sites. Including this detail would help balance the discussion of overall range contraction with the possibility of localized range expansion driven by decreasing cold stress. In addition, our projections revealed higher degrees of habitat fragmentation and regional declines at lower elevations due to temperature increases and reduced summer precipitation. Our findings support previous studies suggesting that mountains and coastal regions may function as vital habitats for tree species under increasing climate stress [84,85,86].
Restoration analyses revealed that the connectivity potential for U. glabra is highly sensitive to both the projected climate trajectory and the temporal scale under consideration. The restoration analyses revealed clear spatial and temporal shifts in the restoration potential of U. glabra across Türkiye, under different climate change scenarios. Under current climatic conditions, restoration pathways connecting the largest core habitat areas show high efficiency with minimal restoration input, suggesting that immediate interventions are both feasible and cost-effective. This finding highlighted the benefits of proactive restoration before severe habitat degradation occurs [87,88]. However, future projections, particularly under higher emission scenarios such as SSP585, indicated increasing habitat fragmentation and greater distances between patches, making restoration efforts more difficult. SSP585 is a high-risk boundary condition rather than a most probable outcome. This high-emission pathway is now widely considered implausible by the climate science community, and its unqualified use in ecological projections has been criticized as misleading or unrealistic for policy planning. Several high-impact studies have demonstrated that SSP585 represents an extreme, low-likelihood scenario, only plausible if all mitigation fails and global coal use continues to rise throughout the 21st century—a trajectory that conflicts with current and projected energy transitions and policy commitments. Given this, presenting SSP585 without caveats may overstate future risks and bias restoration priorities [89,90]. A more credible and policy-relevant analysis would focus on intermediate pathways such as SSP245 or SSP370, which align more closely with observed emission trends and mitigation pledges under the Paris Agreement. An explicit framing of SSP585 as a high-risk boundary condition, rather than a most likely future, will support more adaptive conservation and restoration planning. Although this scenario may exaggerate the severity of future impacts, the projected patterns align with established theory, showing that ongoing climate change will fragment landscapes and raise the complexity and cost of restoration. These findings also highlight the need for early, carefully planned actions that maintain connections between habitat patches and support long-term conservation goals [18,91].
Moreover, although some key restoration corridors retain high functional connectivity under moderate climate scenarios, overall efficiency gains show irregular patterns with increasing climate severity. The result aligns with other studies indicating that connectivity responses to climate change are frequently non-linear and affected by landscape heterogeneity and local climatic variables [92]. Similarly, while ΔECA values indicate that large connectivity gains are achievable under certain scenarios, these gains increasingly require greater restoration inputs towards the end of the century, reflecting the increasing ecological costs of delayed action [91]. Spatially, restoration pathways are projected to shift from northwestern regions to coastal areas, particularly along the Aegean and Mediterranean coasts. This pattern is consistent with expectations that coastal and mountainous areas will act as climatic refugia under future climate scenarios [84,85] However, projections suggested that maintaining connectivity in these areas will require increasingly targeted timely restoration efforts, particularly in southern and southwestern Türkiye, where habitat structure and climatic conditions will still support cost-effective interventions [88].
Based on future scenarios, restoration priorities will transition spatially from coastal-inland connections to east–west corridors. Though current pathways are mostly restricted to Black Sea populations from central Anatolia, by the next (2061–2080 SSP370) period optimal pathways are redirected towards connection from northeastern to northwestern populations. This reconfiguration is consistent with expected habitat expansions in coastal refugia and contractions in inland areas, as seen by Mediterranean riparian systems experiencing aridification [30]. The Anatolian Diagonal is crucial as both a biogeographic transition zone and a climate refuge, maintaining habitat suitability across SSP585, which represents a worst-case boundary scenario rather than a most probable future. The continued habitat suitability observed in the Anatolian Diagonal under these extreme conditions reinforces its conservation value even under the most severe climate projections. Re-establishing connectivity here could help prevent Dutch elm disease dispersal or limbering, two threats that result in large-scale mortality in fragmented populations during drought years [5,6].
Methodologically, the integration of MaxEnt and the Restoration Planner (RP) tool offered a coherent and complementary framework for assessing habitat suitability and prioritizing restoration interventions for U. glabra under climate change. MaxEnt is a widely accepted species distribution modeling algorithm, particularly effective with presence-only data, and has been successfully applied in modeling climate-driven range shifts for many temperate tree species [92,93,94]. In this study, its performance was further enhanced through a rigorous pre-modeling process that included multicollinearity control via VIF analysis and selection among 350 candidate models, ensuring statistical reliability and ecological relevance.
The RP tool was employed to facilitate the spatially explicit evaluation of multiple connectivity-based restoration metrics, including ΔECA, EFFIC, AVDIST_RP, and REST_PIX. However, it should be noted that a recognized limitation of such tools is their emphasis on structural over functional connectivity. It has been determined that factors such as species-specific dispersal capacity, habitat quality, microhabitat heterogeneity and ecological interactions (for example, competition and disturbance regimes) are not directly modeled. This has the potential to result in reduced accuracy regarding the on-the-ground applicability. Consequently, future research should incorporate movement-based connectivity modeling, genetic structure data, and field-based validation of restoration corridors. Despite these limitations, the integrated approach applied here provides a scalable and transferable framework for forest restoration planning, particularly in the face of increasing climate and anthropogenic pressures.
Riparian forests are essential for fauna protection, offering habitat, refuge, and corridors for diverse terrestrial and aquatic species, including amphibians, birds, and invertebrates. The structural complexity and biodiversity of these ecosystems contribute to the regulation of water temperature through shading and provide fundamental resources such as food and shelter, thus supporting the ecological integrity of riverine environments [95]. As a riparian species, U. glabra plays an important role in the protection and prevention of soil erosion through the stabilization provided by their root systems, which reinforce riverbanks and reduce the risk of mass failure [96]. These southernmost populations of U. glabra, located at the biogeographic margin of the species’ range in Türkiye and the southern Balkans, represent rear-edge refugia with high conservation value. Their long-term persistence under climatic stress and fragmentation makes them crucial for preserving genetic diversity and potential source material for assisted migration or adaptive management strategies. The spatially explicit data presented in this study provide essential guidance for safeguarding these marginal refugia. Furthermore, this vegetation also intercepts surface runoff, slowing water flow and promoting infiltration, thereby reducing sediment delivery to watercourses [96,97]. Although, this paper does not directly focus on soil stabilization, our findings can be used as a basis for future research investigating the specific contributions of U. glabra to soil stability in riparian zones.
The findings of this study offer valuable guidelines for forest restoration and conservation. They indicate areas that are crucial for maintaining habitat continuity and identify where fragmented forest patches might be reunited through restoration initiatives. These data can assist in prioritizing regions requiring restoration to maintain ecological links and enhance the effective allocation of conservation resources. The enduring viability of these ecosystems under changing climatic conditions may be strengthened by concentrating on these regions, which might also reinforce riparian and montane forest networks and facilitate genetic exchange across U. glabra populations. The feasibility of implementing these solutions will be influenced by stakeholder collaboration, financial resources, and local land-use regulations. To effectively address these pragmatic challenges and enhance the probability of achieving restoration objectives, collaboration with forest managers, landowners, and local populations is necessary. Achieving these aims will entail overcoming several difficulties, including insufficient finance, conflicting land-use policies, and the need for adaptive management and long-term monitoring. Establishing incentives for community involvement, sustaining reliable funding frameworks to underpin continuous restoration efforts, and integrating restoration goals into regional planning initiatives are practical solutions. By considering such aspects, restoration initiatives can become increasingly realistic, resilient, and more likely to succeed.
5. Conclusions
This study proposes an integrative framework that incorporates species distribution modeling and connectivity-based restoration planning to mitigate climate change threats on U. glabra in Türkiye. The results indicate that the species currently thrives across the Black Sea region, but future climate change, especially under high-emission scenarios is likely to fragment its range. Specifically, restoration efforts in western and southern coastal zones are expected to be more successful in preserving connectivity into the future.
RP-based analyses showed that restoration effectiveness differed by climate scenario and temporal window, where the predictions for mid-century (2040–2080) provided the highest potential for improving ecological connectivity. Restoration efficiency (EFFIC) and gain in equivalent connected area (ΔECA) are key metrics for highlighting cost-effective actions (among the metrics evaluated). As an example of connectivity gain, Pathway 4 <-> 5 contributed the most connectivity gain under SSP585 scenario, whereas pathway 1 <-> 2 was the most efficient (i.e., lowest restoration input) under current conditions.
Restoring connectivity for U. glabra in Türkiye requires attention to two simultaneous strategies; cost efficient action in the short to medium term, together with adaptive planning for future connectivity restoration to combat fragmentation. Protecting these marginal rear-edge populations in Türkiye is especially critical, as they may serve as genetic reservoirs and play a key role in the species’ long-term resilience under climate change. This method provides a model for temperate forests around the world where biodiversity and ecosystem services are threatened by climate change and anthropogenic pressures.
Author Contributions
D.G.: conceptualization, supervision, project administration, funding acquisition, visualization, writing—review and editing; J.V.: conceptualization, formal analysis, writing—review and editing; V.R.: writing—review and editing, validation, software; J.M.-M.: writing—review and editing; E.E.T.: writing—review and editing; A.U.Ö.: investigation, data curation; B.A.: writing—review and editing; K.Ç.: writing—review and editing, software. All authors have read and agreed to the published version of the manuscript.
Funding
This study employs MaxEnt models adapted from the master’s thesis of Buse Ar. The presented study expands on the previous modeling work by applying Restoration Planner (RP) to determine key restoration areas and optimal pathways (corridors). The authors thank to the Scientific Research Projects Unit of Aydın Adnan Menderes University for financially supporting this thesis [project number ZRF-23032].
Data Availability Statement
The data presented in this study are available on request from the corresponding author.
Conflicts of Interest
Víctor Rincón was employed by Tragsatec. The remaining authors declare that the research was conducted in the absence of any commercial or financial relationships that could be construed as a potential conflict of interest.
Appendix A

Table A1.
Bioclimatic variables and their definitions (WorldClim v2.1 database [59]).
Table A1.
Bioclimatic variables and their definitions (WorldClim v2.1 database [59]).
| Code | Description |
|---|---|
| BIO1 | Annual Mean Temperature |
| BIO2 | Mean Diurnal Range (Mean of monthly (max temp–min temp)) |
| BIO3 | Isothermality (BIO2/BIO7) (*100) |
| BIO4 | Temperature Seasonality (standard deviation *100) |
| BIO5 | Max Temperature of Warmest Month |
| BIO6 | Min Temperature of Coldest Month |
| BIO7 | Temperature Annual Range (BIO5-BIO6) |
| BIO10 | Mean Temperature of Warmest Quarter |
| BIO11 | Mean Temperature of Coldest Quarter |
| BIO12 | Annual Precipitation |
| BIO13 | Precipitation of Wettest Month |
| BIO14 | Precipitation of Driest Month |
| BIO15 | Precipitation Seasonality (Coefficient of Variation) |
| BIO16 | Precipitation of Wettest Quarter |
| BIO17 | Precipitation of Driest Quarter |

Table A2.
Resistance values for land use classes according to Corine Land Cover 2018 (CLC 2018).
Table A2.
Resistance values for land use classes according to Corine Land Cover 2018 (CLC 2018).
| CLC 2018 Code | Resistance Values |
|---|---|
| 111 | 1000 |
| 112 | 1000 |
| 121 | 1000 |
| 122 | 1000 |
| 124 | 1000 |
| 131 | 1000 |
| 132 | 1000 |
| 133 | 1000 |
| 141 | 1000 |
| 142 | 1000 |
| 211 | 60 |
| 212 | 60 |
| 213 | 60 |
| 221 | 60 |
| 222 | 60 |
| 223 | 60 |
| 231 | 40 |
| 241 | 60 |
| 242 | 60 |
| 243 | 60 |
| 244 | 60 |
| 311 | 1 |
| 312 | 1 |
| 313 | 1 |
| 321 | 30 |
| 322 | 5 |
| 323 | 5 |
| 324 | 5 |
| 332 | 40 |
| 333 | 40 |
| 334 | 40 |
| 411 | 100 |
| 511 | 100 |
| 512 | 100 |

Table A3.
Resistance values for average daily traffic of infrastructures of the study area.
Table A3.
Resistance values for average daily traffic of infrastructures of the study area.
| Traffic | Resistance Values |
|---|---|
| <1000 | 80 |
| 1000–5000 | 100 |
| 5000–10,000 | 300 |
| >10,000 Not fenced | 700 |
| >10,000 Fenced | 900 |
| >20,000 Not fenced | 800 |
| >20,000 Fenced | 1000 |

Table A4.
Input values for resistance, obtained from Corine Land Cover 2018 land use classifications and average daily traffic of infrastructures within the research region, for the Restoration Planner tool (RP).
Table A4.
Input values for resistance, obtained from Corine Land Cover 2018 land use classifications and average daily traffic of infrastructures within the research region, for the Restoration Planner tool (RP).
| Range of Resistance Values | Reclassification Values for Resistance (%) | Input Values for Restoration Planner |
|---|---|---|
| 0–100 | 0 | 3 |
| 100–200 | 10 | 10 |
| 200–300 | 20 | 20 |
| 300–400 | 30 | 30 |
| 400–500 | 40 | 40 |
| 500–600 | 50 | 50 |
| 600–700 | 60 | 60 |
| 700–800 | 70 | 70 |
| 800–900 | 80 | 80 |
| 900–1000 | 90 | 90 |
| >1000 | 100 | 100 |
| Background | 0 | |
| Foreground | 2 | |

Table A5.
Restoration paths (RESTORE) under the current scenario, based on four metrics: number of restoration pixels (REST_PIX), average distance of restoration pixels from the ecological network (AVDIST_RP), restoration efficiency (EFFIC), and change in equivalent connected area (DELTA_ECA).
Table A5.
Restoration paths (RESTORE) under the current scenario, based on four metrics: number of restoration pixels (REST_PIX), average distance of restoration pixels from the ecological network (AVDIST_RP), restoration efficiency (EFFIC), and change in equivalent connected area (DELTA_ECA).
| SCENARIO | RESTORE | REST_PIX | AVDIST_RP | EFFIC | DELTA_ECA |
|---|---|---|---|---|---|
| Current | 1 <-> 2 | 16 | 2.12 | 38.18 | 34.36 |
| Current | 1 <-> 3 | 110 | 7.30 | 13.33 | 57.05 |
| Current | 1 <-> 4 | 83 | 6.04 | 11.90 | 38.08 |
| Current | 1 <-> 5 | 42 | 5.50 | 17.65 | 35.11 |
| Current | 2 <-> 3 | 94 | 8.18 | 23.38 | 79.04 |
| Current | 2 <-> 4 | 67 | 6.98 | 0.54 | 12.47 |
| Current | 2 <-> 5 | 36 | 6.25 | 0.18 | 25.49 |
| Current | 3 <-> 4 | 161 | 7.68 | 17.19 | 97.62 |
| Current | 3 <-> 5 | 130 | 7.64 | 17.19 | 82.85 |
| Current | 4 <-> 5 | 47 | 6.61 | 0.02 | 22.93 |
| 2021–2040 ssp245 | 1 <-> 2 | 204 | 7.62 | 5.23 | 39,099.27 |
| 2021–2040 ssp245 | 1 <-> 3 | 10 | 2.88 | 41.21 | 14,011.93 |
| 2021–2040 ssp245 | 1 <-> 4 | 87 | 5.75 | 5.57 | 18,220.09 |
| 2021–2040 ssp245 | 1 <-> 5 | 116 | 8.79 | 2.49 | 10,525.61 |
| 2021–2040 ssp245 | 2 <-> 3 | 213 | 7.43 | 6.93 | 53,922.41 |
| 2021–2040 ssp245 | 2 <-> 4 | 117 | 9.02 | 0.67 | 2832.69 |
| 2021–2040 ssp245 | 2 <-> 5 | 228 | 7.64 | 1.12 | 9237.95 |
| 2021–2040 ssp245 | 3 <-> 4 | 96 | 5.50 | 9.12 | 32,635.49 |
| 2021–2040 ssp245 | 3 <-> 5 | 125 | 8.38 | 5.46 | 24,805.88 |
| 2021–2040 ssp245 | 4 <-> 5 | 111 | 6.19 | 0.70 | 2865.33 |
| 2021–2040 ssp370 | 1 <-> 2 | 206 | 7.94 | 5.37 | 40,556.99 |
| 2021–2040 ssp370 | 1 <-> 3 | 11 | 3.80 | 38.76 | 13,564.45 |
| 2021–2040 ssp370 | 1 <-> 4 | 96 | 6.03 | 5.55 | 19,687.80 |
| 2021–2040 ssp370 | 1 <-> 5 | 131 | 12.34 | 2.68 | 12,347.16 |
| 2021–2040 ssp370 | 2 <-> 3 | 216 | 7.77 | 6.99 | 55,005.19 |
| 2021–2040 ssp370 | 2 <-> 4 | 110 | 9.61 | 0.80 | 3214.21 |
| 2021–2040 ssp370 | 2 <-> 5 | 200 | 7.47 | 1.49 | 11,210.04 |
| 2021–2040 ssp370 | 3 <-> 4 | 106 | 5.85 | 8.71 | 33,724.44 |
| 2021–2040 ssp370 | 3 <-> 5 | 141 | 11.76 | 5.34 | 26,258.10 |
| 2021–2040 ssp370 | 4 <-> 5 | 90 | 4.84 | 1.09 | 3826.86 |
| 2021–2040 ssp585 | 1 <-> 2 | 328 | 64.10 | 1.88 | 20,714.13 |
| 2021–2040 ssp585 | 1 <-> 3 | 10 | 2.88 | 38.47 | 13,079.65 |
| 2021–2040 ssp585 | 1 <-> 4 | 97 | 5.44 | 5.51 | 18,739.61 |
| 2021–2040 ssp585 | 1 <-> 5 | 112 | 13.10 | 1.85 | 7362.74 |
| 2021–2040 ssp585 | 2 <-> 3 | 230 | 7.43 | 6.62 | 53,805.13 |
| 2021–2040 ssp585 | 2 <-> 4 | 123 | 9.38 | 0.73 | 3195.96 |
| 2021–2040 ssp585 | 2 <-> 5 | 202 | 7.45 | 1.52 | 11,621.66 |
| 2021–2040 ssp585 | 3 <-> 4 | 107 | 5.20 | 8.62 | 32,223.03 |
| 2021–2040 ssp585 | 3 <-> 5 | 122 | 12.27 | 4.78 | 20,613.10 |
| 2021–2040 ssp585 | 4 <-> 5 | 79 | 4.45 | 1.29 | 4222.24 |
| 2041–2060 ssp245 | 1 <-> 2 | 109 | 5.76 | 6.88 | 25,887.51 |
| 2041–2060 ssp245 | 1 <-> 3 | 379 | 62.62 | 1.45 | 18,900.61 |
| 2041–2060 ssp245 | 1 <-> 4 | 10 | 2.88 | 44.41 | 15,098.95 |
| 2041–2060 ssp245 | 1 <-> 5 | 165 | 4.53 | 2.65 | 16,772.40 |
| 2041–2060 ssp245 | 2 <-> 3 | 206 | 15.31 | 1.91 | 13,981.66 |
| 2041–2060 ssp245 | 2 <-> 4 | 119 | 5.52 | 10.29 | 42,191.77 |
| 2041–2060 ssp245 | 2 <-> 5 | 72 | 4.43 | 1.78 | 4804.67 |
| 2041–2060 ssp245 | 3 <-> 4 | 389 | 61.08 | 2.61 | 34,833.50 |
| 2041–2060 ssp245 | 3 <-> 5 | 134 | 21.15 | 0.64 | 2974.71 |
| 2041–2060 ssp245 | 4 <-> 5 | 175 | 4.43 | 4.87 | 32,505.51 |
| 2041–2060 ssp370 | 1 <-> 2 | 427 | 68.79 | 1.29 | 18,286.19 |
| 2041–2060 ssp370 | 1 <-> 3 | 108 | 6.84 | 4.82 | 17,240.82 |
| 2041–2060 ssp370 | 1 <-> 4 | 27 | 2.86 | 13.83 | 12,859.70 |
| 2041–2060 ssp370 | 1 <-> 5 | 198 | 6.11 | 5.00 | 34,474.62 |
| 2041–2060 ssp370 | 2 <-> 3 | 285 | 19.05 | 1.24 | 12,248.41 |
| 2041–2060 ssp370 | 2 <-> 4 | 454 | 64.87 | 2.10 | 31,685.04 |
| 2041–2060 ssp370 | 2 <-> 5 | 194 | 25.54 | 0.34 | 2248.17 |
| 2041–2060 ssp370 | 3 <-> 4 | 135 | 6.04 | 6.79 | 30,607.67 |
| 2041–2060 ssp370 | 3 <-> 5 | 91 | 5.19 | 1.38 | 4594.76 |
| 2041–2060 ssp370 | 4 <-> 5 | 225 | 5.72 | 6.15 | 48,054.63 |
| 2041–2060 ssp585 | 1 <-> 2 | 6 | 1.64 | 116.35 | 20,942.90 |
| 2041–2060 ssp585 | 1 <-> 3 | 88 | 5.16 | 7.28 | 20,593.88 |
| 2041–2060 ssp585 | 1 <-> 4 | 368 | 13.82 | 3.70 | 45,833.84 |
| 2041–2060 ssp585 | 1 <-> 5 | 17 | 3.03 | 15.71 | 10,526.75 |
| 2041–2060 ssp585 | 2 <-> 3 | 93 | 4.97 | 16.26 | 48,607.34 |
| 2041–2060 ssp585 | 2 <-> 4 | 438 | 79.12 | 0.66 | 9547.03 |
| 2041–2060 ssp585 | 2 <-> 5 | 22 | 2.70 | 42.09 | 34,931.28 |
| 2041–2060 ssp585 | 3 <-> 4 | 280 | 16.54 | 1.58 | 15,078.97 |
| 2041–2060 ssp585 | 3 <-> 5 | 105 | 4.81 | 9.86 | 34,497.92 |
| 2041–2060 ssp585 | 4 <-> 5 | 385 | 13.34 | 4.65 | 60,775.63 |
| 2061–2080 ssp245 | 1 <-> 2 | 102 | 6.00 | 5.51 | 19,460.40 |
| 2061–2080 ssp245 | 1 <-> 3 | 414 | 70.86 | 1.34 | 18,320.83 |
| 2061–2080 ssp245 | 1 <-> 4 | 15 | 2.47 | 27.67 | 15,492.43 |
| 2061–2080 ssp245 | 1 <-> 5 | 207 | 5.83 | 4.99 | 36,599.24 |
| 2061–2080 ssp245 | 2 <-> 3 | 287 | 17.10 | 1.31 | 13,219.65 |
| 2061–2080 ssp245 | 2 <-> 4 | 110 | 5.57 | 9.62 | 35,683.07 |
| 2061–2080 ssp245 | 2 <-> 5 | 113 | 5.36 | 1.25 | 5065.64 |
| 2061–2080 ssp245 | 3 <-> 4 | 429 | 68.47 | 2.42 | 34,492.55 |
| 2061–2080 ssp245 | 3 <-> 5 | 174 | 24.71 | 0.29 | 1778.65 |
| 2061–2080 ssp245 | 4 <-> 5 | 215 | 5.62 | 7.06 | 53,063.32 |
| 2061–2080 ssp370 | 1 <-> 2 | 4 | 1.50 | 146.10 | 21,915.29 |
| 2061–2080 ssp370 | 1 <-> 3 | 21 | 2.91 | 28.24 | 18,637.40 |
| 2061–2080 ssp370 | 1 <-> 4 | 328 | 14.83 | 3.96 | 45,560.69 |
| 2061–2080 ssp370 | 1 <-> 5 | 21 | 4.50 | 12.30 | 9349.54 |
| 2061–2080 ssp370 | 2 <-> 3 | 23 | 2.77 | 65.31 | 48,332.26 |
| 2061–2080 ssp370 | 2 <-> 4 | 324 | 14.99 | 1.35 | 15,361.38 |
| 2061–2080 ssp370 | 2 <-> 5 | 25 | 4.02 | 38.73 | 35,244.45 |
| 2061–2080 ssp370 | 3 <-> 4 | 347 | 14.18 | 6.12 | 74,000.79 |
| 2061–2080 ssp370 | 3 <-> 5 | 40 | 3.81 | 23.24 | 31,372.64 |
| 2061–2080 ssp370 | 4 <-> 5 | 349 | 14.20 | 4.87 | 59,812.12 |
| 2061–2080 ssp585 | 1 <-> 2 | 14 | 2.37 | 57.70 | 26,540.32 |
| 2061–2080 ssp585 | 1 <-> 3 | 149 | 5.30 | 3.65 | 23,553.95 |
| 2061–2080 ssp585 | 1 <-> 4 | 11 | 3.80 | 40.20 | 14,069.53 |
| 2061–2080 ssp585 | 1 <-> 5 | 107 | 5.41 | 1.45 | 6625.07 |
| 2061–2080 ssp585 | 2 <-> 3 | 163 | 5.05 | 7.52 | 51,939.02 |
| 2061–2080 ssp585 | 2 <-> 4 | 25 | 3.00 | 51.68 | 41,857.53 |
| 2061–2080 ssp585 | 2 <-> 5 | 121 | 5.06 | 6.71 | 33,708.03 |
| 2061–2080 ssp585 | 3 <-> 4 | 160 | 5.19 | 5.66 | 38,517.57 |
| 2061–2080 ssp585 | 3 <-> 5 | 42 | 5.01 | 0.74 | 1401.27 |
| 2061–2080 ssp585 | 4 <-> 5 | 118 | 5.26 | 4.27 | 20,957.18 |
| 2081–2100 ssp245 | 1 <-> 2 | 242 | 17.39 | 3.33 | 28,108.07 |
| 2081–2100 ssp245 | 1 <-> 3 | 15 | 3.81 | 30.27 | 16,647.43 |
| 2081–2100 ssp245 | 1 <-> 4 | 99 | 5.99 | 2.40 | 8821.37 |
| 2081–2100 ssp245 | 1 <-> 5 | 8 | 1.71 | 1.22 | 707.62 |
| 2081–2100 ssp245 | 2 <-> 3 | 257 | 16.60 | 5.03 | 45,187.68 |
| 2081–2100 ssp245 | 2 <-> 4 | 143 | 25.29 | 0.28 | 1323.23 |
| 2081–2100 ssp245 | 2 <-> 5 | 250 | 16.89 | 3.20 | 28,828.07 |
| 2081–2100 ssp245 | 3 <-> 4 | 114 | 5.70 | 6.05 | 25,597.15 |
| 2081–2100 ssp245 | 3 <-> 5 | 23 | 3.08 | 15.37 | 17,363.83 |
| 2081–2100 ssp245 | 4 <-> 5 | 107 | 5.67 | 2.24 | 9532.33 |
| 2081–2100 ssp370 | 1 <-> 2 | 19 | 4.00 | 31.02 | 22,336.34 |
| 2081–2100 ssp370 | 1 <-> 3 | 309 | 15.76 | 2.20 | 25,582.46 |
| 2081–2100 ssp370 | 1 <-> 4 | 15 | 3.81 | 24.66 | 13,562.36 |
| 2081–2100 ssp370 | 1 <-> 5 | 13 | 2.24 | 12.85 | 5524.33 |
| 2081–2100 ssp370 | 2 <-> 3 | 326 | 15.16 | 4.09 | 50,180.52 |
| 2081–2100 ssp370 | 2 <-> 4 | 32 | 4.07 | 31.43 | 37,400.66 |
| 2081–2100 ssp370 | 2 <-> 5 | 30 | 3.40 | 26.56 | 28,417.61 |
| 2081–2100 ssp370 | 3 <-> 4 | 324 | 15.21 | 3.32 | 40,428.15 |
| 2081–2100 ssp370 | 3 <-> 5 | 296 | 16.35 | 0.24 | 2688.03 |
| 2081–2100 ssp370 | 4 <-> 5 | 28 | 3.08 | 19.80 | 19,405.69 |
| 2081–2100 ssp585 | 1 <-> 2 | 43 | 4.60 | 14.53 | 21,800.42 |
| 2081–2100 ssp585 | 1 <-> 3 | 401 | 31.79 | 1.26 | 17,756.76 |
| 2081–2100 ssp585 | 1 <-> 4 | 21 | 4.50 | 15.73 | 11,957.10 |
| 2081–2100 ssp585 | 1 <-> 5 | 204 | 27.81 | 3.83 | 31,057.32 |
| 2081–2100 ssp585 | 2 <-> 3 | 449 | 81.77 | 0.46 | 7054.33 |
| 2081–2100 ssp585 | 2 <-> 4 | 60 | 4.64 | 16.90 | 35,489.82 |
| 2081–2100 ssp585 | 2 <-> 5 | 164 | 33.44 | 0.58 | 3905.92 |
| 2081–2100 ssp585 | 3 <-> 4 | 422 | 30.43 | 2.08 | 30,934.60 |
| 2081–2100 ssp585 | 3 <-> 5 | 514 | 80.30 | 0.15 | 2584.21 |
| 2081–2100 ssp585 | 4 <-> 5 | 221 | 26.04 | 5.16 | 44,974.35 |
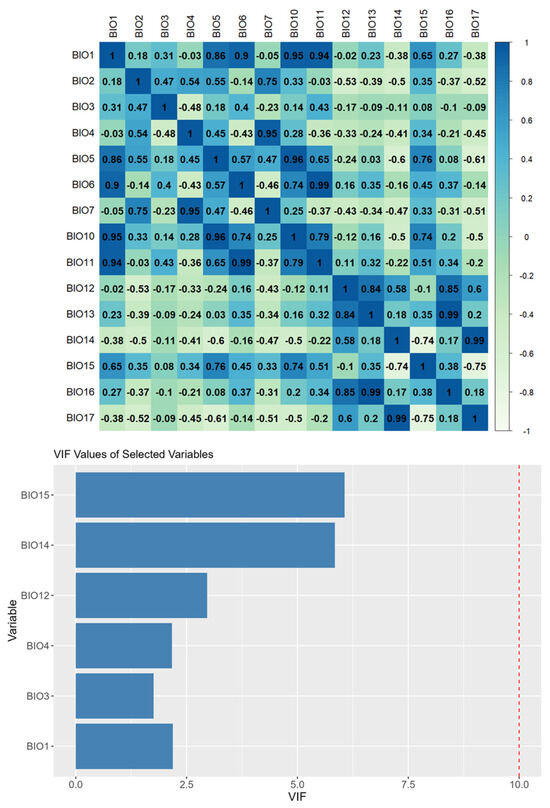
Figure A1.
Correlation matrix of the bioclimatic variables, showing the Pearson correlation coefficients for all variable pairs and VIF values of selected variables.
Figure A1.
Correlation matrix of the bioclimatic variables, showing the Pearson correlation coefficients for all variable pairs and VIF values of selected variables.
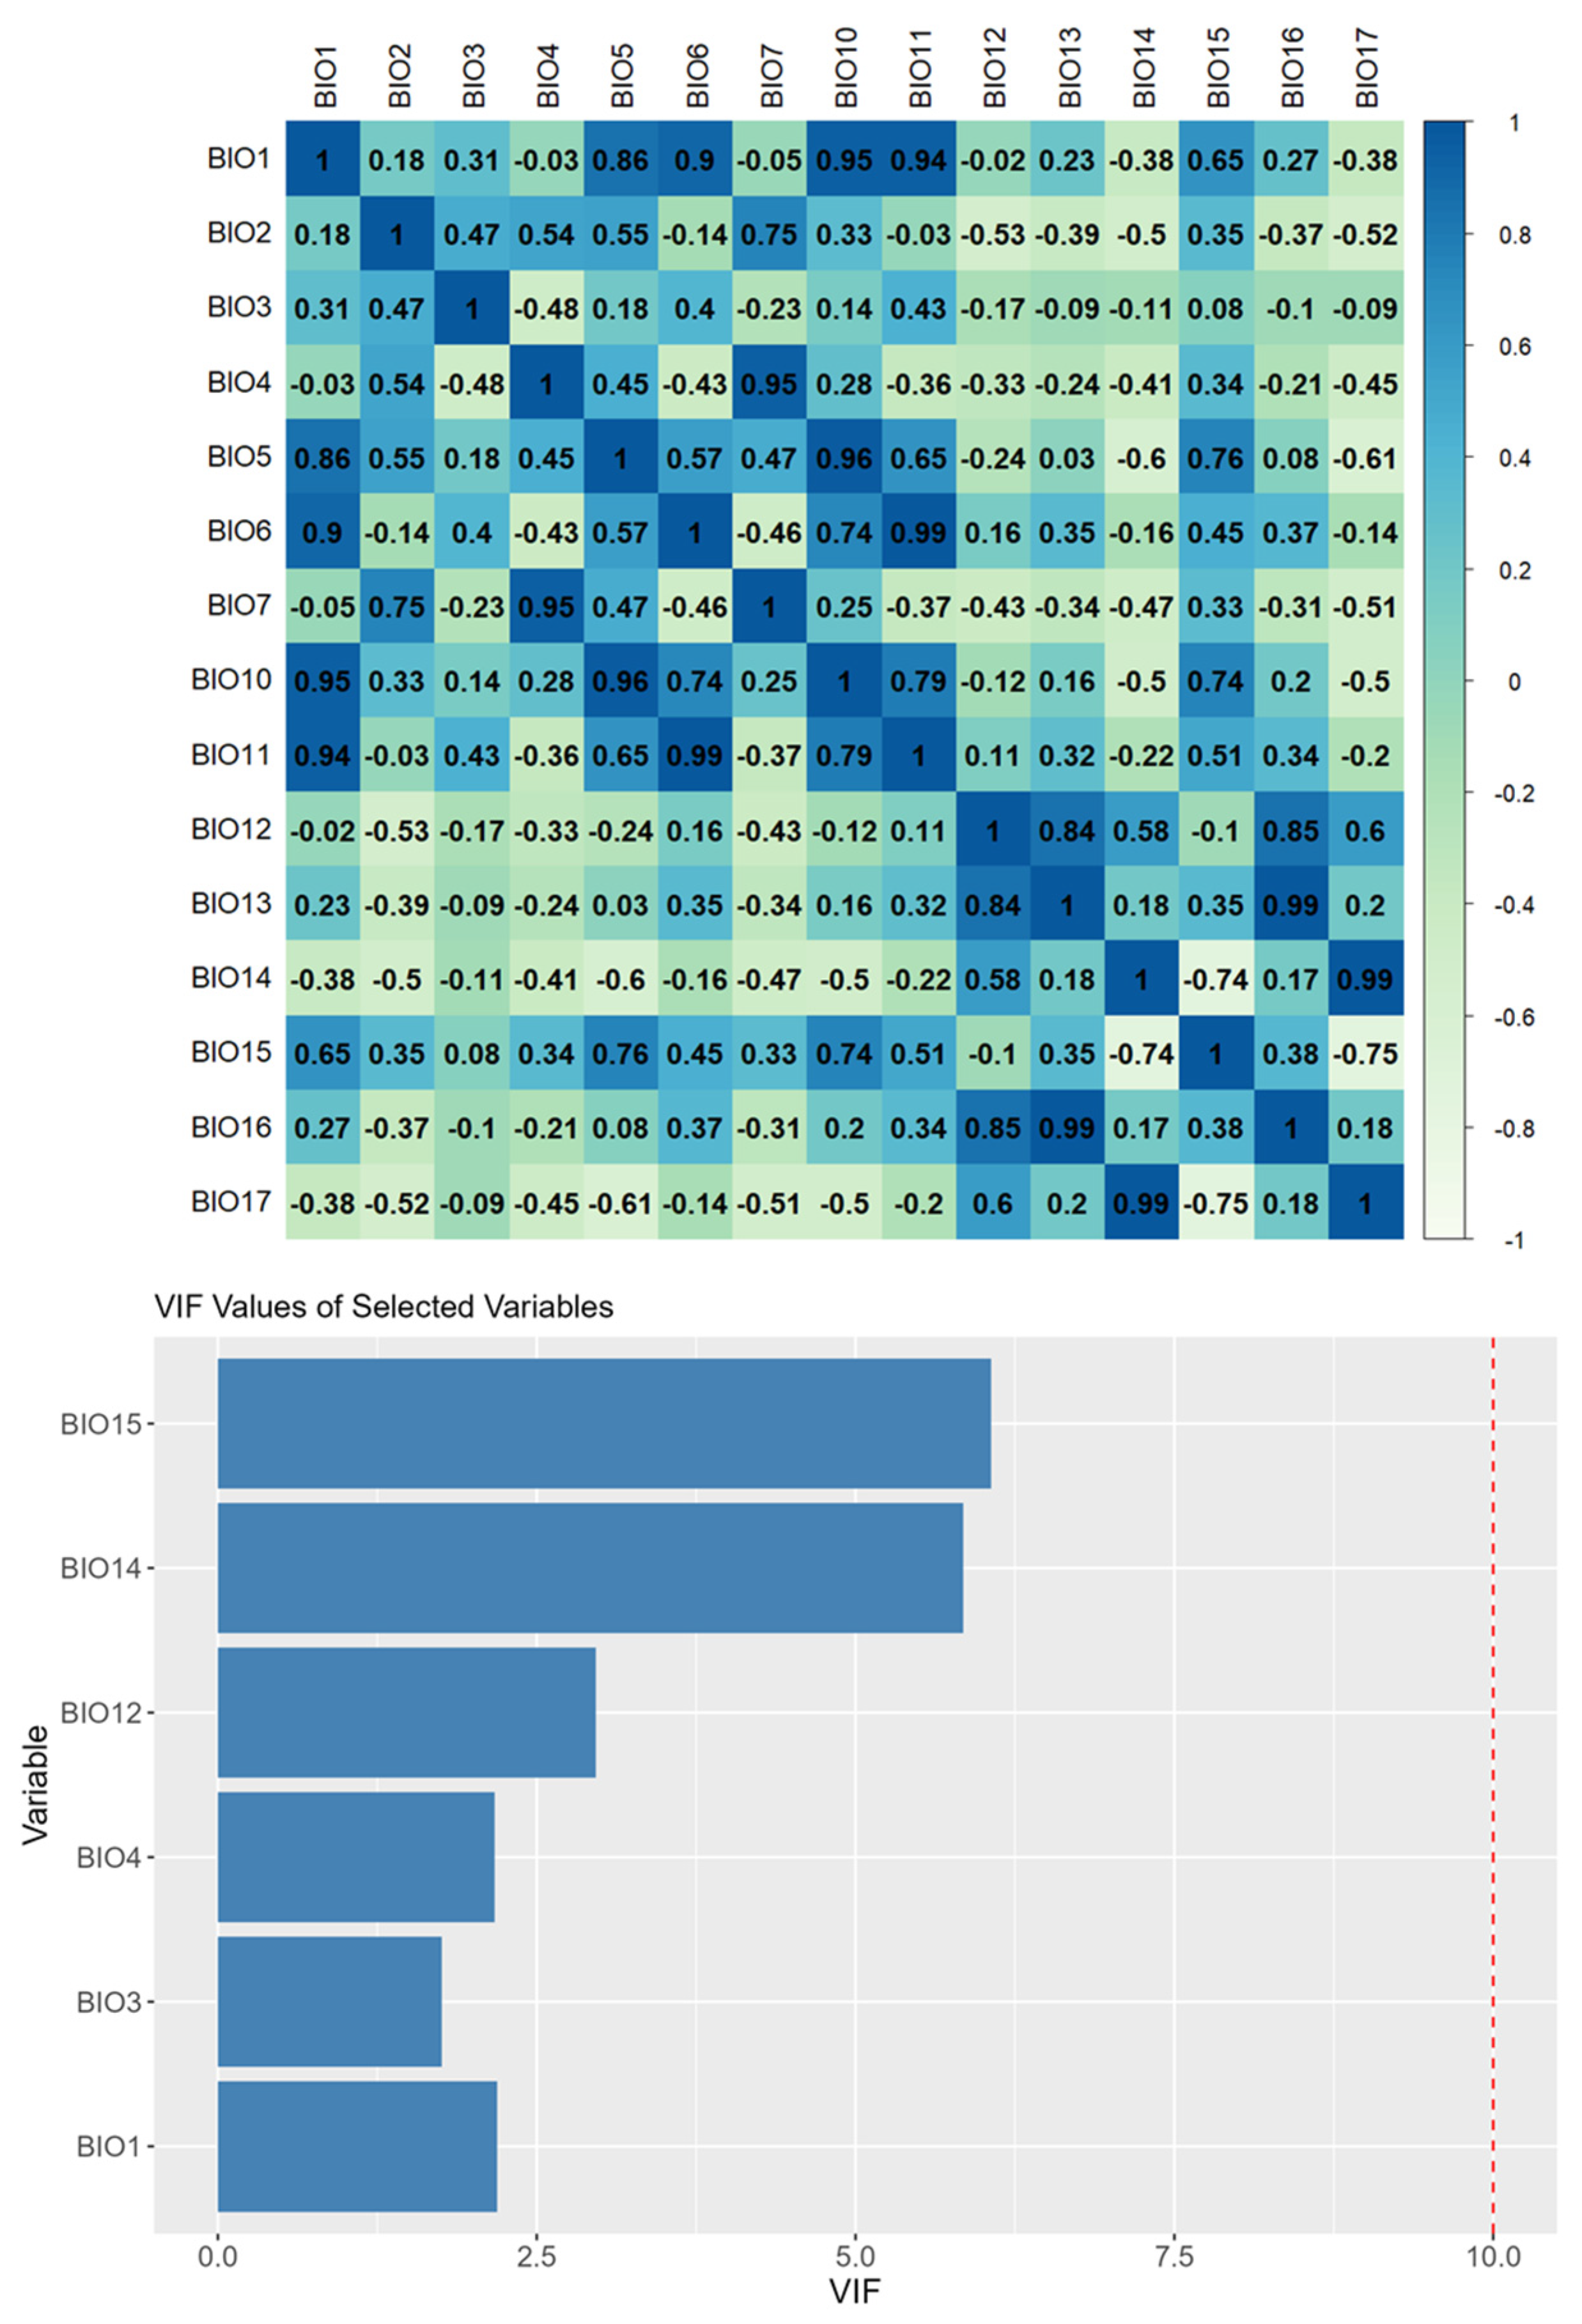
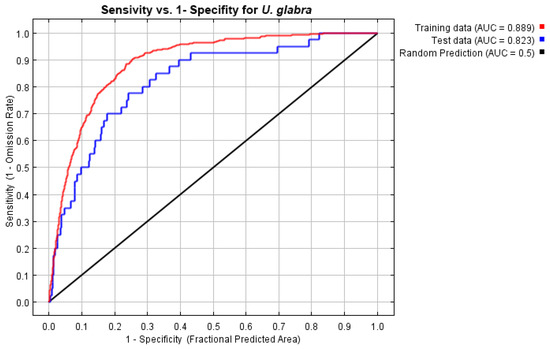
Figure A2.
ROC curve.
Figure A2.
ROC curve.
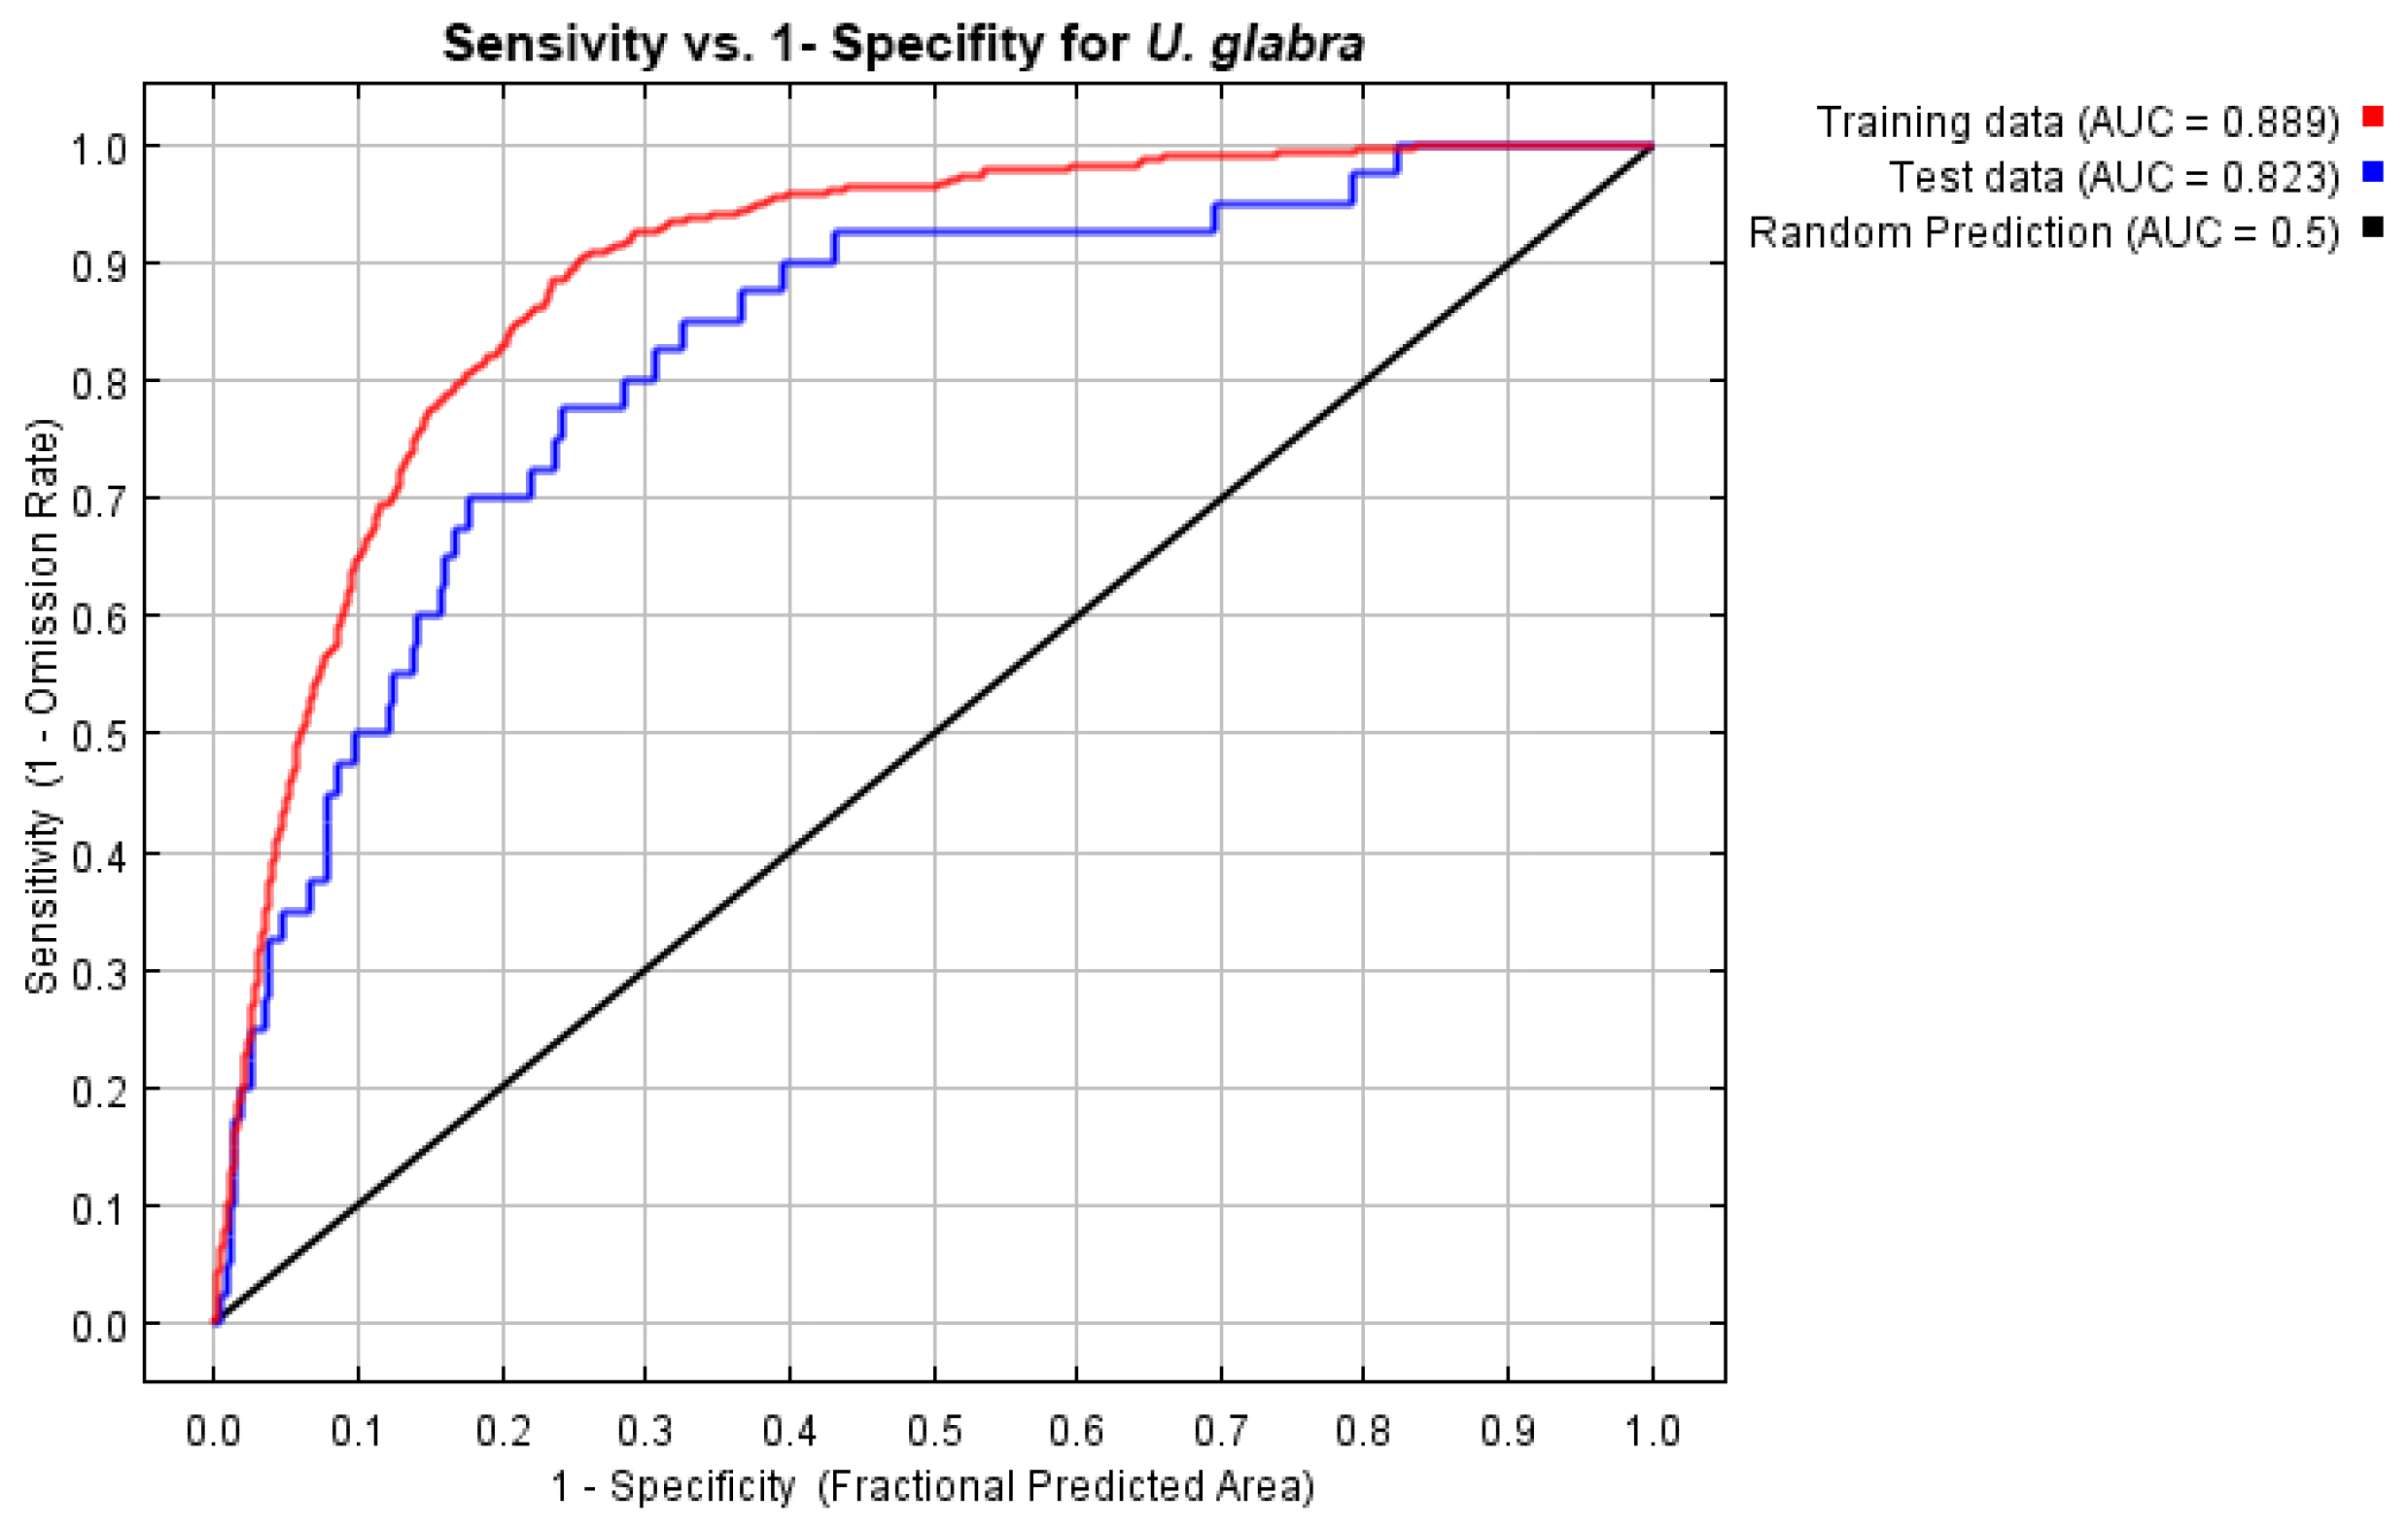

Figure A3.
Results of the jackknife test for the chosen variables in the distribution model.
Figure A3.
Results of the jackknife test for the chosen variables in the distribution model.

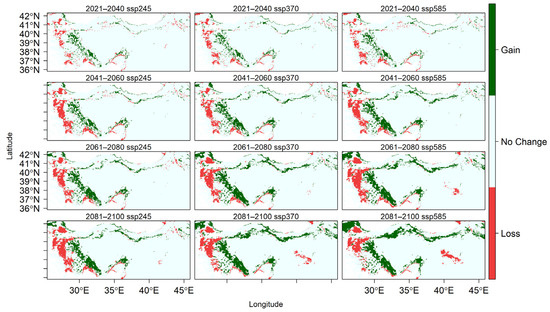
Figure A4.
Changes in the spatial distribution of suitable habitats for U. glabra across different SSP scenarios from 2021 to 2100.
Figure A4.
Changes in the spatial distribution of suitable habitats for U. glabra across different SSP scenarios from 2021 to 2100.
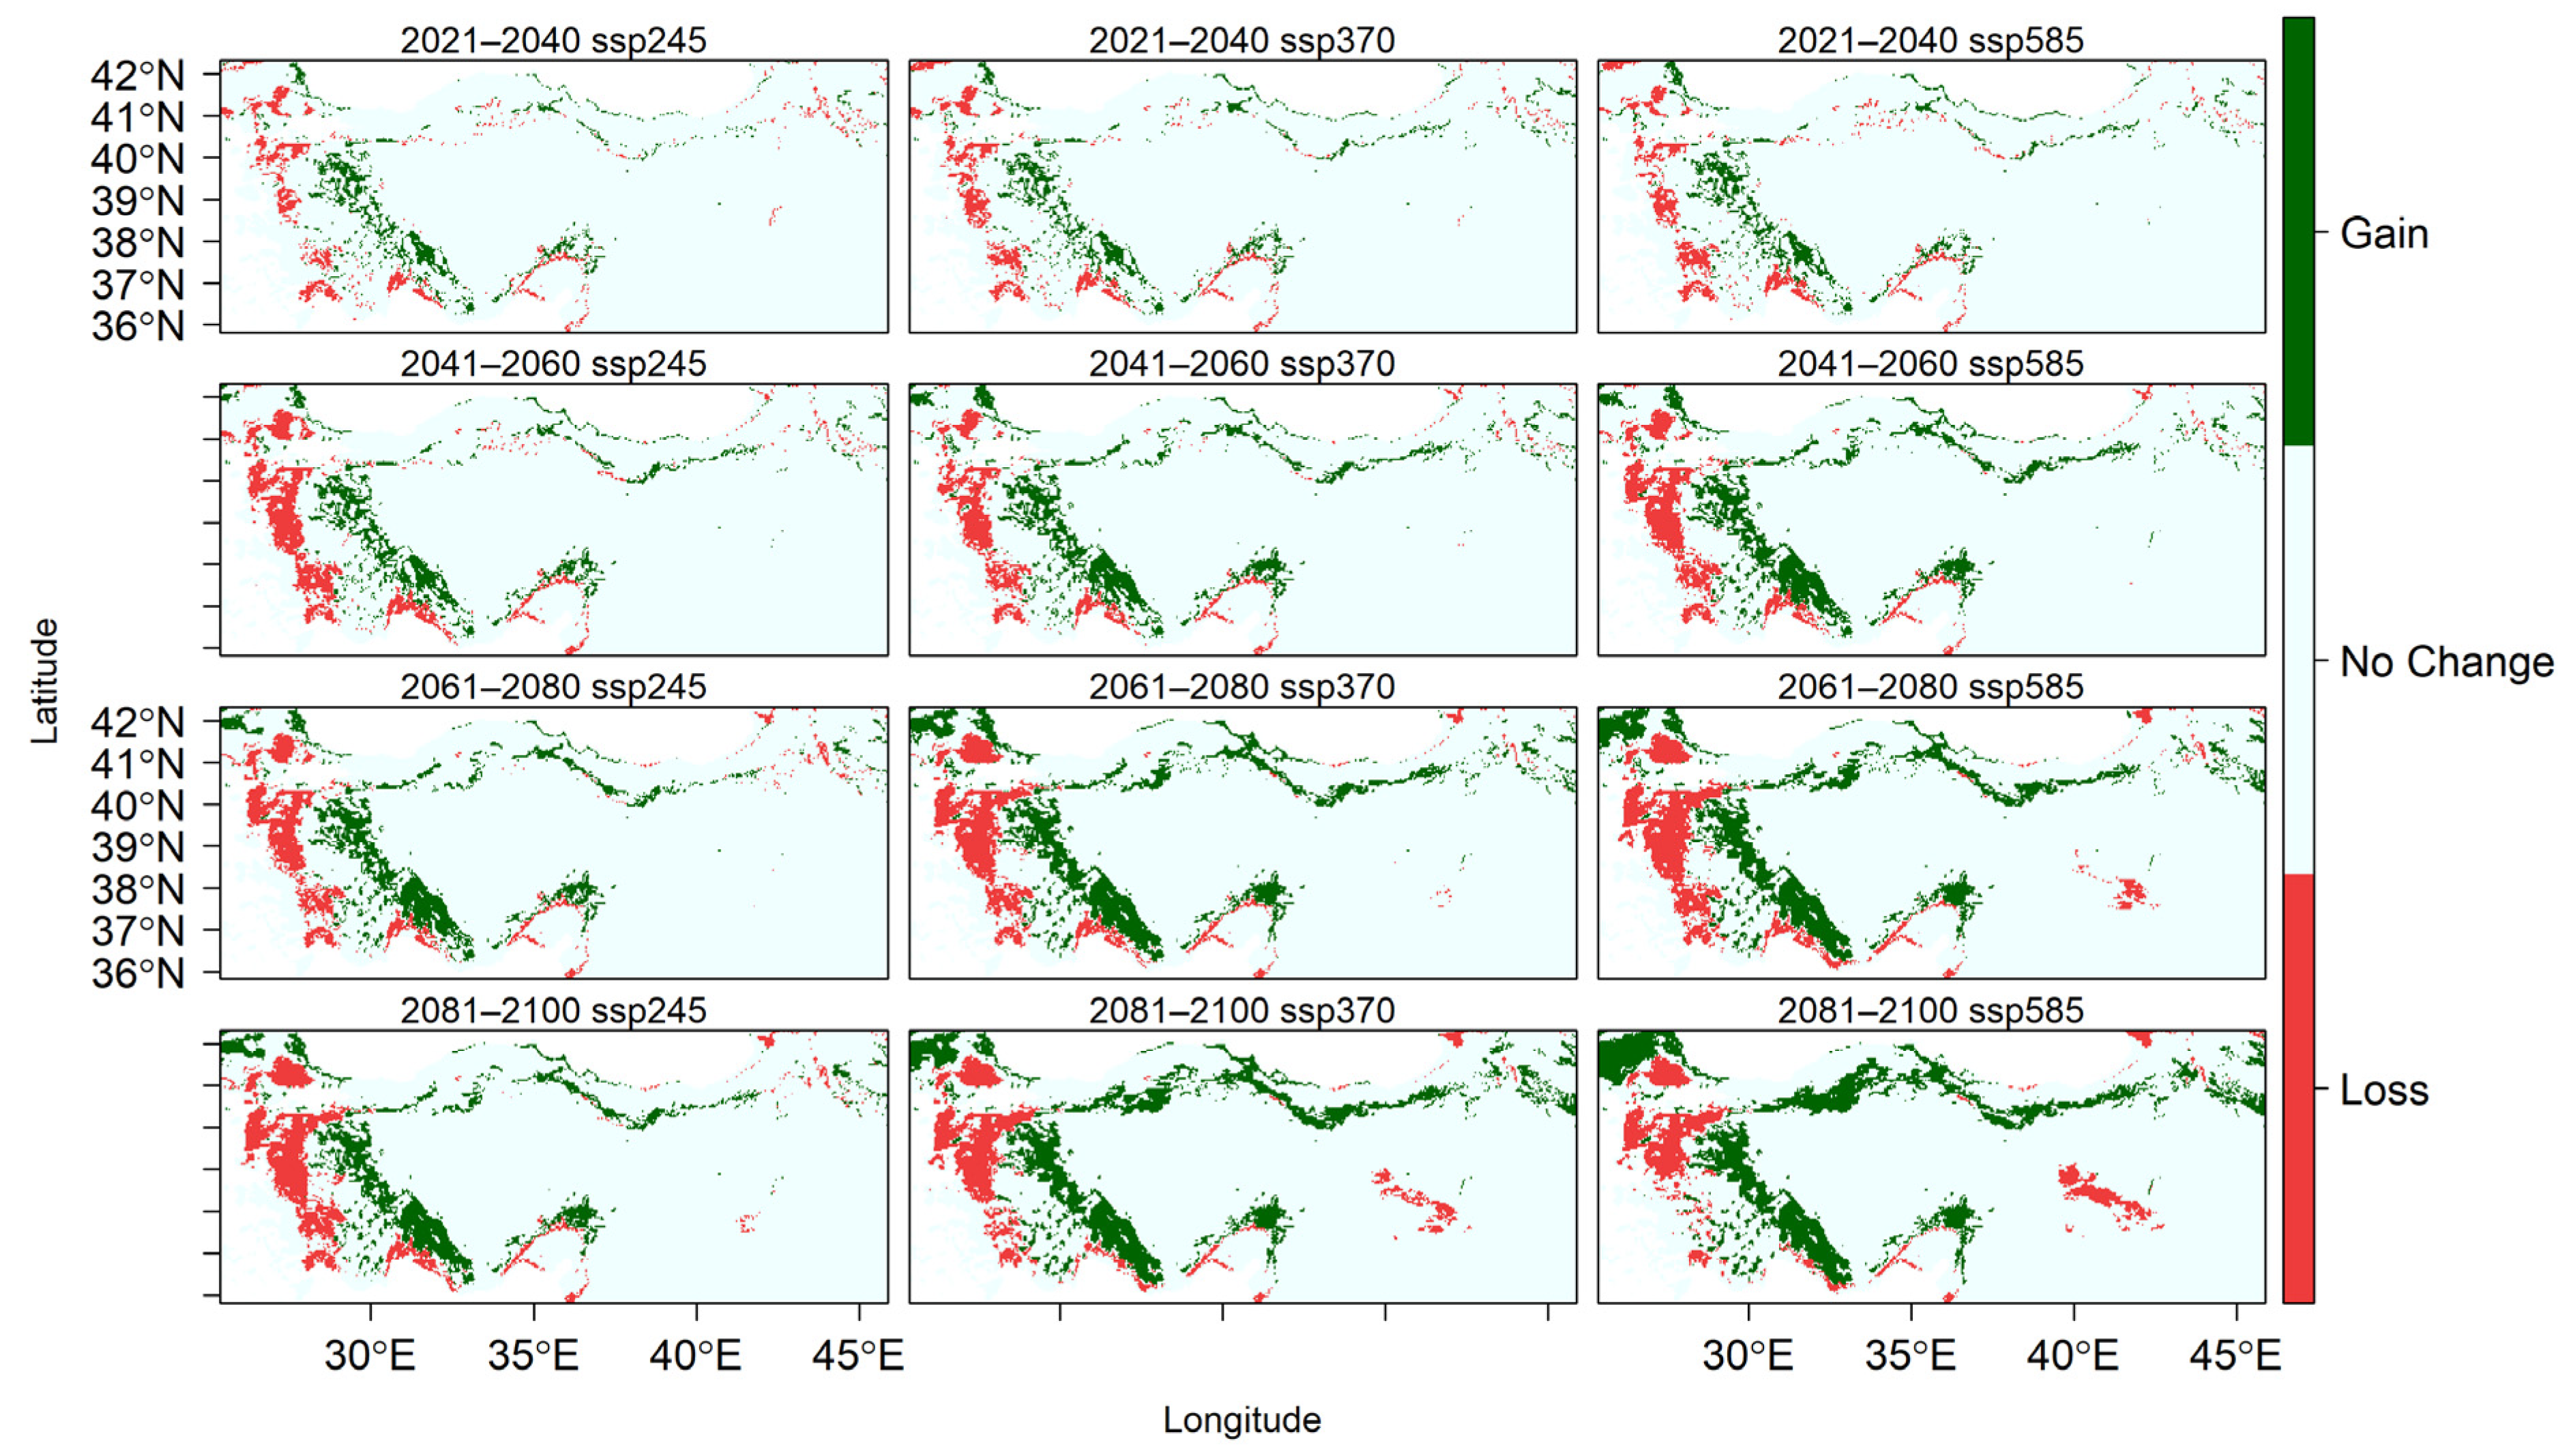
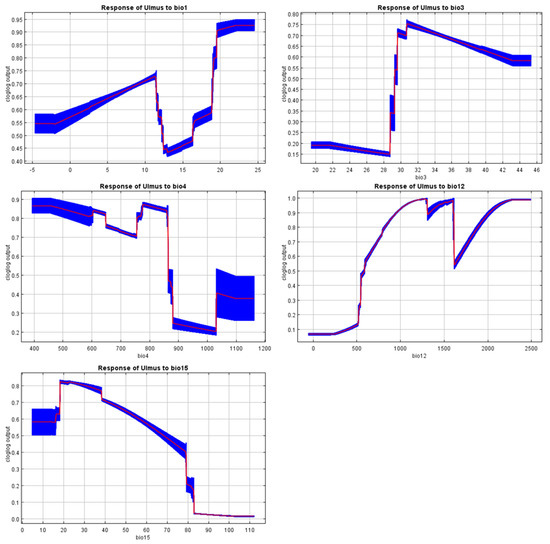
Figure A5.
Response curves of the MaxEnt model.
Figure A5.
Response curves of the MaxEnt model.
References
- Paal, J. The Forests of the North-Estonian Klint; the North-Easternmost Representatives of the EU Habitat Directive Tilio? Acerion Forests of Slopes, Screes and Ravines. Ann. Bot. Fenn. 2009, 46, 525–540. [Google Scholar] [CrossRef]
- Campos, J.A.; García-Mijangos, I.; Herrera, M.; Loidi, J.; Biurrun, I. Ravine Forests (Tilio-Acerion) of the Iberian Peninsula. Plant Biosyst. 2011, 145, 172–179. [Google Scholar] [CrossRef]
- Yılmaz, E.; Çiçek, İ. Detailed Köppen-Geiger Climate Regions of Turkey Türkiye’nin Detaylandırılmış Köppen-Geiger Iklim Bölgeleri. J. Hum. Sci. 2018, 15, 225–242. [Google Scholar] [CrossRef]
- Thomas, P.A.; Stone, D.; La Porta, N. Biological Flora of the British Isles: Ulmus glabra. J. Ecol. 2018, 106, 1724–1766. [Google Scholar] [CrossRef]
- Akkemik, Ü. Türkiye’nin Doğal Karağaç Taksonlarının (Ulmus L.) Morfolojil ve Palinolojik Özellikleri. Master’s Thesis, Istanbul University, Istanbul, Türkiye, 1994. [Google Scholar]
- Martín del Puerto, M.; Martínez García, F.; Mohanty, A.; Martín, J.P. Genetic Diversity in Relict and Fragmented Populations of Ulmus Glabra Hudson in the Central System of the Iberian Peninsula. Forests 2017, 8, 143. [Google Scholar] [CrossRef]
- Anşin, R. Orman Ağaçlarında Görülen Parazit ve Saprofit Mantarlar; Kaya Yayıncılık: Istanbul, Türkiye, 1987. [Google Scholar]
- Ar, B.; Velázquez, J.; Tonyaloğlu, E.E.; Sezgin, M.; Çorbacı, Ö.L.; Özcan, A.U.; Çiçek, K.; Mongil-Manso, J.; Alexandre Castanho, R.; Gülçin, D. Assessing Climate Change Impact on Habitat Suitability and Ecological Connectivity of Wych Elm (Ulmus Glabra Huds.) in Türkiye. Forests 2024, 15, 1894. [Google Scholar] [CrossRef]
- Karahan, O.; Maden, S. Orta Anadolu Bölgesinde Karaağaç (Ulmus spp.) ve Kavak (Populus spp.)’larda Görülen Kurumalar ve Buna Sebep Olan Etmenler. Bitki Koruma Bülteni 1974, 19, 175–180. [Google Scholar]
- Zhang, M.; Yiğit, İ.; Adigüzel, F.; Hu, C.; Chen, E.; Siyavuş, A.E.; Elmastaş, N.; Ustuner, M.; Kaya, A.Y. Impact of Urban Surfaces on Microclimatic Conditions and Thermal Comfort in Burdur, Türkiye. Atmosphere 2024, 15, 1375. [Google Scholar] [CrossRef]
- Moazzam, M.F.U.; Lee, B.G.; Kim, S. Impact of Sea Surface Temperature on City Temperature near Warm and Cold Ocean Currents in Summer Season for Northern Hemisphere. Atmosphere 2025, 16, 54. [Google Scholar] [CrossRef]
- Altman, J.; Fibich, P.; Trotsiuk, V.; Altmanova, N. Global Pattern of Forest Disturbances and Its Shift under Climate Change. Sci. Total Environ. 2024, 915, 170117. [Google Scholar] [CrossRef]
- Costanza, J.K.; Terando, A.J. Landscape Connectivity Planning for Adaptation to Future Climate and Land-Use Change. Curr. Landsc. Ecol. Rep. 2019, 4, 1–13. [Google Scholar] [CrossRef]
- Messier, C.; Bauhus, J.; Doyon, F.; Maure, F.; Sousa-Silva, R.; Nolet, P.; Mina, M.; Aquilué, N.; Fortin, M.-J.; Puettmann, K. The Functional Complex Network Approach to Foster Forest Resilience to Global Changes. For. Ecosyst. 2019, 6, 21. [Google Scholar] [CrossRef]
- Lines, E.R.; Coomes, D.A.; Purves, D.W. Influences of Forest Structure, Climate and Species Composition on Tree Mortality across the Eastern US. PLoS ONE 2010, 5, e13212. [Google Scholar] [CrossRef] [PubMed]
- Ruiz-Fons, F.; Segalés, J.; Gortázar, C. A Review of Viral Diseases of the European Wild Boar: Effects of Population Dynamics and Reservoir Rôle. Vet. J. 2008, 176, 158–169. [Google Scholar] [CrossRef]
- Prasad, A.; Pedlar, J.; Peters, M.; Matthews, S.; Iverson, L.; McKenney, D.; Adams, B. Chapter 8—Understanding Climate Change Dynamics of Tree Species: Implications for Future Forests. In Future Forests; McNulty, S.G., Ed.; Elsevier: Amsterdam, The Netherlands, 2024; pp. 151–175. ISBN 978-0-323-90430-8. [Google Scholar]
- Keeley, A.T.H.; Ackerly, D.D.; Cameron, D.R.; Heller, N.E.; Huber, P.R.; Schloss, C.A.; Thorne, J.H.; Merenlender, A.M. New Concepts, Models, and Assessments of Climate-Wise Connectivity. Environ. Res. Lett. 2018, 13, 073002. [Google Scholar] [CrossRef]
- Kremer, A.; Ronce, O.; Robledo-Arnuncio, J.J.; Guillaume, F.; Bohrer, G.; Nathan, R.; Bridle, J.R.; Gomulkiewicz, R.; Klein, E.K.; Ritland, K.; et al. Long-Distance Gene Flow and Adaptation of Forest Trees to Rapid Climate Change. Ecol. Lett. 2012, 15, 378–392. [Google Scholar] [CrossRef]
- Bolte, A.; Ammer, C.; Löf, M.; Madsen, P.; Nabuurs, G.-J.; Schall, P.; Spathelf, P.; Rock, J. Adaptive Forest Management in Central Europe: Climate Change Impacts, Strategies and Integrative Concept. Scand. J. For. Res. 2009, 24, 473–482. [Google Scholar] [CrossRef]
- Yousefpour, R.; Jacobsen, J.B.; Thorsen, B.J.; Meilby, H.; Hanewinkel, M.; Oehler, K. A Review of Decision-Making Approaches to Handle Uncertainty and Risk in Adaptive Forest Management under Climate Change. Ann. For. Sci. 2012, 69, 1–15. [Google Scholar] [CrossRef]
- Keenan, R.J. Climate Change Impacts and Adaptation in Forest Management: A Review. Ann. For. Sci. 2015, 72, 145–167. [Google Scholar] [CrossRef]
- Watson, J.E.M.; Evans, T.; Venter, O.; Williams, B.; Tulloch, A.; Stewart, C.; Thompson, I.; Ray, J.C.; Murray, K.; Salazar, A.; et al. The Exceptional Value of Intact Forest Ecosystems. Nat. Ecol. Evol. 2018, 2, 599–610. [Google Scholar] [CrossRef]
- Koch, A.; Kaplan, J.O. Tropical Forest Restoration under Future Climate Change. Nat. Clim. Change 2022, 12, 279–283. [Google Scholar] [CrossRef]
- Noulèkoun, F.; Mensah, S.; Birhane, E.; Son, Y.; Khamzina, A. Forest Landscape Restoration under Global Environmental Change: Challenges and a Future Roadmap. Forests 2021, 12, 276. [Google Scholar] [CrossRef]
- Bustamante, M.M.C.; Silva, J.S.; Scariot, A.; Sampaio, A.B.; Mascia, D.L.; Garcia, E.; Sano, E.; Fernandes, G.W.; Durigan, G.; Roitman, I.; et al. Ecological Restoration as a Strategy for Mitigating and Adapting to Climate Change: Lessons and Challenges from Brazil. Mitig. Adapt. Strateg. Glob. Change 2019, 24, 1249–1270. [Google Scholar] [CrossRef]
- Schulz, J.J.; Schröder, B. Identifying Suitable Multifunctional Restoration Areas for Forest Landscape Restoration in Central Chile. Ecosphere 2017, 8, e01644. [Google Scholar] [CrossRef]
- Velázquez, J.; Gülçin, D.; Vogt, P.; Rincón, V.; Hernando, A.; Gutiérrez, J.; Özcan, A.U.; Çiçek, K. Planning Restoration of Connectivity and Design of Corridors for Biodiversity Conservation. Forests 2022, 13, 2132. [Google Scholar] [CrossRef]
- Rudge, M.L.M.; Levick, S.R.; Bartolo, R.E.; Erskine, P.D. Developing Landscape-Scale Forest Restoration Targets That Embrace Spatial Pattern. Landsc. Ecol. 2022, 37, 1747–1760. [Google Scholar] [CrossRef]
- López-Sánchez, A.; Sánchez, I.; Herráez, F.; Gülçin, D.; Tang, T.; Perea, R.; Velázquez, J. Identifying Keystone Connectivity Spots under Climate Change: Implications to Conservation and Management of Riparian Systems. J. Environ. Manag. 2024, 351, 119782. [Google Scholar] [CrossRef]
- Thompson, I.; Mackey, B.; McNulty, S.; Mosseler, A. Forest Resilience, Biodiversity and Climate Change: A Synthesis of the Biodiversity/Resilience/Stability Relationship in Forest Ecosystems; Technical Series; Secretariat of the Convention on Biological Diversity: Montreal, QC, Canada, 2009; Volume 43, pp. 1–67. [Google Scholar]
- Cerioni, M.; Brabec, M.; Bače, R.; Bāders, E.; Bončina, A.; Brůna, J.; Chećko, E.; Cordonnier, T.; de Koning, J.H.C.; Diaci, J.; et al. Recovery and Resilience of European Temperate Forests after Large and Severe Disturbances. Glob. Change Biol. 2024, 30, e17159. [Google Scholar] [CrossRef]
- Zhao, Y.; Liu, S.; Liu, H.; Wang, F.; Dong, Y.; Wu, G.; Li, Y.; Wang, W.; Phan Tran, L.-S.; Li, W. Multi-Objective Ecological Restoration Priority in China: Cost-Benefit Optimization in Different Ecological Performance Regimes Based on Planetary Boundaries. J. Environ. Manag. 2024, 356, 120701. [Google Scholar] [CrossRef]
- Cannon, J.B.; Gannon, B.M.; Feinstein, J.A.; Padley, E.A.; Metz, L.J. Simulating Spatial Complexity in Dry Conifer Forest Restoration: Implications for Conservation Prioritization and Scenario Evaluation. Landsc. Ecol. 2020, 35, 2301–2319. [Google Scholar] [CrossRef]
- Aerts, R.; Honnay, O. Forest Restoration, Biodiversity and Ecosystem Functioning. BMC Ecol. 2011, 11, 29. [Google Scholar] [CrossRef] [PubMed]
- Noss, R.F. Beyond Kyoto: Forest Management in a Time of Rapid Climate Change. Conserv. Biol. 2001, 15, 578–590. [Google Scholar] [CrossRef]
- Chen, X.; Kang, B.; Li, M.; Du, Z.; Zhang, L.; Li, H. Identification of Priority Areas for Territorial Ecological Conservation and Restoration Based on Ecological Networks: A Case Study of Tianjin City, China. Ecol. Indic. 2023, 146, 109809. [Google Scholar] [CrossRef]
- Liang, X.; Guan, Q.; Clarke, K.C.; Liu, S.; Wang, B.; Yao, Y. Understanding the Drivers of Sustainable Land Expansion Using a Patch-Generating Land Use Simulation (PLUS) Model: A Case Study in Wuhan, China. Comput. Environ. Urban Syst. 2021, 85, 101569. [Google Scholar] [CrossRef]
- Rudnick, D.A.; Ryan, S.J.; Beier, P.; Cushman, S.A.; Dieffenbach, F.; Epps, C.W.; Gerber, L.R.; Hartter, J.; Jenness, J.S.; Kintsch, J.; et al. The Role of Landscape Connectivity in Planning and Implementing Conservation and Restoration Priorities. Issues Ecol. 2012, 16, 1–20. [Google Scholar]
- Ng, C.N.; Xie, Y.J.; Yu, X.J. Integrating Landscape Connectivity into the Evaluation of Ecosystem Services for Biodiversity Conservation and Its Implications for Landscape Planning. Appl. Geogr. 2013, 42, 1–12. [Google Scholar] [CrossRef]
- Adriaensen, F.; Chardon, J.P.; De Blust, G.; Swinnen, E.; Villalba, S.; Gulinck, H.; Matthysen, E. The Application of ‘Least-Cost’ Modelling as a Functional Landscape Model. Landsc. Urban Plan. 2003, 64, 233–247. [Google Scholar] [CrossRef]
- McRae, B.H.; Dickson, B.G.; Keitt, T.H.; Shah, V.B. Using Circuit Theory to Model Connectivity in Ecology, Evolution, and Conservation. Ecology 2008, 89, 2712–2724. [Google Scholar] [CrossRef]
- Bunn, A.G.; Urban, D.L.; Keitt, T.H. Landscape Connectivity: A Conservation Application of Graph Theory. J. Environ. Manag. 2000, 59, 265–278. [Google Scholar] [CrossRef]
- Urban, D.; Keitt, T. Landscape Connectivity: A Graph-Theoretic Perspective. Ecology 2001, 82, 1205–1218. [Google Scholar] [CrossRef]
- Galpern, P.; Manseau, M.; Fall, A. Patch-Based Graphs of Landscape Connectivity: A Guide to Construction, Analysis and Application for Conservation. Biol. Conserv. 2011, 144, 44–55. [Google Scholar] [CrossRef]
- Hashemi, R.; Darabi, H.; Hashemi, M.; Wang, J. Graph Theory in Ecological Network Analysis: A Systematic Review for Connectivity Assessment. J. Clean. Prod. 2024, 472, 143504. [Google Scholar] [CrossRef]
- Vogt, P.; Riitters, K. GuidosToolbox: Universal Digital Image Object Analysis. Eur. J. Remote Sens. 2017, 50, 352–361. [Google Scholar] [CrossRef]
- Carlier, J.; Doyle, M.; Finn, J.A.; Ó hUallacháin, D.; Ruas, S.; Vogt, P.; Moran, J. Modelling Enhancement of Ecosystem Services Provision through Integrated Agri-Environment and Forestry Measures. Sci. Total Environ. 2024, 948, 174509. [Google Scholar] [CrossRef] [PubMed]
- Carlier, J.; Doyle, M.; Finn, J.A.; Ó hUallacháin, D.; Ruas, S.; Moran, J. The Development and Potential Application of a Land Use Monitoring Programme for High Nature Value Farmland and Forest Quality and Quantity in the Republic of Ireland. Environ. Sci. Policy 2023, 146, 1–12. [Google Scholar] [CrossRef]
- Phillips, S.J.; Anderson, R.P.; Schapire, R.E. Maximum Entropy Modeling of Species Geographic Distributions. Ecol. Model. 2006, 190, 231–259. [Google Scholar] [CrossRef]
- Phillips, S.J.; Dudík, M. Modeling of Species Distributions with Maxent: New Extensions and a Comprehensive Evaluation. Ecography 2008, 31, 161–175. [Google Scholar] [CrossRef]
- Akkemik, Ü. Ülkemizde Doğal Yetişen Karaağaç (Ulmus L.) Taksonlarının Morfolojik Özellikleri. J. Fac. For. Istanb. Univ. 1995, 45, 93–116. [Google Scholar]
- Myking, T.; Skrøppa, T. Variation in Phenology and Height Increment of Northern Ulmus Glabra Populations: Implications for Conservation. Scand. J. For. Res. 2007, 22, 369–374. [Google Scholar] [CrossRef]
- Nielsen, L.R.; Kjær, E.D. Gene Flow and Mating Patterns in Individuals of Wych Elm (Ulmus glabra) in Forest and Open Land after the Influence of Dutch Elm Disease. Conserv. Genet. 2010, 11, 257–268. [Google Scholar] [CrossRef]
- Caudullo, G.; De Rigo, D. Ulmus-Elms in Europe: Distribution, Habitat, Usage and Threats. In European Atlas of Forest Tree Species; The Publications Office of the European Union: Luxembourg, 2016; pp. 186–188. [Google Scholar]
- Caudullo, G.; Welk, E.; San-Miguel-Ayanz, J. Chorological Maps for the Main European Woody Species. Data Brief 2017, 12, 662–666. [Google Scholar] [CrossRef] [PubMed]
- GBIF. Occurrence Download. Available online: https://www.gbif.org/occurrence/download/0036679-231002084531237 (accessed on 3 November 2023).
- Tübives. Turkish Plants Data Service. Ulmus Glabra Huds. Distribution of the Taxon over Turkey. Available online: http://194.27.225.161/yasin/tubives/index.php?sayfa=1&tax_id=8429 (accessed on 12 November 2023).
- Fick, S.E.; Hijmans, R.J. WorldClim 2: New 1-km Spatial Resolution Climate Surfaces for Global Land Areas. Int. J. Climatol. 2017, 37, 4302–4315. [Google Scholar] [CrossRef]
- Campbell, L.P.; Luther, C.; Moo-Llanes, D.; Ramsey, J.M.; Danis-Lozano, R.; Peterson, A.T. Climate Change Influences on Global Distributions of Dengue and Chikungunya Virus Vectors. Philos. Trans. R. Soc. B Biol. Sci. 2015, 370, 20140135. [Google Scholar] [CrossRef]
- Dormann, C.F.; Elith, J.; Bacher, S.; Buchmann, C.; Carl, G.; Carré, G.; Marquéz, J.R.G.; Gruber, B.; Lafourcade, B.; Leitão, P.J.; et al. Collinearity: A Review of Methods to Deal with It and a Simulation Study Evaluating Their Performance. Ecography 2013, 36, 27–46. [Google Scholar] [CrossRef]
- Heikkinen, R.K.; Luoto, M.; Araújo, M.B.; Virkkala, R.; Thuiller, W.; Sykes, M.T. Methods and Uncertainties in Bioclimatic Envelope Modelling under Climate Change. Prog. Phys. Geogr. Earth Environ. 2006, 30, 751–777. [Google Scholar] [CrossRef]
- Guisan, A.; Thuiller, W.; Zimmermann, N.E. Habitat Suitability and Distribution Models: With Applications in R; Cambridge University Press: Cambridge, UK, 2017. [Google Scholar]
- Naimi, B.; USDM: Uncertainty Analysis for Species Distribution Models. R Package Version 1.1–15. R. Doc. 2015. Available online: https://www.google.com/url?sa=t&source=web&rct=j&opi=89978449&url=https://cran.r-project.org/web/packages/usdm/usdm.pdf&ved=2ahUKEwivn5C5uoaNAxVqqVYBHXNYC2wQFnoECBYQAQ&usg=AOvVaw03AwuXkBUw0hoaGeEAQE6d (accessed on 3 February 2025).
- Wu, T.; Lu, Y.; Fang, Y.; Xin, X.; Li, L.; Li, W.; Jie, W.; Zhang, J.; Liu, Y.; Zhang, L.; et al. The Beijing Climate Center Climate System Model (BCC-CSM): The Main Progress from CMIP5 to CMIP6. Geosci. Model Dev. 2019, 12, 1573–1600. [Google Scholar] [CrossRef]
- Voldoire, A.; Saint-Martin, D.; Sénési, S.; Decharme, B.; Alias, A.; Chevallier, M.; Colin, J.; Guérémy, J.-F.; Michou, M.; Moine, M.-P.; et al. Evaluation of CMIP6 DECK Experiments With CNRM-CM6-1. J. Adv. Model. Earth Syst. 2019, 11, 2177–2213. [Google Scholar] [CrossRef]
- Séférian, R.; Nabat, P.; Michou, M.; Saint-Martin, D.; Voldoire, A.; Colin, J.; Decharme, B.; Delire, C.; Berthet, S.; Chevallier, M.; et al. Evaluation of CNRM Earth System Model, CNRM-ESM2-1: Role of Earth System Processes in Present-Day and Future Climate. J. Adv. Model. Earth Syst. 2019, 11, 4182–4227. [Google Scholar] [CrossRef]
- Swart, R.; Celliers, L.; Collard, M.; Prats, A.G.; Huang-Lachmann, J.-T.; Sempere, F.L.; de Jong, F.; Máñez Costa, M.; Martinez, G.; Velazquez, M.P.; et al. Reframing Climate Services to Support Municipal and Regional Planning. Clim. Serv. 2021, 22, 100227. [Google Scholar] [CrossRef]
- Shiogama, H.; Tatebe, H.; Hayashi, M.; Abe, M.; Arai, M.; Koyama, H.; Imada, Y.; Kosaka, Y.; Ogura, T.; Watanabe, M. MIROC6 Large Ensemble (MIROC6-LE): Experimental Design and Initial Analyses. Earth Syst. Dyn. 2023, 14, 1107–1124. [Google Scholar] [CrossRef]
- Sanderson, B.M.; Knutti, R.; Caldwell, P. A Representative Democracy to Reduce Interdependency in a Multimodel Ensemble. J. Clim. 2015, 28, 5171–5194. [Google Scholar] [CrossRef]
- Phillips, S.J.; Anderson, R.P.; Dudík, M.; Schapire, R.E.; Blair, M.E. Opening the Black Box: An Open-source Release of Maxent. Ecography 2017, 40, 887–893. [Google Scholar] [CrossRef]
- Cobos, M.E.; Peterson, A.T.; Barve, N.; Osorio-Olvera, L. Kuenm: An R Package for Detailed Development of Ecological Niche Models Using Maxent. PeerJ 2019, 7, e6281. [Google Scholar] [CrossRef] [PubMed]
- Radosavljevic, A.; Anderson, R.P. Making Better Maxent Models of Species Distributions: Complexity, Overfitting and Evaluation. J. Biogeogr. 2014, 41, 629–643. [Google Scholar] [CrossRef]
- Anderson, D.R.; Burnham, K.P. Avoiding Pitfalls When Using Information-Theoretic Methods. J. Wildl. Manag. 2002, 66, 912–918. [Google Scholar] [CrossRef]
- Liu, C.; Berry, P.M.; Dawson, T.P.; Pearson, R.G. Selecting Thresholds of Occurrence in the Prediction of Species Distributions. Ecography 2005, 28, 385–393. [Google Scholar] [CrossRef]
- Lamigueiro, O.P.; Hijmans, R. rasterVis: Visualization Methods for Raster Data. 2021. Available online: https://oscarperpinan.github.io/rastervis/ (accessed on 20 January 2025).
- Gurrutxaga, M.; Lozano, P.J.; del Barrio, G. GIS-Based Approach for Incorporating the Connectivity of Ecological Networks into Regional Planning. J. Nat. Conserv. 2010, 18, 318–326. [Google Scholar] [CrossRef]
- de la Fuente, B.; Mateo-Sánchez, M.C.; Rodríguez, G.; Gastón, A.; Pérez de Ayala, R.; Colomina-Pérez, D.; Melero, M.; Saura, S. Natura 2000 Sites, Public Forests and Riparian Corridors: The Connectivity Backbone of Forest Green Infrastructure. Land Use Policy 2018, 75, 429–441. [Google Scholar] [CrossRef]
- EEA. CORINE Land Cover 2018 (Raster 100 m), Europe, 6-Yearly—Version 2020_20u1. May 2020. Available online: https://sdi.eea.europa.eu/catalogue/copernicus/api/records/960998c1-1870-4e82-8051-6485205ebbac (accessed on 27 March 2025).
- Vogt, P. User Guide of Guidostoolbox Release 3.3; European Commission Joint Research Centre (JRC): Ispra, Italy, 2024. [Google Scholar]
- Huang, J.; Ling, C.X. Using AUC and Accuracy in Evaluating Learning Algorithms. IEEE Trans. Knowl. Data Eng. 2005, 17, 299–310. [Google Scholar] [CrossRef]
- Lobo, J.M.; Jiménez-Valverde, A.; Real, R. AUC: A Misleading Measure of the Performance of Predictive Distribution Models. Glob. Ecol. Biogeogr. 2008, 17, 145–151. [Google Scholar] [CrossRef]
- Napierala-Filipiak, A.; Filipiak, M.; Lakomy, P.; Kuzminski, R.; Gubanski, J. Changes in Elm (Ulmus) Populations of Mid-Western Poland during the Past 35 Years. Dendrobiology 2016, 76, 145–156. [Google Scholar] [CrossRef]
- Ruiz-Labourdette, D.; Nogués-Bravo, D.; Ollero, H.S.; Schmitz, M.F.; Pineda, F.D. Forest Composition in Mediterranean Mountains Is Projected to Shift along the Entire Elevational Gradient under Climate Change. J. Biogeogr. 2012, 39, 162–176. [Google Scholar] [CrossRef]
- Varol, T.; Cetin, M.; Ozel, H.B.; Sevik, H.; Zeren Cetin, I. The Effects of Climate Change Scenarios on Carpinus Betulus and Carpinus Orientalis in Europe. Water Air Soil. Pollut. 2022, 233, 45. [Google Scholar] [CrossRef]
- Tekin, O.; Cetin, M.; Varol, T.; Ozel, H.B.; Sevik, H.; Zeren Cetin, I. Altitudinal Migration of Species of Fir (Abies spp.) in Adaptation to Climate Change. Water Air Soil. Pollut. 2022, 233, 385. [Google Scholar] [CrossRef]
- McDonald-Madden, E.; Baxter, P.W.J.; Possingham, H.P. Making Robust Decisions for Conservation with Restricted Money and Knowledge. J. Appl. Ecol. 2008, 45, 1630–1638. [Google Scholar] [CrossRef]
- Hodgson, J.A.; Thomas, C.D.; Wintle, B.A.; Moilanen, A. Climate Change, Connectivity and Conservation Decision Making: Back to Basics. J. Appl. Ecol. 2009, 46, 964–969. [Google Scholar] [CrossRef]
- Hausfather, Z.; Peters, G.P. Emissions—The ‘Business as Usual’ Story Is Misleading. Nature 2020, 577, 618–620. [Google Scholar] [CrossRef]
- Ritchie, J.; Dowlatabadi, H. Why Do Climate Change Scenarios Return to Coal? Energy 2017, 140, 1276–1291. [Google Scholar] [CrossRef]
- Opdam, P.; Wascher, D. Climate Change Meets Habitat Fragmentation: Linking Landscape and Biogeographical Scale Levels in Research and Conservation. Biol. Conserv. 2004, 117, 285–297. [Google Scholar] [CrossRef]
- Heller, N.E.; Zavaleta, E.S. Biodiversity Management in the Face of Climate Change: A Review of 22 Years of Recommendations. Biol. Conserv. 2009, 142, 14–32. [Google Scholar] [CrossRef]
- Elith, J.; Phillips, S.J.; Hastie, T.; Dudík, M.; Chee, Y.E.; Yates, C.J. A Statistical Explanation of MaxEnt for Ecologists. Divers. Distrib. 2011, 17, 43–57. [Google Scholar] [CrossRef]
- Walas, Ł.; Sobierajska, K.; Ok, T.; Dönmez, A.A.; Kanoğlu, S.S.; Dagher-Kharrat, M.B.; Douaihy, B.; Romo, A.; Stephan, J.; Jasińska, A.K.; et al. Past, Present, and Future Geographic Range of an Oro-Mediterranean Tertiary Relict: The Juniperus Drupacea Case Study. Reg. Environ. Change 2019, 19, 1507–1520. [Google Scholar] [CrossRef]
- Studinski, J.M.; Hartman, K.J.; Niles, J.M.; Keyser, P. The Effects of Riparian Forest Disturbance on Stream Temperature, Sedimentation, and Morphology. Hydrobiologia 2012, 686, 107–117. [Google Scholar] [CrossRef]
- Micheli, E.R.; Kirchner, J.W.; Larsen, E.W. Quantifying the Effect of Riparian Forest versus Agricultural Vegetation on River Meander Migration Rates, Central Sacramento River, California, USA. River Res. Appl. 2004, 20, 537–548. [Google Scholar] [CrossRef]
- Weigelhofer, G.; Fuchsberger, J.; Teufl, B.; Welti, N.; Hein, T. Effects of Riparian Forest Buffers on In-Stream Nutrient Retention in Agricultural Catchments. J. Environ. Qual. 2012, 41, 373–379. [Google Scholar] [CrossRef]
Disclaimer/Publisher’s Note: The statements, opinions and data contained in all publications are solely those of the individual author(s) and contributor(s) and not of MDPI and/or the editor(s). MDPI and/or the editor(s) disclaim responsibility for any injury to people or property resulting from any ideas, methods, instructions or products referred to in the content. |
© 2025 by the authors. Licensee MDPI, Basel, Switzerland. This article is an open access article distributed under the terms and conditions of the Creative Commons Attribution (CC BY) license (https://creativecommons.org/licenses/by/4.0/).

