Abstract
The spatiotemporal evolution of coastal rural settlements varies significantly across different geomorphic environments, yet this variation is underexplored in current research. Guided by Coupled Human and Natural Systems, this study examines the adaptation mechanisms between coastal rural settlements and landforms using an integrated framework that combines various bay types, spatiotemporal characteristics, and dynamic drivers. Four representative bay types along Guangdong’s coast were analyzed: Hilly Ria Coast, Platform Ria Coast, Barrier-Lagoon Coast, and Estuarine Delta Coast. Using multi-source remote sensing data and optimized Geodetector modeling (1972 vs. 2022), we identified the patterns of spatiotemporal evolution and their driving forces. The results reveal distinct adaptation pathways: Hilly Ria Coast settlements expanded in a constrained manner, supported by tunnel–bridge infrastructure; Platform Ria Coasts developed multi-nucleated, port-oriented clusters through harbor-linked road networks; Barrier-Lagoon Coasts achieved balanced growth through integrated land–river–sea governance; and Estuarine Delta Coasts experienced urban–rural restructuring accompanied by water network degradation. This study proposes governance strategies tailored to specific landforms to support sustainable coastal planning.
1. Introduction
Coastal zones are vital interfaces for global demographic, economic, and ecological processes, supporting over 40% of the world’s population and generating 60% of global GDP [1]. Their sustainable development is essential for maintaining the balance of human–environment systems. Coastal rural settlements are critical to socio-ecological resilience, reflecting the dynamic interaction between human activities and coastal environments [2,3]. Current research highlights the significant transformation challenges faced by coastal rural areas worldwide [4]. Due to varying geographic and socio-economic contexts, different regions follow divergent developmental paths. In Europe, particularly in densely populated Mediterranean areas, much of the literature addresses the balance between tourism expansion, cultural heritage protection, and managing ecologically sensitive areas [5,6], along with adaptive governance and resilience-building practices [7,8,9]. In South America, regions such as northeastern Brazil and southern Chile focus on environmental degradation and climate change impacts, exploring ecosystem-based livelihood alternatives for sustainability [10,11,12,13,14,15].
In China, coastal area transformations are notably shaped by complex geomorphic environments and rapid urbanization [16]. Since the 1978 reform, urbanization in coastal provinces has surged from 18% to 72% (National Bureau of Statistics, China). This rapid change has placed significant pressures on rural settlements, including the decline of traditional fishing and farming communities [17], resource imbalances [18,19,20], rural hollowing [21,22,23], and arable land loss [24,25]. Thus, China’s coastal areas, with their diverse geomorphology and rapid social change, offer a representative case for examining rural settlement evolution. These areas reveal vital human–environment feedback mechanisms and provide insights for other coastal regions facing similar pressures, such as Southeast Asia and the Indian subcontinent. However, there remains a lack of systematic analysis of rural settlement evolution in the context of diverse natural environments and socio-economic changes.
Understanding the differentiated evolution of coastal rural settlements requires investigating how complex natural foundations shape settlement trajectories and adaptation processes through “environment–society” feedback mechanisms. Recent literature on coastal rural settlements is growing, covering topics such as urban–rural differences [26], spatial differentiation and functional structures [27], village tourism [28], economic transformation [29,30,31], rural hollowing [32], community disaster response [33,34,35], and traditional village protection [36,37,38,39]. Nevertheless, the following gaps remain:
- Coastal geomorphic complexity is insufficiently addressed. Geomorphology profoundly influences human–environment relationships through the “natural foundation–societal response” feedback loop. Coastal geomorphology, with features such as agricultural and fishery resources, establishes the conditions for settlement development, while human activities adapt and transform these environments through cultural practices, creating divergent development paths. This process reflects the co-evolutionary dynamics in Coupled Human and Natural Systems (CHANS) theory [40,41,42]. Although recent studies have begun focusing on the adaptability of coastal socio-economic systems to geomorphic changes, such as social participation mechanisms in lagoon ecosystem restoration [43], retreat strategies for delta settlements in response to sea-level rise [44], and trade-offs between tourism development and shoreline protection in sandbank areas [45], most studies treat geomorphic types as background variables or lack comparative studies across different geomorphic types. They fail to systematically explore these types as the “core clue” to understanding the spatial morphology, economic models, and social structures of coastal communities.
- Spatial unit selection is biased. Many studies rely on administrative boundaries, ignoring the integrity of bays as essential natural geographic units, disrupting holistic human–environment system analyses.
- Driving mechanisms are underexplored. Quantitative studies often focus on statistical correlations without delving into the multi-source driving mechanisms of settlement evolution, especially the interaction between natural environments, socio-economic factors, and location.
To address these gaps, this study aims to answer the core question: How do diverse coastal geomorphologies differentially drive the spatiotemporal dynamics of rural settlements? This study innovates in the following three key areas: (1) Theoretical framework: It develops an integrative framework combining multi-bay units, spatiotemporal analysis, and dynamic mechanisms, classifying coastal zone systems by geomorphology and analyzing their spatial adaptation patterns. (2) Research unit: It replaces administrative boundaries with bay units, restoring the integrity of coastal settlement systems. (3) Methodological breakthrough: This study employs the geographical detector method, which offers higher sensitivity to spatial heterogeneity than traditional methods, to identify multi-source coupling driving effects of natural environments, socio-economic factors, and location.
This study focuses on Guangdong Province, China, with the country’s longest coastline (4114.3 km). It includes four typical geomorphic types: Hilly Ria Coast, Platform Ria Coast, Barrier-Lagoon Coast, and Estuarine Delta Coast [46,47], offering a valuable comparative sample. This study divides the coastal zone into bay units and compares typical units across geomorphic types. It focuses on two key periods: 1972 (pre-reform) and 2022 (post-planning maturity), constructing a 50-year spatiotemporal comparison framework with the following goals: (1) construct a spatiotemporal framework for coastal rural settlements; (2) reveal differentiated dynamics and driving mechanisms across geomorphic contexts; and (3) propose geomorphologically adaptive governance strategies for sustainable coastal development.
2. Materials and Methods
2.1. Study Area
Guangdong Province, situated at China’s southern extremity (20°13′ N–25°31′ N, 109°39′ E–117°24′ E), sustains the mainland’s longest coastline (4114.3 km). Its coastal zone has been shaped into four characteristic geomorphic types through tectonic activity and land–sea interactions [46,47]: Hilly Ria Coast, Platform Ria Coast, Barrier-Lagoon Coast, and Estuarine Delta Coast, each providing diversified environmental foundations for settlement development. As a pioneer of China’s 1978 economic reforms, Guangdong has maintained the nation’s highest GDP for decades. Rapid socioeconomic development has driven significant divergences in land use patterns and settlement configurations across these geomorphic contexts.
Bay-unit selection criteria were implemented following China’s national coastal survey protocols (1980–1985) [48], delineating a 10 km inland buffer from the shoreline. Representative bays from each geomorphic type were analyzed (Figure 1 and Figure 2), with core characteristics defined as follows:
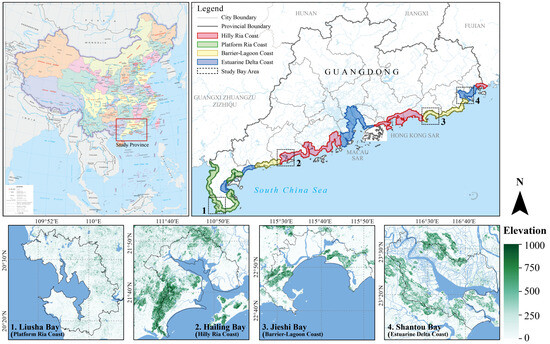
Figure 1.
Spatial distribution of four coastal geomorphic types and selected study bay units.
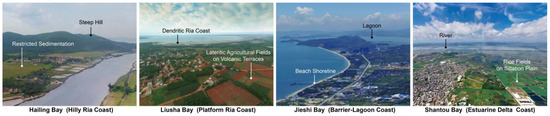
Figure 2.
Representative present-day photographs of sampled bay units, illustrating key morphological characteristics.
- Hilly Ria Coast: Characterized by steep bedrock slopes and sediment-constrained valleys, this type features limited terrestrial space but deep-water harbor advantages. Units are concentrated along the Pearl River Estuary, spanning from Honghai Bay (east) to Hailing Bay and Zhelin Bay (west).
- Platform Ria Coast: Formed by volcanic platforms and marine transgressions, these dendritic coastlines exhibit flat terrain and natural harbors, yet suffer from arid conditions restricting agriculture. Dominated by fishing economies, clusters are observed along the Leizhou Peninsula.
- Barrier-Lagoon Coast: Defined by sandbars and semi-enclosed lagoons, this type sustains robust fishery–salt industries but faces soil erosion risks from sandy substrates. Distributed peripherally to hilly ria systems, key units include Haimen Bay (east) and Jianjiang Estuary (west).
- Estuarine Delta Coast: Comprising alluvial plains and anastomosing channels, these zones prioritize intensive reclamation agriculture. Major units align with deltaic regions of the Pearl, Han, Rong, Lian, Jian, and Nandu Rivers.
2.2. Data Source and Processing
Spatiotemporal datasets were systematically compiled and processed from multiple sources:
- Land Use Data: Historical settlement patterns (1972) were reconstructed from KeyHole satellite imagery (3 m resolution) through geometric correction, visual interpretation, and resampling to 30 m resolution. Contemporary patterns (2022) were derived from Landsat 8 multispectral imagery (30 m resolution) using random forest supervised classification. All datasets were spatially co-registered to generate settlement patch maps for the four bay units spanning 1972 vs. 2022 (Figure 3).
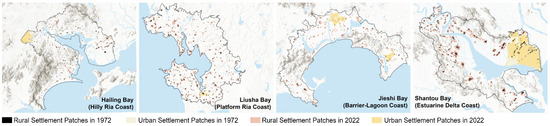 Figure 3. Identified settlement patches across four representative bay units, derived from multi-temporal remote sensing analysis (1972 vs. 2022).
 - Topographic and Hydrologic Data: Digital elevation models (30 m resolution) and national hydrographic vector datasets were acquired from the Geospatial Data Cloud (http://www.gscloud.cn/) (accessed on 15 September 2024).
- Administrative Boundaries: Village-level administrative boundaries were extracted from the Third National Land Survey of Guangdong Province (2020), provided by the Provincial Department of Natural Resources.
- Transportation Networks: Road networks encompassing expressways, national, provincial, and county roads were obtained from the Resource and Environment Science Data Center (http://www.resdc.cn/) (accessed on 15 September 2024). Road density and accessibility metrics were calculated using the Network Analyst module in ArcGIS 10.4.
- Socioeconomic Data: Statistical datasets were compiled from multiple sources, including the China Bay Chronicles, Guangdong Yearbook, Quanyue Cunqing, and municipal government reports. These data provided demographic, economic, and infrastructure indicators at village and township levels.
3. Theoretical Foundation and Research Framework
3.1. Theoretical Foundation
This study is based on the Coupled Human and Natural Systems (CHANS) theory, which highlights the nonlinear interactions, co-evolution, and feedback loops between human societies and the natural environment [40]. In coastal zones, empirical research has shown that geomorphic environments, as the rigid foundation of natural systems, shape human–environment relationships through resource distribution and disaster risk patterns [49]. Rural settlements reflect the adaptive responses of social systems, such as spatial reorganization and livelihood transformation [50,51]. These interactions lead to spatial differentiation and path dependence in settlement dynamics [52,53]. Three key principles for coastal rural settlement systems, supported by multidisciplinary research, are outlined below:
- (1)
- Scale Dependency Principle. Administrative units, such as townships, disrupt ecological processes in bays (e.g., sediment transport) [54] and social networks (e.g., fisheries cooperation) [55], limiting the effectiveness of CHANS analysis. Recent studies emphasize the system value of bays as natural units, noting their role in land–sea interactions, biogeochemical cycles, and human activity. This study adopts bays as the base unit for analysis [56].
- (2)
- Structural–Functional Symbiosis Principle. Settlement geography research shows that spatial structures (e.g., distribution patterns, edge morphology) and socio-economic functions (e.g., land use, industrial activities) co-evolve [29,57]. In coastal zones, environmental constraints drive functional adaptations (e.g., the development of agricultural–fishery systems in delta regions) [58], while functional needs lead to structural changes (e.g., aquaculture development creating new settlement areas) [59]. This study explores the interplay of structure and function as key drivers of spatiotemporal evolution.
- (3)
- Heterogeneous Response Principle. Research has shown that identical socio-economic factors produce different effects in various geographical environments. For example, beach coasts, with their loose sandy structures, are more easily altered under tourism pressure, leading to significant geomorphic changes [60], while bedrock coasts experience minimal disturbance [61]. While the role of geomorphic environments in spatiotemporal evolution is well-established [43], further investigation is needed into how multiple geomorphic types lead to differentiation.
3.2. Spatiotemporal Analytical Framework for Coastal Rural Settlements
Building on CHANS Theory, this study develops an analytical framework for the spatiotemporal evolution of coastal rural settlements. It centers on “multi-type bay units—multidimensional spatiotemporal characteristics—multisource coupling driving mechanisms” (Figure 4). The framework classifies bay units based on geomorphology, following the scale dependency principle, and establishes a baseline for coupling natural and social processes. By integrating multidimensional features, the framework quantifies structural–functional co-evolution, addressing the limitations of one-dimensional analysis. The optimal parameter geographical detector model identifies the interactions of multiple driving forces—natural environments, socio-economic factors, and location—capturing the heterogeneity in these mechanisms [62,63]. The bay unit classification addresses “where coupling occurs,” spatiotemporal features quantify “how coupling is measured,” and driving mechanisms explain “why coupling happens.” This framework shifts the focus from static spatial patterns to interpreting human–environment coupling mechanisms, filling the gap in comparative studies of dynamic rural settlement systems across different geomorphic types.
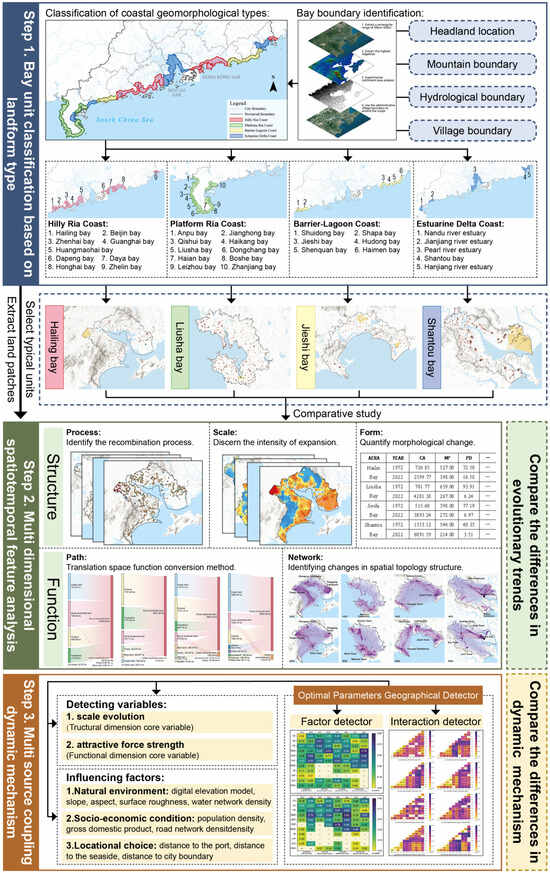
Figure 4.
Methodological framework integrating geomorphic classification, multidimensional analysis, and driving mechanism detection.
3.2.1. Geomorphic Typology-Based Bay Unit Classification
Following planning and ecological methods [64], bay units are defined based on the “morphological–functional integrity” principle, which emphasizes the spatial coupling of ecological processes and socio-economic activities within natural geographic units. A multi-factor overlay analysis in ArcGIS, considering topography, hydrology, and village boundaries, divided Guangdong Province’s coastal zone into 30 continuous bay units. These include nine hilly ria types, ten platform ria types, six barrier-lagoon types, and five estuarine delta types.
Based on existing research, typical bay samples were selected for geographic representativeness and analytical control. The selection criteria are listed in Table 1. The final comparative study samples include Hailing Bay (hilly ria), Liusha Bay (platform ria), Jieshi Bay (barrier-lagoon), and Shantou Bay (estuarine delta).

Table 1.
Selection criteria for typical bay unit samples.
3.2.2. Multidimensional Spatiotemporal Characterization
The spatiotemporal evolution of coastal rural settlements reflects the human–environment–sea interaction system, governed by the “structure–function” co-evolutionary law. To overcome the limitations of traditional one-dimensional approaches, this study develops a five-dimensional analytical framework (Table 2) based on “structure–function” coupling. This framework captures the full scope of settlement development, including “reorganization, scale growth, spatial morphology, functional transformation, and regional network correlation.” The framework is structured as follows:
Table 2.
Methods and basis for characterization Indicators.
- (1)
- Structural Dimensions: Temporal Adaptation of Spatial Material Form
- Process: Settlement typology classification methods [70] identify various evolutionary patterns to reveal macro-structural reorganization processes.
- Scale: Land use area changes, based on spatial expansion measurement paradigms [71], characterize the intensity of spatial expansion, providing a quantitative basis for structural evolution.
- Form: Using landscape ecology analysis methods [72], landscape pattern indices are employed to quantify changes in settlement spatial morphology.
- (2)
- Functional Dimensions: Spatial Mapping of Socio-Economic Activities
- Path: Based on land change dynamics models [73,74], land use transition matrices are used to interpret the spatial implementation of functional transformations.
- Network: Spatial gravity models in economic geography [75,76] calculate attraction indices between settlements to reveal functional linkages’ spatial topology.
3.2.3. Multi-Source Coupled Dynamic Mechanisms
This study uses the optimal parameter geographical detector (OPGD) method to quantitatively analyze the evolutionary mechanisms of coastal rural settlements under heterogeneous geomorphic conditions [62]. Drawing on the work of relevant scholars [71] and incorporating the requirements of the geographical detector model for continuous dependent variables, this study selects area size (representing structural attributes) and spatial attraction index (representing functional attributes) as core dependent variables. From the three levels of natural environment (elevation, slope, aspect, surface roughness, and river network density), socio-economic factors (population, GDP, and road network density), and locational elements (port distance, coastal distance, and urban distance), 11 key factors are selected as independent variables. The goal is to use the OPGD parameter optimization algorithm to focus on analyzing the multisource coupling paths and interactive effects of natural foundations, socio-economic, and locational elements (Table 3).
Table 3.
Selection of independent variables and basis.
3.3. Methodology
3.3.1. Analysis Method for Scale Evolution: Scale Expansion Intensity
Settlement expansion intensity was quantified using the Settlement Expansion Intensity Index (SEII) to assess spatiotemporal variations in built-up areas [71]. Discrete settlement metrics were spatially interpolated into 30-meter-resolution continuous surfaces through Ordinary Kriging interpolation on the ArcGIS 10.7 platform, revealing spatial heterogeneity in expansion patterns. The SEII was calculated as follows:
where and represent the built-up areas of rural settlements at the initial and terminal study periods, respectively, within each settlement unit.
3.3.2. Analysis Method for Evolutionary Path Features: Land Use Transition Matrix
The structural characteristics of regional land use changes are systematically quantified using Land Use Transition Matrices [71,73], which reveal human activity-driven transformation patterns.
The matrix is constructed as follows:
where represents the transition area from land use type i to j between initial (t1) and terminal (t2) study periods, with n denoting the total land use categories (LUCC classification system).
3.3.3. Analysis Method for Morphological Evolution Features: Landscape Pattern Indices
Landscape pattern indices are essential tools for quantifying spatial complexity and heterogeneity in landscape structure, offering insights into the composition and configuration of coastal rural settlements [72]. In current settlement-related studies, when using landscape indices to assess spatial evolution, the selection of indices generally covers three aspects: “scale, shape, and spatial configuration” [77]. Based on existing literature, this study selects nine indices to describe the morphological evolution characteristics of coastal rural settlements. Their definitions and functions are summarized in Table 4.
Table 4.
Landscape pattern indices and ecological significance.
3.3.4. Analysis Method for Network Structure Features: Settlement Attraction Index Based on Spatial Gravity Model
The spatial gravity model from economic geography was employed to quantify interaction intensity between settlements, measuring structural connectivity through settlement area (spatial entity magnitude) and accessibility distance (network impedance) [76]. Settlement areas (S) and inter-settlement shortest-path distances () were computed using ArcGIS Network Analyst and OD cost matrix tools. Attraction indices were calculated as follows:
where denotes the attraction between settlements i and j; represents settlement areas; and is the network-based travel distance.
3.3.5. Analysis Method for Driving Mechanism: Optimal Parameter Geographical Detector (OPGD)
The Geodetector is a spatial analysis model used to assess correlations between dependent and independent variables by detecting spatial heterogeneity [77]. Traditional implementations often rely on subjective decisions regarding discretization and scale selection [78]. In contrast, the OPGD framework improves detection accuracy by algorithmically optimizing three key parameters: discretization method, number of strata, and spatial scale thresholds [79]. In this study, the OPGD was applied using the “GD” package in R Studio (version 2023.09.1+494) with R version 4.4.2, incorporating three core modules: 1. Parameter optimization: automated selection of optimal discretization schemes; 2. Factor detector: identification of dominant drivers; 3. Interaction detector: evaluation of synergistic or antagonistic effects among variables. Spatial correlations between factors X and Y were quantified using the q-statistic:
where N = total samples, Nh = samples in stratum h, = global variance, and = stratum-specific variance. The explanatory power of factor X on Y increases with higher q-statistic values (0 ≤ q ≤ 1).
4. Results
4.1. Spatiotemporal Characteristics of Rural Settlements Across Four Bay Units
4.1.1. Comparative Evolution Modes
Spatiotemporal analysis of rural settlement patches in 1972 and 2022 identified five distinct evolution modes: (1) Urban–Rural Integration—peripheral villages absorbed by urban expansion; (2) Monolithic Expansion—outward growth of individual settlements; (3) Cluster Amalgamation—merging of adjacent settlements into continuous patches; (4) Adjacent Newly Established—new settlements nucleating near original villages; (5) Atrophy and Decline—settlements experiencing >50% area loss due to relocation or abandonment.
The prevalence and spatial configuration of these modes varied significantly across the four bay units (Figure 5).
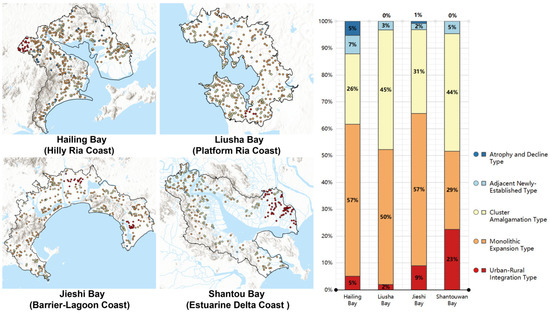
Figure 5.
Comparative spatial distribution and quantitative ratios of rural settlement evolution modes across four bay units (1972 vs. 2022).
Hailing Bay (Hilly Ria Coast) exhibited a distribution pattern of 5:57:26:7:5, dominated by Monolithic Expansion. Mountainous terrain constrained growth to ribbon-like patterns along the coast, with wide spacing limiting settlement coalescence. This bay recorded the highest proportions of Atrophy and Adjacent Newly Established types, reflecting a “high-altitude abandonment → low-altitude nucleation” trend that highlights topographic constraints on long-term sustainability.
Liusha Bay (Platform Ria Coast) displayed a 1:25:22:2:0 ratio, also dominated by Monolithic Expansion and Cluster Amalgamation. Settlements expanded inland as isolated units, while coastal clustering occurred due to integrated agriculture–aquaculture–salt production economies. Limited Urban–Rural Integration reflected weak river–sea transportation infrastructure that restricted urban influence.
Jieshi Bay (Barrier-Lagoon Coast) showed a 7:43:24:2:1 ratio, with Monolithic Expansion as the primary mode. Settlements on sandy coastal ridges maintained wide spacing for soil conservation, while Cluster Amalgamation occurred in alluvial tidal plains where shared resource networks supported coalescence and mudflat exploitation.
Shantou Bay (Estuarine Delta Coast) demonstrated a 14:18:26:3:0 ratio, with Cluster Amalgamation most prevalent. Fertile alluvial plains and dense waterway networks fostered large agrarian clusters. This bay exhibited the highest Urban–Rural Integration ratio, forming “urban–village mosaics” facilitated by flat terrain and robust transport connectivity, which accelerated rural–urban symbiosis.
4.1.2. Comparative Analysis of Settlement Expansion
Significant differences in expansion intensity and spatial patterns were observed across the four bay units (Figure 6 and Figure 7).
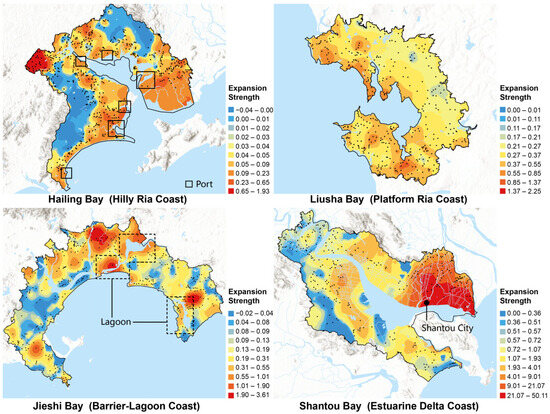
Figure 6.
Comparative settlement expansion intensity across four bay units (1972 vs. 2022).
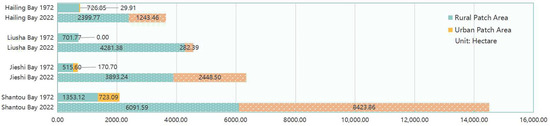
Figure 7.
Aerial comparison of settlement expansion in four bay units (1972 vs. 2022).
Shantou Bay (Estuarine Delta Coast) demonstrated the highest expansion intensity with an annual growth rate of 248.78 ha/yr. In 1972 and 2022, its settlement area consistently exceeded other bay units, expanding radially outward from Shantou City in a monocentric pattern driven by rapid urbanization.
Jieshi Bay (Barrier-Lagoon Coast) experienced substantial growth at 113.11 ha/yr, with settlement area increasing from 686.30 ha (1972) to 6341.74 ha (2022). Expansion concentrated around two lagoons, facilitated by sediment management in the Luo and Wukan Rivers and enhanced lagoon ecosystem services.
Liusha Bay (Platform Ria Coast) showed moderate expansion at 77.24 ha/yr, constrained by arid volcanic platforms and poor soil conditions. Growth exhibited spatial dispersion and low efficiency, with development concentrated in coastal low-platform zones.
Hailing Bay (Hilly Ria Coast) recorded the slowest growth at 57.72 ha/yr, with 63.57% of expansion occurring along coastal corridors—particularly near harbors and river–sea junctions. This created a port-oriented circumferential pattern constrained by mountainous topography.
4.1.3. Comparative Transition Pathways
Distinct land use transition pathways were observed across the four bay units, shaped by geomorphic constraints, resource endowments, and human interventions (Figure 8).
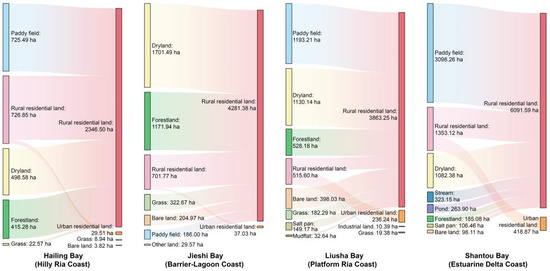
Figure 8.
Comparative analysis of land use conversion areas for rural settlements across four bay units (1972 vs. 2022).
Hailing Bay (Hilly Ria Coast) was characterized by agriculture-dominated transitions, with paddy fields (725.49 ha) and drylands (498.58 ha) accounting for 71.37% of total conversions to settlements. Notably, reverse transitions from rural residential areas to grassland indicated land degradation in high-altitude zones with limited agricultural suitability.
Liusha Bay (Platform Ria Coast) exhibited resource-exploitative transitions, primarily sourced from drylands (1701.49 ha) and forestland (1171.94 ha). Forestland conversions (32.4%) were the highest among all bay units, reflecting intensive exploitation of volcanic platform resources for settlement development.
Jieshi Bay (Barrier-Lagoon Coast) demonstrated agriculture-driven transitions through paddy field (1193.21 ha) and dryland (1130.14 ha) conversions. Significantly, saltpan-to-residential transitions (149.17 ha) peaked among all bays (mean: 63.91 ha), predominantly concentrated along eastern lagoons in response to saltpan conversion policies.
Shantou Bay (Estuarine Delta Coast) reflected multifunctional integration, with settlement expansion sourced from paddy fields (3098.26 ha), drylands (1082.38 ha), streams (323.15 ha), and ponds (263.90 ha). Paddy field conversion was twice the bay average, while stream and pond conversions illustrated characteristic deltaic “pond-filling” reclamation practices.
4.1.4. Comparative Morphological Evolution
All four bay units exhibited significant morphological intensification in 1972 and 2022, as revealed by landscape metrics (Table 5). Decreasing patch density (PD) indicated settlement coalescence, rising largest patch index (LPI) reflected strengthened core influence, declining landscape shape index (LSI) suggested spatial regularization, while increases in aggregation index (AI) and mean patch area (AREA_MN) signaled contiguous and intensive development.
Table 5.
Analysis of landscape indices for four bays (1972 vs. 2022). Note: CA: class area; NP: number of patches; PD: patch density; LPI: largest patch index; LSI: landscape shape index; AERA_MN: mean patch area; SHAPE_MN: mean shape index; PAFRAC: perimeter-area fractal dimension; AI: aggregation index.
Despite the overall centralization trend, notable differences emerged among bay units:
Hailing Bay (Hilly Ria Coast) demonstrated linear extension patterns, with AI increasing by 5.82% and mean shape index (SHAPE_MN) growing by 15.53%, driven by port-road corridor expansion. A 5.74% rise in perimeter-area fractal dimension (PAFRAC) and a 3.69% decline in LSI reflected terrain-constrained complexity amid planning-induced regularization.
Liusha Bay (Platform Ria Coast) was characterized by spatial dispersion. AREA_MN increased 13.9-fold, yet AI rose only 11.96%, indicating large but fragmented expansion patterns. An 18.79% increase in SHAPE_MN highlighted settlement integration with coastal shelterbelt systems, maintaining natural boundary configurations.
Jieshi Bay (Barrier-Lagoon Coast) exhibited balanced polycentric development. LPI increased only 0.11 (compared to the average of 1.89), demonstrating the absence of dominant cores, while a 19.47% increase in PAFRAC suggested persistence of natural morphological boundaries.
Shantou Bay (Estuarine Delta Coast) displayed strong core consolidation, with the number of patches (NP) declining by 60.81% and AREA_MN increasing 11.55-fold. Its 36.83% reduction in LSI (versus the average of 22.98%) underscored road-network-driven spatial regularization processes.
4.1.5. Comparative Evolution of Network Structures
The evolution of rural settlement network structures across the four bay units reveals distinct hierarchical patterns shaped by geomorphic constraints and socioeconomic dynamics (Figure 9).
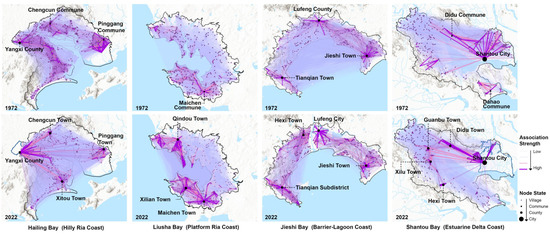
Figure 9.
Comparative evolution of rural settlement spatial network structures across four bay units (1972 vs. 2022).
Hailing Bay (Hilly Ria Coast) transitioned from bifurcated systems to cross-watershed integration. In 1972, networks along the eastern and western banks of the Zhihuang River operated separately, with fan-shaped diffusion from Yangxi County (west) and dual cores at Chengcun and Pinggang Communes (east). By 2022, Yangxi County emerged as the dominant hub, transcending hydrological barriers, while Chengcun and Pinggang were upgraded to townships and Xitou Town became a key secondary node.
Liusha Bay (Platform Ria Coast) evolved from homogeneous dispersion to coastal polynuclear configurations. In 1972, network centrality was limited to Maichen Commune, serving as the historical administrative center. By 2022, coastal polynuclearity emerged, with port and market nodes enhancing marine economic connectivity and strengthening regional network efficiency through integrated traditional commerce.
Jieshi Bay (Barrier-Lagoon Coast) demonstrated progressive reinforcement of lagoon-centric networks. The 1972 triangular network structure (Lufeng County—Jieshi Town—Tianqian Town) centered on Lufeng County as the maritime commerce core. By 2022, dual-core development between Lufeng City and Hexi Town reflected constrained cross-lagoon integration due to sandy substrate limitations and declining water transport capacity.
Shantou Bay (Estuarine Delta Coast) shifted from river-bifurcated to trans-marine networks. The 1972 river-segregated pattern featured Shantou City (east bank) and the independent Dahao Commune (west bank). By 2022, cross-sea bridge construction enabled U-shaped transmission networks centered on Shantou City, incorporating secondary hubs such as Didu Town while diminishing Dahao’s centrality.
4.2. Comparative Dynamics of Rural Settlement Evolution
4.2.1. Driving Mechanisms of Settlement Scaling
Significant disparities in driving mechanisms across the four bay units were identified, with factor interactions (1972 vs. 2022) quantified through 11 indicators using Geodetector analysis (Figure 10 and Figure 11).
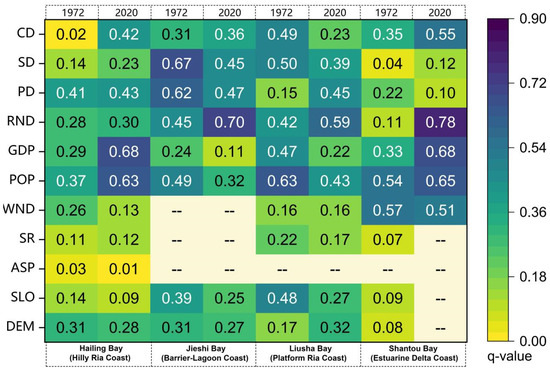
Figure 10.
Factor detector results of rural settlement area scaling across four bay units (1972 vs. 2022), identifying key drivers through q-statistic analysis. Note: DEM: digital elevation model; SLO: slope; ASP: aspect; SR: surface roughness; WND: water network density; POP: population density; GDP: gross domestic product; RND: road network density; PD: distance to the port; SD: distance to the seaside; CD: distance to city boundary; q-value: contribution of drivers to settlement area. Areas with no data indicate no significant correlation.
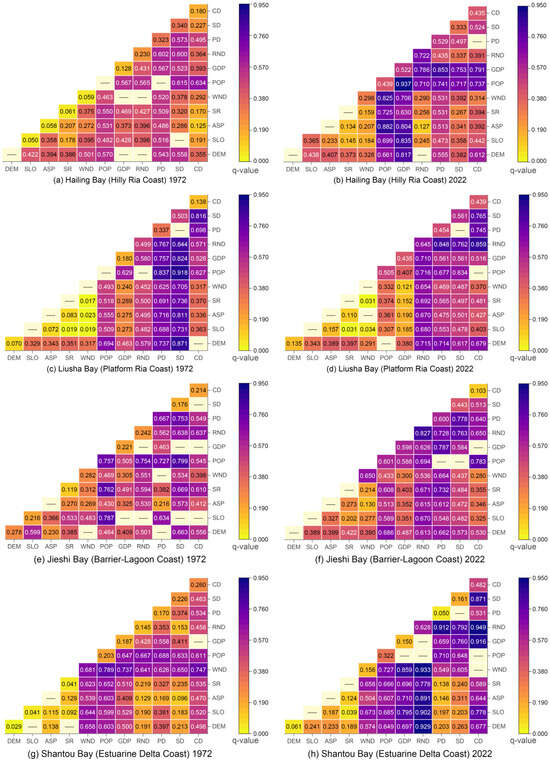
Figure 11.
Interaction detector results of areal expansion patterns across four bay units (1972 vs. 2022). Note: DEM: digital elevation model; SLO: slope; ASP: aspect; SR: surface roughness; WND: water network density; POP: population density; GDP: gross domestic product; RND: road network density; PD: distance to the port; SD: distance to the seaside; CD: distance to city boundary; q-value: contribution of two-factor interactions to settlement area. Areas with no data indicate no significant correlation.
Hailing Bay (Hilly Ria Coast) experienced infrastructure-driven breakthroughs within topographic constraints. In 1972, distance to port (q = 0.41), population density (q = 0.97), and elevation (q = 0.31) were dominant factors, with terrain constraints indirectly mediated by population carrying capacity (DEM ∩ population density = 0.57). By 2022, GDP (q = 0.68) and population density (q = 0.63) emerged as primary drivers, with infrastructure investments creating economic-transportation synergies (GDP ∩ road network density = 0.79). Critical infrastructure projects, including port highways and cross-sea bridges, mitigated topographic limitations and facilitated coastal ribbon development.
Liusha Bay (Platform Ria Coast) shifted from port dependency to transportation-driven mechanisms. In 1972, coastal proximity (distance to seaside: q = 0.67) and port accessibility (distance to port: q = 0.62) dominated settlement development, with strong interactions (all >0.5) between coastal proximity and other factors fostering port–village symbiosis. By 2022, road network density (q = 0.70) surpassed natural factors as the primary driver. This transition was facilitated by flat platform terrain that reduced marginal costs for transportation infrastructure. Spatial synergy between transportation networks and urban nodes (road network density ∩ distance to city boundary = 0.86) established growth corridors, enhancing rural connectivity.
Jieshi Bay (Barrier-Lagoon Coast) transitioned from resource dependency to port-driven mechanisms. In 1972, population density (q = 0.63) and coastal proximity (distance to seaside: q = 0.50) were dominant, with their interaction (population density ∩ distance to seaside = 0.80) highlighting coastal population attraction due to integrated agriculture–aquaculture–salt production systems. By 2022, road network density (q = 0.59) and port accessibility (distance to port: q = 0.45) became primary drivers, with economic-port synergy (GDP ∩ distance to port = 0.78) establishing coastal trade corridors. Notably, increased topographic influence (Δq = 0.15 for elevation) indicated improved flood resilience through river desilting projects, enabling utilization of previously hazard-constrained lands.
Shantou Bay (Estuarine Delta Coast) evolved from hydrology-dependent to urban radiation-driven mechanisms. In 1972, water network density (q = 0.57) dominated, reflecting the critical role of irrigation and navigation in early water-oriented settlement patterns. By 2022, road network density (q = 0.78) and GDP (q = 0.68) became main drivers, with their interaction (road network density ∩ GDP = 0.86) establishing growth corridors through urban connectivity leveraging deltaic geomorphic advantages. Concurrently, stronger urban proximity effects (Δq = 0.20 for distance to city boundary) marked a shift from endogenous rural expansion to metropolitan radiation-driven development.
4.2.2. Comparative Dynamics of Attractive Force Strength Evolution
The evolution of attractive force strength was primarily driven by enhanced material and population flow efficiency through transportation corridor optimization. All four bay units exhibited a transition from riverine/marine dependency to road network dominance, with distinct pathways shaped by geomorphic factors (Figure 12 and Figure 13).
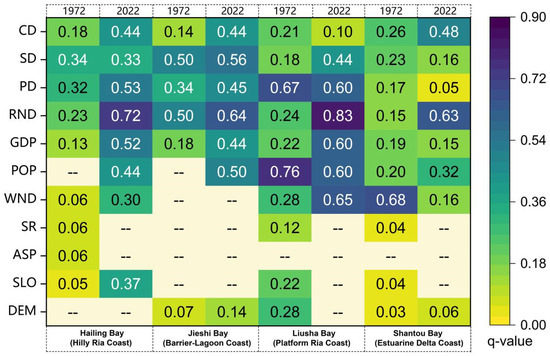
Figure 12.
Factor detector results of settlement attraction strength across four bay units (1972 vs. 2022). Note: DEM: digital elevation model; SLO: slope; ASP: aspect; SR: surface roughness; WND: water network density; POP: population density; GDP: gross domestic product; RND: road network density; PD: distance to the port; SD: distance to the seaside; CD: distance to city boundary; q-value: contribution of drivers to attractive force strength. Areas with no data indicate no significant correlation.
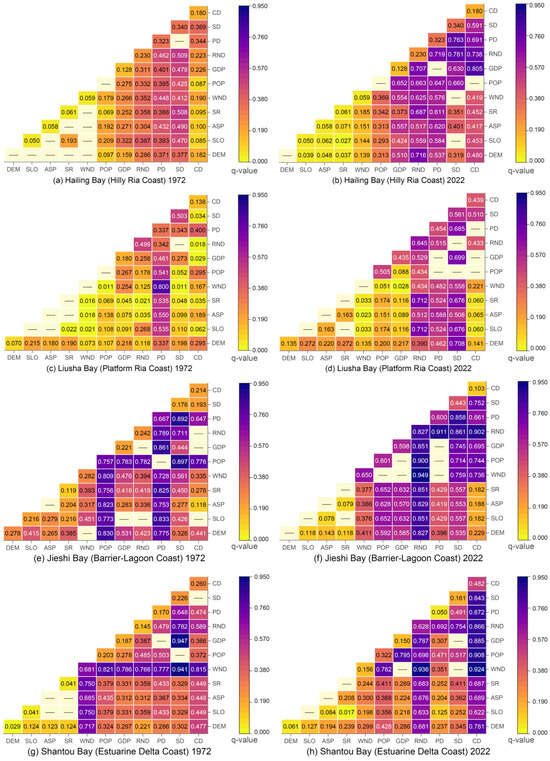
Figure 13.
Interaction detector results of settlement attraction strength across four bay units (1972 vs. 2022). Note: DEM: digital elevation model; SLO: slope; ASP: aspect; SR: surface roughness; WND: water network density; POP: population density; GDP: gross domestic product; RND: road network density; PD: distance to the port; SD: distance to the seaside; CD: distance to city boundary; q-value: contribution of two-factor interactions to attractive force strength. Areas with no data indicate no significant correlation.
Hailing Bay (Hilly Ria Coast) transitioned from port–marine spatial coupling to infrastructure-mediated terrain breakthrough. In 1972, settlement development was driven by distance to port (q = 0.32) and distance to seaside (q = 0.34), reflecting maritime-dependent spatial connectivity. By 2022, road network density (q = 0.72) became the dominant driver, with strong infrastructure–industry interactions (road network density ∩ GDP = 0.71). This shift reflected the successful overcoming of terrain barriers through tunnels and bridges, integrating mountain settlements into regional economies.
Liusha Bay (Platform Ria Coast) shifted from linear coastal dependence to platform-wide coverage. In 1972, coastal proximity (distance to seaside: q = 0.50) dominated, with port–coast interactions (distance to seaside ∩ distance to port = 0.34) enhancing accessibility. By 2022, dual drivers emerged: road network density (q = 0.64) and distance to seaside (q = 0.56). Strengthened port–coast interactions reflected marine economic expansion inland, facilitated by comprehensive transportation networks linking deep-water ports through specialized highways.
Jieshi Bay (Barrier-Lagoon Coast) evolved from lagoon–port monocentricity to integrated land–sea–river connectivity. In 1972, settlement development was dominated by population density (q = 0.76) and distance to port (q = 0.67), with strong port–GDP interactions (distance to port ∩ GDP = 0.86) compensating for unstable sandbar environments (distance to seaside: q = 0.18). By 2022, road network density (q = 0.83) became the primary driver, with strong coastal synergy (road network density ∩ distance to seaside = 0.86). Concurrently, water network density increased dramatically by 132% (Δq = +0.37), reflecting the transformation of flood-prone channels into development assets through hydrological remediation, creating multimodal land–sea transportation networks.
Shantou Bay (Estuarine Delta Coast) shifted from hydrological corridor dependence to urban expansion dynamics. In 1972, water network density (q = 0.68) dictated spatial linkages, with strong river–coast interactions (q = 0.94) forming integrated river–sea–settlement networks. By 2022, dynamics shifted toward road network density (q = 0.63) and distance to city boundary (q = 0.48), with their synergy (q = 0.86) marking urban economic dominance and regional spatial restructuring.
5. Discussion
The spatiotemporal evolution of coastal rural settlements is fundamentally shaped by the co-evolution of geophysical environments and socioeconomic activities. Current coastal social–ecological systems (CSES) theories inadequately emphasize the prerequisite constraints and foundational provisioning of natural environments [80]. This study employs geomorphic differentiation as an environmental variable, advancing the “nature–society co-evolution” paradigm in coastal human–environment systems while revealing evolutionary characteristics and dynamic mechanisms to inform differentiated governance of coastal settlement systems.
5.1. Advances and Limitations
Coastal rural settlements, as spatial representations of the human–environment system, reflect how human activities adapt to natural constraints through their spatiotemporal dynamics. Previous studies have explored the mechanisms driving coastal settlement development from various angles. For example, Nguyen et al. [81] used multi-temporal remote sensing images to show significant land expansion toward the sea driven by shrimp farming in the Mekong Delta, emphasizing the positive feedback between “economic growth” and “land use expansion.” Similarly, Madariaga et al. [82] demonstrated how the protection of fisheries heritage and tourism development in coastal Spain transformed traditional fishing villages. However, comparative studies on rural settlement evolution across diverse geomorphic types in the extensive coastal zone have been overlooked.
This study addresses the key question: “How do different geomorphic environments in coastal zones drive spatiotemporal dynamics in rural settlement evolution?” The following advancements were made: First, a comparative analysis revealed the threshold effects of geomorphic foundations on settlement development. For instance, the average annual expansion rate in the hilly ria bay (Hailing Bay) is only 20% of that in the estuarine delta bay (Shantou Bay). This aligns with Santana et al.’s [83] findings in the Bahamas, where terrain complexity and ecosystem integrity were identified as core factors in assessing tourism development risks, highlighting the “geomorphic threshold–ecological resilience” coupling principle.
Second, this study introduces a spatial governance model that replaces administrative boundaries with bay units, addressing the traditional land–sea divide (e.g., in Chesapeake Bay, where state-based institutional differences have led to reduced wetland connectivity [84]). This approach aligns with “Integrated Coastal Area and River Basin Management” practices in Brazil [85], demonstrating the effectiveness of geographic unit reconstruction in improving governance.
Finally, by integrating multidimensional “structure–function” coupling and using the optimal parameter geographical detector, this study uncovers the complex, nonlinear dynamics of coastal settlement evolution. This framework not only advances understanding of settlement mechanisms but also provides crucial quantitative support for coastal management and rural planning.
Despite these contributions, this study has the following limitations: (1) Time scale: The 50-year period (1972 vs. 2022) does not capture long-term geomorphic-settlement co-evolution processes (e.g., estuarine delta advances) or extreme event cycles (e.g., typhoon recurrence). Future research should integrate IPCC extreme scenarios for better disaster modeling. (2) Socio-cultural gaps: This study did not incorporate traditional ecological knowledge (TEK) from fishermen on port layout. Future work should include participatory GIS (PGIS) to interpret the value of tidal patterns and intangible heritage in decision-making. (3) Mechanism depth: The feedback pathways triggered by environmental thresholds (e.g., steep slopes → population outflow → industrial transformation → geomorphic recovery) were not quantified. Future research could develop a multi-agent model (ABM) to simulate these feedback processes.
5.2. Critical Reflection on Rural Settlement Transformation in Coastal Zones Under Geomorphic Differentiation
The evolution of coastal rural settlements reflects the “spatial reproduction” strategy shaped by the interaction of geomorphic constraints and socio-economic drivers. These differences are not just variations in settlement morphology or scale but represent the complex feedback between socio-economic needs and ecosystem services under different environmental thresholds. The spatiotemporal dynamics of coastal rural settlements require deeper exploration and critical reexamination from a systemic perspective.
In hilly ria bays (e.g., Hailing Bay), the terrain limits settlement expansion, encouraging development along deep-water harbors. While road networks improve connectivity, they also increase risks, such as slope instability and other geohazards [86]. The reliance on linear development exposes settlements to cascading risks from single-point failures, with disruptions to key roads potentially triggering regional system risks. This highlights the vulnerability of infrastructure in complex terrain.
In platform ria bays (e.g., Liusha Bay), land reclamation addresses poor soil quality, enabling port–city integration and expanding development space. However, it leads to the permanent loss of coastal habitats and ecosystem service degradation [87]. This approach, heavily reliant on a marine economic model, faces risks such as resource depletion, market volatility, and spatial polarization, which can marginalize hinterland rural areas and worsen regional development imbalances.
Barrier-lagoon bays (e.g., Jieshi Bay) face constraints from sandy soil erosion and flooding in lowland areas. Historically, these areas relied on lagoon shoals for combined agricultural, fishery, and salt production. However, large-scale interventions (e.g., river channel regulation and shoreline protection) have increased land use intensity, transforming traditional salt production due to lower profitability. The “salt-to-residence” policy, while increasing land value, overlooks the ecological resilience provided by salt pan wetlands. Salt marsh vegetation, which protects shorelines and stabilizes sand, cannot be replaced by hard engineering solutions [88]. Nevertheless, current policies still neglect the protection of these wetland systems.
Estuarine delta bays (e.g., Shantou Bay), with their fertile soils and river–sea hub advantages, are rapidly urbanizing. Land expansion through pond filling and reclamation reduces the flood retention space of river networks, amplifying flood risks and disconnecting key estuarine ecological corridors [89]. Recent policies, such as the “Regulations on the Management of Estuarine Mudflats in Guangdong Province” and “Shantou City River Management Measures,” emphasize the need for a balanced approach to development and environmental protection, particularly in estuarine mudflats.
5.3. Practical Implications: Geomorphic-Adaptive Governance Strategies for Multi-Typological Bays
The four evolutionary paths of coastal rural settlements identified in this study lay the foundation for advancing Integrated Coastal Zone Management (ICZM). Aligning with the Sustainable Development Goals (SDG 11: Sustainable Cities and Communities; SDG 14: Life Below Water), this study proposes geomorphological adaptation strategies for bay governance, focusing on balancing short-term development and long-term ecological and social resilience.
In hilly ria bays, steep terrain limits settlement expansion, making growth highly dependent on road corridors, which creates vulnerabilities in network connectivity. Governance should prioritize enhancing system resilience by developing multi-path transportation networks, including bridges and tunnels, to reduce risks of system failure. Additionally, development should focus on low-altitude, infrastructure-mature, and geologically stable areas, with land remediation guiding efficient renewal and minimizing development on ecologically sensitive slopes.
In platform ria bays, land reclamation is driven by the need to overcome poor soil quality. The land use transformation is heavily reliant on the marine economy, leading to imbalances such as port–city polarization and hinterland marginalization. Governance should adopt a coordinated approach: promote water-saving irrigation systems and protective forest belts to improve soil water retention, and implement strict coastal protection lines and reclamation control zones. Priority should be given to renewing inefficient industrial land to prevent unchecked sea expansion. When upgrading port infrastructure, focus should be on connecting core fishing ports, processing hubs, and rural settlements to reduce polarization and foster inclusive development.
Barrier-lagoon bays face a conflict between the ecological carrying capacity of lagoon plains and development pressures. The “salt-to-residence” transformation has undermined the resilience value of salt pan wetlands. Governance should re-establish the importance of natural infrastructure by restoring or conserving salt marshes, mangroves, and other critical habitats. A “salt-to-wetland or salt-to-shore” restoration model should be implemented to preserve natural resilience, especially for storm surge defense and biodiversity. Additionally, a “compact waterfront” settlement model, integrating shared disaster prevention facilities and natural buffer zones, should be promoted to reduce risks from sandy soil erosion and flooding.
In estuarine delta bays, urban expansion leads to polarization and ecological decline. Land reclamation and pond filling have reduced flood retention space and disrupted ecological corridors. Governance should focus on protecting the blue–green ecological network and optimizing spatial structure. This includes strict protection of key pond systems and river networks, with inviolable ecological protection lines. In planning new urban clusters, industrial zones, and transport corridors, integrating blue–green ecological spaces into the design will help balance ecological preservation and development. This integration ensures the compatibility of ecological networks and development spaces, enhancing spatial coordination and resilience.
6. Conclusions
The spatiotemporal evolution of coastal rural settlements exhibits significant geomorphic differentiation. In hilly ria bays, the terrain’s potential energy imposes a rigid constraint on settlement topology, leading settlements to transcend traditional hinterland diffusion patterns. This is achieved through spatial compensation via bridge and tunnel infrastructure, forming a “corridor-like” coastal aggregation and revealing the limited domestication of natural boundaries through infrastructure intervention. In platform ria bays, poor soil limits terrestrial agriculture, and settlement development depends on enhancing marine economic synergy through port road networks. This results in a dual pattern of multi-core coastal aggregation and extensive inland development, demonstrating uneven spatial reproduction. In barrier-lagoon bays, the collaboration between land, sea, and river governance transforms fragile lowlands into potential development areas, continually strengthening regional networks around the lagoon core. However, this approach overlooks the ecological service value of salt marshes, thus neglecting their resilience. Estuarine delta bays, leveraging river network advantages, promote urban–rural network reconstruction, displaying an intense spatial integration process. Nevertheless, this comes at the cost of pond loss, confirming the detrimental accumulation of high-intensity development at the expense of blue–green infrastructure and highlighting the deep contradictions between high-intensity development and the protection of water network ecosystems.
This study develops an analytical framework based on “multi-type bay units, multidimensional spatiotemporal characteristics, and multisource coupling driving mechanisms,” revealing the evolutionary process of coastal rural settlements under geomorphic constraints and adaptive transformations. It proposes differentiated governance strategies, including “steep slope treatment to disperse settlements, platform promotion for connectivity, lagoon management for sedimentation, and estuary density control.”
Despite limitations in time and spatial scales, as well as socio-cultural dimensions, this study’s groundbreaking contributions include the following: (1) replacing administrative units with bays in reconstructing the coastal settlement analysis framework; (2) establishing a multidimensional spatiotemporal characteristic quantification system; and (3) forming differentiated governance strategies based on “geomorphological adaptability,” providing scientific support for the implementation of SDG 11 (Sustainable Communities) and SDG 14 (Life Below Water).
Author Contributions
Conceptualization, S.F.; methodology, S.F.; software, S.F.; validation, Y.S.; formal analysis, S.F.; investigation, S.F.; resources, Y.P.; data curation, S.F.; writing—original draft preparation, S.F.; writing—review and editing, Y.P. and Y.S.; visualization, S.F.; supervision, Y.S.; project administration, Y.P.; funding acquisition, Y.P. All authors have read and agreed to the published version of the manuscript.
Funding
This research was funded by the Independent Research Project of the State Key Laboratory of Subtropical Building and Urban Science (Grant No. 2023ZB09) and the Guangdong Basic and Applied Basic Research Foundation (Grant No. 2025A1515011540).
Data Availability Statement
The data presented in this study are available upon request from the corresponding author.
Conflicts of Interest
The authors declare no conflicts of interest.
References
- Cicin-Sain, B. Conserve and sustainably use the oceans, seas and marine resources for sustainable development. UN Chron. 2015, 51, 32–33. [Google Scholar] [CrossRef]
- Insani, T.D.; Rudiarto, I.; Handayani, W.; Wijaya, H.B. Rural livelihood resilience on multiple dimensions: A case study from selected coastal areas in Central Java. World Rev. Sci. Technol. Sustain. Dev. 2022, 18, 176. [Google Scholar] [CrossRef]
- Jozaei, J.; Chuang, W.-C.; Allen, C.R.; Garmestani, A. Social vulnerability, social-ecological resilience and coastal governance. Glob. Sustain. 2022, 5, e12. [Google Scholar] [CrossRef]
- Magnan, A.K.; Bell, R.; Duvat, V.K.E.; Ford, J.D.; Garschagen, M.; Haasnoot, M.; Lacambra, C.; Losada, I.J.; Mach, K.J.; Noblet, M.; et al. Status of global coastal adaptation. Nat. Clim. Change 2023, 13, 1213–1221. [Google Scholar] [CrossRef]
- Pirlone, F.; Spadaro, I. Sustainable tourism action plan in the Mediterranean coastal areas. Int. J. Sustain. Dev. Plan. 2017, 12, 995–1005. [Google Scholar] [CrossRef]
- Cannas, R. Communicating actions for sustainable tourism development. The implementation of the European Tourism Indicator System for sustainable destinations in South Sardinia. Almatourism 2018, 9, 105–128. Available online: https://hdl.handle.net/11584/264698 (accessed on 3 September 2024).
- da Silva, M.F.; Macias, J.V.; Taylor, S.; Ferguson, L.; Sousa, L.P.; Lamers, M.; Flannery, W.; Martins, F.; Costa, C.; Pita, C. Tourism and coastal & maritime cultural heritage: A dual relation. J. Tour. Cult. Change 2022, 20, 806–826. [Google Scholar] [CrossRef]
- Ioppolo, G.; Saija, G.; Salomone, R. From coastal management to environmental management: The sustainable eco-tourism program for the mid-western coast of Sardinia (Italy). Land Use Policy 2013, 31, 460–471. [Google Scholar] [CrossRef]
- Heimann, T. Culture, Space and Climate Change: Vulnerability and Resilience in European Coastal Areas; Routledge: London, UK, 2018; pp. 15–38. [Google Scholar] [CrossRef]
- Prado, D.S.; Seixas, C.S.; Berkes, F. Looking back and looking forward: Exploring livelihood change and resilience building in a Brazilian coastal community. Ocean Coast. Manag. 2015, 113, 29–37. [Google Scholar] [CrossRef]
- Gamarra, N.; Costa, A.; Ferreira, M.; Diele-Viegas, L.; Santos, A.; Ladle, R.; Malhado, A.; Campos-Silva, J. The contribution of fishing to human well-being in Brazilian coastal communities. Mar. Policy 2023, 150, 105521. [Google Scholar] [CrossRef]
- Pinillos, F.J.V.; Ruiz, J.A.C. Coastal management and climate change on the island and the sea of Chiloé (Chile): An evaluation of policies, regulations, and instruments. Environ. Sci. Policy 2024, 156, 103758. [Google Scholar] [CrossRef]
- Hiriart-Bertrand, L.; Silva, J.A.; Gelcich, S. Challenges and opportunities of implementing the marine and coastal areas for indigenous peoples policy in Chile. Ocean Coast. Manag. 2020, 193, 105233. [Google Scholar] [CrossRef]
- Partelow, S.; Glaser, M.; Arce, S.S.; Barboza, R.S.L.; Schlüter, A. Mangroves, fishers, and the struggle for adaptive comanagement: Applying the social-ecological systems framework to a marine extractive reserve (RESEX) in Brazil. Ecol. Soc. 2018, 23, 19. Available online: https://www.jstor.org/stable/26799142 (accessed on 3 September 2024). [CrossRef]
- Parra, J.; Jensen, M. Adapting to climate change: Lessons from Chile’s coastal communities. Int. J. Clim. Change Strat. Manag. 2025, 17, 291–310. [Google Scholar] [CrossRef]
- Xu, X.; Peng, H.; Xu, Q.; Xiao, H.; Benoit, G. Land changes and conflicts coordination in coastal urbanization: A case study of the Shandong Peninsula in China. Coast. Manag. 2009, 37, 54–69. [Google Scholar] [CrossRef]
- Hu, Q.; Zhang, T.; Jiao, Z.; Duan, Y.; Dewancker, B.J.; Gao, W. How does industrial transformation enhance the development of coastal fishing villages: Lessons learned from different transformation models in Qingdao, China. Ocean Coast. Manag. 2023, 235, 106470. [Google Scholar] [CrossRef]
- Chen, Y.; Chen, A.; Zhang, D. Evaluation of resources and environmental carrying capacity and its spatial-temporal dynamic evolution: A case study in Shandong Province, China. Sustain. Cities Soc. 2022, 82, 103916. [Google Scholar] [CrossRef]
- Du, Y.-W.; Wang, Y.-C. Evaluation of marine ranching resources and environmental carrying capacity from the pressure-and-support perspective: A case study of Yanta. Ecol. Indic. 2021, 126, 107688. [Google Scholar] [CrossRef]
- Liao, S.; Wu, Y.; Wong, S.W.; Shen, L. Provincial perspective analysis on the coordination between urbanization growth and resource environment carrying capacity (RECC) in China. Sci. Total Environ. 2020, 730, 138964. [Google Scholar] [CrossRef]
- Long, H.; Li, Y.; Liu, Y.; Woods, M.; Zou, J. Accelerated restructuring in rural China fueled by ‘increasing vs. decreasing balance’land-use policy for dealing with hollowed villages. Land Use Policy 2012, 29, 11–22. [Google Scholar] [CrossRef]
- Liu, Y.; Shu, L.; Peng, L. The Hollowing Process of Rural Communities in China: Considering the Regional Characteristic. Land 2021, 10, 911. [Google Scholar] [CrossRef]
- Liu, Y.-S.; Liu, Y.; Chen, Y.; Long, H. The process and driving forces of rural hollowing in China under rapid urbanization. J. Geogr. Sci. 2010, 20, 876–888. [Google Scholar] [CrossRef]
- Liu, Y.; Yang, Y.; Li, Y.; Li, J. Conversion from rural settlements and arable land under rapid urbanization in Beijing during 1985–2010. J. Rural. Stud. 2017, 51, 141–150. [Google Scholar] [CrossRef]
- Liu, Y.; Wang, J.; Long, H. Analysis of arable land loss and its impact on rural sustainability in Southern Jiangsu Province of China. J. Environ. Manag. 2010, 91, 646–653. [Google Scholar] [CrossRef]
- Chen, M.; Ye, C. Differences in pattern and driving forces between urban and rural settlements in the coastal region of Ningbo, China. Sustainability 2014, 6, 1848–1867. [Google Scholar] [CrossRef]
- Long, H.; Liu, Y.; Wu, X.; Dong, G. Spatio-temporal dynamic patterns of farmland and rural settlements in Su-Xi-Chang region: Implications for building a new countryside in coastal China. Land Use Policy 2009, 26, 322–333. [Google Scholar] [CrossRef]
- Wu, C.H. Research on the coastal marine environment and rural sustainable development strategy of island countries—Taking the Penghu Islands as an example. Water 2021, 13, 1434. [Google Scholar] [CrossRef]
- Jia, K.; Qiao, W.; Chai, Y.; Feng, T.; Wang, Y.; Ge, D. Spatial distribution characteristics of rural settlements under diversified rural production functions: A case of Taizhou, China. Habitat Int. 2020, 102, 102201. [Google Scholar] [CrossRef]
- Long, H.; Zou, J.; Liu, Y. Differentiation of rural development driven by industrialization and urbanization in eastern coastal China. Habitat Int. 2009, 33, 454–462. [Google Scholar] [CrossRef]
- Su, S.; Zhang, Q.; Zhang, Z.; Zhi, J.; Wu, J. Rural settlement expansion and paddy soil loss across an ex-urbanizing watershed in eastern coastal China during market transition. Reg. Environ. Change 2011, 11, 651–662. [Google Scholar] [CrossRef]
- Yang, R.; Liu, Y.; Long, H.; Qiao, L. Spatio-temporal characteristics of rural settlements and land use in the Bohai Rim of China. J. Geogr. Sci. 2015, 25, 559–572. [Google Scholar] [CrossRef]
- Islam, M.; Amir, A.A.; Begum, R.A. Community awareness towards coastal hazard and adaptation strategies in Pahang coast of Malaysia. Nat. Hazards 2021, 107, 1593–1620. [Google Scholar] [CrossRef]
- Hovis, M.; Hollinger, J.C.; Cubbage, F.; Shear, T.; Doll, B.; Kurki-Fox, J.J.; Line, D.; Fox, A.; Baldwin, M.; Klondike, T.; et al. Natural infrastructure practices as potential flood storage and reduction for farms and rural communities in the North Carolina coastal plain. Sustainability 2021, 13, 9309. [Google Scholar] [CrossRef]
- Rivera-Arriaga, E.; Williams-Beck, L.; Hernández, L.E.V.; Arjona, M.E.G. Crafting grassroots’ socio-environmental governance for a coastal biosphere rural community in Campeche, Mexico. Ocean Coast. Manag. 2021, 204, 105518. [Google Scholar] [CrossRef]
- Xu, G.; Zhou, J.; Dai, Y.; Lin, J.; Zou, F. Regional differences, temporal evolution, and drivers of rural hollowing in coastal provinces: A case study of Fujian Province. Sustainability 2023, 15, 13318. [Google Scholar] [CrossRef]
- Cai, Z.; Li, J.; Wang, J. The protection and landscape characteristics of traditional villages in coastal areas of SW China. J. Coast. Res. 2020, 111, 331–335. [Google Scholar] [CrossRef]
- Arjaya, I.M. The strength of traditional villages in managing coastal areas in Bali. Law Dr. Community Serv. J. 2022, 1, 54–59. [Google Scholar] [CrossRef]
- Chen, T.-L.; Cheng, H.-W. Applying traditional knowledge to resilience in coastal rural villages. Int. J. Disaster Risk Reduct. 2020, 47, 101564. [Google Scholar] [CrossRef]
- Liu, J.; Dietz, T.; Carpenter, S.R.; Alberti, M.; Folke, C.; Moran, E.; Pell, A.N.; Deadman, P.; Kratz, T.; Lubchenco, J.; et al. Complexity of coupled human and natural systems. Science 2007, 317, 1513–1516. Available online: https://www.science.org/doi/10.1126/science.1144004 (accessed on 15 September 2024). [CrossRef]
- Alberti, M.; Asbjornsen, H.; Baker, L.A.; Brozovic, N.; Drinkwater, L.E.; Drzyzga, S.A.; Jantz, C.A.; Fragoso, J.; Holland, D.S.; Kohler, T.A.; et al. Research on coupled human and natural systems (CHANS): Approach, challenges, and strategies. Bull. Ecol. Soc. Am. 2011, 92, 218–228. Available online: http://archives.pdx.edu/ds/psu/16425 (accessed on 15 September 2024). [CrossRef]
- Wang, S.; Fu, B.; Zhao, W.; Liu, Y.; Wei, F. Structure, function, and dynamic mechanisms of coupled human-natural systems. Curr. Opin. Environ. Sustain. 2018, 33, 87–91. [Google Scholar] [CrossRef]
- Phuah, T.L.-K.; Chang, Y.-C. Socioeconomic adaptation to geomorphological change: An empirical study in Cigu Lagoon, southwestern coast of Taiwan. Front. Environ. Sci. 2023, 10, 1091640. [Google Scholar] [CrossRef]
- Miller, F.; Dun, O. Resettlement and the environment in Vietnam: Implications for climate change adaptation planning. Asia Pac. Viewp. 2019, 60, 132–147. [Google Scholar] [CrossRef]
- Yuhi, M.; Matsuyama, M.; Hayakawa, K. Sandbar migration and shoreline change on the Chirihama Coast, Japan. J. Mar. Sci. Eng. 2016, 4, 40. [Google Scholar] [CrossRef]
- Guangdong Provincial Chorography Compilation Committee. Guangdong Provincial Chronicles: Records of Oceans and Islands (2000); Guangdong People’s Publishing House: Guangdong, China, 2000; pp. 53–54. (In Chinese) [Google Scholar]
- Zeng, Z.X.; Huang, W.F. Natural Geography of Guangdong (2001); Guangdong People’s Publishing House: Guangdong, China, 2001; pp. 44–65. (In Chinese) [Google Scholar]
- Guangdong Provincial Comprehensive Survey Team of Coastal Zone and Tidal Flat Resources. Guangdong Provincial Comprehensive Survey Report on Coastal Zone and Tidal Flat Resources (1987); Ocean Press: Beijing, China, 1987; pp. 1–10. (In Chinese) [Google Scholar]
- Rupp-Armstrong, S.; Nicholls, R.J. Coastal and estuarine retreat: A comparison of the application of managed realignment in England and Germany. J. Coast. Res. 2007, 236, 1418–1430. Available online: https://www.jstor.org/stable/30138541 (accessed on 15 September 2024). [CrossRef]
- Setyawan, W.B. Adaptation strategy to coastal erosion by rural communities: Lessons learned from Ujunggebang village, Indramayu, West Java, Indonesia. Marit. Technol. Res. 2022, 4, 252846. [Google Scholar] [CrossRef]
- Wei, C.; Xu, H.; Wall, G. Asset assemblages and livelihood resilience in a coastal community. J. Sustain. Tour. 2024, 32, 904–922. [Google Scholar] [CrossRef]
- Zhang, Z.; Yang, X.; Xiao, R. Fractal characterization of settlement patterns and their spatial determinants in coastal zones. ISPRS Int. J. Geo-Inform. 2015, 4, 2728–2741. [Google Scholar] [CrossRef]
- Choudhury, M.; Wu, H.; Shahidullah, A.K.M. Improving the feedback loop between community-and policy-level learning: Building resilience of coastal communities in Bangladesh. Sustain. Dev. 2024, 32, 1508–1524. [Google Scholar] [CrossRef]
- Thom, B.; Eliot, I.; Eliot, M.; Harvey, N.; Rissik, D.; Sharples, C.; Short, A.; Woodroffe, C. National sediment compartment framework for Australian coastal management. Ocean Coast. Manag. 2018, 154, 103–120. [Google Scholar] [CrossRef]
- Léopold, M.; Guillemot, N.; Rocklin, D.; Chen, C. A framework for mapping small-scale coastal fisheries using fishers’ knowledge. ICES J. Mar. Sci. 2014, 71, 1781–1792. [Google Scholar] [CrossRef]
- Chen, Y.; Zhou, Y.; Ma, Y.; Sun, Z.; Yang, W. Can China’s ocean governance system improve the marine ecosystem?–Taking the “bay chief system” as an example. Front. Mar. Sci. 2024, 11, 1361187. [Google Scholar] [CrossRef]
- Holmes, J.; Argent, N. Rural transitions in the Nambucca Valley: Socio-demographic change in a disadvantaged rural locale. J. Rural. Stud. 2016, 48, 129–142. [Google Scholar] [CrossRef]
- Yuen, K.W.; Hanh, T.T.; Quynh, V.D.; Switzer, A.D.; Teng, P.; Lee, J.S.H. Interacting effects of land-use change and natural hazards on rice agriculture in the Mekong and Red River deltas in Vietnam. Nat. Hazards Earth Syst. Sci. 2021, 21, 1473–1493. [Google Scholar] [CrossRef]
- Giri, S.; Daw, T.M.; Hazra, S.; Troell, M.; Samanta, S.; Basu, O.; Marcinko, C.L.J.; Chanda, A. Economic incentives drive the conversion of agriculture to aquaculture in the Indian Sundarbans: Livelihood and environmental implications of different aquaculture types. Ambio 2022, 51, 1963–1977. [Google Scholar] [CrossRef]
- Machado, P.M.; Suciu, M.C.; Costa, L.L.; Tavares, D.C.; Zalmon, I.R. Tourism impacts on benthic communities of sandy beaches. Mar. Ecol. 2017, 38, e12440. [Google Scholar] [CrossRef]
- Hampton, M.P.; Bianchi, R.; Jeyacheya, J. Dynamics of coastal tourism: Drivers of spatial change in South-East Asia. Singap. J. Trop. Geogr. 2024, 45, 54–69. [Google Scholar] [CrossRef]
- Song, Y.; Wang, J.; Ge, Y.; Xu, C. An optimal parameters-based geographical detector model enhances geographic characteristics of explanatory variables for spatial heterogeneity analysis: Cases with different types of spatial data. GISci. Remote Sens. 2020, 57, 593–610. [Google Scholar] [CrossRef]
- Zhou, W.; Pickett, S.T.A.; Cadenasso, M.L. Shifting concepts of urban spatial heterogeneity and their implications for sustainability. Landsc. Ecol. 2017, 32, 15–30. [Google Scholar] [CrossRef]
- Wen, C.X.; Que, Q.H.; Lin, X.R. Research on Land-sea Coordination Spatial Planning Based on Bay Unit. Urban Dev. Stud. 2022, 29, 27–34. (In Chinese) [Google Scholar]
- Barba, A.C.; Nero, C.A.; Battaglia, G.; Zambito, L.; Virga, L.; Messina, A.; Cangemi, M.; Bazan, G. Continuity, Resilience, and Change in Rural Settlement Patterns from the Roman to Islamic Period in the Sicani Mountains (Central-Western Sicily). Land 2024, 13, 400. [Google Scholar] [CrossRef]
- Marom, R.; Taxel, I. Ḥamāma: The historical geography of settlement continuity and change in Majdal ‘Asqālan’s hinterland, 1270–1750 CE. J. Hist. Geogr. 2023, 82, 49–65. [Google Scholar] [CrossRef]
- Wu, Z.; Fang, X.; Ye, Y. A settlement density based allocation method for historical cropland cover: A case study of Jilin province, China. Land 2022, 11, 1374. [Google Scholar] [CrossRef]
- Xu, H.; Guo, Q.; Siqin, C.; Li, Y.; Gao, F. Study of Settlement Patterns in Farming–Pastoral Zones in Eastern Inner Mongolia Using Planar Quantization and Cluster Analysis. Sustainability 2023, 15, 15077. [Google Scholar] [CrossRef]
- Chen, L.; Gao, Y.; Zhu, D.; Yuan, Y.; Liu, Y.; Shah, T.I. Quantifying the scale effect in geospatial big data using semi-variograms. PLoS ONE 2019, 14, e0225139. [Google Scholar] [CrossRef]
- Beyazli, D.; Aydemir, S.; Öksüz, A.M.; Özlü, S. Rural typology with and inductive approach. Int. J. Environ. Res. 2017, 11, 225–241. [Google Scholar] [CrossRef]
- Tan, S.; Zhang, M.; Wang, A.; Ni, Q. Spatio-temporal evolution and driving factors of rural settlements in low hilly region—A case study of 17 cities in Hubei Province, China. Int. J. Environ. Res. Public Health 2021, 18, 2387. [Google Scholar] [CrossRef]
- Chen, S.; Wang, X.; Qiang, Y.; Lin, Q. Spatial-temporal evolution and land use transition of rural settlements in mountainous counties. Environ. Sci. Eur. 2024, 36, 38. [Google Scholar] [CrossRef]
- Verburg, P.H.; Soepboer, W.; Veldkamp, A.; Limpiada, R.; Espaldon, V.; Mastura, S.S.A. Modeling the spatial dynamics of regional land use: The CLUE-S model. Environ. Manag. 2002, 30, 391–405. [Google Scholar] [CrossRef]
- Xie, S.; Zhang, W.; Zhao, Y.; Tong, D. Extracting land use change patterns of rural town settlements with sequence alignment method. Land 2022, 11, 313. [Google Scholar] [CrossRef]
- Ye, X.; Andris, C. Spatial social networks in geographic information science. Int. J. Geogr. Inf. Sci. 2021, 35, 2375–2379. [Google Scholar] [CrossRef]
- Zhou, X.; Zhang, H.; Ye, X. A multi-hierarchical method to extract spatial network structures from large-scale origin-destination flow data. Int. J. Geogr. Inf. Sci. 2024, 38, 577–602. [Google Scholar] [CrossRef]
- Song, W.; Li, H. Spatial pattern evolution of rural settlements from 1961 to 2030 in Tongzhou District, China. Land Use Policy 2020, 99, 105044. [Google Scholar] [CrossRef]
- Wang, J.F.; Xu, C.D. Geodetector: Principle and prospective. Acta Geogr. Sin. 2017, 72, 116–134. (In Chinese) [Google Scholar]
- Yang, L.; Ji, X.; Li, M.; Yang, P.; Jiang, W.; Chen, L.; Yang, C.; Sun, C.; Li, Y. A comprehensive framework for assessing the spatial drivers of flood disasters using an optimal Parameter-based geographical Detector-machine learning coupled model. Geosci. Front. 2024, 15, 101889. [Google Scholar] [CrossRef]
- Jiang, R.; Wu, P.; Song, Y.; Wu, C.; Wang, P.; Zhong, Y. Factors influencing the adoption of renewable energy in the U. S. residential sector: An optimal parameters-based geographical detector approach. Renew. Energy 2022, 201, 450–461. [Google Scholar] [CrossRef]
- Nguyen, M.T.; Renaud, F.G.; Sebesvari, Z. Drivers of change and adaptation pathways of agricultural systems facing increased salinity intrusion in coastal areas of the Mekong and Red River deltas in Vietnam. Environ. Sci. Policy 2019, 92, 331–348. [Google Scholar] [CrossRef]
- de Madariaga, C.J.; del Hoyo, J.J.G. Enhancing of the cultural fishing heritage and the development of tourism: A case study in Isla Cristina (Spain). Ocean Coast. Manag. 2019, 168, 1–11. [Google Scholar] [CrossRef]
- Santana, S.E.; Barroso, G.F. Integrated ecosystem management of river basins and the coastal zone in Brazil. Water Resour. Manag. 2014, 28, 4927–4942. [Google Scholar] [CrossRef]
- Areizaga, J.; Sanò, M.; Medina, R.; Juanes, J. Improving public engagement in ICZM: A practical approach. J. Environ. Manag. 2012, 109, 123–135. [Google Scholar] [CrossRef]
- Chesapeake Watershed Agreement. Available online: https://www.chesapeakebay.net/files/Chesapeake-Bay-Watershed-Agreement-Amended.pdf (accessed on 15 May 2025).
- L’Heureux, J.S.; Hansen, L.; Longva, O.; Eilertsen, R.S. Landslides along Norwegian fjords: Causes and hazard assessment. In Landslide Science and Practice: Volume 5: Complex Environment; Springer: Berlin/Heidelberg, Germany, 2013; pp. 81–87. [Google Scholar] [CrossRef]
- Liu, X.; Sun, M.; Cai, W.; Liang, Y.; Tian, J.; Wang, Z.; Zheng, Y. Evaluation Techniques of the Loss of Marine Ecosystem Services Caused by Sea Reclamation Project Based on Three Methods. J. Landsc. Res. 2016, 8, 29. [Google Scholar] [CrossRef]
- Feng, X.; Li, Y.; Lin, X. Protect China’s coastal salt marshes. Science 2024, 386, 629–630. [Google Scholar] [CrossRef] [PubMed]
- Wu, W.; Yang, Z.; Tian, B.; Huang, Y.; Zhou, Y.; Zhang, T. Impacts of coastal reclamation on wetlands: Loss, resilience, and sustainable management. Estuar. Coast. Shelf Sci. 2018, 210, 153–161. [Google Scholar] [CrossRef]
Disclaimer/Publisher’s Note: The statements, opinions and data contained in all publications are solely those of the individual author(s) and contributor(s) and not of MDPI and/or the editor(s). MDPI and/or the editor(s) disclaim responsibility for any injury to people or property resulting from any ideas, methods, instructions or products referred to in the content. |
© 2025 by the authors. Licensee MDPI, Basel, Switzerland. This article is an open access article distributed under the terms and conditions of the Creative Commons Attribution (CC BY) license (https://creativecommons.org/licenses/by/4.0/).