Article

Influence of Climate and Land Use Change on Runoff in Xiying River

1
Jingtai River Electric Lift Irrigation Water Resources Utilization Center of Gansu Province, Baiyin 730900, China
2
College of Geography and Environmental Science, Northwest Normal University, Lanzhou 730070, China
3
Comprehensive Observatory of Ecological Environment in Shiyang River Basin, Northwest Normal University, Lanzhou 730070, China
*
Author to whom correspondence should be addressed.
Land 2025, 14(7), 1381; https://doi.org/10.3390/land14071381
Submission received: 29 April 2025 / Revised: 18 June 2025 / Accepted: 27 June 2025 / Published: 30 June 2025

Abstract

In arid inland river basins, the upstream runoff generation zones contribute the majority of the basin’s water resources. Global warming and land use changes will produce uncertain impacts on runoff variations in the headwaters of inland rivers in arid regions. Deeply understanding the response mechanisms of runoff to climate and land use changes is fundamental for scientifically developing watershed water resource utilization planning and achieving sustainable socio-economic and ecological development. By integrating meteorological data, hydrological data, and multi-source remote sensing data, this study systematically evaluates the factors influencing changes in watershed hydrological processes. The results show: (1) From 1976 to 2016, the Xiying River runoff exhibited a slight increasing trend, with an increment of 0.213 mm per decade. (2) At the interannual scale, runoff is primarily influenced by precipitation changes, with a trend of further weakening ice and snowmelt effects. (3) The land use types in the Xiying River Basin are predominantly forestland, grassland, and unused land. With increasing forestland and cultivated land and decreasing grassland and construction land area, the watershed’s water conservation capacity has significantly improved.

1. Introduction

Climate change and anthropogenic land-use change are the primary drivers of global hydrological cycle disturbances, exerting profound impacts on water resource availability, distribution, and management [1,2]. Against the backdrop of global warming, river runoff has undergone significant spatiotemporal variations [3]. These runoff changes dominate the evolution of hydrological systems, thereby generating substantial impacts on resource environments and regional economies.
Alterations in river runoff are primarily driven by two key factors: climate change and human activities [4]. On one hand, climate change directly influences hydrological processes through key climatic elements such as precipitation and temperature. On the other hand, human activities mainly affect hydrological runoff processes by altering land-use types [5]. Specifically, climate change typically manifests as alterations in climatic variables, including precipitation, air temperature, sunshine duration, relative humidity, and wind speed. Both river runoff and these climatic factors exhibit distinct nonlinear characteristics and multi-scale dependence, encompassing complex features such as periodicity, abrupt changes, chaos, and fractals [6,7]. Extensive research confirms that precipitation is one of the dominant climatic factors driving river runoff variations [8]. Air temperature primarily influences river runoff indirectly by altering basin evapotranspiration [9]. As part of the natural system, human activities, particularly changes in land-use practices, significantly impact river runoff [10]. This impact is chiefly realized by modifying hydrological processes such as evapotranspiration, infiltration, surface runoff, and groundwater recharge, thereby directly altering regional water balances [11]. Furthermore, studies indicate that soil conservation measures and afforestation can significantly reduce surface runoff, while the impact of land-use change on surface runoff is particularly pronounced in highly arid regions [12].
As the principal contributor to the Shiyang River Basin’s hydrological network in northwest China, the Xiying River watershed has emerged as a critical focus for contemporary hydrological regime analysis. Quantifying the relative contributions of anthropogenic and climatic drivers to discharge regime alterations, particularly through interdecadal hydrological shifts, is essential to elucidate the underlying mechanisms of fluvial system transformation. Based on hydrological observation data from Jiutailing and corresponding meteorological records from 1976 to 2016, this study employs hydroclimate attribution analysis to investigate the synergistic effects of climate variability and anthropogenic land cover changes on hydrological zoning in the Xiyinghe River Basin. The research focuses on: (1) quantifying the impact of temperature and precipitation changes on runoff; (2) analyzing the effects of changes in different land use types on runoff; and (3) investigating the main controlling factors of the seasonal variation of runoff. A predictive framework for water flux variations under hydroclimate stress was established, with the resulting decision support analysis aimed at optimizing integrated water resources allocation, aquatic ecosystem conservation, and climate-adaptive infrastructure design for water-stressed endorheic river basins.

2. Study Area and Data
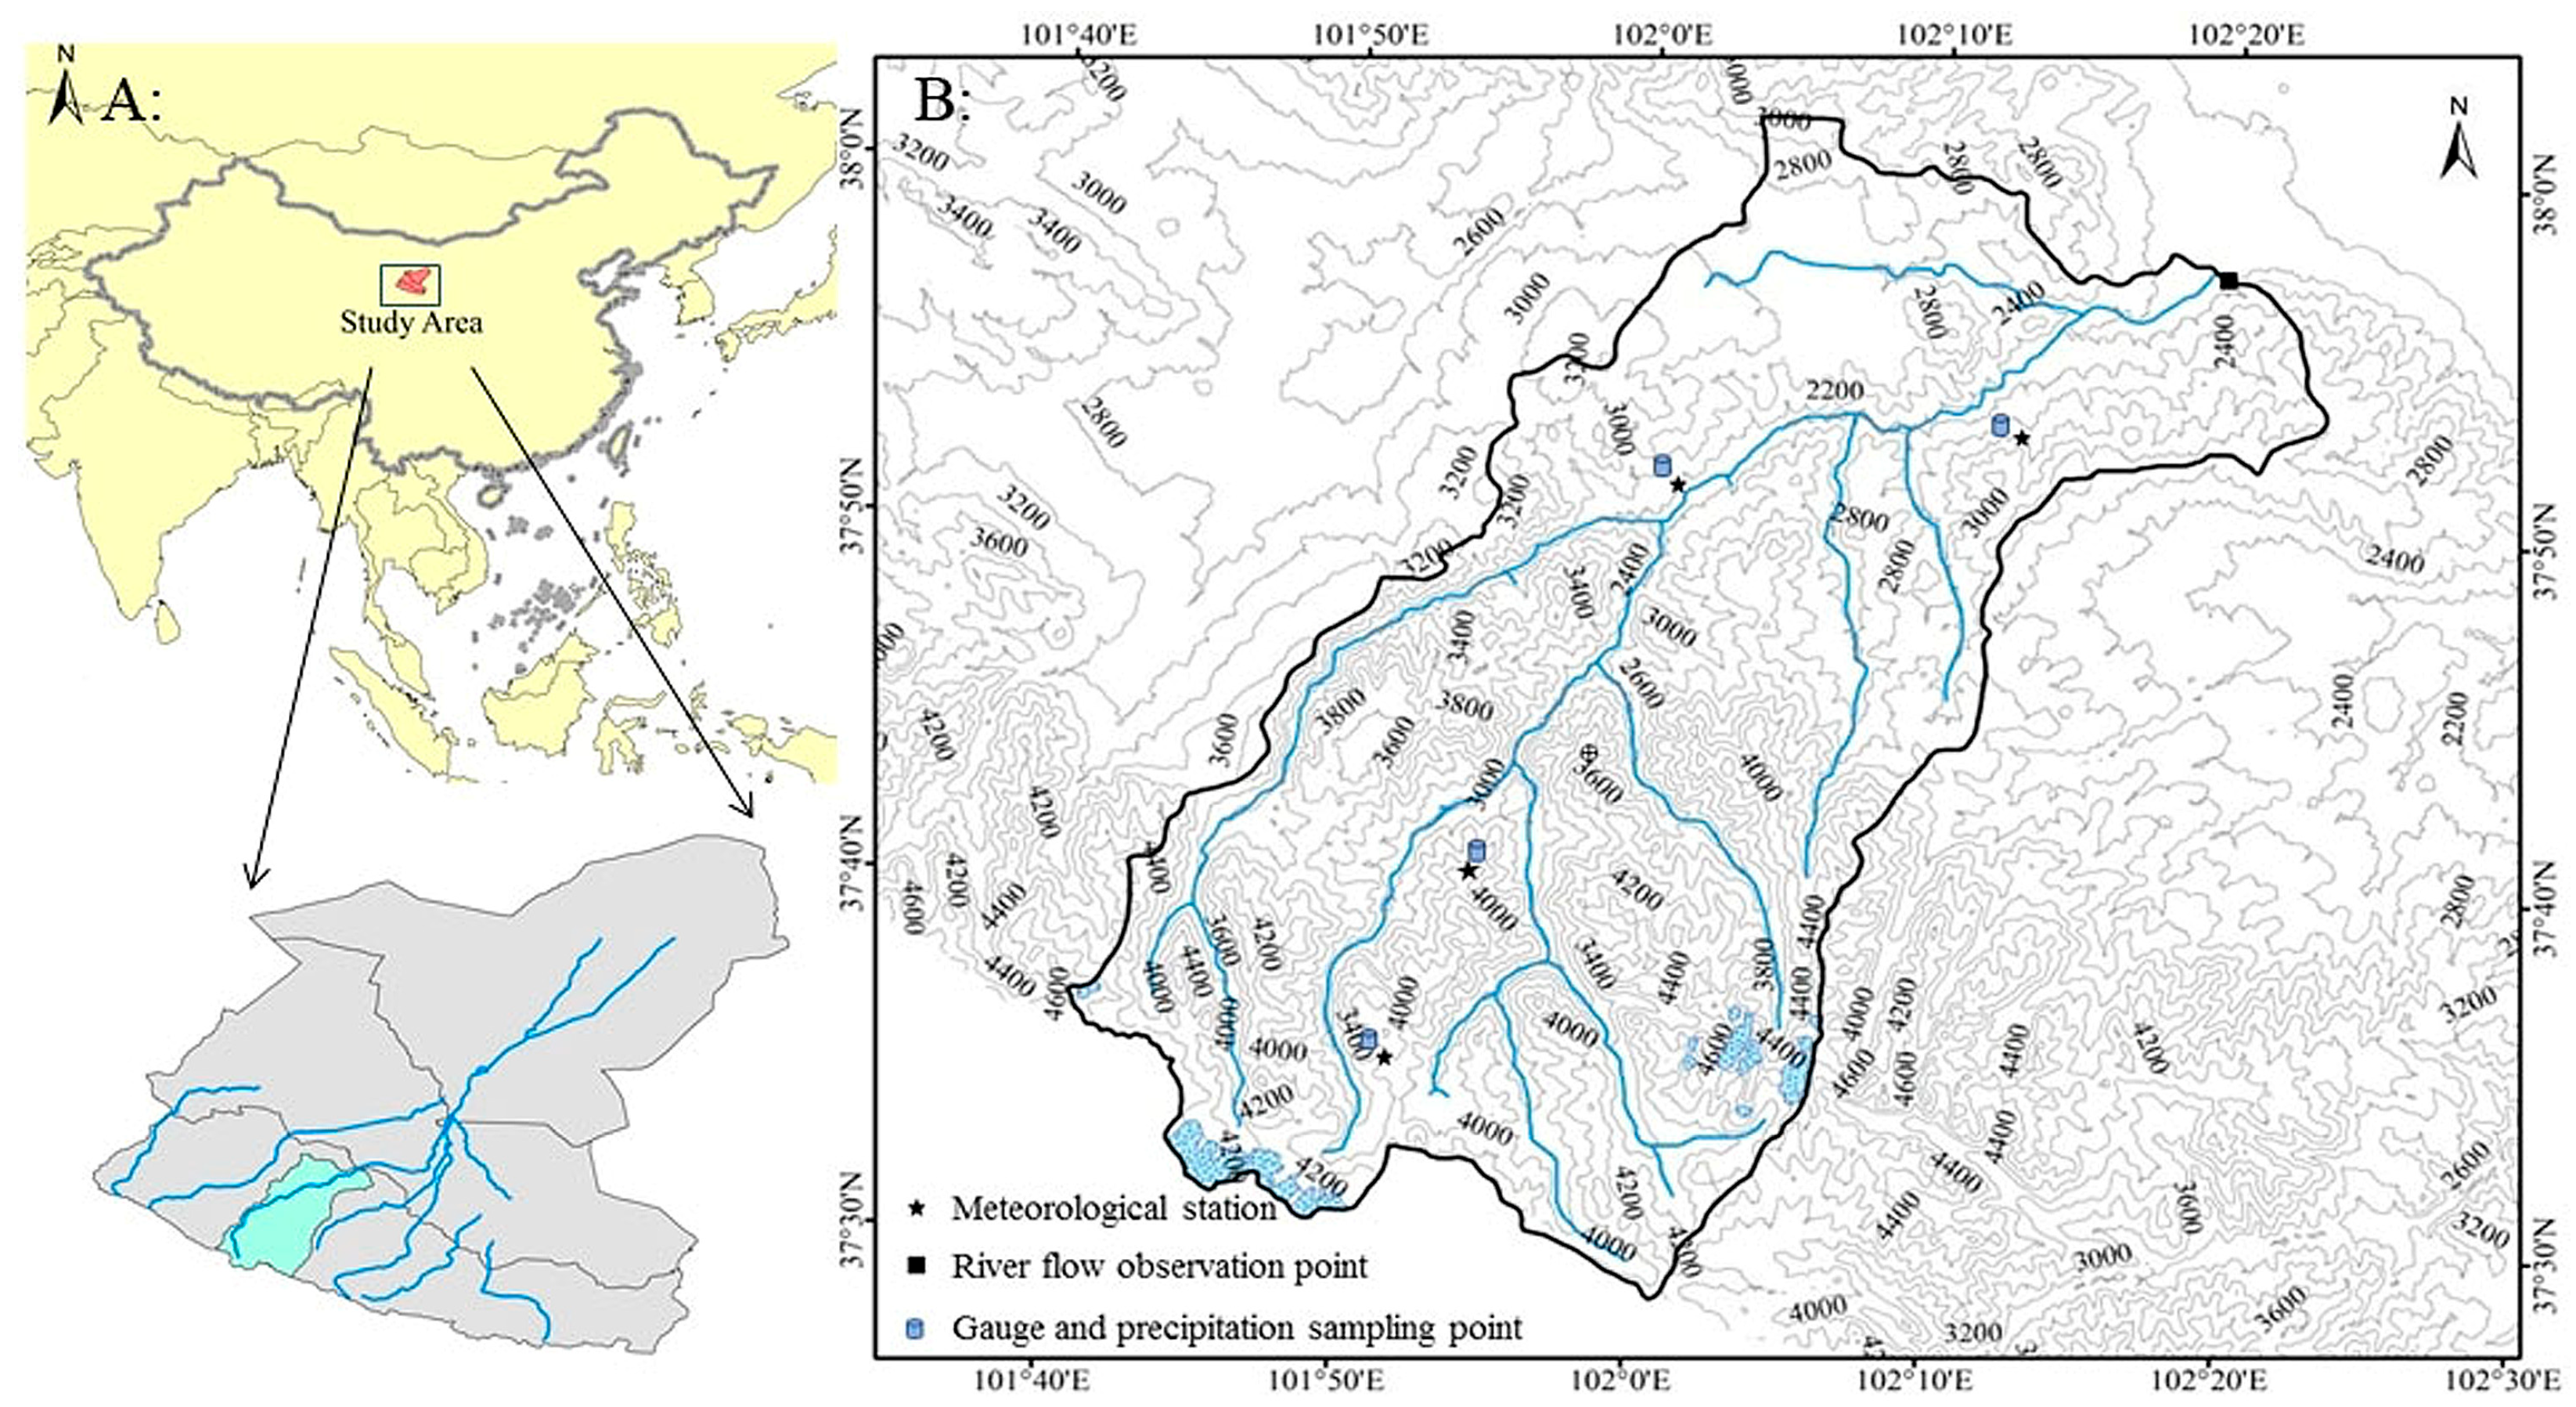
2.1. Study Area

The Xiying River watershed originates from the Lenglong Ridge in the Qilian Mountains (Figure 1), and its modern glaciers are mainly distributed in the snowline region above 4200 m above sea level (the watershed’s elevation range is 1873–4911 m) [13]. The watershed is located in the Qilian Mountains alpine semi-arid and semi-humid zone, and the development of geomorphology shows a typical internal and external camp force interaction: erosion shaped the mountainous landscape, intermountain tectonic basins, and canyon system; denudation formed the middle and low mountainous landforms and valley basin shape [14]. The climate system is a temperate continental arid climate with significant plateau climate characteristics: high intensity of solar radiation, hours of sunshine, and dramatic temperature differences between day and night, while the water-heat imbalance characteristics of precipitation are scarce and evaporation is exuberant.
Within the Shiyang River watershed, the Xiying River emerges as a critical tributary, significantly contributing to the regional hydrological system. Hydrological studies reveal that the river generates an average annual runoff of approximately 318.4 million cubic meters, representing roughly 22.3% of the total watershed runoff. It exhibits significant seasonal hydrological characteristics, with runoff primarily concentrated in the months of June–August. The water sources are mainly derived from high-mountain ice-snow meltwater and precipitation in the mountainous areas. In the upstream of the basin, there are modern glaciers covering an area of 19.8 square kilometers, with an ice reserve of 207 million cubic meters and an annual meltwater contribution of approximately 17 million cubic meters. After exiting the Xiying Gorge, the river flows into the alluvial fan-alluvial plain complex zone of the Hexi Corridor. Due to river diversion, strong seepage, and seasonal cutoff, it forms a typical surface runoff disappearance zone. To regulate water resources, a reservoir has been built at the mountain outlet of the Xiying River. Through a conduit system, it irrigates 380,000 acres of farmland in the Wuwei Oasis, supporting the regional agricultural ecosystem.

2.2. Data

Due to significant economic transformations in China during the 1970s, land use patterns underwent notable changes. Additionally, the climate, land use, and runoff data in the study area from 1976 to 2016 are continuous and reliable, facilitating long-term trend analysis. Therefore, this study selects this 40-year period as the research timeframe. The annual and monthly average runoff data (1976–2016) came from Jiutiaoling Hydrological Observatory of Xiying River. Meteorological data were obtained from Huajian Township Meteorological Station (2014–2019) and Wushaoling Meteorological Station (1976–2014) in Shiyang River Basin of Northwest Normal University, and the meteorological data of Xiying River Basin from 1976 to 2016 were obtained by linear regression method (Temperature: R = 0.9892 (p < 0.001), R2 = 0.9785; Precipitation: R = 0.8619 (p < 0.01), R2 = 0.7429). The year is divided into four meteorological seasons: spring (March–May), summer (June–August), autumn (September–November), and winter (December–February) [15]. Topographic characterization was performed using 30-m resolution Digital Elevation Model (DEM) data provided by the National Earth System Science Data Center Geospatial Data Cloud Platform (http://www.gscloud.cn) (accessed on 23 September 2024). Land use/cover change (LUCC) analysis incorporates the Chinese Academy of Sciences’ Resource and Environmental Science Data Center (RESDC) multi-temporal dataset (http://www.resdc.cn) (accessed on 26 September 2024), featuring decadal intervals (1980, 1990, 2000, 2010, 2018) at 1 km spatial resolution.

3. Method

3.1. Calculation Method of Temperature Contribution in Different Seasons

The variable Is represents the contribution of temperature changes in season s to the overall annual temperature variation. Its calculation formula is given as:
I s = T s , i T ¯ s , b Σ s ( T s , i T ¯ b ) × 100 %
where Is denotes the contribution of temperature change in the s-th season; T ¯ s , b is the baseline temperature for seasons in the reference year; T s , i is the temperature of season s in year I after the reference year; and T ¯ b is the baseline annual temperature for the Xiying River basin. The reason for calculating the importance of temperature change in each season in the annual change is to find out whether a certain season plays a greater role in the annual change than other seasons.

3.2. Calculation Method of Contribution Rate of Runoff Change

The runoff (R) is affected by precipitation (p) and temperature (T) in Xiying River, and the relationship between them can be expressed as follows:
R = R(P,T)
Multivariate regression analysis is used to study the change in runoff:
Δ R = ǝ R ǝ P Δ P + ǝ R ǝ T Δ T
where ǝRP and ǝRT are the multiple regression coefficients of precipitation and temperature, respectively, to express their contribution rate to runoff change. If the change in climate factors causes the increase in runoff, it is called a positive contribution; on the contrary, the decrease in runoff caused by climate change is called a negative contribution.

3.3. Acquisition and Interpolation of Meteorological Data

The Xiying River Basin monitoring network comprises four hydrometeorological stations generating high-temporal-resolution (15-min increment) observations. A hybrid analytical approach employing multivariate regression techniques coupled with spline interpolation algorithms was implemented to transform discrete measurement sequences into continuous temporal functions. This deterministic interpolation framework achieves full nodal conformity across all observation points while maintaining spatiotemporal coherence in hydrological process representation.

3.4. Mann–Kendall Trend Test and Mutation Test

The Mann-Kendall trend test, a nonparametric rank-based methodology, serves as a robust analytical framework for detecting monotonic trends in hydrometeorological time series while mitigating distributional assumptions [16]. The Mann–Kendall test computes the forward statistic (UF) by progressively evaluating trends from the start to each point in the series, while the backward statistic (UB) assesses trends in reverse from the end toward each point, enabling detection of trend directions and potential change points. If UF > 0, it indicates that the data series is increasing. If UF < 0, the data series shows a downward trend. Suppose the trends of UF and UB intersect, and the intersection does not exceed the significance limit. In that case, the value corresponding to the intersection position’s abscissa is the moment of sudden change in runoff.

3.5. Analysis on the Dynamic Change in Land Use and Transfer of Land Use Types

(1)
Dynamic change in land use
This paper studies the land change situation through two indicators: land use change quantity and change range. Change quantity refers to the difference in area change in a certain land use type in the two periods before and after; change range: the change rate represents a critical metric in landscape dynamics analysis, quantitatively expressing the magnitude of land use transitions within a defined spatial context [17]. The calculation formula is:
ΔS = Sb − Sa
K = (Sb − Sa)/Sa × 100%
where Sa and Sb represent the area quantity (km2) of a certain land use type at the initial and final stages of the study; ΔS and K indicate the change in quantity and change range of area of a certain land use type during the study period.
(2)
Analysis of land use type transfer
This study employs transition matrix analysis to systematically quantify land cover transformation dynamics in the Xiying River Basin (1980–2018) through geospatial computation. Using ArcGIS Pro’s advanced raster processing tools, we conducted multi-temporal overlay of classified land use layers to map bidirectional conversions between categories. The matrix delineates three critical aspects: transition probabilities between land classes, net spatial flux between competing land uses, and long-term stability metrics for unchanged areas.

4. Results

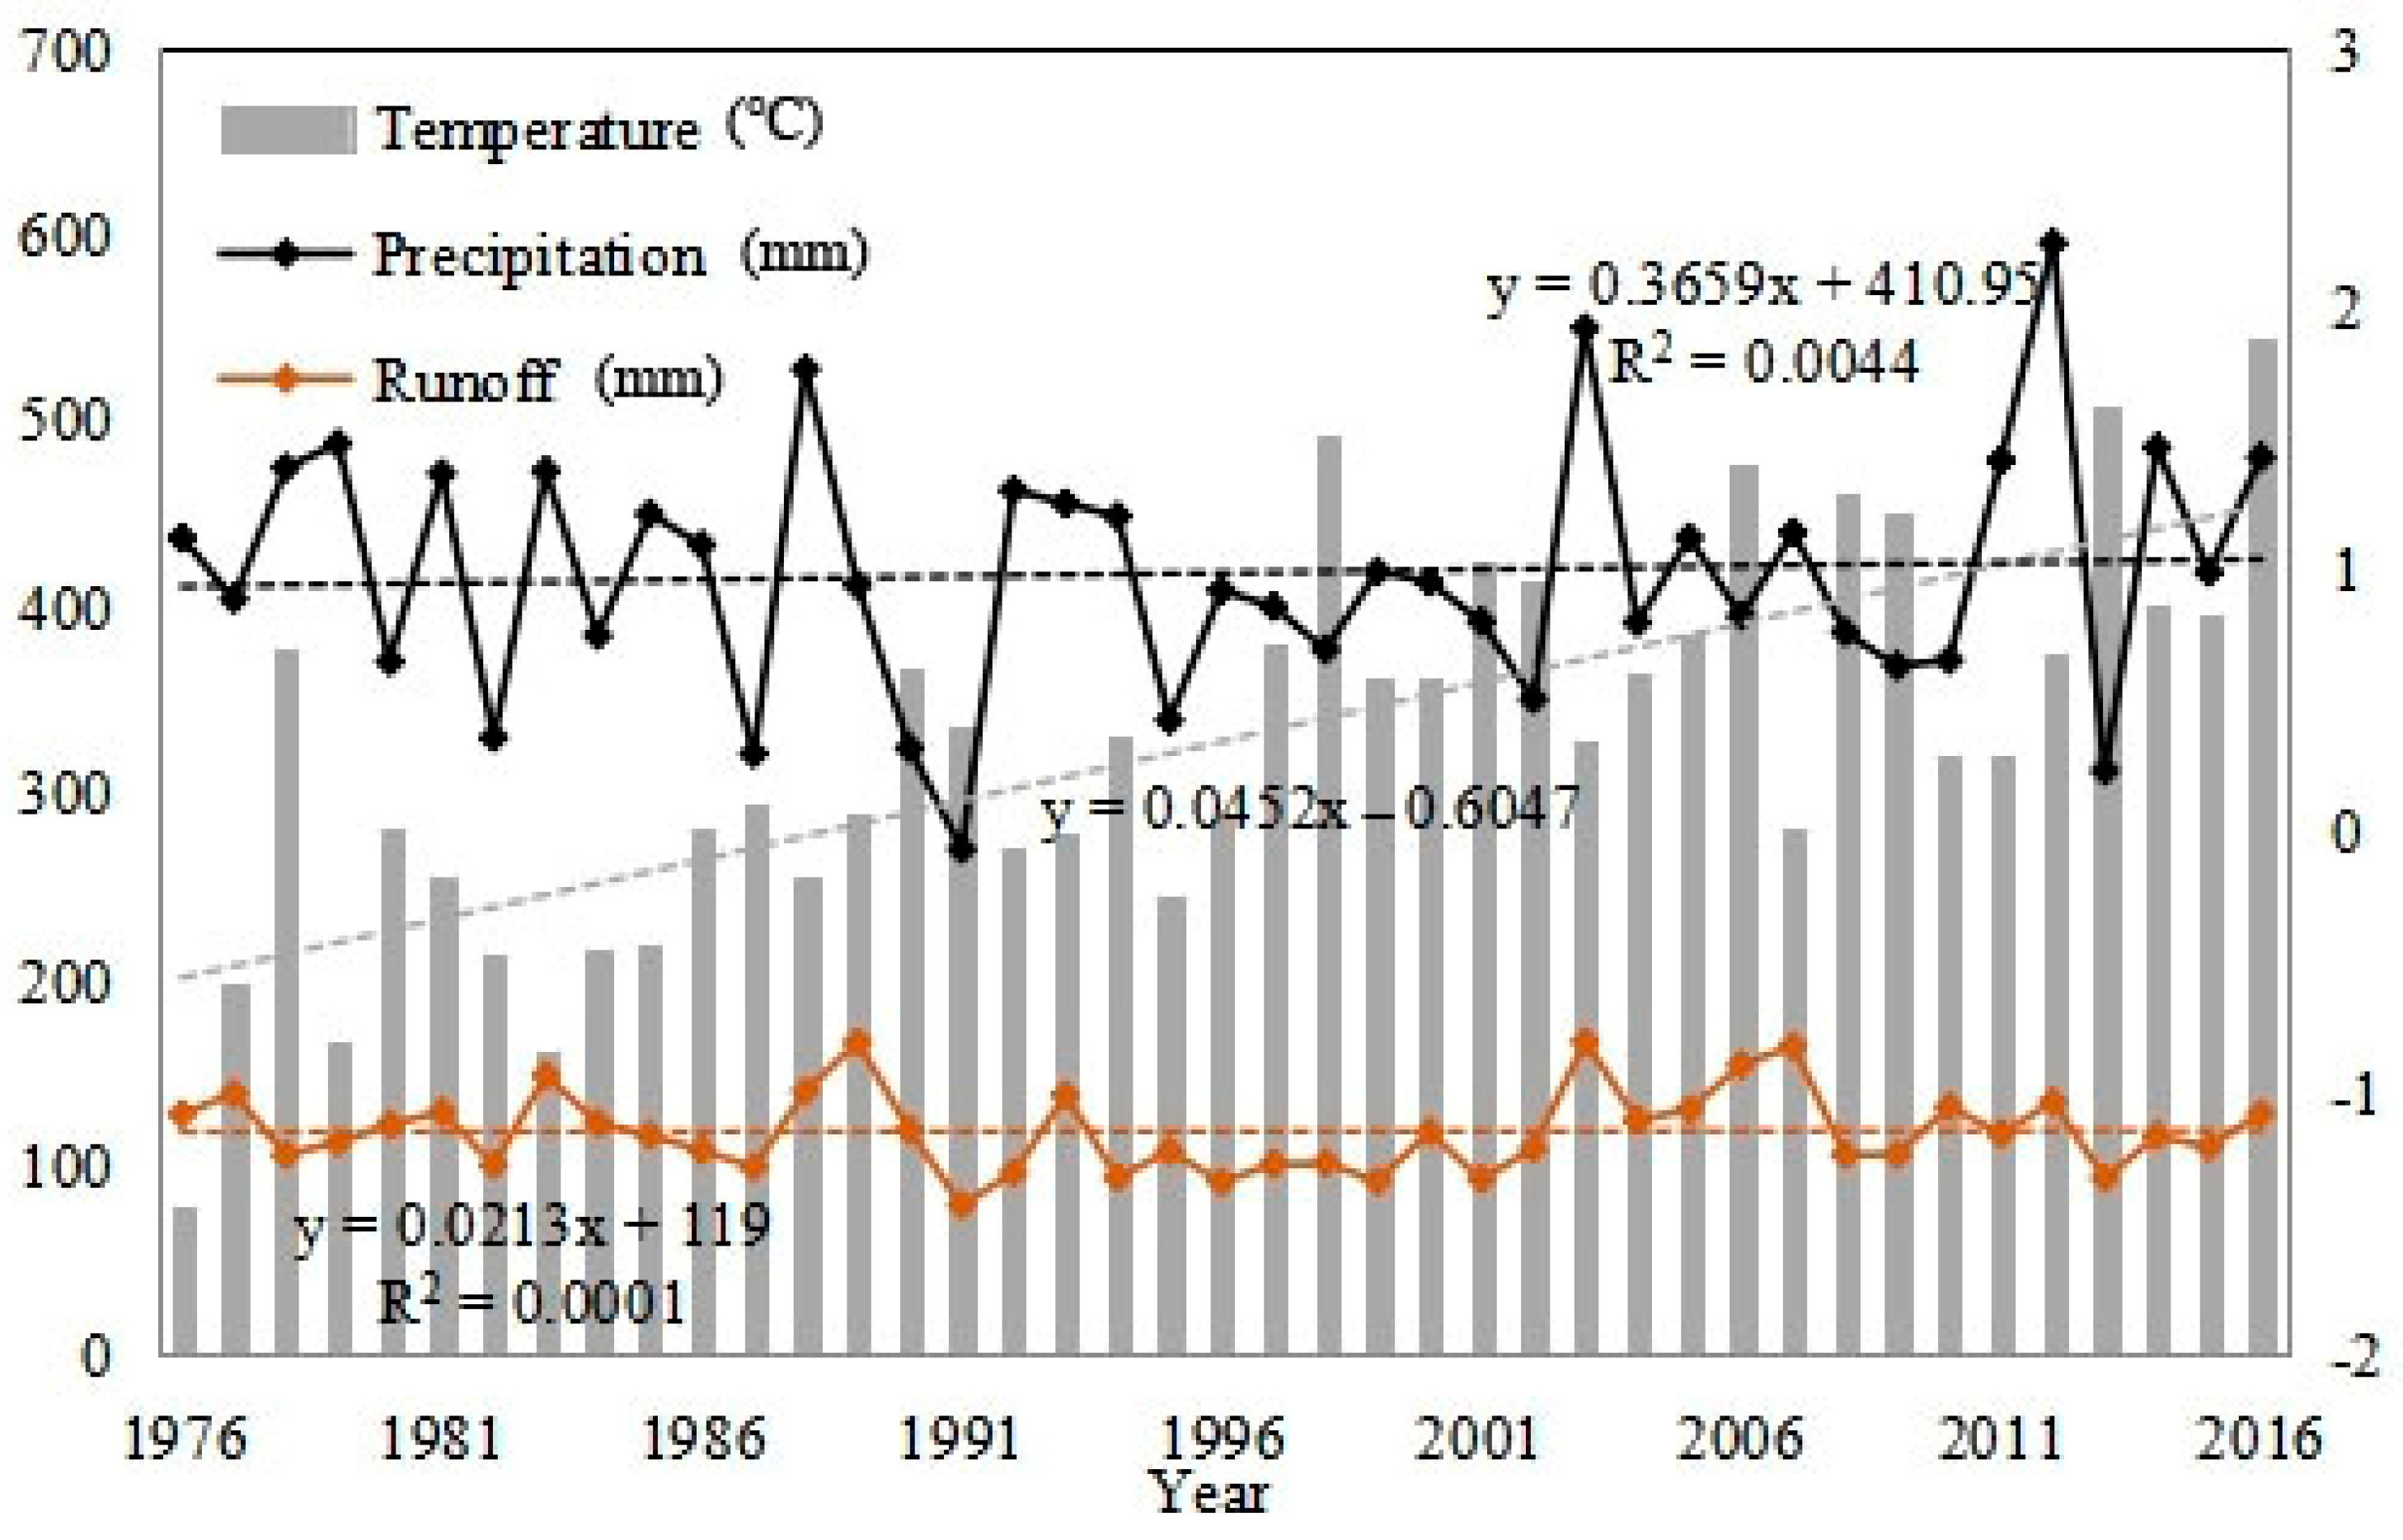
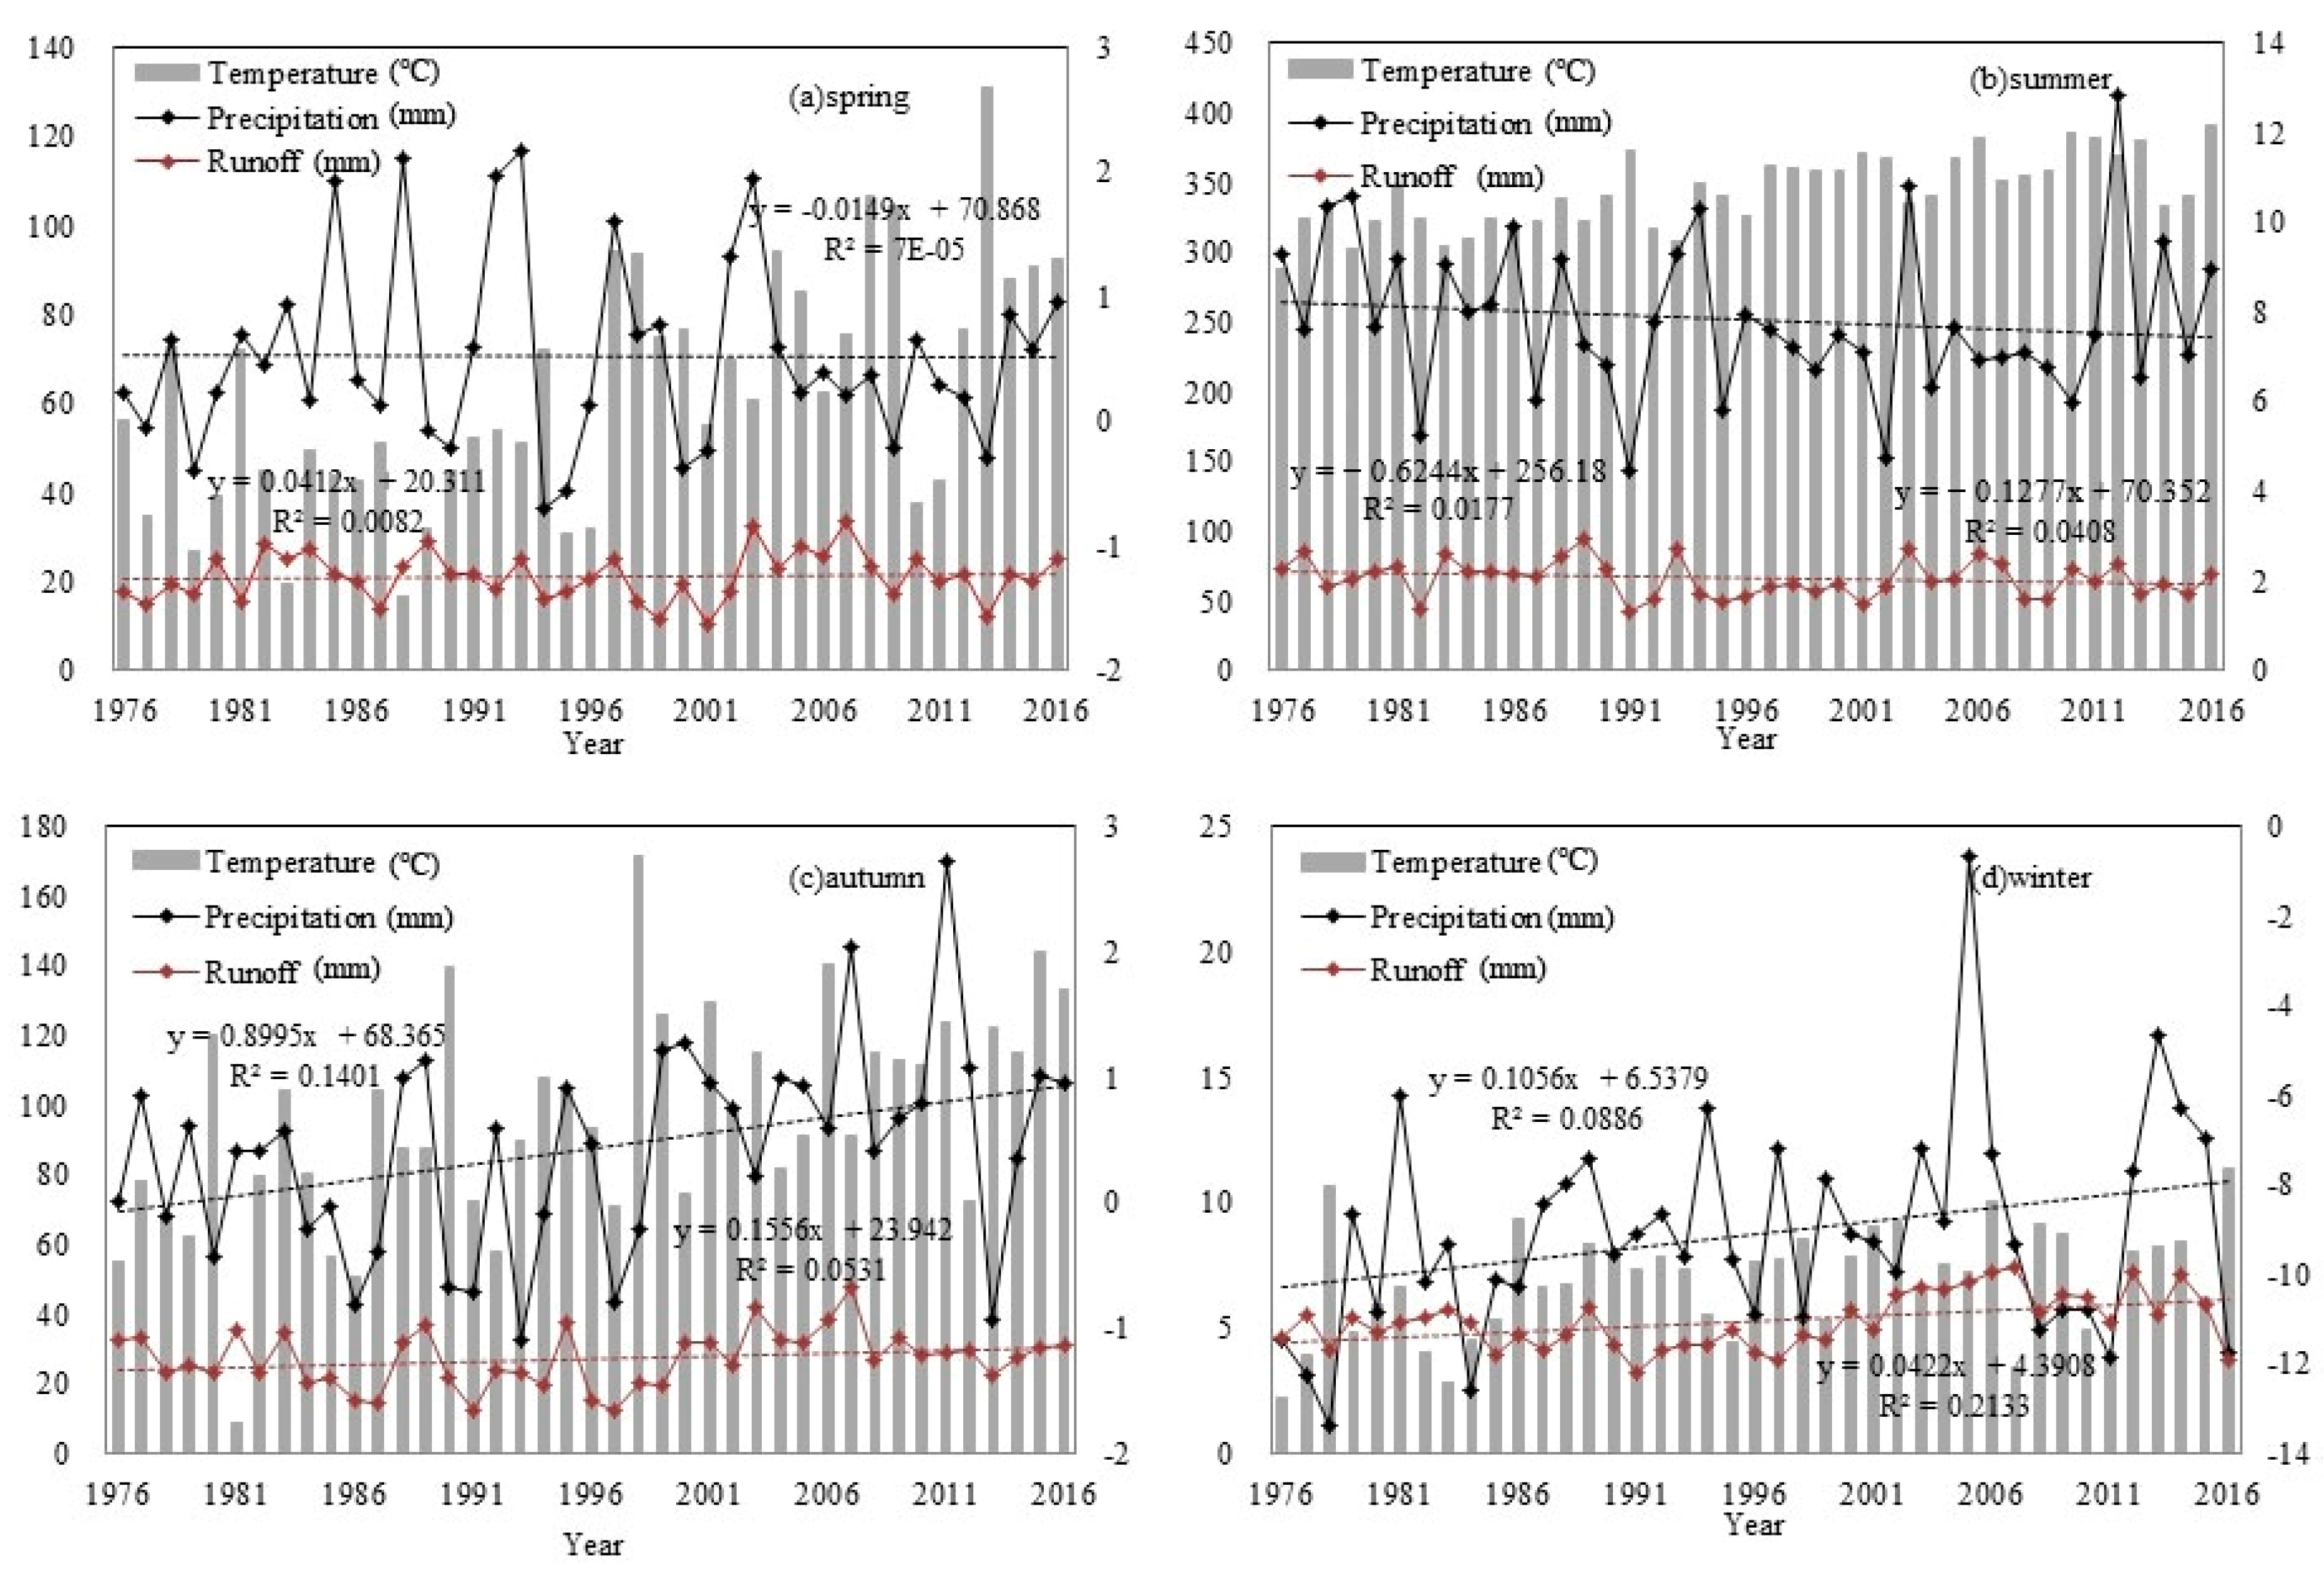
4.1. Changes of Hydrological and Climatic Factors in Xiying River

Analysis using the Mann-Kendall trend test and abrupt change detection (as shown in Figure 2) reveals that temperature variations in the Xiying River Basin display distinct phase-specific patterns: the average annual temperature significantly decreased during the period from 1976 to 1980, while the temperature series from 1981 to 2016 indicated a warming trend, but the statistical analysis did not demonstrate statistical significance at the conventional 5% significance level. The Mann–Kendall abrupt change analysis identified a statistically significant breakpoint (p < 0.01) in the Xiying River Basin’s thermal regime during 2005, marked by the intersection of forward (UFk) and backward (UBk) statistic curves exceeding critical thresholds (α = 0.05). Post-breakpoint diagnostics revealed a 1.8 °C/decade warming rate, surpassing pre-2005 trends by 240%. Mutation analysis of precipitation characteristics indicated that the annual precipitation series experienced multiple mutation points in 2010, 2014, and 2016. The Mann–Kendall trend test results for the runoff series showed that while the runoff exhibited a weak upward trend from 1976 to 2016, it did not reach statistical significance. Further verification using the sliding T-test and the Cramér-von Mises criterion confirmed that no structural mutation occurred in the runoff series during the study period.
Based on the hydrological and meteorological data analysis of the Xiying River Basin from 1976 to 2016 (Figure 3), the key characteristics of temperature change are as follows: The mean annual temperature in the study area is 0.34 °C, exhibiting a pronounced warming trend. The calculated climate tendency rate is 0.45 °C per decade, with a notably accelerated increase observed after the year 2000. The annual precipitation average is 418.63 mm, presenting a fluctuating upward trend with a climate tendency rate of 3.66 mm per decade. The annual runoff depth series exhibits a weak upward trend, and extreme hydrological event analysis reveals that 1991 was an extreme drought year (runoff depth of 79.80 mm), while 2003 was an extreme flood year (runoff depth of 167.48 mm).
Seasonal analysis indicates that average temperatures have risen across all seasons, with the most pronounced warming occurring in summer, followed by spring (see Figure 4, Table 1). The contribution analysis revealed that temperature changes in spring, summer, autumn, and winter accounted for 30%, 33%, 21%, and 16% of the annual temperature variation, respectively. It can be seen that the increase in summer temperature contributed the most to the increase in annual average temperature.
Statistical analysis of precipitation trends from 1976 to 2016 revealed that autumn in the Xiying River region exhibited a notably higher increasing trend, with a rate of 9.00 mm per decade, compared to other seasons. The M-K trend test results further showed that the precipitation increased significantly in autumn from 1960 to 2016 in the Xiying River.
The trend analysis of runoff data from 1976 to 2016 showed that the runoff change rate in summer and autumn was obviously faster than in spring and winter in recent years. The runoff in spring and winter was relatively stable (Figure 4). Autumn runoff showed a clear increasing trend, but the annual runoff change was not significant because runoff in the wettest season (summer) showed a decreasing trend.
The monthly variation in the average temperature from 1976 to 2016 is illustrated in Figure 5. The temperature rose from January to July, reached the peak value (11.76 °C) in July, and then decreased month by month in the Xiying River. The lowest average temperature appeared in January, and its temperature was lower than 0 °C. Precipitation demonstrates pronounced intra-annual variability, with over 80% of annual totals concentrated during the May–September hydrological season. The hydrological regime demonstrates marked interannual phase shifts, with 90.78% of annual runoff concentrated in the April–October hydrological season following seasonal precipitation resurgence.

4.2. Correlation of Hydrological and Climatic Factors in the Xiying River

To assess the impacts of temperature and precipitation on runoff dynamics, a statistical analysis was conducted to quantify their correlations across monthly, seasonal, and interannual timescales, and the results are shown in Table 2.
Interannual hydrological dynamics exhibit significant covariance with precipitation (direct association) and temperature (inverse relationship). Under the condition of constant temperature, with the increase in precipitation, the runoff increased. Under conditions of constant precipitation, as temperature increases, both the evaporation rate of water molecules and the melting rate of ice and snow increase. However, since the evaporation rate exceeds the melting rate of ice and snow, this results in a decrease in runoff.
In spring, summer, and winter, the runoff was positively correlated with precipitation and negatively correlated with temperature. In autumn, the runoff was positively correlated with precipitation and temperature, and the evaporation rate of water molecules was lower than the melting rate of ice and snow, which led to an increase in runoff.
On the monthly scale, there was a significant positive correlation between precipitation and runoff from June to September, indicating that runoff increased with the increase in precipitation, and the amount of precipitation in flood season determined the annual runoff. A notable positive correlation was observed between runoff and temperature from January to May and September to November. This may be attributed to the gradual rise in temperatures during these periods, which accelerates the melting of ice and snow. Additionally, weaker evaporation during this time likely contributes to increased runoff; summer runoff exhibited a statistically significant inverse relationship (p < 0.05) with temperature anomalies during the June–August ablation season [18]. During this period, the temperature rose, evaporation was strong, and water loss was fast, which was not conducive to the formation of confluence and the increase in runoff.

4.3. Land Use Change in Xiying River

The Xiying River Basin’s land cover composition is dominated by forestland, grassland, and unused land, with limited distributions of cultivated land, construction land, and water area (Figure 6). Over the period of 1980–2010, changes in land use areas were relatively stable, and the proportion of the three main land use types relative to the total basin area exhibited minimal temporal variability. From 1980 to 2018, the change in land use structure in the basin was not significant, and the proportion of cultivated land showed an upward trend, which was 2.10% and 2.43% in turn. The area of forestland was on the rise, accounting for 21.68% and 22.31%, respectively. Grassland percentage decreased from 59.16% to 58.28%, indicating a slight decline. Similarly, construction land percentage declined from 0.18% to 0.06%. Water area and unused land experienced minimal changes.
Table 3 presents the land use type area transfer matrix from 1980 to 2018. Grassland was the predominant source of land use change during this period. Specifically, 181.88 km2 of grassland transitioned to forestland, accounting for an 18.0% conversion rate; 95.85 km2 converted to unused land (9.47%), and 24.24 km2 shifted to cultivated land (2.39%). Conversely, cultivated land transitioned to grassland and forestland with areas of 22.04 km2 and 3.12 km2, representing transfer rates of 72.14% and 10.21%, respectively. Construction land mainly converted to grassland (22.04 km2, 98.21%) and a minor portion to cultivated land (3.12 km2, 1.79%). Forestland exhibited transitions to grassland (166.5 km2, 48.17%), cultivated land (5.66 km2, 1.64%), and unused land (6.25 km2, 1.81%). Water bodies primarily transitioned to grassland (1.96 km2, 95.61%) and, to a lesser extent, unused land (0.06 km2, 2.93%). Lastly, unused land was converted to grassland (91.06 km2, 33.98%), forestland (6.39 km2, 2.38%), and water area (1.91 km2, 0.71%).

5. Discussion

5.1. Influence of Temperature on Runoff Change in Xiying River

In the alpine region, temperature regulated river runoff by affecting the intensity of ice-snow ablation and evaporation [19]. According to the correlation analysis results between temperature and runoff in the Xiying River (Table 2), there was a significant correlation between annual runoff and temperature, showing a positive correlation in autumn and a negative correlation in spring, summer, and winter.
As a crucial contributor to runoff, ice and snow meltwater is highly sensitive to climate change. In alpine regions, there is typically a negative correlation between glacier- and snow-covered area and temperature [20]. Moreover, glacier and snow areas respond more sensitively to maximum temperatures than to average or minimum temperatures. The Xiying River originates from Lenglongling in the Qilian Mountains, an area characterized by forest grasslands, glaciers, and snowfields. Ice and snow meltwater serves as a vital source of runoff for the river [21]. Since May, the temperature gradually rose, and the glacier snow began to melt, making the runoff show a slightly increasing trend. Summer energetic forcing in the Xiying River Basin drives elevated evaporative demand that suppresses runoff generation, with peak flood season (July–August) discharge demonstrating significant inverse correlation to thermal stress through snowmelt contribution depletion mechanisms [22].

5.2. Influence of Precipitation on Runoff Change in the Xiying River

As the primary contributor to river discharge, precipitation serves as the dominant governing factor for runoff generation in hydrological systems [23]. Statistical analysis revealed a strong hydrological linkage between precipitation patterns and discharge dynamics within the Xiying River basin, with precipitation demonstrating a statistically significant positive correlation to interannual runoff variability (Table 2). It can be seen from Figure 5 that the annual distribution law of precipitation and runoff was consistent. In the month with abundant precipitation, the runoff was relatively large, while in the month with little precipitation, the runoff was small, which further indicated that the fluctuation of precipitation in the basin was an important factor causing the runoff change. The Xiying River Basin exhibits concentrated precipitation seasonality, with May–September rainfall constituting over 80% of annual totals and corresponding discharge representing equivalent proportions of yearly streamflow volumes. Combining the results of correlation analysis (Table 3) and contribution rate analysis (Table 4). Precipitation exerts dominant control over interannual runoff variability in the Xiying River Basin, primarily through its May–September peak precipitation phase. Therefore, the precipitation was an important factor affecting the change in annual runoff in the Xiying River.

5.3. Influence of Land Use Change on Runoff Change

Land use/land cover change dynamics critically modulate surface runoff generation through alterations in infiltration capacity and evapotranspiration partitioning mechanisms [24,25,26]. Under scenarios of changing climate and internal vegetation conditions, hydrological effects can be significantly altered even when land use changes in specific regions or watersheds are minimal. In the Xiying River Basin, the net changes in dominant land cover types (forestland/grassland/unused land) were very small, and the impact of land use change on runoff is not significant. One possible explanation is that the uncertainties in the land use change module of hydrological models, such as SWAT, are not able to identify the impacts of subtle land use changes on runoff.
The cumulative slope rate of change comparison method is a statistical approach for quantitative analysis of multi-factor contributions to target variables. Compared to other methods, the cumulative slope rate of change comparison method has certain physical mechanisms and requires relatively low sample sizes. Quantitative attribution analysis using the cumulative slope rate of change comparison method reveals that land use/land cover change (LUCC) contributed +17.49% to runoff changes, with impact mechanisms showing distinct spatial heterogeneity characteristics. Specifically, grassland-to-forestland conversion reduces runoff generation by increasing vegetation interception and evapotranspiration, while grassland-to-unused land conversion increases surface runoff due to surface hardening and reduced vegetation cover. Although these two conversion processes have counteracting hydrological effects, grassland-to-unused land conversion dominates overall due to differences in conversion scale, spatial distribution, and temporal sequences, resulting in a net positive contribution from LUCC.
Precipitation change is the dominant factor driving runoff increase (+62.7%), which aligns with fundamental hydrological principles. Notably, LUCC (+17.49%) and temperature effects (+19.81%) exhibit significant synergistic amplification effects on runoff changes. Temperature rise enhances runoff supply through accelerated snow and ice melting on one hand and affects infiltration processes by altering soil freeze-thaw cycles on the other hand, while LUCC further regulates the intensity and spatiotemporal distribution of these processes by modifying surface roughness and soil structure. This synergistic effect results in a total contribution of the three factors (99.99%) approaching 100%, indicating that the constructed attribution framework has good explanatory power.

5.4. Uncertainty Analysis

Uncertainties inherent in the study constrain the precision of quantitative attribution of runoff changes in the Siereng River basin. The main reasons include: (1) The use of temperature and precipitation alone as climate drivers, while necessary to isolate dominant factors, ignores the potential influence of other meteorological variables (e.g., radiation, wind speed, humidity) on evapotranspiration and the overall water balance. This simplification may underestimate the complexity of climate-runoff interactions [27]. (2) Limitations in data availability and quality introduce uncertainty. Classification uncertainties inherent in remotely sensed-derived land use/cover change (LUCC) data affect the accuracy of quantifying LUCC impacts on hydrologic processes [28,29]. Despite these uncertainties, reliable model performance and the identification of clear trends provide valuable insights for analyzing the important relative roles of temperature, precipitation, and LUCC changes on runoff.

6. Conclusions

(1)
Runoff in the Xiying River demonstrated a modest upward trajectory over the observed period. Among them, the autumn runoff showed a significantly increasing trend; the annual runoff change trend was not significant because the runoff change trend in the wet season (summer) was not significant.
(2)
From 1976 to 2016, the annual average temperature showed an upward trend in the Xiying River Basin, especially since 2000. Seasonal temperature trends indicated a consistent warming pattern, with summer temperature increases contributing most significantly—approximately 33%—to the annual mean temperature rise. Basin-wide annual precipitation exhibited fluctuating characteristics with a progressive increasing trend, characterized by statistically significant precipitation increments across all seasonal periods.
(3)
The land use types were mainly forestland, grassland, and unused land in the Xiying River, and the change in land use structure was not significant. Land use composition demonstrated a dynamic transformation, with cultivated land and forestland proportions progressively increasing, while grassland and construction land percentages simultaneously declined. Water area and unused land exhibited minimal morphological alterations. Expanding forestland coupled with reduced grassland and construction land areas progressively amplified the watershed’s water conservation capacity, subsequently diminishing runoff production potential and potentially modulating future hydrological dynamics.
(4)
On the interannual scale, the distribution law of precipitation and runoff was consistent. The influence of precipitation on runoff mainly occurred from May to September, when precipitation was relatively abundant. During cold-season periods (spring and winter), temperature emerged as the dominant control on runoff variability, exhibiting a statistically significant correlation with discharge patterns compared to precipitation’s marginal influence. This regime shift coincided with sustained positive temperature anomalies driving cryospheric melt contributions, where thermal forcing-initiated meltwater generation from glaciers and seasonal snowpack. At this time, evaporation was weak, which led to the increase in runoff in the Xiying River.

Author Contributions

Methodology, J.P.; Writing—original draft, P.Y.; Writing—review & editing, Q.W.; Visualization, J.W.; Supervision, G.Z. All authors have read and agreed to the published version of the manuscript.

Funding

This research was financially supported by the 2024 Gansu Provincial Water Resources Science Experimental Research and Technology Promotion Project (24GSLK020).

Data Availability Statement

Annual and monthly runoff data (1976–2016) are available from the Jiutiaoling Hydrological Observatory, Xiying River. Meteorological data were sourced from the Huajian Township Meteorological Station (2014–2019) and Wushaoling Meteorological Station (1976–2014), Shiyang River Basin, with missing Xiying River Basin data (1976–2016) reconstructed using linear regression. A 30 m-resolution DEM was obtained from the Geographic Data Cloud Sharing Platform (http://www.gscloud.cn/) (accessed on 23 September 2024). Land use data (1980, 1990, 2000, 2010, 2018) are accessible via the Resource and Environmental Science Data Center, CAS (http://www.resdc.cn) (accessed on 26 September 2024).

Conflicts of Interest

The authors declare no conflict of interest. We hereby certify that the manuscript titled “Hydrological Response to Climate Change and Anthropogenic Land Use Variations in the Xiying River Basin” constitutes original scholarly work that has neither been published previously nor is currently under editorial review by any other peer-reviewed journal. To the best of our knowledge, no conflicts of interest—financial, personal, or professional—exist that could be perceived as influencing the objectivity of this research or its conclusions.

References

  1. Laurent, L.; Ullmann, A.; Castel, T. How Have Atmospheric Components of the Local Water Cycle Changed around the Abrupt Climatic Shift over France? J. Hydrol. 2024, 645, 132211. [Google Scholar] [CrossRef]
  2. Arnell, N.W.; Gosling, S.N. The Impacts of Climate Change on River Flow Regimes at the Global Scale. J. Hydrol. 2013, 486, 351–364. [Google Scholar] [CrossRef]
  3. Wang, Y.; Ye, A.; Zhang, Y.; Yang, F. The Quantitative Attribution of Climate Change to Runoff Increase over the Qinghai-Tibetan Plateau. Sci. Total Environ. 2023, 897, 165326. [Google Scholar] [CrossRef]
  4. Ni, Y.; Yu, Z.; Lv, X.; Qin, T.; Yan, D.; Zhang, Q.; Ma, L. Spatial Difference Analysis of the Runoff Evolution Attribution in the Yellow River Basin. J. Hydrol. 2022, 612, 128149. [Google Scholar] [CrossRef]
  5. Liang, S.; Wang, W.; Zhang, D.; Li, Y.; Wang, G. Quantifying the Impacts of Climate Change and Human Activities on Runoff Variation: Case Study of the Upstream of Minjiang River, China. J. Hydrol. Eng. 2020, 25, 05020025. [Google Scholar] [CrossRef]
  6. Xu, J.; Chen, Y.; Ji, M.; Lu, F. Climate Change and Its Effects on Runoff of Kaidu River, Xinjiang, China: A Multiple Time-Scale Analysis. Chin. Geogr. Sci. 2008, 18, 331–339. [Google Scholar] [CrossRef]
  7. Xu, J.; Chen, Y.; Li, W.; Yang, Y.; Hong, Y. An Integrated Statistical Approach to Identify the Nonlinear Trend of Runoff in the Hotan River and Its Relation with Climatic Factors. Stoch. Environ. Res. Risk Assess. 2011, 25, 223–233. [Google Scholar] [CrossRef]
  8. Li, Z.; Qi, F.; Wang, Q.J.; Song, Y.; Li, J.; Li, Y.; Wang, Y. Quantitative Evaluation on the Influence from Cryosphere Meltwater on Runoff in an Inland River Basin of China. Glob. Planet. Change 2016, 143, 189–195. [Google Scholar] [CrossRef]
  9. Xiong, L.; Yu, K.; Zhang, H.; Zhang, L. Annual Runoff Change in the Headstream of Yangtze River and Its Relation to Precipitation and Air Temperature. Hydrol. Res. 2013, 44, 850–874. [Google Scholar] [CrossRef]
  10. Tian, J.; Guo, S.; Yin, J.; Pan, Z.; Xiong, F.; He, S. Quantifying Both Climate and Land Use/Cover Changes on Runoff Variation in Han River Basin, China. Front. Earth Sci. 2022, 16, 711–733. [Google Scholar] [CrossRef]
  11. Deng, X.; Shi, Q.; Zhang, Q.; Shi, C.; Yin, F. Impacts of Land Use and Land Cover Changes on Surface Energy and Water Balance in the Heihe River Basin of China, 2000-2010. Phys. Chem. Earth 2015, 79–82, 2–10. [Google Scholar] [CrossRef]
  12. Hu, J.; Wu, Y.; Wang, L.; Sun, P.; Zhao, F.; Jin, Z.; Wang, Y.; Qiu, L.; Lian, Y. Impacts of Land-Use Conversions on the Water Cycle in a Typical Watershed in the Southern Chinese Loess Plateau. J. Hydrol. 2021, 593, 125741. [Google Scholar] [CrossRef]
  13. Sun, M.; Liu, S.; Yao, X.; Guo, W.; Xu, J. Glacier Changes in the Qilian Mountains in the Past Half-Century: Based on the Revised First and Second Chinese Glacier Inventory. J. Geogr. Sci. 2018, 28, 206–220. [Google Scholar] [CrossRef]
  14. Yang, J.; Zheng, W.; Wang, Y.; Bi, H.; Zhang, D.; Zhang, P.; Chen, G.; Wang, W. Quantitative Geomorphological Constraints on the Landform Evolution of the Current Active Boundary of the Northeastern Tibetan Plateau. Geomorphology 2020, 358, 107120. [Google Scholar] [CrossRef]
  15. Guo, X.; Wang, L.; Ma, F.; Tankpa, V.; Jiang, X.; Li, Z. Pathway Analysis to Quantify the Relationship between Runoff and Meteorological Factors in Re-Identifying Seasonality throughout the Ashi River Watershed, Northeast China. Theor. Appl. Climatol. 2021, 143, 1047–1061. [Google Scholar] [CrossRef]
  16. Characteristics Analysis of Spatial and Temporal Variation on Extreme Weather Events in Anhui Province for Recent 50 Years | Natural Hazards. Available online: https://link.springer.com/article/10.1007/s11069-017-2995-z (accessed on 23 May 2025).
  17. Moisa, M.B.; Busha Hinkosa, L.; Negasa, G.F.; Olika, G.; Ijigu, T.E.; Wedajo, Y.N. GIS and Remote Sensing Based Analysis of Land Use and Land Cover Change in the Upper Anger Watershed, Western Ethiopia. Geol. Ecol. Landsc. 2025, 9, 542–551. [Google Scholar] [CrossRef]
  18. Deng, H.; Chen, Y.; Wang, H.; Zhang, S. Climate Change with Elevation and Its Potential Impact on Water Resources in the Tianshan Mountains, Central Asia. Glob. Planet. Change 2015, 135, 28–37. [Google Scholar] [CrossRef]
  19. Hao, G.; Li, J.; Li, K.; Huang, K.; Song, J.; Li, H. Improvement and Application Research of the SRM in Alpine Regions. Environ. Sci. Pollut. Res. 2019, 26, 36798–36811. [Google Scholar] [CrossRef]
  20. Verma, A.; Kumar, A.; Tiwari, S.K.; Bhambri, R.; Sain, K.; Rai, S.K.; Patidar, P. Heterogeneity in Glacio-Hydrological Processes and Estimation of Different Components in Streamflow from Central Himalayan Glaciers. J. Hydrol.-Reg. Stud. 2023, 49, 101495. [Google Scholar] [CrossRef]
  21. Feng, L.; Yang, D.; Huang, Y. Analysis of Runoff Characteristics and Contribution Rate in Xiying River Basin in the Eastern Qilian Mountains. E3S Web Conf. 2019, 136, 04014. [Google Scholar] [CrossRef]
  22. Lin, X.; Zhu, G.; Qiu, D.; Ye, L.; Liu, Y.; Jiao, Y.; Wang, L.; Zhao, K.; Zhang, W.; Liu, J.; et al. Climate and Landscape Control of Runoff Stable Isotopes in the Inland Mountain. J. Hydrol. Reg. Stud. 2024, 51, 101633. [Google Scholar] [CrossRef]
  23. Lutz, A.F.; Immerzeel, W.W.; Shrestha, A.B.; Bierkens, M.F.P. Consistent Increase in High Asia’s Runoff Due to Increasing Glacier Melt and Precipitation. Nat. Clim. Change 2014, 4, 587–592. [Google Scholar] [CrossRef]
  24. Anache, J.A.A.; Flanagan, D.C.; Srivastava, A.; Wendland, E.C. Land Use and Climate Change Impacts on Runoff and Soil Erosion at the Hillslope Scale in the Brazilian Cerrado. Sci. Total Environ. 2018, 622–623, 140–151. [Google Scholar] [CrossRef] [PubMed]
  25. Wang, X.; He, K.; Dong, Z. Effects of Climate Change and Human Activities on Runoff in the Beichuan River Basin in the Northeastern Tibetan Plateau, China. Catena 2019, 176, 81–93. [Google Scholar] [CrossRef]
  26. Wang, D.; Yu, X.; Jia, G.; Wang, H. Sensitivity Analysis of Runoff to Climate Variability and Land-Use Changes in the Haihe Basin Mountainous Area of North China. Agric. Ecosyst. Environ. 2019, 269, 193–203. [Google Scholar] [CrossRef]
  27. Yang, D.; Sun, F.; Liu, Z.; Cong, Z.; Ni, G.; Lei, Z. Analyzing Spatial and Temporal Variability of Annual Water-Energy Balance in Nonhumid Regions of China Using the Budyko Hypothesis. Water Resour. Res. 2007, 43, W04426. [Google Scholar] [CrossRef]
  28. Oudin, L.; Andréassian, V.; Lerat, J.; Michel, C. Has Land Cover a Significant Impact on Mean Annual Streamflow? An International Assessment Using 1508 Catchments. J. Hydrol. 2008, 357, 303–316. [Google Scholar] [CrossRef]
  29. Olofsson, P.; Foody, G.M.; Herold, M.; Stehman, S.V.; Woodcock, C.E.; Wulder, M.A. Good Practices for Estimating Area and Assessing Accuracy of Land Change. Remote Sens. Environ. 2014, 148, 42–57. [Google Scholar] [CrossRef]
Figure 1. Overview map of the study area (A) Location of the study area in China; (B) Xiying River basin). The map shows the geographic location, the network of major rivers, and the watershed boundaries of the Xiying River watershed. The watershed’s elevation range is 1873–4911 m and has a temperate continental arid climate.
Land 14 01381 g001
Figure 2. Forecast of sudden change in annual hydroclimatic elements in the Xiying River. (Blue solid line: Mann-Kendall forward statistic; Black dash-dot line: Mann-Kendall backward statistic; Yellow translucent wavy line:representing temperature, precipitation, and runoff, respectively; Red dotted horizontal lines: Significance threshold bounds for detecting sudden change.)
Land 14 01381 g002
Figure 3. Annual variation of hydroclimatic elements in the Xiying River during 1976–2016.
Land 14 01381 g003
Figure 4. Seasonal variation of hydroclimatic elements in the Xiying River during 1976–2016.
Land 14 01381 g004
Figure 5. Monthly variation of hydroclimatic elements in the Xiying River during 1976–2016.
Land 14 01381 g005
Figure 6. Land use changes in the Xiying River from 1980 to 2018.
Land 14 01381 g006
Table 1. Results of the M-K trend analysis in the Xiying River (°C, mm/10a).
SpringSummerAutumnWinterAnnual
Temperature: Z 4.02 **4.93 **3.83 **2.58 **5.20 **
Precipitation: Z0.171.72 *2.24 **1.65 *−0.10
Runoff: Z0.51−1.021.042.57 **−0.01
Note: * means that M-K trend analysis passed the 95% reliability test; ** means that M-K trend analysis passed the 99% reliability test.
Table 2. The correlation coefficient between runoff and meteorological factors in the Xiying River.
Time ScaleXiying River
PrecipitationTemperature
January0.007 *0.168 **
February0.369 **0.309 **
March−0.098 **0.487 **
April−0.192 **0.492 **
May−0.006 **0.217 **
June0.278 **−0.270 **
July0.474 **−0.250 **
August0.500 **−0.0458 **
September0.432 **0.036 **
October0.659 **0.154 **
November0.3950.035 **
December0.038 **−0.031 **
Spring0.316 **−0.149 **
Summer0.414 **−0.262 **
Autumn0.628 **0.062 **
Winter0.325 **−0.055 **
Annual0.465 **−0.206 **
Note: ** and * indicate that the data passed the significance test of 0.01 and 0.05, respectively.
Table 3. The Xiying River Basin land use type area transfer matrix from 1980 to 2018. km2.
ProjectTypesGrasslandCultivated LandConstruction LandForestlandWater AreaUnused LandTotal
Area (1980–2018)Grassland708.29 24.24 1.00 181.88 1.06 95.85 1012.32
Cultivated land22.04 5.39 3.12 30.55
Construction land1.65 0.03 1.68
Forestland166.50 5.66 167.27 6.25 345.68
Water area1.96 0.03 0.06 2.05
Unused land91.06 6.39 1.91 168.64 268.00
Total991.50 35.32 1.00 358.66 3.00 270.80 1660.28
Table 4. The contribution rate of meteorological factors to runoff variation in the study area.
Month123456789101112
Precipitation2.554.505.711.8218.0625.3821.6012.8344.4930.356.5626.14
Temperature0.450.151.8412.0618.8274.7923.3021.3732.2210.203.101.70
Disclaimer/Publisher’s Note: The statements, opinions and data contained in all publications are solely those of the individual author(s) and contributor(s) and not of MDPI and/or the editor(s). MDPI and/or the editor(s) disclaim responsibility for any injury to people or property resulting from any ideas, methods, instructions or products referred to in the content.

