
“Target–Classification–Modification” Method for Spatial Identification of Brownfields: A Case Study of Tangshan City, China
 , ,
, ,
Abstract
1. Introduction
- (1)
- How can multi-type industrial brownfields be identified at the city scale?
- (2)
- What are the spatial characteristics of each industrial brownfield subtype?
- (3)
- What factors influence the spatial characteristics of industrial brownfields?
2. Materials and Methods
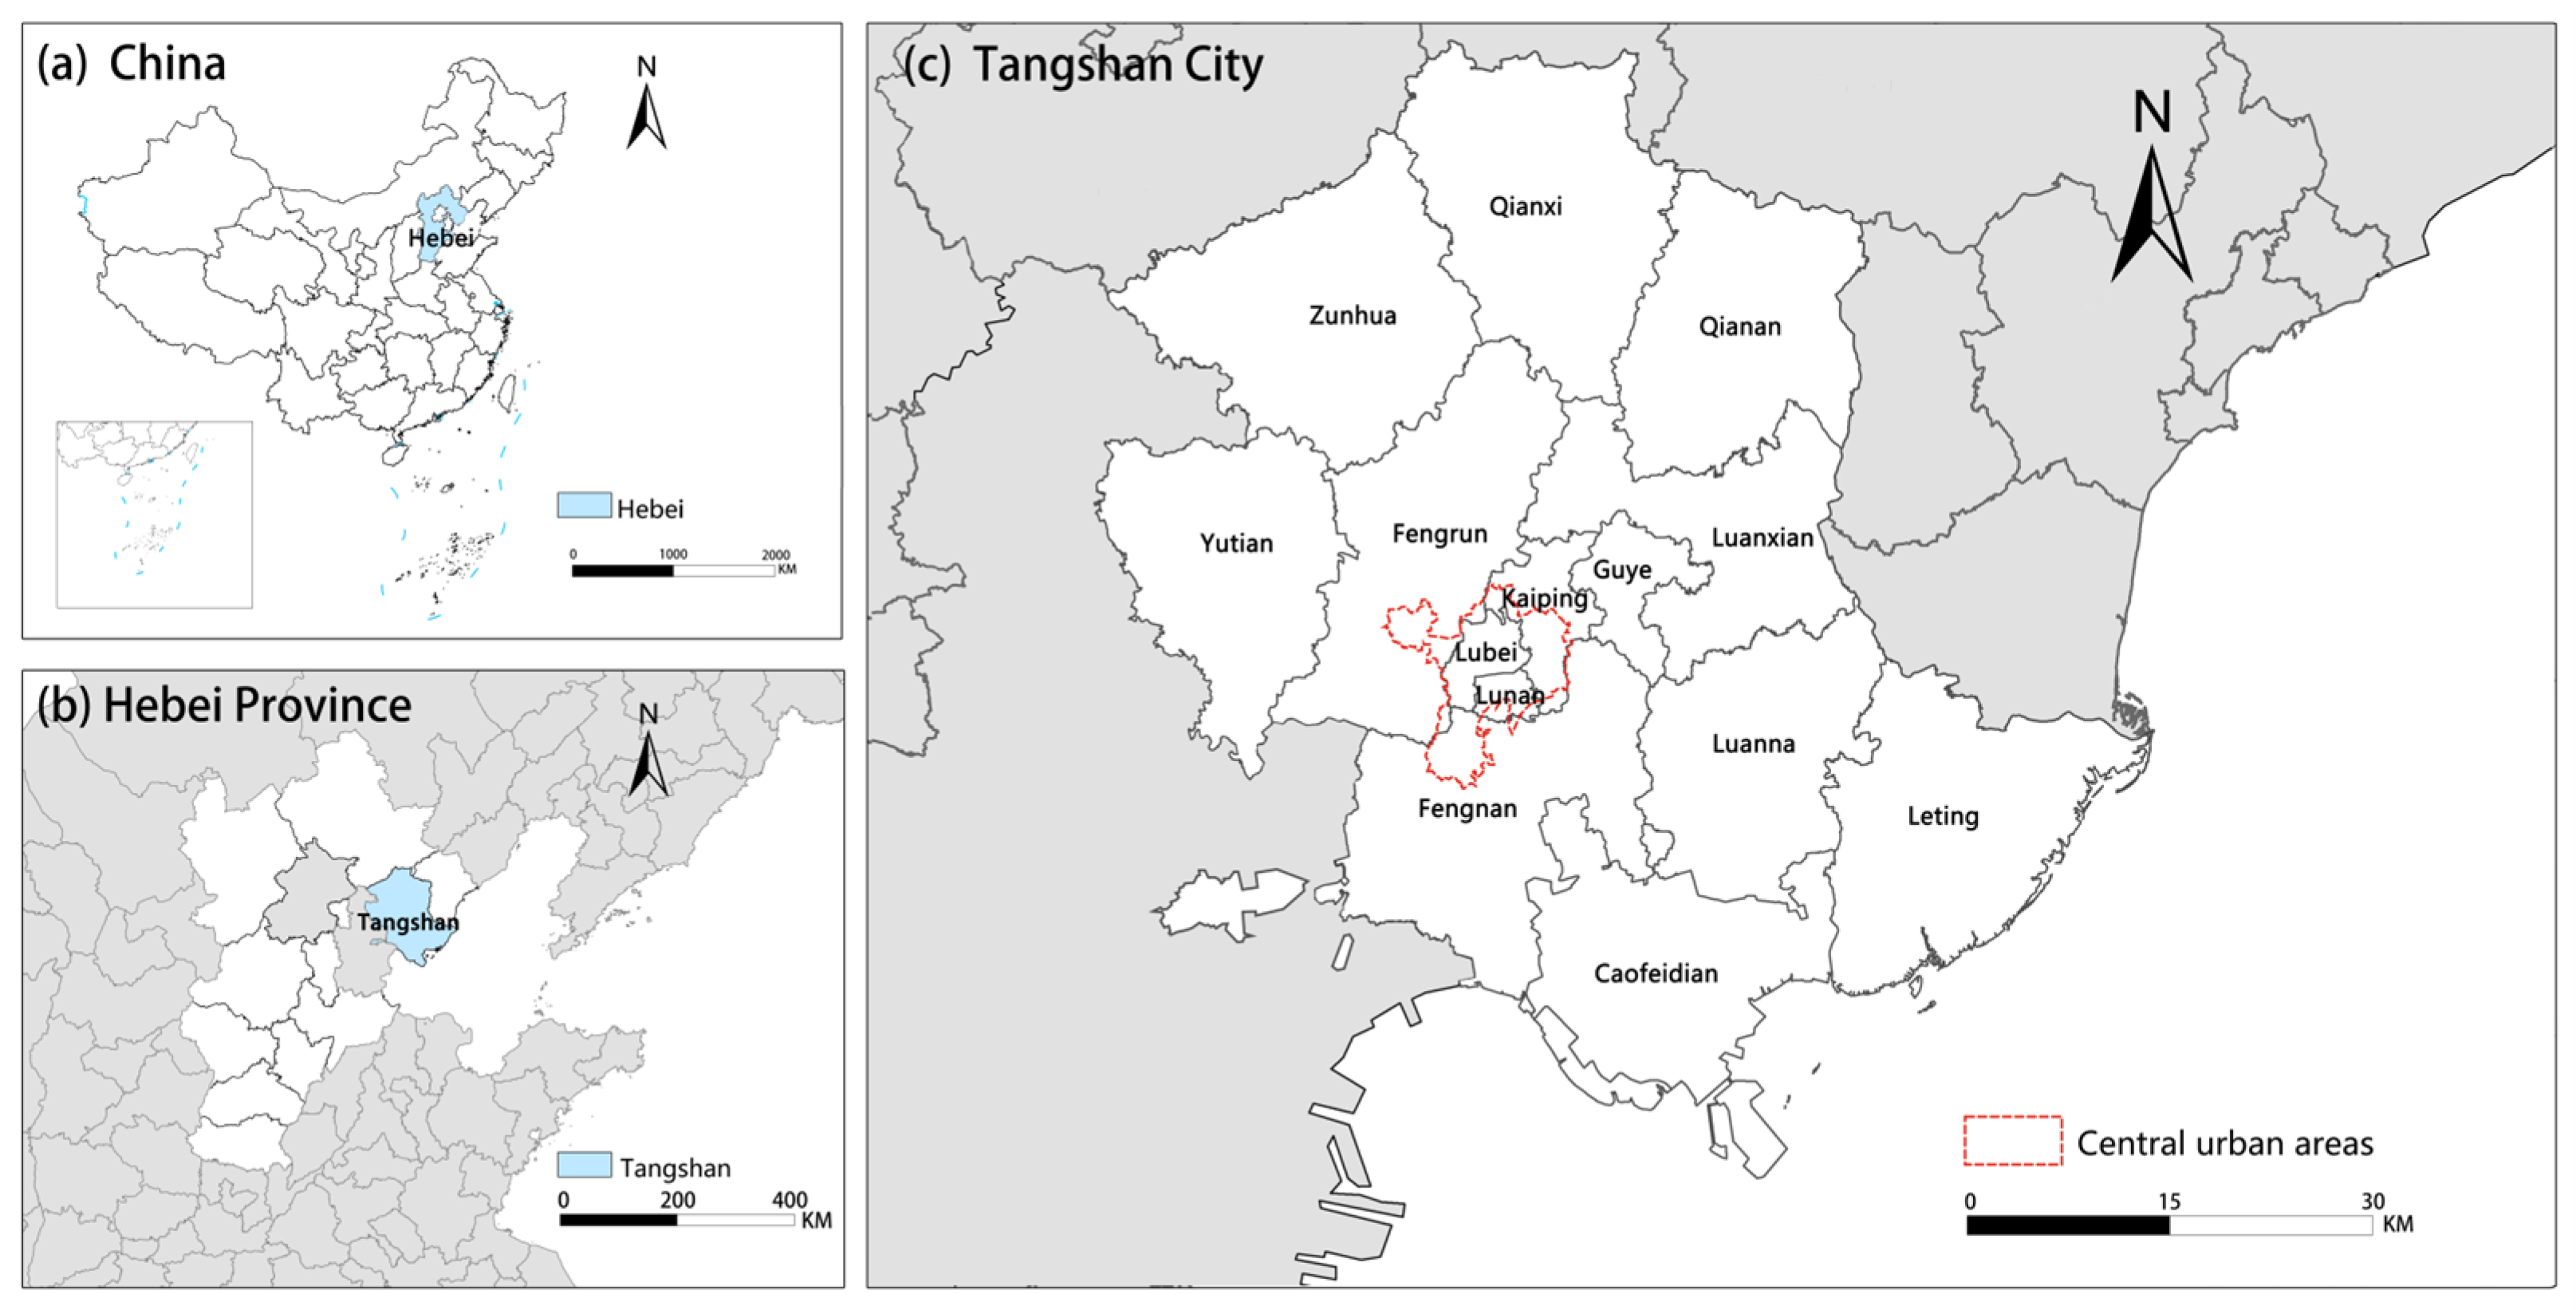
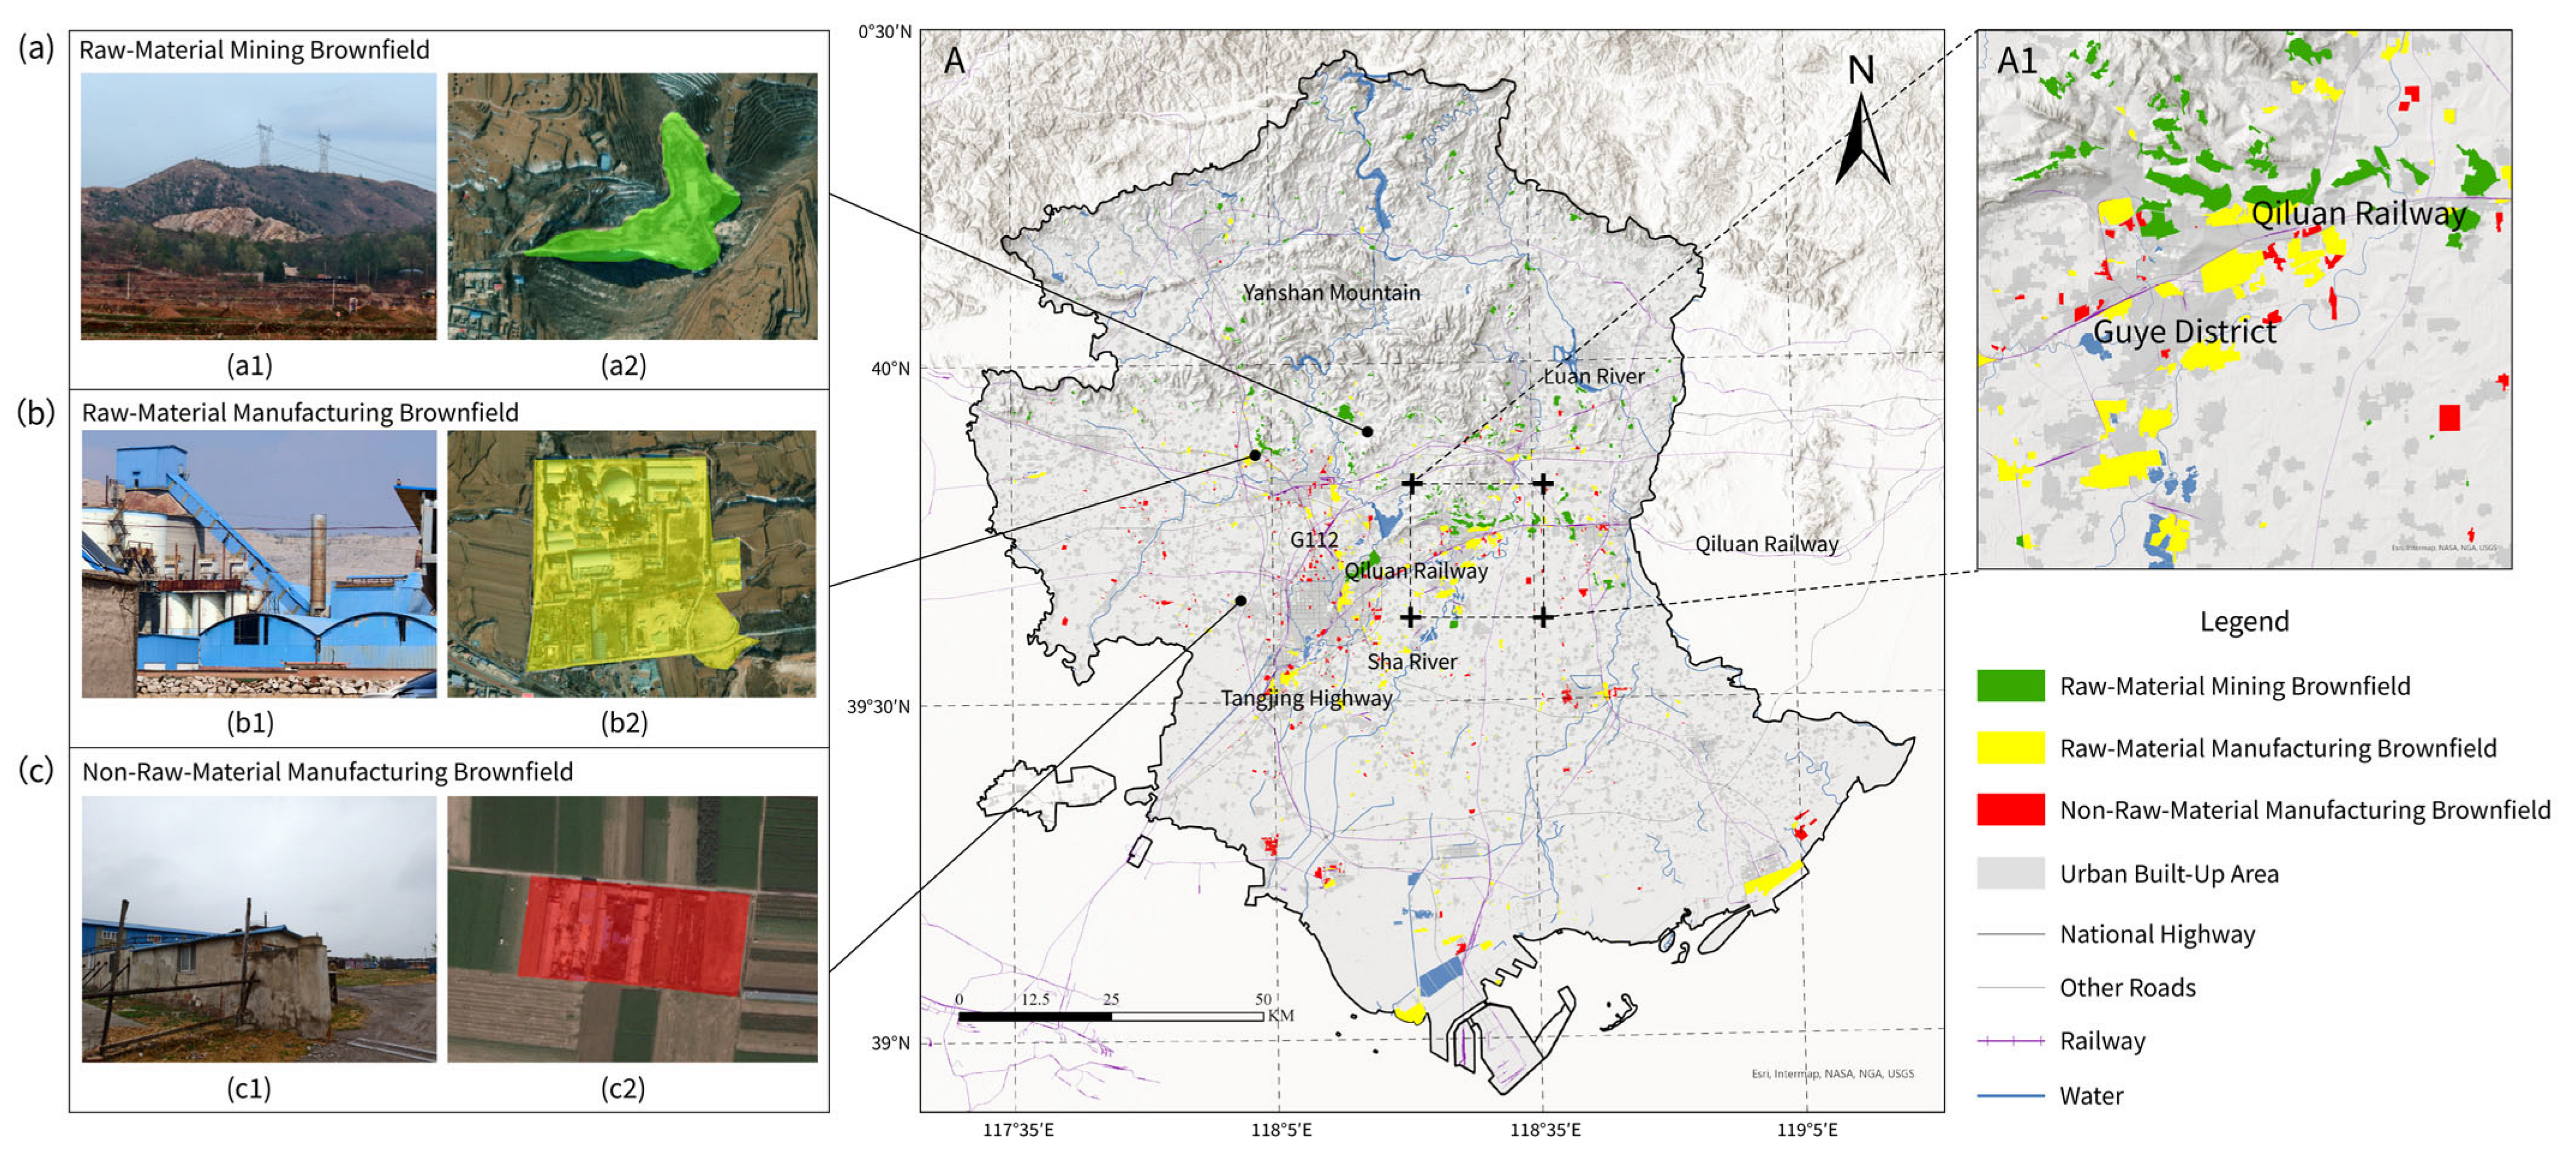
2.1. Study Areas
2.2. Framework of the TCM Method for the Spatial Identification of Brownfields
2.3. Data Sources
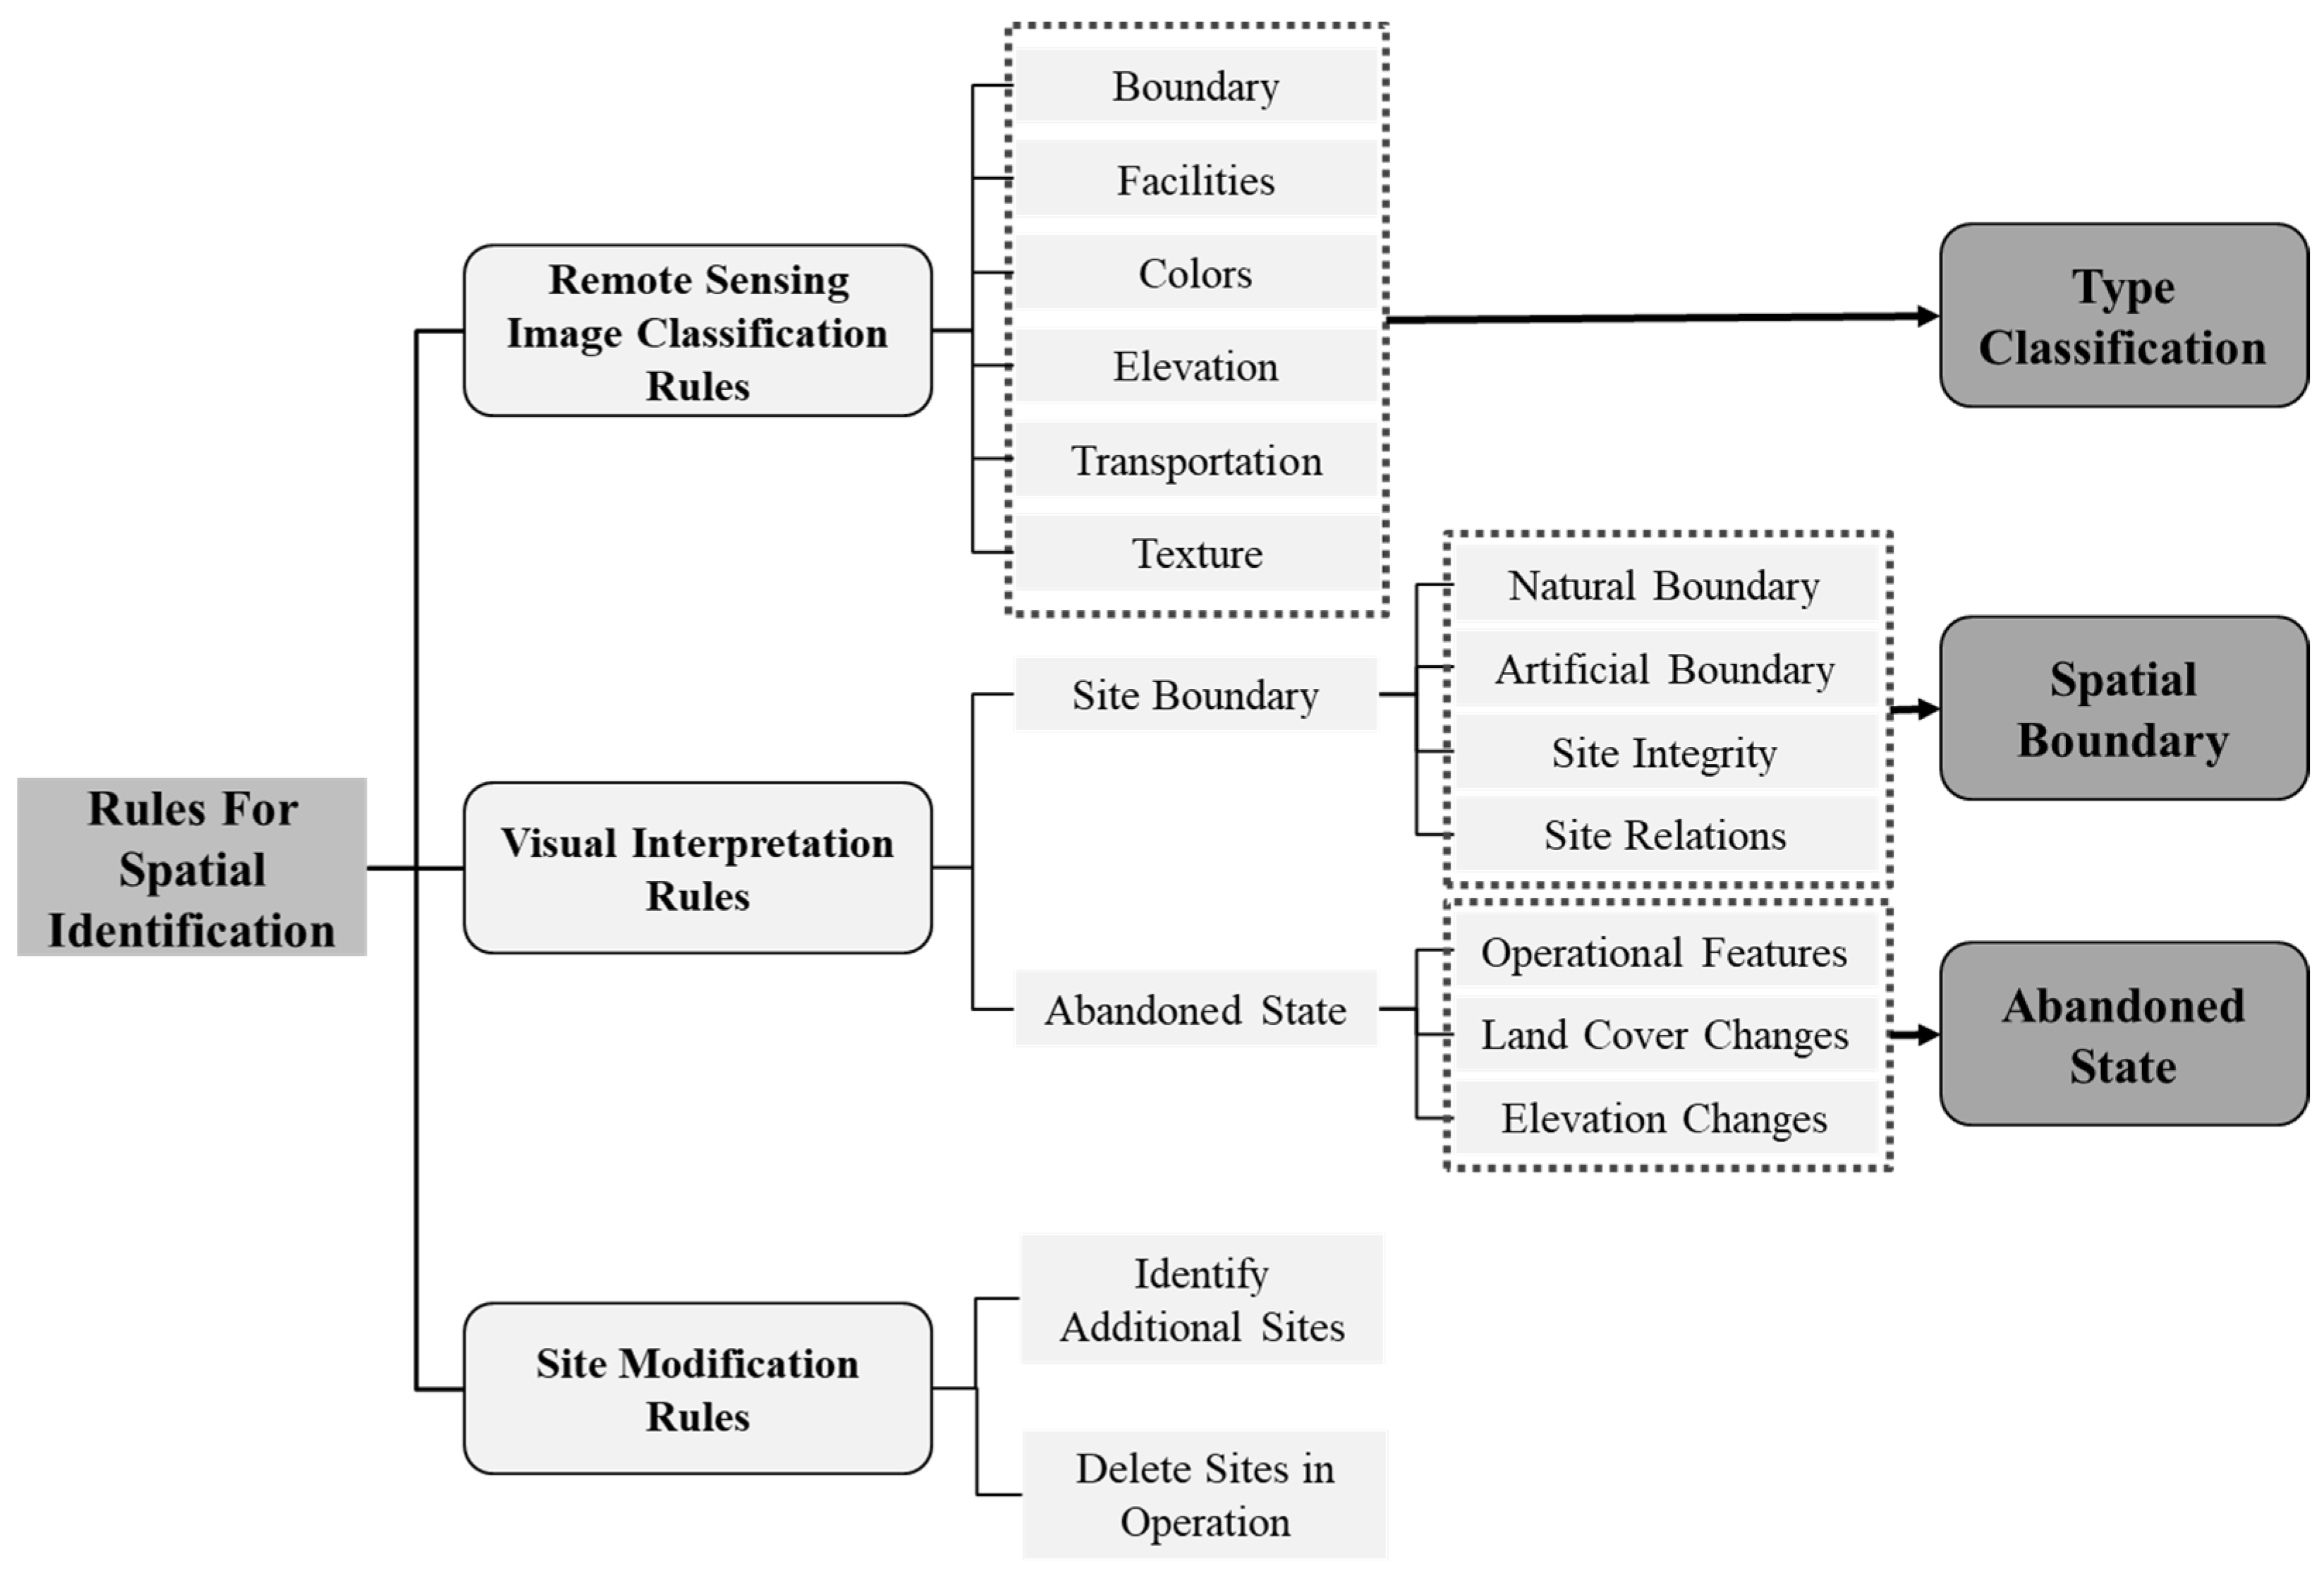
2.4. Classification and Identification Rules for Industrial Brownfields
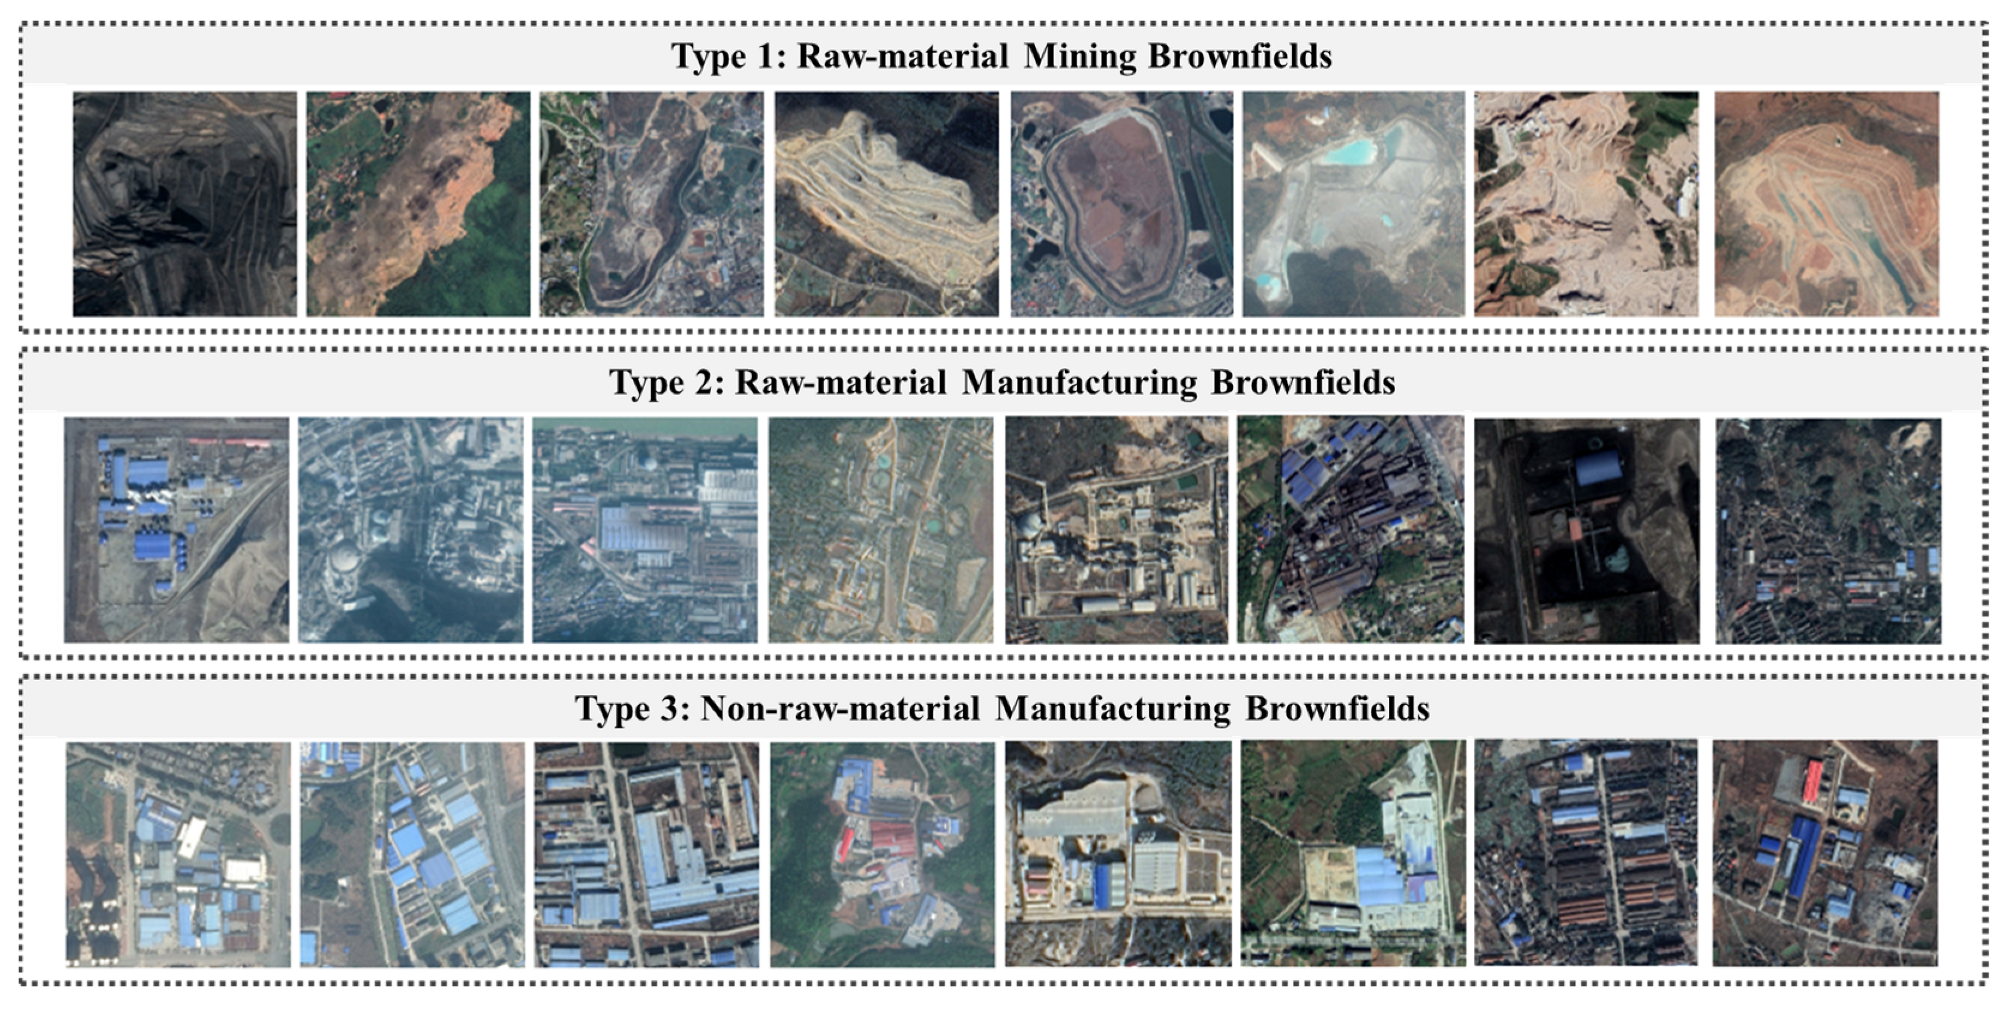
2.4.1. Remote Sensing Image Classification Rules
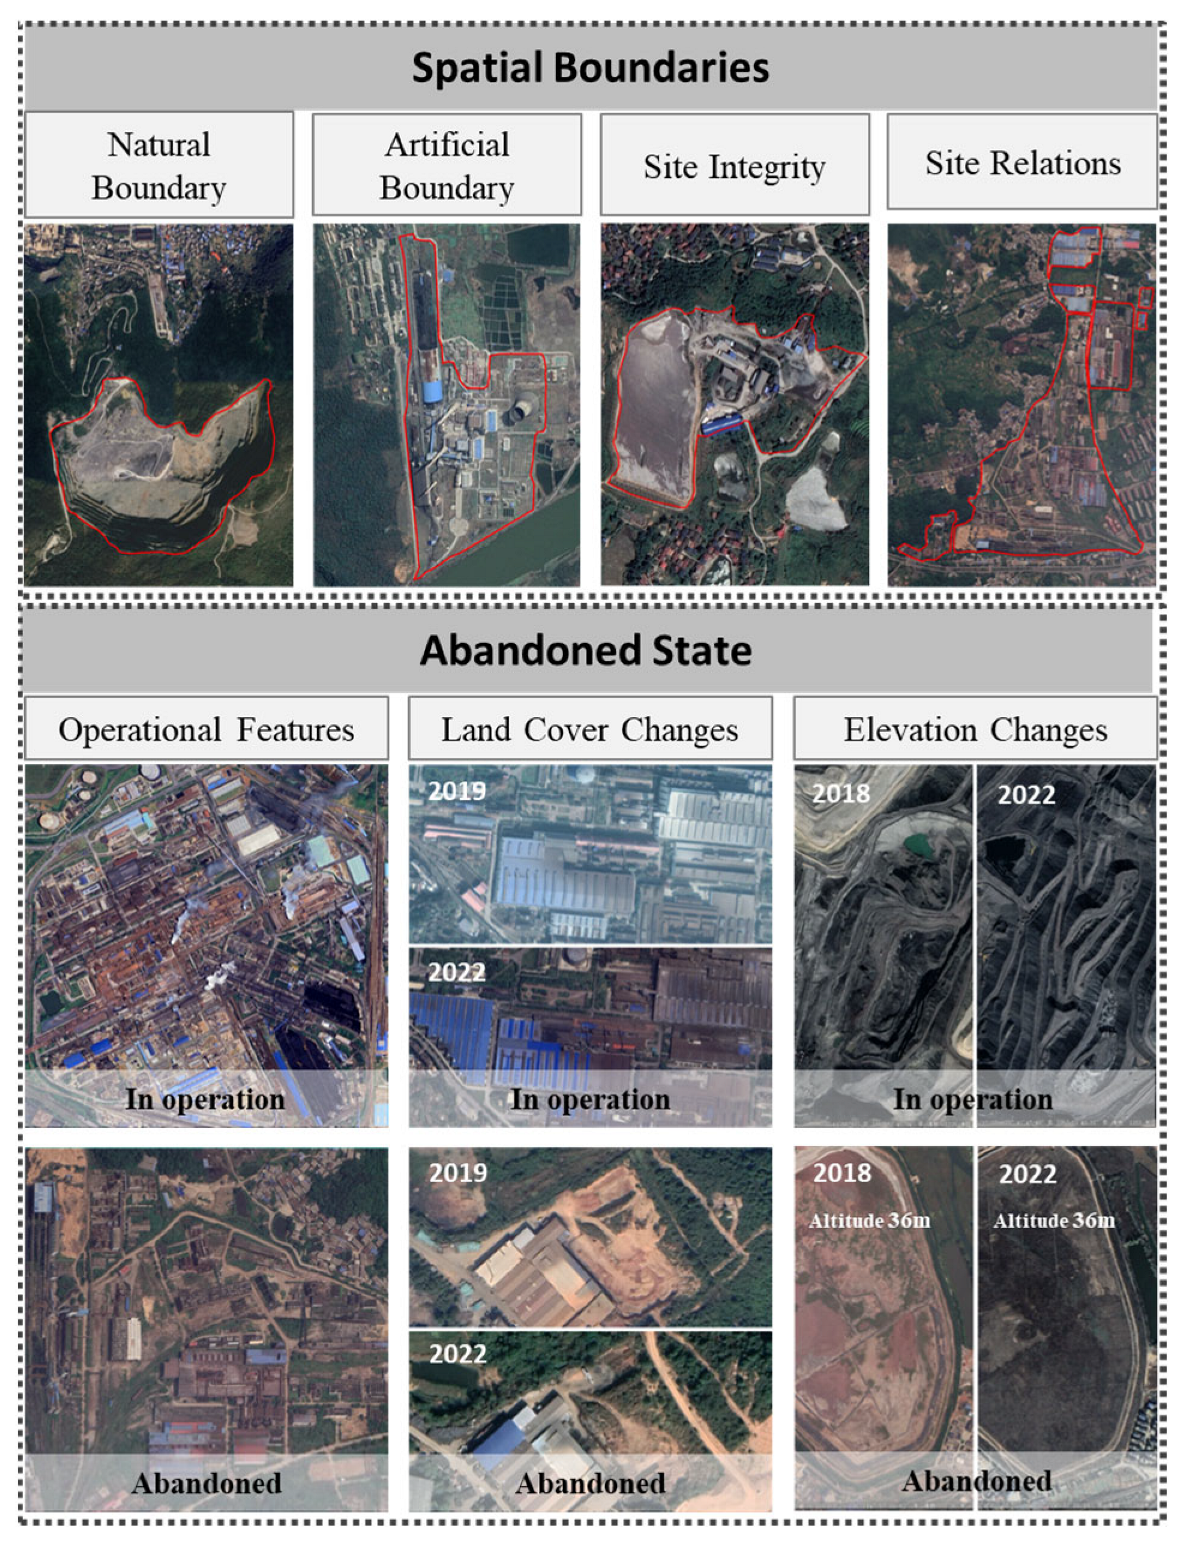
2.4.2. Visual Interpretation Rules
2.4.3. Site Modification Rules
2.5. Technical Workflow of the TCM Method
2.5.1. Target Area Localization via POI Data
2.5.2. Visual Interpretation for Brownfield Classification
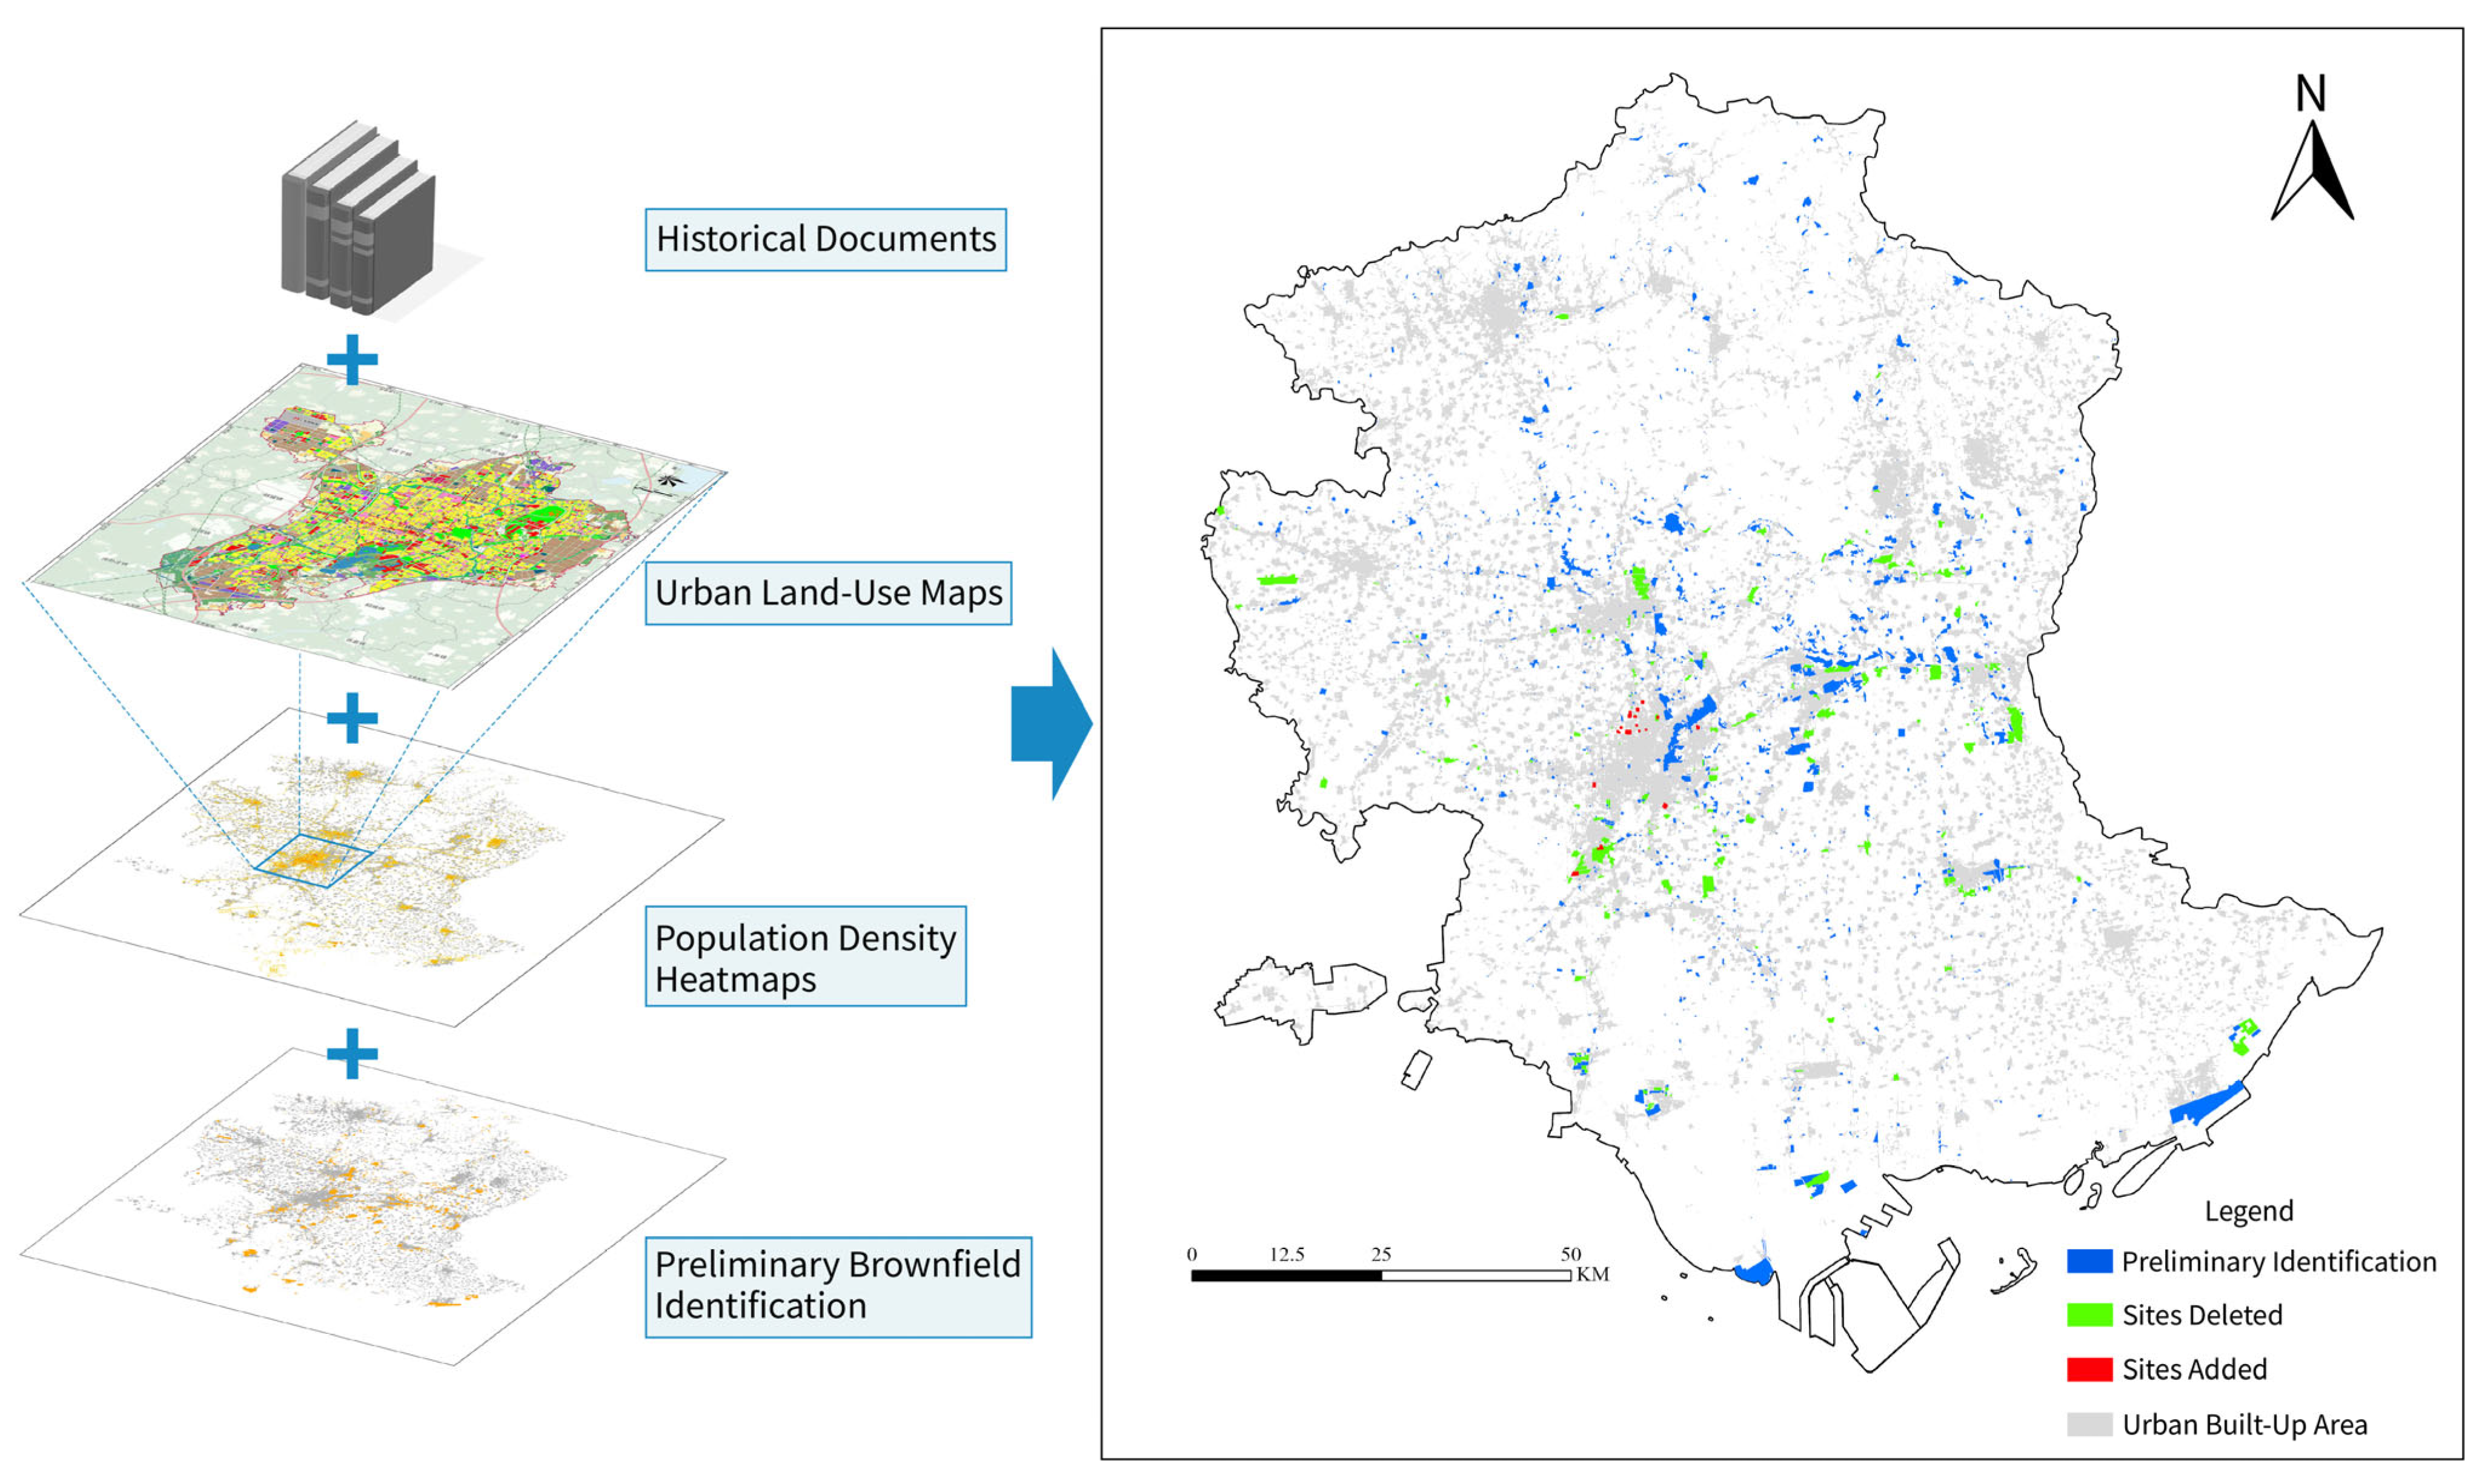
2.5.3. Identification Modification
2.6. Accuracy Evaluation of the TCM Method
2.7. Spatial Characteristic Analysis Method for Industrial Brownfields
3. Results
3.1. Performance Evaluation of the TCM Method
3.2. Identification Results of Industrial Brownfields in Tangshan
3.3. Spatial Characteristics and Influencing Factors of Industrial Brownfields
3.3.1. Spatial Distribution Patterns
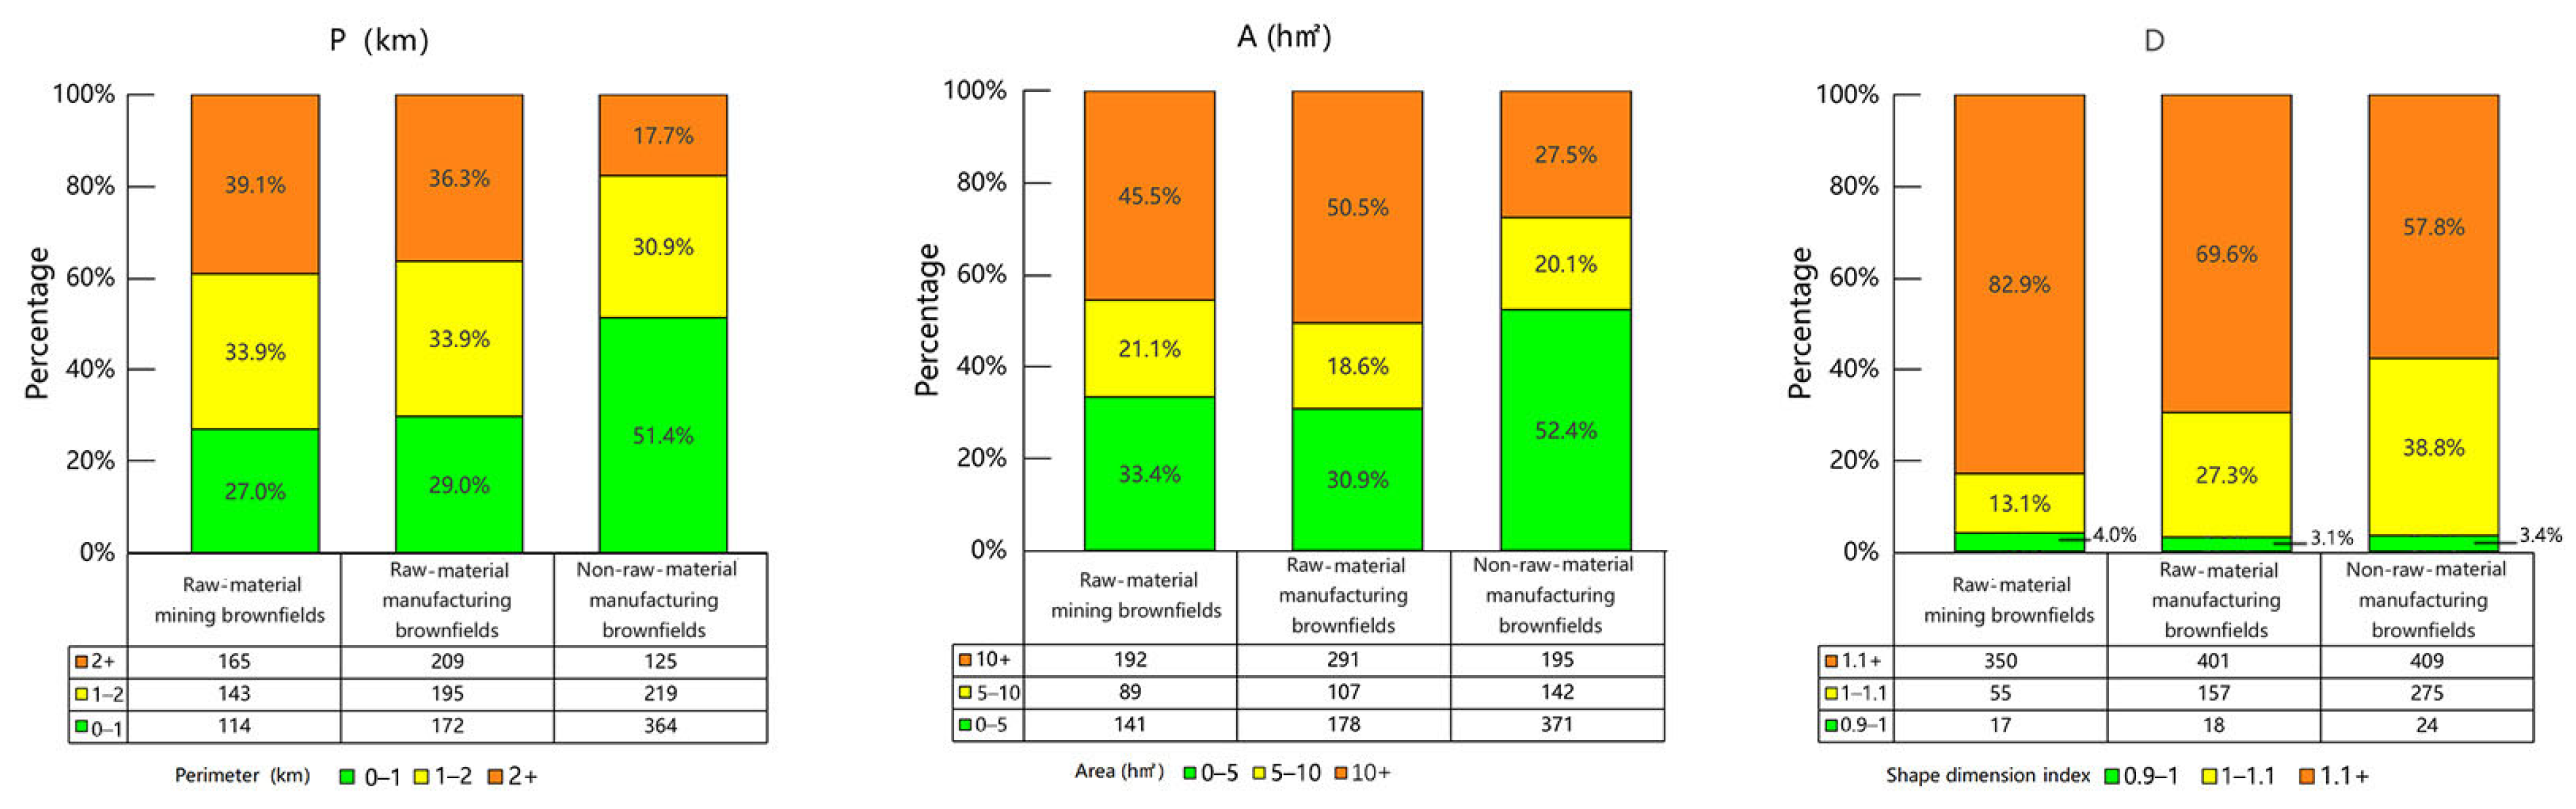
3.3.2. Spatial Morphological Characteristics
3.3.3. Spatial Association Characteristics
4. Discussion
4.1. Factors Influencing Identification Accuracy
4.2. A Comparison with Existing Methods
- (1)
- Most existing methods treat brownfields as a homogeneous category, obscuring critical differences in site characteristics and hindering tailored regeneration strategies. In contrast, the TCM method distinctly classifies industrial brownfields into three categories, thereby revealing subtype-specific spatial distribution, morphological patterns, and interrelationships. This granularity provides a nuanced foundation for targeted reuse and redevelopment planning.
- (2)
- Similar brownfield identification methods often rely on environmental contamination records, corporate filings, or land transaction logs. While accurate, these data sources are limited in accessibility and temporal lag. The TCM method instead anchors its subtype differentiation in remote sensing classification rules. Remote sensing imagery delivers a comprehensive, up-to-date view of land-use status, is readily obtainable, and ensures replicable and reliable identification outcomes. This establishes a solid platform for subsequent spatial analyses and assessments of the redevelopment potential.
- (3)
- Typical workflows defer abandonment assessment to post-classification field surveys, which are labor-intensive and time-consuming. Song et al. [52] used Baidu Street View for preliminary judgment, improving modification efficiency. In contrast, the TCM method embeds abandonment determination both during visual interpretation and throughout the site modification phase, utilizing multi-source data to improve accuracy. On this basis, validation via a stratified field-survey sample yielded an overall accuracy of 84.9%, exceeding 90% for raw-material mining sites.
4.3. Limitations
5. Conclusions
Author Contributions
Funding
Data Availability Statement
Conflicts of Interest
References
- Zheng, X. Landscape Strategies for Brownfield Regeneration Based on the Concept of “Brown Earth-Work”. Doctoral Thesis, Tsinghua University, Beijing, China, 2014. [Google Scholar]
- United States Congress. Small Business Liability Relief and Brownfields Revitalization Act. Public Law 107–118. 2002. Available online: https://www.congress.gov/107/plaws/publ118/PLAW-107publ118.pdf (accessed on 6 April 2025).
- Ministry of Housing, Communities and Local Government. UK. National Planning Policy Framework Annex 2: Glossary. 2012. Available online: https://www.gov.uk/guidance/national-planning-policy-framework/annex-2-glossary#prev-dev-land (accessed on 28 April 2025).
- Oliver, L.; Ferber, U.; Grimski, D.; Millar, K.; Nathanail, P. The scale and nature of European brownfields. In Proceedings of the CABERNET 2005-International Conference on Managing Urban Land LQM Ltd., Belfast, UK, 13–15 April 2005. [Google Scholar]
- Environment and Climate Change Canada, Canada. Pollution and Waste Management. 2025. Available online: https://www.canada.ca/en/services/environment/pollution-waste-management/contaminated-sites.html (accessed on 28 April 2025).
- CABERNET Coordination Team University of Nottingham. Sustainable Brownfield Regeneration: CABERNET Network Report. 2006. Available online: https://www.yumpu.com/en/document/read/38906007/sustainable-brownfield-regeneration-cabernet-network-report (accessed on 6 April 2025).
- Japan: Expert Studying Group for Countermeasures against Brownfields. Current status of the Brownfields Issue in Japan Interim Report. 2007. Available online: https://www.env.go.jp/en/water/soil/brownfields/interin-rep0703.pdf (accessed on 6 April 2025).
- China Architecture & Building Press; The Architectural Society of China. Architectural Design Dataset; China Architecture & Building Press: Beijing, China, 2017; p. 509. [Google Scholar]
- Zheng, X. Multidimensional Brownfields. World Archit. 2021, 04, 26–30+129. [Google Scholar] [CrossRef]
- Kirkwood, N.; Xiao, L. Looking Broadly at Brownfields. Chin. Landsc. Archit. 2015, 31, 5–9. [Google Scholar]
- EPA, United States. Brownfields. 2025. Available online: https://www.epa.gov/brownfields/about (accessed on 28 April 2025).
- Ministry of Housing, UK, Communities and Local Government. Dataset: Brownfield Land. 2025. Available online: https://www.planning.data.gov.uk/dataset/brownfield-land# (accessed on 28 April 2025).
- Ministère de la Transition écologique, de la Biodiversité, de la Forêt, de la Mer et de la Pêche, France. Carte Interactive. 2025. Available online: https://www.georisques.gouv.fr/cartes-interactives#/ (accessed on 28 April 2025).
- Treasury Board of Canada Secretariat, Canada. Find Sites by Classification. 2025. Available online: https://www.tbs-sct.gc.ca/fcsi-rscf/classification-eng.aspx (accessed on 28 April 2025).
- Ministerstvo životního prostředí, Czech Republic. Systém evidence kontaminovaných míst. 2025. Available online: https://www.sekm.cz/portal/areasource/map_search_public/ (accessed on 28 April 2025).
- Li, X.; Jiao, W.; Xiao, R.; Chen, W.; Liu, W. Contaminated sites in China: Countermeasures of provincial governments. J. Clean. Prod. 2017, 147, 485–496. [Google Scholar] [CrossRef]
- Bai, Z.; Zhou, W.; Wang, J.; Zhao, Z.; Cao, Y.; Zhou, Y. Overall Protection, Systematic Restoration and Comprehensive Management of Land Space. China Land Sci. 2019, 33, 1–11. [Google Scholar]
- Zhao, Y. Research on the Current Situation of Coal Mine Wastewater Pollution and Analysis of Treatment Plans. Create Living 2019, 11, 168–170. [Google Scholar]
- Landrigan, P.J.; Fuller, R.; Acosta, N.J.; Adeyi, O.; Arnold, R.; Baldé, A.B.; Bertollini, R.; Bose-O′Reilly, S.; Boufford, J.I.; Breysse, P.N.; et al. The Lancet Commission on pollution and health. Lancet 2018, 391, 462–512. [Google Scholar] [CrossRef]
- Novosák, J.; Hájek, O.; Nekolová, J.; Bednář, P. The spatial pattern of brownfields and characteristics of redeveloped sites in the Ostrava metropolitan area (Czech Republic). Morav. Geogr. Rep. 2013, 21, 36–45. [Google Scholar] [CrossRef]
- Holl, A. Manufacturing location and impacts of road transport infrastructure: Empirical evidence from Spain. Reg. Sci. Urban Econ. 2004, 34, 341–363. [Google Scholar] [CrossRef]
- Smith, J.P.; Li, X.; Turner II, B.L. Lots for greening: Identification of metropolitan vacant land and its potential use for cooling and agriculture in Phoenix, AZ, USA. Appl. Geogr. 2017, 85, 139–151. [Google Scholar] [CrossRef]
- Turečková, K.; Nevima, J.; Škrabal, J.; Martinát, S. Uncovering patterns of location of brownfields to facilitate their regeneration: Some remarks from the Czech Republic. Sustainability 2018, 10, 1984. [Google Scholar] [CrossRef]
- Kunc, J.; Navrátil, J.; Tonev, P.; Frantál, B.; Klusáček, P.; Martinát, S.; Havlíček, M.; Černík, J. Perception of urban renewal: Reflexions and coherences of socio-spatial patterns (Brno, Czech Republic). Geogr. Tech. 2014, 9, 66–77. [Google Scholar]
- Abe, S.; Nakagawa, D.; Matsunaka, R.; Oba, T. Study on the factors to transform underused land focusing on the influence of railway stations in central areas of Japanese Local cities. Land Use Policy 2014, 41, 344–356. [Google Scholar] [CrossRef]
- Frantál, B.; Greer-Wootten, B.; Klusáček, P.; Krejčí, T.; Kunc, J.; Martinát, S. Exploring spatial patterns of urban brownfields regeneration: The case of Brno, Czech Republic. Cities 2015, 44, 9–18. [Google Scholar] [CrossRef]
- Smoļakova, A. Exploring spatial patterns of urban brownfields: The case of Daugavpils city. In Proceedings of the International Scientific and Practical Conference, Rezekne, Latvia, 16 June 2017. [Google Scholar]
- Špirić, A. Spatial criteria in urban renewal of industrial brownfield sites. Građevinar 2015, 67, 865–877. [Google Scholar]
- Yang, H. Study of Abandoned Mine Land Regeneration under the Perspective of “Urban Renewal and Ecological Restoration”. Doctoral Thesis, China University of Mining & Technology, Beijing, China, 2018. [Google Scholar]
- Hou, W.; Zhai, L.; Feng, S.; Walz, U. Restoration priority assessment of coal mining brownfields from the perspective of enhancing the connectivity of green infrastructure networks. J. Environ. Manag. 2021, 277, 111289. [Google Scholar] [CrossRef]
- Liao, Q.; Xu, H.; Liu, X. Regeneration of mining wasteland in view of optimization of urban green infrastructure system: A case study of Daye. Bull. Geol. Sci. Technol. 2021, 40, 214–223. [Google Scholar] [CrossRef]
- Fu, Q. Spatial Patterns and Regeneration Strategies of Brownfield Clusters in Resource-Exhausted Cities, China. Doctoral Thesis, Tsinghua University, Beijing, China, 2021. [Google Scholar]
- Brunner, P.H.; Rechberger, H. Practical Handbook of Material Flow Analysis. Int. J. Life Cycle Assess. 2004, 9, 337–338. [Google Scholar] [CrossRef]
- Haninger, K.; Ma, L.; Timmins, C. The value of brownfield remediation. J. Assoc. Environ. Resour. Econ. 2017, 4, 197–241. [Google Scholar] [CrossRef]
- Ferrara, V.; Beriatos, E.; Brebbia, C.A. Brownfield identification: Different approaches for analysing data detected by means of remote sensing. WIT Trans. Ecol. Environ. 2008, 107, 45–54. [Google Scholar] [CrossRef]
- Gregory, A.S.; Ritz, K.; McGrath, S.P.; Quinton, J.N.; Goulding, K.W.T.; Jones, R.J.A.; Harris, J.A.; Bol, R.; Wallace, P.; Pilgrim, E.S.; et al. A review of the impacts of degradation threats on soil properties in the UK. Soil Use Manag. 2015, 31, 1–15. [Google Scholar] [CrossRef]
- Huang, D.; Liu, Q.; Liu, G.; Yan, W. Coal Gangue Yards Information Extraction Using Object-oriented Method Based on SPOT-5 Remote Sensing Images. J. Geo-Inf. Sci. 2015, 17, 369–377. [Google Scholar]
- Mao, L.; Zheng, Z.; Meng, X.; Zhou, Y.; Zhao, P.; Yang, Z.; Long, Y. Large-scale automatic identification of urban vacant land using semantic segmentation of high-resolution remote sensing images. Landsc. Urban Plan. 2022, 222, 104384. [Google Scholar] [CrossRef]
- Hu, X.; Zhuang, S. Large-Scale Spatial–Temporal Identification of Urban Vacant Land and Informal Green Spaces Using Semantic Segmentation. Remote Sens. 2024, 16, 216. [Google Scholar] [CrossRef]
- Sun, Y.; Hu, H.; Han, Y.; Wang, Z.; Zheng, X. Large-Scale Automatic Identification of Industrial Vacant Land. ISPRS Int. J. Geo-Inf. 2023, 12, 409. [Google Scholar] [CrossRef]
- Durrbeck, K.; Lasker, A.; Gollapalli, K.; Ghosh, M.; Sk, M.O.; Fischer, R. BrownViTNet: Hybrid CNN-Vision Transformer Model for the Classification of Brownfields in Aerial Imagery. IEEE J. Sel. Top. Appl. Earth Obs. Remote Sens. 2025, 18, 8189–8202. [Google Scholar] [CrossRef]
- Ge, D. Research on the Key Techniques of SAR Interferometry for Regional Land Subsidence Monitoring. Doctoral Thesis, China University of Geosciences, Beijing, China, 2013. [Google Scholar]
- Zhu, Y. Analysis of Ground Subsidence Monitoring in Mining Areas Using InSAR with Parameter Inversion. Doctoral Thesis, Central South University, Changsha, China, 2013. [Google Scholar]
- Cheng, F.; Geertman, S.; Kuffer, M.; Zhan, Q. An integrative methodology to improve brownfield redevelopment planning in Chinese cities: A case study of Futian, Shenzhen. Comput. Environ. Urban Syst. 2011, 35, 388–398. [Google Scholar] [CrossRef]
- Skála, J.; Vácha, R.; Čechmánková, J.; Horvathova, V. Various aspects of the genesis and perspectives on agricultural brownfields in the Czech Republic. Morav. Geogr. Rep. 2013, 21, 46–55. [Google Scholar] [CrossRef]
- Frickel, S.; Elliott, J.R. Tracking industrial land use conversions: A new approach for studying relict waste and urban development. Organ. Environ. 2008, 21, 128–147. [Google Scholar] [CrossRef]
- Lin, H.; Song, Y.; Wang, S. Research on the Method of Urban Brownfield Information Identification and Brownfield Database Construction: Taking Changchun as an Example. China Land Sci. 2016, 30, 80–87+97. [Google Scholar]
- He, T. Study on the pollution space update of Changsha-Zhuzhou-Xiangtan Urban Agglomeration. Ph.D. Thesis, Hunan Normal University, Changsha, China, 2016. [Google Scholar]
- Volpe, L.L.; Vasques, A.R.; Lombardo, M.A.; Misra, S.C.; Revetria, R.; Sztandera, L.M.; Iliescu, M.; Zaharim, A.; Parsiani, H. The use of geoprocessing techniques to identify the brownfields railroad areas in the city of Rio Claro-Sp, Brazil. In Proceedings of the 4th WSEAS International Conference on Remote Sensing, Venice, Italy, 21–23 November 2008. [Google Scholar]
- Stuczynski, T.; Siebielec, G.; Korzeniowska-Puculek, R.; Koza, P.; Pudelko, R.; Lopatka, A.; Kowalik, M. Geographical location and key sensitivity issues of post-industrial regions in Europe. Environ. Monit. Assess. 2009, 151, 77–91. [Google Scholar] [CrossRef]
- Li, W.; Wang, D.; Li, H.; Wang, J.; Zhu, Y.; Yang, Y. Quantifying the spatial arrangement of underutilized land in a rapidly urbanized rust belt city: The case of Changchun City. Land Use Policy 2019, 83, 113–123. [Google Scholar] [CrossRef]
- Song, Y.; Lyu, Y.; Qian, S.; Zhang, X.; Lin, H.; Wang, S. Identifying urban candidate brownfield sites using multi-source data: The case of Changchun City, China. Land Use Policy 2022, 117, 106084. [Google Scholar] [CrossRef]
- Lin, M.; Li, J.; Xie, H. Methods and Practices for Identifying Urban Brownfield Sites. World Reg. Stud. 2013, 22, 169–176. [Google Scholar]
- Tangshan Territorial Spatial Ecological Restoration Plan (2021–2035), Public Consultation Draft. Available online: http://zygh.tangshan.gov.cn/ts/xxgk/ghtj/gtgh/10981983046046597120.html (accessed on 28 April 2024).
- Tangshan Municipal Bureau of Housing and Urban-Rural Development. The 14th Five-Year Special Plan for Urban Renewal in the Central Urban Area of Tangshan. Available online: https://zhujianju.tangshan.gov.cn/u/cms/tszjj/202407/01110943y5bq.pdf (accessed on 28 April 2024).
- Yamane, T. Statistics: An Introductory Analysis, 2nd ed.; Harper & Row press: New York, NY, USA, 1976; p. 886. [Google Scholar]
- Osman, R.; Frantál, B.; Klusáček, P.; Kunc, J.; Martinát, S. Factors affecting brownfield regeneration in post-socialist space: The case of the Czech Republic. Land Use Policy 2015, 48, 309–316. [Google Scholar] [CrossRef]


| Brownfield Type | Historical Use | Common Site Examples | Spatial Characteristics | Contamination Features | Redevelopment Challenges and Potential |
|---|---|---|---|---|---|
| Raw-material mining brownfields | Open-pit mining for mineral extraction | Mining pits, waste dumps, tailing ponds | Irregular terrain, surface degradation | Heavy | Terrain reshaping, ecological restoration |
| Raw-material manufacturing brownfields | Processing of raw ores, including washing, crushing, smelting, and sintering | Coal washing plants, steel mills, cement plants, coking plants | Flat terrain, large industrial buildings and structures | Heavy | Contamination remediation, industrial heritage utilization |
| Non-raw-material manufacturing brownfields | Further processing of finished mineral materials | Steel pipe factories, machinery plants, construction material plants | Flat terrain, large-scale factory buildings | Light | Functional space replacement |
| Data Type | Dataset | Description | Source |
|---|---|---|---|
| Historical and documentary records | - | Important industrial and mining projects, shutdown and remediation status of tailing ponds | Local government official websites, books, and literature |
| Urban land-use maps | - | Current land-use and planning maps | Local government official websites |
| Industrial and mining POIs | National Mineral Resources Database (2020 edition) | Mineral sites with latitude, longitude, mineral types, and utilization status, in SHP format | National Geological Archives of China (NGA), http://dcc.cgs.gov.cn, accessed on 26 December 2020 |
| Gaode Map POIs | Names, latitude, and longitude, in KML format | BIGEMAP | |
| High-resolution remote sensing images | Google Earth Pro remote sensing imagery | Multi-temporal, meter-scale, high-resolution remote sensing imagery | Google Earth Pro |
| Population density heatmaps | Baidu heatmap | Heatmap point data with a 200 m resolution, in SHP format | https://www.baidu.com/, accessed on 16 September 2020 |
| Type | Boundary | Facilities | Colors | Elevation | Transportation | Textures |
|---|---|---|---|---|---|---|
| Raw-material mining brownfields | Clear and irregular | No special facilities | Coal: black; hematite: brownish yellow; copper: yellowish red; limestone: grayish white | Elevation variation, terraced or stepped terrain | Rugged roads | Coal, iron, and copper: a few large sites; limestone: smaller |
| Raw-material manufacturing brownfields | Clear and regular with walls | Industrial structures, like blast furnaces and conveyor belts | Cement plant: grayish white; steel plant: brownish; coke plant: black | Relatively flat | Well-structured internal roads; railways | Large-scale clustered industrial buildings connected by pipelines or railways |
| Non-raw-material manufacturing brownfields | Clear and regular with walls | Storage of raw materials and miscellaneous items | Blue or red corrugated steel sheets | Relatively flat | Well-structured internal roads | Dense building clusters surpassing residential buildings in size |
| Data | Number of Brownfields | |||
|---|---|---|---|---|
| Before | Process | After | ||
| Sites Deleted | Sites Added | |||
| Historical records | 1930 | —— | 13 | 1943 |
| Urban land-use maps | 1930 | 47 | 26 | 1909 |
| Population density heatmap | 1930 | 239 | —— | 1691 |
| Combination | 1930 | 256 | 32 | 1706 |
| Type | Sample Number | Sampling Rate | Actual Number | Accuracy |
|---|---|---|---|---|
| Raw-material mining brownfields | 24 | 5.7% | 22 | 91.7% |
| Raw-material manufacturing brownfields | 17 | 3.0% | 15 | 88.2% |
| Non-raw-material manufacturing brownfields | 46 | 6.5% | 36 | 80.4% |
| In total | 86 | 5.0% | 73 | 84.9% |
| Type | Spatial Distribution | Spatial Morphology | ||
|---|---|---|---|---|
| Raw-material mining brownfields | Clustered along mountain ranges and railways |  | Scale ranges from 0.2 to 730 hectares; irregular shape | 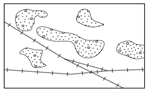 |
| Raw-material manufacturing brownfields | Adjacent to urban built-up areas; distributed along rivers | 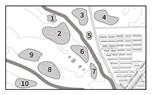 | Scale ranges from 0.3 to 2000 hectares; relatively regular shape | 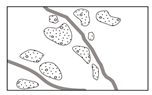 |
| Non-raw-material manufacturing brownfields | Scattered within urban built-up areas; distributed along roads | 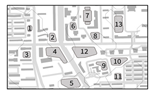 | Scale ranges from 0.1 to 320 hectares; highly regular shape | 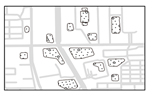 |
Disclaimer/Publisher’s Note: The statements, opinions and data contained in all publications are solely those of the individual author(s) and contributor(s) and not of MDPI and/or the editor(s). MDPI and/or the editor(s) disclaim responsibility for any injury to people or property resulting from any ideas, methods, instructions or products referred to in the content. |
© 2025 by the authors. Licensee MDPI, Basel, Switzerland. This article is an open access article distributed under the terms and conditions of the Creative Commons Attribution (CC BY) license (https://creativecommons.org/licenses/by/4.0/).
Share and Cite
Fu, Q.; Zhu, J.; Zheng, X.; Li, Z.; Chen, M.; He, Y. “Target–Classification–Modification” Method for Spatial Identification of Brownfields: A Case Study of Tangshan City, China. Land 2025, 14, 1213. https://doi.org/10.3390/land14061213
Fu Q, Zhu J, Zheng X, Li Z, Chen M, He Y. “Target–Classification–Modification” Method for Spatial Identification of Brownfields: A Case Study of Tangshan City, China. Land. 2025; 14(6):1213. https://doi.org/10.3390/land14061213
Chicago/Turabian StyleFu, Quanchuan, Jingyuan Zhu, Xiaodi Zheng, Zhengxiang Li, Maini Chen, and Yuyuwei He. 2025. "“Target–Classification–Modification” Method for Spatial Identification of Brownfields: A Case Study of Tangshan City, China" Land 14, no. 6: 1213. https://doi.org/10.3390/land14061213
APA StyleFu, Q., Zhu, J., Zheng, X., Li, Z., Chen, M., & He, Y. (2025). “Target–Classification–Modification” Method for Spatial Identification of Brownfields: A Case Study of Tangshan City, China. Land, 14(6), 1213. https://doi.org/10.3390/land14061213