
Investigating Spatial Heterogeneity Patterns and Coupling Coordination Effects of the Cultural Ecosystem Service Supply and Demand: A Case Study of Taiyuan City, China


Abstract
1. Introduction
2. Materials and Methods
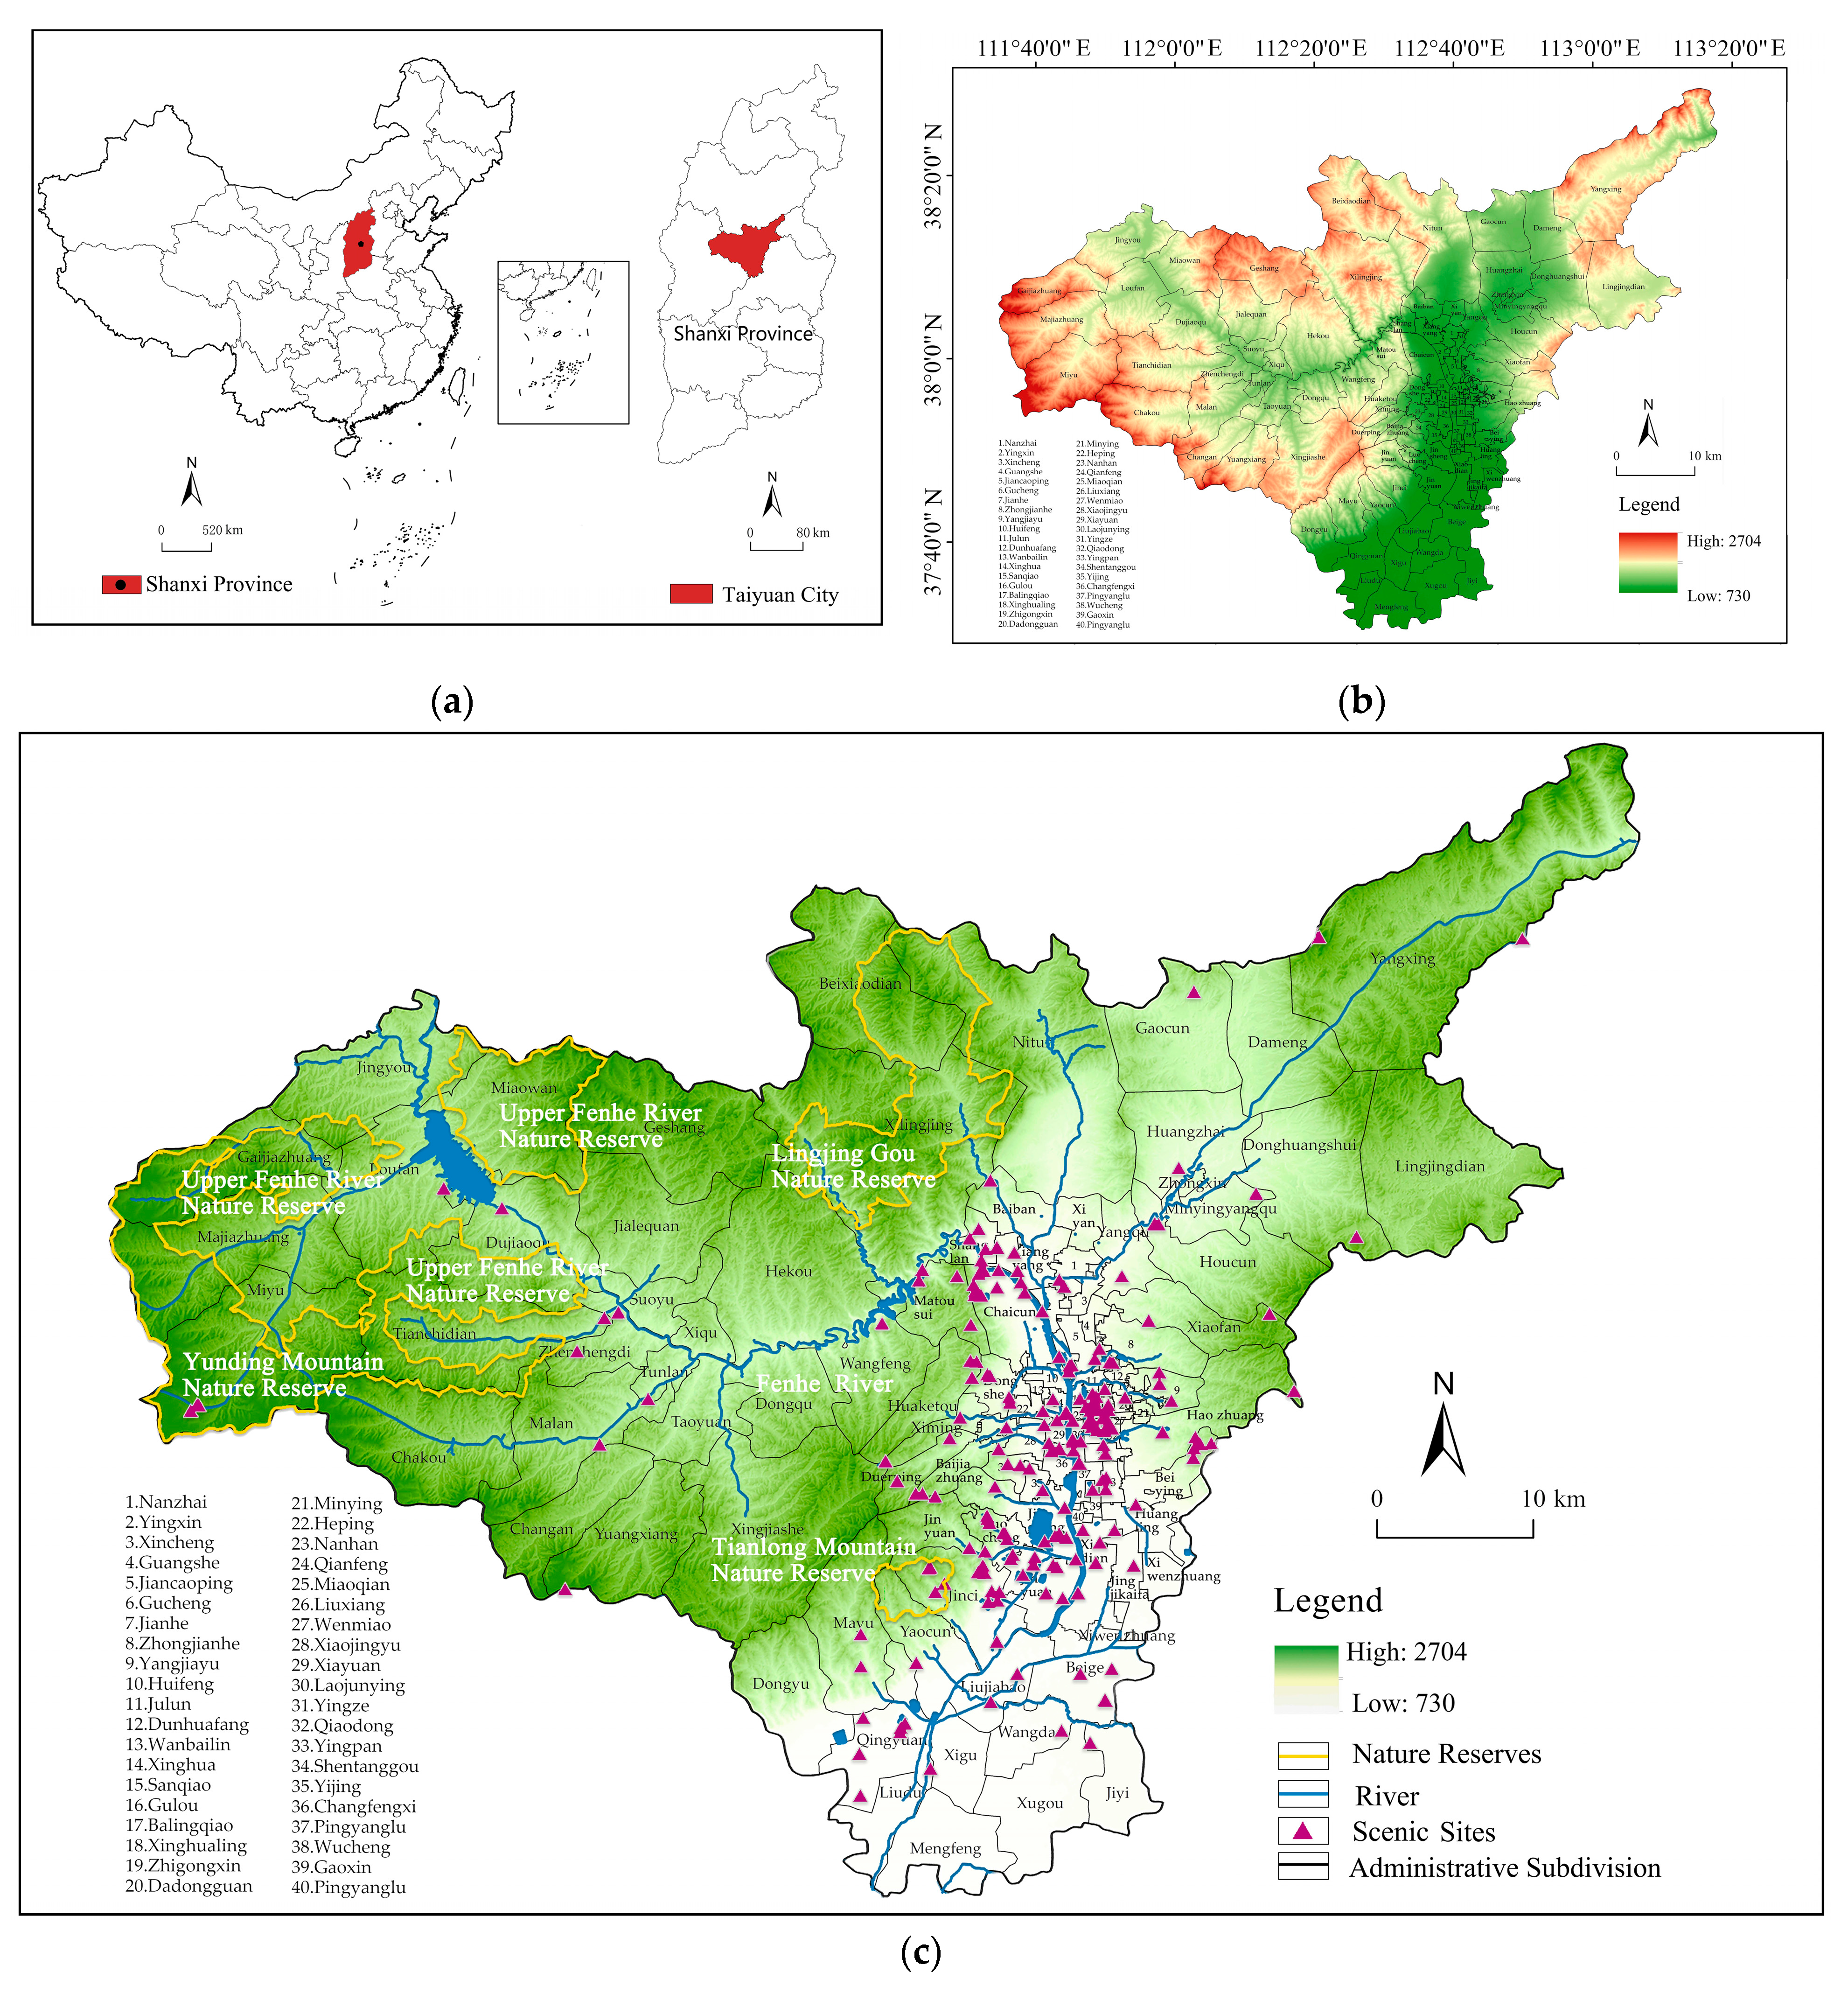
2.1. Study Area
2.2. Data Sources
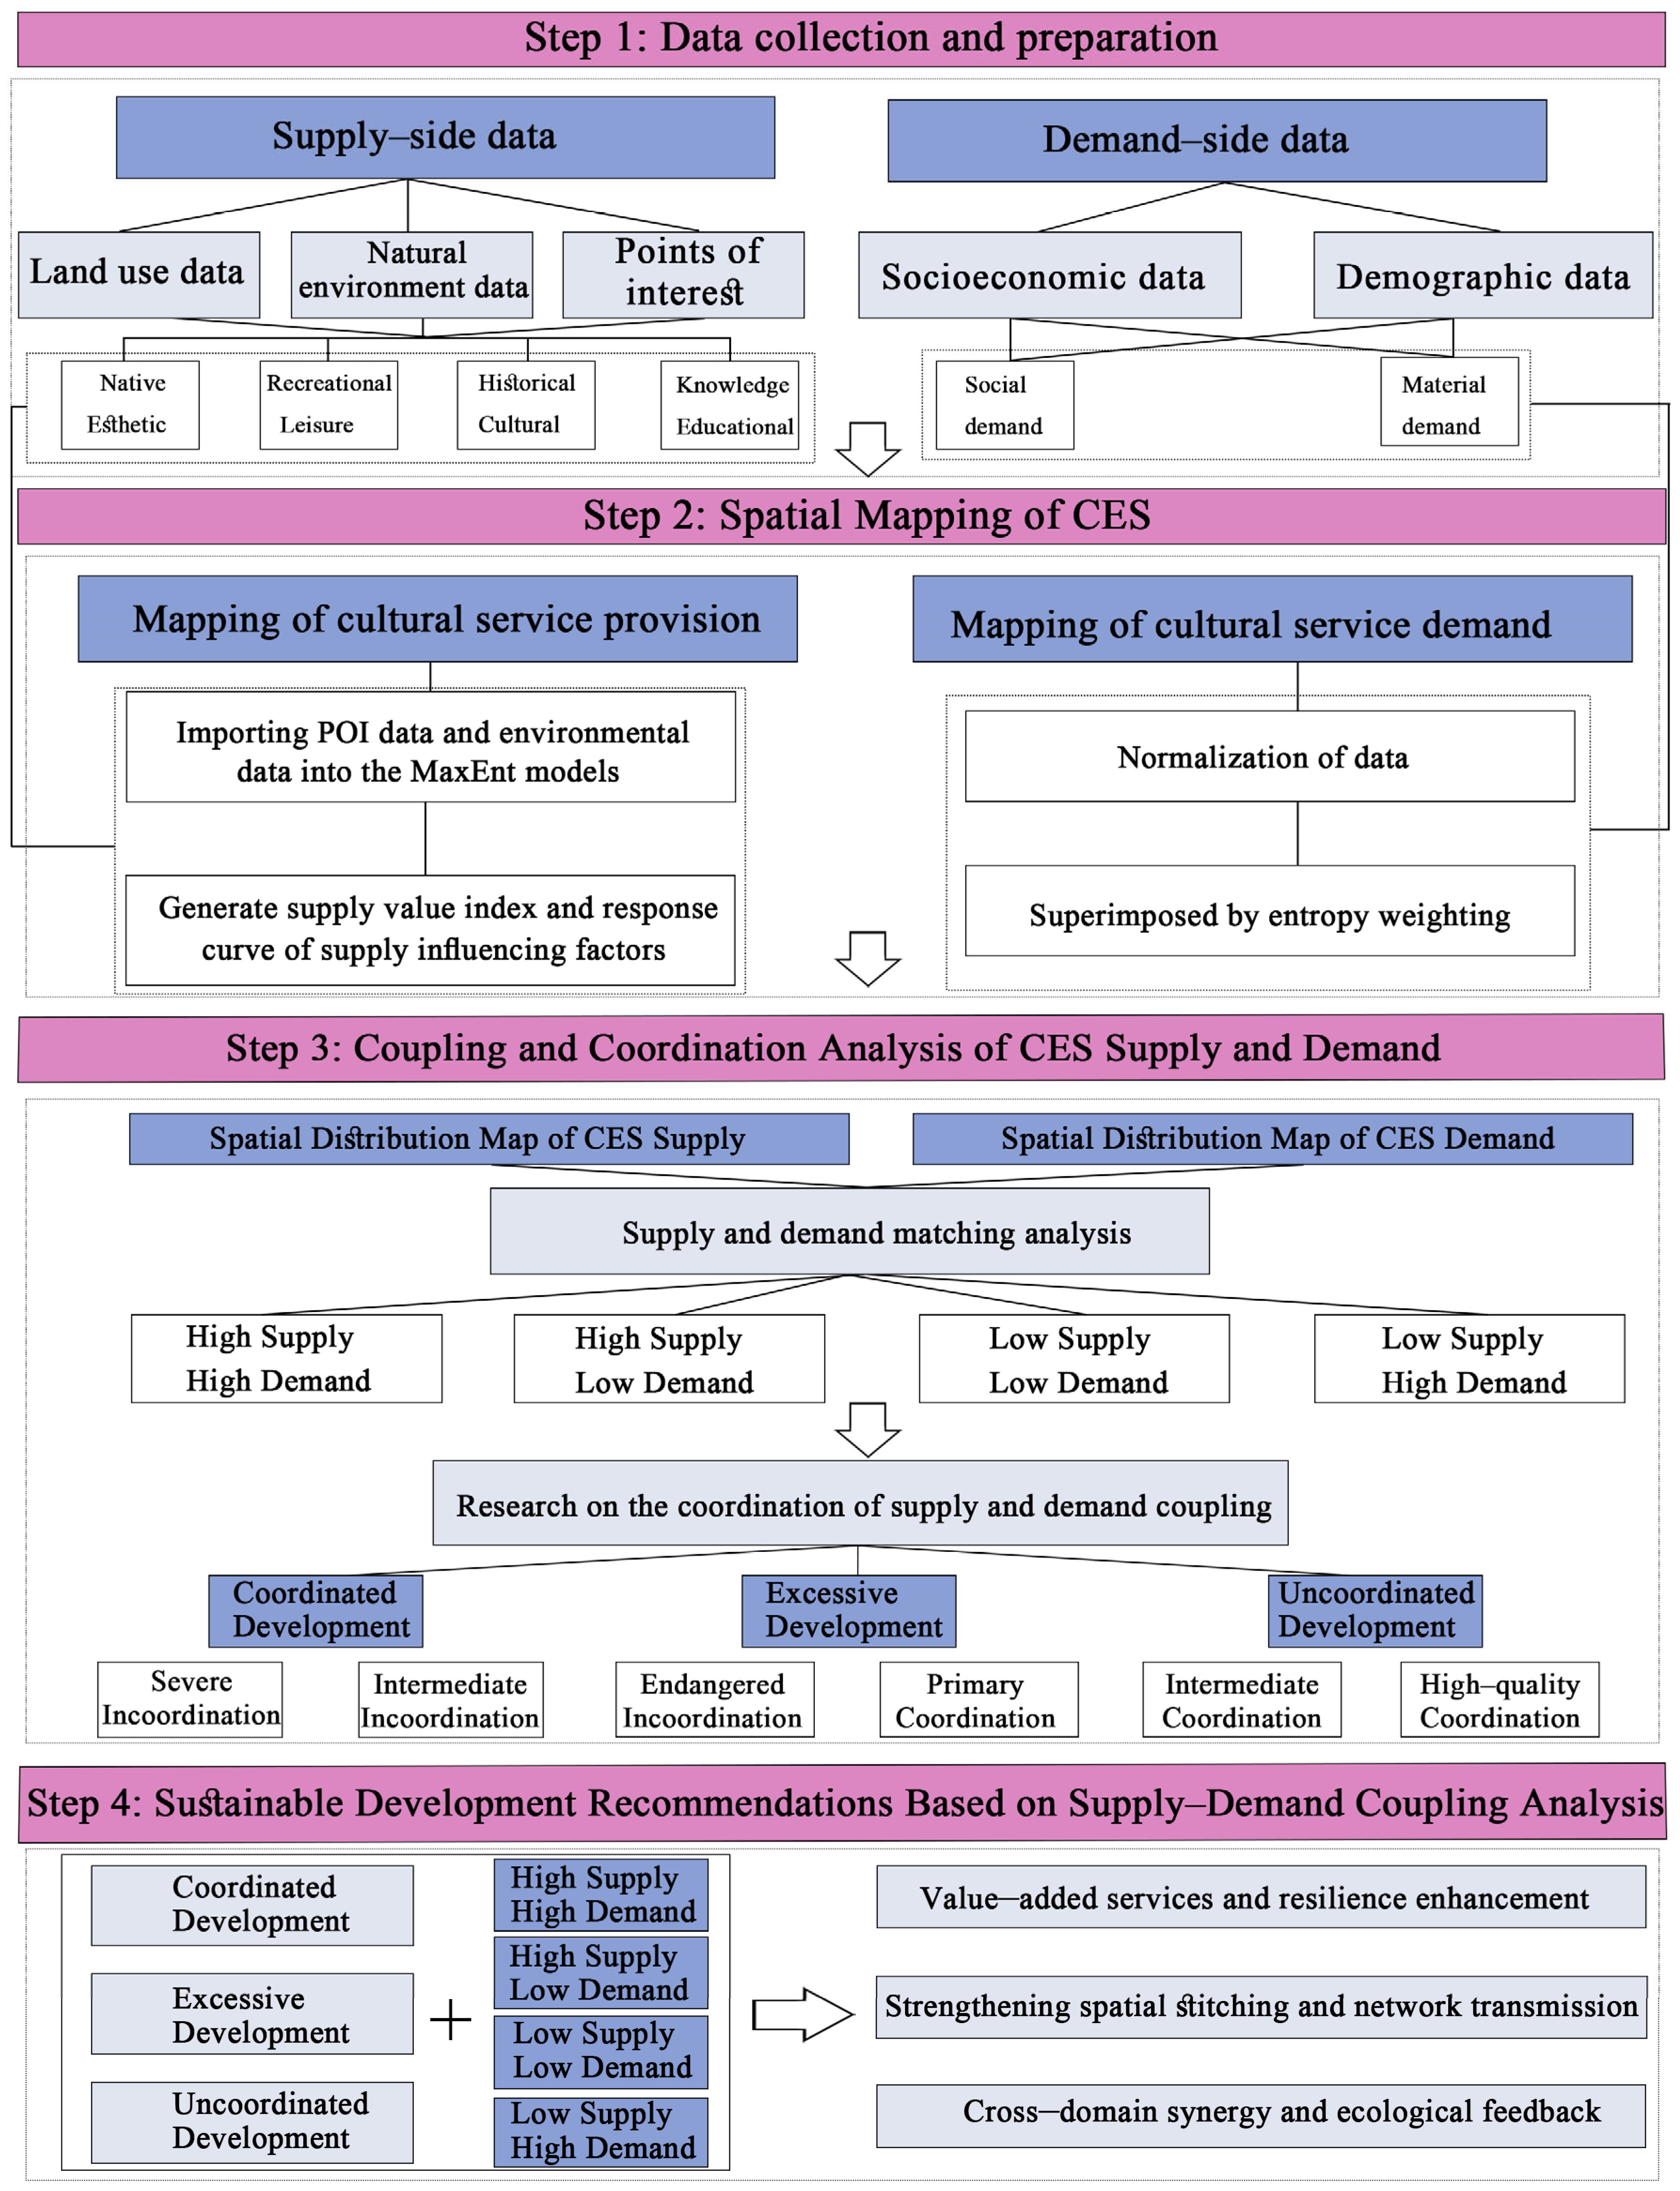
2.3. Methods
- (1)
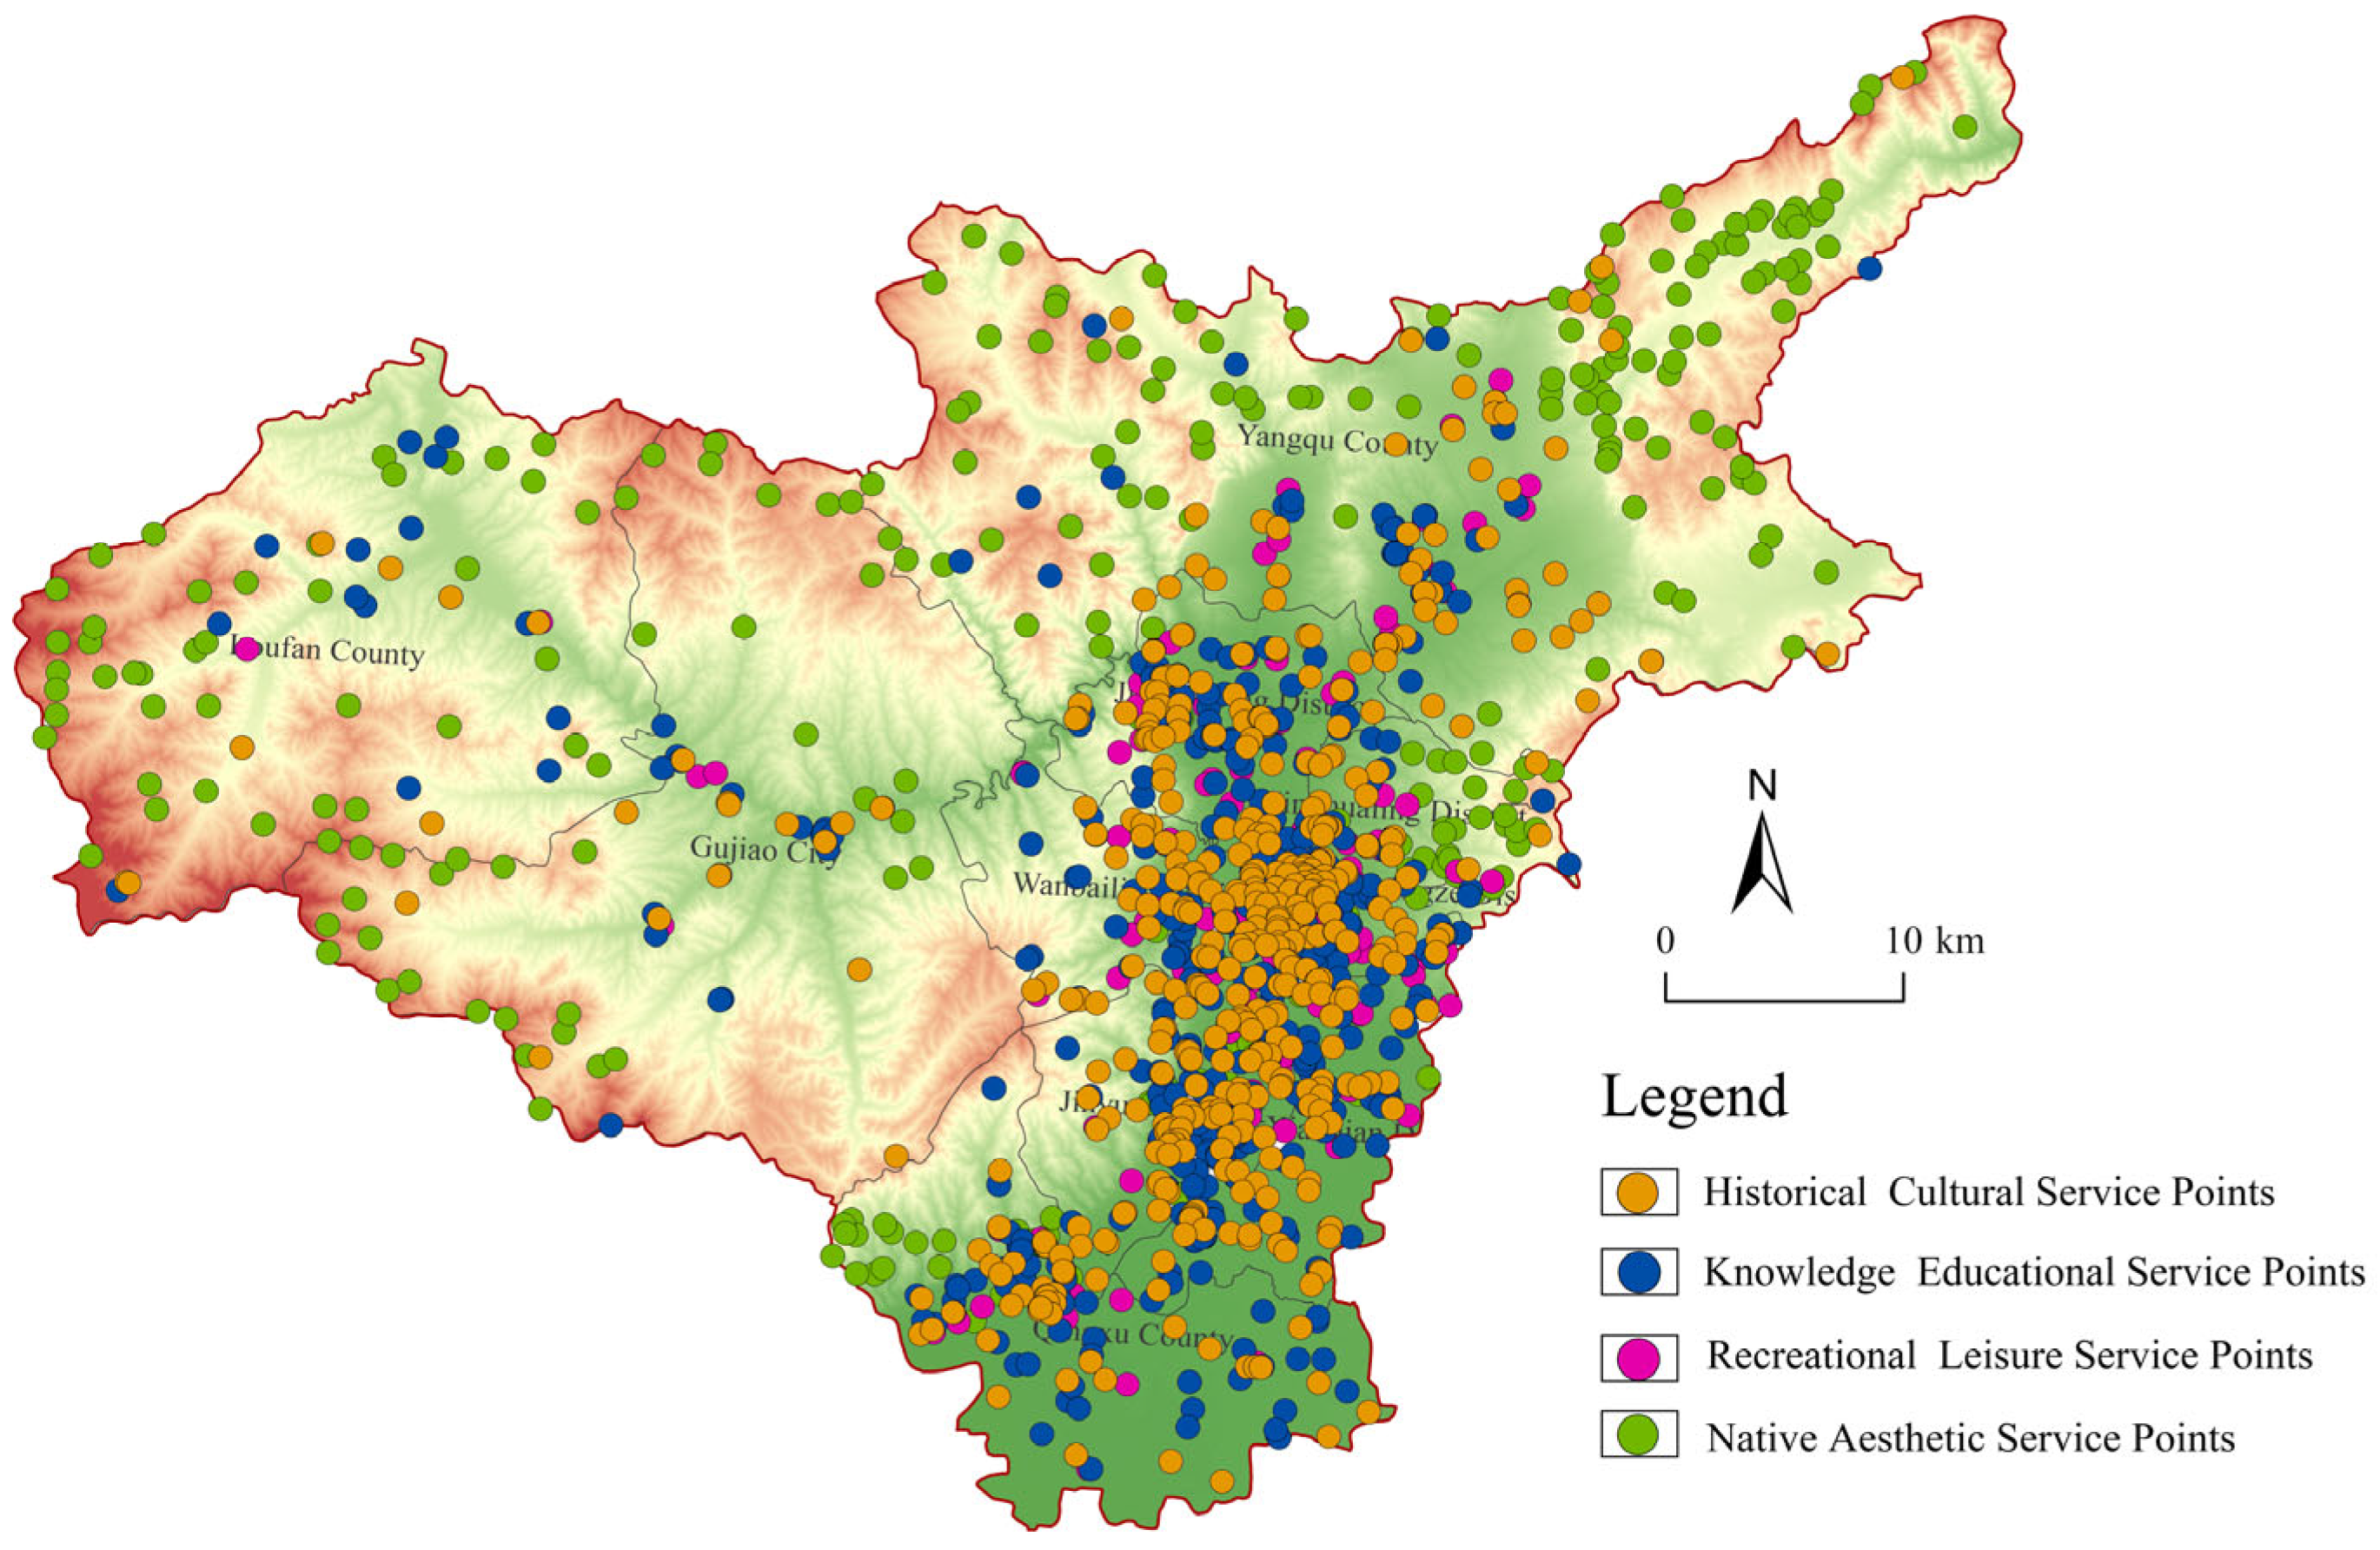
- Data collection and processing: POIs obtained from the Gaode Map API were screened and categorized to establish a POI dataset as social data. A comprehensive literature review identified the environmental factors influencing various CES supplies, and an environmental factor database was constructed.
- (2)
- Model input and analysis: The POI dataset and environmental factors were inputted into the MaxEnt model. CES supply maps were generated and quantified using both natural and anthropogenic variables. The determinant variables and their impacts on the CES supply in Taiyuan City were quantified. CES demand levels were quantified from two dimensions: social and material demands.
- (3)
- Supply–demand coordination analysis: The research units are categorized into four distinct matching typologies through the supply–demand matching analysis, followed by an examination of coordinated development levels utilizing a coupling coordination model to assess the evolutionary progression of the supply–demand equilibrium.
- (4)
- Policy management and recommendations for sustainable development: Specific measures and suggestions for different types of coupling coordination development.
2.3.1. Quantification of CES Supply and Influencing Factors
2.3.2. Quantification of CES Demand
- (a)
- Indicator normalization:
- (b)
- The conversion of into proportion form is achieved through
- (c)
- The information entropy value for each indicator was calculated using the following formula:
- (d)
- The entropy weight for the i-th indicator is defined as follows:
- (e)
- Calculating weighted composite scores for CES demand values
2.3.3. CES Supply–Demand Balance and Coupling Coordination
3. Results
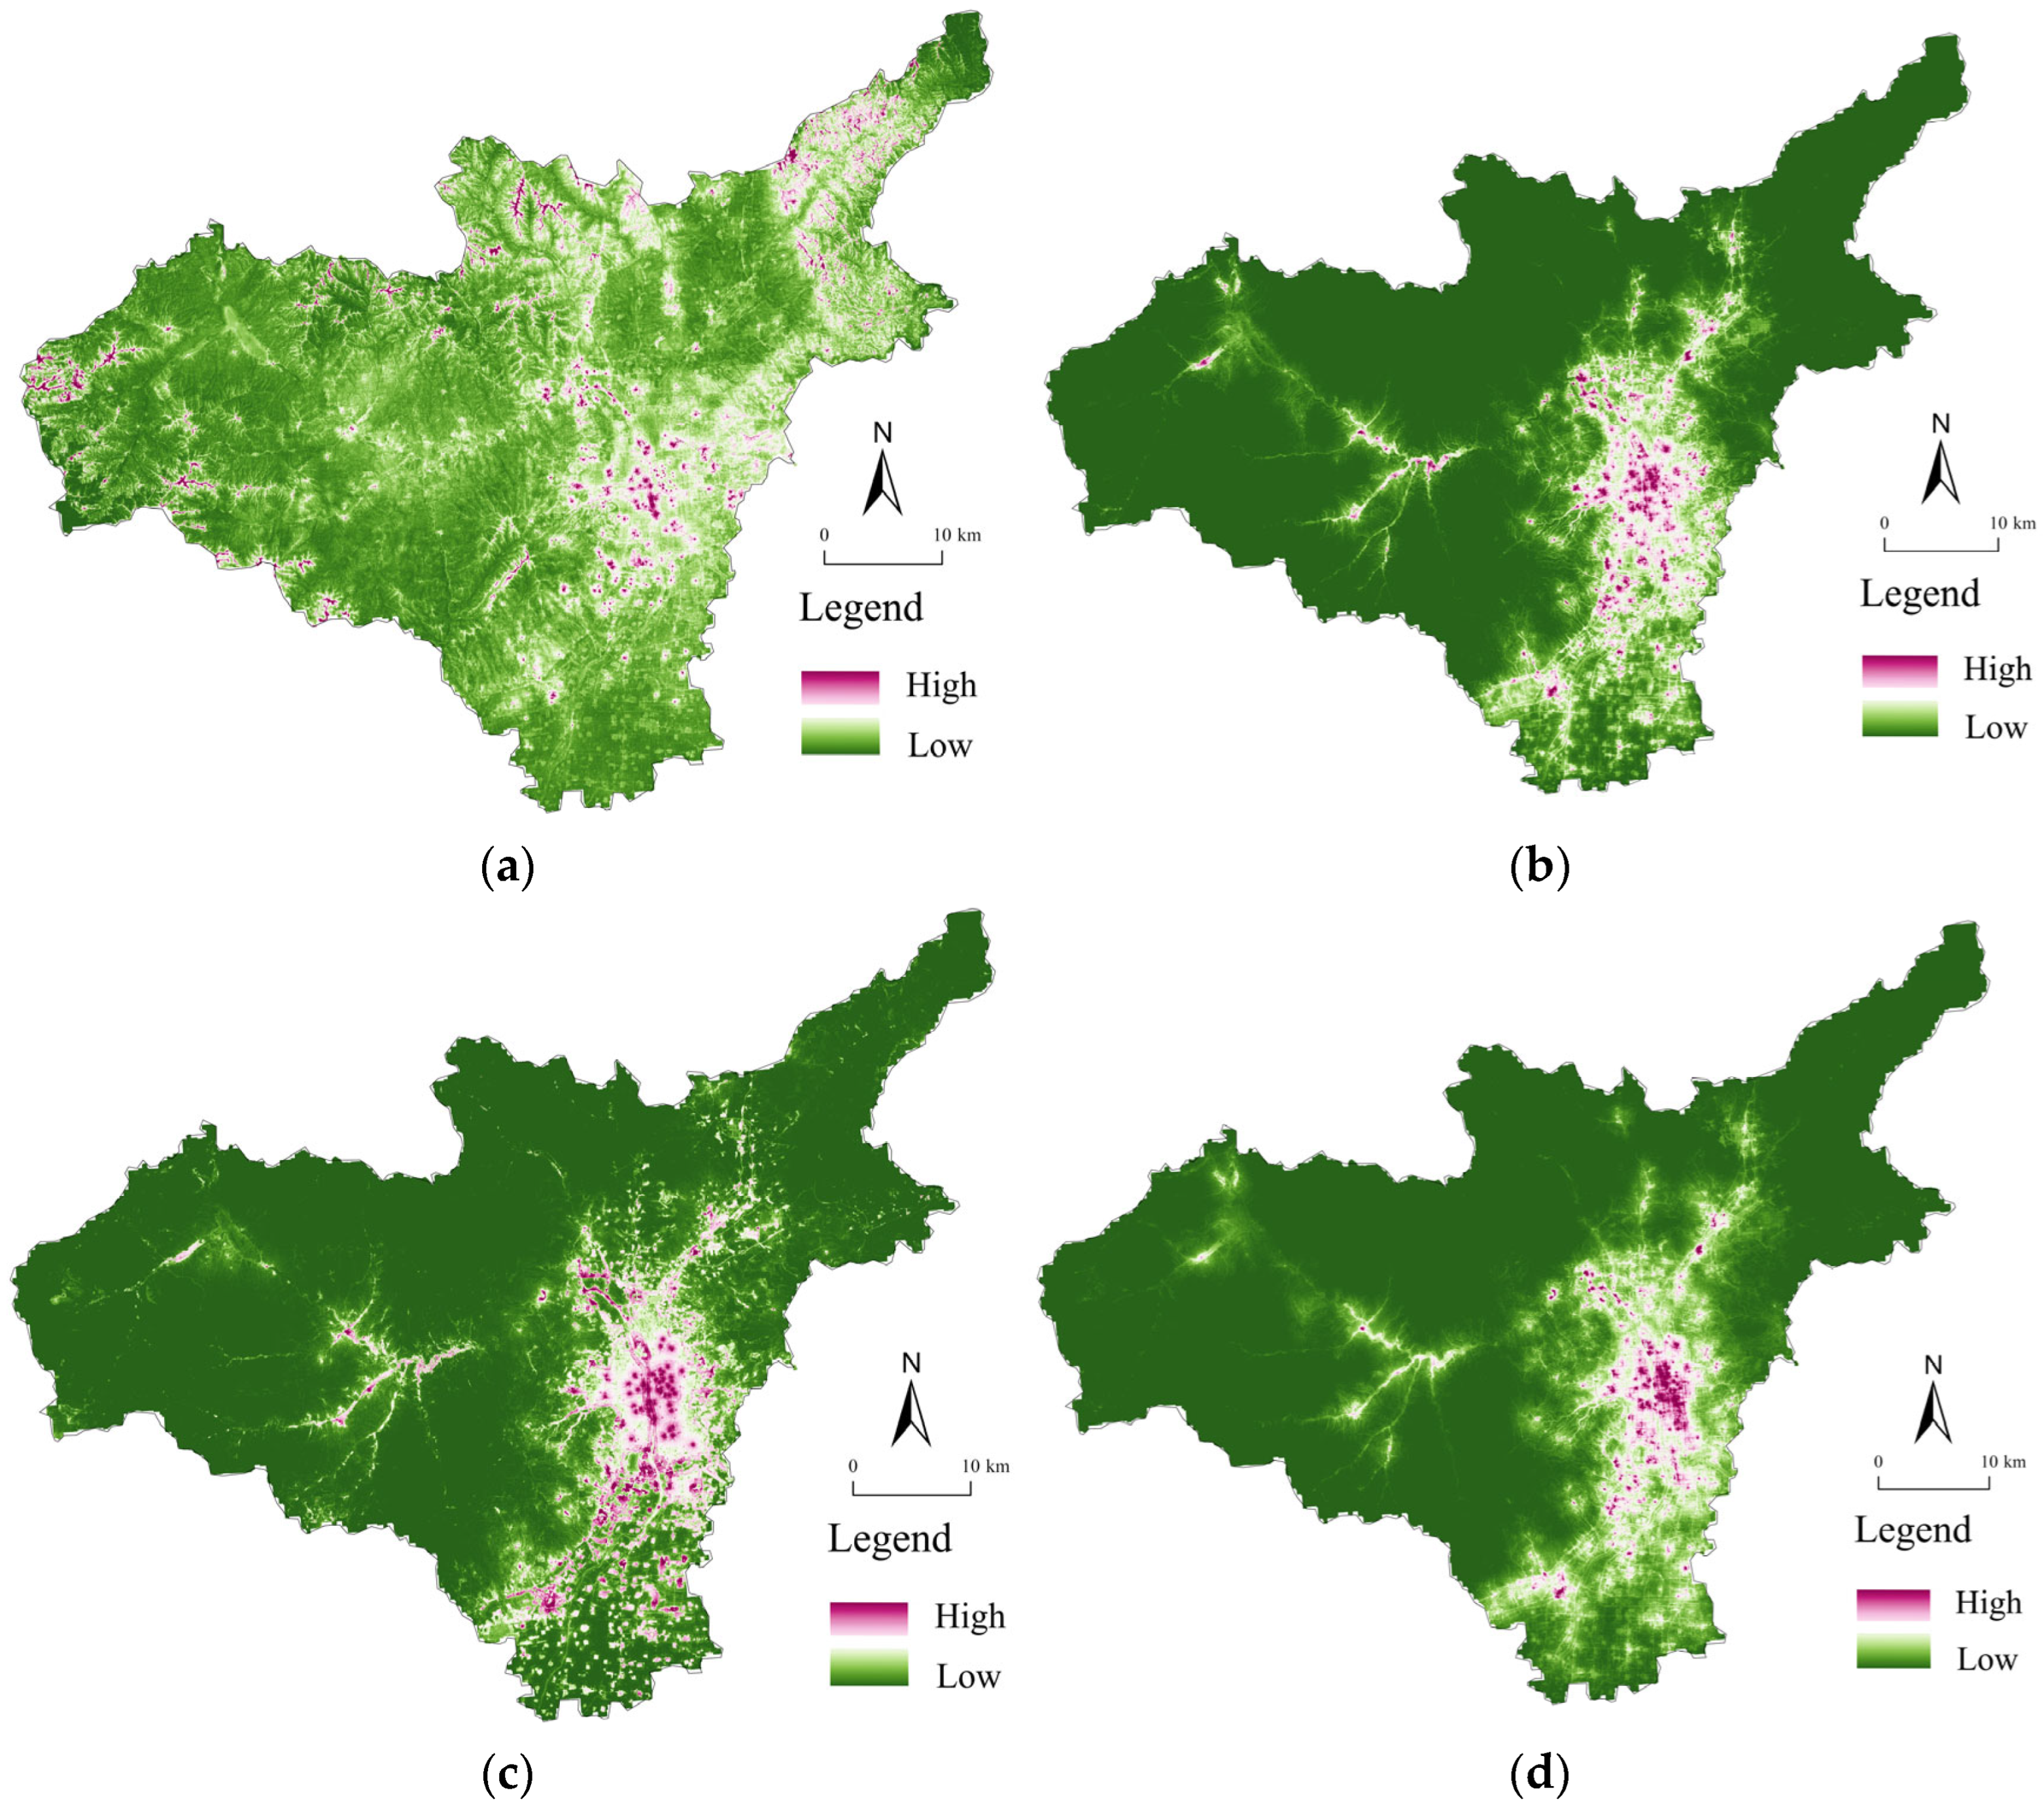
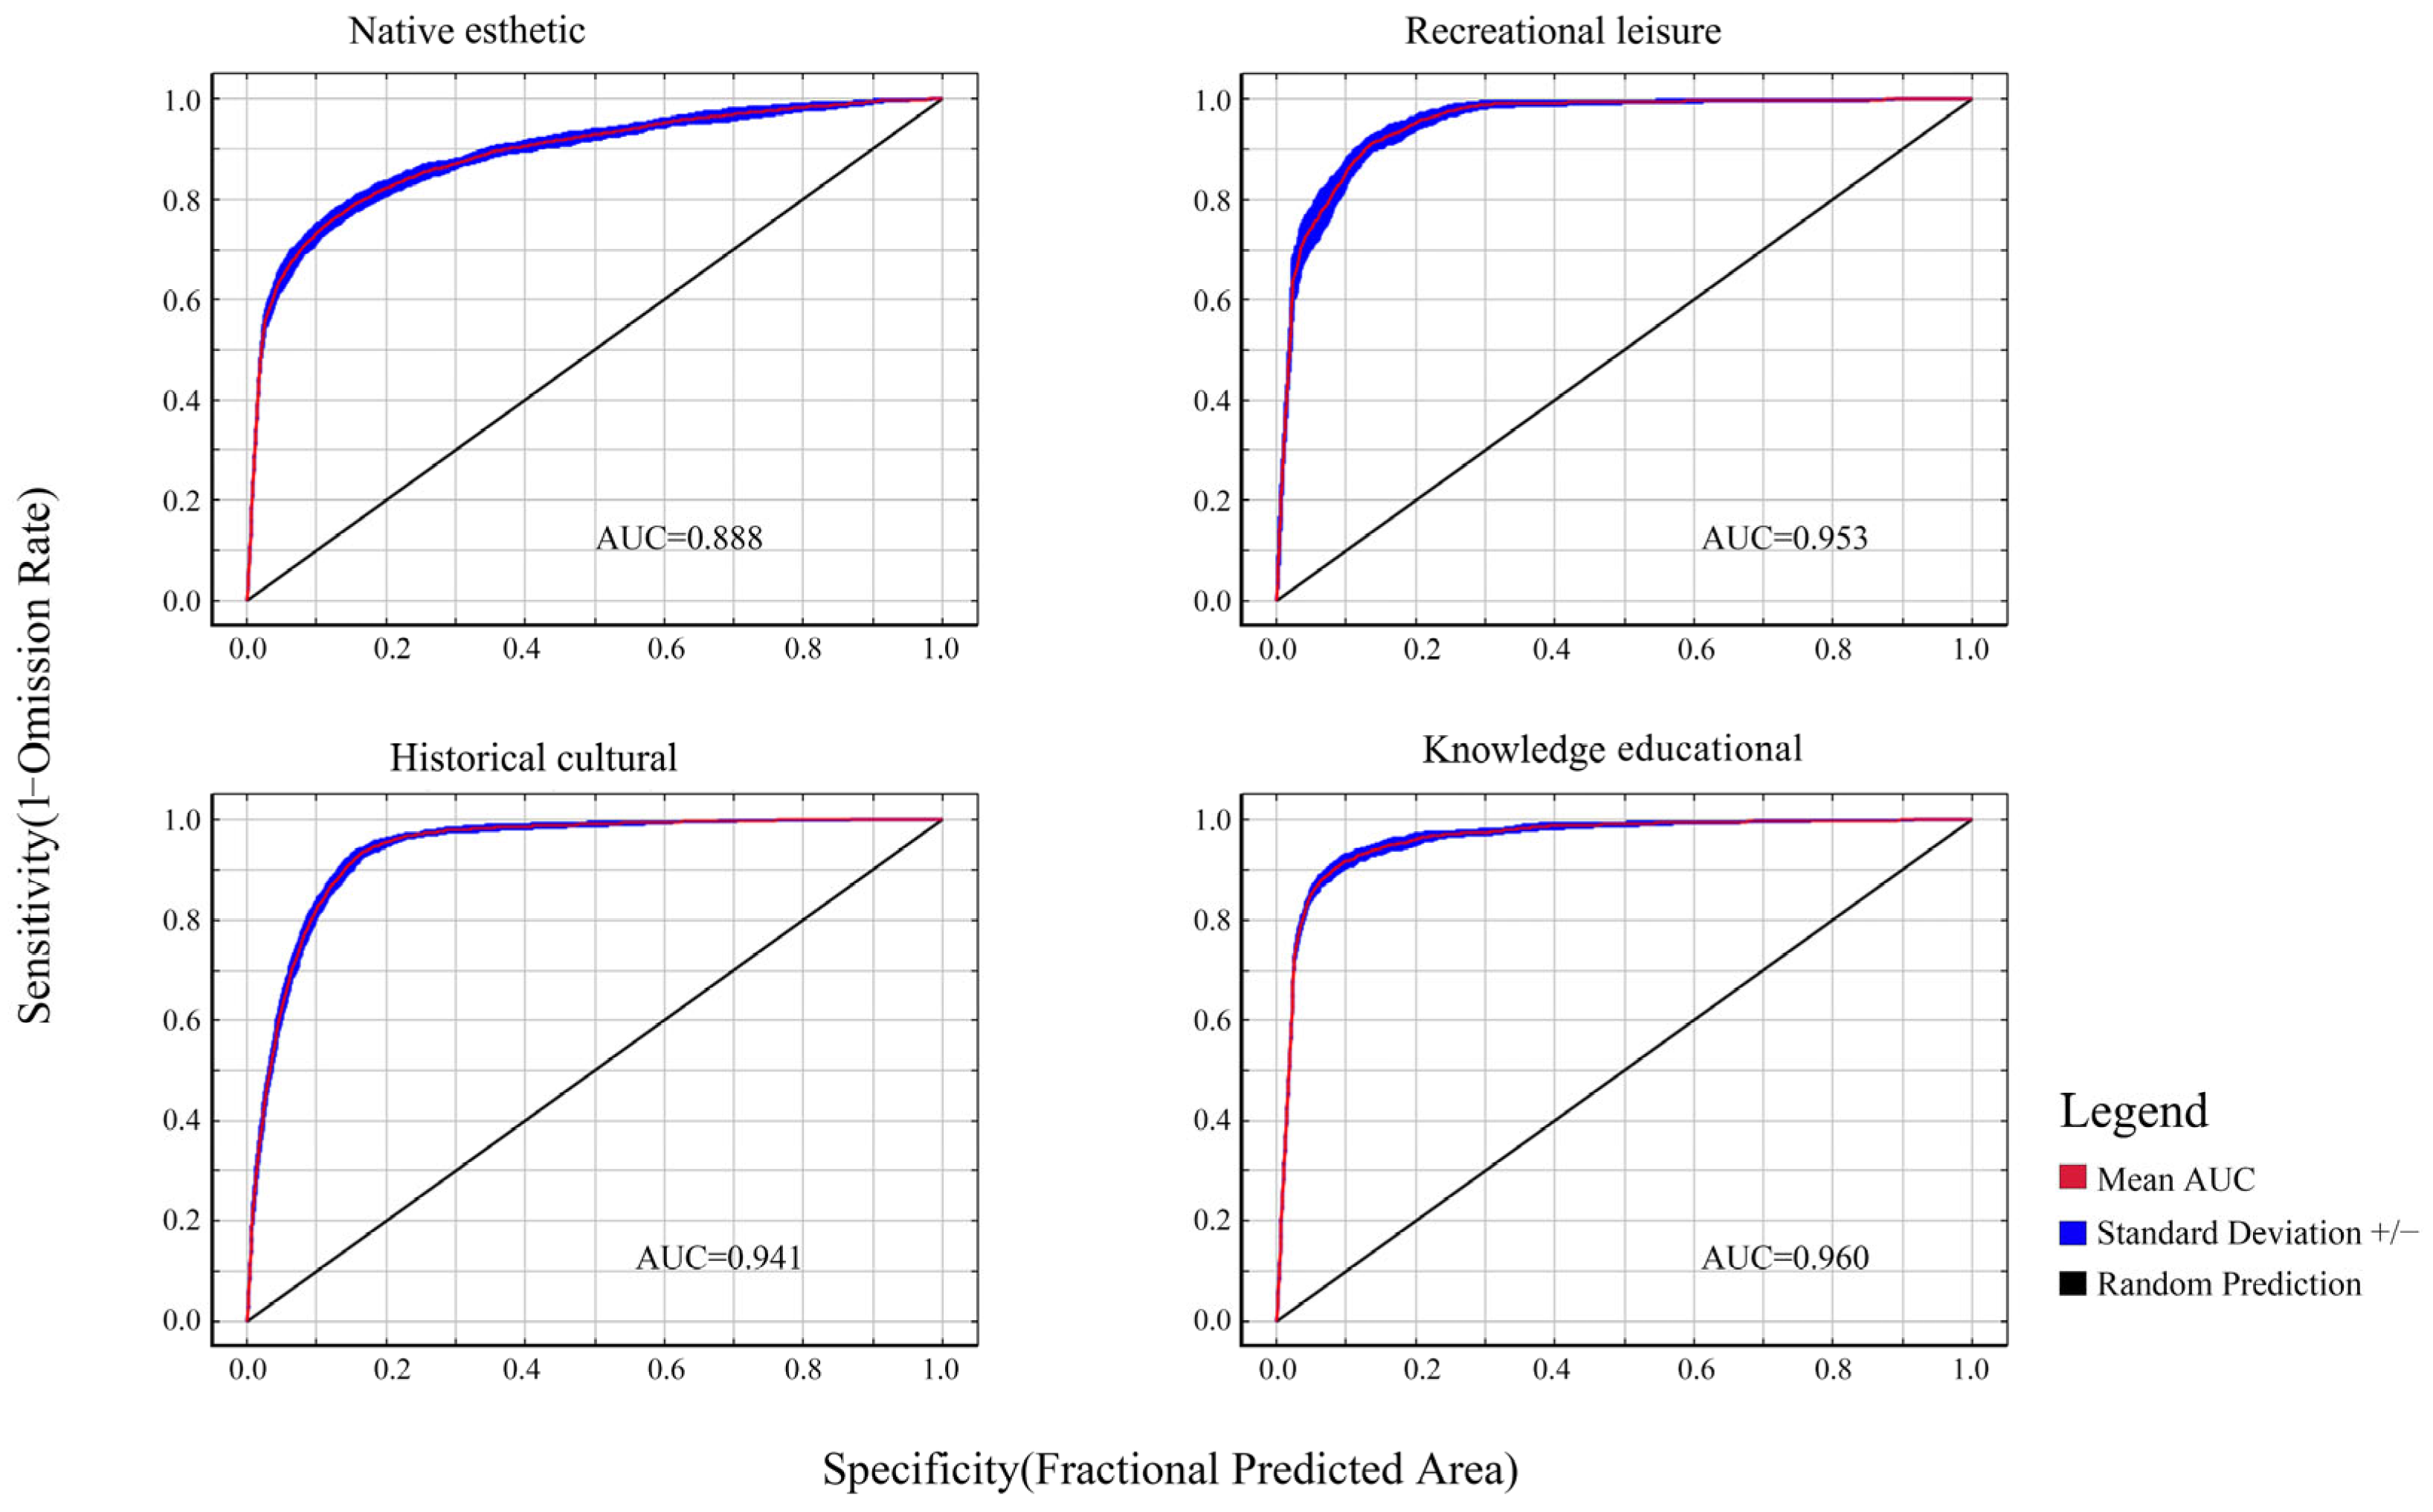
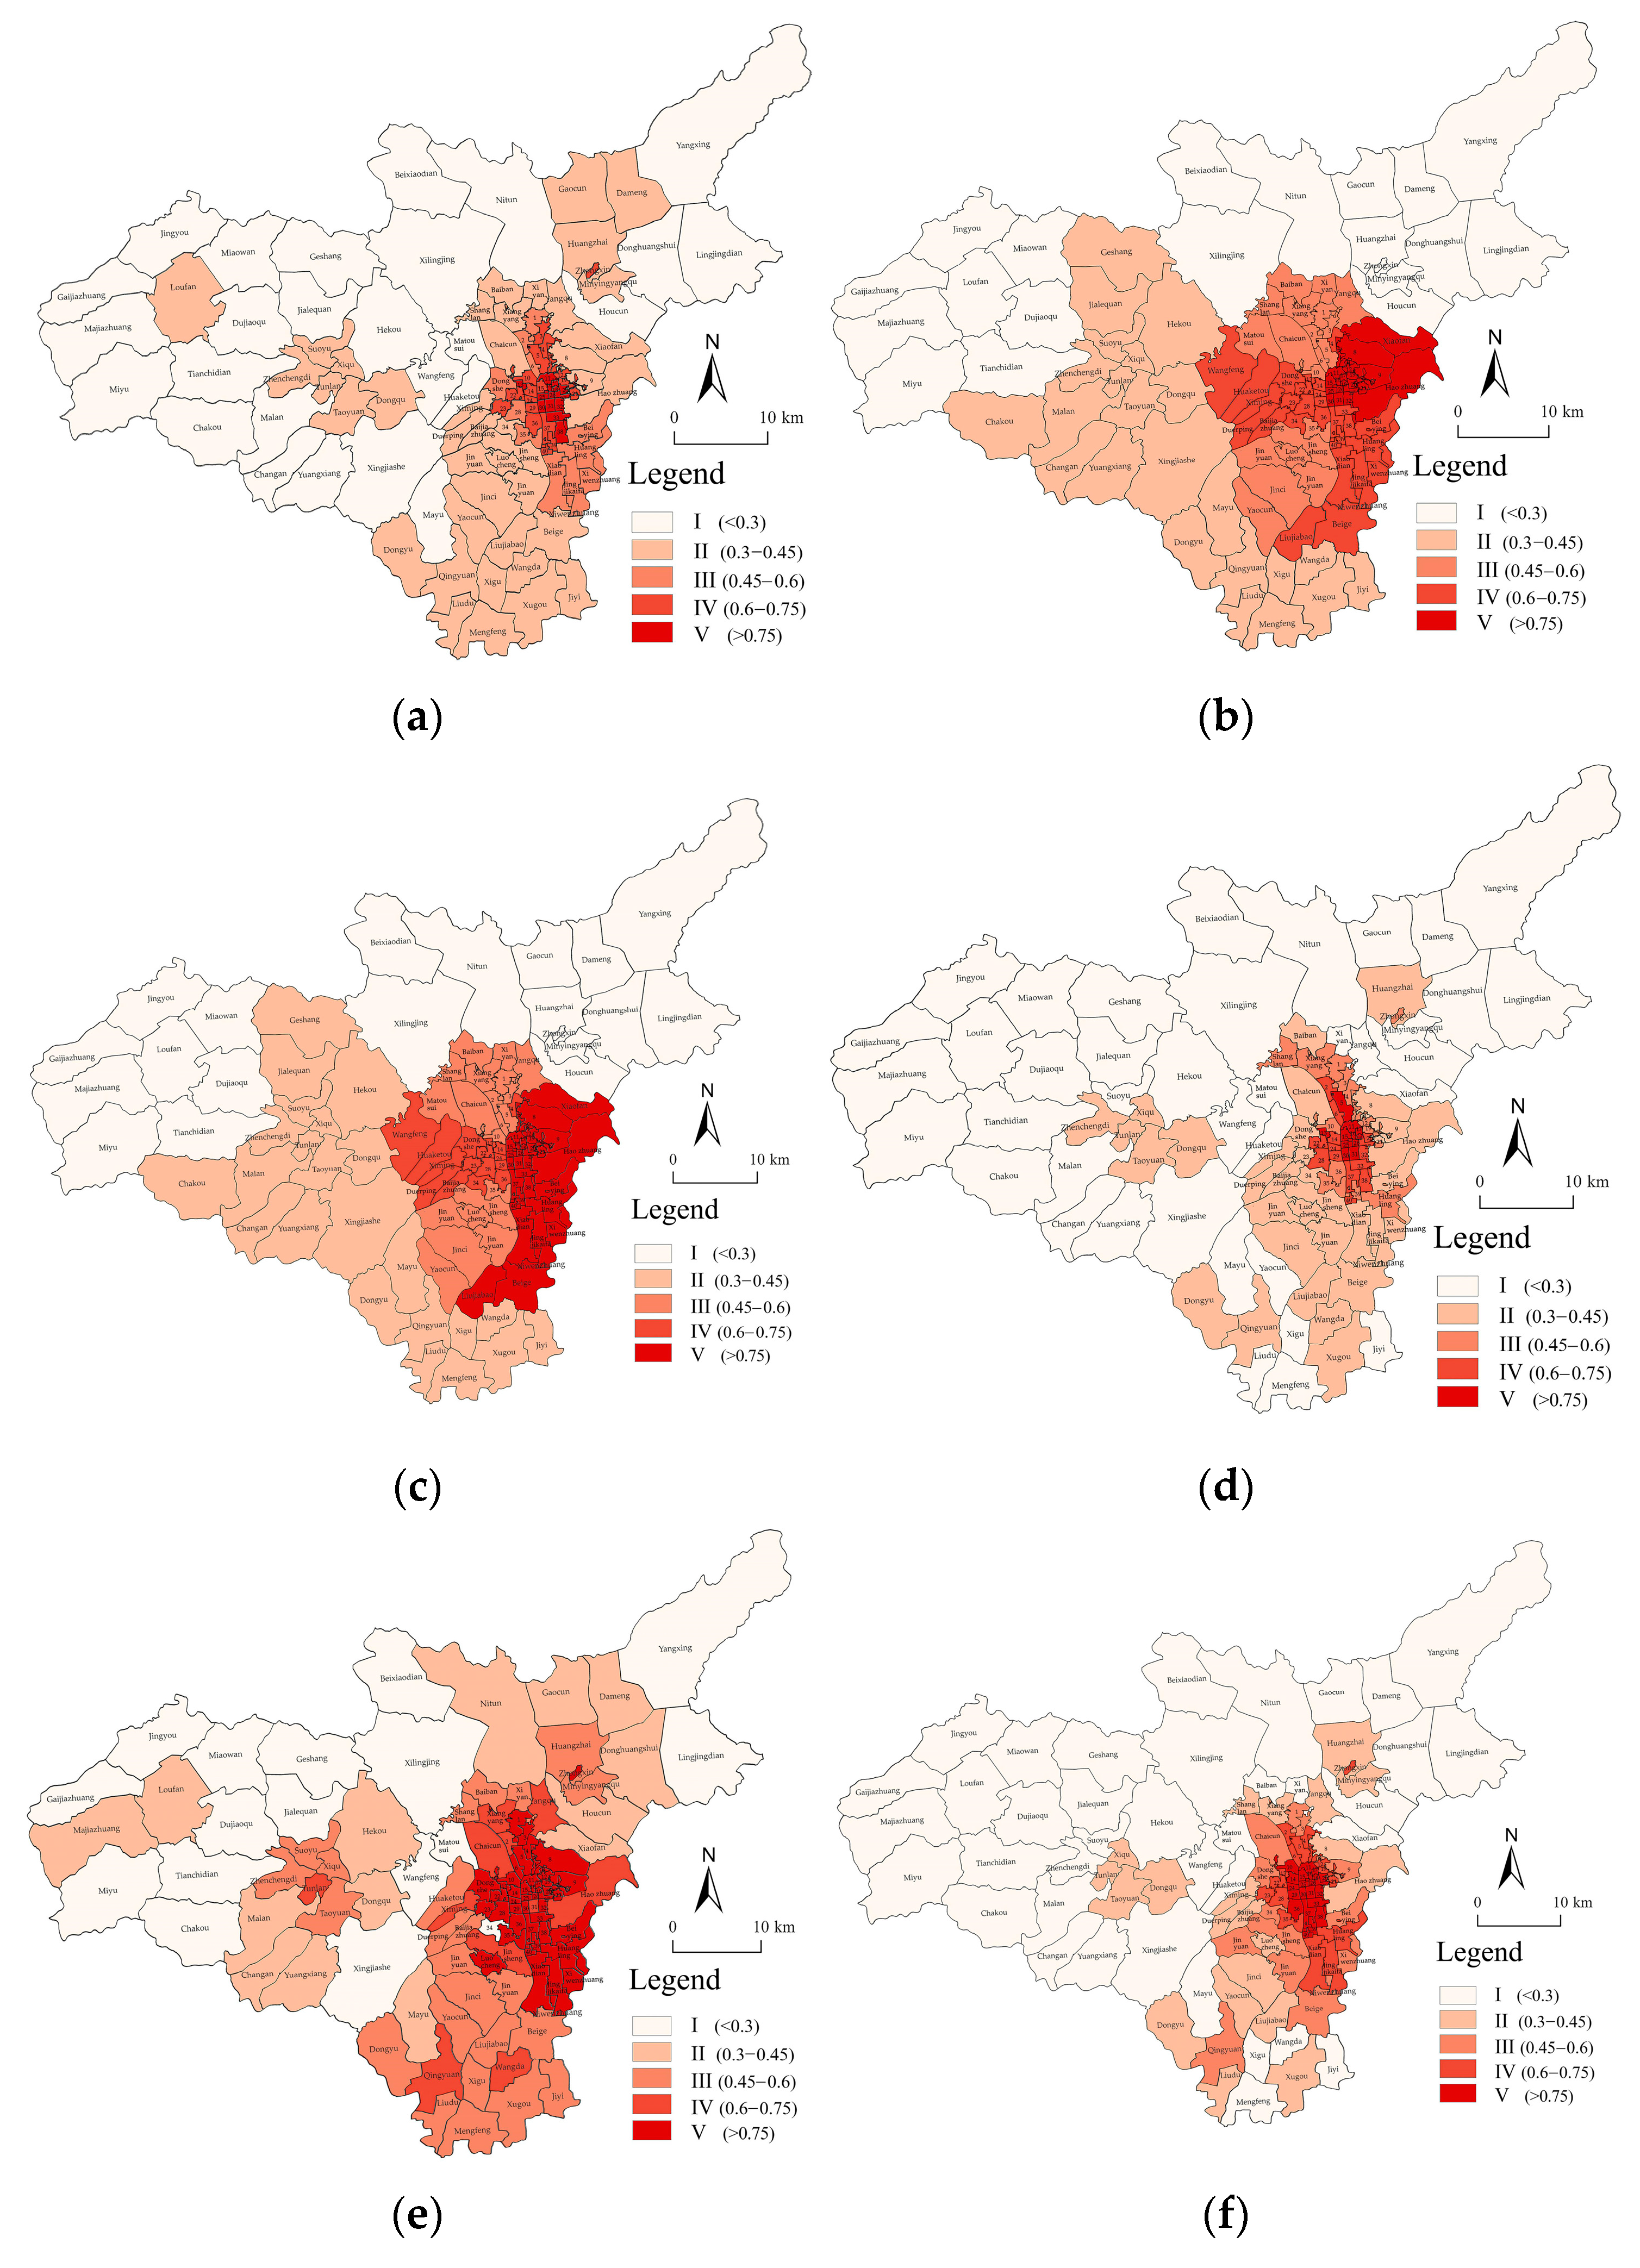
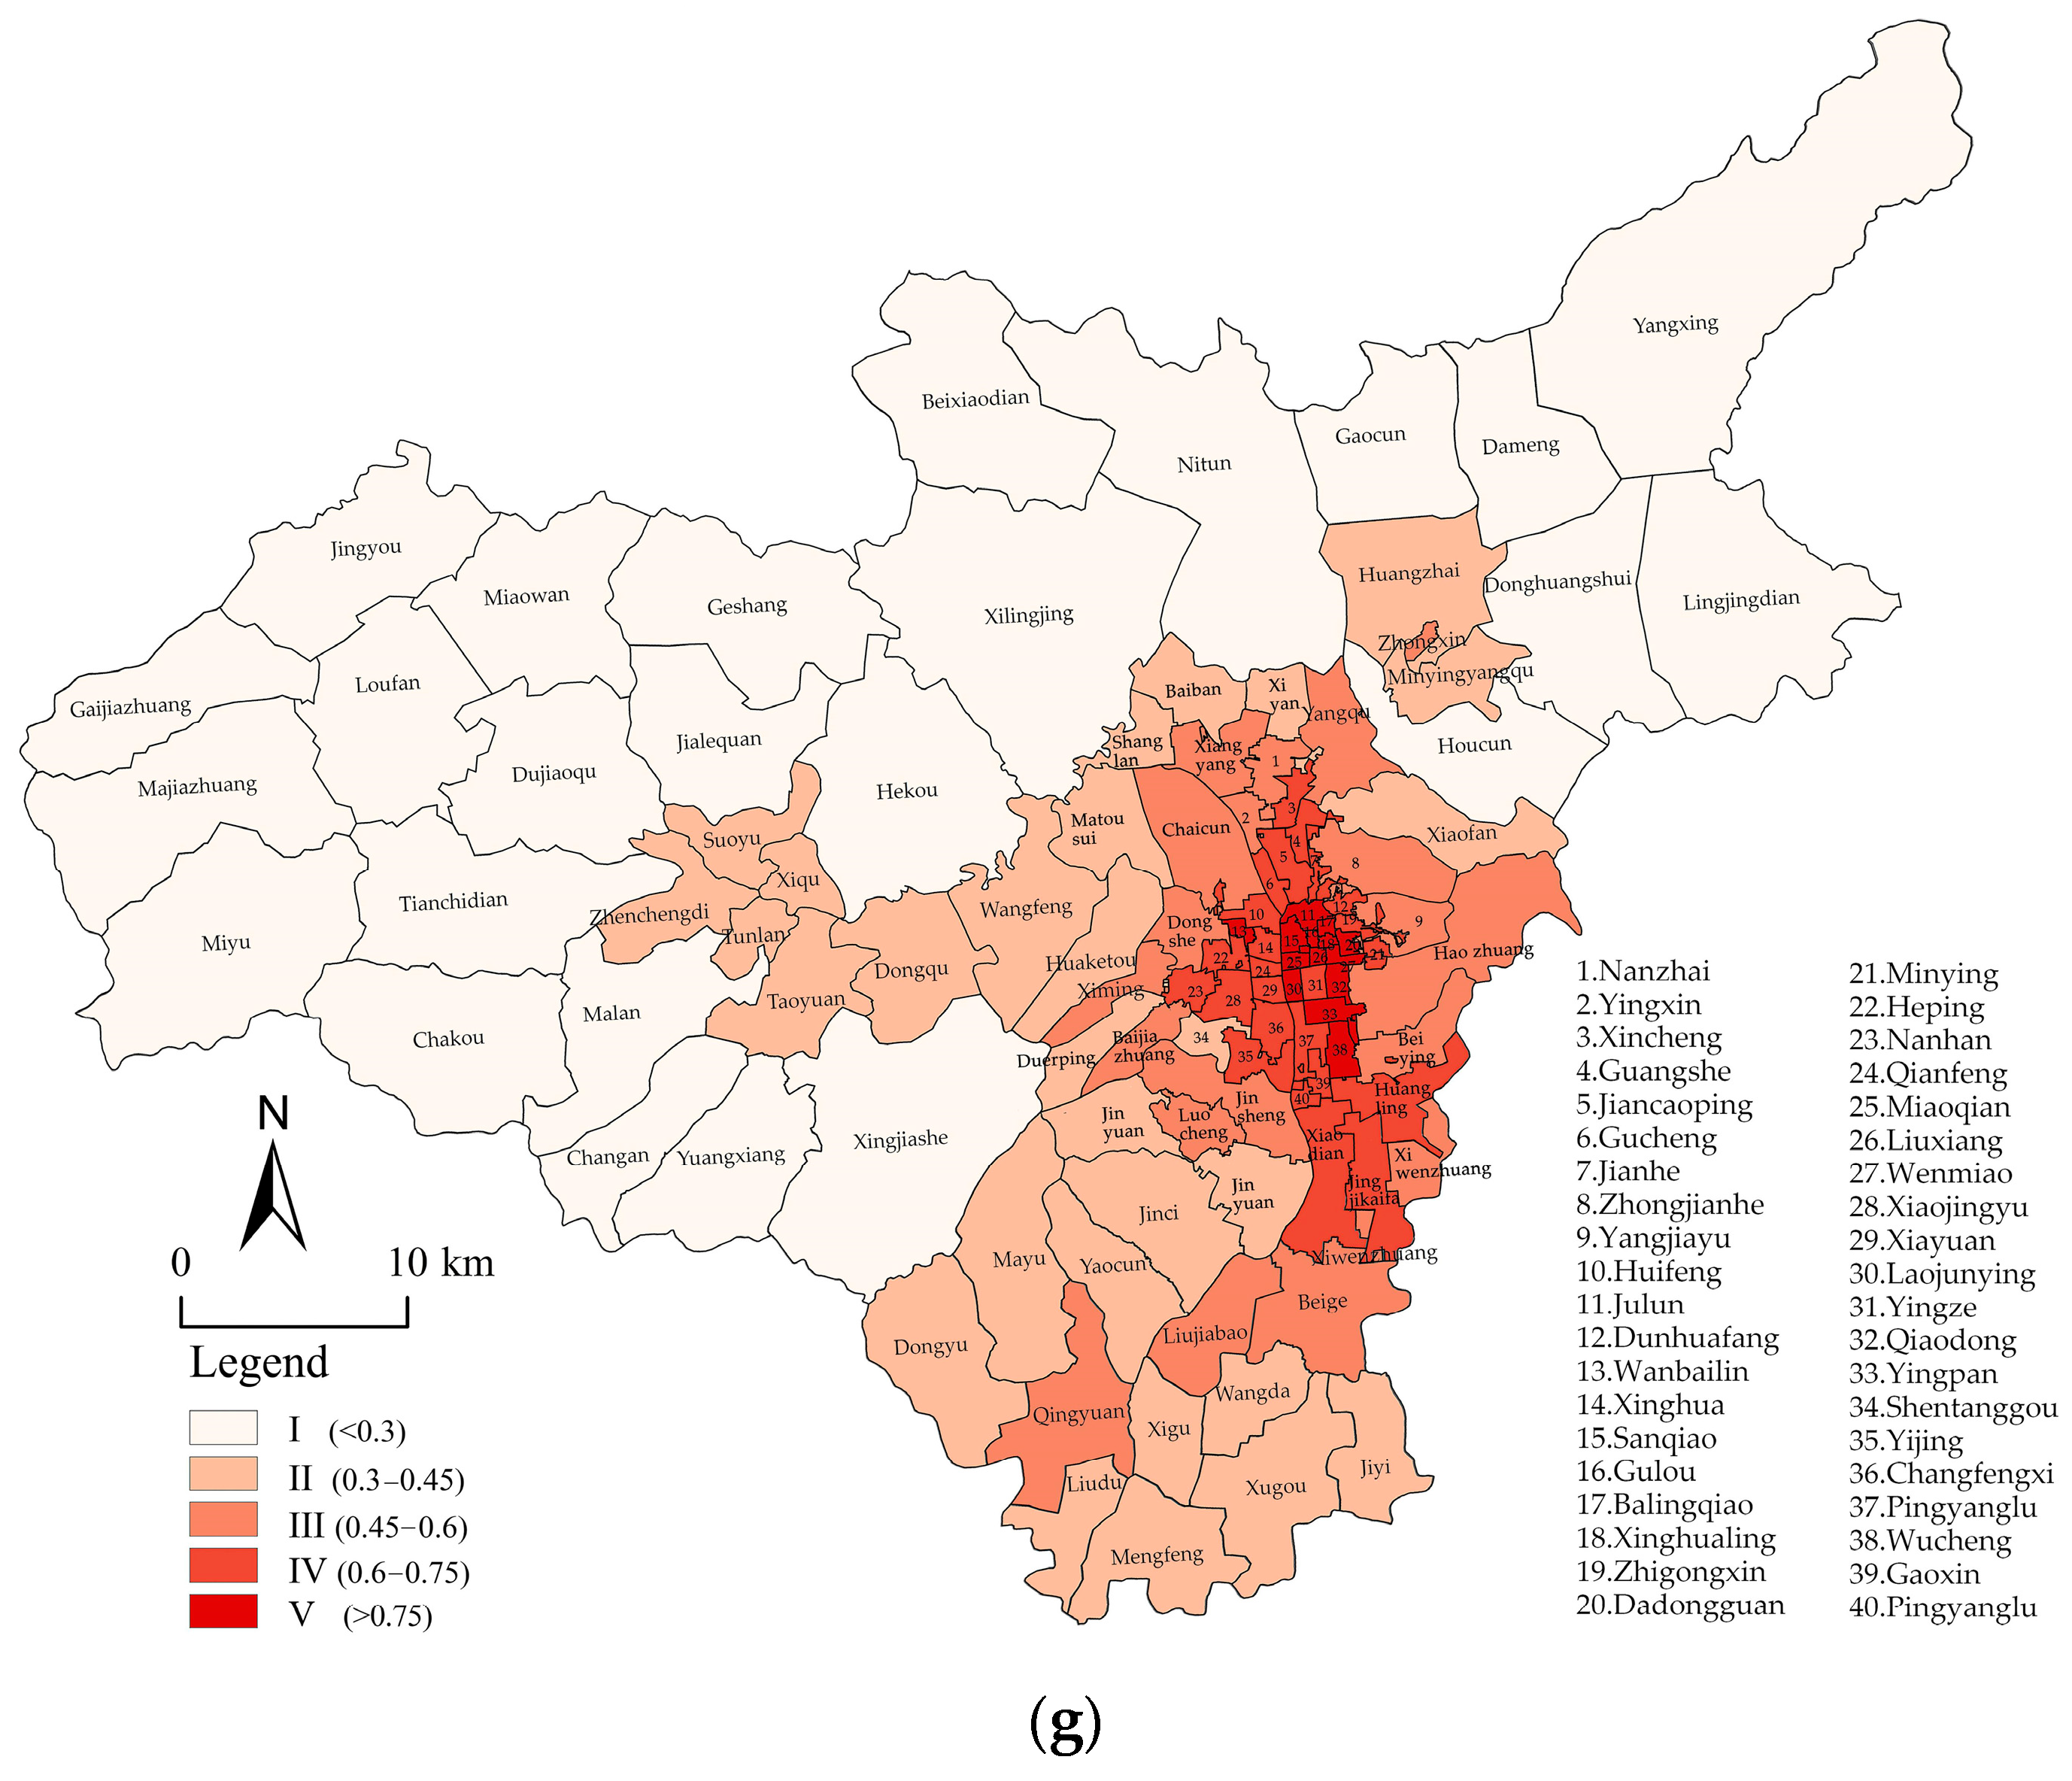
3.1. Measurement and Spatial Expression of CES Supply in Taiyuan City
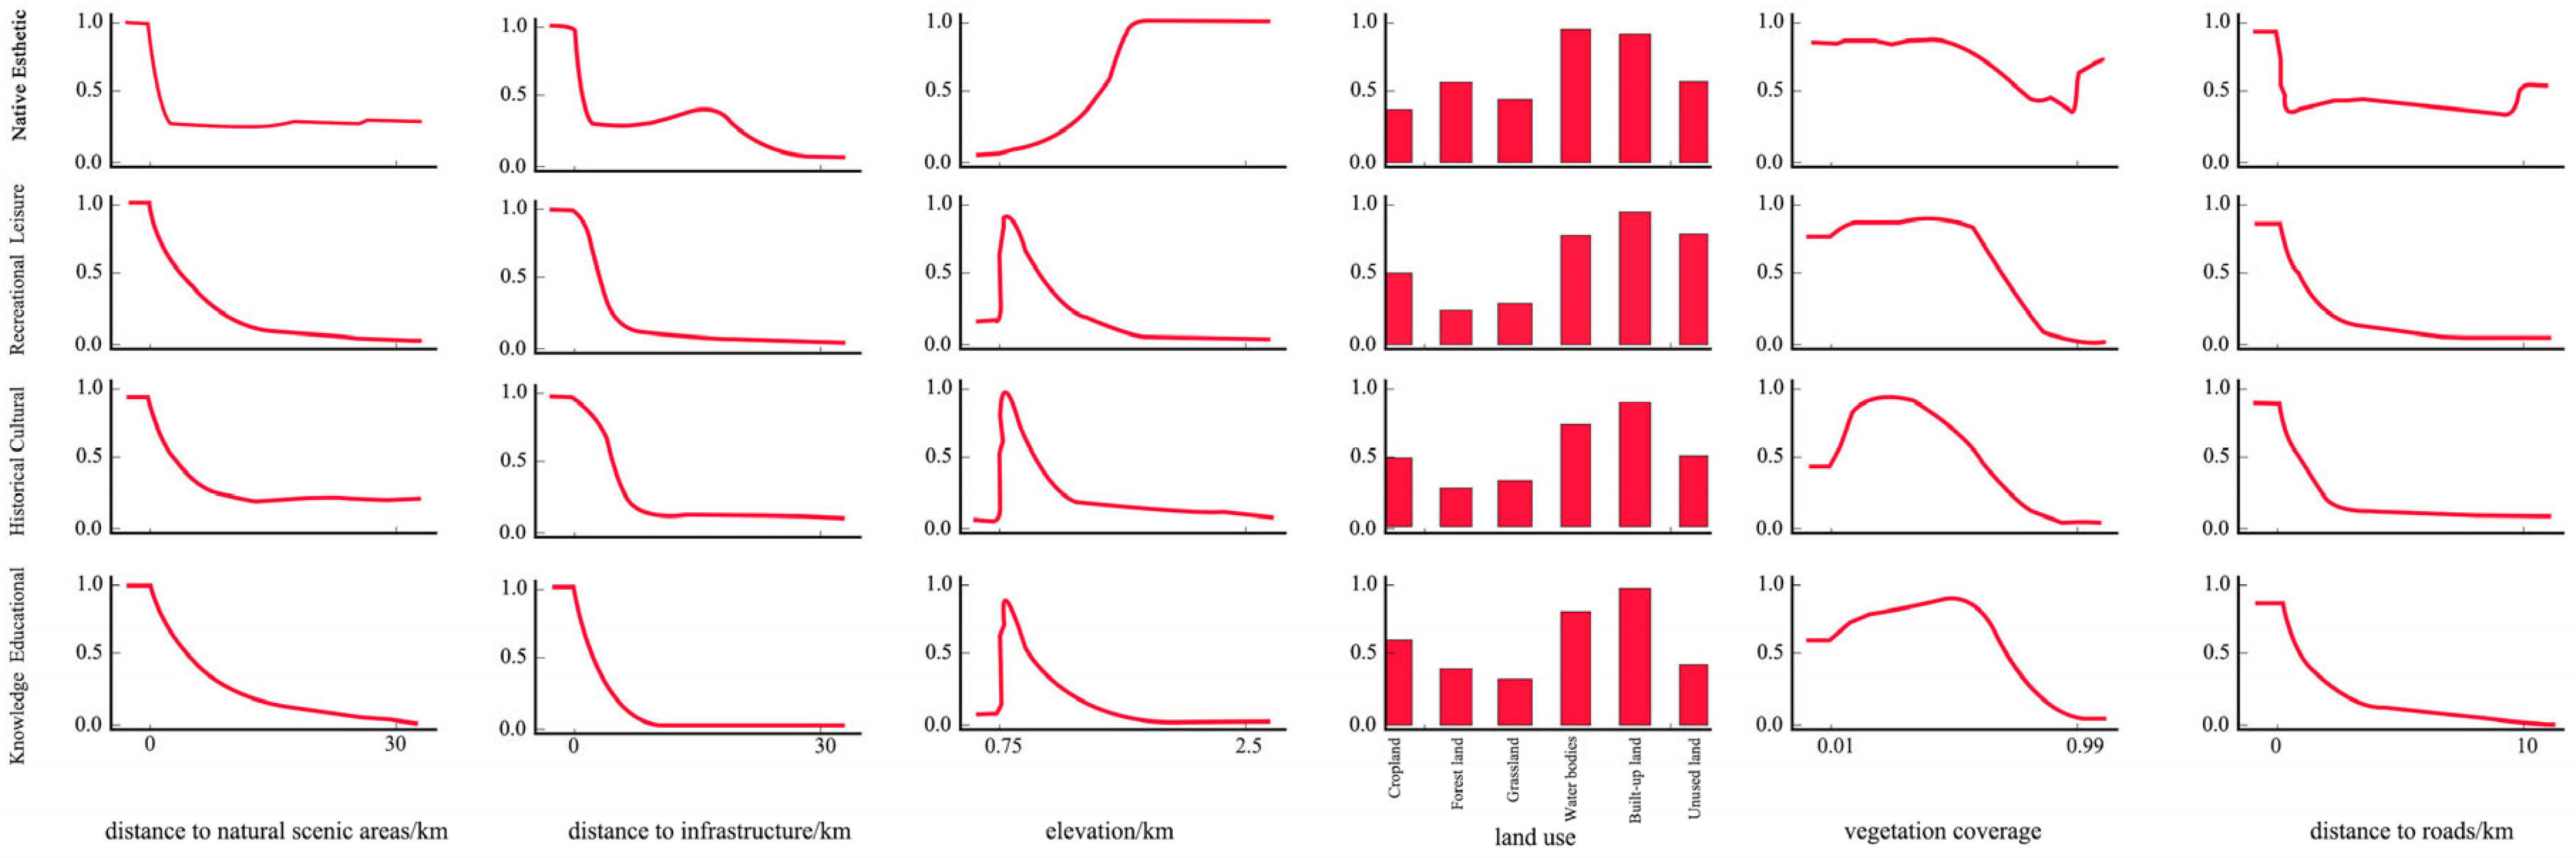
3.2. Analysis of Spatial Influencing Factors on CES Supply in Taiyuan City
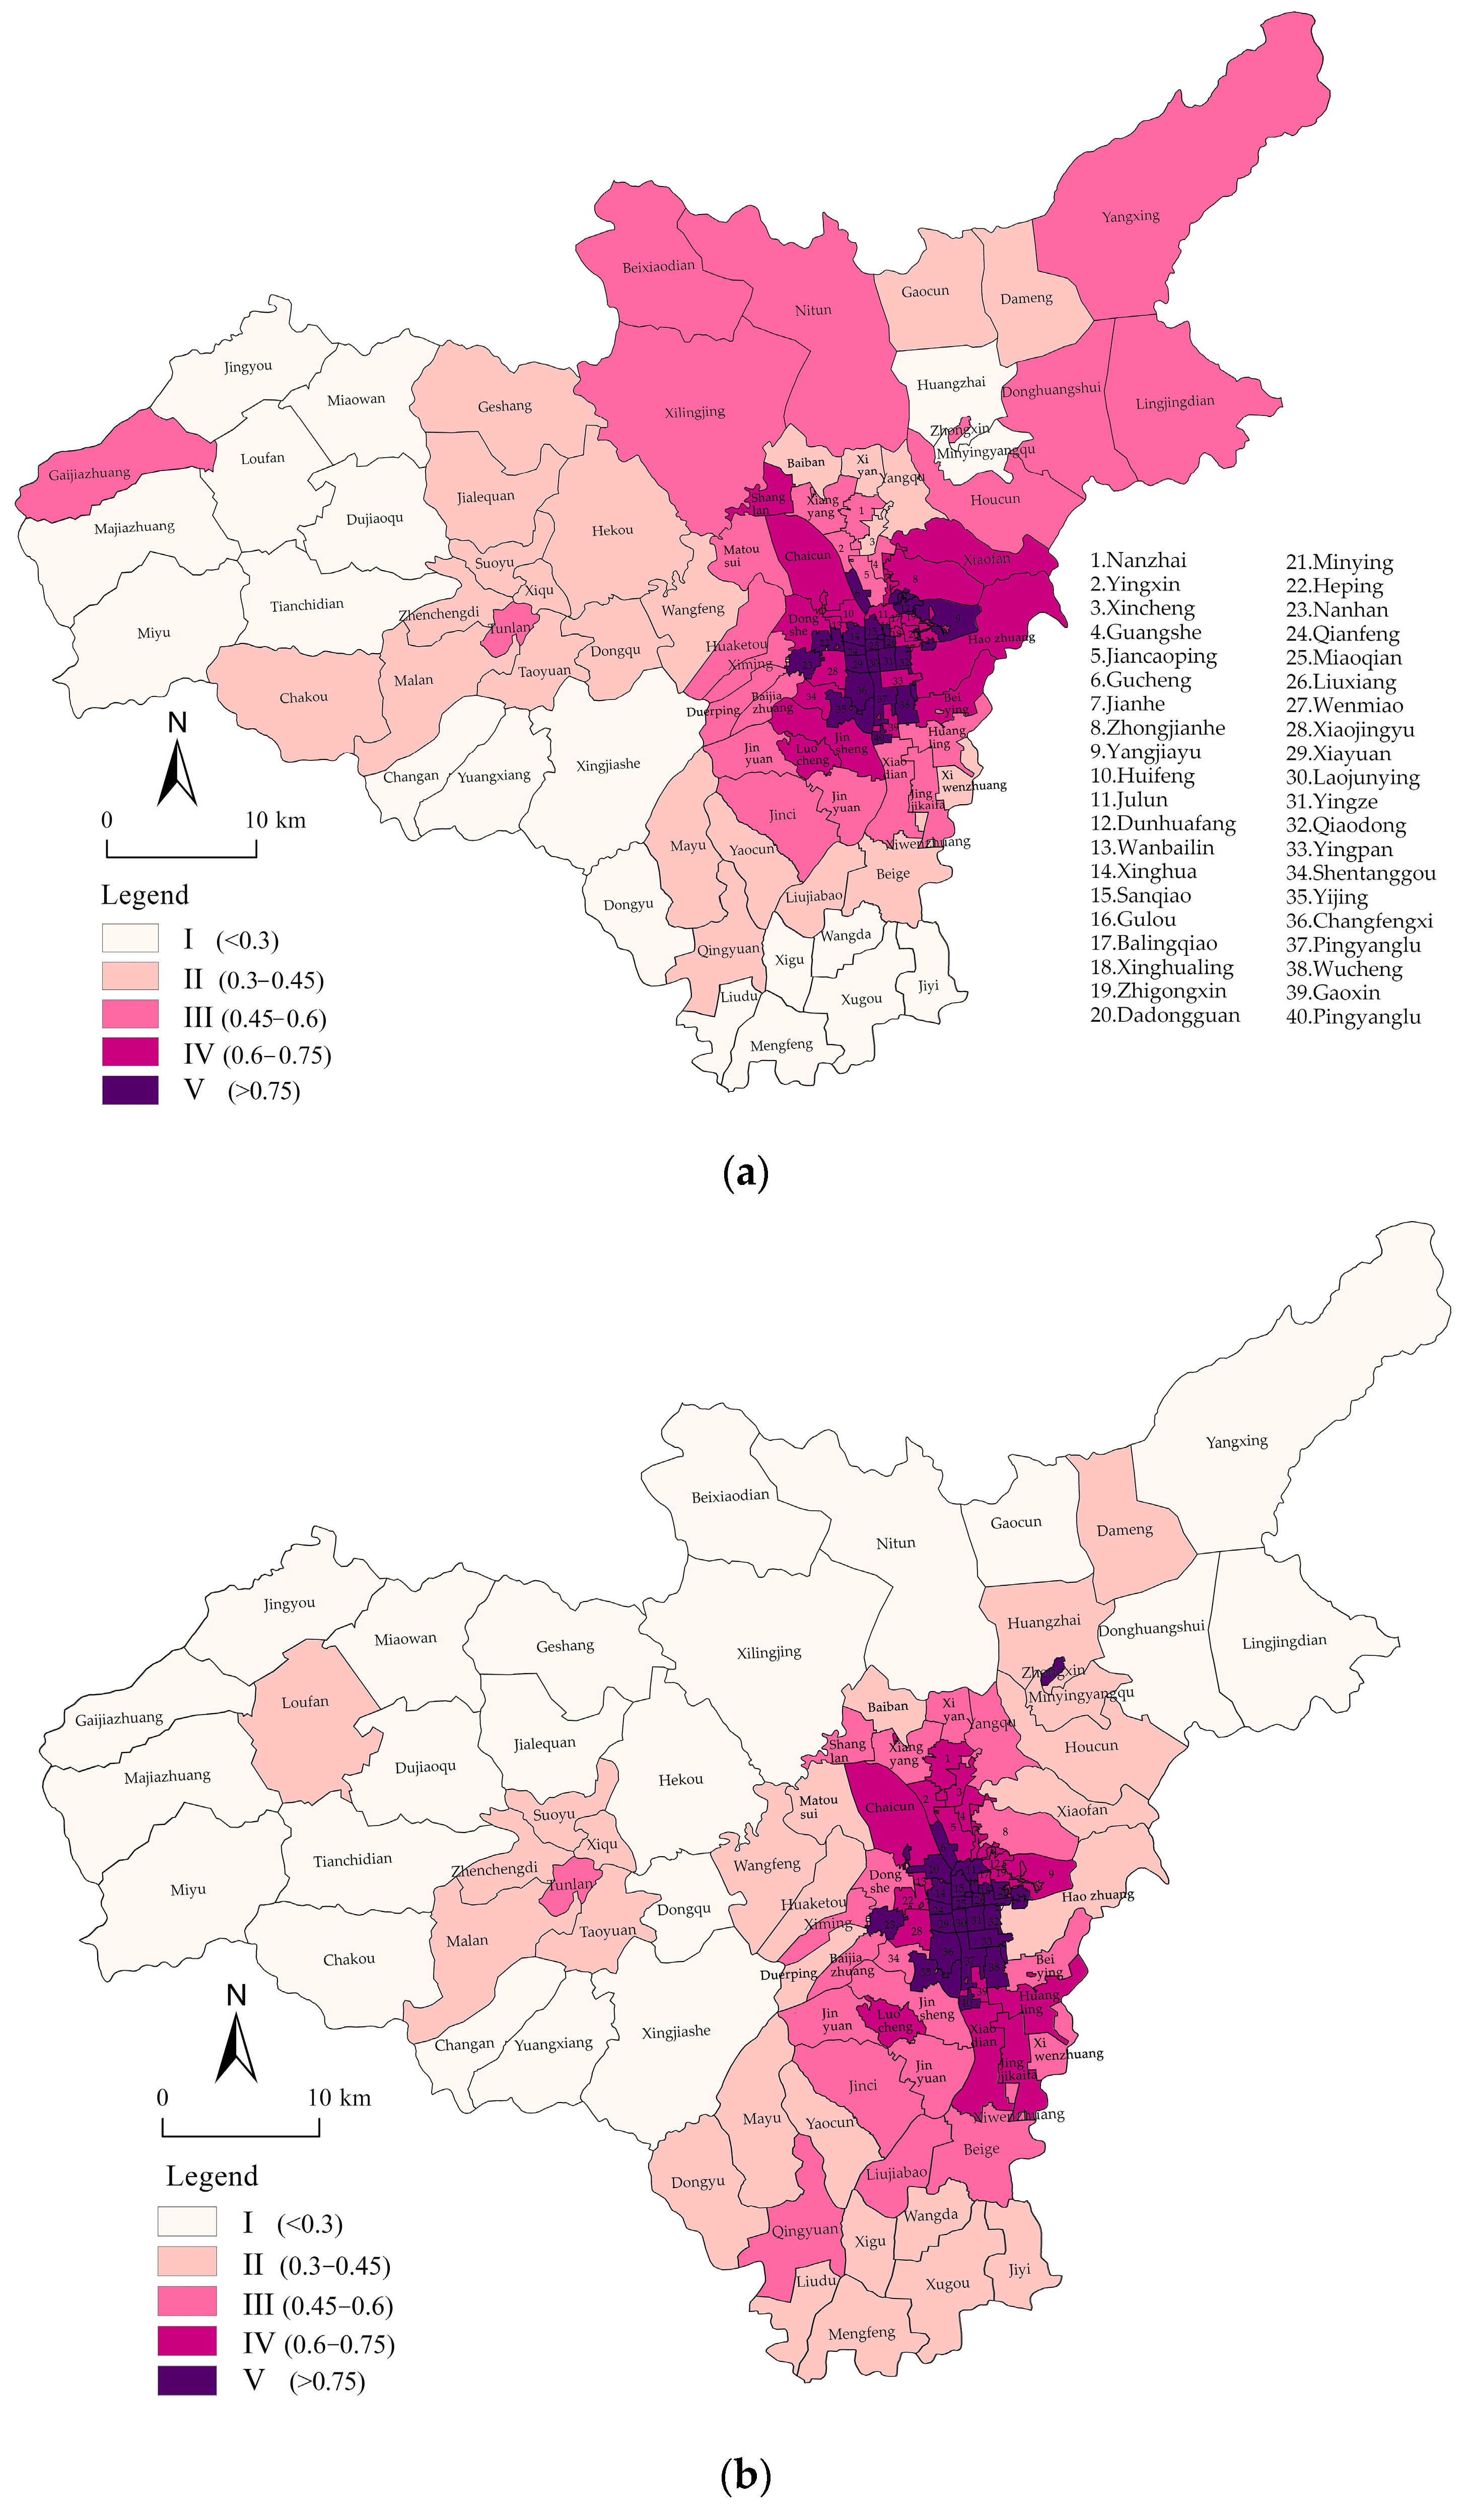
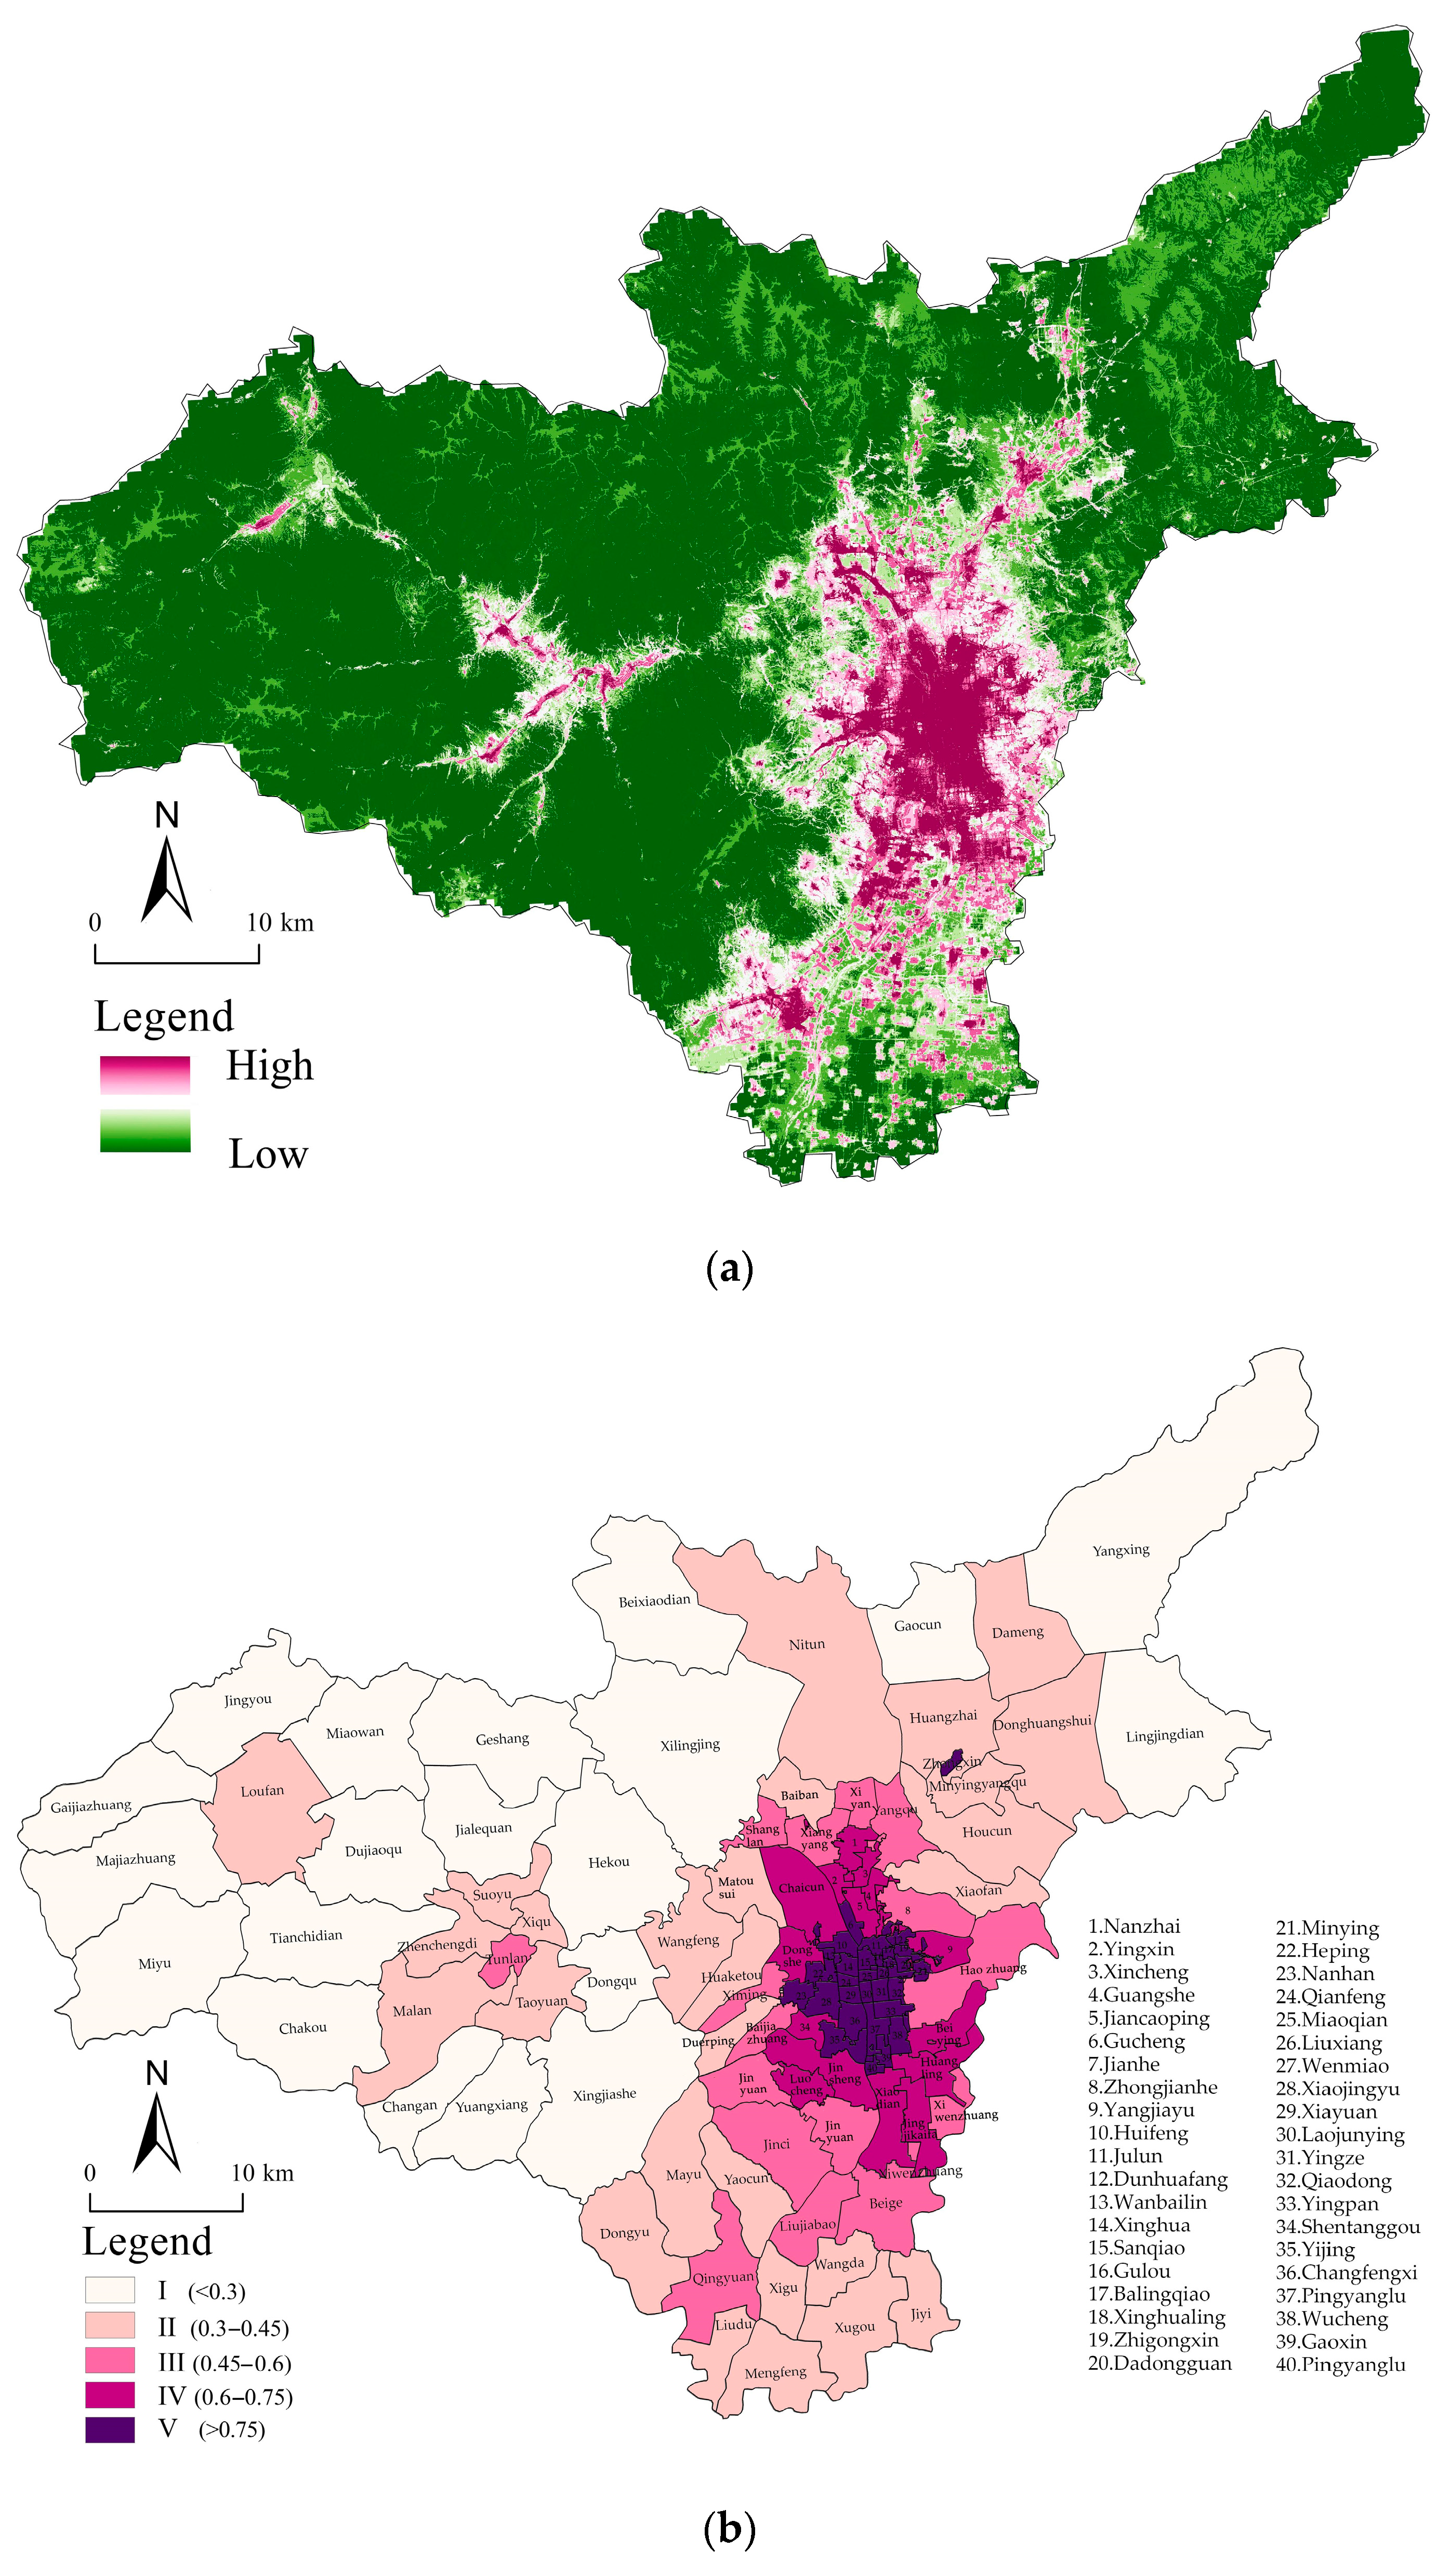
3.3. Measurement and Spatial Expression of CES Demand in Taiyuan City
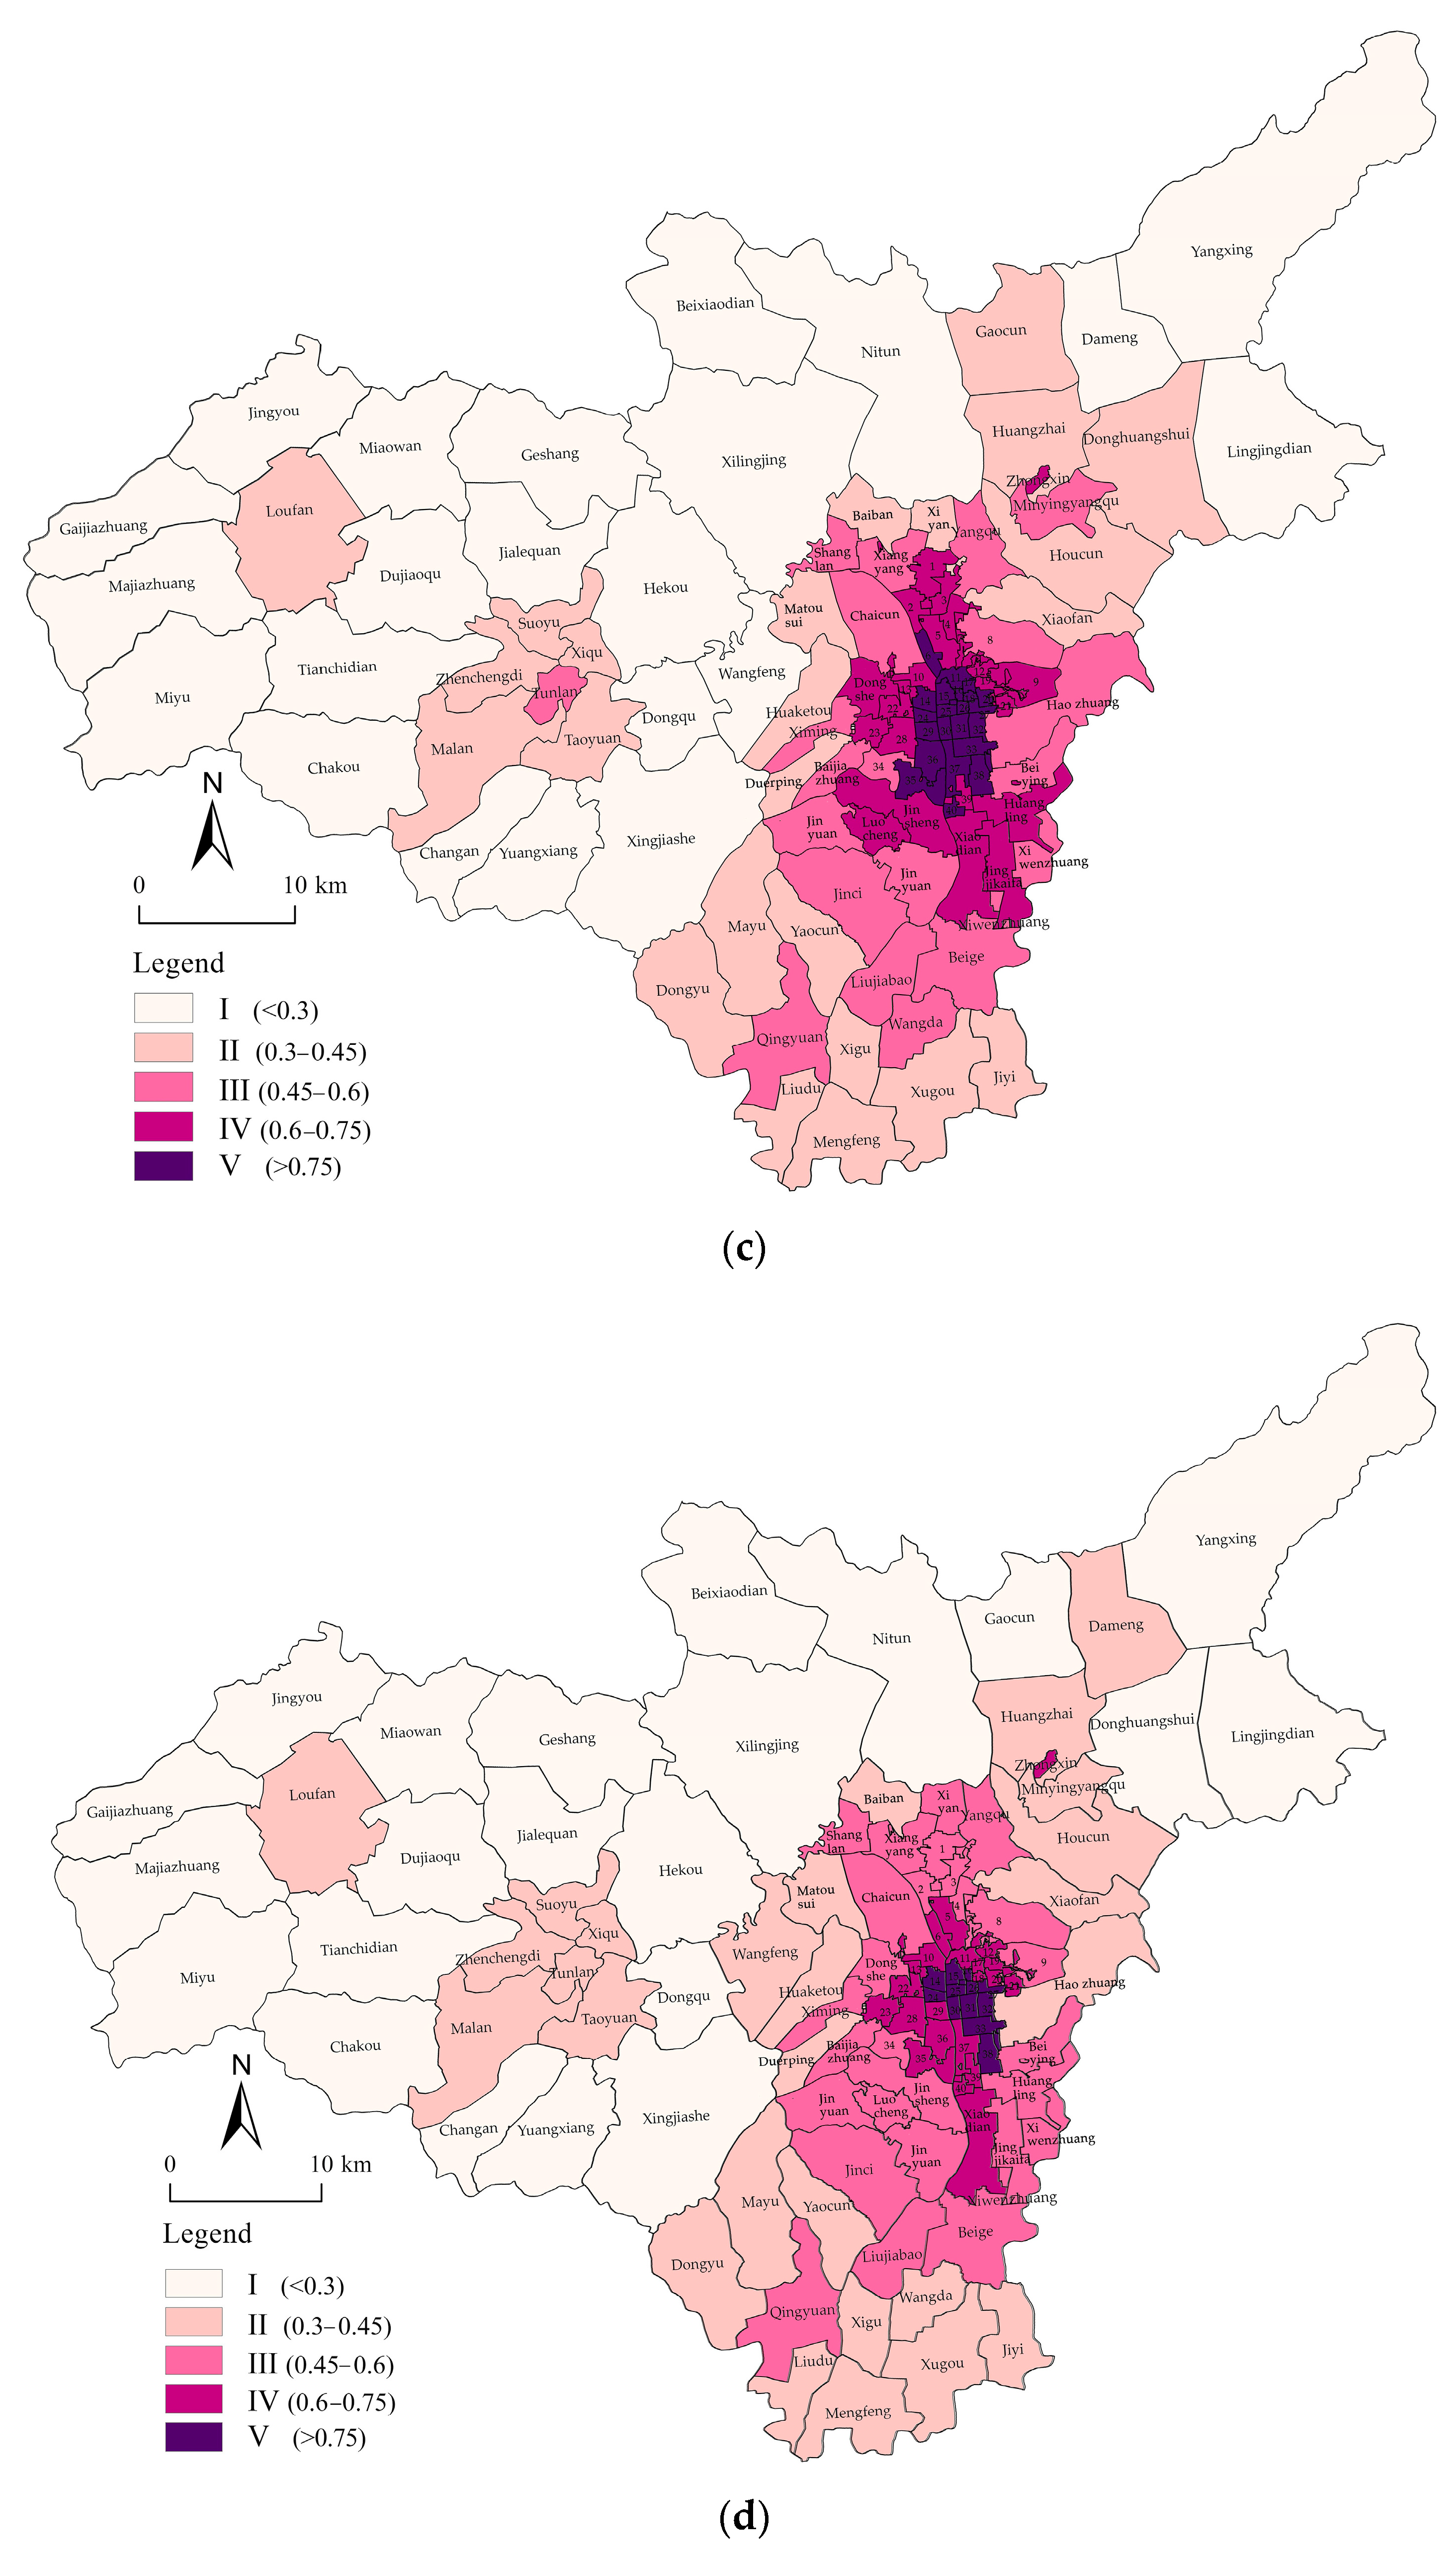
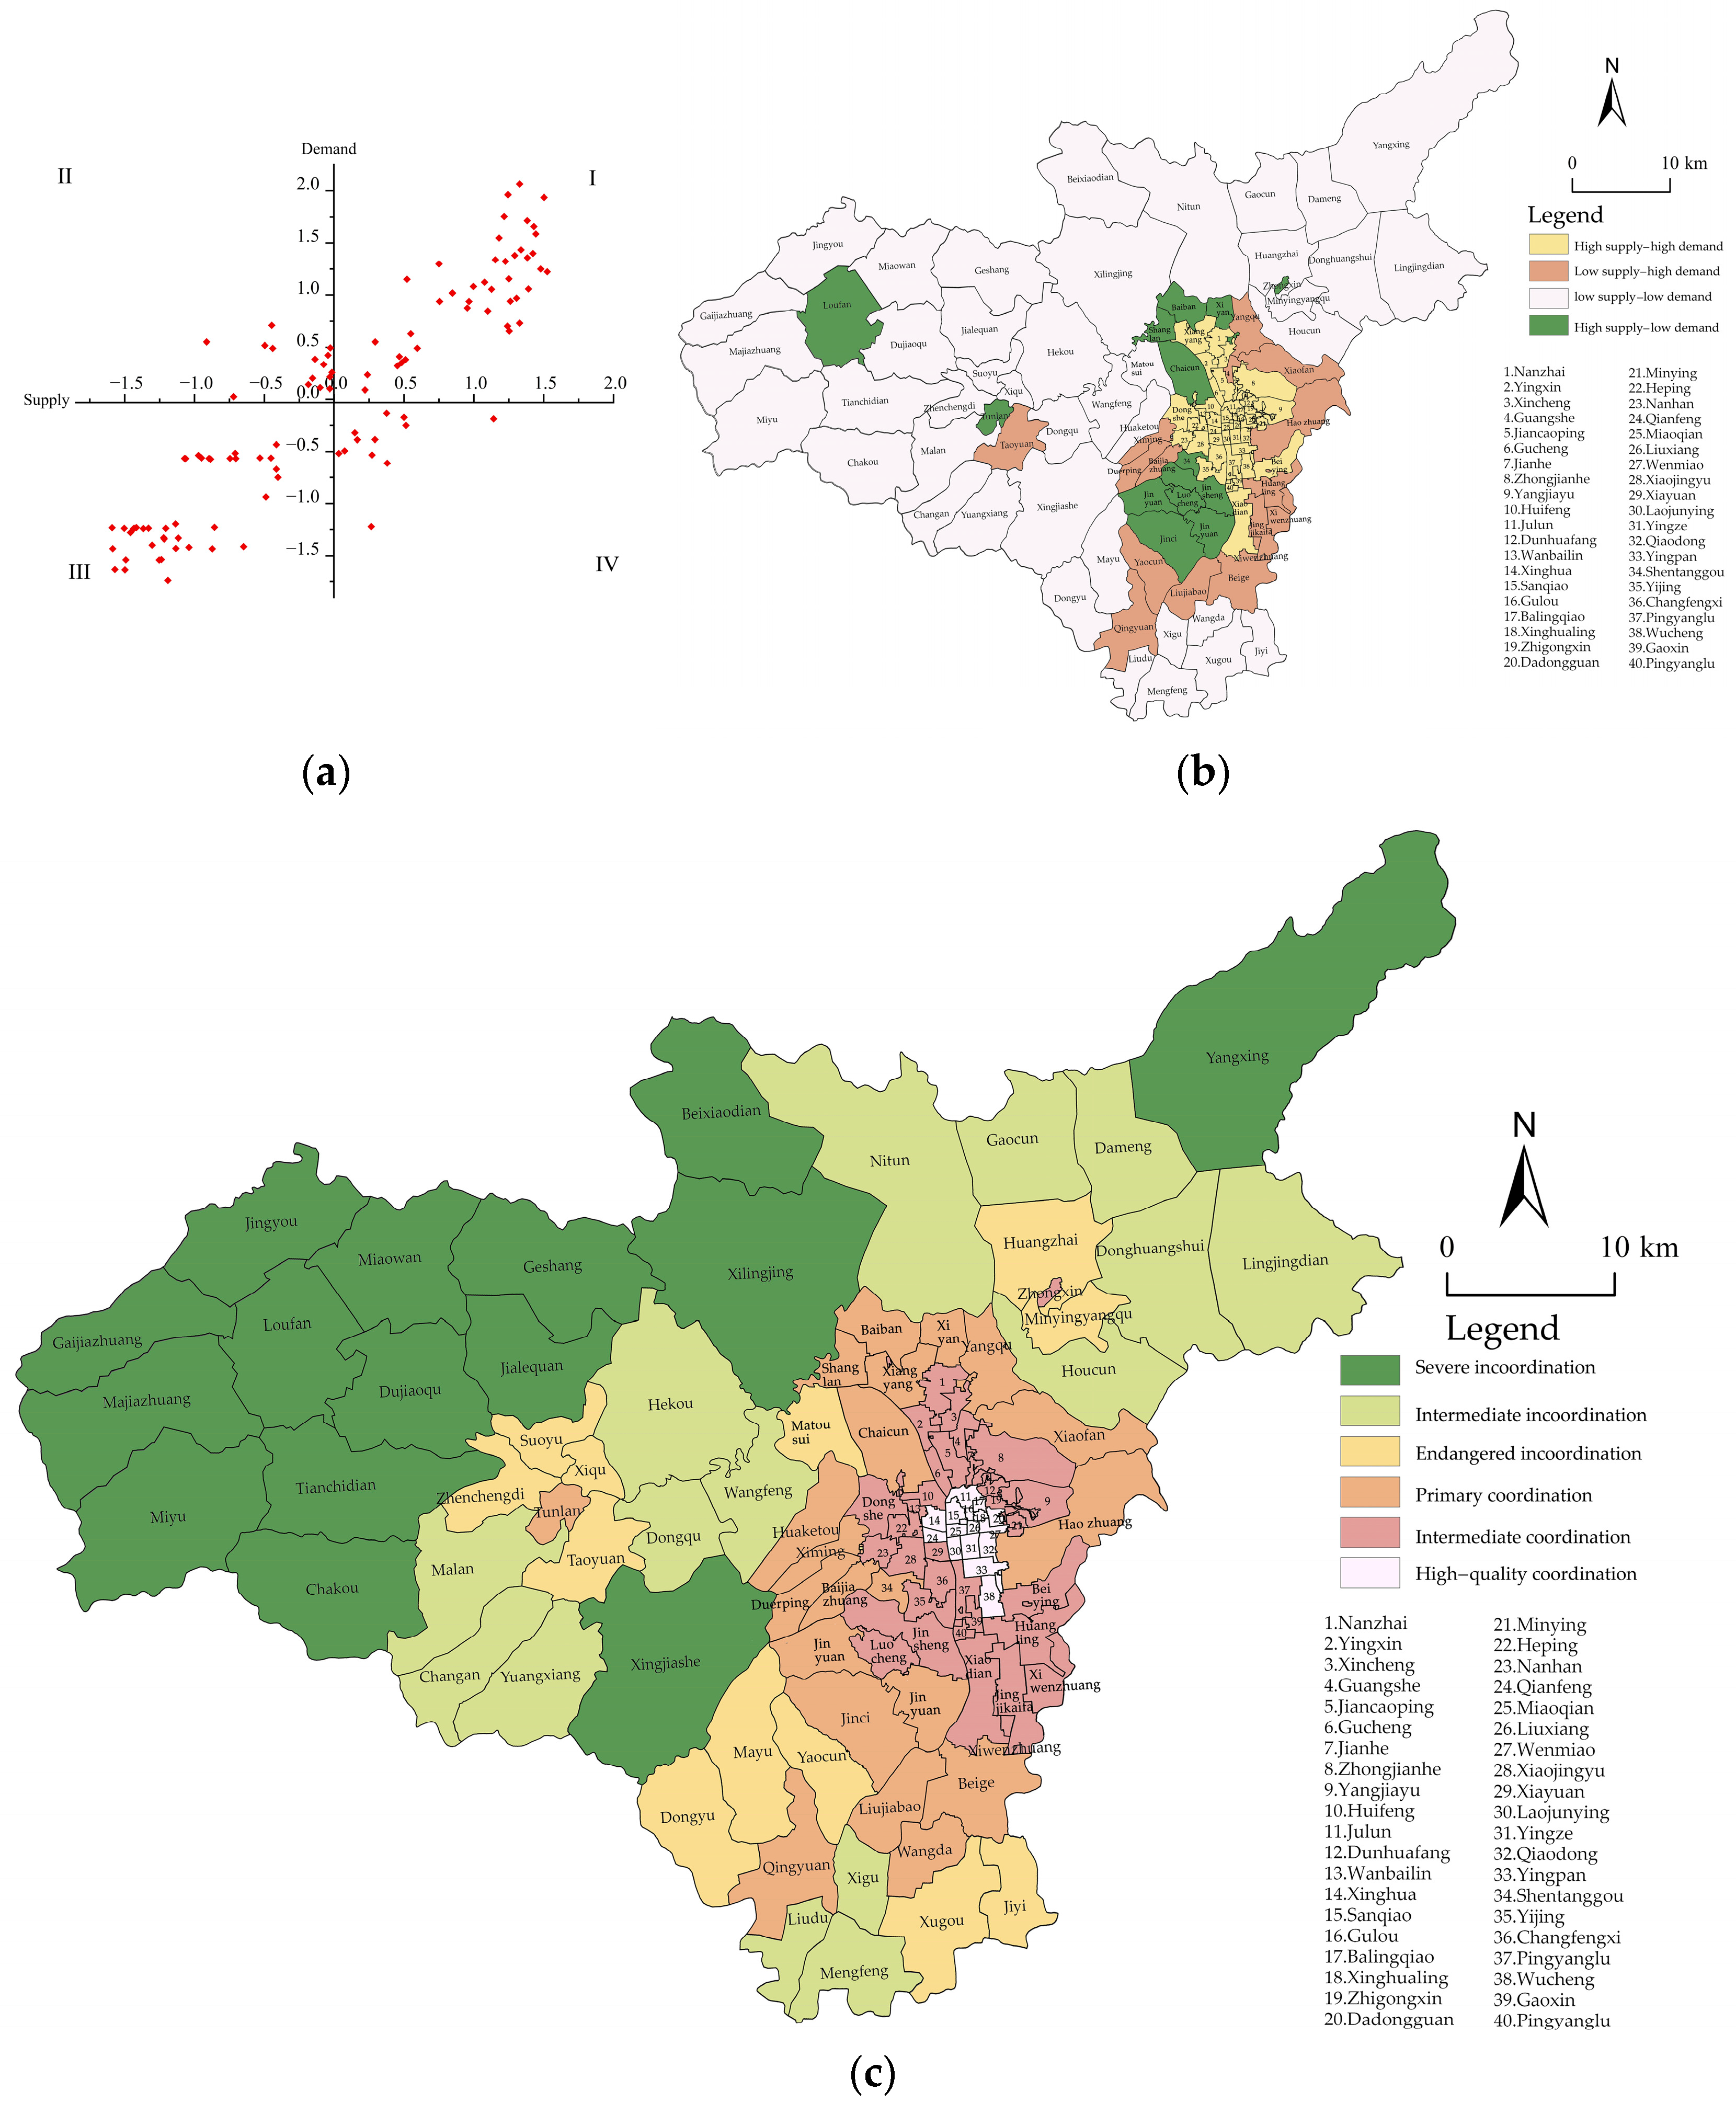
3.4. Analysis of CES Supply–Demand Balance and Coupling Coordination in Taiyuan City
4. Discussion
4.1. Comparative Analysis of MaxEnt Model and Other Methods
4.2. Spatial Distribution and Influencing Factors of CES Supply and Demand in Taiyuan City
4.3. Urban–Rural CES Supply–Demand Balance and Coupling Coordination in Taiyuan City
4.4. Sustainable Development Management and Planning Recommendations Based on CES
- (1)
- Coordinated Development Zone: Implement service value enhancements and resilience strengthening to improve the premium green space supply.
- (2)
- Excessive Development Zone: Strengthen spatial connectivity and network transmission to activate green space service efficiency.
- (3)
- Uncoordinated Development Zone: Implement cross-regional coordination and ecological reciprocity to reconstruct systemic service resilience.
4.5. Limitations of the Study and Future Prospects
5. Conclusions
- (1)
- Supply–Demand Coupling Coordination Analysis and Spatial Management Implications. The coupling coordination analysis revealed an average coordination degree of 0.65 across the city, with spatial patterns closely associated with topographic characteristics and rapid urbanization. High CES supply areas were concentrated along the Fen River’s historical relics and nature reserves, spatially coinciding with urban scenic zones and ecological infrastructure. Demand hotspots coupled with population density and economic vitality, showing significant supply–demand mismatches in urban–rural transition areas. High coordination zones benefited from positive feedback effects of flat terrains, transportation accessibility, and population agglomeration, while low coordination areas were distributed in the hinterlands of Lüliang and Taihang Mountains. The environmental factor analysis identified the terrain gradient and transportation accessibility as key drivers of the CES spatial differentiation. We recommend prioritizing ecological network restoration in low-supply areas to enhance service capacity, while activating cultural heritage resources in low-demand regions through cultural–tourism integration, such as incorporating underutilized heritage sites, like the Tianlong Mountain Grottoes in Jinci Town, into regional tourism routes.
- (2)
- Methodological Innovations and Limitations. Methodologically, this study innovatively integrated POI data with the MaxEnt model by analogizing the cultural service distribution to “species habitats”, enabling the objective quantification of the CES supply potential. The dual-dimensional supply–demand coupling framework overcame static limitations of traditional Z-score matching, identifying systemic imbalance origins in urban–rural systems. However, POI data’s inadequate coverage of informal cultural spaces (e.g., traditional villages) may introduce a spatial bias and underrepresent marginalized groups’ cultural needs. Future research should integrate participatory mapping and a social media sentiment analysis to establish an “objective facilities-subjective values” dual-dimensional index system, such as supplementing indigenous ritual site data through community interviews to enhance the assessment inclusiveness.
- (3)
- Framework Universality and Application Strategies. The modular structure enables dynamic parameter adjustments for different urbanization stages and ecological contexts: in ecologically fragile mountainous cities (e.g., Kathmandu, Nepal), CES supply assessments could be enhanced by replacing terrain factors (emphasizing slope stability) and modifying local cultural POI classifications (adding religious sites and hiking trails). For industrial heritage transformation regions (e.g., Ruhr Area, Germany), analyses should focus on industrial heritage reuse and the green infrastructure supply–demand balance, incorporating economic transition indicators like industrial substitution rates. The cross-scale adaptability enables multi-level planning applications: a macro-level analysis could combine nighttime light data and transportation networks to identify regional CES flow corridors, while a micro-level implementation might utilize high-resolution remote sensing and a social media sentiment analysis to capture community demand dynamics. Addressing common challenges in rapid urbanization (e.g., ecological restoration vs. heritage preservation conflicts), our socio-ecological synergy model proposes strategies like digital platforms for cross-administrative cultural resource sharing and ecological compensation mechanisms to alleviate terrain constraints. Future research should validate the global applicability through a case database construction and parameter sensitivity testing, ultimately providing technical support for international cultural heritage conservation and urban sustainable development.
Author Contributions
Funding
Data Availability Statement
Conflicts of Interest
References
- Ostrom, E. A General Framework for Analyzing Sustainability of Social-Ecological Systems. Science 2009, 325, 419–422. [Google Scholar] [CrossRef] [PubMed]
- Lu, D.; Liu, W. The Significance, Progress and Future Tasks of an Integrated Study of Geo-Dynamics Behind Regional Development. Adv. Earth Sci. 2003, 18, 12. [Google Scholar]
- MEA. Millennium Ecosystem Assesment: Ecosystems and Human Well-Being; Island Press: Washington, DC, USA, 2005. [Google Scholar]
- Zhao, Y.; You, W.; Lin, X.; He, D. Assessing the Supply and Demand Linkage of Cultural Ecosystem Services in a Typical County-Level City with Protected Areas in China. Ecol. Indic. 2023, 147, 109992. [Google Scholar] [CrossRef]
- Zhong, J.; Gao, M.; Han, Z.; Zhou, C.; Yan, X. Spatial reconstruction of the human-land relationship based on cultural ecosystem services. ACTA Geogr. Sin. 2024, 79, 1682–1699. [Google Scholar]
- Plieninger, T.; Dijks, S.; Oteros-Rozas, E.; Bieling, C. Assessing, Mapping, and Quantifying Cultural Ecosystem Services at Community Level. Land Use Policy 2013, 33, 118–129. [Google Scholar] [CrossRef]
- Tu, X.; Chang, Q.; Van Eetvelde, V.; Li, L. How Do Visitors’ Perceptions Differ from the Supply of Cultural Ecosystem Services in Urban Parks? A Case Study from Beijing. Int. J. Sustain. Dev. World Ecol. 2023, 30, 883–896. [Google Scholar] [CrossRef]
- Schmidt, K.; Walz, A.; Jones, I.; Metzger, M.J. The Sociocultural Value of Upland Regions in the Vicinity of Cities in Comparison with Urban Green Spaces. Mt. Res. Dev. 2016, 36, 465–474. [Google Scholar] [CrossRef]
- Assandri, G.; Bogliani, G.; Pedrini, P.; Brambilla, M. Beautiful Agricultural Landscapes Promote Cultural Ecosystem Services and Biodiversity Conservation. Agric. Ecosyst. Environ. 2018, 256, 200–210. [Google Scholar] [CrossRef]
- Zhuang, S.; Gong, J.; Chen, K.; Li, J. Supply and demand matching characteristics of cultural ecosystem services of small parks and greenbelts in the Guangdong-Hong Kong-Macao Greater Bay Area. Acta Fcologica Sin. 2023, 43, 5714–5725. [Google Scholar]
- Bagstad, K.; Semmens, D.; Ancona, Z.; Sherrouse, B. Evaluating Alternative Methods for Biophysical and Cultural Ecosystem Services Hotspot Mapping in Natural Resource Planning. Landsc. Ecol. 2017, 32, 77–97. [Google Scholar] [CrossRef]
- Brown, G.; Montag, J.; Lyon, K. Public Participation GIS: A Method for Identifying Ecosystem Services. Soc. Nat. Resour. 2012, 25, 633–651. [Google Scholar] [CrossRef]
- Ridding, L.; Redhead, J.; Oliver, T.; Schmucki, R.; McGinlay, J.; Graves, A.; Morris, J.; Bradbury, R.; King, H.; Bullock, J. The Importance of Landscape Characteristics for the Delivery of Cultural Ecosystem Services. J. Environ. Manage. 2018, 206, 1145–1154. [Google Scholar] [CrossRef] [PubMed]
- Tian, T.; Sun, L.; Peng, S.; Sun, F.; Che, Y. Understanding the Process from Perception to Cultural Ecosystem Services Assessment by Comparing Valuation Methods. Urban Green 2021, 57, 126945. [Google Scholar] [CrossRef]
- Zhu, W.; Zhang, Z.; Zhang, H.; Tovuudorj, R. Integrating Spatial Patterns and Driving Factors of Cultural Ecosystem Services into Territorial Spatial Governance: A Case Study of the Horqin Sandy Land with Multi-Ethnic Settlements. Habitat Int. 2024, 148, 103093. [Google Scholar] [CrossRef]
- He, S.; Su, Y.; Shahtahmassebi, A.; Huang, L.; Zhou, M.; Gan, M.; Deng, J.; Zhao, G.; Wang, K. Assessing and Mapping Cultural Ecosystem Services Supply, Demand and Flow of Farmlands in the Hangzhou Metropolitan Area, China. Sci. Total Environ. 2019, 692, 756–768. [Google Scholar] [CrossRef]
- Zhong, J.; Gao, M.; Zhao, Y.; Peng, S.; Wang, M. Spatial variation of the cultural ecosystem services pattern and influencing factors in the coastal areas: Evidence from Ramsar Sites in China. Acta Geogr. Sin. 2024, 79, 76–96. [Google Scholar]
- Zuo, Y.; Zhang, L. Research on Local Ecosystem Cultural Services in the Jiangnan Water Network Rural Areas: A Case Study of the Ecological Green Integration Demonstration Zone in the Yangtze River Delta, China. Land 2023, 12, 1373. [Google Scholar] [CrossRef]
- Ghermandi, A. Integrating Social Media Analysis and Revealed Preference Methods to Value the Recreation Services of Ecologically Engineered Wetlands. Ecosyst. Serv. 2018, 31, 351–357. [Google Scholar] [CrossRef]
- Oteros-Rozas, E.; Martin-Lopez, B.; Fagerholm, N.; Bieling, C.; Plieninger, T. Using Social Media Photos to Explore the Relation between Cultural Ecosystem Services and Landscape Features across Five European Sites. Ecol. Indic. 2018, 94, 74–86. [Google Scholar] [CrossRef]
- Sinclair, M.; Mayer, M.; Woltering, M.; Ghermandi, A. Using Social Media to Estimate Visitor Provenance and Patterns of Recreation in Germany’s National Parks. J. Environ. Manage. 2020, 263, 110418. [Google Scholar] [CrossRef]
- Li, X.; Xu, L.; Tian, S.; Yang, J.; Liu, M.; Liu, H. Human Settlements in China Based on the Geographical Scale. Sci. Geogr. Sin. 2022, 42, 951–962. [Google Scholar] [CrossRef]
- Wei, J.; Chen, M.; Chu, C.; Zhao, C.; Xia, X.; Li, Y. Assessing Cultural Ecosystem Services Supply–Demand Balance of Urban Parks in the Context of Old and New Urban Districts. Ecol. Indic. 2024, 159, 111688. [Google Scholar] [CrossRef]
- De Valck, J.; Broekx, S.; Liekens, I.; De Nocker, L.; Van Orshoven, J.; Vranken, L. Contrasting Collective Preferences for Outdoor Recreation and Substitutability of Nature Areas Using Hot Spot Mapping. Landsc. Urban Plan. 2016, 151, 64–78. [Google Scholar] [CrossRef]
- Qiao, X.; Gu, Y.; Zou, C.; Xu, D.; Wang, L.; Ye, X.; Yang, Y.; Huang, X. Temporal Variation and Spatial Scale Dependency of the Trade-Offs and Synergies among Multiple Ecosystem Services in the Taihu Lake Basin of China. Sci. Total Environ. 2019, 651, 218–229. [Google Scholar] [CrossRef] [PubMed]
- Phillips, S.; Dudík, M. Modeling of Species Distributions with Maxent:: New Extensions and a Comprehensive Evaluation. Ecography 2008, 31, 161–175. [Google Scholar] [CrossRef]
- Clemente, P.; Calvache, M.; Antunes, P.; Santos, R.; Cerdeira, J.O.; Martins, M.J. Combining Social Media Photographs and Species Distribution Models to Map Cultural Ecosystem Services: The Case of a Natural Park in Portugal. Ecol. Indic. 2019, 96, 59–68. [Google Scholar] [CrossRef]
- Gosal, A.; Geijzendorffer, I.; Václavík, T.; Poulin, B.; Ziv, G. Using Social Media, Machine Learning and Natural Language Processing to Map Multiple Recreational Beneficiaries. Ecosyst. Serv. 2019, 38, 100958. [Google Scholar] [CrossRef]
- He, S.; Hu, C.; Li, J.; Wu, J.; Xu, Q.; Lin, L.; Zhu, C.; Li, Y.; Zhou, M.; Zhu, L. Revealing Spatial Patterns of Cultural Ecosystem Services in Four Agricultural Landscapes: A Case Study from Hangzhou, China. Int. J. Environ. Res. Public. Health 2022, 19, 9269. [Google Scholar] [CrossRef]
- You, C.; Qu, H.; Feng, C.-C.; Guo, L. Evaluating the Match between Natural Ecosystem Service Supply and Cultural Ecosystem Service Demand: Perspectives on Spatiotemporal Heterogeneity. Environ. Impact Assess. Rev. 2024, 108, 107592. [Google Scholar] [CrossRef]
- Erskine, E.; Baillie, R.; Lusseau, D. Marine Protected Areas Provide More Cultural Ecosystem Services than Other Adjacent Coastal Areas. One Earth 2021, 4, 1175–1185. [Google Scholar] [CrossRef]
- Xia, C.; Guo, H.; Zhao, J.; Xue, F.; Wang, C.; Zhou, J.; Sun, T.; Li, S.; Zhang, N. Dynamic responses of ecosystem services to urbanization at multi-spatial scales in the Beijing-Tianjin-Hebei region. Acta Fcologica Sin. 2023, 43, 2756–2769. [Google Scholar]
- Kosanic, A.; Petzold, J. A Systematic Review of Cultural Ecosystem Services and Human Wellbeing. Ecosyst. Serv. 2020, 45, 101168. [Google Scholar] [CrossRef]
- Kang, N.; Xie, G.; Liu, C. Assessment of Society’s Perceptions on Cultural Ecosystem Services in a Cultural Landscape in Nanchang, China. Sustainability 2023, 15, 10308. [Google Scholar] [CrossRef]
- Langemeyer, J.; Baró, F.; Roebeling, P.; Gómez-Baggethun, E. Contrasting Values of Cultural Ecosystem Services in Urban Areas: The Case of Park Montjuic in Barcelona. Ecosyst. Serv. 2015, 12, 178–186. [Google Scholar] [CrossRef]
- Tenerelli, P.; Demsar, U.; Luque, S. Crowdsourcing Indicators for Cultural Ecosystem Services: A Geographically Weighted Approach for Mountain Landscapes. Ecol. Indic. 2016, 64, 237–248. [Google Scholar] [CrossRef]
- Li, C.; Huang, X.; Zhao, J.; Zhao, Z.; Mei, Z.; Chen, S. Progress and prospects of research on cultural ecosystem services. Acta Ecol. Sin. 2025, 12, 1–13. [Google Scholar] [CrossRef]
- Haines-Young, R.; Potschin, M. Common International Classification of Ecosystem Services (CICES, Version 4.1). Eur. Environ. Agency 2012, 33, 107. [Google Scholar]
- Kumar, P. The Economics of Ecosystems and Biodiversity: Ecological and Economic Foundations; Routledge: Oxfordshire, UK, 2012; ISBN 1-84977-548-6. [Google Scholar]
- Li, Y.; Zhang, D.; Wang, K.; Huang, L. Supply-demand relationships of cultural ecosystem services in rural areas: A case study of Huzhou City, Zhejiang Province. Acta Fcologica Sin. 2022, 42, 6888–6899. [Google Scholar]
- Csurgó, B.; Smith, M. The Value of Cultural Ecosystem Services in a Rural Landscape Context. J. Rural Stud. 2021, 86, 76–86. [Google Scholar] [CrossRef]
- Koh, Y.F.; Loc, H.H.; Park, E. Towards a “City in Nature”: Evaluating the Cultural Ecosystem Services Approach Using Online Public Participation GIS to Support Urban Green Space Management. Sustainability 2022, 14, 1499. [Google Scholar] [CrossRef]
- Wang, Z.; Xu, M.; Lin, H.; Qureshi, S.; Cao, A.; Ma, Y. Understanding the Dynamics and Factors Affecting Cultural Ecosystem Services during Urbanization through Spatial Pattern Analysis and a Mixed-Methods Approach. J. Clean. Prod. 2021, 279, 123422. [Google Scholar] [CrossRef]
- Martin, D.; Pititto, F.; Gil, J.; Paola Mura, M.; Bahamon, N.; Romano, C.; Thorin, S.; Schvartz, T.; Dutrieux, E.; Bocquenet, Y. Long-Distance Influence of the Rhone River Plume on the Marine Benthic Ecosystem: Integrating Descriptive Ecology and Predictive Modelling. Sci. Total Environ. 2019, 673, 790–809. [Google Scholar] [CrossRef] [PubMed]
- West, A.M.; Kumar, S.; Brown, C.S.; Stohlgren, T.J.; Bromberg, J. Field Validation of an Invasive Species Maxent Model. Ecol. Inform. 2016, 36, 126–134. [Google Scholar] [CrossRef]
- Di Pasquale, G.; Saracino, A.; Bosso, L.; Russo, D.; Moroni, A.; Bonanomi, G.; Allevato, E. Coastal Pine-Oak Glacial Refugia in the Mediterranean Basin: A Biogeographic Approach Based on Charcoal Analysis and Spatial Modelling. Forests 2020, 11, 673. [Google Scholar] [CrossRef]
- Swets, J.A. Measuring the Accuracy of Diagnostic Systems. Science 1988, 240, 1285–1293. [Google Scholar] [CrossRef]
- Merow, C.; Smith, M.J.; Silander, J.A., Jr. A Practical Guide to MaxEnt for Modeling Species’ Distributions: What It Does, and Why Inputs and Settings Matter. Ecography 2013, 36, 1058–1069. [Google Scholar] [CrossRef]
- Wang, M.; Wang, Y. Balance or Match? Multi-scenario Analysis and Optimization of Supply and Demand of Park Green Space with Ecological Wisdom. Chin. Landsc. Archit. 2021, 37, 37–42. [Google Scholar] [CrossRef]
- Wang, M.; Zhu, A.; Wang, J.; Lu, T. Supply and demand analysis of urban park distribution based on social equity and justice: A case study of Xuhui District, Shanghai. Acta Ecol. Sin. 2019, 39, 7035–7046. [Google Scholar]
- Gao, M.; Li, C.; Zhao, H. Spatiotemporal Pattern of Supply-Demand of Ecosystem Services and lnfluencing Factors in Jiangsu Province. Res. Soil Water Conserv. 2023, 30, 315–324. [Google Scholar] [CrossRef]
- Chen, S.; Chen, L.; Hong, Y.; Liu, J.; Que, X.; Li, Y.; He, D.; Zhao, J. Ecological security evaluation and obstacle factors of Quanzhou Bay Wetland carbon pool. J. Fujian Agric. For. Univ. Nat. Seience Ed. 2024, 53, 686–695. [Google Scholar] [CrossRef]
- Zhao, H.; Li, C.; Gao, M. Investigation of the Relationship between Supply and Demand of Ecosystem Services and the Influencing Factors in Resource-Based Cities in China. Sustainability 2023, 15, 7397. [Google Scholar] [CrossRef]
- Yang, Z.; Zhan, J.; Wang, C.; Twumasi-Ankrah, M.J. Coupling Coordination Analysis and Spatiotemporal Heterogeneity between Sustainable Development and Ecosystem Services in Shanxi Province, China. Sci. Total Environ. 2022, 836, 155625. [Google Scholar] [CrossRef] [PubMed]
- Zhang, D.; Chen, Y. Evaluation on Urban Environmental Sustainability and Coupling Coordination among Its Dimensions: A Case Study of Shandong Province, China. Sustain. Cities Soc. 2021, 75, 103351. [Google Scholar] [CrossRef]
- Huo, S.; Huang, L.; Yan, L. Valuation of cultural ecosystem services based on SolVES: A case study of the South Ecological Park in Wuyi County, Zhejiang. Acta Ecol. Sin. 2018, 38, 3682–3691. [Google Scholar]
- Dușcu, D.M.; Rîșnoveanu, G. Understanding Visitor Preferences: Perceived Importance of Anthropogenic and Natural Forest Features in Supplying Cultural Ecosystem Services. For. Ecosyst. 2025, 13, 100306. [Google Scholar] [CrossRef]
- Ghasemi, M.; González-García, A.; Charrahy, Z.; Serrao-Neumann, S. Utilizing Supply-Demand Bundles in Nature-Based Recreation Offers Insights into Specific Strategies for Sustainable Tourism Management. Sci. Total Environ. 2024, 922, 171185. [Google Scholar] [CrossRef]
- Liu, H.; Remme, R.; Hamel, P.; Nong, H.; Ren, H. Supply and Demand Assessment of Urban Recreation Service and Its Implication for Greenspace Planning-A Case Study on Guangzhou. Landsc. Urban Plan. 2020, 203, 103898. [Google Scholar] [CrossRef]
- Bing, Z.; Qiu, Y.; Huang, H.; Chen, T.; Zhong, W.; Jiang, H. Spatial Distribution of Cultural Ecosystem Services Demand and Supply in Urban and Suburban Areas: A Case Study from Shanghai, China. Ecol. Indic. 2021, 127, 107720. [Google Scholar] [CrossRef]
- Dang, H.; Li, J. Supply-Demand Relationship and Spatial Flow of Urban Cultural Ecosystem Services: The Case of Shenzhen, China. J. Clean. Prod. 2023, 423, 138765. [Google Scholar] [CrossRef]
- Guo, R.-Z.; Lin, L.; Xu, J.-F.; Dai, W.-H.; Song, Y.-B.; Dong, M. Spatio-Temporal Characteristics of Cultural Ecosystem Services and Their Relations to Landscape Factors in Hangzhou Xixi National Wetland Park, China. Ecol. Indic. 2023, 154, 110910. [Google Scholar] [CrossRef]
- Zhou, L.; Guan, D.; Huang, X.; Yuan, X.; Zhang, M. Evaluation of the Cultural Ecosystem Services of Wetland Park. Ecol. Indic. 2020, 114, 106286. [Google Scholar] [CrossRef]
- Lorilla, R.; Kalogirou, S.; Poirazidis, K.; Kefalas, G. Identifying Spatial Mismatches between the Supply and Demand of Ecosystem Services to Achieve a Sustainable Management Regime in the Ionian Islands (Western Greece). Land Use Policy 2019, 88, 104171. [Google Scholar] [CrossRef]
- Luo, Y.; Xu, H.; Zhang, J.; Chen, N.; Ye, H.; Lei, W. Magnifier or Refractor? Exploring the Impact of Geographical Indication on People’s Perception of the Value of Cultural Ecosystem Services Based on the SolVES Model. Front. Ecol. Evol. 2023, 11, 1208169. [Google Scholar] [CrossRef]
- Wang, L.; Huang, L.; Cao, W.; Zhai, J.; Fan, J. Assessing Grassland Cultural Ecosystem Services Supply and Demand for Promoting the Sustainable Realization of Grassland Cultural Values. Sci. Total Environ. 2024, 912, 169255. [Google Scholar] [CrossRef]
- Chen, X.; Wu, C. Mapping and Assessing the Supply and Demand of Rural Recreation Services in National Parks: A Case Study of Qianjiangyuan, Zhejiang, China. Land 2025, 14, 302. [Google Scholar] [CrossRef]
- Bachi, L.; Ribeiro, S.; Hermes, J.; Saadi, A. Cultural Ecosystem Services (CES) in Landscapes with a Tourist Vocation: Mapping and Modeling the Physical Landscape Components That Bring Benefits to People in a Mountain Tourist Destination in Southeastern Brazil. Tour. Manag. 2020, 77, 104017. [Google Scholar] [CrossRef]
- Darvill, R.; Lindo, Z. The Inclusion of Stakeholders and Cultural Ecosystem Services in Land Management Trade-off Decisions Using an Ecosystem Services Approach. Landsc. Ecol. 2016, 31, 533–545. [Google Scholar] [CrossRef]
- Kalinauskas, M.; Bogdzevic, K.; Gomes, E.; Inacio, M.; Barcelo, D.; Zhao, W.; Pereira, P. Mapping and Assessment of Recreational Cultural Ecosystem Services Supply and Demand in Vilnius (Lithuania). Sci. Total Environ. 2023, 855, 158590. [Google Scholar] [CrossRef]
- Lan, X.; Tang, H.; Liang, H. A Theoretical Framework for Researching Cultural Ecosystem Service Flows in Urban Agglomerations. Ecosyst. Serv. 2017, 28, 95–104. [Google Scholar] [CrossRef]
- Schaich, H.; Bieling, C.; Plieninger, T. Linking Ecosystem Services with Cultural Landscape Research. GAIA Ecol. Perspect. Sci. Soc. 2010, 19, 269–277. [Google Scholar] [CrossRef]
- Burkhard, B.; Kroll, F.; Nedkov, S.; Müller, F. Mapping Ecosystem Service Supply, Demand and Budgets. Ecol. Indic. 2012, 21, 17–29. [Google Scholar] [CrossRef]
- Wen, L.; Li, B.; Peng, Y.; Zhou, Y.; Weng, A.; Jin, Y.; Cai, G.; Lin, Y.; Chen, B. Exploring the Evolution of Coupled Natural-Cultural Ecosystem Services and Their Geographically Scaled Driven Modeling in a Coastal City of Southeast China. J. Environ. Manage. 2024, 361, 121265. [Google Scholar] [CrossRef] [PubMed]
- Yang, Y.; Jiang, L.; Ma, X.; Liu, S.; Wang, L. A Comprehensive Approach to Identifying the Supply and Demand of Urban Park Cultural Ecosystem Services in the Megalopolis Area of Shanghai, China. Land 2025, 14, 455. [Google Scholar] [CrossRef]
- Iniesta-Arandia, I.; Garcia-Llorente, M.; Aguilera, P.A.; Montes, C.; Martin-Lopez, B. Socio-Cultural Valuation of Ecosystem Services: Uncovering the Links between Values, Drivers of Change, and Human Well-Being. Ecol. Econ. 2014, 108, 36–48. [Google Scholar] [CrossRef]
- Scholte, S.S.K.; van Teeffelen, A.J.A.; Verburg, P.H. Integrating Socio-Cultural Perspectives into Ecosystem Service Valuation: A Review of Concepts and Methods. Ecol. Econ. 2015, 114, 67–78. [Google Scholar] [CrossRef]
- Yu, Y.; Yang, X.; L, X.; Qian, L.; Zhou, S. Supply-Demand Matching Evaluation and Coupling Coordination of Cultural Ecosystem Services in Urban Park Green Spaces. Landsc. Archit. 2025, 32, 90–99. [Google Scholar] [CrossRef]
- Yoshimura, N.; Hiura, T. Demand and Supply of Cultural Ecosystem Services: Use of Geotagged Photos to Map the Aesthetic Value of Landscapes in Hokkaido. Ecosyst. Serv. 2017, 24, 68–78. [Google Scholar] [CrossRef]

| Date Name | Resolution | Year | Sources |
|---|---|---|---|
| Digital elevation model | 30 m | - | Geospatial Data Cloud (https://www.gscloud.cn/) (accessed on 8 May 2024) |
| Land use data | 30 m | 2020 | China Resources and Environment Science Data Center, CRESDC (https://www.resdc.cn/) (accessed on 8 May 2024) |
| Administrative division vector date | - | - | National Geographic Information Resources Catalog Service System (https://www.webmap.cn/).(accessed on 1 May 2024) |
| Points of interest (POIs) data | - | 2022 | Open platform of the GAODE map |
| Road network data | - | 2020 | Open Street Map website (https://www.openstreetmap.org/) (accessed on 6 May 2024) |
| Raster data for Gross domestic product (GDP) per unit area | 1000 m | 2020 | China Resources and Environment Science Data Center, CRESDC (https://www.resdc.cn/) (accessed on 6 May 2024) |
| Population density | 100 m | 2020 | WorldPop project (https://www.worldpop.org/) (accessed on 8 May 2024) |
| Normalized Difference Vegetation Index (NDVI) | 30 m | 2020 | China Resources and Environment Science Data Center, CRESDC (https://www.resdc.cn/) (accessed on 1 May 2024) |
| Annual average temperature | 1000 m | 2020 | National Earth System Science Data Center (http://www.geodata.cn/) (accessed on 8 May 2024) |
| Annual average precipitation | 1000 m | 2020 | National Earth System Science Data Center (http://www.geodata.cn/) (accessed on 8 May 2024) |
| Nighttime light data | 1000 m | 2020 | National Earth System Science Data Center (http://www.geodata.cn/) (accessed on 3 May 2024) |
| Category | Description | Classification | Keywords | Quantity |
|---|---|---|---|---|
| Native Esthetic Service | Sites of Natural and Cultural Significance with Unique Esthetic Value | Scenic Sites, Natural Sites, and Nature Reserves | Agricultural Fields, Lakes, Rivers, Streams, Springs, Waterfalls, Wetlands, Caves, Parks, Gardens, Scenic Areas, Nature Reserves, etc. | 671 |
| Recreational Leisure Service | Venues for Local Recreational Experiences and Leisure Activities | Recreational Facilities, Dining and Entertainment Venues, Resort Destinations, and Commercial Areas | Tourist Orchards, Farms, Amusement Parks, Hotels, Rural Home Stays, Sanatoriums, Observation Towers, Pick-Your-Own Farms, Parks, etc. | 507 |
| Historical Cultural Service | Locations of Historical Heritage with Humanistic and Traditional Significance | Cultural Heritage Conservation Units, Folk Custom Venues, and Historical Relics | Cultural Sites, Former Residences, Pagodas, Bridges, Shrines, Ancestral Halls, Monuments, Traditional Pavilions, Ancient Wells, etc. | 496 |
| Knowledge Educational Service | Capacity to Provide Learning Resources and Venues for the Formation of Human Ideology and Enhancement of Cognition | Nature Education Bases and Science Popularization Centers | Innovation Training Bases, Ecomuseums, Scientific Research Centers, Educational Practice Gardens, etc. | 499 |
| Variable Category | Environmental Variable | Source and Processing |
|---|---|---|
| Natural environmental | Elevation | Geospatial Data Cloud (https://www.gscloud.cn/) (accessed on 8 May 2024) |
| Slope | Calculated using ArcGIS 10.5 | |
| Aspect | ||
| Annual Mean Temperature | National Earth System Science Data Center (http://www.geodata.cn/) (accessed on 8 May 2024) | |
| Annual Precipitation | ||
| Fractional Vegetation Cover | Derived from NDVI calculation in ENVI | |
| Landscape Diversity Index | Calculated using Fragstats 4.2.1 | |
| Landscape Connectivity Index | ||
| Land Use Type | China Resources and Environment Science Data Center, CRESDC (https://www.resdc.cn/) (accessed on 8 May 2024) | |
| Distance to Water Bodies | Euclidean Distance | |
| Distance to Natural Scenic Areas | Euclidean Distance | |
| Anthropogenic activity | Distance to Infrastructure | Euclidean Distance |
| Distance to Roads | Euclidean Distance | |
| Distance to Transportation Stations | Euclidean Distance | |
| Distance to Residential Areas | Euclidean Distance |
| Category | Indicator | Indicator Description | Weight |
|---|---|---|---|
| Social Demand | Population Density | Changes in the spatial distribution of the population affect the demand level for CESs. | 0.269 |
| GDP per Unit Area | Reflects the output density and economic development level within urban clusters. Higher GDP indicates higher internal development and economic concentration, leading to greater demand. | 0.234 | |
| Population Density of 60+ Years Old | The density of the population over 60 years old within the city. | 0.098 | |
| Population Density of Under 14 Years Old | Density of population under 14 years old within the city. | 0.089 | |
| Material Demand | Development and Construction Intensity | This is measured by the proportion of built-up areas within the city, representing that higher urban construction levels lead to greater spatial demand for CESs. | 0.144 |
| Human Activity Intensity | Measured by the nighttime light index within the city. | 0.166 |
| Coupling Coordination Type | Coordination Degree | Coupling Coordination Index Range |
|---|---|---|
| Coordinated Development | High-quality Coordination | 0.8–1 |
| Intermediate Coordination | 0.6–0.8 | |
| Excessive Development | Primary Coordination | 0.5–0.6 |
| Endangered Incoordination | 0.4–0.5 | |
| Uncoordinated Development | Intermediate Incoordination | 0.2–0.4 |
| Severe Incoordination | 0–0.2 |
| Cultural Service Type | AUC | TSS Threshold | TPT Threshold | Low-Level Zone | Medium-Level Zone | High-Level Zone | |||
|---|---|---|---|---|---|---|---|---|---|
| Area (km2) | Proportion (%) | Area (km2) | Proportion (%) | Area (km2) | Proportion (%) | ||||
| Native Esthetic | 0.888 | 0.239 | 0.077 | 3089.62 | 44.21 | 2966.52 | 42.45 | 931.86 | 13.34 |
| Recreational Leisure | 0.959 | 0.145 | 0.037 | 4857.24 | 69.51 | 1260.17 | 18.33 | 870.59 | 12.16 |
| Knowledge Educational | 0.949 | 0.132 | 0.026 | 4652.01 | 66.57 | 1824.70 | 26.11 | 511.29 | 7.32 |
| Historical Cultural | 0.946 | 0.192 | 0.050 | 5234.06 | 74.90 | 1078.99 | 15.44 | 674.95 | 9.66 |
| Environmental Variables | Native Esthetic | Recreational Leisure | Knowledge Educational | Historical Cultural | ||||
|---|---|---|---|---|---|---|---|---|
| Importance | Contribution Rate | Importance | Contribution Rate | Importance | Contribution Rate | Importance | Contribution Rate | |
| Elevation | 7.0 | 25.1 | 3.6 | 1.2 | 0.6 | 0.1 | 1.1 | 4.8 |
| Slope | 3.7 | 1.9 | 2.4 | 1.8 | 0.4 | 1.5 | 0.8 | 1.9 |
| Aspect | 2.0 | 1.8 | 2.0 | 0.2 | 0.3 | 1.2 | 0.8 | 1.9 |
| Annual Mean Temperature | 0.6 | 4.4 | 1.7 | 0.5 | 3.1 | 0.4 | 1.6 | 1.7 |
| Annual Precipitation | 2.2 | 8.3 | 0.5 | 0.0 | 0.3 | 1.0 | 0.6 | 0.6 |
| Distance to Water Bodies | 2.8 | 1.4 | 1.8 | 2.1 | 0.2 | 1.1 | 0.4 | 1.9 |
| Distance to Scenic Areas | 38.6 | 20.4 | 10.0 | 17.6 | 10.3 | 11.1 | 36.3 | 38.3 |
| Distance to Infrastructure | 19.5 | 11.6 | 49.1 | 43.1 | 81.3 | 70.1 | 1.0 | 1.0 |
| Distance to Roads | 2.9 | 3.8 | 3.7 | 6.8 | 1.3 | 2.2 | 1.1 | 3.9 |
| Distance to Transportation Hubs | 3.8 | 4.1 | 1.3 | 4.6 | 0.3 | 0.9 | 1.0 | 3.5 |
| Distance to Residential Areas | 2.6 | 1.5 | 3.2 | 1.1 | 0.3 | 2.2 | 39.9 | 6.5 |
| Fractional Vegetation Cover | 5.0 | 5.0 | 6.4 | 8.5 | 0.8 | 5.1 | 6.8 | 24.5 |
| Landscape Diversity Index | 3.7 | 3.0 | 3.8 | 4.9 | 0.3 | 1.6 | 0.7 | 3.7 |
| Landscape Connectivity Index | 1.4 | 2.4 | 1.0 | 0.3 | 0.2 | 1.0 | 1.6 | 2.6 |
| Land Use Type | 4.2 | 4.2 | 9.5 | 7.3 | 0.3 | 0.5 | 6.3 | 3.2 |
| Coupling Coordination Type | Coordination Degree | ||
|---|---|---|---|
| Type | Percentage | Type | Percentage |
| Coordinated Development | 38(43.64%) | High-quality Coordination | 16 (14.55%) |
| Intermediate Coordination | 32 (29.09%) | ||
| Excessive Development | 32(29.09%) | Primary Coordination | 20 (18.19%) |
| Endangered Incoordination | 12 (10.09%) | ||
| Uncoordinated Development | 30(27.28%) | Intermediate Incoordination | 15 (13.64%) |
| Severe Incoordination | 15 (13.64%) | ||
Disclaimer/Publisher’s Note: The statements, opinions and data contained in all publications are solely those of the individual author(s) and contributor(s) and not of MDPI and/or the editor(s). MDPI and/or the editor(s) disclaim responsibility for any injury to people or property resulting from any ideas, methods, instructions or products referred to in the content. |
© 2025 by the authors. Licensee MDPI, Basel, Switzerland. This article is an open access article distributed under the terms and conditions of the Creative Commons Attribution (CC BY) license (https://creativecommons.org/licenses/by/4.0/).
Share and Cite
Huang, X.; Li, C.; Zhao, J.; Chen, S.; Gao, M.; Liu, H. Investigating Spatial Heterogeneity Patterns and Coupling Coordination Effects of the Cultural Ecosystem Service Supply and Demand: A Case Study of Taiyuan City, China. Land 2025, 14, 1212. https://doi.org/10.3390/land14061212
Huang X, Li C, Zhao J, Chen S, Gao M, Liu H. Investigating Spatial Heterogeneity Patterns and Coupling Coordination Effects of the Cultural Ecosystem Service Supply and Demand: A Case Study of Taiyuan City, China. Land. 2025; 14(6):1212. https://doi.org/10.3390/land14061212
Chicago/Turabian StyleHuang, Xin, Cheng Li, Jie Zhao, Shuang Chen, Minghui Gao, and Haodong Liu. 2025. "Investigating Spatial Heterogeneity Patterns and Coupling Coordination Effects of the Cultural Ecosystem Service Supply and Demand: A Case Study of Taiyuan City, China" Land 14, no. 6: 1212. https://doi.org/10.3390/land14061212
APA StyleHuang, X., Li, C., Zhao, J., Chen, S., Gao, M., & Liu, H. (2025). Investigating Spatial Heterogeneity Patterns and Coupling Coordination Effects of the Cultural Ecosystem Service Supply and Demand: A Case Study of Taiyuan City, China. Land, 14(6), 1212. https://doi.org/10.3390/land14061212