Article

Spatiotemporal Dynamics of Urban and Rural Settlements in Tanzania (1975–2020): Drivers, Patterns, and Regional Disparities

1
Social Development Research Center, Zhengzhou University of Light Industry, Zhengzhou 450001, China
2
Henan International Joint Laboratory of Computer Animation Implementation Technologies, Zhengzhou University of Light Industry, Zhengzhou 450001, China
*
Authors to whom correspondence should be addressed.
Land 2025, 14(6), 1205; https://doi.org/10.3390/land14061205
Submission received: 14 May 2025 / Revised: 27 May 2025 / Accepted: 2 June 2025 / Published: 4 June 2025

Abstract

:
Exploring the spatiotemporal evolution of urban and rural settlements in African countries could provide critical insights into the patterns of urbanization, regional disparities, and sustainable development in the context of rapid socio-economic and demographic changes. Using global human settlement data alongside multi-source socio-economic and environmental datasets, this study investigates the spatiotemporal dynamics of human settlements in Tanzania from 1975 to 2020. A combination of methods, including hotspot analysis, standard deviation ellipse analysis, and geographic detectors, is employed to examine the characteristics of settlement evolution and the underlying factors contributing to regional differentiation. The findings reveal that over the past 45 years, the expansion of urban centers and urban clusters in Tanzania has significantly accelerated, while rural areas have experienced a corresponding decline, reflecting a shift from low-density to high-density settlements and a transformation from rural to urban landscapes. Dar es Salaam, Mwanza, and Arusha have consistently been hotspots for urban center growth, while Kagera has emerged as a primary hotspot for urban clusters. The distribution of rural hotspots and coldspots generally mirrors that of urban clusters. The spatial distribution of urban centers, urban clusters, and rural areas follows a northwest–southeast orientation, with the spatial distribution of urban centers gradually stabilizing. However, the development gap between urban clusters in the northwest and rural areas in the southeast is widening and narrowing, respectively. Socio-economic factors exert a stronger influence on the development of settlements than natural environmental factors. Population density, GDP density, and road network density are significant drivers of settlement patterns, with their influence intensifying over time.

1. Introduction

1.1. Background

Africa is one of the regions with the fastest population growth rate and the highest urbanization development rate in the world. The generally high fertility rate and gradually improving medical conditions have led to rapid population growth in Africa. It is expected that by 2050, more than half of the global population growth will be concentrated in eight countries—the Democratic Republic of Congo, Egypt, Ethiopia, India, Nigeria, Pakistan, the Philippines, and Tanzania—five of which are located in Africa. From 2050 to 2100, the population of sub-Saharan African countries will continue to grow and account for over half of the world’s population growth [1]. Urbanization is one of the most profound changes that the African continent will experience in the 21st century. Since 1990, the number of cities in Africa has doubled, and the cumulative urban population has increased by 500 million. The rapid urbanization process will have a profound impact on the social, economic, and political landscape of Africa in the coming decades [2]. At the same time, the types of human settlements in African countries are undergoing rapid changes and reconstruction, providing important opportunities for exploring sustainable development paths for urban and rural areas with African characteristics. However, this process also faces enormous challenges in terms of social, economic, and ecological environments, making it a hot topic of concern for governments and academia.

1.2. Literature Review

Previous research on the sustainable development of urban and rural areas in different countries and regions has mainly been conducted from the perspectives of urbanization, population distribution, and land use change [3,4,5,6]. With the rapid development of 3S technology, high-precision, finely classified, and long-term human settlement data have emerged, which comprehensively consider population size, density, and built-up area morphology and have the ability to better depict human transformation and the utilization of the Earth’s surface. Scholars have conducted extensive research on human settlement changes at various spatial scales in different regions, providing important support for the formulation of regional urban–rural sustainable development policies [7,8,9,10]. Related research can mainly be divided into the following three categories.
Spatial distribution of human settlements: In this category, the main focus is on the distribution of human settlements on the Earth’s surface [11,12], and through a detailed description and analysis of the spatial distribution of human settlements, the population distribution characteristics, urbanization processes, and land use patterns of different countries and regions can be revealed [13,14,15]. Researchers typically utilize remote sensing data, Geographic Information System (GIS) technology, and statistical models to conduct a spatial analysis of the case area. By using high-resolution remote sensing images, the distribution information of settlements in different regions can be obtained to analyze their spatial distribution characteristics. These studies not only provide rich geographic spatial data, but also reveal spatial differences in settlement distribution worldwide, providing a scientific basis for urban and rural planning, resource allocation, and environmental management. In addition, research involves the classification of settlement types, such as rural settlements, urban settlements, and informal settlements, and explores the spatial characteristics and development patterns of different types of settlements.
Spatiotemporal evolution of settlements: Based on long-term series data, various studies focus on the temporal and spatial changes in human settlements, analyzing the growth, expansion, and trends in human settlements [16,17,18], as well as evaluating the impact of settlement evolution on the socio-economic and ecological environment [19,20]. Studies have summarized the laws of human settlement development, such as the trend of settlement concentration towards large cities and the formation of metropolitan areas, providing important references for regional urban planning, land use planning, and population policy formulation. In addition, by comparing the changes in settlements over different time periods, the impact of specific policies or events (such as economic reforms and natural disasters) on the distribution of settlements can be discovered, providing historical references for future development.
Driving factors of settlement distribution: Scholars mainly use spatial analysis and statistical methods such as multiple regression analysis, geographically weighted regression, and geographic detectors to quantitatively analyze the impact of various factors on settlement distribution [21,22,23], including natural factors (such as terrain, climate, and soil type), human factors (such as economic development level and population distribution), and historical and policy factors, in order to reveal the various mechanisms behind human settlement distribution [24,25]. For example, research has found that terrain has a significant impact on the distribution of settlements. The density of settlements in plain areas is usually higher than that in mountainous areas, and climate conditions also play an important role in the selection of settlement locations. For example, warm and humid areas are usually more suitable for human habitation. In addition, human activities such as transportation networks and the establishment of economic centers have greatly influenced the spatial distribution of settlements. By identifying the main factors that affect the distribution of settlements, more targeted infrastructure construction, economic development planning, and environmental protection can be carried out.
However, there is still relatively little attention being paid to the spatiotemporal evolution of human settlements in African countries, and there is a lack of comprehensive research that combines the above three perspectives. Against the backdrop of sustained rapid population and urbanization in African countries, there is an urgent need to conduct research relating to the distribution, evolution, and influencing factors of human settlements. As one of the fastest urbanizing regions in the world, Africa faces unique development challenges and opportunities. For example, many African countries are undergoing rapid urbanization processes, with urban populations constantly growing, as well as facing inadequate infrastructure, resource shortages, and environmental issues. Therefore, conducting comprehensive research on the evolution of human settlements in African countries not only makes up for the shortcomings of existing research but also provides a scientific basis for urban and rural planning, resource management, and sustainable development in these countries.

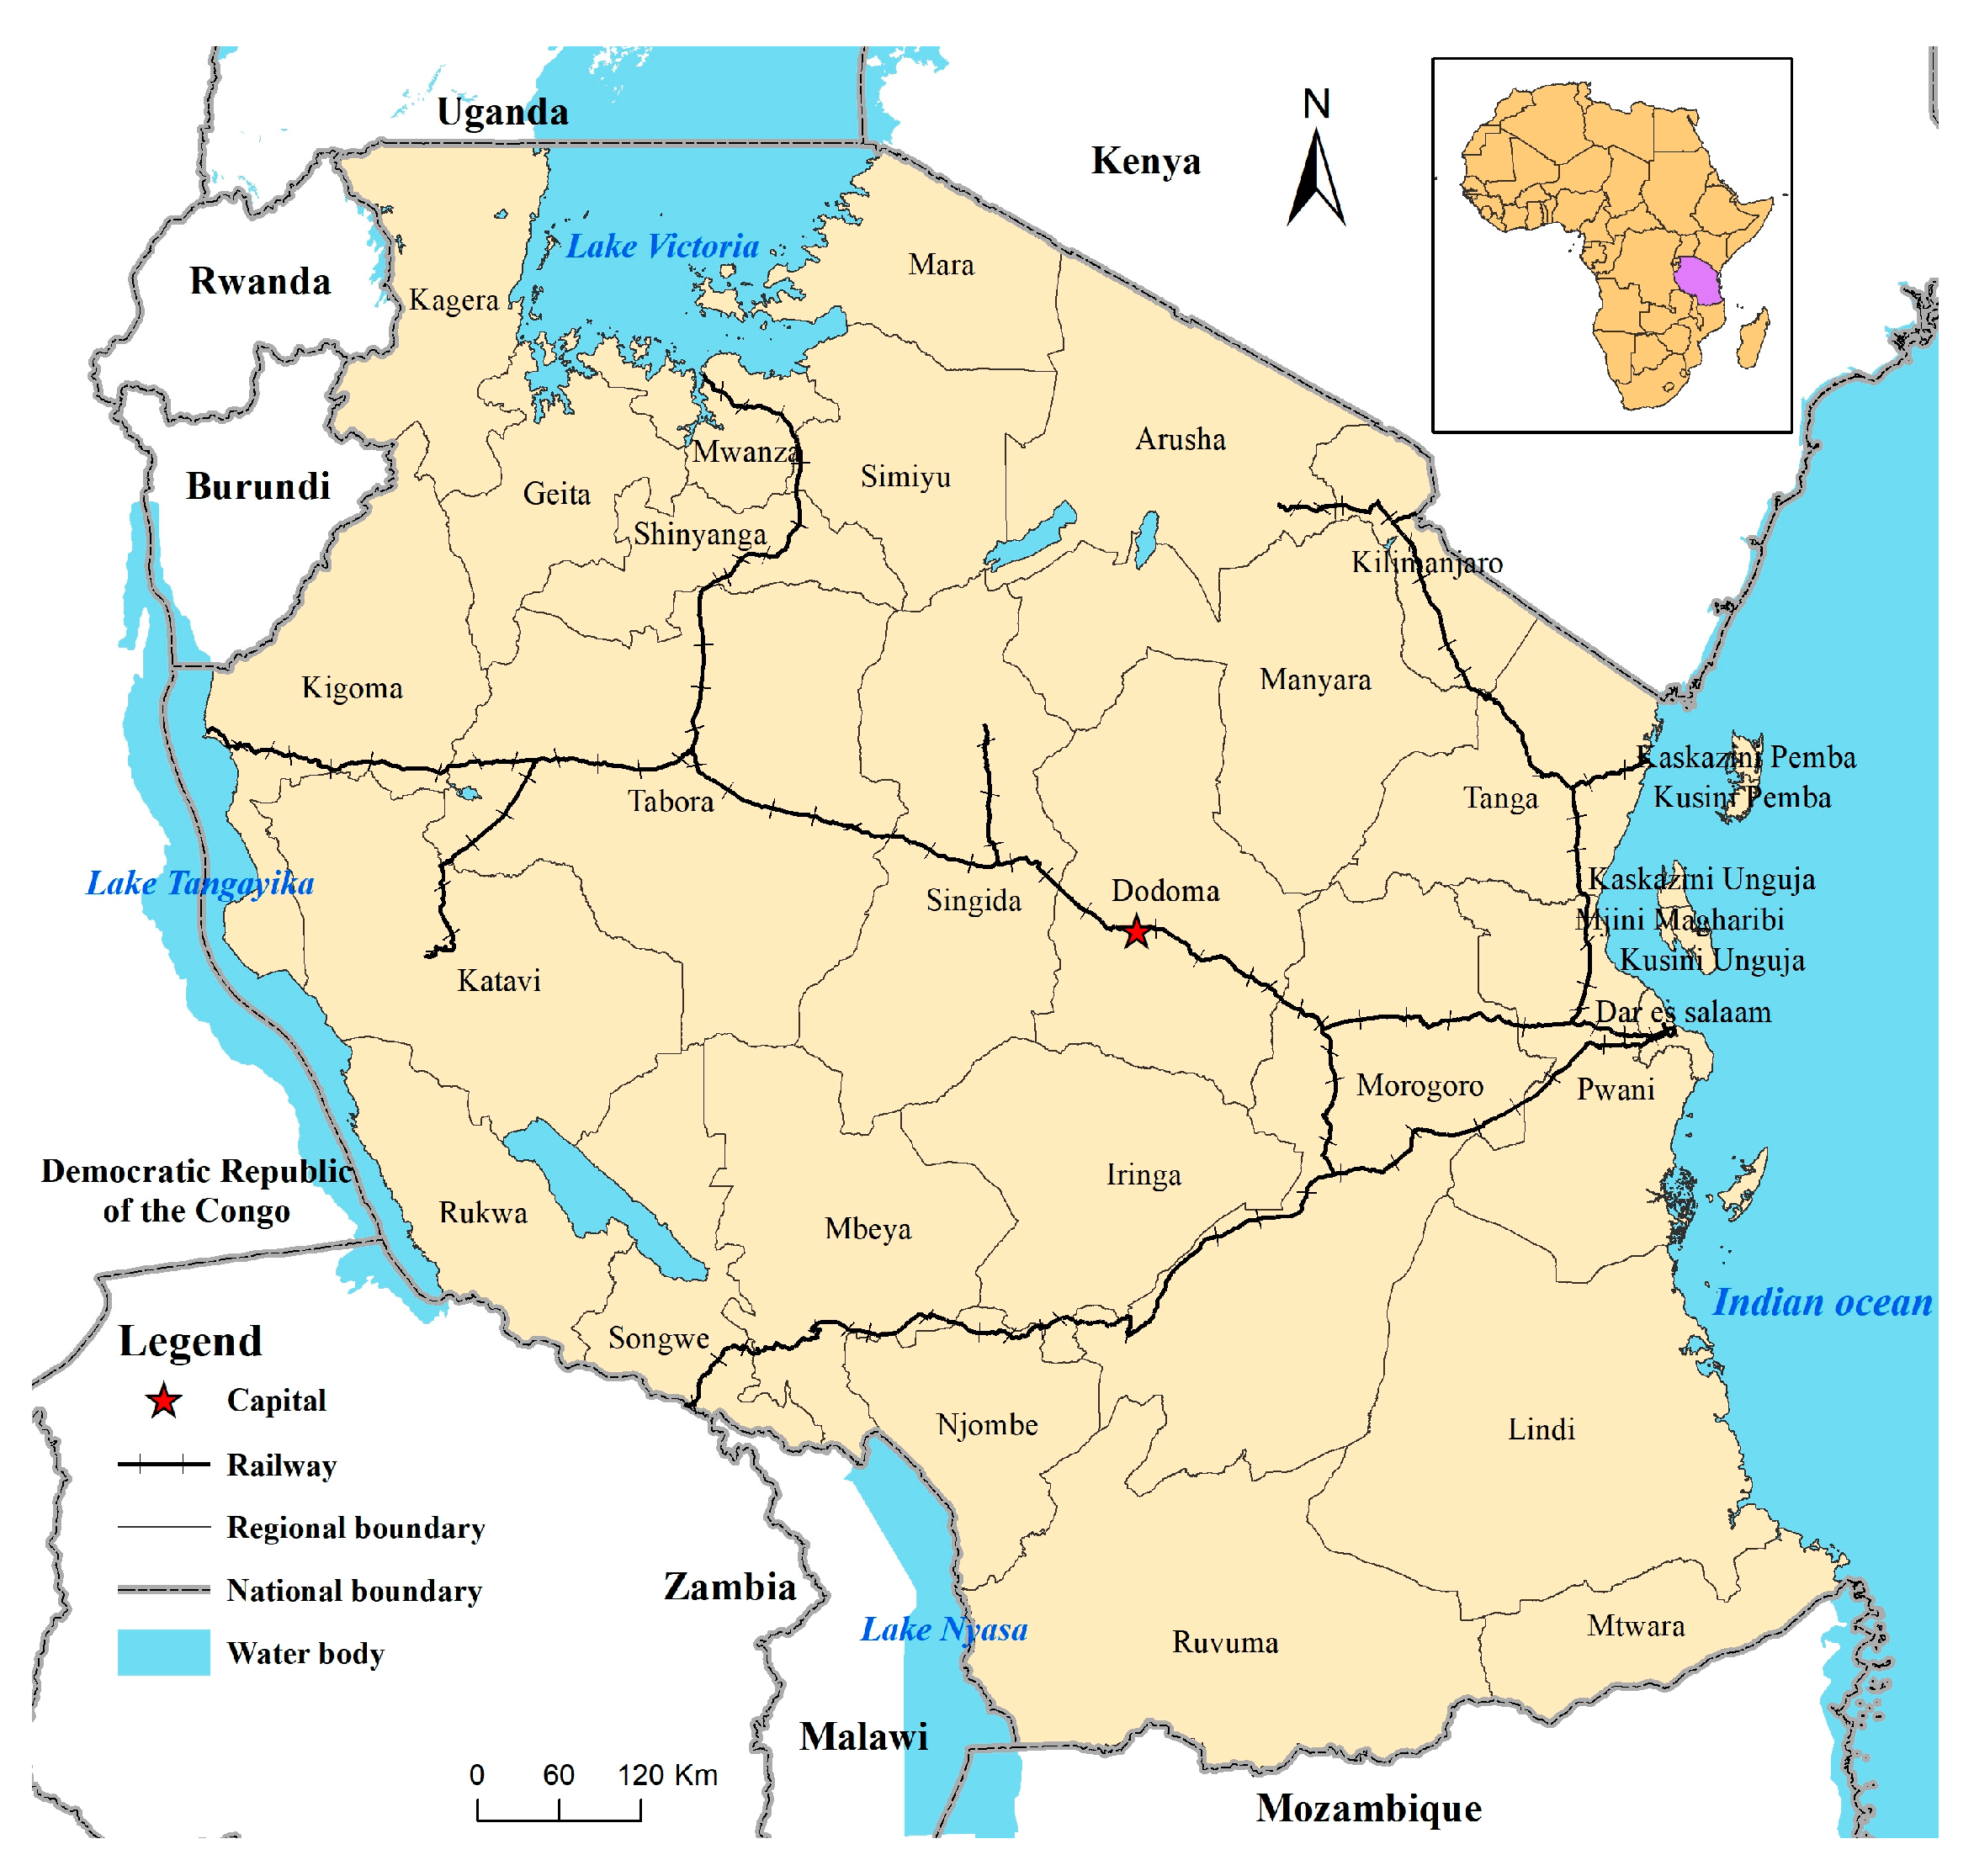
1.3. Study Area Selection

Among many African countries, Tanzania, which is located in East Africa, represents an ideal case study for several reasons. One is demographic and urbanization dynamics. Tanzania is one of the fastest growing countries in terms of population growth and urbanization. It is expected that its population will continue to grow rapidly, with an average annual population growth rate of 2–3% between 2022 and 2050. With its high population growth rate and rapid urban expansion, Tanzania exemplifies typical African urban–rural transformation. The second reason is geographical representativeness. Tanzania’s diverse topography and regional development disparities (e.g., coastal vs. inland areas) provide a comprehensive backdrop for analyzing settlement patterns. Last but not least is strategic importance. China is Tanzania’s largest trading partner, largest source of foreign investment, and largest engineering contractor. Since Tanzania is an important gateway for the Belt and Road Initiative to the interior of Africa, studying the evolution of human settlements in Tanzania has a certain representativeness and important practical significance.

1.4. Research Objectives

Given the above background, based on Global Human Settlement Layer (GHSL) data and multi-source socio-economic and natural environment datasets, through comprehensively using research methods such as the land use transfer matrix, hotspot analysis, standard deviation ellipse analysis, and geographic detectors, this study aims to analyze the spatiotemporal evolution of urban and rural settlements in Tanzania from 1975 to 2020, identify spatial differentiation patterns of urban and rural settlements, and disentangle the relative impacts of socio-economic and natural environmental factors on settlement dynamics. This study aims to find out whether the evolution of urban and rural settlements in African countries has its own regional characteristics. The research results could contribute a profound understanding of the historical evolution and development trends in human settlements in Tanzania and provide important references for Tanzania in urban and rural planning and construction, infrastructure investment, and improving people’s livelihoods and well-being.

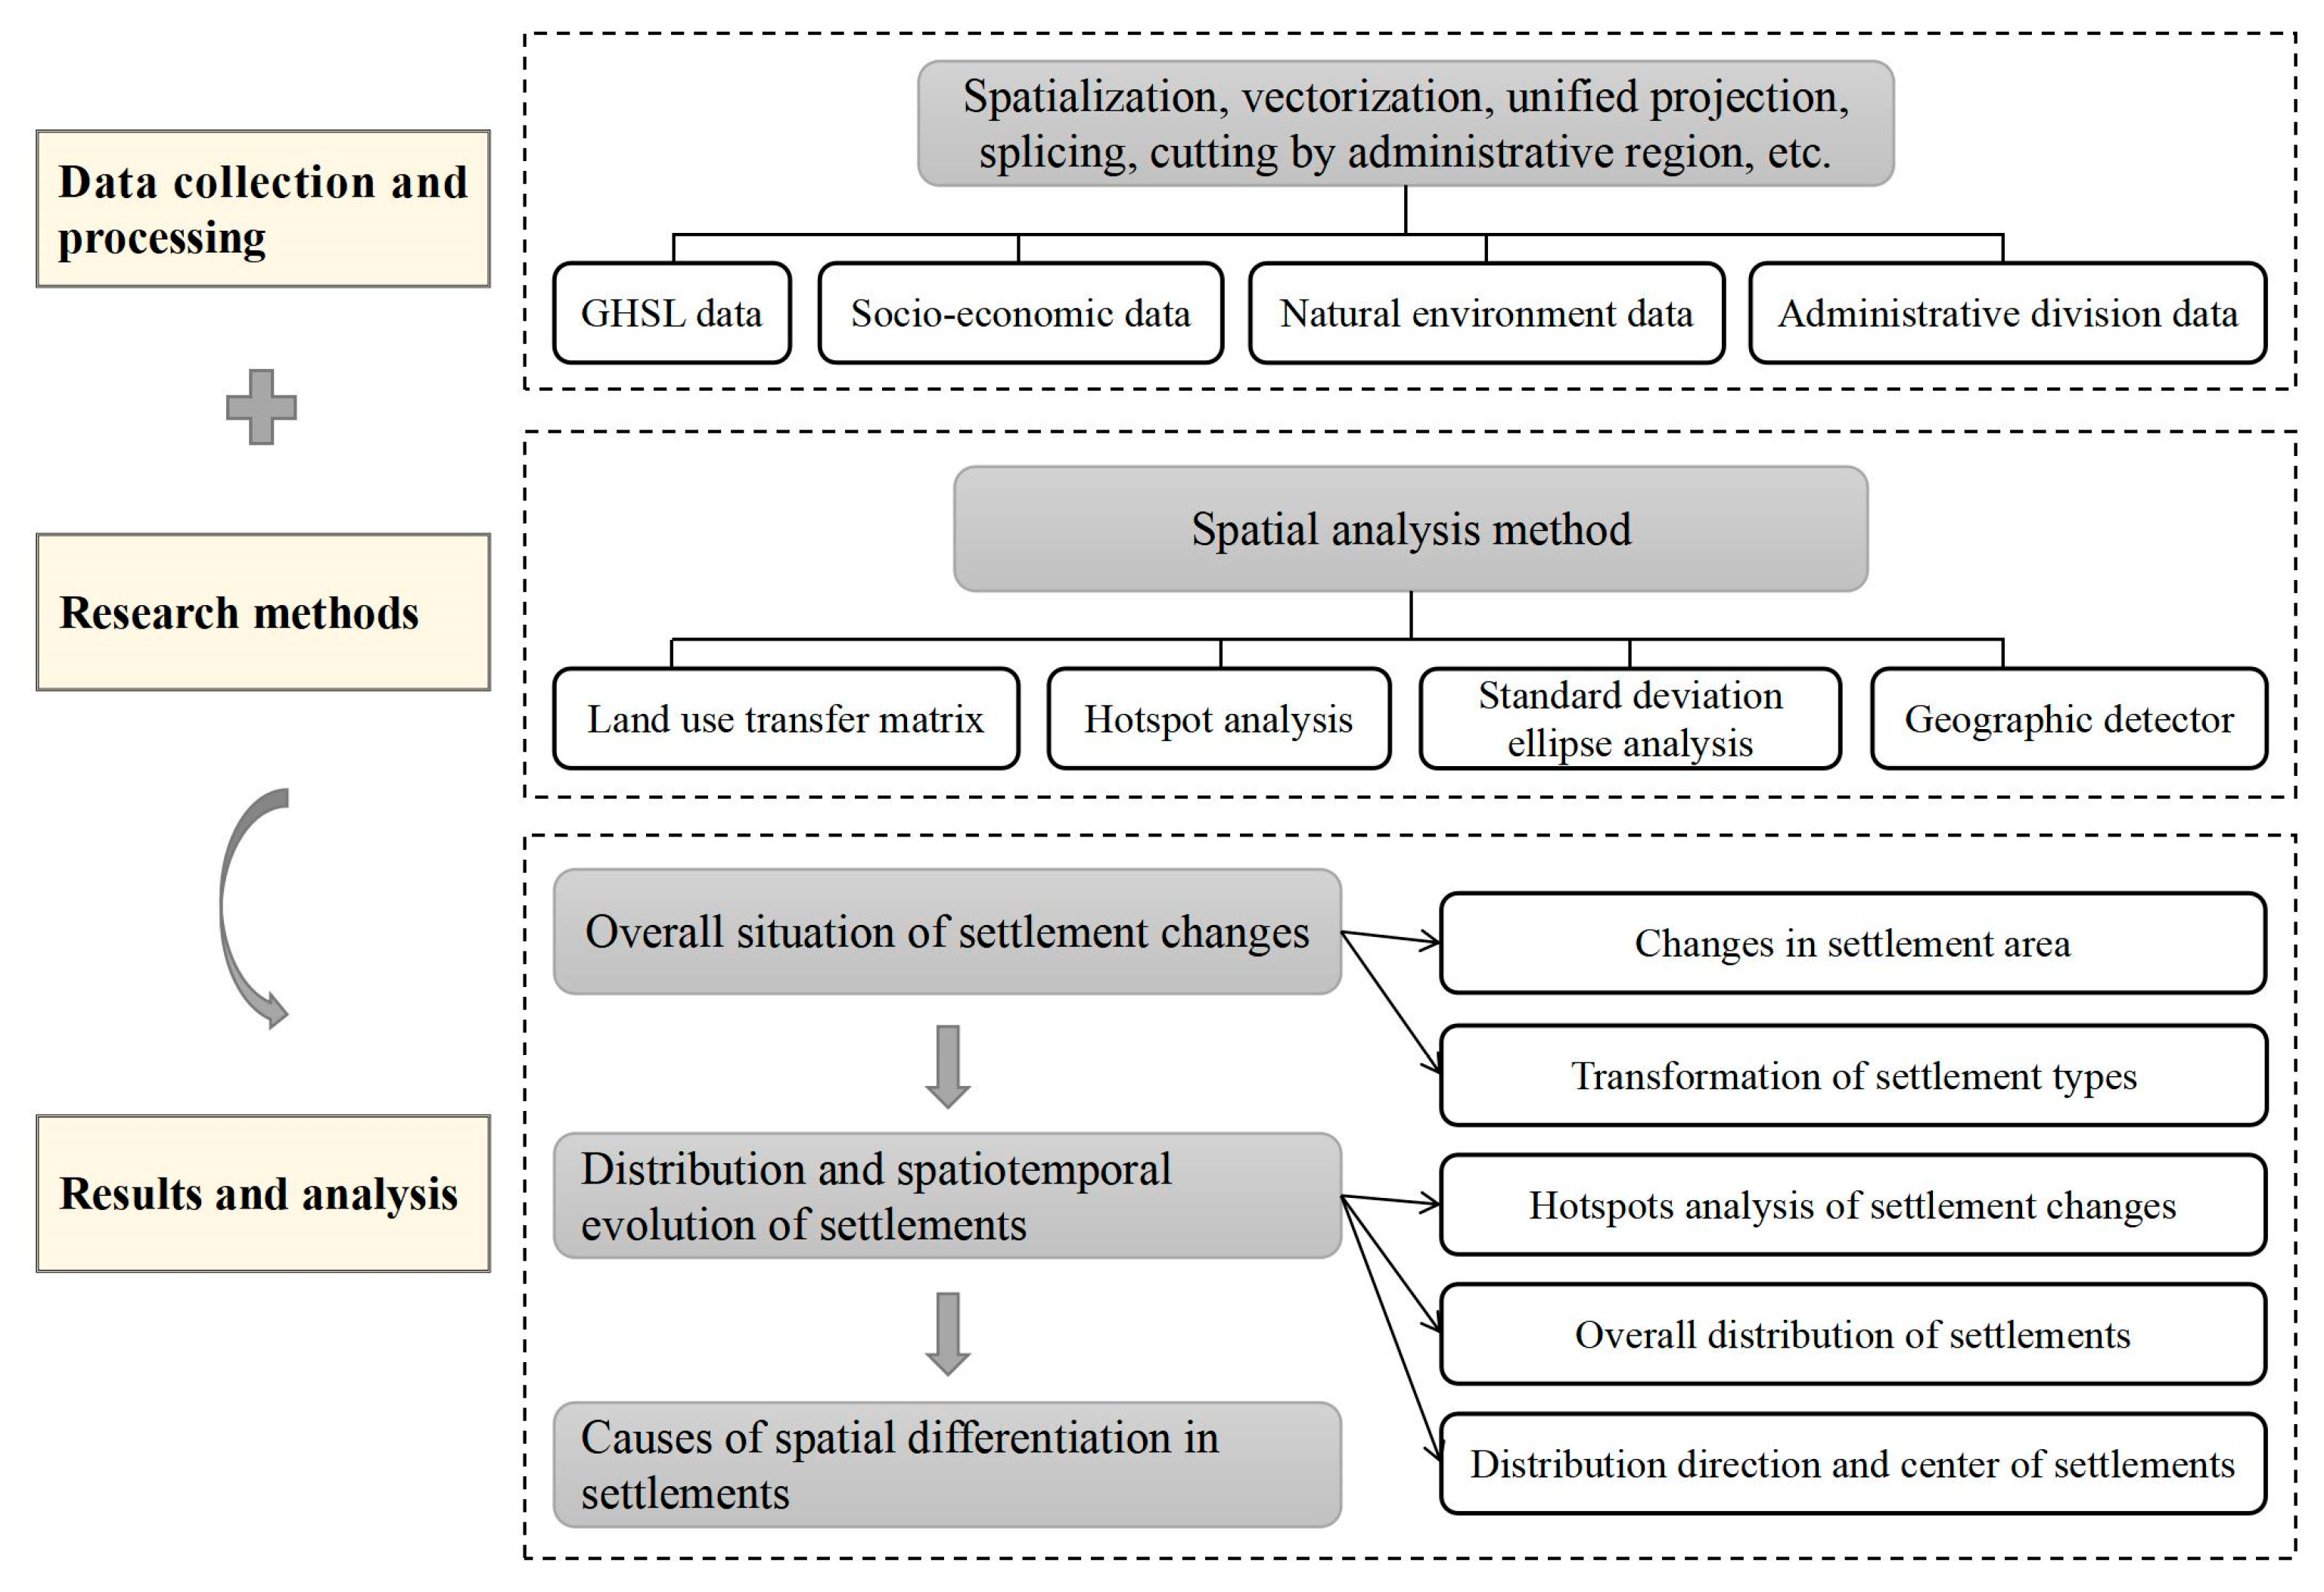
2. Materials and Methods

The data, methods, and main research contents of the study are shown in Figure 1.

2.1. Overview of the Study Area

Tanzania is located in Eastern Africa, which is south of the equator, with a latitude ranging from 0°29′ to 11.44° S and a longitude ranging from 29.14° to 40.30° E (Figure 2). It has a total area of 945,000 km2 and is composed of Tanganyika (the mainland) and Zanzibar (an island) [26]. In 2022, the population was 61.74 million, divided into 31 administrative regions, with 195 districts under its jurisdiction. The subdistricts (Ward) at the county level are divided into three types—urban, mixed, and rural [27].

2.2. Data Source and Processing

Human settlement data relating to Tanzania are sourced from the GHSL website. The Global Human Settlement Layer data are produced and released by the Joint Research Centre of the European Commission, aiming to provide new global spatial information to describe the human habitation status on Earth. Among them, the GHS-SMOD (GHS Settlement Model) data divide human settlements into two levels based on indicators such as population size, population density, and the continuity of built-up areas. The first-level settlement types are divided into three categories—urban centers, urban clusters, and rural areas. The secondary settlement types are divided into seven categories—urban centers, dense urban clusters, semi-dense urban clusters, suburban areas, rural clusters, low-density rural areas, very-low-density rural areas, and water areas [28].
In relation to socio-economic and natural environment data, population density data are sourced from the GHSL website, the GDP density data are sourced from the Scientific Data website, the road network density data are sourced from the Open Street Map, the temperature and rainfall data are sourced from the World Bank Climate Change Knowledge Portal, the soil type data are sourced from the International Livestock Research Institute, and the elevation data are sourced from SRTM. The slope and terrain undulation are calculated separately. The above raster data are processed through seamless stitching, cropping, and unified projection coordinates.
The data on administrative divisions at all levels in Tanzania are sourced from the website of the Tanzania National Bureau of Statistics.
Data used in the research are shown in Table 1.

2.3. Research Method

2.3.1. Land Use Transfer Matrix

The land use transfer matrix is a method used to analyze land use change. By constructing a two-dimensional matrix, the transformation relationship between different land use types is described. Based on the Markov model, this method can quantitatively show the transformation between different land use types. The land use transfer matrix lists the areas of mutual transformation between different settlements in different years in the form of a matrix, which serves as the basis for analyzing the changes and directions of settlement types. This allows for a more intuitive understanding of the mutual transformation relationships between different settlement types. The land use transfer matrix is used to analyze the characteristics of settlement type transformation in Tanzania.

2.3.2. Hotspot Analysis

Hotspot analysis is used to identify spatial clusters with statistically significant high values (hotspots) and low values (coldspots). Its theoretical basis is spatial autocorrelation. Global methods such as Moran’s I index are used to judge the overall aggregation mode, and local methods such as the Getis-Ord Gi* index and Local Moran’s I index are used to accurately locate the hotspots or coldspots. Analysis accuracy is improved by means of spatial scanning statistics. The reliability of the results is verified by statistical significance tests (such as z-score and p-value). This method is widely used in public health, urban planning, criminology, and other fields. According to the z-score and p-value of the element, it can be divided into three types of results. If the z-score of the element is high and the p-value is small, it indicates the existence of high-value spatial clustering; if the z-score of the element is a low negative value and the p-value is small, it indicates the existence of low-value spatial clustering; if the z-score is close to zero, it indicates that there is no obvious spatial clustering. In addition, the higher (or lower) the z-score, the greater the degree of clustering [29]. Hotspot analysis is used to study the high- and low-value clustering areas of different settlement changes in Tanzania.

2.3.3. Standard Deviation Ellipse Analysis

The standard deviation ellipse analysis method is an algorithm used to analyze the direction and distribution of geographic elements at the same time. It uses spatial distribution ellipses with center, azimuth, major, and minor axes as basic parameters to quantitatively analyze spatial characteristics such as the central tendency, directional tendency, and discreteness of geographic elements. The center point of the ellipse represents the center position of the whole data, the azimuth represents the included angle formed by clockwise rotation from the true north direction to the long axis of the ellipse, the semi-major axis represents the direction of data distribution, and the semi-minor axis represents the range of data distribution. The greater the difference between the values of the major and minor axes, the greater of the oblateness, and the more obvious the directionality of the data [30]. Standard deviation ellipse analysis is used to study the directional distribution and central variation characteristics of different settlement types in Tanzania.

2.3.4. Geographic Detector

The geographic detector is a statistical method to detect spatial heterogeneity and reveal the driving factors behind it. This method, with no linear hypothesis, has clear physical meaning. The basic idea is as follows: suppose the study area is divided into several sub-regions; if the sum of the variance of sub-regions is less than the total variance of regions, there is spatial heterogeneity. The Q statistic of the geographic detector can be used to measure spatial heterogeneity and detect explanatory factors and has been applied in many fields of natural and social sciences. By calculating and comparing the q values of each single factor, the explanatory power of each factor on the spatial differentiation of the dependent variable is detected, with a range of values of [0, 1]. The larger the value, the stronger the explanatory power [31]. Based on the actual situation in Tanzania and considering the availability of relevant data, two types of factors—socio-economic and natural environment—are selected to analyze the causes of spatial differentiation in settlements. The former includes population density, GDP density, road network density, and sub-regional types. The latter includes temperature, rainfall, soil type, elevation, slope, and terrain undulation.

3. Results

3.1. Overall Situation of Settlement Changes

3.1.1. Changes in Settlement Area

The changes in the area of primary and secondary settlements in Tanzania from 1975 to 2020 are shown in Table 2. From the results, it can be seen that the urban centers of Tanzanian continue to increase, and the growth rate has significantly improved; however, by 2020, its proportion was only 0.26%.
The area of urban cluster also shows an increasing trend, and the growth rate has significantly increased. The growth rate between 2015 and 2020 was 16.37 times that of urban centers, making it an important type of human settlement development in Tanzania. Suburban areas are the main types of urban clusters, followed by semi-dense urban clusters, while dense urban clusters have the smallest area. They account for 53.52%, 36.44%, and 10.04% of urban clusters in 2020, respectively. Between 1975 and 2020, all three types of area showed an accelerated increasing trend. Among them, suburban areas have the fastest growth rate.
Rural settlements are the main type of settlement in Tanzania. Although their area is rapidly decreasing, their proportion remained above 97% in 2020. Rural settlements are mainly composed of very-low-density rural areas, followed by low-density rural areas. The area of rural clusters is relatively small. Among them, the area of very-low-density rural areas has accelerated and significantly decreased, while the low-density rural areas have accelerated and increased significantly. The rural clusters also show an accelerated increasing trend, but the increase is relatively small.
The above results indicate that both urban and rural settlements in Tanzania are dominated by settlement forms with a low population density. In 2020, the sum of urban centers, dense urban clusters, and rural clusters accounted for only 2.05%.

3.1.2. Transformation of Settlement Types

The transition matrix of different types of settlements in Tanzania from 1975 to 2020 was calculated. Overall, the transformation of settlement types in Tanzania shows the characteristics of “transition from low-density settlements to high-density settlements, and from rural settlements to urban settlements”, reflecting the rapid urbanization process and the trend in population concentration towards urban settlements in Tanzania. This change is closely related to Tanzania’s market-oriented reform since the 1990s. For example, in 1995, the land policy allowed land transfer, promoted the migration of rural population to the periphery of cities, and promoted the transformation of low-density rural areas to suburbs.
Specifically, the main source of the increase in urban centers is the suburban areas, followed by dense urban clusters. The area transformed from rural settlements to urban centers is very small, indicating that Tanzania’s urbanization process is not simply a migration of the rural population to urban centers, but has undergone more complex spatial transformations. The main source of the increase in dense urban clusters is the suburban and semi-dense urban clusters, and there are also some rural clusters that have been transformed into dense urban clusters. Semi-dense urban clusters play an important transitional role in the urbanization process, attracting residents and economic activities from the surrounding rural areas. The main sources of their increase are rural clusters and low-density rural areas. The main source of the increase in suburban areas is low-density rural areas, reflecting the phenomenon of suburbanization caused by urban expansion. At the same time, the area that has transformed from semi-dense urban clusters and rural clusters to suburban area is also relatively large, further indicating the complexity and diversity of Tanzania’s urbanization process. Rural settlements are also undergoing a certain degree of spatial reconstruction, with the main source of the increase in rural clusters being low-density rural areas.

3.2. Distribution and Spatiotemporal Evolution of Settlements

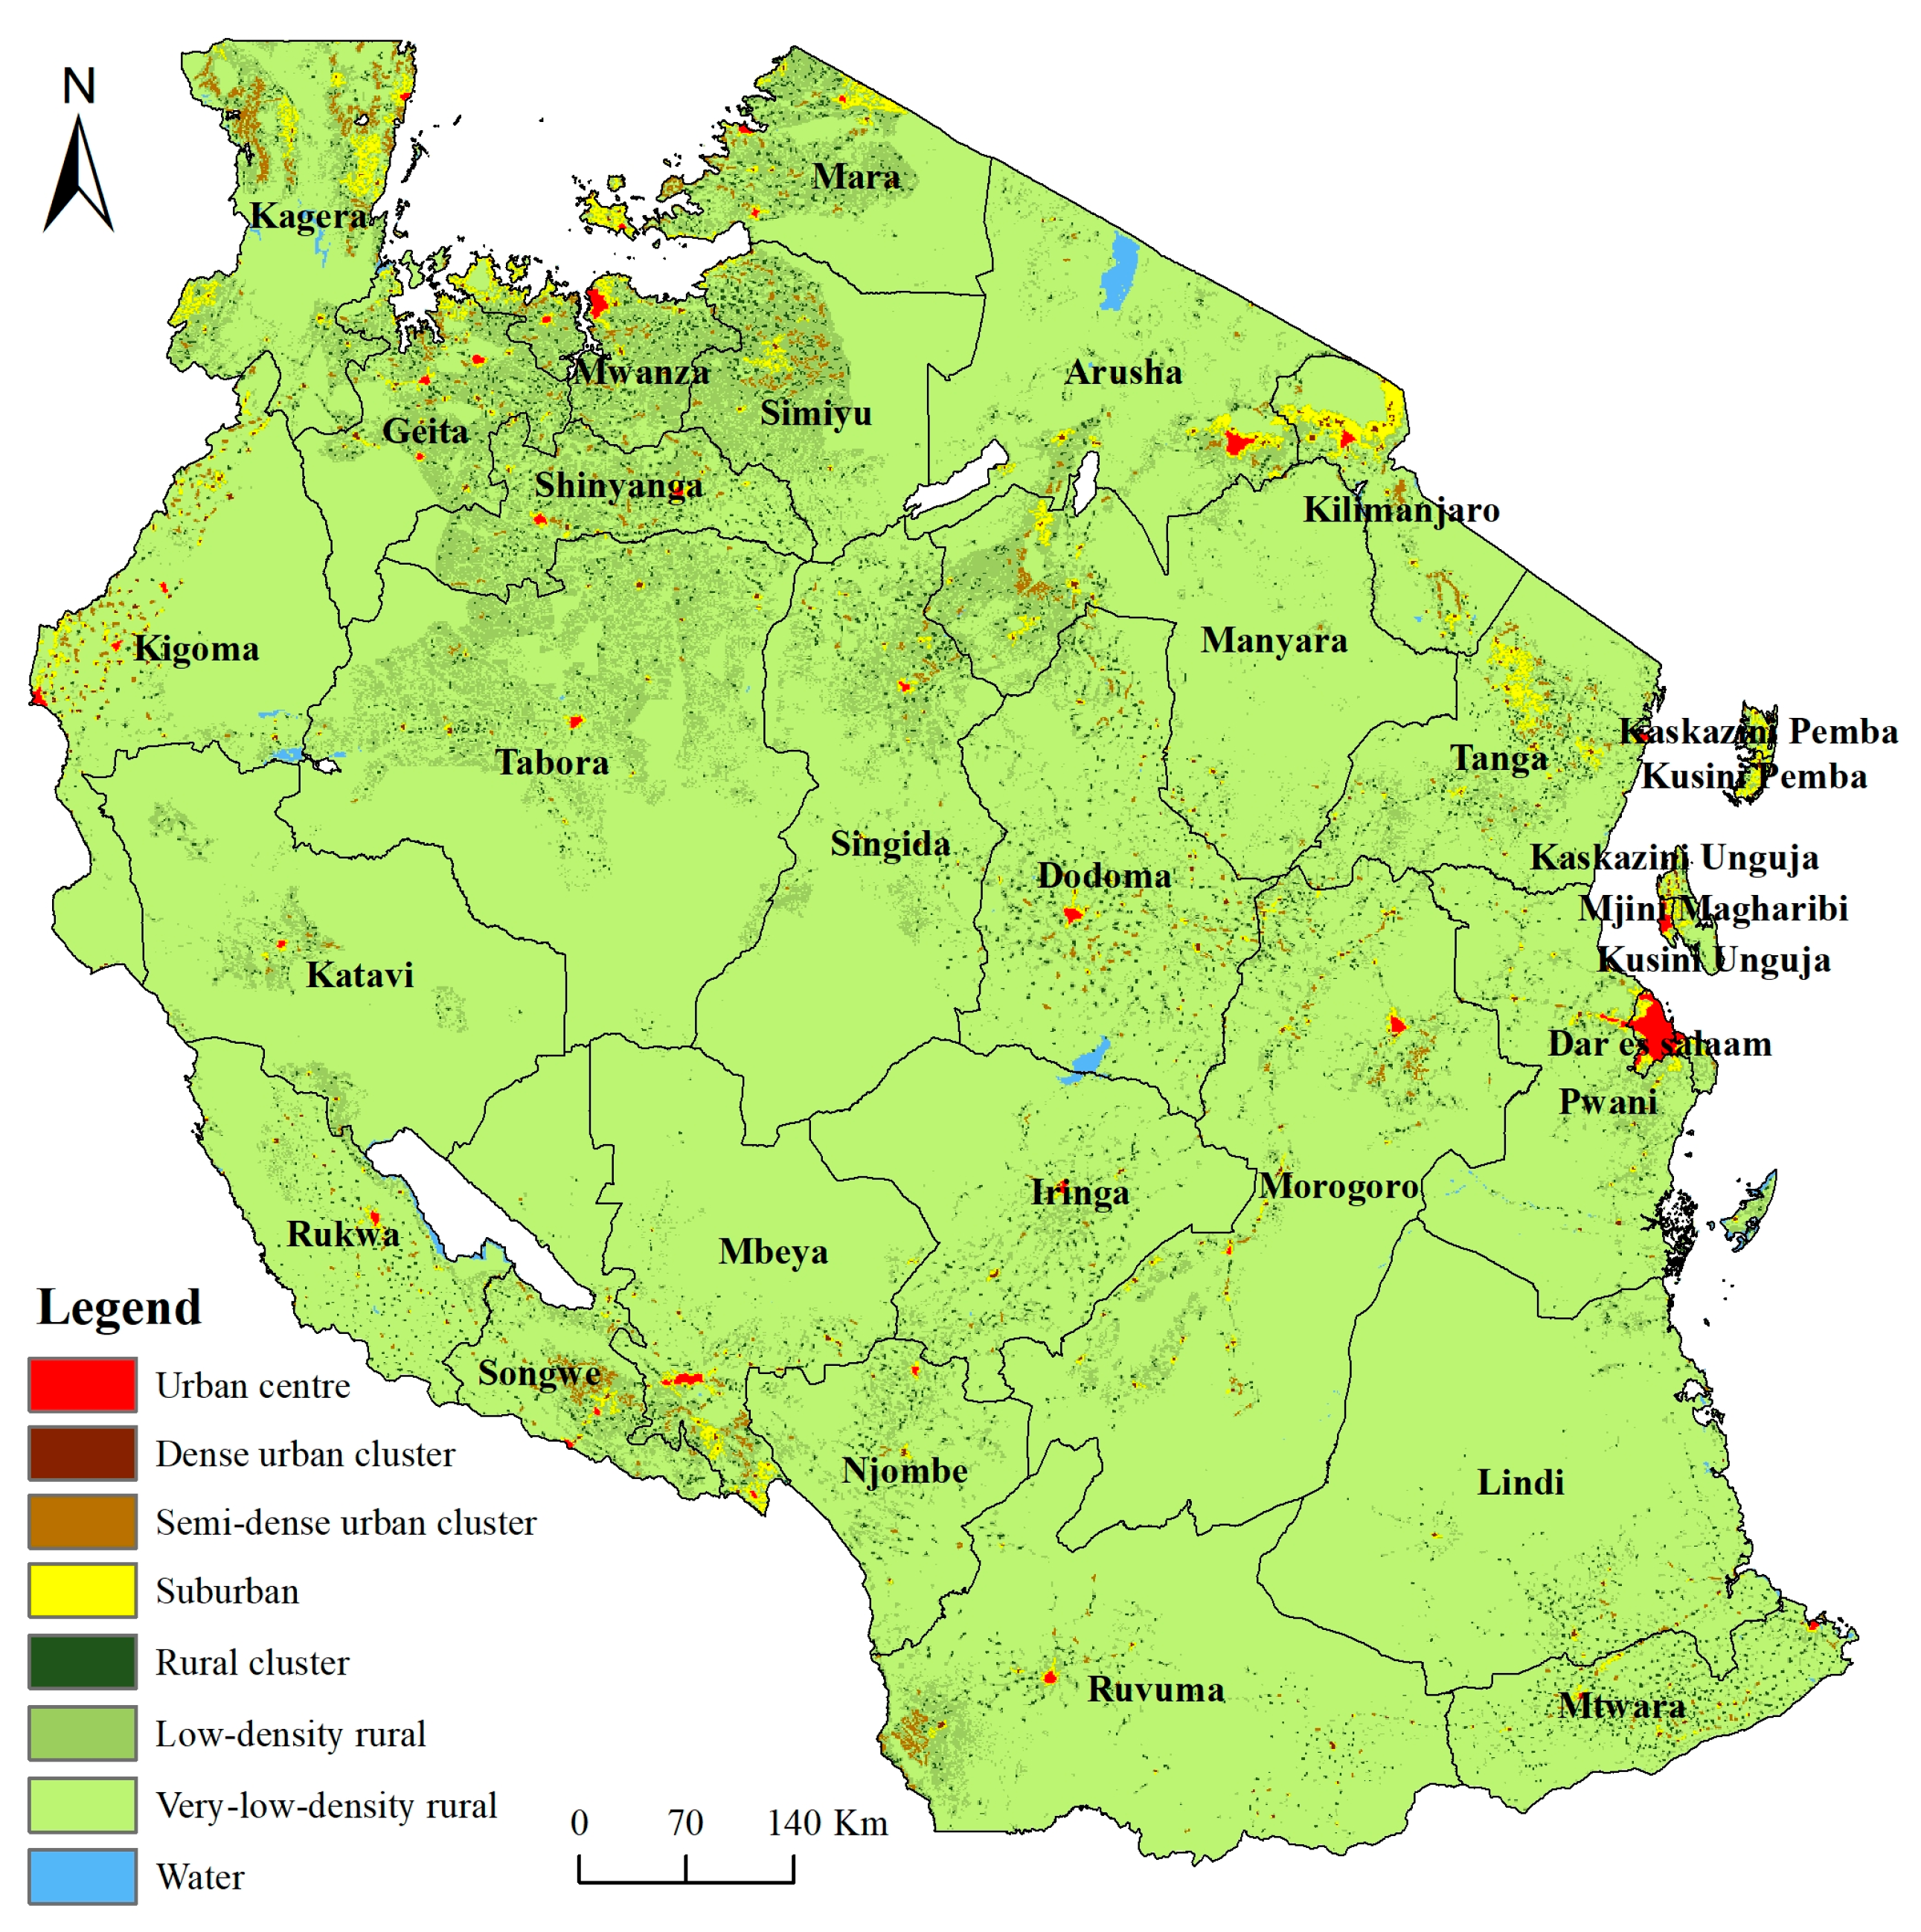
3.2.1. Overall Distribution of Settlements

Statistics on the area distribution of different settlement types in various regions of Tanzania in 2020. Overall, the distribution of urban centers, dense urban clusters, semi-dense urban clusters, and suburban areas is relatively concentrated, with the top ten regions accounting for 76.55%, 64.24%, 68.91%, and 69.49% of the total area of each settlement type, respectively. The top ten regions in terms of rural clusters, low-density rural areas, and very-low-density rural areas account for 54.70%, 62.60%, and 64.34% of the total area of each settlement type, respectively. The degree of concentration is lower than that of urban settlements.
The spatial distribution of different settlement types in Tanzania in 2020 is shown in Figure 3. From the results, it can be seen that the distribution in the urban center is the most concentrated, mainly due to the large area of Dar es Salaam’s urban center, which accounts for 33.05% of the total area of the urban center. Other regions with large urban centers include Mwanza, Arusha, Mbeya, and Kigoma, while the urban center of Dodoma region, where the capital is located, is relatively small. Kigoma region has the largest area of dense urban clusters, and its capital city—Kigoma—has gradually developed into an important secondary city along Lake Tanganyika in western Tanzania. Other regions with large dense urban clusters include Morogoro, Kilimanjaro, Geita, and Dodoma, which are mainly distributed in the central and eastern regions. Semi-dense urban clusters are more commonly distributed along the lake, with Kagera region in the northwest having the largest semi-dense urban cluster, accounting for 18.04% of the total semi-dense urban clusters.

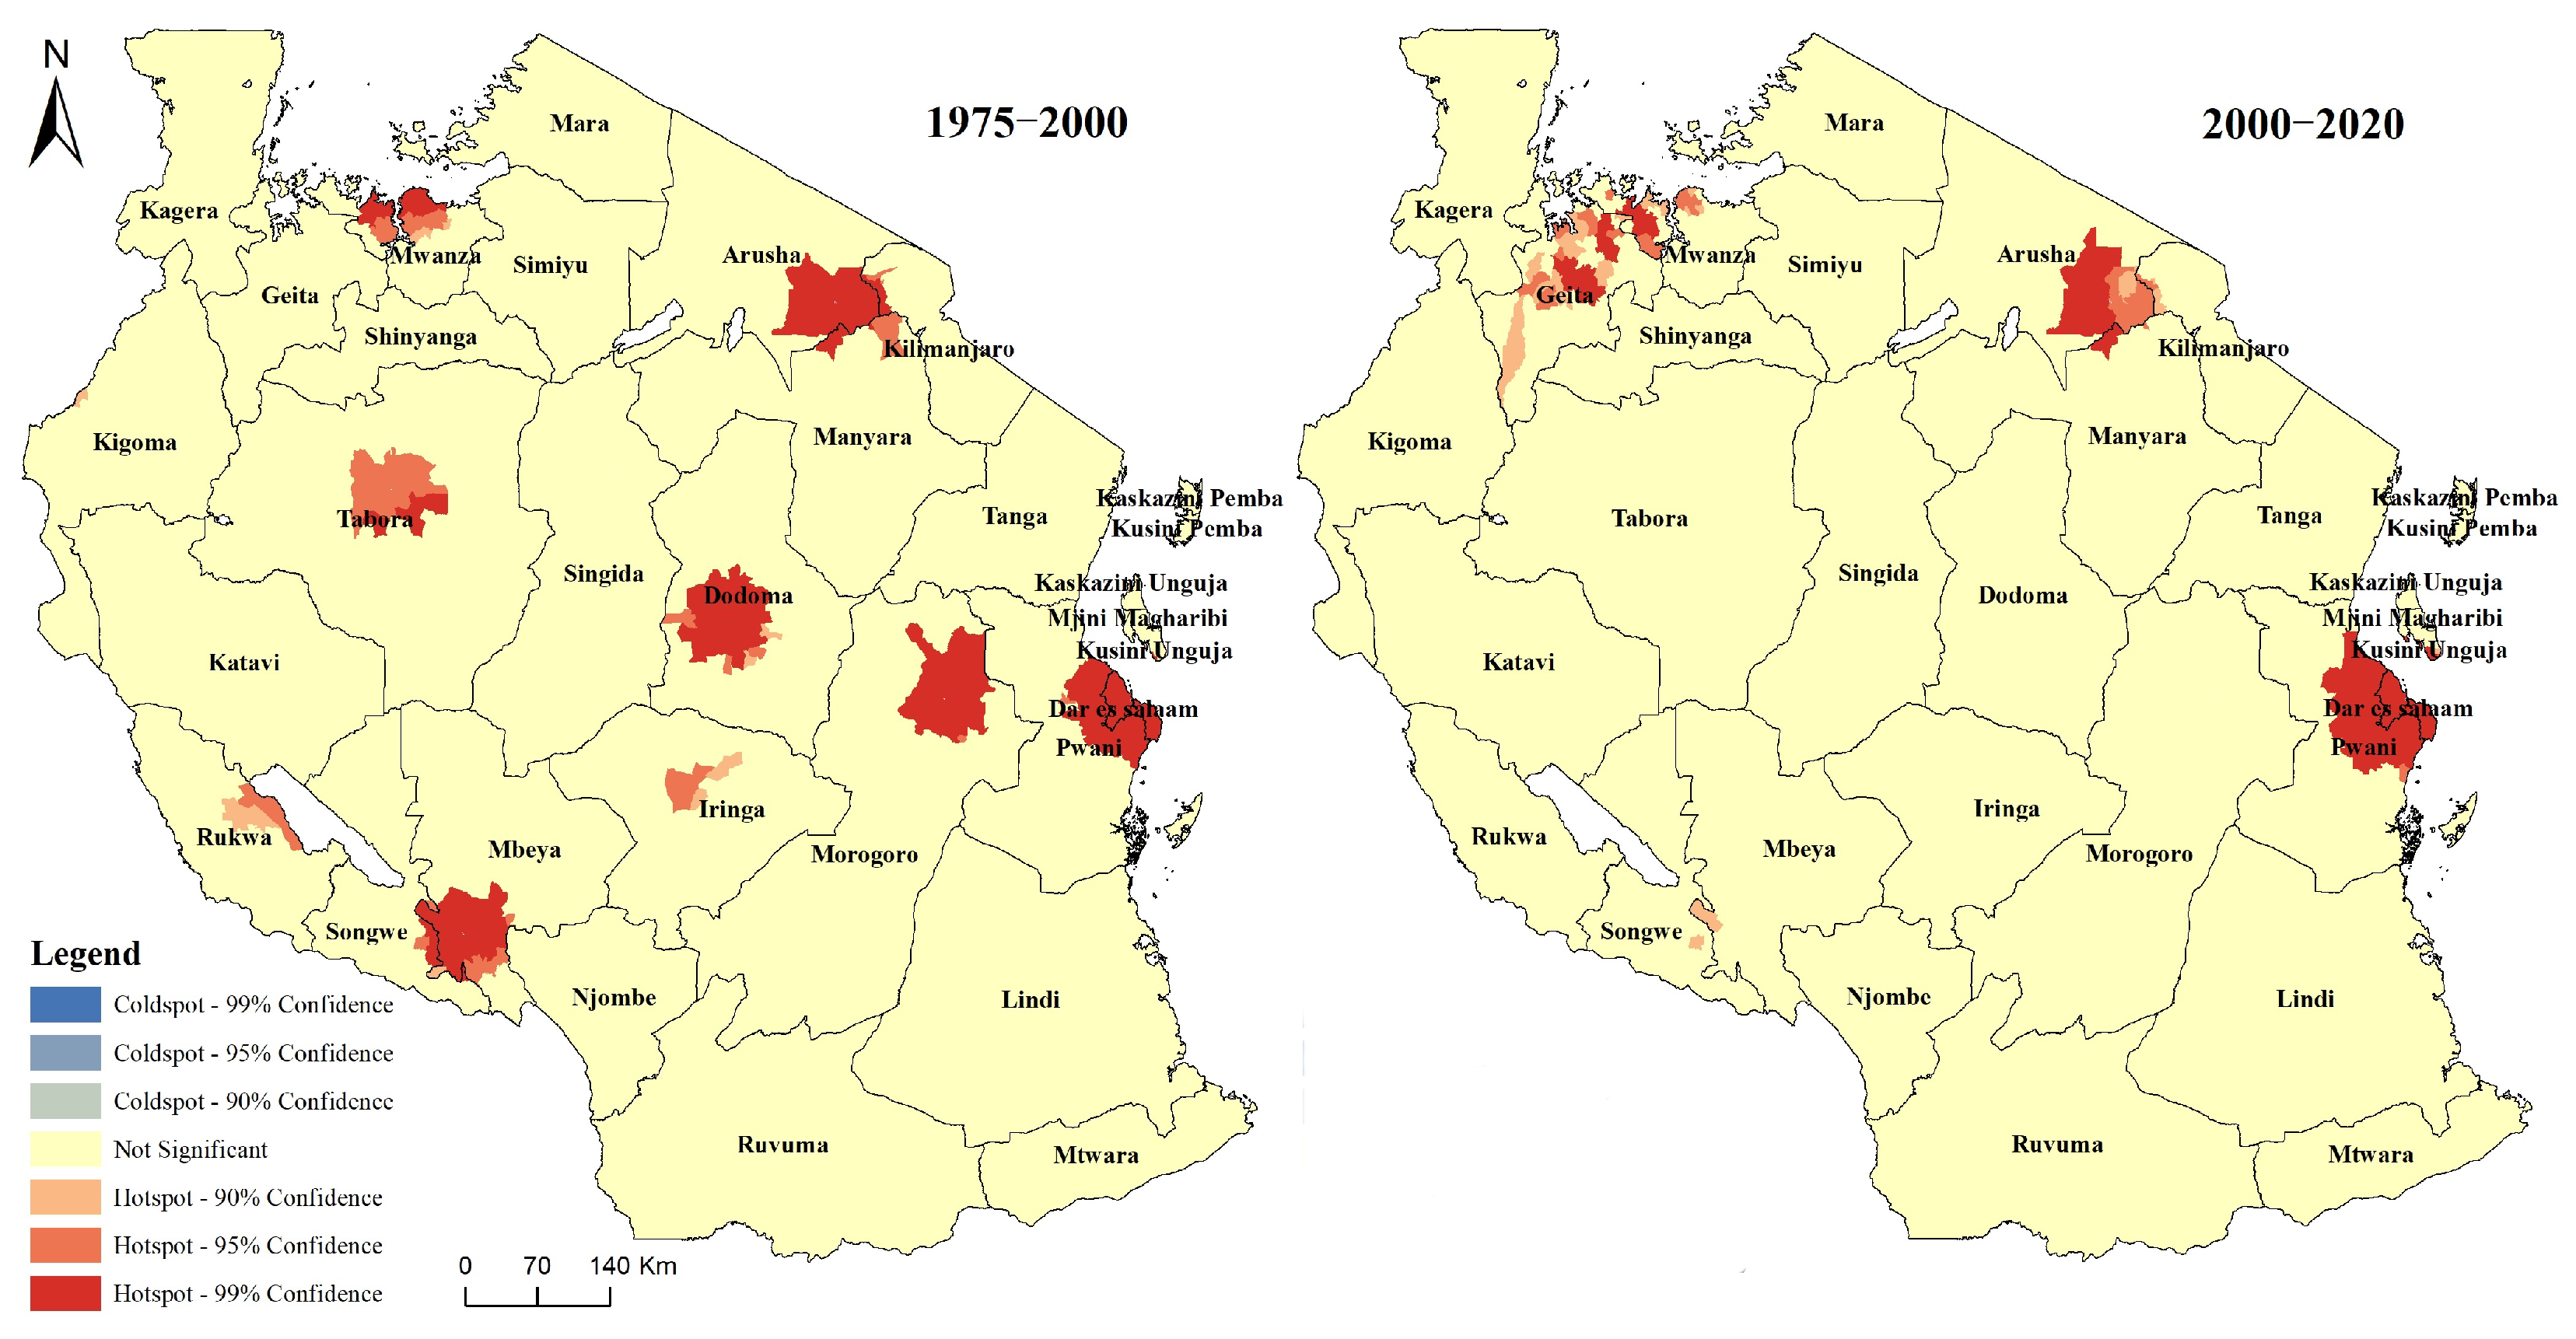
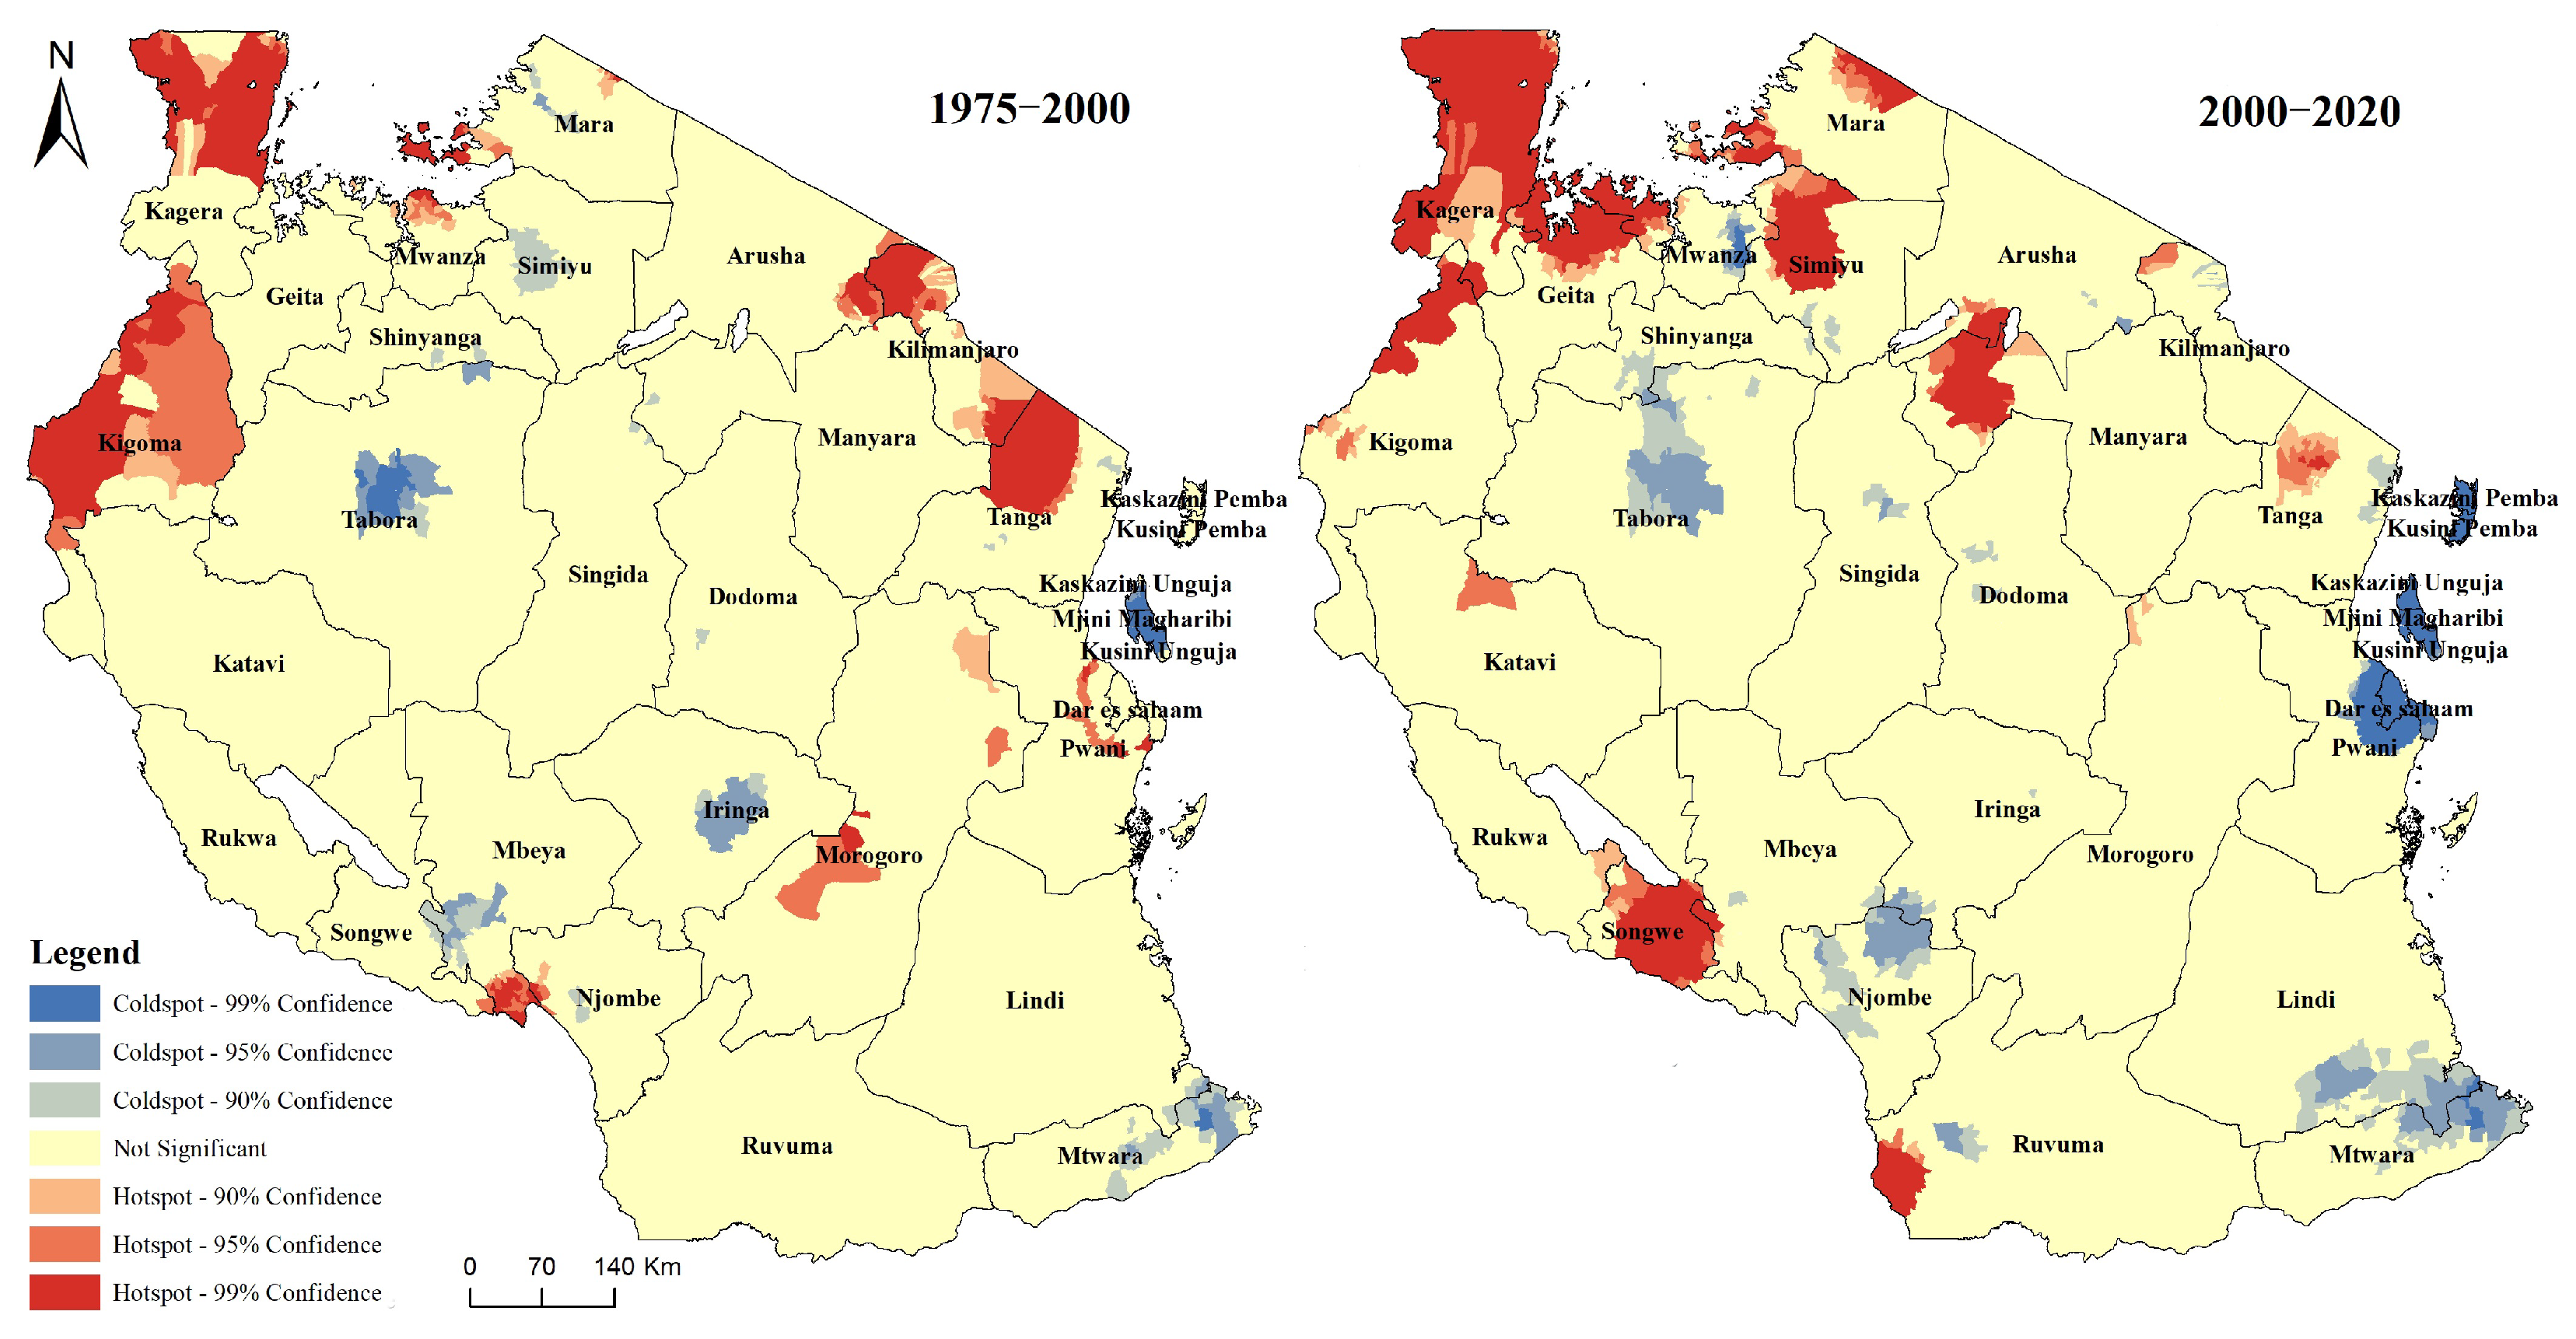
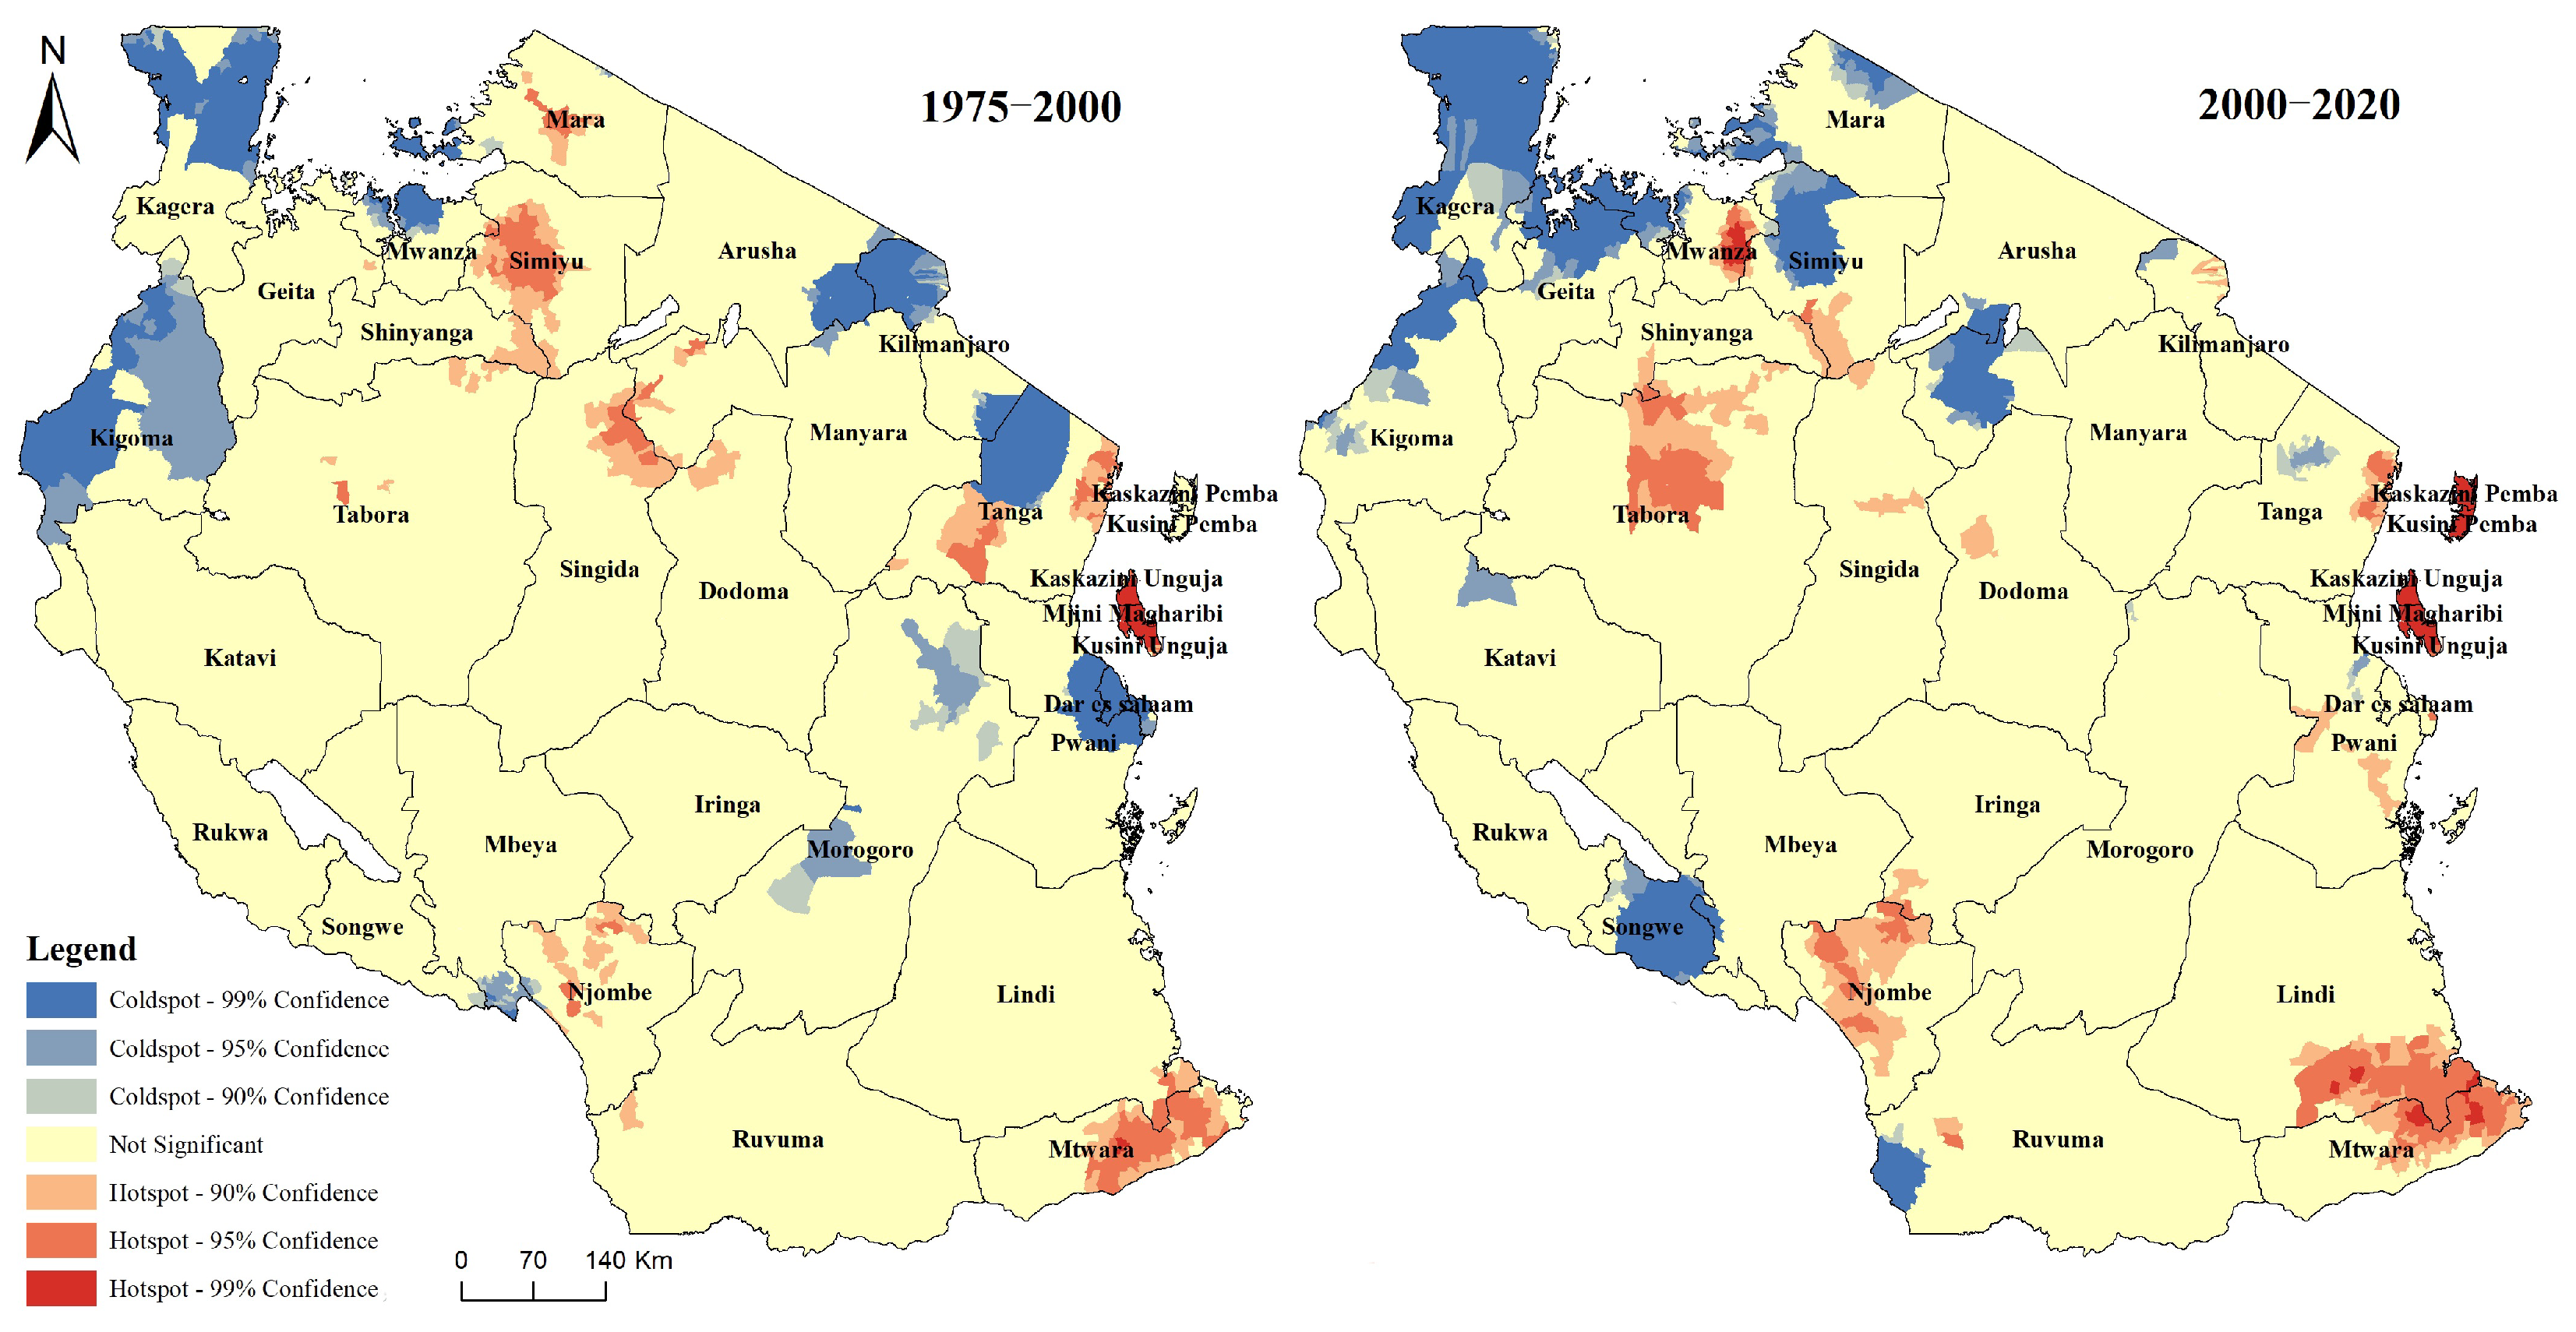
3.2.2. Analysis of Coldspots and Hotspots in Relation to Settlement Changes

(1) Changes in urban centers
The spatial distribution of hotspots and coldspots in urban centers in Tanzania from 1975 to 2020 is shown in Figure 4. From the results, it can be seen that between 1975 and 2000, the hotspots of urban center growth were mainly distributed in the regions of Dar es Salaam, Arusha, Mbeya, Mwanza, Dodoma, and Morogoro, which are the capital cities of each region. They are all located along the central railway and its branches, as well as the TAZARA railway line, and have significant geographical advantages, attracting a large number of population migrations and economic activities. Dar es Salaam and its surrounding areas are all urban center growth clusters, with the growth area of Dar es Salaam city center accounting for 30.31% of the total growth area, occupying a core position in Tanzania’s urbanization process.
Between 2000 and 2020, due to policy guidance, adjustments in regional development strategies, and increased economic activity in other regions, the hotspots for urban center growth decreased compared to the previous stage, while urban center growth became more balanced. The hotspots are mainly distributed in regions such as Dar es Salaam, Arusha, and Geita, among which the growth area of Dar es Salaam city center accounts for 29.63% of the total growth area, which is still the largest and most concentrated area of urban center area growth. This sustained high growth is due to its important position as an international trade port and its historical accumulation as the former capital of the country, making it a major magnet for attracting investment, population mobility, and economic activity. Tanzania has implemented a series of policies to avoid the excessive concentration of resources in one or a few cities, in order to promote urbanization development in a wider area.
(2) Changes in urban clusters
The spatial distribution of hotspots and coldspots in urban clusters in Tanzania from 1975 to 2020 is shown in Figure 5. It can be seen from the results that from 1975 to 2000, the growth hotspots of urban clusters were mainly distributed in Kigoma and Kagera regions in the northwest, which are close to Rwanda and Burundi and have obvious advantages in border trade and transportation. In addition, Tanga and Kilimanjaro regions in the northeast are also hotspots for urban cluster growth, mainly due to their convenient transportation and abundant mineral and agricultural resources, attracting population gathering and economic activities. The coldspots of urban cluster growth are mainly distributed in various regions of Zanzibar Island. Due to the geographical location of the island, it faces high transportation and logistics costs, resulting in relatively lagging urbanization development. Regions such as Tabora, Iringa, and Mbeya have mainly experienced a decrease in urban clusters due to the expansion of urban centers.
Between 2000 and 2020, benefiting from the development of the fishing and tourism industries, as well as trade relations with neighboring countries, the hotspots of urban cluster growth were mainly distributed in regions around Lake Victoria, especially Kagera region, where the hotspot area was relatively large. Kagera continues to be a hotspot for the growth of urban clusters. Relying on the fishery resources of Lake Victoria and cross-lake transportation channels (such as Mwanza–Kagera Highway), Kagera forms a “fishery processing-trade-residence” composite settlement zone. After 2010, the government set up special economic border zones here to attract foreign investment to build fishing ports and logistics centers and prompted the area of urban clusters to increase significantly. In addition, there were also some areas in regions such as Geita, Mwanza, Simiyu, and Mara. Most areas in Songwe region are also hotspots for urban cluster growth. The coldspots of urban cluster growth are mainly distributed in various regions of Zanzibar, and the geographical location and transportation costs of the islands are still important factors restricting their development. Dar es Salaam region and its surrounding areas are also coldspots, mainly due to the expansion of its urban center and the diversion of population and economy caused by urbanization in other regions.
(3) Changes in rural areas
The spatial distribution of hotspots and coldspots in relation to rural changes in Tanzania from 1975 to 2020 is shown in Figure 6. The results indicate that the hotspots and coldspots of rural growth roughly correspond to the hotspots and coldspots of urban agglomeration growth, as the main source of urban agglomeration area growth is rural settlements. From 1975 to 2000, the hotspots of rural growth were mainly distributed in various regions of Zanzibar Island. Zanzibar Island has a unique tropical maritime climate and abundant tourism resources, which have promoted the development of the local rural economy. In addition, the relatively closed environment of islands also makes it easier for internal rural settlements to form growth hotspots. Simiyu and Mtwara regions are also hotspots for rural growth. Mtwara region is located along the southeast coast and benefits from the development and utilization of marine resources, promoting the growth of rural economy. The coldspots for rural growth are mainly distributed in Kigoma and Kagera regions, as well as Dar es Salaam and its surrounding areas.
Between 2000 and 2020, due to the sustained development of the tourism industry and government policy support, Zanzibar Island remained a hotspot for rural growth. Agricultural reform, infrastructure construction, and foreign investment introduction have also promoted the rapid growth of the rural economy in regions such as Tabora, Njombe, and Mtwara. The regions of Kagera, Geita, Simiyu, and others around Lake Victoria, although possessing abundant water resources and agricultural potential, have hindered rural growth due to poor water resource management, outdated agricultural technology, and inadequate infrastructure.

3.2.3. Distribution Direction and Center of Settlements

To further measure the directional distribution characteristics of different settlement types in Tanzania, weighted standard deviation ellipse analysis was conducted on different settlement types in 1975, 2000, and 2020, with the weight being settlement area. The results are shown in Figure 7 and Table 3. From the results, it can be seen that the spatial distributions of the three types of settlements, namely urban centers, urban clusters, and rural areas, all exhibit a “northwest–southeast” spatial trend, which is consistent with the overall terrain trend of Tanzania.
Specifically, the elliptical center of the urban center is located in the central eastern position, moving 79 km southwest from 1975 to 2000 and continuing to move 9 km southwest from 2000 to 2020, gradually approaching the capital city of Dodoma. The elliptical center of the urban cluster is located in the central northern position, moving 100 km northwest from 1975 to 2000 and continuing to move 66 km northwest from 2000 to 2020. The above results indicate that the overall direction of urban settlement development in Tanzania has gradually shifted from the past bias towards the eastern coast to the western region, and the gap in urban settlement development between the east and west is gradually narrowing. In order to promote the development of urban settlements in areas other than Dar es Salaam on the eastern coast and to narrow the regional urban development gap, Tanzania began implementing the “growth pole” strategy in 1969, establishing nine city centers as growth poles, except for Dar es Salaam. In 1973, plans were made to relocate the capital from Dar es Salaam to Dodoma. However, this plan was not truly implemented until 2017. Currently, all ministries in Tanzania are located in Dodoma, and the above measures have eased the imbalance in urban settlement development between the east and the west. The elliptical area in the urban center first increased significantly and then slightly increased, while the oblateness first decreased significantly and then slightly decreased, indicating that the spatial distribution of urban centers tends to be stable. The elliptical area of urban clusters does not change significantly, while the oblateness gradually increases, indicating that the development gap between the northwest and southeast directions is gradually widening. The center of the rural ellipse is located in the central region of Singida region, closest to the National Geographic Center position, and has continued to move towards its southern National Geographic Center position over a period of 45 years. The area of rural ellipses has not changed much, and the oblateness gradually decreases, indicating that the development gap in the northwest and southeast directions is gradually narrowing.

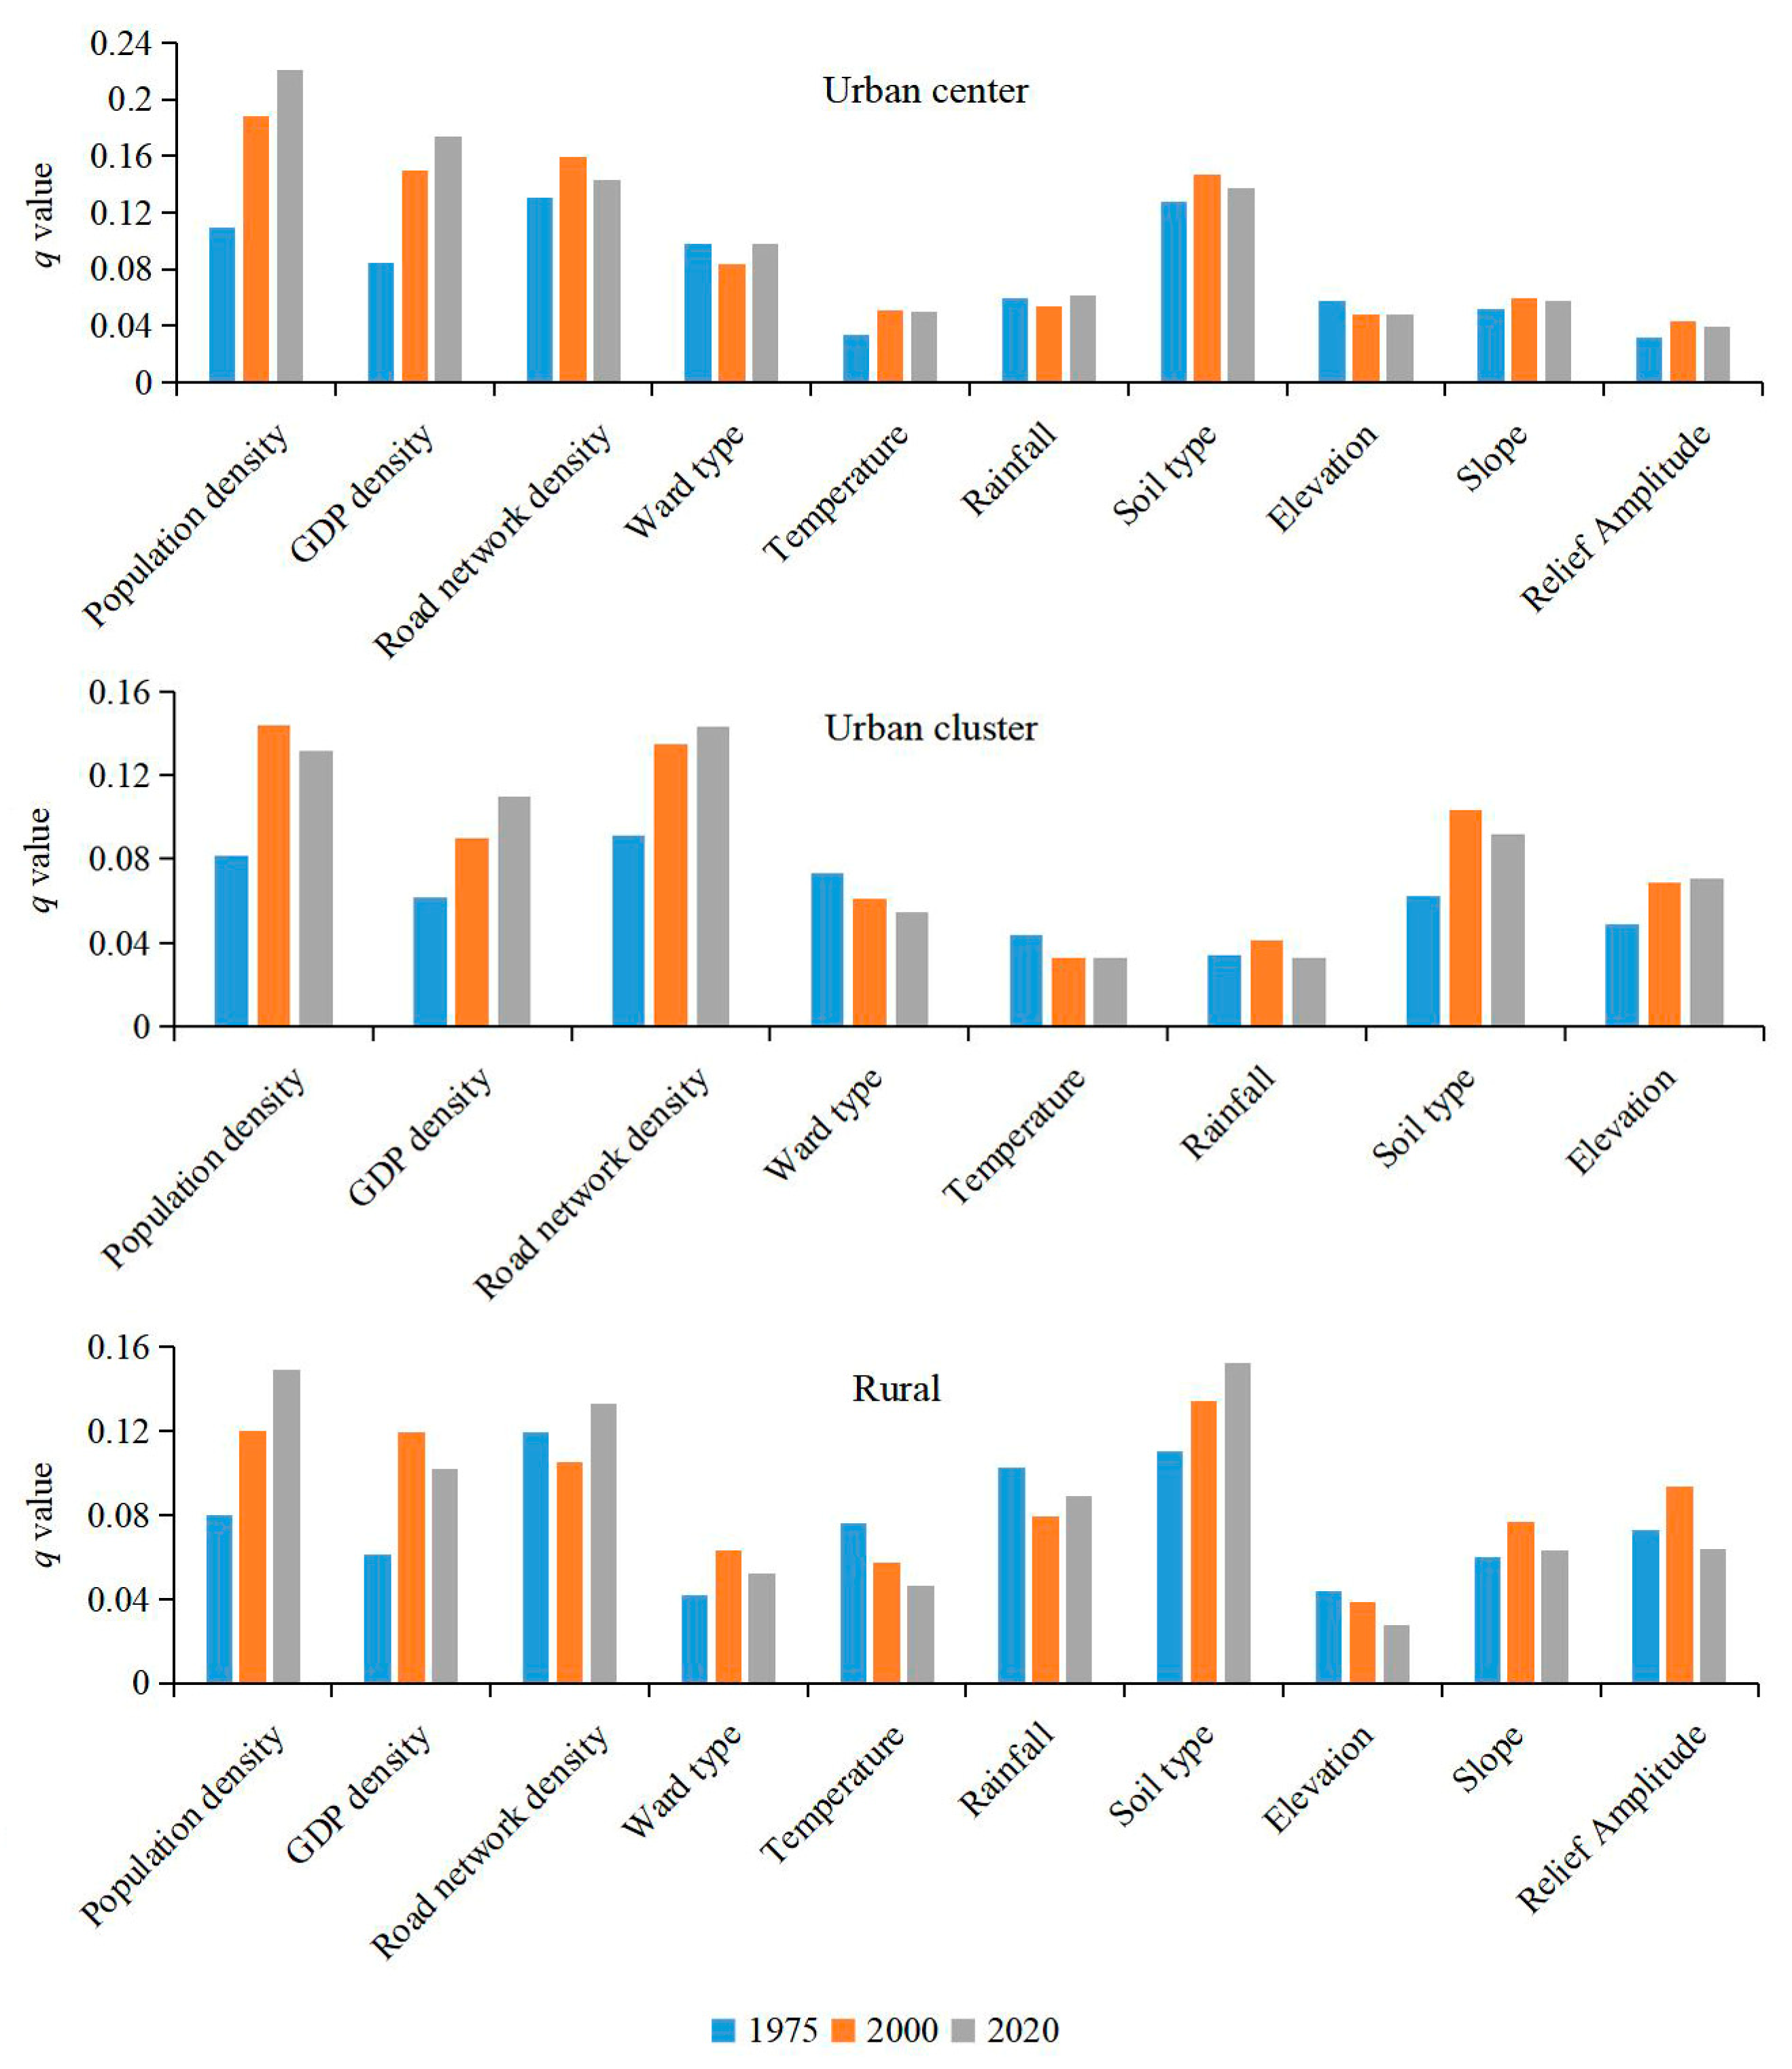
3.3. Causes of Spatial Differentiation in Tanzanian Settlements

Using the geographic detector model to analyze the causes of spatial differentiation of different settlement types in Tanzania, the factors that significantly affect each settlement type (p-value < 0.05) are shown in Figure 8. From the results, it can be seen that the magnitude and significance of the influence of socio-economic and natural environmental factors on different settlement types vary at different stages.
Overall, the impact of socio-economic factors on the three types of settlements is stronger than that of natural environmental factors. The population density, GDP density, and road network density have a significant impact on various types of settlements in relation to socio-economic factors, and their influence generally increases over time. Among them, population density has the greatest impact on various types of settlements, while population growth is the main driving force for settlement expansion. It confirms Tanzania’s model of “urbanization driven by population growth”. From 1978 to 2022, the population of the whole country increased from 17.53 million to 61.74 million, and the average annual growth rate of 3.39% prompted the rural population to gather around the city, forming a phenomenon of “suburbanization”. GDP density represents the level of economic development and agglomeration. Currently, urban and rural construction in Tanzania is mainly based on horizontal expansion, and economic development drives the expansion of settlement areas. In addition, the increase in GDP density is related to the concentration of manufacturing industry in cities, which will attract labor to gather and promote the expansion of urban settlements. The density of road networks also has a significant impact on settlement expansion. Previous studies have shown that roads play an important spatial guiding role in the development of urban and rural areas in Tanzania, especially as an important type of informal settlement in urban agglomerations. They are usually built along both sides of the road and then expand into the middle of the road network, leading to rapid growth in the area of urban agglomerations. Sub-district types distinguish different settlement types based on administrative divisions, which also have a certain impact on settlement expansion. Different sub-district types are influenced by urban–rural development policies in different ways and to varying degrees.
The soil type has the greatest impact on various settlements among natural environmental factors. According to statistics, 62.22% of urban center settlements in Tanzania are built on soil with high agricultural suitability. Nevertheless, agricultural modernization may reduce the dependence on natural soil fertility, leading to the weakening of the influence of soil types on settlement distribution. Agriculture has long been a pillar industry in Tanzania, playing an important role in both urban and rural economic development. Agricultural development requires suitable soil, temperature, rainfall, terrain, etc., especially for rural settlements, which are the main battlefield of agricultural development. In the case of low levels of agricultural mechanization, these natural environmental factors have a significant impact on the development of settlements. The increase in road network density makes it possible to develop mountainous areas, which reflects that technological progress has weakened the restrictions of natural factors such as elevation on settlement expansion. The impact of relief amplitude and slope on urban clusters is not significant, indicating that the expansion of urban clusters takes the influence of terrain and slope into account in a lesser amount, as they mainly expand horizontally in the form of unplanned informal settlements, many of which are built on slopes and valleys with poor infrastructure conditions and have a negative impact on the ecological environment, posing a huge challenge to the sustainable development of urban and rural areas.

4. Discussion

The findings of this study offer nuanced insights into the complex interplay between urbanization, spatial equity, and sustainable development in Tanzania, situating them within the broader context of African urban–rural transformations. The observed trajectory of settlement evolution—characterized by accelerated urban expansion and rural contraction—echoes continental trends but is uniquely shaped by Tanzania’s demographic dynamics, policy interventions, and geographical endowments.

4.1. Convergence with and Departure from Global Urbanization Theories

The primacy of socio-economic factors (population density, GDP density, and road networks) in driving settlement changes aligns with the “new urbanization” paradigm in developing countries, where urban growth is often led by informal expansions, rural–urban migration, and infrastructure-led development [32,33,34]. For instance, the role of road networks in facilitating linear urban agglomeration growth, particularly in semi-dense urban clusters and suburban areas, mirrors the patterns observed in Ghana and Nigeria, where transportation corridors act as catalysts for unplanned urban sprawl [35,36]. However, Tanzania’s case diverges in the pronounced dominance of suburban areas as the primary growth component of urban clusters (accounting for 53.52% of urban clusters in 2020), which reflects a hybrid urbanization model that blends formal city expansion with informal peri-urban settlement proliferation. This highlights the need to transcend binary urban–rural dichotomies and recognize the role of transitional zones in African urbanization [37,38]. This “in situ urbanization” process, where rural settlements evolve into urban-like environments without formal planning, highlights the need for theoretical refinement that accommodates endogenous and polycentric urban growth pathways.

4.2. Policy Implications and Regional Development Dynamics

The persistent hotspots in Dar es Salaam, Mwanza, and Arusha underscore the challenge of urban primacy in Tanzania, a phenomenon that is exacerbated by historical investments in coastal and railway-connected cities [39,40]. While the “growth pole” strategy aimed to disperse development, the slow westward shift in urban center coordinates indicates limited success in reducing regional disparities, which is a common pitfall in African spatial planning [41,42]. The findings reinforce critiques of those spatial planning policies that fail to overcome path dependency in investment and infrastructure allocation. Conversely, our study adds new insights by identifying Kagera and Kigoma in the northwest as emergent growth poles for urban clusters—driven by cross-border trade with Rwanda/Burundi and Lake Victoria fisheries—supporting recent findings that secondary cities in Sub-Saharan Africa can become engines of regional development when they leverage niche economic opportunities [43,44]. This dual pattern of primate city dominance and secondary city emergence calls for policies that balance investment in megacities with infrastructure upgrading in hinterland regions to avoid polarizing development. The adaptive potential of hinterland cities should not be underestimated.

4.3. Urban–Rural Interdependencies and Sustainability Challenges

The inverse relationship between urban cluster hotspots and rural coldspots reveals a classic urban–rural interaction: urban growth frequently draws resources and population from rural hinterlands, potentially weakening rural sustainability. This finding confirms earlier analyses of urban pull dynamics across Africa [45,46]. However, in Zanzibar, rural hotspots sustained by tourism and tropical agriculture highlight the potential for local characteristic economic activities to counteract rural decline—a model that could be replicated in other resource-rich rural areas. This echoes studies from other countries and regions that emphasize the role of local assets in sustaining rural livelihoods. Conversely, the marginal role of natural factors (e.g., slope and relief amplitude) in urban cluster expansion signals a concerning trend of ecologically insensitive urbanization, with informal settlements often being established in ecologically fragile zones. This not only poses risks for soil erosion, flood vulnerability, and inadequate infrastructure provision, but also amplifies risks for marginalized populations living in hazard-prone zones, aligning with warnings about “disorderly urban growth” in sub-Saharan Africa [47,48,49]. Future planning should integrate environmental risk assessments into settlement policies to mitigate these challenges.

4.4. Relevance for China–Africa Cooperation

Tanzania’s strategic position as a Belt and Road Initiative partner underscores the policy relevance of our findings. The prioritization of road network density and GDP-driven growth in this study resonates with China’s infrastructure investments in the country, such as the Dar es Salaam Port expansion and standard-gauge railway projects. However, our results caution against focusing solely on high-profile infrastructure and highlight the need for these investments to be paired with spatial equity measures, such as targeted rural infrastructure to stem unsustainable rural–urban migration and environmental safeguards in order to ensure that urban expansion does not degrade ecologically important areas. Supporting secondary cities and enhancing rural–urban connectivity could yield more balanced development and prevent unchecked sprawl in primary cities. By embedding these insights into bilateral cooperation frameworks, stakeholders can foster more inclusive and resilient urban–rural systems in Tanzania and beyond.
In summary, this study situates Tanzania’s settlement dynamics within a globalized African context, emphasizing the role of policy, economy, and infrastructure in shaping space, while cautioning against the ecological and social costs of unplanned growth. The findings challenge simplistic narratives of African urbanization, instead advocating for context-specific, multi-stakeholder approaches to balance development efficiency with sustainability.

5. Conclusions

This study systematically analyzes the spatiotemporal evolution of urban and rural settlements in Tanzania from 1975 to 2020, revealing key patterns and driving mechanisms.
Urban centers and agglomerations in Tanzania experienced accelerated expansion, while rural areas shrank, reflecting a transition from low-density rural areas to high-density urban forms. Urban clusters, particularly suburban and semi-dense urban clusters, emerged as the dominant growth type, driven by rapid urbanization and population concentration.
Dar es Salaam, Mwanza, and Arusha remained persistent hotspots for urban center growth, while Kagera led the expansion of urban clusters. Rural settlement changes were closely linked to urban growth, with hotspots in Zanzibar and coldspots in northwest Tanzania, indicating spatial interdependencies between urban–rural systems.
All settlement types exhibited a northwest–southeast spatial trend, with urban centers stabilizing in distribution and urban clusters showing widening development gaps in this direction. Rural settlements, conversely, saw narrowing regional disparities over time.
Socio-economic factors, especially population density, GDP density, and road network density, exerted stronger influences than natural factors. Soil type was the most significant natural factor, reflecting Tanzania’s agrarian foundation, while terrain had limited impact, highlighting the role of unplanned urban expansion in shaping settlements.
By combining hotspot analysis, standard deviation ellipses, and geographic detectors, this study advances the understanding of African settlement dynamics through a multi-scale, interdisciplinary approach. These findings offer critical insights for Tanzania’s urban–rural planning, underscoring the need to integrate spatial equity, infrastructure investment, and environmental sustainability into policy design. As a key partner in the China–Africa cooperation, Tanzania can leverage these results to optimize resource allocation, enhance rural–urban connectivity, and promote inclusive development under the Belt and Road Initiative. Future research may extend this framework to other African countries to identify commonalities and context-specific challenges in continental settlement dynamics. Although this study has achieved some results, several research limitations remain. Firstly, there is a lack of micro-level analyses of informal settlements, which constitute a significant but understudied component of urban settlements in Tanzania. With the improvement of data resolution, future research could delve into the socio-economic and ecological impacts of such settlement patterns and explore adaptive strategies for sustainable urban–rural integration. Secondly, there is limited qualitative integration, such as field research and interviewing local stakeholders to explore the lived experiences and policy reception in urban–rural transformation. Thirdly, comparative studies with other East African countries (e.g., Kenya and Uganda) could illuminate regional commonalities and idiosyncrasies in settlement evolution under shared demographic and climatic pressures.

Author Contributions

Conceptualization, J.Z. and H.L.; methodology, J.Z. and J.F.; software, J.Z. and R.Z.; validation, J.Z. and X.G.; formal analysis, J.Z. and J.F.; investigation, J.Z. and R.Z.; resources, J.Z. and H.L.; data curation, J.Z., R.Z. and J.F.; writing—original draft preparation, J.Z. and R.Z.; writing—review and editing, J.Z. and X.G.; visualization, J.Z.; supervision, J.Z. and H.L.; project administration, J.Z.; funding acquisition, J.Z. All authors have read and agreed to the published version of the manuscript.

Funding

This research was funded by the National Natural Science Foundation of China, grant number 42101309; 42161144003; 42301314, the Annual Projects of the Philosophy and Social Sciences Planning of Henan Province, grant number 2024BSH037; 2022HSH026, the General Project of Humanities and Social Sciences Research in Henan Provincial Department of Education, grant number 2025-ZDJH-036, the Higher Education Philosophy and Social Science Innovation Team Support Plan of Henan Province, grant number 2024-CXTD-004, and the Major Project of Basic Research on Philosophy and Social Sciences in Universities of Henan Province, grant number 2023-JCZD-21.

Data Availability Statement

The data that support the findings of this study are available from the corresponding author upon reasonable request.

Conflicts of Interest

The authors declare no conflicts of interest.

Abbreviations

The following abbreviations are used in this manuscript:
GISGeographic Information System
GHSLGlobal Human Settlement Layer

References

  1. UN. World Population Prospects—Summary of Results; United Nations: New York, NY, USA, 2022; Available online: https://www.un.org/development/desa/pd/sites/www.un.org.development.desa.pd/files/wpp2022_summary_of_results.pdf (accessed on 12 February 2024).
  2. Sumari, N.S.; Cobbinah, P.B.; Ujoh, F.; Xu, G. On the Absurdity of Rapid Urbanization: Spatio-Temporal Analysis of Land-Use Changes in Morogoro, Tanzania. Cities 2020, 107, 102876. [Google Scholar] [CrossRef]
  3. Shi, C.; Zhu, X.; Wu, H.; Li, Z. Urbanization Impact on Regional Sustainable Development: Through the Lens of Urban-Rural Resilience. Int. J. Environ. Res. Public Health 2022, 19, 15407. [Google Scholar] [CrossRef] [PubMed]
  4. Profiroiu, C.M.; Bodislav, D.A.; Burlacu, S.; Radulescu, C.V. Challenges of Sustainable Urban Development in the Context of Population Growth. Eur. J. Sustain. Dev. 2020, 9, 51–57. [Google Scholar] [CrossRef]
  5. Gibas, P.; Majorek, A. Analysis of Land-Use Change between 2012–2018 in Europe in Terms of Sustainable Development. Land 2020, 9, 46. [Google Scholar] [CrossRef]
  6. Baqa, M.F.; Lu, L.; Chen, F.; Nawaz-ul-Huda, S.; Pan, L.; Tariq, A.; Qureshi, S.; Li, B.; Li, Q. Characterizing Spatiotemporal Variations in the Urban Thermal Environment Related to Land Cover Changes in Karachi, Pakistan, from 2000 to 2020. Remote Sens. 2022, 14, 2164. [Google Scholar] [CrossRef]
  7. Gutierrez, E.; Moral-Benito, E.; Oto-Peralias, D.; Ramos, R. The Spatial Distribution of Population in Spain: An Anomaly in European Perspective. J. Reg. Sci. 2023, 63, 728–750. [Google Scholar] [CrossRef]
  8. Liao, B.; Wang, Z.; He, J.; Wu, J.; Su, J. The Driving Mechanisms for Human Settlement and Ecological Environment in the Upper Minjiang Watershed, China. Front. Environ. Sci. 2023, 11, 1097801. [Google Scholar] [CrossRef]
  9. Sheng, S.; Lian, H. The Spatial Pattern Evolution of Rural Settlements and Multi-Scenario Simulations since the Initiation of the Reform and Opening up Policy in China. Land 2023, 12, 1763. [Google Scholar] [CrossRef]
  10. Togiti, D.; Naik, G.; Bagadi, R.C. Investigation on Built-up, Population, and Road Network Density Dynamics Using GIS, Regression, and Causation Analysis: A Case Study of Hyderabad City, India. J. Urban Plann. Dev. 2023, 149, 04023020. [Google Scholar] [CrossRef]
  11. Strano, E.; Simini, F.; De Nadai, M.; Esch, T.; Marconcini, M. The Agglomeration and Dispersion Dichotomy of Human Settlements on Earth. Sci. Rep. 2021, 11, 23289. [Google Scholar] [CrossRef]
  12. Hu, Q.; Wang, C. Quality Evaluation and Division of Regional Types of Rural Human Settlements in China. Habitat Int. 2020, 105, 102278. [Google Scholar] [CrossRef]
  13. Corbane, C.; Syrris, V.; Sabo, F.; Politis, P.; Melchiorri, M.; Pesaresi, M.; Soille, P.; Kemper, T. Convolutional Neural Networks for Global Human Settlements Mapping from Sentinel-2 Satellite Imagery. Neural Comput. Appl. 2021, 33, 6697–6720. [Google Scholar] [CrossRef]
  14. Tan, B.; Wang, H.; Wang, X.; Yi, S.; Zhou, J.; Ma, C.; Dai, X. The Study of Early Human Settlement Preference and Settlement Prediction in Xinjiang, China. Sci. Rep. 2022, 12, 5072. [Google Scholar] [CrossRef] [PubMed]
  15. Bian, J.; Chen, W.; Zeng, J. Spatial Distribution Characteristics and Influencing Factors of Traditional Villages in China. Int. J. Environ. Res. Public Health 2022, 19, 4627. [Google Scholar] [CrossRef]
  16. Cong, X.; Li, X.; Gong, Y. Spatiotemporal Evolution and Driving Forces of Sustainable Development of Urban Human Settlements in China for SDGs. Land 2021, 10, 993. [Google Scholar] [CrossRef]
  17. Sun, D.; Hong, B.; Ren, P. Spatiotemporal Evolution and Driving Factors of the Rural Settlements in the Mountain-Plain Transitional Zone. Int. J. Agric. Biol. Eng. 2022, 15, 149–155. [Google Scholar] [CrossRef]
  18. Wang, J.; Zhang, Y. Analysis on the Evolution of Rural Settlement Pattern and Its Influencing Factors in China from 1995 to 2015. Land 2021, 10, 1137. [Google Scholar] [CrossRef]
  19. Qin, Y.; Wang, L.; Yu, M.; Meng, X.; Fan, Y.; Huang, Z.; Luo, E.; Pijanowski, B. The Spatio-Temporal Evolution and Transformation Mode of Human Settlement Quality from the Perspective of “Production-Living-Ecological” Spaces—A Case Study of Jilin Province. Habitat Int. 2024, 145, 103021. [Google Scholar] [CrossRef]
  20. Ran, D.; Hu, Q.; Zhang, Z. Spatial-Temporal Evolution, Impact Mechanisms, and Reclamation Potential of Rural Human Settlements in China. Land 2024, 13, 430. [Google Scholar] [CrossRef]
  21. Zhong, Q.; Dong, T. Exploring the Spatiotemporal Trends and Influencing Factors of Human Settlement Suitability in Hunan Province Traditional Villages. Sci. Rep. 2024, 14, 25319. [Google Scholar] [CrossRef]
  22. Xie, T.; Liu, X.; Nie, P. Study on Spatial-Temporal Patterns and Factors Influencing Human Settlement Quality in Beijing. Sustainability 2022, 14, 3752. [Google Scholar] [CrossRef]
  23. Song, R.; Li, X.; Hou, X. Spatial Network Structure and Driving Factors of Human Settlements in Three Northeastern Provinces of China. Front. Ecol. Evol. 2023, 11, 1206808. [Google Scholar] [CrossRef]
  24. Song, R.; Li, X. Urban Human Settlement Vulnerability Evolution and Mechanisms: The Case of Anhui Province, China. Land 2023, 12, 994. [Google Scholar] [CrossRef]
  25. Chen, L.; Zhong, Q.; Li, Z. Analysis of Spatial Characteristics and Influence Mechanism of Human Settlement Suitability in Traditional Villages Based on Multi-Scale Geographically Weighted Regression Model: A Case Study of Hunan Province. Ecol. Indic. 2023, 154, 110828. [Google Scholar] [CrossRef]
  26. Guo, Z.; Chen, S.S.; Kattel, G.R.; Mkumbo, A.C.; Xiong, C.; Gao, Q.; Shen, Q. Scenario Analysis of Phosphorus Flow in Food Production and Consumption System in the Mwanza Region, Tanzania. Sci. Total Environ. 2023, 879, 162991. [Google Scholar] [CrossRef] [PubMed]
  27. Zhang, J.; Chen, S.S.; Gao, Q.; Shen, Q.; Kimirei, I.A.; Mapunda, D.W. Morphological Characteristics of Informal Settlements and Strategic Suggestions for Urban Sustainable Development in Tanzania: Dar Es Salaam, Mwanza, and Kigoma. Sustainability 2020, 12, 3807. [Google Scholar] [CrossRef]
  28. Pesaresi, M.; Schiavina, M.; Politis, P.; Freire, S.; Krasnodebska, K.; Uhl, J.H.; Carioli, A.; Corbane, C.; Dijkstra, L.; Florio, P.; et al. Advances on the Global Human Settlement Layer by Joint Assessment of Earth Observation and Population Survey Data. Int. J. Digital Earth 2024, 17, 2390454. [Google Scholar] [CrossRef]
  29. Zheng, Z.; Fu, B.; Feng, X. GIS-Based Analysis for Hotspot Identification of Tradeoff between Ecosystem Services: A Case Study in Yanhe Basin, China. Chin. Geogr. Sci. 2016, 26, 466–477. [Google Scholar] [CrossRef]
  30. Zhang, Y.; Jiang, P.; Cui, L.; Yang, Y.; Ma, Z.; Wang, Y.; Miao, D. Study on the Spatial Variation of China’s Territorial Ecological Space Based on the Standard Deviation Ellipse. Front. Environ. Sci. 2022, 10, 982734. [Google Scholar] [CrossRef]
  31. Zhao, R.; Zhan, L.; Yao, M.; Yang, L. A Geographically Weighted Regression Model Augmented by Geodetector Analysis and Principal Component Analysis for the Spatial Distribution of PM2.5. Sustain. Cities Soc. 2020, 56, 102106. [Google Scholar] [CrossRef]
  32. Jiang, S.; Zhang, Z.; Ren, H.; Wei, G.; Xu, M.; Liu, B. Spatiotemporal Characteristics of Urban Land Expansion and Population Growth in Africa from 2001 to 2019: Evidence from Population Density Data. ISPRS Int. J. Geo-Inf. 2021, 10, 584. [Google Scholar] [CrossRef]
  33. Yussif, K.; Dompreh, E.B.; Gasparatos, A. Sustainability of Urban Expansion in Africa: A Systematic Literature Review Using the Drivers-Pressures-State-Impact-Responses (DPSIR) Framework. Sustain. Sci. 2023, 18, 1459–1479. [Google Scholar] [CrossRef]
  34. Korah, A.; Koch, J.A.M.; Wimberly, M.C. Understanding Urban Growth Modeling in Africa: Dynamics, Drivers, and Challenges. Cities 2024, 146, 104734. [Google Scholar] [CrossRef]
  35. Abu Abdulai, I.; Kuusaana, E.D.; Ahmed, A. Toward Sustainable Urbanization: Understanding the Dynamics of Urban Sprawl and Food (in)Security of Indigenous Households in Peri-Urban Wa, Ghana. J. Urban Aff. 2025, 47, 1371–1396. [Google Scholar] [CrossRef]
  36. Taiwo, O.J. Modelling the Spatiotemporal Patterns of Urban Sprawl in Ibadan Metropolis Between 1984 and 2013 in Nigeria. Model. Earth Syst. Environ. 2022, 8, 121–140. [Google Scholar] [CrossRef]
  37. Follmann, A. Geographies of Peri-Urbanization in the Global South. Geogr. Compass 2022, 16, e12650. [Google Scholar] [CrossRef]
  38. Ashiagbor, G.; Amoako, C.; Asabere, S.B.; Quaye-Ballard, J.A. Landscape Transformations in Rapidly Developing Peri-Urban Areas of Accra, Ghana: Results of 30 Years. Open Geosci. 2019, 11, 172–182. [Google Scholar] [CrossRef]
  39. Henderson, J.V.; Kriticos, S. The Development of the African System of Cities. Annu. Rev. Econ. 2018, 10, 287–314. [Google Scholar] [CrossRef]
  40. Wolff, E.; Grippa, T.; Forget, Y.; Georganos, S.; Vanhuysse, S.; Shimoni, M.; Linard, C. Diversity of Urban Growth Patterns in Sub-Saharan Africa in the 1960–2010 Period. Afr. Geogr. Rev. 2020, 39, 45–57. [Google Scholar] [CrossRef]
  41. Bechir, R.; Ounalli, N.; Jaouad, M.; Sghaier, M. Regional Disparities and Local Development in Southern Tunisia. New Medit 2020, 19, 35–50. [Google Scholar] [CrossRef]
  42. Kerkouch, A.; Bensbahou, A.; Seyagh, I.; Agouram, J. Dynamic Analysis of Income Disparities in Africa: Spatial Markov Chains Approach. Sci. Afr. 2024, 24, e02236. [Google Scholar] [CrossRef]
  43. Brand, A.D.W.; Drewes, J.E.; Campbell, M. Differentiated Outlook to Portray Secondary Cities in South Africa. AIMS Geosci. 2021, 7, 457–477. [Google Scholar] [CrossRef]
  44. Sondou, T.; Anoumou, K.R.; Aholou, C.C.; Chenal, J.; Colombo, V.P. Urban Growth and Land Artificialization in Secondary African Cities: A Spatiotemporal Analysis of Ho (Ghana) and Kpalimé (Togo). Urban Sci. 2024, 8, 207. [Google Scholar] [CrossRef]
  45. Jedwab, R.; Christiaensen, L.; Gindelsky, M. Demography, Urbanization and Development: Rural Push, Urban Pull and … Urban Push? J. Urban Econ. 2017, 98, 6–16. [Google Scholar] [CrossRef]
  46. Brown, D. Towards a Comparative Research Agenda on in Situ Urbanisation and Rural Governance Transformation. Int. Dev. Plan. Rev. 2021, 43, 289–320. [Google Scholar] [CrossRef]
  47. Jiang, S.; Ren, H.; Zhang, Z. Monitoring and Assessing the Growth Law of Urban Land Using Multi-Source Data: A Case Study of Five East African Countries. Land Use Policy 2025, 153, 107530. [Google Scholar] [CrossRef]
  48. Yuan, Y.; Chen, S.S.; Miao, Y. Unmanaged Urban Growth in Dar Es Salaam: The Spatiotemporal Pattern and Influencing Factors. Sustainability 2023, 15, 575. [Google Scholar] [CrossRef]
  49. Enoguanbhor, E.C.; Gollnow, F.; Walker, B.B.; Nielsen, J.O.; Lakes, T. Key Challenges for Land Use Planning and Its Environmental Assessments in the Abuja City-Region, Nigeria. Land 2021, 10, 443. [Google Scholar] [CrossRef]
Figure 1. The workflow of the study.
Land 14 01205 g001
Figure 2. Geographical location map of Tanzania.
Land 14 01205 g002
Figure 3. Spatial distribution of different settlement types in Tanzania in 2020.
Land 14 01205 g003
Figure 4. Spatial distribution of hotspots and coldspots in relation to urban center changes from 1975 to 2020.
Land 14 01205 g004
Figure 5. Spatial distribution of hotspots and coldspots in relation to urban cluster changes from 1975 to 2020.
Land 14 01205 g005
Figure 6. Spatial distribution of hotspots and coldspots in relation to rural changes from 1975 to 2020.
Land 14 01205 g006
Figure 7. Standard deviation ellipse analysis map of different settlement types in Tanzania.
Land 14 01205 g007
Figure 8. q value of settlement distribution influencing factors in Tanzania from 1975 to 2020.
Land 14 01205 g008
Table 1. Data used in the research.
Data TypeData NameData SourceTime Periods (Year)
Settlement dataGHS Settlement Modelhttps://ghsl.jrc.ec.europa.eu/ (accessed on 5 December 2024)1975–2020
Socio-economic dataPopulationhttps://ghsl.jrc.ec.europa.eu/ (accessed on 5 December 2024)1975–2020
GDPhttps://www.nature.com/articles/s41597-022-01322-5 (accessed on 10 December 2024)1992–2019
Road networkhttps://download.geofabrik.de/index.html
(accessed on 15 September 2024)
2015–2020
Natural environment dataTemperaturehttps://climateknowledgeportal.worldbank.org/ (accessed on 11 December 2024)1991–2020
Rainfallhttps://climateknowledgeportal.worldbank.org/
(accessed on 11 December 2024)
1991–2020
Soil typehttps://www.ilri.org/
(accessed on 15 September 2024)
2006
Elevationhttps://earthexplorer.usgs.gov/
(accessed on 15 September 2024)
2014
Administrative divisions dataAdministrative divisionshttp://www.nbs.go.tz
(accessed on 8 January 2025)
2025
Table 2. Changes in the area of primary and secondary settlements in Tanzania from 1975 to 2020 (unit: km2).
Primary Settlements19751990200020152020Secondary
Settlements
19751990200020152020
Urban center340914127920622351Urban center340914127920622351
Urban cluster27995563843814,89019,620Dense urban cluster517811112017721970
Semi-dense urban cluster9921652309653277150
Suburban129031004222779110,500
Rural887,146883,808880,568873,333868,314Rural cluster42157349908212,74113,953
Low-density rural51,66968,62679,398109,322123,360
Very-low-density rural 828,158804,777789,050748,293728,031
Water31043056303829772970
Table 3. Analysis results of standard deviation ellipse analysis for different settlement types in Tanzania.
YearCentral CoordinatesSemi-Major Axis(km)Semi-Minor Axis(km)Azimuth
(°)
Area
(Million Km2)
Oblateness
Urban center197536°58′37″, 5°32′57″543.46170.59117.1629.120.69
200036°14′27″, 5°49′49″480.88313.57122.4647.370.35
202034°32′57″, 5°34′56″483.27323.29127.6249.080.33
Urban cluster197535°59′11″, 5°10′12″448.73379.03161.6053.430.16
200035°8′38″, 4°50′22″505.38362.35139.9457.530.28
202034°33′49″, 4°41′6″512.12346.64147.7755.770.32
Rural197534°48′38″, 5°23′58″535.42289.36149.4248.670.46
200034°46′55″, 5°25′7″513.72293.70150.9347.400.43
202034°52′59″, 5°41′10″504.07304.47151.3548.210.40
Disclaimer/Publisher’s Note: The statements, opinions and data contained in all publications are solely those of the individual author(s) and contributor(s) and not of MDPI and/or the editor(s). MDPI and/or the editor(s) disclaim responsibility for any injury to people or property resulting from any ideas, methods, instructions or products referred to in the content.

